Embed Size (px)
Citation preview

PEER-REVIEWED ARTICLE bioresources.com
Sen et al. (2012). “Microfibrillated cellulose & water,” BioResources 7(4), 4683-4703. 4683
CELLULOSE MICROFIBRIL-WATER INTERACTION AS CHARACTERIZED BY ISOTHERMAL THERMOGRAVIMETRIC ANALYSIS AND SCANNING ELECTRON MICROSCOPY
Suman K. Sen,a Vinit K. Baheti,
b Richard A. Venditti,
a,* Joel J. Pawlak,
a Sunkyu Park,
a
and Mukesh C. Bansal b
Microfibrillated celluloses, liberated from macroscopic lignocellulosic fibers by mechanical means, are sub-fiber elements with lengths in the micron scale and diameters ranging from 10 to a few hundred nanometers. These materials have shown strong water interactions. This article describes an investigation and quantification of the ‘hard-to-remove (HR) water content’ in cellulose fibers and microfibrillated structures prepared from fully bleached softwood pulp (BSW). The fiber/fibril structure was altered by using an extended beating process (up to 300 minutes), and water interactions were determined with isothermal thermogravimetric analysis (TGA). Isothermal TGA is shown to be a convenient and insightful characterization method for fiber-water interactions for fibers and microfibrils at small sample size. In addition, scanning electron microscopic (SEM) images depict the differences between fibers and microfibrils with respect to beating time in the dried consolidated structures. Highly refined pulps with microfibrils were determined to have two critical drying points, i.e., two minima in the second derivative of weight versus time, not before reported in the literature. Also in this study, hard-to-remove (HR) water content is related to the area above the first derivative curve in the constant rate and falling rate drying zones. This measure of HR water correlates with a previous measurement method of HR water but is less ambiguous for materials that lack a constant drying rate zone. Blends of unbeaten fibers and microfibril containing samples were prepared and show potential as composite materials.
Keywords: Hard to remove water; Thermogravimetric analysis (TGA); Scanning electron microscope
(SEM); Cellulose microfibrils; Cellulose fibers; Surface diffusion; Capillary action
Contact information: a: Department of Forest Biomaterials, North Carolina State University, P. O. Box
8005, Raleigh, NC 27695-8005 USA; b: Department of Pulp and Paper Technology, Indian Institute of
Technology, Roorkee, Star Paper Mill Road, Saharanpur Campus, Saharanpur 247001, India;
*Corresponding author: [email protected]
INTRODUCTION
Microfibrillated cellulose (MFC), a special class of cellulosic materials, was first
developed by Turbak et al. in 1983 from purified cellulose fibers using wood pulp as
starting materials (Turbak et al. 1983). MFC is basically a material produced by
disintegration of cellulosic fibers by high pressure mechanical homogenization into sub-
structural fibrils and microfibrils possessing lengths in the micron scale and widths
ranging from 10 to few hundred nanometers (Spence et al. 2011). A wide variety of fiber
sources have been used to prepare MFC, including primarily woods, agricultural crops

PEER-REVIEWED ARTICLE bioresources.com
Sen et al. (2012). “Microfibrillated cellulose & water,” BioResources 7(4), 4683-4703. 4684
and by-products, bacterial cellulose, etc. Depending upon the source of raw material and
the degree of processing, extensive mechanical defibrillation (e.g., refining and high
pressure homogenization, grinding, cryocrushing) is also combined with chemical
treatments (e.g., alkaline pretreatment, oxidation pretreatment) to produce purified
cellulose. In some cases, enzymatic pre-treatment is used to reduce the energy
requirement. A more detailed description on the microfibrillated cellulose preparation
can be found in a recent review article on microfibrillated cellulose preparation and their
use in nano-composites (Siró and Plackett 2010).
Characterization of water associated with cellulose fiber-water system in regard to
its thermodynamic (Stone and Scallan 1967; Maloney and Paulapuro 1998a; Driemeier et
al. 2012), molecular dynamics (Menon et al. 1987), and solution properties (Stone and
Scallan 1968) has been a subject of interest. The presence of different pore sizes within
the fiber play an important role in determining the type of interaction between the water
and the surrounding macromolecules (Hubbe et al. 2009).
Recently, Spence et al. (2011) reported a comprehensive investigation on MFC
production from a variety of raw material sources using different mechanical processing
techniques. A thorough investigation of the microfibril-water interaction revealed that the
water retention value (WRV) for MFCs from raw materials were in the range of 4.5 to 30
g/g, depending on microfibril’s chemical composition. The water vapor transmission
rates (WVTR) for MFC films produced from microfibrils with varying chemical
composition were in the range of 2.0 to 5.1×10⁻²
((g/m2×day)/m), with an initial water
contact angles of 48.2o to 88.1
o, and water adsorption in the range 2.3 to 3.2 g/g (Spence
et al. 2010a).
Accordingly, the strong interaction among cellulose fibers (or fibrils) and between
water and cellulose fiber directly affects the thermodynamics of the water removal from
cellulose fiber (Liu and Yao 2001; Nakamura et al. 1981; Ping et al. 2001). The removal
of water during the drying process is an important subject of interest for many industries,
e.g. paper, textiles, agriculture, food, and pharmaceutical industries. In the paper industry,
cellulose fiber-water interaction is an important parameter that controls the final physical
properties of paper and the process economics in terms of drainage rate, press solids, and
drying energy (Back 1978; Hubbe et al. 2007). A small change in moisture content,
which is further reduced by the repetition of drying and recycling of fibers, can
significantly affect the final strength of paper and paperboard products (Bobalek and
Chaturvedi 1989; Bovin et al. 1973).
Another important factor, the process economics, is also reliant on the final drying
of the paper or paperboards. Generally, during the paper making process most of the
water is removed by mechanical action, because mechanical dewatering is much cheaper
than thermal dewatering. However, to achieve a final solids content of about 95%,
thermal drying of a paper web in the final stage is necessary.
Although the dryer section is responsible for only a small amount of the total
water removal, it is the major energy consumer in the paper mill. Moreover, the dryer
section is the final processing stage that determines the strength and absorbent properties
of paper products. Energy consumption during the drying of paper and paper board
products can be understood by the hygroscopic and porous structure of pulp fibers that
contain hard-to-remove water.

PEER-REVIEWED ARTICLE bioresources.com
Sen et al. (2012). “Microfibrillated cellulose & water,” BioResources 7(4), 4683-4703. 4685
As the beating time increases, energy consumption in drying will also increase
due to the increased amount of hard-to-remove water (Park et al. 2007a,b). Hence, a
deep understanding of the interaction between cellulose fibers/microfibrils and water is
required.
In the pulp and paper industry, the level of refining, swelling, and mechanical
properties of fibers and papers are correlated to their corresponding WRV and freeness
value (Scallan and Carles 1972). WRV is defined as the ratio of water to dry fiber after
centrifugation of a fiber pad under standard conditions and is used as a measure of fiber
swelling. Fiber swelling, which emphasizes the inter-fiber bond development in paper, is
directly associated with the degree of fiber flexibility and fibrillation. Another parameter,
the freeness, is a measure of the water drainage rate from a fiber suspension under
controlled conditions. Freeness measurement is used as an indicator of drainablility on
the paper machine, and as a process-monitoring tool for refining to develop paper
strength. Despite their conveniences, there seems to be lack of scientific implications of
these methods (Abson and Gilbert 1980; Clark 1970). Further, WRV and freeness
measurements require about 0.5 and 3 g of dry fiber mass, respectively. Although these
amounts of dry fiber are relatively small in the case of papermaking standards, these
sample sizes are considered as large in the case of sample fibers extracted from
genetically modified trees grown inside greenhouses (Park et al. 2006a).
Other methods to characterize absorbed water are available. Nakamura et al.
introduced a method based on differential scanning calorimetry (DSC) to quantify the
sorbed water into the polymer (Nakamura et al. 1981; Weise et al. 1996; Maloney et al.
1998). Another instrumental technique, nuclear magnetic resonance (NMR) spectros-
copy to measure the sorbed water into cellulose was initiated by Odajima et al. (1959).
Later, this technique found application to characterize and quantitatively measure the
bound water in a fiber-water system (Ogiwara et. al. 1969; Froix and Nelson 1975;
Topgaard and Söderman 2002). All of these methods categorized the sorbed water in
fiber into three different classes e.g., unbound, freezing bound, and non-freezing bound
water based on the thermodynamics of the water associated with cellulose fibers.
However, these techniques are not very practical because of significant operator training
needed to operate and to interpret the data with expensive equipment.
In an earlier publication, a simplified and convenient method to determine the
hard-to-remove water content was developed using high resolution thermogravimetric
analysis (TGA) (Park et al. 2006a). Fiber samples were prepared from bleached softwood
kraft pulp after beating, using up to 4.5 kg load and beating time up to 40 minutes.
Observed drying kinetics revealed three different drying regimes: warm-up zone,
constant rate zone, and falling rate zone. After placing a wet fiber sample inside the TG
furnace, initially the drying rate increases as the sample warms up; this regime is
considered as the warm-up zone. After warming up, the evaporation rate of water from
the fiber remains relatively constant up to a point. This zone has been assigned as the
constant rate zone. The constant rate zone over a wide range of time is a manifestation of
a constant water evaporation, which is originated from the constant movement of
moisture from the interior to keep the exposed surface ‘sufficiently wet’ (Belhamri 2003;
Schlünder 2004). After the constant rate zone, a prolonged exposure to the isothermal
condition leads to a decrease in the drying rate. This is the beginning of the falling rate
zone. The moisture ratio at the onset of this decrease is considered to be related to the
fiber characteristics. This isothermal TGA protocol can simply be utilized to identify
different classes of water in fibers and then predict the drying behavior of fibers.

PEER-REVIEWED ARTICLE bioresources.com
Sen et al. (2012). “Microfibrillated cellulose & water,” BioResources 7(4), 4683-4703. 4686
In the current study, an isothermal TGA was used to investigate sorbed water
present in fibers and microfibrillated cellulose prepared from bleached softwood kraft
pulps after beating for extended times (up to five hours). The different drying regimes of
fibers with and without heavy refining were characterized using TGA. However, for
highly beaten pulps containing microfibrillated cellulose the distinction between the
falling rate zone and the constant rate zone becomes very difficult to determine, and an
alternate measure of water interaction is proposed herein. In addition, SEM image
analysis was performed to analyze the fiber/microfibrillated cellulose samples and
consolidated dried material structure at different degrees of beating.
EXPERIMENTAL
Sample Preparation Fully bleached commercial kraft softwood pulp (moisture content of about 8%)
was used for all experiments. Eleven samples were produced with different beating times
using a valley beater at 1.5% consistency with pre-soaking for three hours. Initially, the
valley beater was run for 20 minutes without any load to fiberize the pulp sample. Then,
samples (one liter) were collected after every 30 minutes with a maximum beating time
of five hours with a load of 5 kg. The samples were stored in cold storage at 4 oC until
further use.
Methods Fiber quality analyzer
A Fiber Quality Analyzer (FQA) LDA96 (OpTest Equipment Inc., Ontario,
Canada) was used to determine the fiber length and fines content. A quantity of sample
(about 1 mL) was taken from the refrigerated sample and added to 600 mL of deionized
water. The instrument measured the properties of over 3000 fibers per sample.
Percentages of fines measured in this study are the length-weighted percentage of fines.
This is an estimate of the weight fraction of the fines, assuming that the coarseness is
constant for all length classes. A fine is defined as any object having its largest dimension
shorter than 200 micrometers. The FQA classifies an object as anything longer than 70
micrometers. The reported mean length in this study is the length-weighted average of
detected fibers. This value is most often used to compare differences between samples.
Fines tend to have a minor effect on this result under normal conditions. The length-
weighted average can be calculated from,
Lw = ∑niLi2 / ∑niLi (1)
where L is the contour length and n is the fiber count in the ith
category.
This formula shows that by squaring a term the contribution of the term becomes
larger for large terms and smaller for small terms. Other data such as curl index and kink
index and arithmetic average width were also determined.
Thermogravimetric analysis
A volume of 100 mL of sample with 1.5% consistency was taken and mixed with
200 mL of deionized water. With house vacuum on a Büchner funnel, a handsheet was
made on a filter paper. When no more water could be removed by vacuum, the sheet was

PEER-REVIEWED ARTICLE bioresources.com
Sen et al. (2012). “Microfibrillated cellulose & water,” BioResources 7(4), 4683-4703. 4687
separated from the filter paper and divided into two parts. The first part was introduced
into an oven to evaluate the consistency of the sample, and the other part was stored in a
refrigerator in an air-tight aluminum container. Some amount of the wet sheet was mixed
with deionized water to produce a consistency of 9.1% (10 g water /g OD fiber). Then a
100 mg wet sample was introduced into the furnace of a thermogravimetric analyzer
(TGA Q500, TA instruments, New castle, DE). A platinum sample pan (Part
#952018.906, TA Instruments) was used to hold the sample, as specified by the previous
study (Park et al. 2006a). The sample pans have a dimension of 2 mm height and 10 mm
diameter. The drying experiments were run at an isothermal temperature of 90 °C until
no more drying occurred, about 45 minutes. Dry nitrogen gas was used at a flow rate of
40 mL/min for balance gas and 60 mL/min for sample gas. Drying was defined as
complete when the weight percent loss per minute was less than 0.001%/min.
SEM analysis
Two methods of sample preparation were used for SEM analysis. First,
handsheets were made on filter paper using a Büchner funnel and house vacuum. The
sheets were removed from the filter paper, placed within two plastic restraining rings, and
clamped tightly. The samples were allowed to dry in a controlled environment, 23˚C and
relative humidity of 50%. SEM analysis was performed on the side not contacting the
filter paper. Second, a very dilute suspension of about 10 mL of sample was placed into
a small glass tube and freeze-dried for at least 18 hours. A low-density pad of dried
fibers was produced. A Hitachi S3200 N scanning electron microscope at 5kV with a
resolution of 1600 x 2000 pixels with different magnification was taken. Samples were
secured onto carbon tape and then kept inside the vacuum chamber (containing the
microscope) during the collection of images.
Blending procedure
TGA and SEM experiments were also performed with blended samples. Samples
with 0 hour beating time and 5 hours beating time were used for this purpose. Blended
samples used were 100/0, 80/20, 50/50, 20/80, 0/100 mass ratio of sample with no
beating/sample with 5 hours beating. Blends were produced by adding the proper ratio of
samples to produce a volume of 100 mL at 1.5% with 200 mL of deionized water and
then stirring the samples vigorously. A pad was made using a Buchner funnel with house
vacuum and a consistency was measured. TGA and SEM analysis were performed
following the same procedure as non-blended samples described above.
RESULTS AND DISCUSSION
Effect of Beating on the Fiber Properties It is well known that beating affects fiber quality significantly by cutting of fibers,
delaminating of lamellar structure, flattening of fiber and lumen, and promoting swelling
within the fiber wall (McIntosh 1967; Page and De Grace 1967). This results in swollen
and flexible fibers that make strong paper, but at the expense of some reduction of the
fiber length (Claudio-da-Silva et al. 1982). The length-weighted average length
decreased, and the length-weighted percentage of fines (<0.2 mm long) increased with
respect to the beating time for the softwood pulp, as shown in Fig. 1. Two beating runs
were performed, and the results were found to be reproducible. The width of the fiber

PEER-REVIEWED ARTICLE bioresources.com
Sen et al. (2012). “Microfibrillated cellulose & water,” BioResources 7(4), 4683-4703. 4688
fraction decreased slightly upon beating from about 30 microns to about 25 microns for
beating at 5 hours. The curl and kink indexes were basically constant at around 0.15 and
1.5, respectively. It is important to mention that from Fig. 1 it was observed that
prolonged beating of fibers of more than 210 minutes was required to convert the fibers
to their corresponding microbril materials when length-weighted average length becomes
less than or about 200 microns. Normal beating times to prepare wood pulps for
papermaking are less than 60 minutes for bleached softwood pulps (T 200 sp-96, 2000).
Beating times greater than 90 minutes would be uncommon for papermaking, resulting in
unacceptably high fines content and poor drainage properties.
Mean Length (mm)
0
0.5
1
1.5
2
2.5
Percentage Fines (%)
0
20
40
60
80
Beating Time (minutes)
0 50 100 150 200 250 300
Fig. 1. Change in mean length and percentage fines (objects shorter than 200 micrometer) with the increased beating time. Duplicate experimental results are shown, indicating repeatability.
SEM images of freeze-dried and air-dried samples showed that the beating
decreased the fiber size and liberated microfibrils. The images of the air-dried material in
Fig. 2 show that the fibrous structure on the surface did not exist anymore for the sample
after 5 hours of beating. The microfibrillated cellulose when dried formed a film without
significant micro-pores (approximately not more than 1.1 micrometer of diameter for 180
minutes of beating time and no micro-pores in the film samples beyond 180 minutes of
beating time), which is apparent at the lower magnification. These images were obtained
from samples after the collapse of the fiber network during drying. In order to better
distinguish the state of the fibers and microfibrils in the water suspension before drying,
SEM images of freeze dried samples were taken, as shown in Fig. 3. It is clear that at the
higher magnification, the bulk wall of the fiber changed from a solid mass to individual
microfibrils. These microfibrils have diameters in nanometers and an accompanying large
specific surface area (Spence et al. 2010, 2011).

PEER-REVIEWED ARTICLE bioresources.com
Sen et al. (2012). “Microfibrillated cellulose & water,” BioResources 7(4), 4683-4703. 4689
Fig. 2. Surface of air-dried sheet observed by SEM at constant humidity. Top to bottom are 0, 3, and 5 hours beating. Length scale on left of 500 microns and on right of 5 microns.
Drying Behavior of Fibers
In an earlier publication, in the case of fibrous surface (with pulps prepared with
beating times of up to 40 minutes, Park et al. 2006a), drying kinetics using a TG furnace
revealed three different drying regimes, which are a warm-up zone, a constant rate zone,
and a falling rate zone, as most easily observed in the first derivative curve in Fig. 4.
When a sample is initially placed in the TG furnace, the drying rate increases as the
sample warms up, indicating a warm-up zone. The evaporation rate then remains
relatively constant for a time. The existence of the constant rate zone over a wide range
of time can be understood if the exposed surface is kept ‘sufficiently wet’ by the
movement of moisture from the interior (Belhamri 2003; Schlünder 2004).

PEER-REVIEWED ARTICLE bioresources.com
Sen et al. (2012). “Microfibrillated cellulose & water,” BioResources 7(4), 4683-4703. 4690
Fig. 3. SEM images of freeze dried samples collected at beating times from top to bottom of 0, 3, and 5 hours. Length scale on left of 500 microns and on right of 2 microns.
Schlünder showed mathematically that the condition for a sufficiently wet surface
is fulfilled if the pore diameter of the porous material is small compared to the thickness
of the viscous sub-layer formed by the gas flow past the surface and the pores are evenly
distributed (Schlünder 1988).
The decrease in the drying rate in the falling rate zone can be attributed to a
change in the mechanism of drying. When the movement of water is not sufficient to
replenish the free water at the surface, the rate of drying falls. The rate of drying thus is
governed by the internal diffusion, which is dependent on properties such as
fiber/microfibril type, pore volume and geometry, fiber wall thickness, and moisture
ratio. Thus, the constant rate zone is indicative of large volumes of external water to the
fiber cell wall, which can evaporate freely.

PEER-REVIEWED ARTICLE bioresources.com
Sen et al. (2012). “Microfibrillated cellulose & water,” BioResources 7(4), 4683-4703. 4691
0 10 20 30 40 50
0
20
40
60
80
100
We
igh
t (%
)
Time (minute)
Weight
2n
d D
eri
v.
wt.
(%
wt.
/min
ute
2)
De
riv
. w
t. (
% w
t./m
inu
te)
-3
-2
-1
0
1
2
3
4
5
6
7
Deriv. wt.
0.3
0.2
0.1
0.0
-0.1
-0.2
-0.3
2nd Deriv. wt.
Fig. 4. TGA analysis of an unbeaten bleached softwood pulp sample at an isothermal temperature of 90 °C. The filled arrowhead (at 22.25 minutes) indicates the critical point, representing the end of the constant rate drying zone and the beginning of the falling rate zone.
The hard-to-remove water is the water remaining in the pores and capillaries of
the fiber wall, which are removed at a slower rate after the bulk water evaporates. This
slower rate of drying is presumably associated with the smaller features (cracks, pores,
voids between fibrils, fibril intersections) of the material (Park et al. 2006b). In this
regime, as the water is progressively removed from the pores of the solid, the fraction of
pore volume that is occupied by air increases. When the fraction reaches a certain limit,
there is insufficient water left to maintain continuous films across the pores and the pores
fill with air, which now becomes the continuous phase.
According to the definition, ‘hard-to-remove water’ (in Park et al. 2006a) is the
moisture ratio of fibers at the transition between the constant rate zone and the falling rate
zone during the isothermal drying of fibers and fiber suspensions containing microfibrils.
The transition zone was defined as the time at which twice the average value of the 2nd
derivative in the constant rate zone was reached. The issue with this definition occurs
when a pronounced constant rate zone is not apparent. In this case, ambiguity in the
transition zone determination is realized. The complete drying is defined as the point at
which the derivative of the weight loss reaches 0.001 %/min. The amount of water at the
transition point divided by the final solids provides the HR-water content in grams of
water per gram of solids.
Drying Behavior of Fibers and Microfibrils As beating time increases, however, fibers are converted into microfibrils and
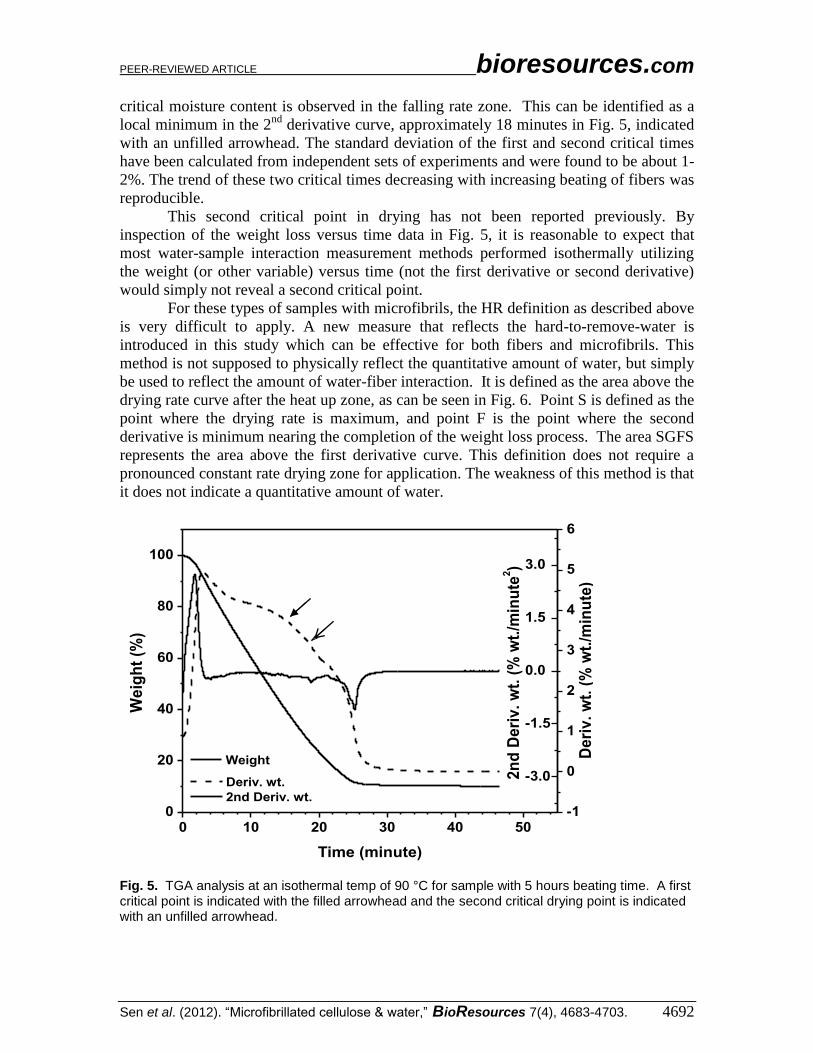
both exist in the material. Figure 5 shows the drying behavior of the predominantly
microfibrillated cellulose generated after five hours of beating. It is observed that a
constant rate drying zone does not appreciably exist in these kinds of samples. A second
PEER-REVIEWED ARTICLE bioresources.com
Sen et al. (2012). “Microfibrillated cellulose & water,” BioResources 7(4), 4683-4703. 4692
critical moisture content is observed in the falling rate zone. This can be identified as a
local minimum in the 2nd
derivative curve, approximately 18 minutes in Fig. 5, indicated
with an unfilled arrowhead. The standard deviation of the first and second critical times
have been calculated from independent sets of experiments and were found to be about 1-
2%. The trend of these two critical times decreasing with increasing beating of fibers was
reproducible.
This second critical point in drying has not been reported previously. By
inspection of the weight loss versus time data in Fig. 5, it is reasonable to expect that
most water-sample interaction measurement methods performed isothermally utilizing
the weight (or other variable) versus time (not the first derivative or second derivative)
would simply not reveal a second critical point.
For these types of samples with microfibrils, the HR definition as described above
is very difficult to apply. A new measure that reflects the hard-to-remove-water is
introduced in this study which can be effective for both fibers and microfibrils. This
method is not supposed to physically reflect the quantitative amount of water, but simply
be used to reflect the amount of water-fiber interaction. It is defined as the area above the
drying rate curve after the heat up zone, as can be seen in Fig. 6. Point S is defined as the
point where the drying rate is maximum, and point F is the point where the second
derivative is minimum nearing the completion of the weight loss process. The area SGFS
represents the area above the first derivative curve. This definition does not require a
pronounced constant rate drying zone for application. The weakness of this method is that
it does not indicate a quantitative amount of water.
Fig. 5. TGA analysis at an isothermal temp of 90 °C for sample with 5 hours beating time. A first critical point is indicated with the filled arrowhead and the second critical drying point is indicated with an unfilled arrowhead.
0 10 20 30 40 500
20
40
60
80
100
We
igh
t (%
)
Time (minute)
Weight
2n
d D
eri
v.
wt.
(%
wt.
/min
ute
2)
De
riv
. w
t. (
% w
t./m
inu
te)
-1
0
1
2
3
4
5
6
Deriv. wt.
-3.0
-1.5
0.0
1.5
3.0
2nd Deriv. wt.

PEER-REVIEWED ARTICLE bioresources.com
Sen et al. (2012). “Microfibrillated cellulose & water,” BioResources 7(4), 4683-4703. 4693
Derivative Wt. (% wt./ minute)
-1
0
1
2
3
4
5
6
2nd Deriv. Wt. (% wt./minute
2)
-2
0
2
4
Time (minute)
0 10 20 30 40 50
S G
F
Fig. 6. HR water content determined by the area defined in this study
The weight loss versus time, the first derivative of weight loss, and second
derivative of weight loss are shown in Fig. 7. It can be noticed from careful inspection of
Fig. 7a that the highly beaten samples dry slower and continue to lose small amounts of
mass even after 40 minutes of drying, which is not apparent in the unbeaten fibers.
When the first and second derivatives are inspected, other interesting differences are
revealed, the main difference being in the decreased constant rate drying zone time with
increased beating. In the case of no beating (0 minutes) in Fig. 7b, the area above the
curve will be small due to a prominent constant rate zone. The area above the first
derivative of weight loss data has a significant contribution from the falling rate zone. As
beating time increases, the constant rate zone starts to diminish and for fibers with low or
no constant rate zone in Fig. 7b (120 to 300 minutes), and the area above the curve will
be greater.
The second critical point is indicated on Figs. 7b and 7c with unfilled arrowheads
for the 180, 240, and 300 minute samples at 23.1, 22.1, and 18.7 minutes, respectively.
This second critical point may be due to another complication occurring during drying
which is pore/void closure (Park et al. 2006b). If all the voids between the solid elements
are closed in the matrix due to drying contraction, then the moisture will have to diffuse
throughout the cellulose bulk structure to be removed, which is presumed to be a very
slow process. For example, Fig. 2 shows a much tighter void structure with dense
packing for the 5 hours beaten material relative to the 0 hour beaten material (low
magnification). For the 5 hours beaten material, the path that water must take includes
significant diffusion through the bulk material that does not contain macro-voids.
Significantly longer diffusion lengths are required in this case. It is suggested here that
the second critical point observed with the microfibril element containing materials is due
to the continuous, macro-void free structure developed in the material. Certainly more
research must be performed to understand the origin of this second critical point.

PEER-REVIEWED ARTICLE bioresources.com
Sen et al. (2012). “Microfibrillated cellulose & water,” BioResources 7(4), 4683-4703. 4694
Weight (%), a.u.
Time (minute)
0 10 20 30 40 50
0 minute
120 minutes
180 minutes
300 minutes
240 minutes
60 minutes
7a
Derivative Wt. (% wt/minute), a. u.
Time (minute)
0 10 20 30 40 50
0 minute
60 minutes
120 minutes
180 minutes
240 minutes
300 minutes
7b

PEER-REVIEWED ARTICLE bioresources.com
Sen et al. (2012). “Microfibrillated cellulose & water,” BioResources 7(4), 4683-4703. 4695
2nd Deriv. Wt. (% wt /minute
2), a. u.
Time (minute)
0 10 20 30 40 50
300 minutes
240 minutes
180 minutes
120 minutes
60 minutes
0 minute
7c
Fig. 7. Comparison of drying rate at isothermal temperature of 90 °C with beating time, (a) weight loss versus temperature, (b) derivative weight loss versus temperature, and (c) 2
nd derivative
weight loss versus temperature. First critical point is indicated with the filled arrowhead and the second critical drying point is indicated with an unfilled arrowhead. The x-axis range spans 9% wt/min; however, individual curves have been stacked by arbitrary levels.
Comparison of the Two Methods to Characterize Water Interactions Both methods to characterize the amount of sample-water interaction, (1) by
identifying the first critical point and calculating the HR water (Park et al. 2006a) and (2)
by integration of the area above the 1st derivative curve, were performed on all of the
samples, and the results shown in Figs. 8 and 9 versus beating time, respectively. A
reasonably linear correlation between the two methods exists at low beating times, as
shown in Fig. 10, but with longer beating times the scatter in the data becomes more
pronounced. This study indicates that both methods can be used as a gauge for water-
sample interactions.
It was also of interest to determine if higher water-sample interactions correlated
with a total drying time increase. Figure 11 indeed shows that the drying time, as defined
as the time in which a weight loss rate of 0.001%/minute is realized, increased with
beating time, another indication of water-sample interactions. However, the increase in
time was only about 15%, and the correlation strength was weaker, as indicated by the
low R2 value.
Also of interest was the moisture ratio at the second critical point versus beating
time, Fig. 12. The second critical point was observed for pulps with beating times of 3
hours or greater, see Fig. 7. Figure 12 shows the average of two points for each beating
time. Both the moisture ratio for the first and second critical points increase with beating,
with some scatter, with the first critical point being more sensitive (higher slope) to
beating time than the second critical point.

PEER-REVIEWED ARTICLE bioresources.com
Sen et al. (2012). “Microfibrillated cellulose & water,” BioResources 7(4), 4683-4703. 4696
HR Water Content (g/g)
0.5
1
1.5
2
2.5
3
3.5
4
4.5
Beating Time (minute)
-50 0 50 100 150 200 250 300 350
y=0.009x+0.8231
R2=0.8786
Fig. 8. HR water content calculated via the identification of the 1
st critical point method versus
beating time
HR Water Content (via integration, g/g)0
5
10
15
20
25
30
35
Beating Time (minute)
0 50 100 150 200 250 300 350
y=0.058x+12.799
R2=0.8197
Fig. 9. HR water content calculated via ‘integration’ method defined in this study versus beating time

PEER-REVIEWED ARTICLE bioresources.com
Sen et al. (2012). “Microfibrillated cellulose & water,” BioResources 7(4), 4683-4703. 4697
HR Water (Park et al., g/g )
0
0.5
1
1.5
2
2.5
3
3.5
4
4.5
HR Water (Integr, g/g)
10 15 20 25 30 35
y = 0.1313x - 0.6499
R2 = 0.7674
Fig. 10. Comparison of HR water content calculated via integration and via critical point methods. This figure shows that initially when fibers are in excess then both can be correlated, but when microfibrils are in excess, the correlation is weaker.
Total Drying Time (minute)
0
5
10
15
20
25
30
35
Beating Time (minute)
0 50 100 150 200 250 300 350
y=0.0119x+26.277
R2=0.5085
Fig. 11. Effect of beating on the total drying time of samples

PEER-REVIEWED ARTICLE bioresources.com
Sen et al. (2012). “Microfibrillated cellulose & water,” BioResources 7(4), 4683-4703. 4698
Moisture Ratio (g water/g solids)
0
1
2
3
Beating Time (minute)
-50 0 50 100 150 200 250 300 350
First Critical Point
Second Critical Point
y=0.007x+0.861
R2=0.7968
y=0.029x+0.4277
R2=0.7851
Fig. 12. Moisture ratio at the first critical point and second critical point versus beating time
In summary, it has been observed that with increasing beating time, the fiber
length decreases, and after beating for more than 210 minutes, the average fiber length is
lowered to 200 micron (Fig. 1). The SEM images (Fig. 2) of the air dried film surface
showed that with increasing beating time, the pores initially present in the case of non-
beaten fibers are diminished and the film prepared from the fibers after 5 hours of beating
time revealed no micro-pores. From Fig. 7b it is clear that with an increase in beating
time the constant drying rate zone started to diminish, and after 5 hours of beating, the
constant drying rate zone was essentially non-existent. This, in turn, signifies that as the
beating time increases, the easy to evaporate water content (external water to the fiber
cell wall) decreases and the hard-to-remove water content (present in the pores and
capillaries of fiber wall) increases. Figures 9 and 11 represent how the increasing beating
time increased the hard-to-remove water content and total drying time, respectively.
These results suggest that longer drying times or more drying energy would be required
for drying microfibrillated materials relative to fibers.
Fiber Properties for Blends
The drying rates of three blended samples (80/20, 50/50, and 20/80 fiber/micro-
fibrils) are shown in Fig. 13a (1st derivative of weight %) and Fig. 13b (2
nd derivative of
weight %). The first critical points are shown with filled arrow heads. The first critical
points for three blends e.g., 80 (0 hours)/ 20 (5 hours), 50 (0 hours)/ 50 (5 hours), and 20
(0 hours)/ 80 (5 hours) are identified at 20.8, 20.7, and 14.9 minutes, respectively. A
constant rate drying zone was apparent for blends containing up to 50% of 5 hour beaten
fiber. At the 20/80 fiber/ microfibril level the 2nd
critical point was observed at 19.0
minutes, indicated as an unfilled arrow head.

PEER-REVIEWED ARTICLE bioresources.com
Sen et al. (2012). “Microfibrillated cellulose & water,” BioResources 7(4), 4683-4703. 4699
SEM surface images of the air-dried sheet and freeze dried samples from 50/50
blends are shown in Figures 14 and 15, respectively. As expected, these SEM images
show the presence of both the fiber and microfibrils in the 50/50 blend sample. Also note
that for the air-dried sample, the surface is void-free, with a continuous film of
microfibrils. Thus, the 50/50 blend sample appears to have similar surface characteristics
to the void-free sample (beaten for 5 hours) having 100% microfibrils in Fig. 2 and does
not have surface pores and features like the unbeaten fibers in Fig. 2. This indicates that
the blends of fibers and microfibrils might have unique composite properties, enjoying
surface properties developed by the microfibrils and bulk properties retaining some of the
fiber properties such as tear strength. This is an important area for further research.
Drying Rate (% wt./minute), a. u.
Time (minute)
0 5 10 15 20 25 30 35 40 45 50
Blend 80 (0 hours)/20(5 hours)
Blend 50 (0 hours)/50(5 hours)
Blend 20 (0hours)/80(5 hours)
13a
Fig. 13. Comparison of drying rate at isothermal temperature of 90 °C for the blends, (a) 1
st
derivative weight and (b) 2nd
derivative weight. First critical point is indicated with the filled arrowhead, and the second critical drying point is indicated with an unfilled arrowhead.
Fig. 14. SEM surface images for air-dried sheet from 50/50 blend at constant humidity. Length scale on left image is of 500 microns and on right image is of 2 microns.

PEER-REVIEWED ARTICLE bioresources.com
Sen et al. (2012). “Microfibrillated cellulose & water,” BioResources 7(4), 4683-4703. 4700
Fig. 15. SEM images of freeze dried blended samples of 50/50 blend. Length scale on left image is of 500 microns and on right image is of 2 microns.
CONCLUSIONS
1. Isothermal thermogravimetric analysis has been shown to be a convenient and
insightful characterization method for fiber-water as well as microfibrils-water
systems and allows a direct comparison of fibers and fibrils at a small sample size,
e.g. 10 mg of dried mass.
2. SEM images showed that a prolonged beating converts the solid bulk wall of the large
fibers to liberate microfibrils with diameters in nanometers.
3. When the microfibrillated cellulose materials are dried from water, a continuous film
without macro-pores is formed. Materials with this structure have a diminished
constant drying rate zone.
4. The microfibrillated cellulose materials take a longer time to dry than unbeaten fibers
under the same drying conditions. This suggests that the net drying energy to prepare
microfibrillated materials would be greater than that for unbeaten or moderately
beaten fibers.
5. A new drying critical point was identified for microfibril-containing structures,
hereby designated as a second critical moisture content in the falling rate zone. This
can be observed as a local minimum in the 2nd derivative curve.
6. A new method to quantify the HR water content in both fibers and microfibrillated
cellulose material is proposed based on the area above the first derivative curve, and
this method for characterizing HR water is reasonably linear with the previous HR
water calculation method.
ACKNOWLEDGMENTS
The authors are grateful for travel support for the student from the Department of
Forest Biomaterials, NCSU. The assistance of Dr. Audimar Bangi and Dr. Sa Yong Lee
in thermal analysis is greatly appreciated.

PEER-REVIEWED ARTICLE bioresources.com
Sen et al. (2012). “Microfibrillated cellulose & water,” BioResources 7(4), 4683-4703. 4701
REFERENCES CITED Abson, D., and Gilbert, R. D. (1980). “Observations on water retention values,” Tappi J.
63(9), 146-147.
Back, E. L. (1978). “Discussion,” In: Fiber-Water Interactions in Paper-making, Trans.
Symp., Oxford, Sept. 1977, Tech. Div. British Paper and Board Ind. Fed., London,
Vol. 2, 873.
Belhamri, A. (2003). “Characterization of the first falling rate period during of a porous
material,” Drying Technol. 21(7), 1235-1252.
Bobalek, J. F., and Chaturvedi, M. (1989). “The effects of recycling on the physical
properties of handsheets with respect to specific wood species,” Tappi J. 72(6), 123-
125.
Bovin, A., Hartler, A., and Teder, A. (1973). “Changes in pulp quality due to repeated
papermaking,” Paper Technol. 14(10), 261-264.
Clark, J. (1970). “Freeness fallacies and facts,” Tappi J. 53(1), 108-113.
Claudio-da-Silva Jr., E., Marton, R., and Granzoq, S. (1982). “Effect of beating on wet
web properties,” Tappi J. 65(11), 99-103.
Driemeier, C., Mendes, F. M., and Oliveira, M. M. (2012). “Dynamic vapor sorption and
thermoporometry to probe water in celluloses,” Cellulose 19(4), 1051-1063.
Froix, M. F., and Nelson, R. (1975). “The interaction of water with cellulose from
nuclear magnetic resonance relaxation times,” Macromolecules 8(6), 726-730.
Hubbe, M. A., Chen, H., and Heitmann, J. A. (2009). “Permeability reduction phenomena
in packed beds, fiber mats, and wet webs of paper exposed to flow of liquids and
suspensions: A review,” BioResources 4(1), 405-451.
Hubbe, M. A., Venditti, R. A., and Rojas, O. (2007). “What happens to cellulosic fibers
when drying during papermaking and recycling? A review,” BioResources 2(4), 739-
788.
Liu, W. G., and Yao, K. D. (2001). “What causes the unfrozen water in polymers:
Hydrogen bonds between water and polymer chains?,” Polymer 42(8), 3943-3947.
Nakamura, K., Hatakeyama, T., and Hatakeyama, H. (1981). “Studies on bound water of
cellulose by differential scanning calorimetry,” Textile Res. J. 51(9), 607-613.
Maloney, T. C., Johansson T., and Paulapuro, H. (1998a). “Removal of water from the
cell wall during drying,” Paper Technol. 39(6), 39-47.
Maloney, T., Paulapuro, H., and Stenius, P. (1998b). “Hydration and swelling of pulp
fibers measured with differential scanning calorimetry,” Nordic Pulp Paper Res. J.
13(1), 31-36.
McIntosh, D. C. (1967). “The effect of refining on the structure of the fiber wall,” Tappi
J. 50(10), 482-488.
Menon, R. S., MacKay, A. L., Hailey, J. R. T., Bloom, M., Burgess, A. E., and Swanson,
J. S. (1987). “An NMR determination of the physiological water distribution in wood
during drying,” J. Appl. Polym. Sci. 33(4), 1141-1155.
Odajima, A., Sohma, J., and Watanabe, S. (1959). “Nuclear magnetic resonance of water
sorbed on fibrous materials,” J. Chem. Phys. 31(1), 276-277.
Ogiwara, Y., Kubota, M., Hayashi, S., and Mitomo, N. (1969). “Studies of water
adsorbed on cellulosic materials by a high resolution NMR spectrometer,” J. Appl.
Polym. Sci. 13(8), 1689-1695.

PEER-REVIEWED ARTICLE bioresources.com
Sen et al. (2012). “Microfibrillated cellulose & water,” BioResources 7(4), 4683-4703. 4702
Page, D. H., and De Grace, J. H. (1967). “The delamination of fiber walls by beating and
refining,” Tappi J. 50(1), 489-495.
Park, S., Venditti, R. A., Jameel, H., and Pawlak, J. J. (2006a), “Hard to remove water in
cellulose fibers characterized by high resolution thermogravimetric analysis –
Methods development,” Cellulose 13(1), 23-30.
Park, S., Venditti, R. A., Jameel, H., and Pawlak, J. J. (2006b). “Changes in pore size
distribution during the drying of cellulose fibers as measured by differential scanning
calorimetry,” Carbohydrate Polym. 66(1), 97-103.
Park, S., Venditti, R. A., Jameel, H., and Pawlak, J. J. (2007a). “Studies of the heat of
vaporization of water associated with cellulose fibers characterized by thermal
analysis,” Cellulose 14(3), 195-204.
Park, S., Venditti, R. A., Jameel, H., and Pawlak, J. J. (2007b). “Hard-to-remove water in
cellulose fibers characterized by thermal analysis: A model for the drying of
wood-based fibers,” Tappi J. 6(7), 10-16.
Ping, Z. H., Nguyen, Q. T., Chen, S. M., Zhou, J. Q., and Ding, Y. D. (2001). “State of
water in different hydrophilic polymers—DSC and FTIR studies,” Polymer 42(20),
8461-8467.
Scallan, A. M., and Carles, J. E. (1972). “Correlation of water retention value with fiber
saturation point,” Svensk Paperstidn 75(17), 699-703.
Schlünder, E. U. (1988). “On the mechanism of the constant drying rate period and its
relevance to diffusion controlled catalytic gas phase reactions,” Chem. Eng. Sci.
43(10), 2685-2688.
Schlünder, E. U. (2004). “Drying of porous material during the constant and the falling
rate period: A critical review of existing hypotheses,” Drying Technol. 22(6), 1517-
1532.
Siró, I., and Plackett, D. (2010). “Microfibrillated cellulose and new nanocomposite
materials: A review,” Cellulose 17(3), 459-494.
Spence, K. L., Venditti, R. A., Rojas, O. J., Habibi, Y., and Pawlak, J. J. (2011). “A
comparative study of energy consumption and physical properties of microfibrillated
cellulose produced by different processing methods,” Cellulose 18(4), 1097-1111.
Spence, K. L., Venditti, R. A., Rojas, O. J., Habibi, Y., and Pawlak, J. J. (2010a). “The
effect of chemical composition on microfibrillar cellulose films from wood pulps:
Water interactions and physical properties for packaging applications,” Cellulose
17(4), 835-848.
Spence, K. L., Venditti, R. A., Habibi, Y., Rojas, O. J., and Pawlak, J. J. (2010b). “The
effect of chemical composition on microfibrillar cellulose films from wood pulps:
Mechanical processing and physical properties,” Biores. Technol. 101(15), 5961-
5968.
Stone, J. E., and Scallan, A. M. (1968). “A structural model for the cell wall of water-
swollen wood pulp fibres based on their accessibility to macromolecules,” Cellulose
Chem. Technol. 2, 343-358.
Stone, J. E., and Scallan, A. M. (1967). “The effect of component removal upon the
porous structure of the cell wall of wood. II. Swelling in water and the fiber saturation
point,” Tappi J. 50(10), 496-501.
TAPPI Test Methods (2000-2001). T200 sp-96, “Laboratory beating of pulp (valley
beater method),” TAPPI Press, Atlanta.

PEER-REVIEWED ARTICLE bioresources.com
Sen et al. (2012). “Microfibrillated cellulose & water,” BioResources 7(4), 4683-4703. 4703
Topgaard, D., and Söderman, O. (2002). “Changes of cellulose fiber wall structure during
drying investigated using NMR self diffusion and relaxation experiments,” Cellulose
9(2), 139-147.
Turbak, A., Snyder, F., and Sandberg, K. (1983). “Microfibrillated cellulose: A new
cellulose product: Properties, uses, and commercial potential,” J. Appl. Polym. Sci.:
Appl. Polym. Symp. 37, 815-827.
Weise, U., Maloney, T., and Paulapuro, H. (1996). “Quantification of water in different
states of interaction with wood pulp fibers,” Cellulose 3(4), 189-202.
Article submitted: June 22, 2012; Peer review completed: July 21, 2012; Revised version
received and accepted: August 1, 2012; Published: August 9, 2012.