Embed Size (px)
Citation preview
Cellular Networks
Day 21
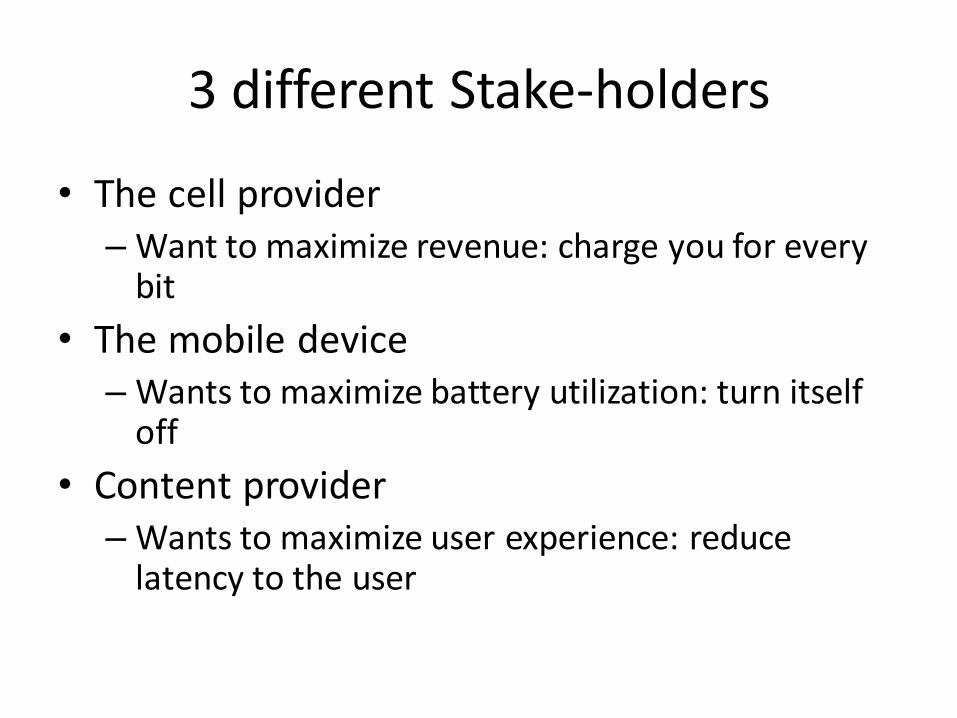
3 different Stake-holders
• The cell provider– Want to maximize revenue: charge you for every
bit
• The mobile device– Wants to maximize battery utilization: turn itself
off
• Content provider– Wants to maximize user experience: reduce
latency to the user
Cellular Core Network
eNodeB 3 S-GW 2
P-GW
3
S-GW 1
eNodeB 1
eNodeB 2
Internet andOther IP Networks
GTP Tunnels
UE 2
UE 1
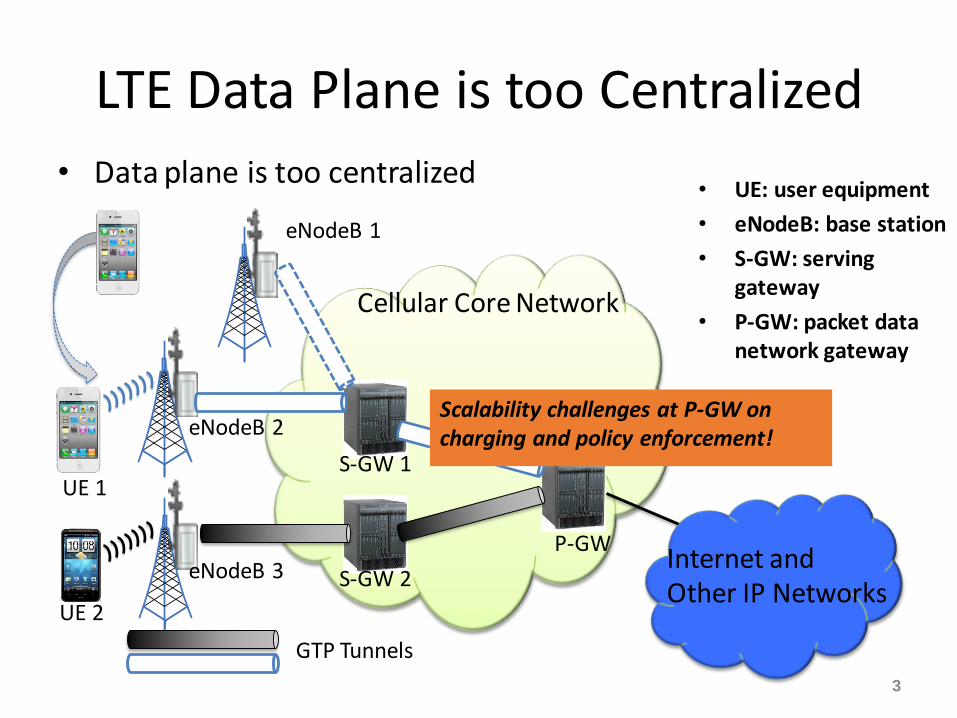
LTE Data Plane is too Centralized
• UE: user equipment
• eNodeB: base station
• S-GW: serving gateway
• P-GW: packet data network gateway
• Data plane is too centralized
Scalability challenges at P-GW on charging and policy enforcement!

3 different Stake-holders
• The cell provider– Want to maximize revenue: charge you for every
bit
• The mobile device– Wants to maximize battery utilization: turn itself
off
• Content provider– Wants to maximize user experience: reduce
latency to the user
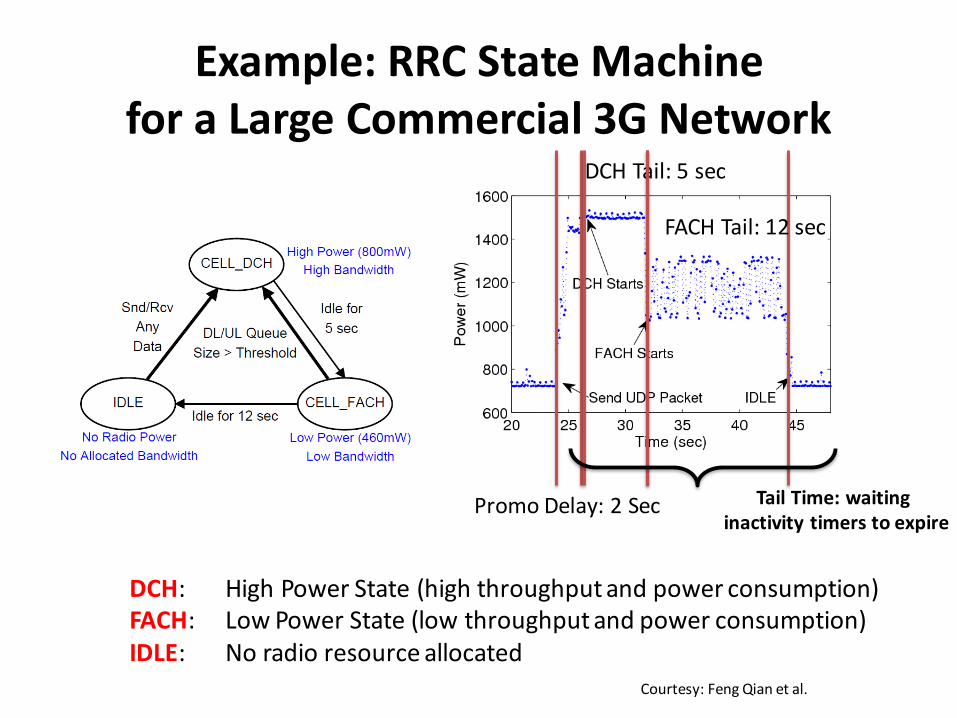
Example: RRC State Machinefor a Large Commercial 3G Network
Promo Delay: 2 Sec
DCH Tail: 5 sec
FACH Tail: 12 sec
DCH: High Power State (high throughput and power consumption)FACH: Low Power State (low throughput and power consumption)IDLE: No radio resource allocated
Tail Time: waiting inactivity timers to expire
Courtesy: Feng Qian et al.
3 different Stake-holders
• The cell provider– Want to maximize revenue: charge you for
everybit
• The mobile device– Wants to maximize battery utilization: turn itself
off
• Content provider– Wants to maximize user experience: reduce
latency to the user

Outline
• Discuss Network Performance
• Discuss Implications of mobile device power optimizations
• Discuss implications of cellular network on performance
8
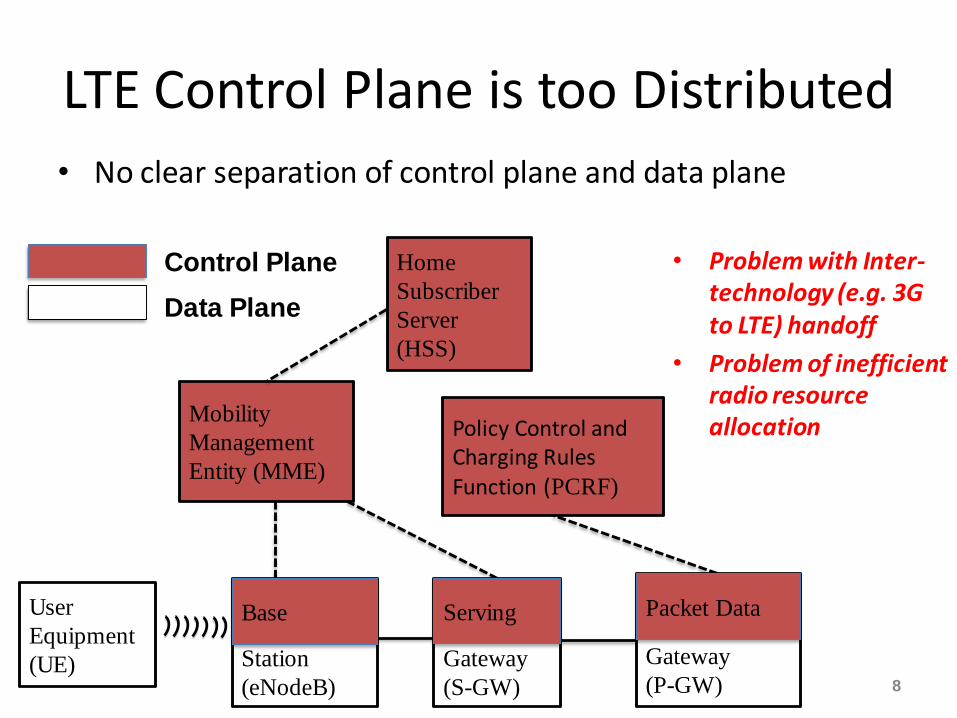
LTE Control Plane is too Distributed
• Problem with Inter-technology (e.g. 3G to LTE) handoff
• Problem of inefficient radio resource allocation
User
Equipment
(UE) Gateway
(S-GW)
Mobility
Management
Entity (MME)
Network
Gateway
(P-GW)
Home
Subscriber
Server
(HSS)
Policy Control and Charging Rules Function (PCRF)
Station
(eNodeB)
Base Serving Packet Data
Control Plane
Data Plane
• No clear separation of control plane and data plane
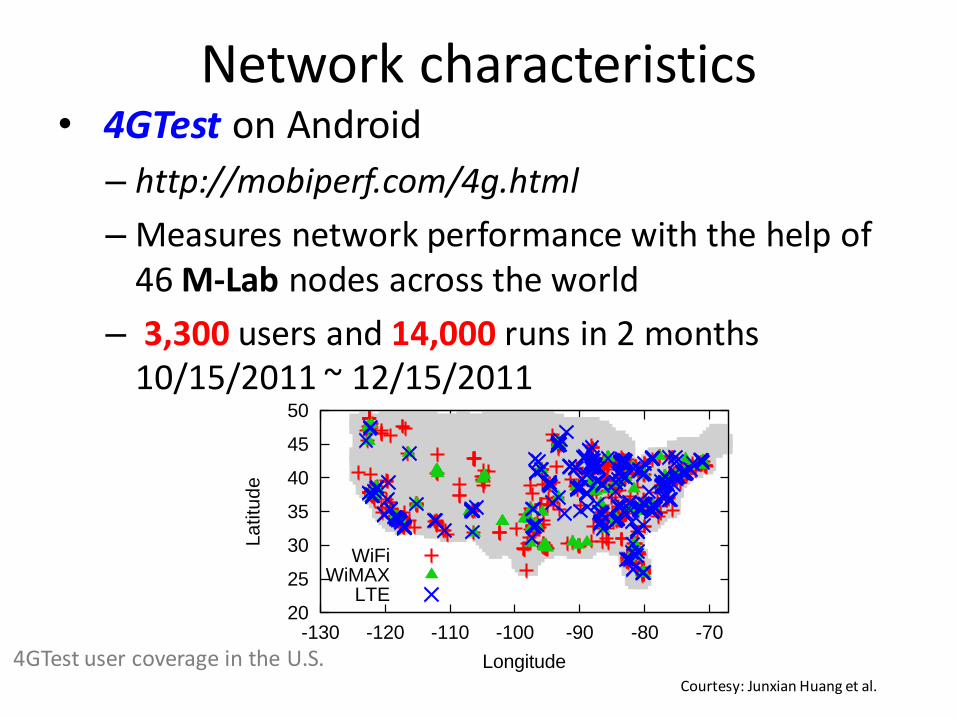
Network characteristics• 4GTest on Android
– http://mobiperf.com/4g.html
– Measures network performance with the help of 46 M-Lab nodes across the world
– 3,300 users and 14,000 runs in 2 months 10/15/2011 ~ 12/15/2011
20
25
30
35
40
45
50
-130 -120 -110 -100 -90 -80 -70
La
titu
de
Longitude
WiFiWiMAX
LTE
4GTest user coverage in the U.S.Courtesy: Junxian Huang et al.
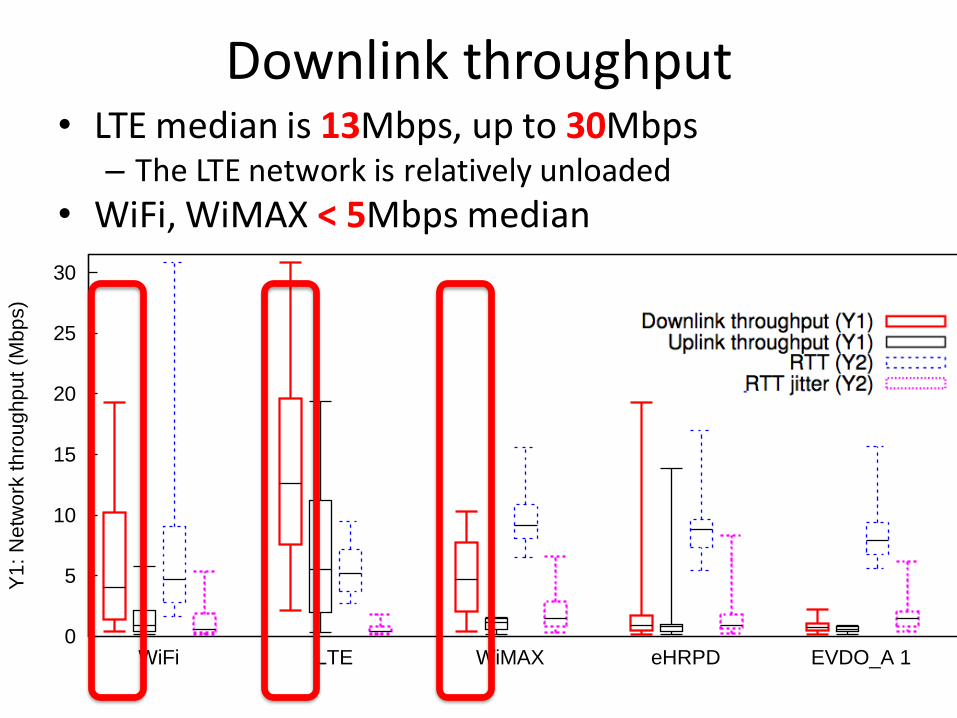
Downlink throughput• LTE median is 13Mbps, up to 30Mbps
– The LTE network is relatively unloaded
• WiFi, WiMAX < 5Mbps median
0
5
10
15
20
25
30
WiFi LTE WiMAX eHRPD EVDO_A 1 EVDO_A 2 HSDPA 1 HSDPA 2 0
100
200
300
400
Y1
: N
etw
ork
th
rou
gh
pu
t (M
bp
s)
Y2
: R
TT
(m
s)
Downlink throughput (Y1)Uplink throughput (Y1)
RTT (Y2)RTT jitter (Y2)
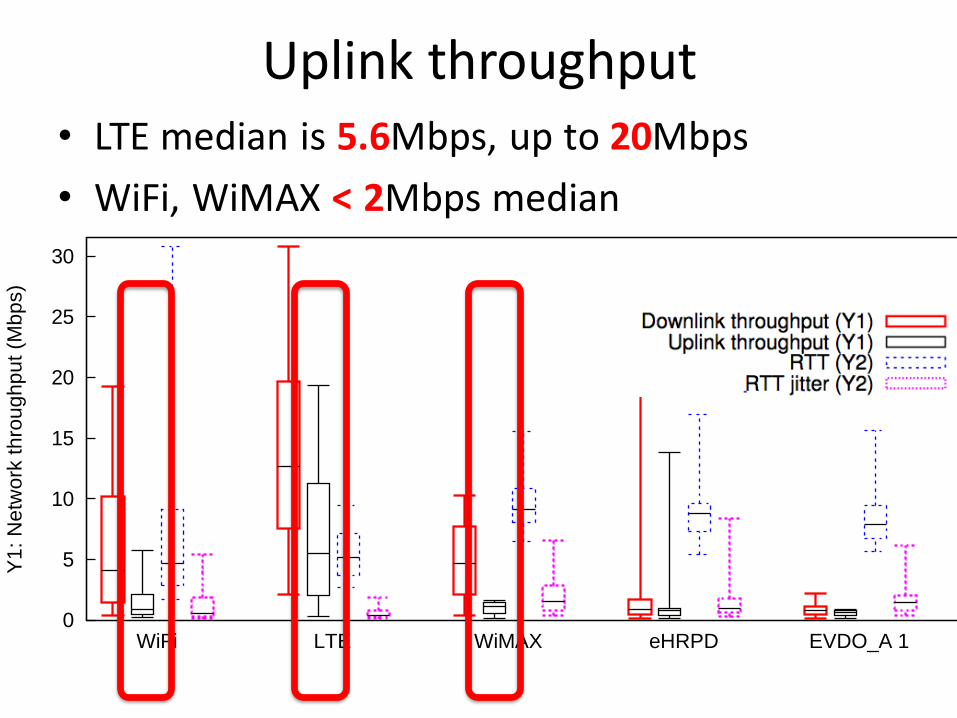
Uplink throughput• LTE median is 5.6Mbps, up to 20Mbps
• WiFi, WiMAX < 2Mbps median
0
5
10
15
20
25
30
WiFi LTE WiMAX eHRPD EVDO_A 1 EVDO_A 2 HSDPA 1 HSDPA 2 0
100
200
300
400
Y1
: N
etw
ork
th
rou
gh
pu
t (M
bp
s)
Y2
: R
TT
(m
s)
Downlink throughput (Y1)Uplink throughput (Y1)
RTT (Y2)RTT jitter (Y2)
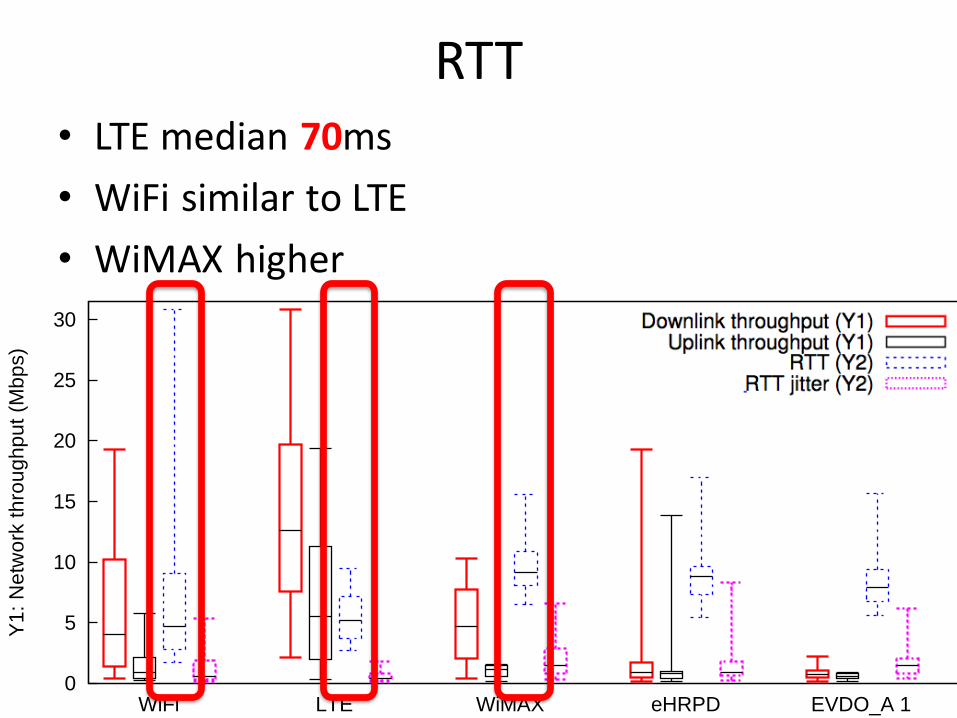
RTT• LTE median 70ms
• WiFi similar to LTE
• WiMAX higher
0
5
10
15
20
25
30
WiFi LTE WiMAX eHRPD EVDO_A 1 EVDO_A 2 HSDPA 1 HSDPA 2 0
100
200
300
400
Y1
: N
etw
ork
th
rou
gh
pu
t (M
bp
s)
Y2
: R
TT
(m
s)
Downlink throughput (Y1)Uplink throughput (Y1)
RTT (Y2)RTT jitter (Y2)

Outline
• Discuss Network Performance
• Discuss Implications of mobile device power optimizations
• Discuss implications of cellular network on performance
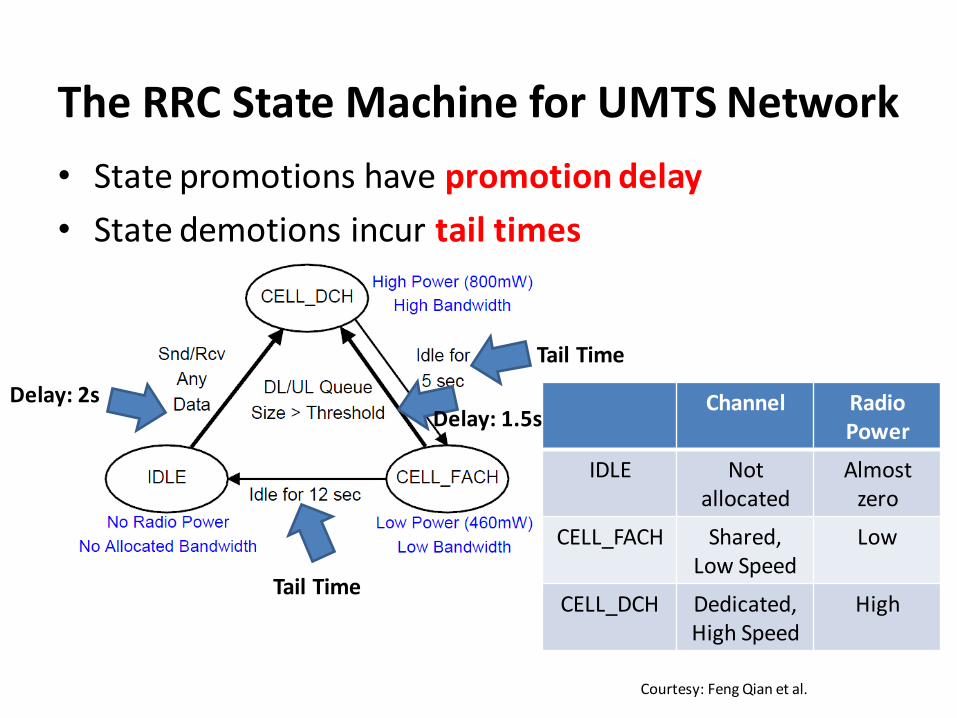
The RRC State Machine for UMTS Network
• State promotions have promotion delay
• State demotions incur tail times
Tail Time
Tail Time
Delay: 1.5sDelay: 2s Channel Radio
Power
IDLE Not allocated
Almostzero
CELL_FACH Shared, Low Speed
Low
CELL_DCH Dedicated, High Speed
High
Courtesy: Feng Qian et al.

Example: RRC State Machinefor a Large Commercial 3G Network
Promo Delay: 2 Sec
DCH Tail: 5 sec
FACH Tail: 12 sec
DCH: High Power State (high throughput and power consumption)FACH: Low Power State (low throughput and power consumption)IDLE: No radio resource allocated
Tail Time: waiting inactivity timers to expire
Courtesy: Feng Qian et al.
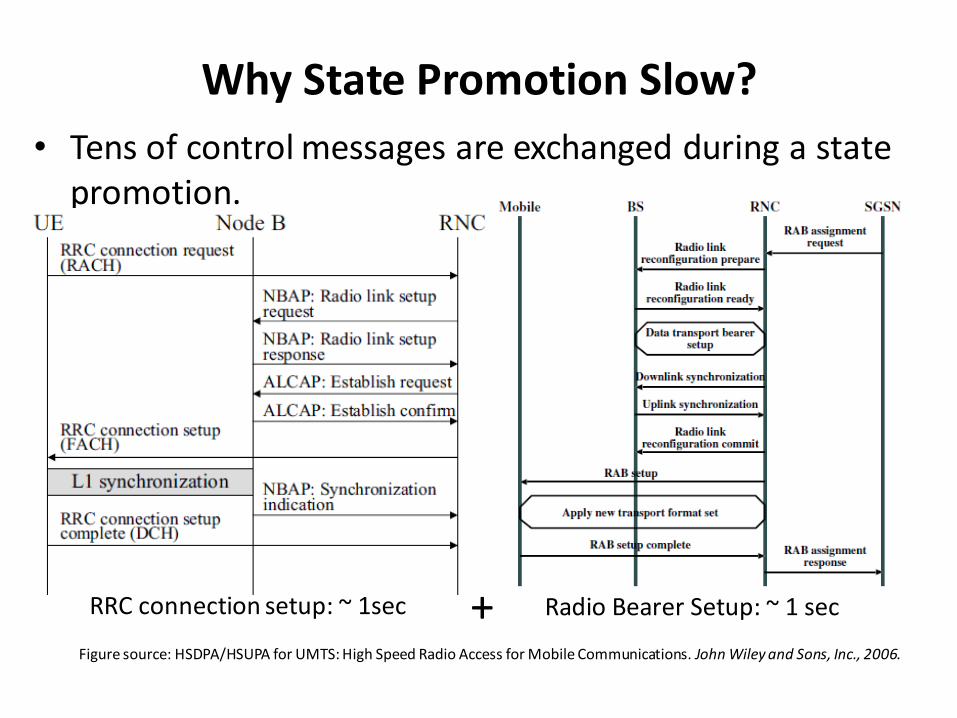
Why State Promotion Slow?
• Tens of control messages are exchanged during a state promotion.
RRC connection setup: ~ 1sec Radio Bearer Setup: ~ 1 sec+Figure source: HSDPA/HSUPA for UMTS: High Speed Radio Access for Mobile Communications. John Wiley and Sons, Inc., 2006.
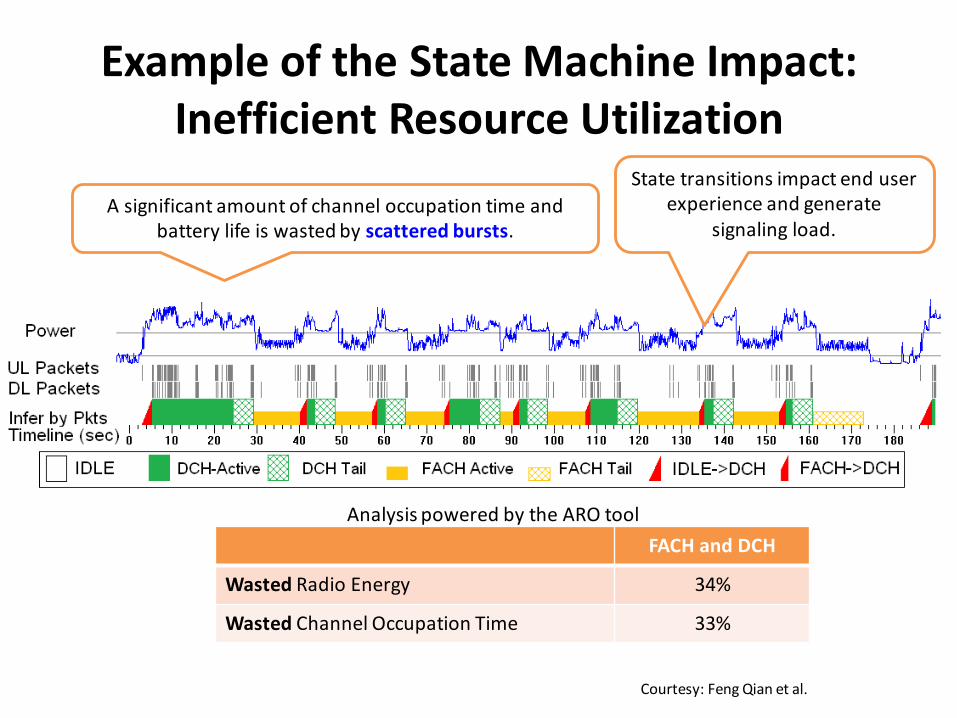
Example of the State Machine Impact:Inefficient Resource Utilization
FACH and DCH
Wasted Radio Energy 34%
Wasted Channel Occupation Time 33%
A significant amount of channel occupation time and battery life is wasted by scattered bursts.
State transitions impact end user experience and generate
signaling load.
Analysis powered by the ARO tool
Courtesy: Feng Qian et al.
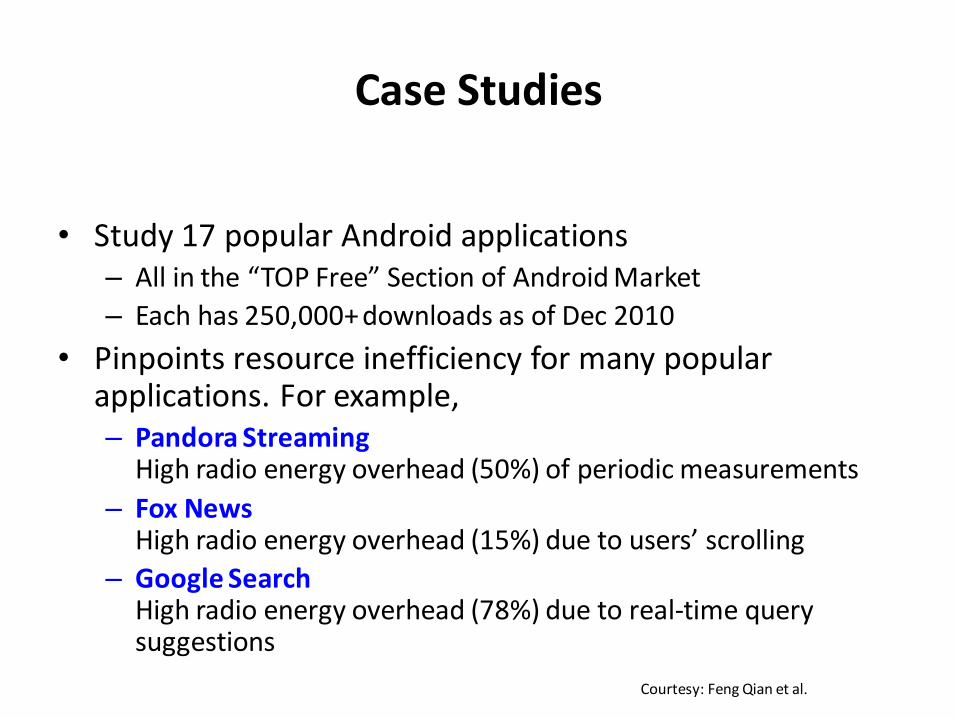
Case Studies
• Study 17 popular Android applications– All in the “TOP Free” Section of Android Market
– Each has 250,000+ downloads as of Dec 2010
• Pinpoints resource inefficiency for many popular applications. For example,– Pandora Streaming
High radio energy overhead (50%) of periodic measurements
– Fox NewsHigh radio energy overhead (15%) due to users’ scrolling
– Google SearchHigh radio energy overhead (78%) due to real-time query suggestions
Courtesy: Feng Qian et al.
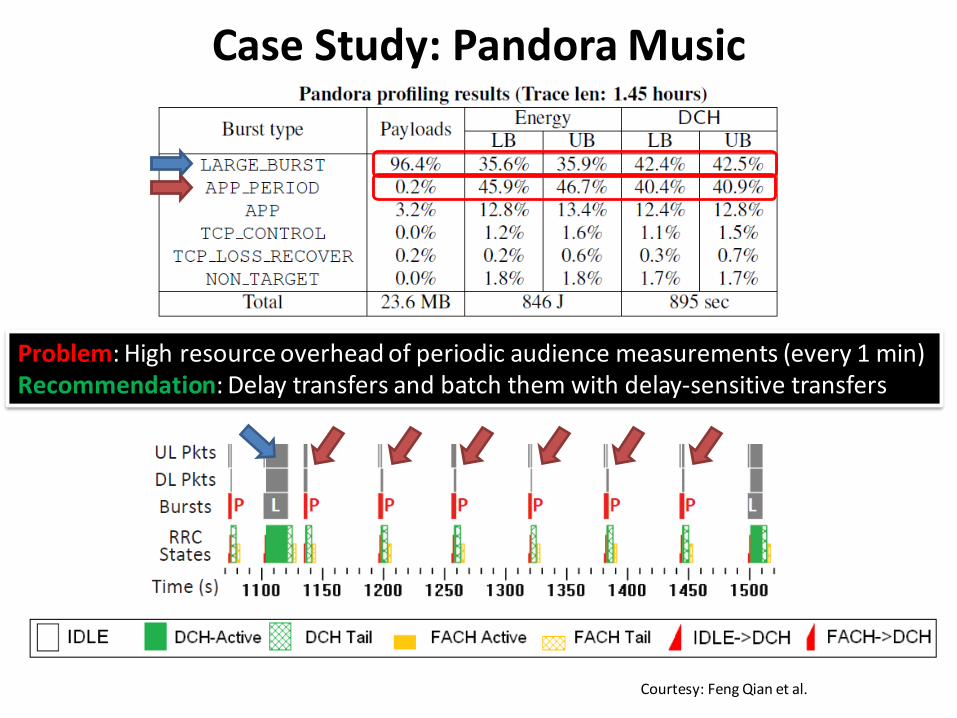
Case Study: Pandora Music
Problem: High resource overhead of periodic audience measurements (every 1 min)Recommendation: Delay transfers and batch them with delay-sensitive transfers
Courtesy: Feng Qian et al.
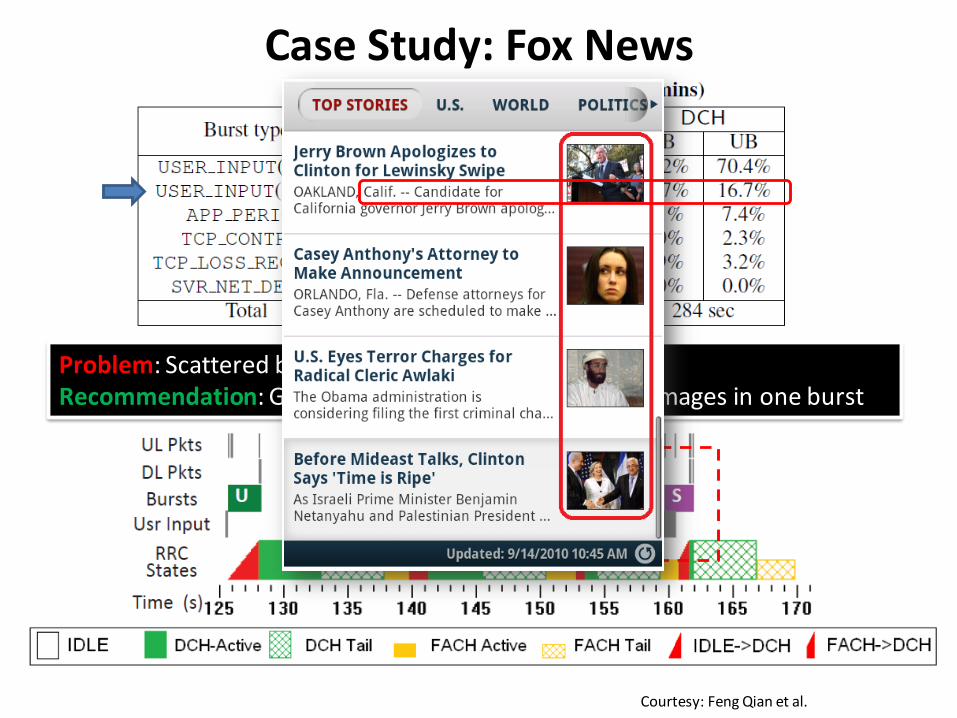
Case Study: Fox News
Problem: Scattered bursts due to scrollingRecommendation: Group transfers of small thumbnail images in one burst
Courtesy: Feng Qian et al.
Outline
• Discuss Network Performance
• Discuss Implications of mobile device power optimizations
• Discuss implications of cellular network on performance
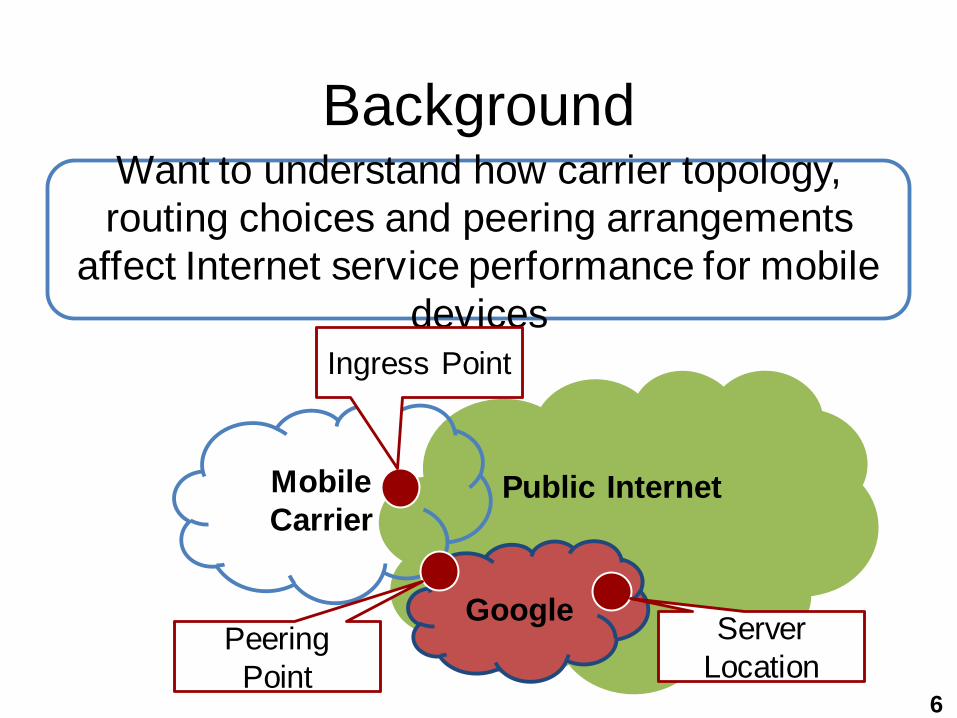
BackgroundWant to understand how carrier topology,
routing choices and peering arrangements
affect Internet service performance for mobile
devices
Public Internet
Mobile
Carrier
Ingress Point
Peering
Point6
Server
Location
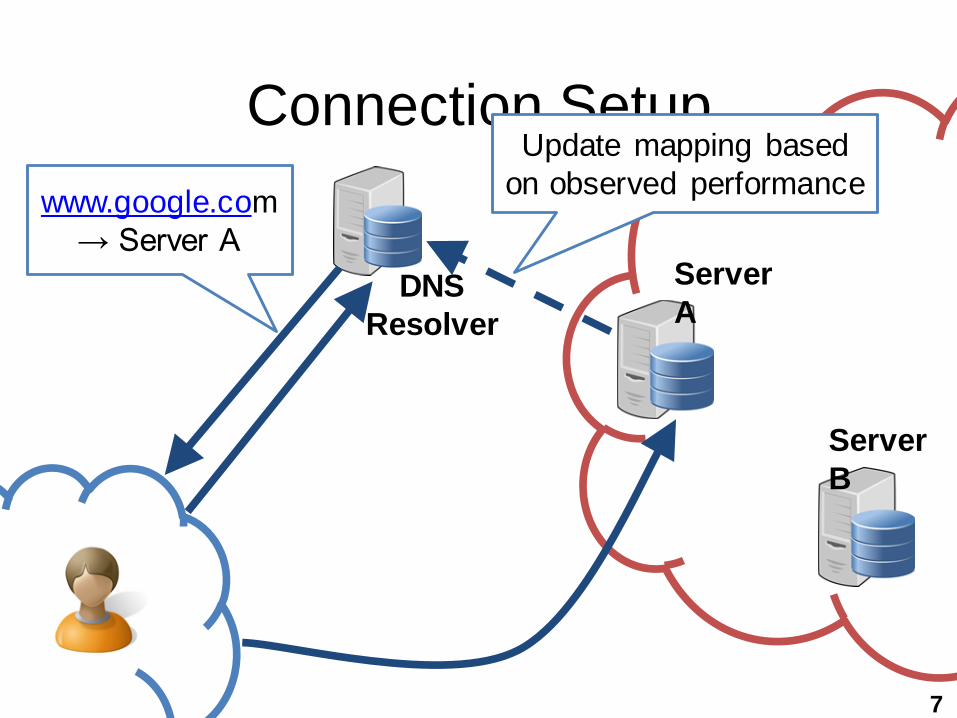
Connection Setup
Server
A
Server
B
www.google.com
→ Server A
Update mapping based
on observed performance
DNS
Resolver
7
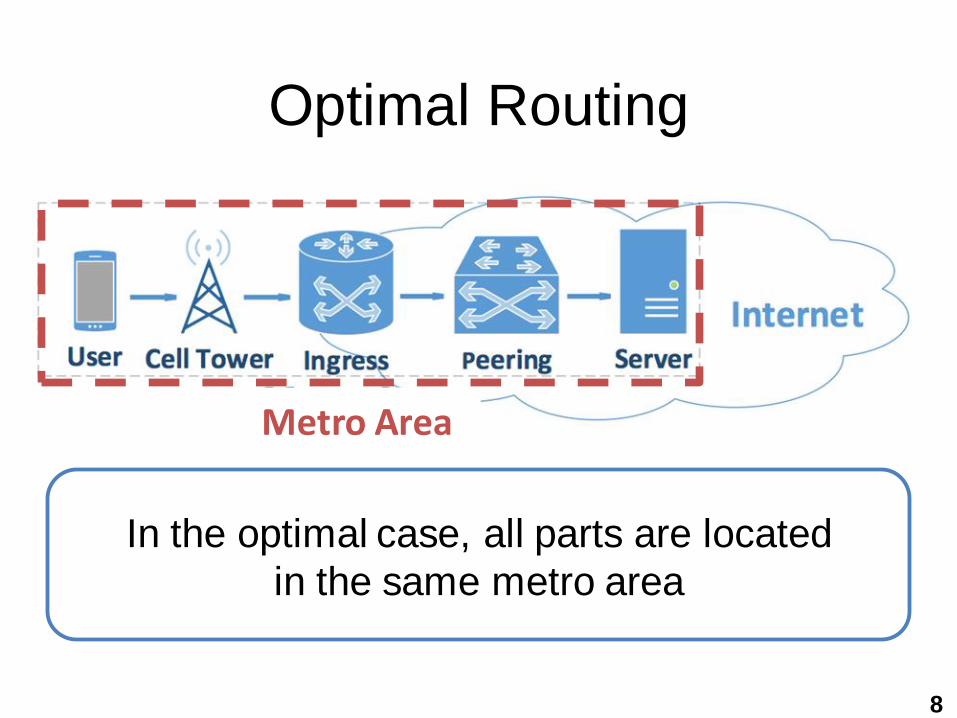
Optimal Routing
In the optimal case, all parts are located
in the same metro area
8
Metro Area
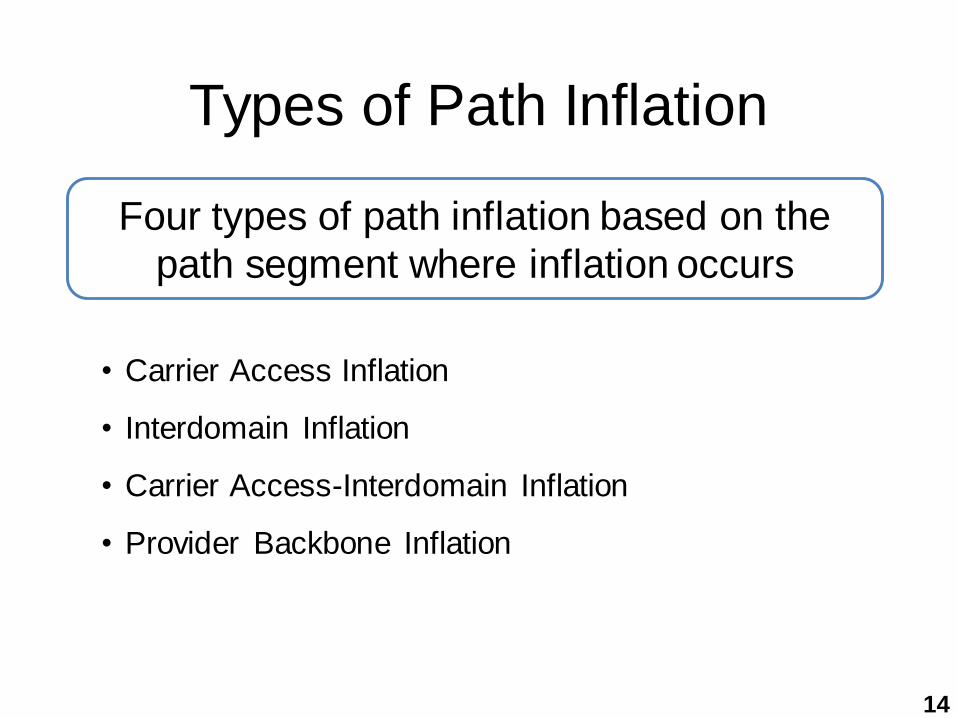
Types of Path Inflation
• Carrier Access Inflation
• Interdomain Inflation
• Carrier Access-Interdomain Inflation
• Provider Backbone Inflation
Four types of path inflation based on the
path segment where inflation occurs
14
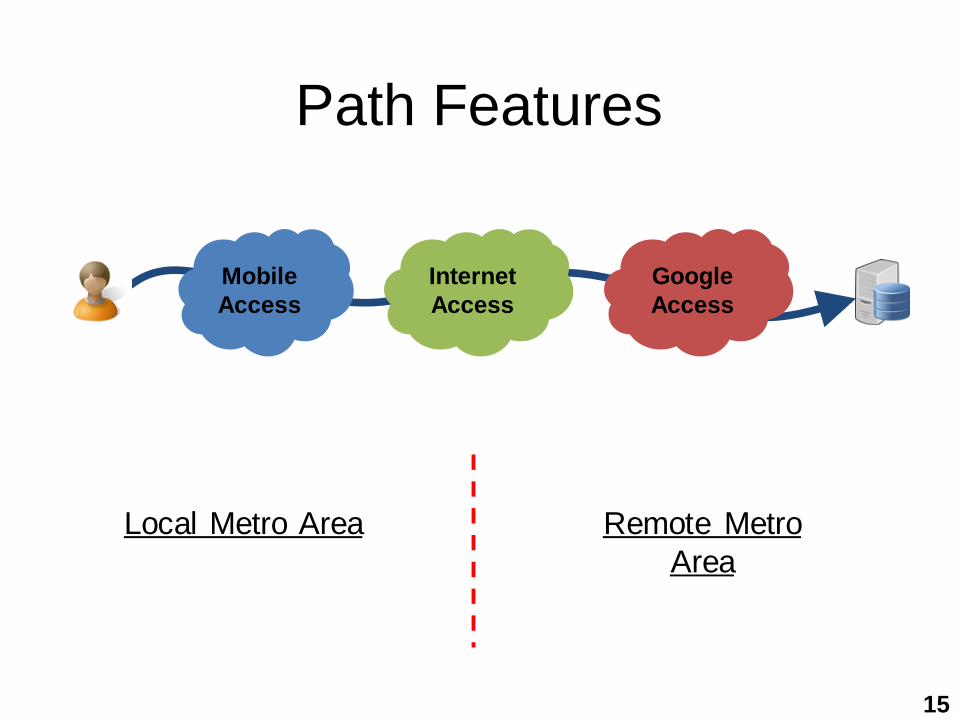
Path Features
Local Metro Area Remote Metro
Area
Mobile
Access
Internet
Access
Access
15
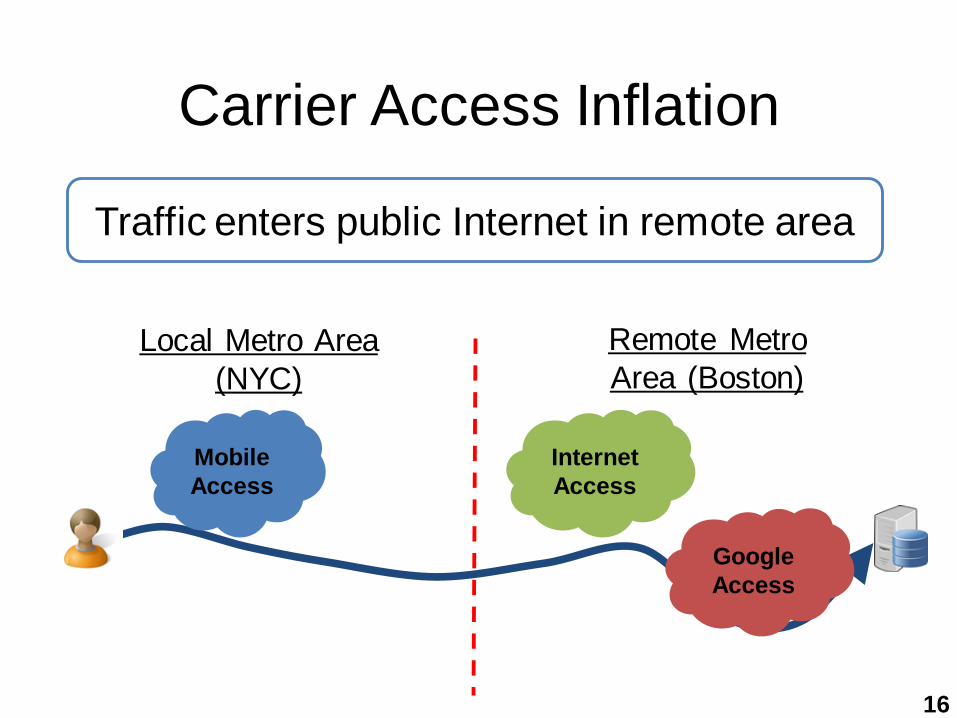
Carrier Access Inflation
Local Metro Area
(NYC)
Remote Metro
Area (Boston)
Traffic enters public Internet in remote area
Mobile
Access
Internet
Access
Access
16
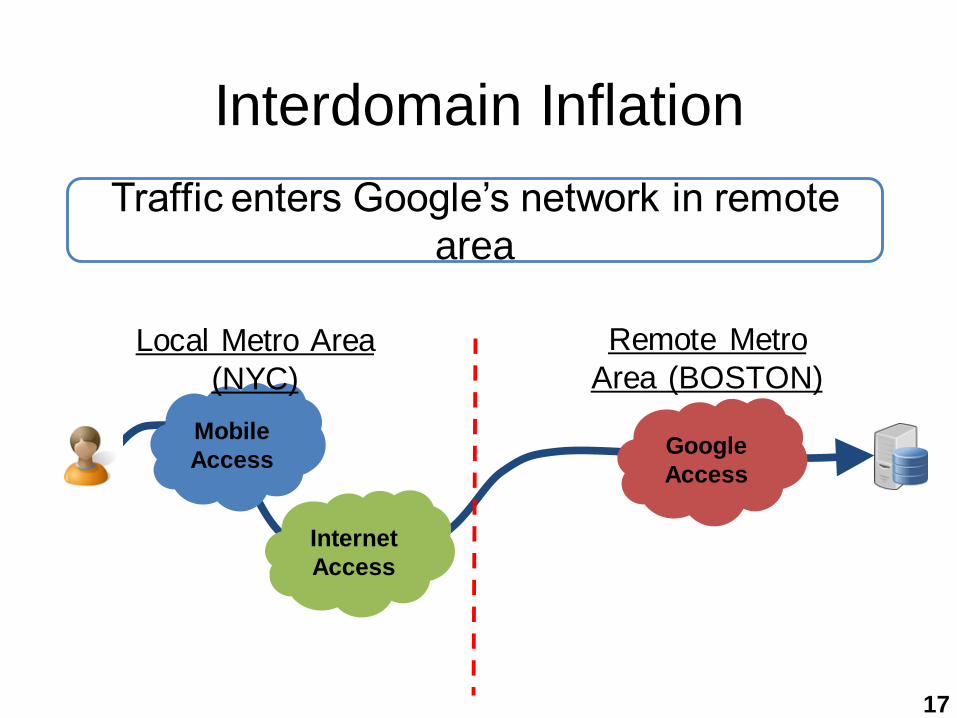
Interdomain Inflation
Traffic enters Google’s network in remote
area
Mobile
Access
Internet
Access
Access
Local Metro Area
(NYC)
Remote Metro
Area (BOSTON)
17
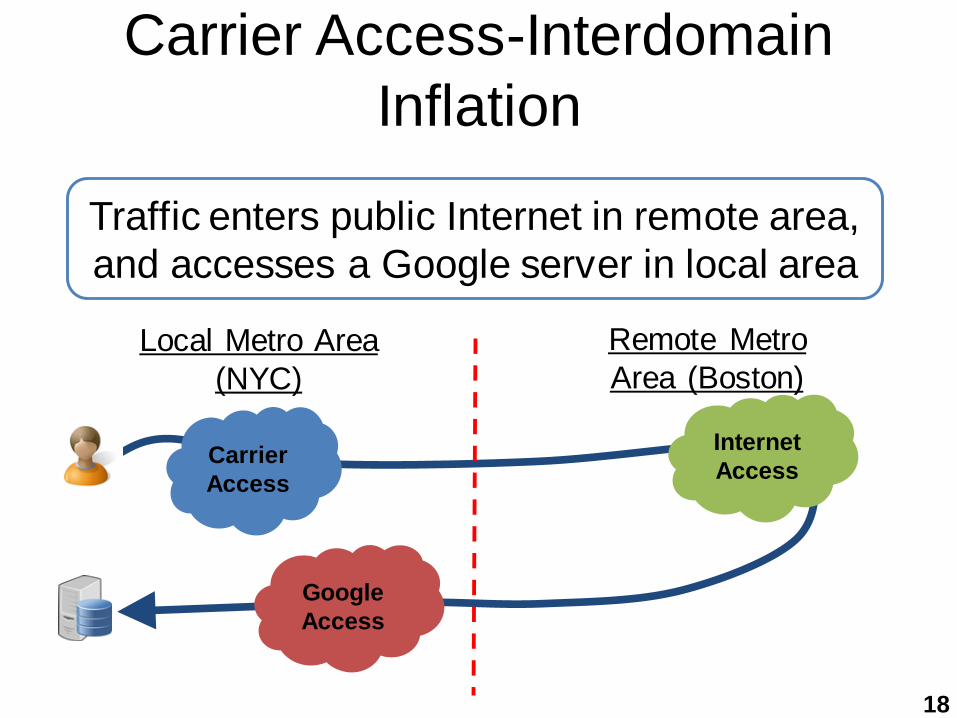
Carrier Access-Interdomain
Inflation
Traffic enters public Internet in remote area,
and accesses a Google server in local area
Carrier
Access
Internet
Access
Access
Local Metro Area
(NYC)
Remote Metro
Area (Boston)
18
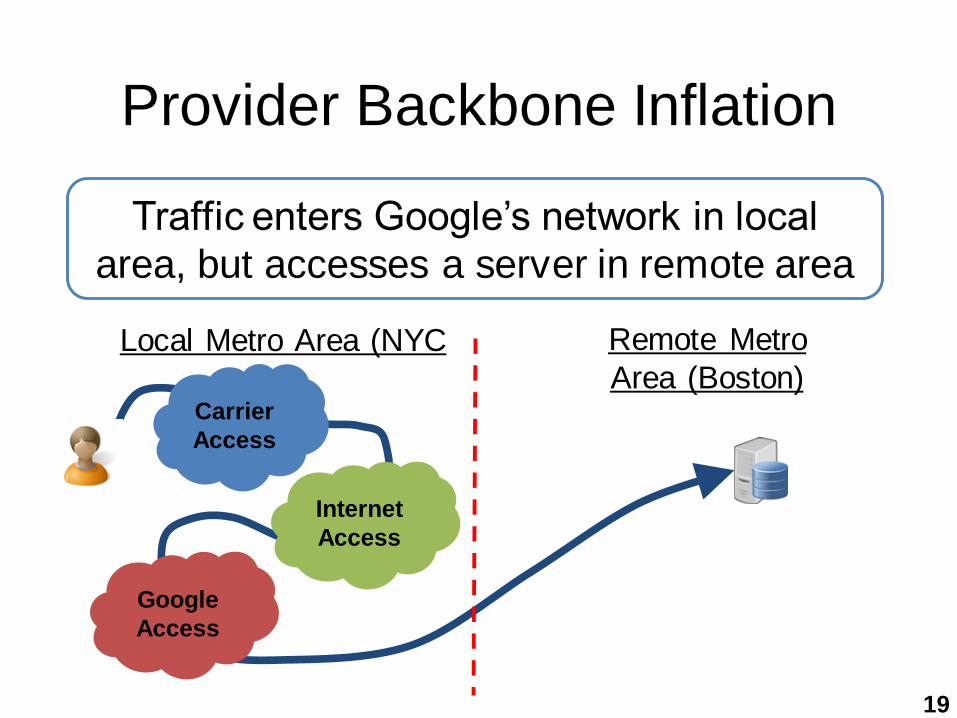
Provider Backbone Inflation
Traffic enters Google’s network in local
area, but accesses a server in remote area
Carrier
Access
Internet
Access
Access
Local Metro Area (NYC Remote Metro
Area (Boston)
19
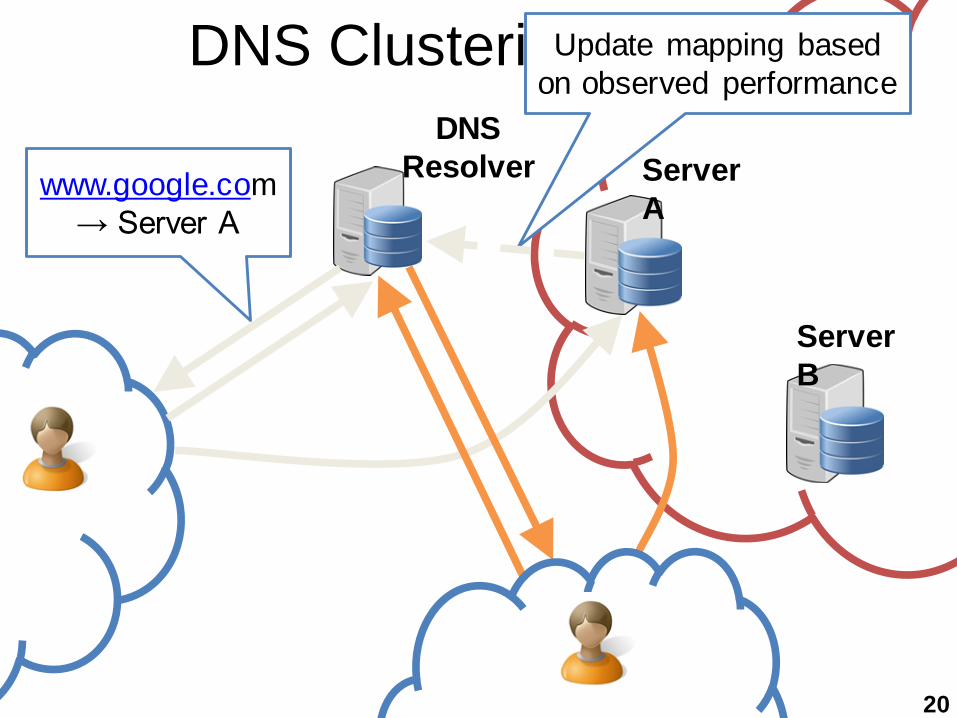
DNS Clustering
Server
A
Server
B
www.google.com
→ Server A
Update mapping based
on observed performance
DNS
Resolver
20
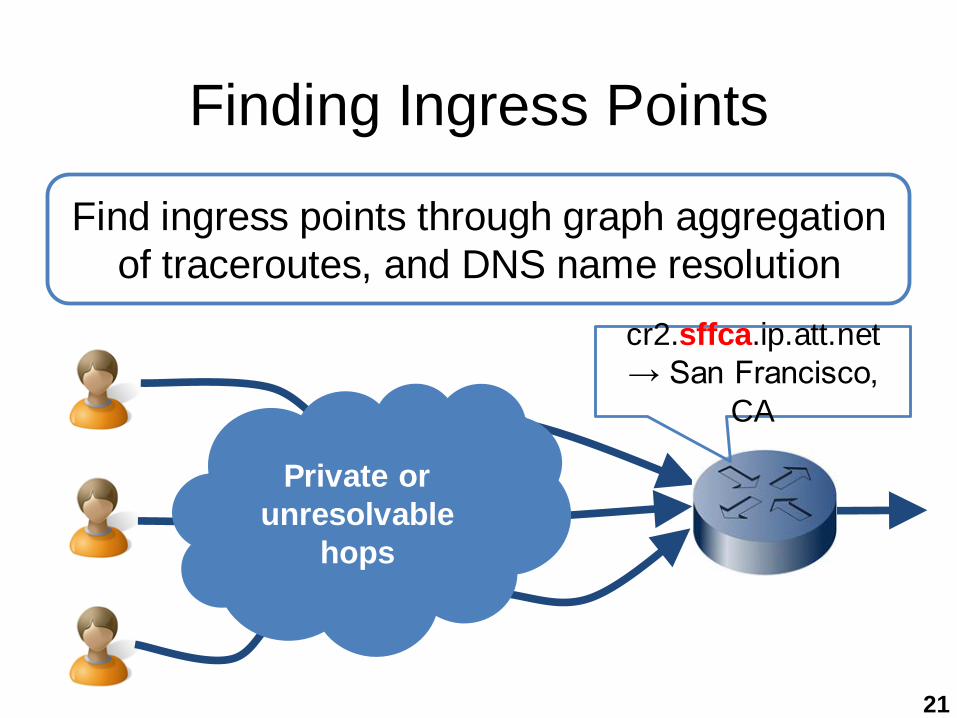
Finding Ingress Points
Find ingress points through graph aggregation
of traceroutes, and DNS name resolution
Private or
unresolvable
hops
cr2.sffca.ip.att.net
→ San Francisco,
CA
21
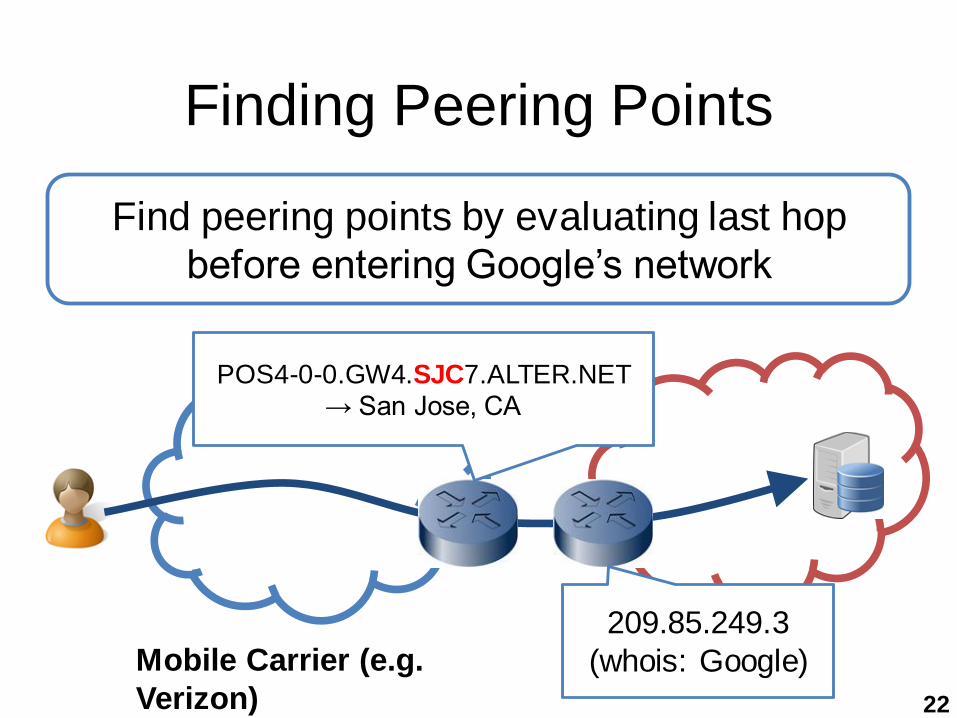
Finding Peering Points
Find peering points by evaluating last hop
before entering Google’s network
Mobile Carrier (e.g.
Verizon)
POS4-0-0.GW4.SJC7.ALTER.NET
→ San Jose, CA
22
209.85.249.3
(whois: Google)
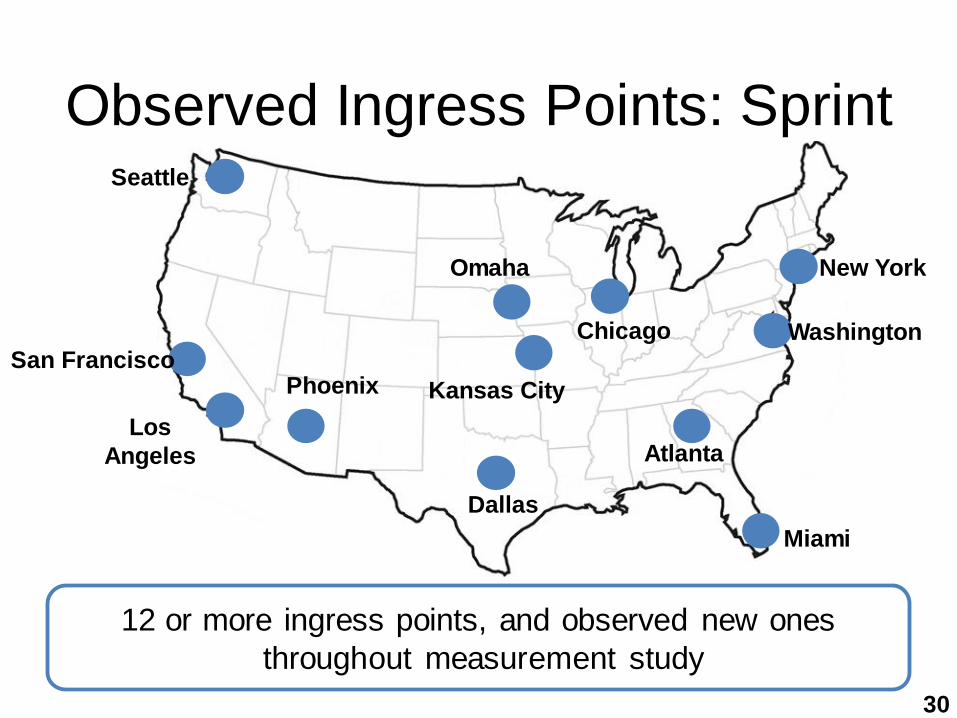
Observed Ingress Points: SprintSeattle
San Francisco
Los
Angeles
Phoenix
Dallas
Omaha
Chicago
Kansas City
Miami
Atlanta
Washington
New York
12 or more ingress points, and observed new ones
throughout measurement study
30
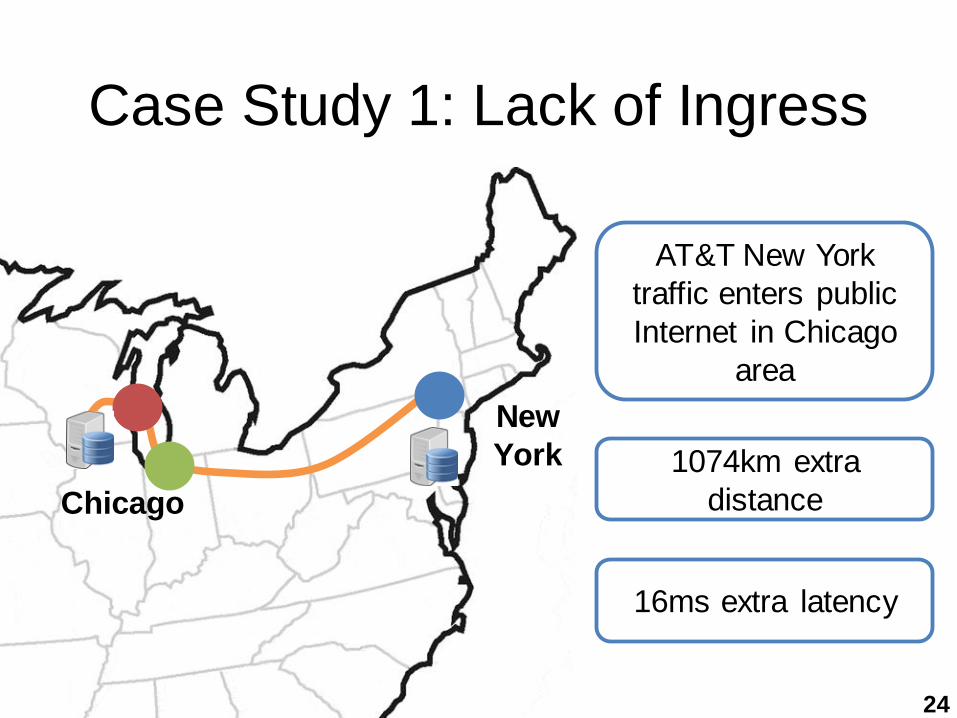
Case Study 1: Lack of Ingress
Chicago
New
York
AT&T New York
traffic enters public
Internet in Chicago
area
1074km extra
distance
16ms extra latency
24
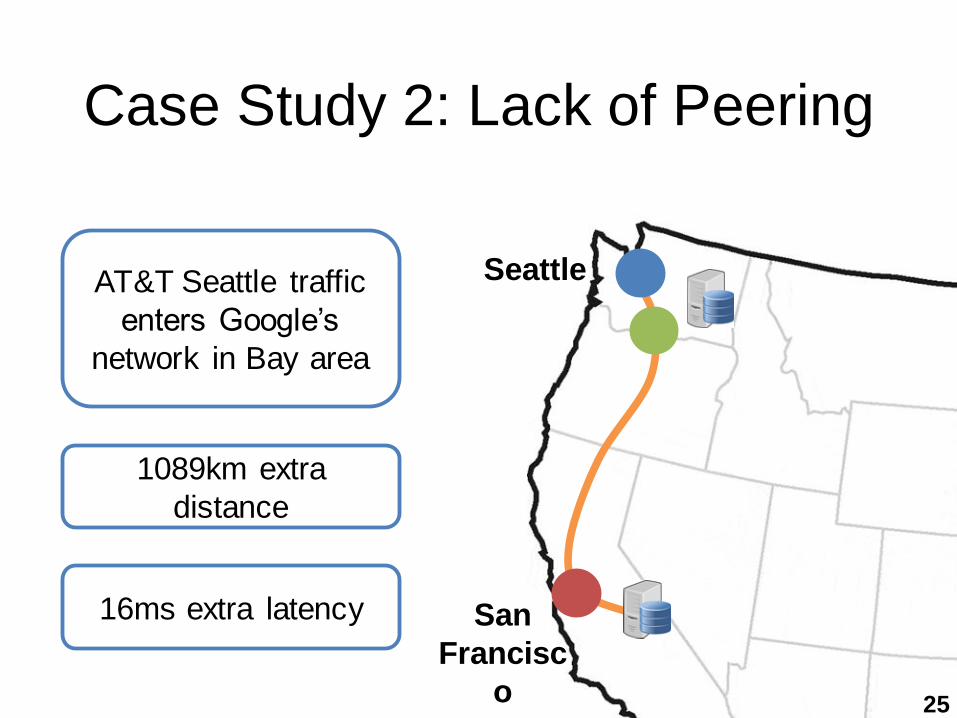
Case Study 2: Lack of Peering
San
Francisc
o
SeattleAT&T Seattle traffic
enters Google’s
network in Bay area
1089km extra
distance
16ms extra latency
25
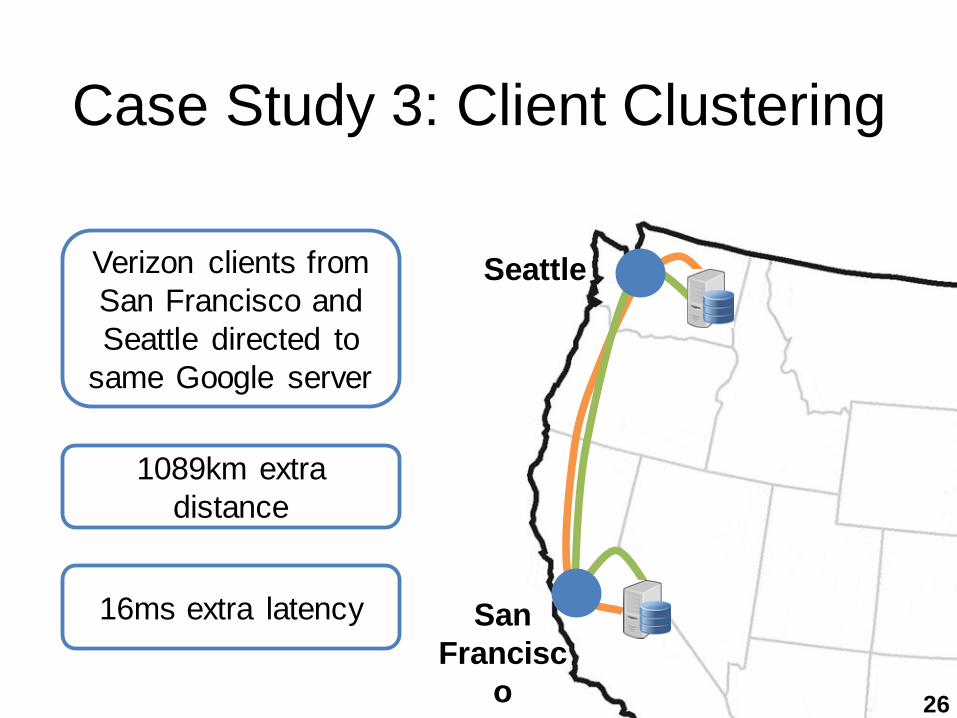
Case Study 3: Client Clustering
San
Francisc
o
SeattleVerizon clients from
San Francisco and
Seattle directed to
same Google server
1089km extra
distance
16ms extra latency
26
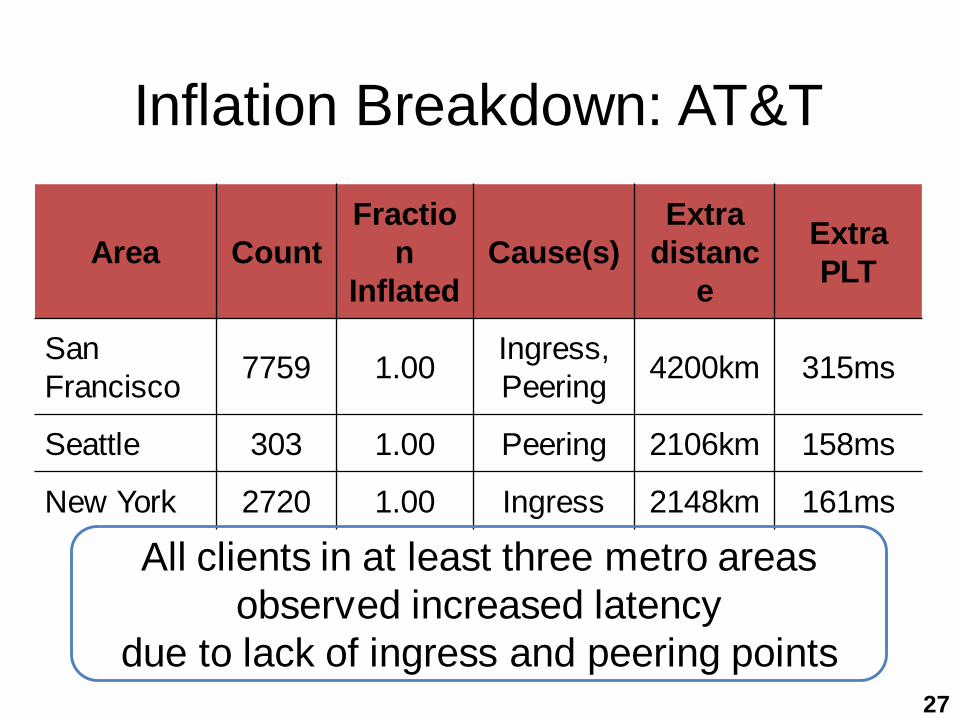
Inflation Breakdown: AT&T
Area Count
Fractio
n
Inflated
Cause(s)
Extra
distanc
e
Extra
PLT
San
Francisco7759 1.00
Ingress,
Peering4200km 315ms
Seattle 303 1.00 Peering 2106km 158ms
New York 2720 1.00 Ingress 2148km 161ms
All clients in at least three metro areas
observed increased latency
due to lack of ingress and peering points27
Cellular Networks
• LTE protocol improves mobile client energy savings– Overheads still exists
• Path inflation exists in other parts of the world– Nawras clients in Oman are directed to
Paris (France) instead of New Delhi (India)
→ Round-trip distance increased by over 7000km
– Movistar clients in Spain are directed to London (UK)
instead of targeting local servers in Madrid
35