Embed Size (px)
Citation preview
Int. J. Bioinformatics Research and Applications, Vol. 1, No. 3, 2006 335
Copyright © 2006 Inderscience Enterprises Ltd.
Cellular function prediction and biological pathway discovery in Arabidopsis thaliana using microarray data
Trupti Joshi Digital Biology Laboratory, Department of Computer Science, University of Missouri-Columbia, Columbia, MO, USA E-mail: [email protected]
Yu Chen Digital Biology Laboratory, Department of Computer Science, University of Missouri-Columbia, Columbia, MO, USA
UT-ORNL Graduate School of Genome Science and Technology, Oak Ridge, TN, USA E-mail: [email protected]
Nickolai N. Alexandrov Ceres, Inc., 1535 Rancho Conejo Blvd., Thousand Oaks, CA, USA E-mail: [email protected]
Dong Xu* Digital Biology Laboratory, Department of Computer Science, University of Missouri-Columbia, Columbia, MO, USA
UT-ORNL Graduate School of Genome Science and Technology, Oak Ridge, TN, USA E-mail: [email protected] *Corresponding author
Abstract: Determination of protein function and biological pathway is one of the most challenging problems in the post-genomic era. To address this challenge, we have developed a new integrated probabilistic method for cellular function prediction using microarray gene expression profiles, in
336 T. Joshi, Y. Chen, N.N. Alexandrov and D. Xu
conjunction with predicted protein-protein interactions and annotations of known proteins. Our approach is based on a novel assessment for the relationship between correlation of two genes’ expression profiles and their functional relationship in terms of the Gene Ontology (GO) hierarchy. We applied the method for function prediction of hypothetical genes in Arabidopsis. We have also extended our method using Dijkstra’s algorithm to identify the components and topology of signaling pathway of phosphatidic acid as a second messenger in Arabidopsis.
Keywords: function prediction; microarray; protein-protein interactions; high-throughput data; Arabidopsis thaliana; pathways.
Reference to this paper should be made as follows: Joshi, T., Chen, Y., Alexandrov, N.N. and Xu, D. (2006) ‘Cellular function prediction and biological pathway discovery in Arabidopsis thaliana using microarray data’, Int. J. Bioinformatics Research and Applications, Vol. 1, No. 3, pp.335–350.
Biographical notes: Trupti Joshi is a Bioinformatics Programmer/Analyst in the Digital Biology Laboratory, Computer Science Department at the University of Missouri-Columbia. She earned an MS Degree with computational biology and bioinformatics major from the University of Tennessee–Oak Ridge National Laboratory, Graduate School of Genome Science and Technology. Her research interests are in the areas of data mining, analysis of high-throughput biological data including gene expression profiles, protein-protein interaction data and ESTs analysis, and application and development of bioinformatics methods for function and biological pathway discovery.
Yu Chen is a Postdoctoral Fellow in Bioinformatics, Biomarker Development, Novartis Pharmaceuticals Corporation. He obtained his PhD Degree in Computational Biology and Bioinformatics from the University of Tennessee–Oak Ridge National Laboratory, Graduate School of Genome Science and Technology in 2004. His research interests include data mining of large-scale biological data and gene expression profile/signature analysis of pharmacological and/or toxicity effects leading to the discovery of biomarkers.
Nickolai N. Alexandrov is a Manager of Computational Biology at Ceres Inc. He obtained his PhD in Molecular Biology (computational) at the Institute for Genetics of Micro-organisms, Moscow, Russia in 1989. He worked as a Researcher in the Institute of Genetics of Industrial Micro-organisms, Russia, Kyoto University, Japan, Protein Engineering Research Institute, Japan, National Cancer Institute (US), and Amgen Inc. His research interests are in the areas of protein structure analysis and prediction, gene expression data analysis, and biological sequence analysis.
Dong Xu is a James C. Dowell Associate Professor and Director of the Digital Biology Laboratory in the Computer Science Department, University of Missouri, Columbia. He obtained his PhD from the University of Illinois, Urbana-Champaign in 1995. He worked as a Researcher at the National Cancer Institute and Oak Ridge National Laboratory. He has been involved in many areas of computational biology and bioinformatics, including protein structure prediction and analysis, high-throughput biological data analyses, computational proteomics, and in silico studies of plant and microbes.
Cellular function prediction and biological pathway discovery 337
1 Introduction Determination of protein function is one of the most important and challenging problems in the post-genomic era. The traditional wet laboratory experiments for this purpose are accurate, but the process is time-consuming and costly. Despite all the efforts, only 50–60% of genes have been annotated in most organisms. This leaves bioinformatics with the opportunity and challenge of predicting functions of unannotated proteins by developing efficient and automated methods.
Several approaches have been developed for predicting protein function. The classical way to infer function is based on sequence similarity using programs such as FASTA (Pearson and Lipman, 1998) and PSI-BLAST (Altschul et al., 1997). Another method to predict function is based on sequence fusion information, i.e., the Rosetta-Stone approach (Marcotte et al., 1999). Function can also be inferred based on the phylogenetic footprint of proteins in multiple genomes (Pellegrini et al., 1999). With an ever-increasing flow of biological data generated by the high-throughput methods such as yeast two-hybrid systems (Chien et al., 1991), protein complexes identification by mass spectrometry (Gavin et al., 2002; Ho et al., 2002), microarray gene expression profiles (Eisen et al., 1998; Brown et al., 2000), and systematic synthetic lethal analysis (Tong et al., 2001; Goehring et al., 2003), some computational approaches have been developed to use this data for gene function prediction. Clustering analysis of the gene-expression profiles is a common approach used to predict function based on the assumption that genes with similar functions are likely to be coexpressed (Eisen et al., 1998; Brown et al., 2000; Pavlidis and Weston, 2001). Using protein-protein interaction data to assign function to novel proteins is another approach. Proteins often interact with one another in an interaction network to achieve a common objective. It is, therefore, possible to infer the functions of proteins based on the functions of their interaction partners. Schwikowski et al. (2000) applied the neighbour-counting method in predicting the function. The method was improved by Hishigaki et al. (2001), who used χ2 statistics. Both these approaches give equal significance to all the functions contributed by the neighbours of the protein. Other function prediction methods using high-throughput data include machine-learning and data-mining approaches (Clare and King, 2003) and Markov random fields (Deng et al., 2002, 2003). Instead of searching for a simple consensus among the functions of the interacting partners, Deng et al. (2002, 2003) used the Bayesian approach to assign a probability for an unannotated protein to have the annotated function. Letovsky and Kasif (2003) have developed a similar method, which combines Markov random field propagation algorithm with functional linkage graph of local neighbours. Another Bayesian approach for combining heterogeneous data in yeast for function assignment has been applied by Troyanskaya et al. (2003).
Although these methods have been developed for gene function prediction, we believe that the error in the high-throughput data has not been handled well and the rich information contained in high-throughput data has not been fully utilised given the complexity and the quality of high-throughput data (Chen and Xu, 2003). Inherent in the high-throughput nature of the experimental techniques is heterogeneity in data quality. The data generated are noisy and incomplete, with many false positives and false negatives. In a microarray clustering analysis, the genes with similar functions may not be clustered together because of lack of similar expression profiles. Clearly, different types of high-throughput data indicate different aspects of the internal relationships between the same set of genes. Each type of high-throughput data has its strengths and weaknesses in revealing certain relationships. Therefore, different types of
338 T. Joshi, Y. Chen, N.N. Alexandrov and D. Xu
high-throughput data complement each other and offer more information than a single source. The combination of high-throughput data from various sources also provides a basis for cross-validating the data to reduce the effect of noise in the data. While most current methods use a single source of high-throughput data for function prediction, it is evident that integrating various types of high-throughput data will help handle the data quality issue and retrieve better the underlying information from the data for function prediction. Although a few attempts have been made along the line, better statistical models can be developed to retrieve more information from the data. In this paper, we propose a statistical model for functional annotation of unannotated proteins in Arabidopsis thaliana using high-throughput biological data including microarray gene expression profiles and predicted protein-protein interactions from genomic sequences. In our approach, we improved function predictions by developing an integrative statistical model, which better quantifies the relationship between functional similarity and high-throughput data similarity than the existing methods.
2 Method
2.1 Cellular function prediction
Our method consists of two steps. In the first step, we estimate the a-priori probabilities for two genes to share a similar function given their microarray gene expression profiles and predicted protein-protein interactions. In the second step, we utilise these estimated a-priori probabilities to predict the functions of unannotated proteins. For function assignment, it is important to differentiate the types of functions. A particular gene product can be characterised with respect to its molecular function at the biochemical level (e.g., cyclase or kinase, whose annotation is often more related to sequence similarity and protein structure) or the biological process which it contributes to (e.g., pyrimidine metabolism or signal transduction that is often revealed in the high-throughput data of protein interaction and gene expression profiles). In our study, function annotation of protein is defined by GO (Gene Ontology) biological process (The Gene Ontology Consortium, 2000). It can be organised in a hierarchical structure with nine classes at the top level that are subdivided into more specific classes at subsequent levels. We acquired GO biological process functional annotation for the known proteins as of 26th November, 2002 (ftp://ftp.geneontology.org/pub/go/ ontology-archive), and generated a numerical GO INDEX, which represents the hierarchical structure of the classification. The deepest level of hierarchy is 13 (excluding the first level, which always begins with 1, representing biological process, to distinguish them from the other molecular function and cellular component categories in the GO annotation). The following shows an example of GO hierarchy: • 1-4 cell growth and/or maintenance GO:0008151 • 1-4-3 cell cycle GO:0007049 • 1-4-3-2 DNA replication and chromosome cycle GO:0000067 • 1-4-3-2-4 DNA replication GO:0006260 • 1-4-3-2-4-2 DNA dependent DNA replication GO:0006261 • 1-4-3-2-4-2-2 DNA ligation GO:0006266.
Cellular function prediction and biological pathway discovery 339
An ORF (Open Reading Frame) can (and usually does) belong to multiple indices at various index levels in the hierarchy, as the proteins may be involved in more than one function in a cell.
2.1.1 Estimation of a-priori probabilities
The a-priori probability (Pa) is the observed frequency based on the information available from high-throughput data about the functions of already annotated proteins. We estimated a-priori probabilities by comparing the pairs in high-throughput data, where both genes have annotated functions, and by simultaneously comparing the level of similarity in functions that the two genes share in terms of the GO INDEX. For example, consider an interaction pair ORF1 and ORF2, both of which are annotated proteins. Assume ORF1 has a function represented by GO INDEX 4-3-3-4 and ORF2 has a function 4-3-2. When compared with each other for the level of matching GO INDEX, they match through INDEX level 1 (4) and level 2 (4-3).
2.1.1.1 Arabidopsis microarray data
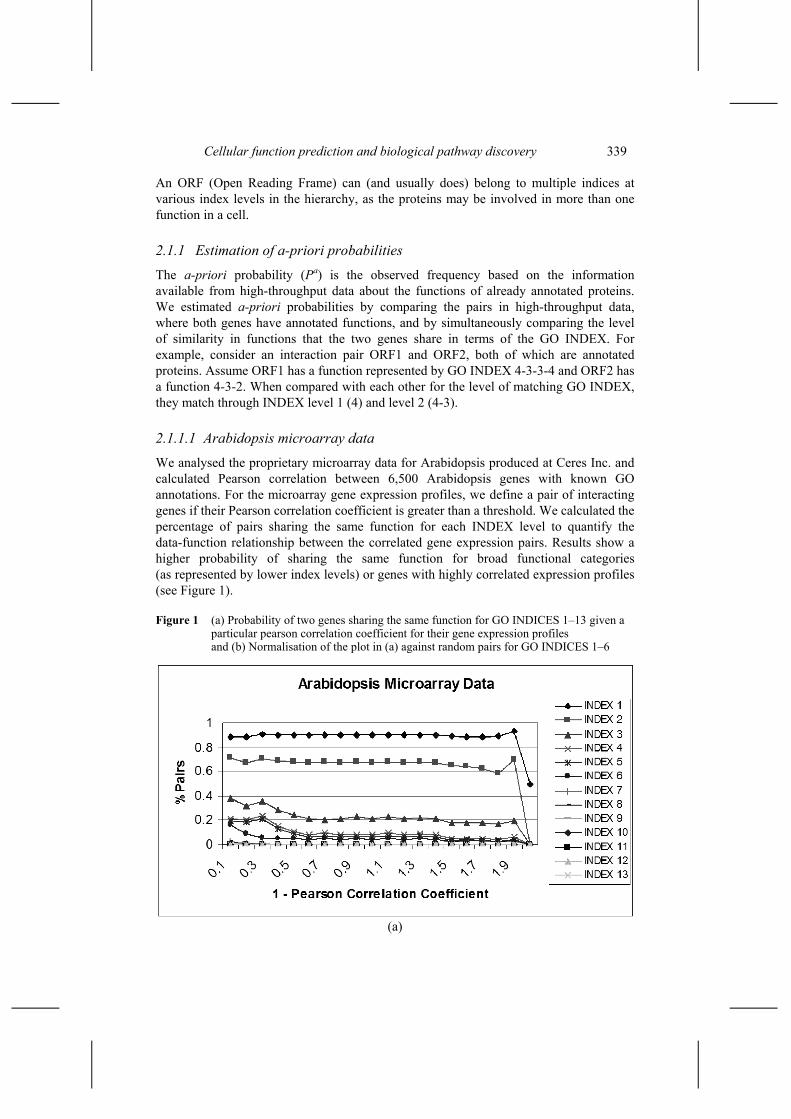
We analysed the proprietary microarray data for Arabidopsis produced at Ceres Inc. and calculated Pearson correlation between 6,500 Arabidopsis genes with known GO annotations. For the microarray gene expression profiles, we define a pair of interacting genes if their Pearson correlation coefficient is greater than a threshold. We calculated the percentage of pairs sharing the same function for each INDEX level to quantify the data-function relationship between the correlated gene expression pairs. Results show a higher probability of sharing the same function for broad functional categories (as represented by lower index levels) or genes with highly correlated expression profiles (see Figure 1).
Figure 1 (a) Probability of two genes sharing the same function for GO INDICES 1–13 given a particular pearson correlation coefficient for their gene expression profiles and (b) Normalisation of the plot in (a) against random pairs for GO INDICES 1–6
(a)
340 T. Joshi, Y. Chen, N.N. Alexandrov and D. Xu
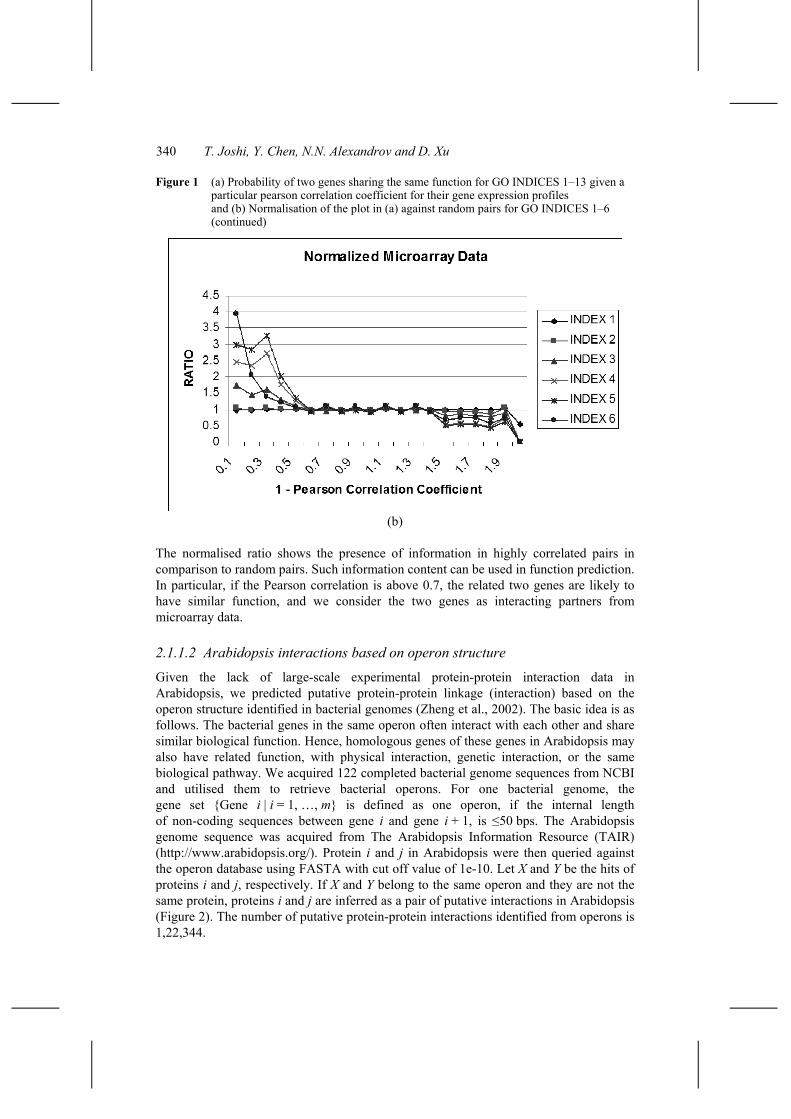
Figure 1 (a) Probability of two genes sharing the same function for GO INDICES 1–13 given a particular pearson correlation coefficient for their gene expression profiles and (b) Normalisation of the plot in (a) against random pairs for GO INDICES 1–6 (continued)
(b)
The normalised ratio shows the presence of information in highly correlated pairs in comparison to random pairs. Such information content can be used in function prediction. In particular, if the Pearson correlation is above 0.7, the related two genes are likely to have similar function, and we consider the two genes as interacting partners from microarray data.
2.1.1.2 Arabidopsis interactions based on operon structure
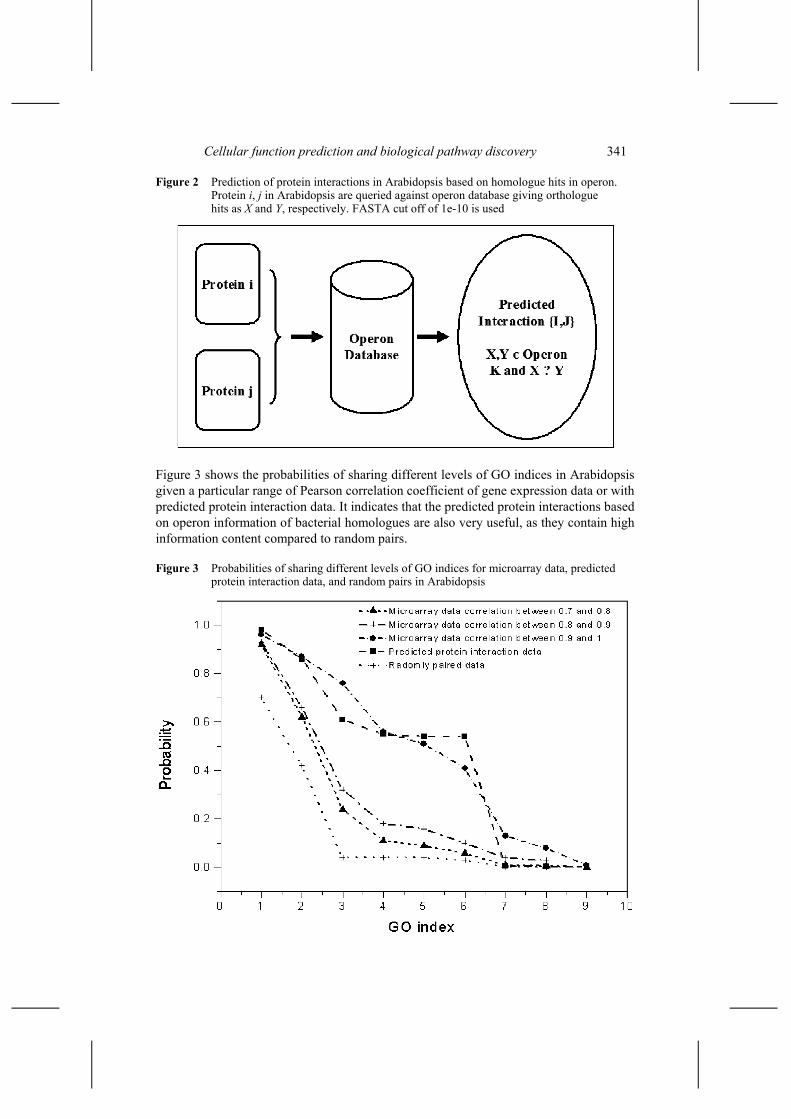
Given the lack of large-scale experimental protein-protein interaction data in Arabidopsis, we predicted putative protein-protein linkage (interaction) based on the operon structure identified in bacterial genomes (Zheng et al., 2002). The basic idea is as follows. The bacterial genes in the same operon often interact with each other and share similar biological function. Hence, homologous genes of these genes in Arabidopsis may also have related function, with physical interaction, genetic interaction, or the same biological pathway. We acquired 122 completed bacterial genome sequences from NCBI and utilised them to retrieve bacterial operons. For one bacterial genome, the gene set {Gene i | i = 1, …, m} is defined as one operon, if the internal length of non-coding sequences between gene i and gene i + 1, is ≤50 bps. The Arabidopsis genome sequence was acquired from The Arabidopsis Information Resource (TAIR) (http://www.arabidopsis.org/). Protein i and j in Arabidopsis were then queried against the operon database using FASTA with cut off value of 1e-10. Let X and Y be the hits of proteins i and j, respectively. If X and Y belong to the same operon and they are not the same protein, proteins i and j are inferred as a pair of putative interactions in Arabidopsis (Figure 2). The number of putative protein-protein interactions identified from operons is 1,22,344.
Cellular function prediction and biological pathway discovery 341
Figure 2 Prediction of protein interactions in Arabidopsis based on homologue hits in operon. Protein i, j in Arabidopsis are queried against operon database giving orthologue hits as X and Y, respectively. FASTA cut off of 1e-10 is used
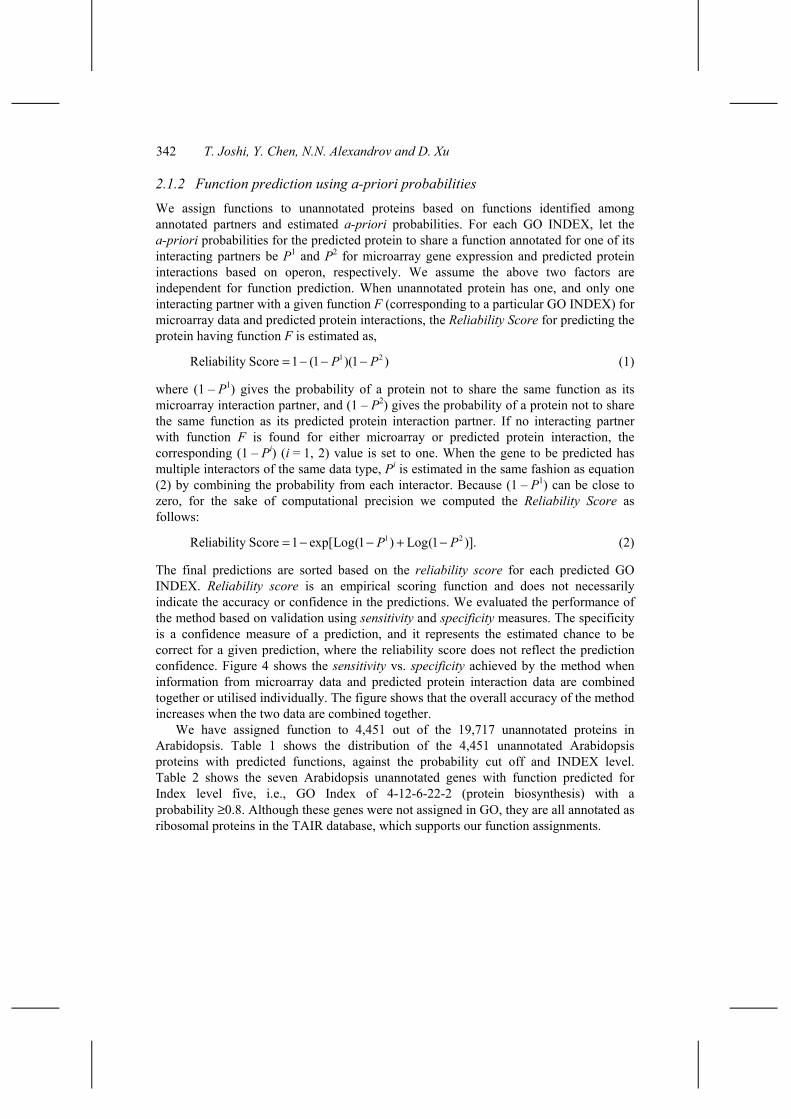
Figure 3 shows the probabilities of sharing different levels of GO indices in Arabidopsis given a particular range of Pearson correlation coefficient of gene expression data or with predicted protein interaction data. It indicates that the predicted protein interactions based on operon information of bacterial homologues are also very useful, as they contain high information content compared to random pairs.
Figure 3 Probabilities of sharing different levels of GO indices for microarray data, predicted protein interaction data, and random pairs in Arabidopsis
342 T. Joshi, Y. Chen, N.N. Alexandrov and D. Xu
2.1.2 Function prediction using a-priori probabilities
We assign functions to unannotated proteins based on functions identified among annotated partners and estimated a-priori probabilities. For each GO INDEX, let the a-priori probabilities for the predicted protein to share a function annotated for one of its interacting partners be P1 and P2 for microarray gene expression and predicted protein interactions based on operon, respectively. We assume the above two factors are independent for function prediction. When unannotated protein has one, and only one interacting partner with a given function F (corresponding to a particular GO INDEX) for microarray data and predicted protein interactions, the Reliability Score for predicting the protein having function F is estimated as,
1 2Reliability Score 1 (1 )(1 )P P= − − − (1)
where (1 – P1) gives the probability of a protein not to share the same function as its microarray interaction partner, and (1 – P2) gives the probability of a protein not to share the same function as its predicted protein interaction partner. If no interacting partner with function F is found for either microarray or predicted protein interaction, the corresponding (1 – Pi) (i = 1, 2) value is set to one. When the gene to be predicted has multiple interactors of the same data type, Pi is estimated in the same fashion as equation (2) by combining the probability from each interactor. Because (1 – P1) can be close to zero, for the sake of computational precision we computed the Reliability Score as follows:
1 2Reliability Score 1 exp[Log(1 ) Log(1 )].P P= − − + − (2)
The final predictions are sorted based on the reliability score for each predicted GO INDEX. Reliability score is an empirical scoring function and does not necessarily indicate the accuracy or confidence in the predictions. We evaluated the performance of the method based on validation using sensitivity and specificity measures. The specificity is a confidence measure of a prediction, and it represents the estimated chance to be correct for a given prediction, where the reliability score does not reflect the prediction confidence. Figure 4 shows the sensitivity vs. specificity achieved by the method when information from microarray data and predicted protein interaction data are combined together or utilised individually. The figure shows that the overall accuracy of the method increases when the two data are combined together.
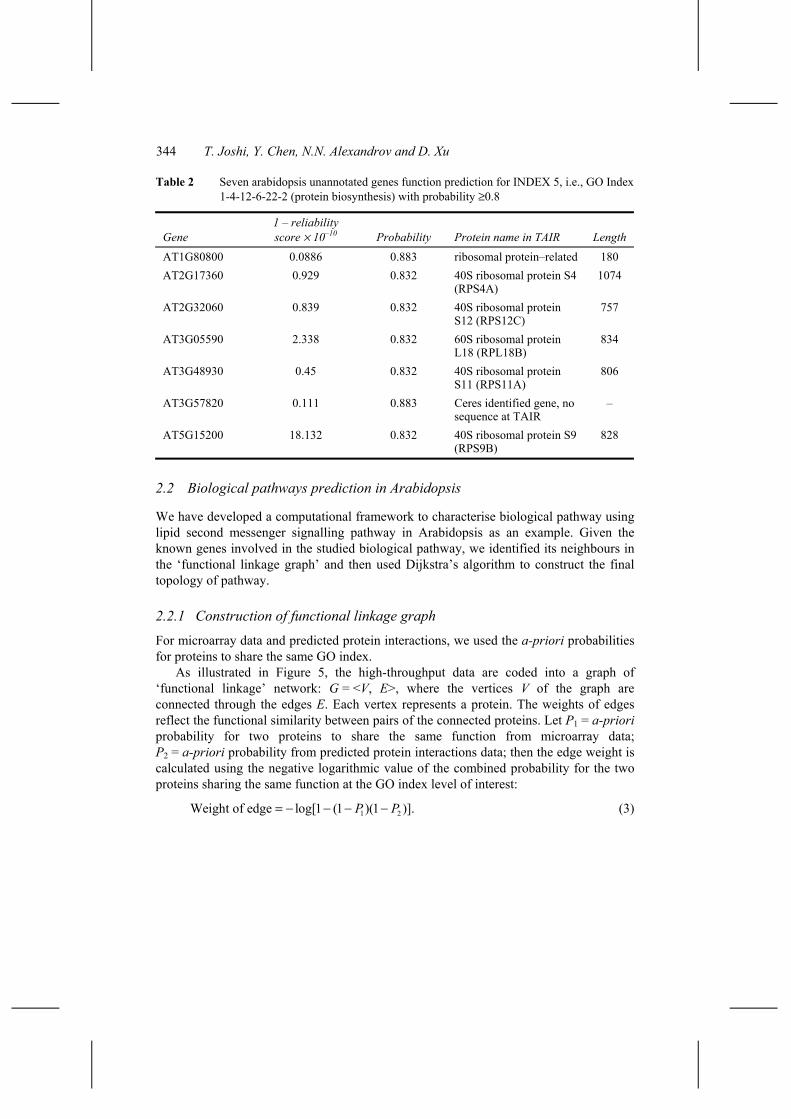
We have assigned function to 4,451 out of the 19,717 unannotated proteins in Arabidopsis. Table 1 shows the distribution of the 4,451 unannotated Arabidopsis proteins with predicted functions, against the probability cut off and INDEX level. Table 2 shows the seven Arabidopsis unannotated genes with function predicted for Index level five, i.e., GO Index of 4-12-6-22-2 (protein biosynthesis) with a probability ≥0.8. Although these genes were not assigned in GO, they are all annotated as ribosomal proteins in the TAIR database, which supports our function assignments.

Cellular function prediction and biological pathway discovery 343
Figure 4 Sensitivity vs. specificity of the method
Table 1 Distribution of 4,451 unannotated Arabidopsis proteins with predicted function, against probability cut off and INDEX level
Probability index ≥0.9 ≥0.8 ≥0.7 ≥0.6 ≥0.5 ≥0.4 ≥0.3 ≥0.2 ≥0.1
1 335 538 739 1,122 1,944 1,944 4,451 4,451 4,451 2 128 259 391 587 1,180 1,180 3,300 4,450 4,450 3 20 39 58 137 384 384 1,597 3,378 4,255 4 1 10 17 26 76 76 492 1,266 3,801 5 0 7 15 24 63 63 397 998 3,649 6 0 0 0 0 0 0 62 382 1,354 7 0 0 0 0 0 0 0 0 33 8 0 0 0 0 0 0 0 0 7 9 0 0 0 0 0 0 0 0 1 10 0 0 0 0 0 0 0 0 0 11 0 0 0 0 0 0 0 0 0 12 0 0 0 0 0 0 0 0 0 13 0 0 0 0 0 0 0 0 0
344 T. Joshi, Y. Chen, N.N. Alexandrov and D. Xu
Table 2 Seven arabidopsis unannotated genes function prediction for INDEX 5, i.e., GO Index 1-4-12-6-22-2 (protein biosynthesis) with probability ≥0.8
Gene 1 – reliability score × 10–10 Probability Protein name in TAIR Length
AT1G80800 0.0886 0.883 ribosomal protein–related 180 AT2G17360 0.929 0.832 40S ribosomal protein S4
(RPS4A) 1074
AT2G32060 0.839 0.832 40S ribosomal protein S12 (RPS12C)
757
AT3G05590 2.338 0.832 60S ribosomal protein L18 (RPL18B)
834
AT3G48930 0.45 0.832 40S ribosomal protein S11 (RPS11A)
806
AT3G57820 0.111 0.883 Ceres identified gene, no sequence at TAIR
–
AT5G15200 18.132 0.832 40S ribosomal protein S9 (RPS9B)
828
2.2 Biological pathways prediction in Arabidopsis
We have developed a computational framework to characterise biological pathway using lipid second messenger signalling pathway in Arabidopsis as an example. Given the known genes involved in the studied biological pathway, we identified its neighbours in the ‘functional linkage graph’ and then used Dijkstra’s algorithm to construct the final topology of pathway.
2.2.1 Construction of functional linkage graph
For microarray data and predicted protein interactions, we used the a-priori probabilities for proteins to share the same GO index.
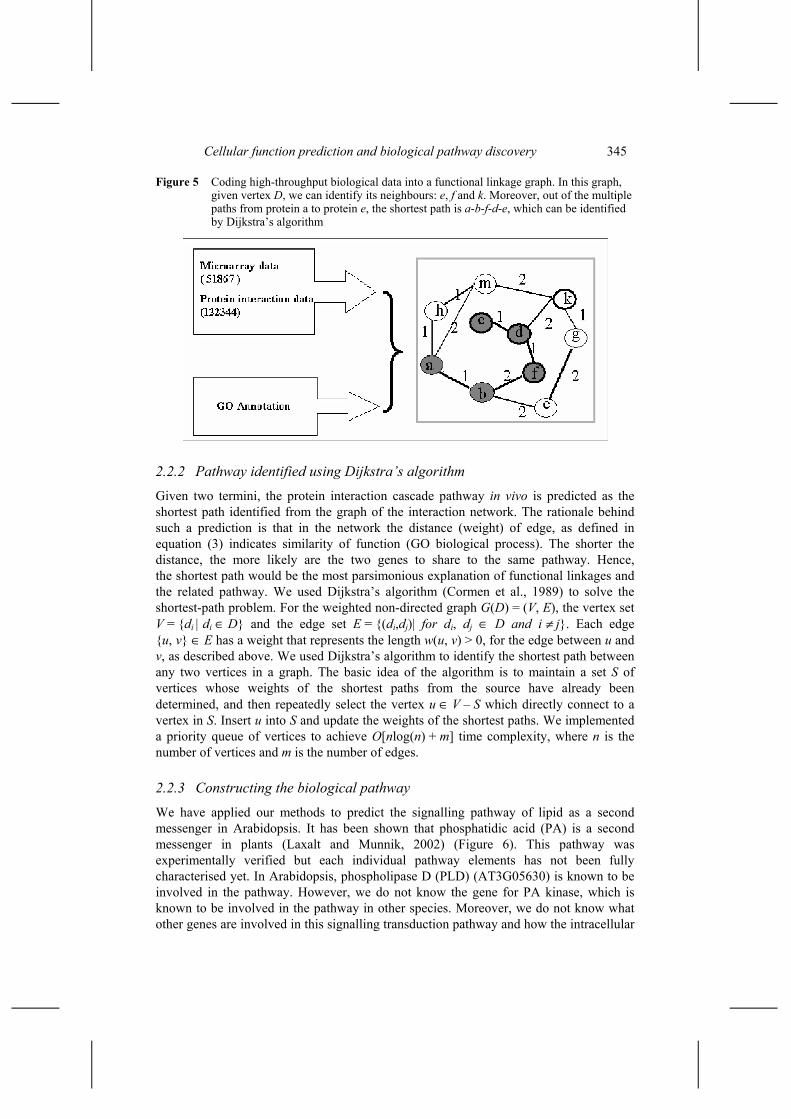
As illustrated in Figure 5, the high-throughput data are coded into a graph of ‘functional linkage’ network: G = <V, E>, where the vertices V of the graph are connected through the edges E. Each vertex represents a protein. The weights of edges reflect the functional similarity between pairs of the connected proteins. Let P1 = a-priori probability for two proteins to share the same function from microarray data; P2 = a-priori probability from predicted protein interactions data; then the edge weight is calculated using the negative logarithmic value of the combined probability for the two proteins sharing the same function at the GO index level of interest:
1 2Weight of edge log[1 (1 )(1 )].P P= − − − − (3)
Cellular function prediction and biological pathway discovery 345
Figure 5 Coding high-throughput biological data into a functional linkage graph. In this graph, given vertex D, we can identify its neighbours: e, f and k. Moreover, out of the multiple paths from protein a to protein e, the shortest path is a-b-f-d-e, which can be identified by Dijkstra’s algorithm
2.2.2 Pathway identified using Dijkstra’s algorithm
Given two termini, the protein interaction cascade pathway in vivo is predicted as the shortest path identified from the graph of the interaction network. The rationale behind such a prediction is that in the network the distance (weight) of edge, as defined in equation (3) indicates similarity of function (GO biological process). The shorter the distance, the more likely are the two genes to share to the same pathway. Hence, the shortest path would be the most parsimonious explanation of functional linkages and the related pathway. We used Dijkstra’s algorithm (Cormen et al., 1989) to solve the shortest-path problem. For the weighted non-directed graph G(D) = (V, E), the vertex set V = {di
| di ∈ D} and the edge set E = {(di,dj)| for di, dj ∈ D and i ≠ j}. Each edge {u, v} ∈ E has a weight that represents the length w(u, v) > 0, for the edge between u and v, as described above. We used Dijkstra’s algorithm to identify the shortest path between any two vertices in a graph. The basic idea of the algorithm is to maintain a set S of vertices whose weights of the shortest paths from the source have already been determined, and then repeatedly select the vertex u ∈ V – S which directly connect to a vertex in S. Insert u into S and update the weights of the shortest paths. We implemented a priority queue of vertices to achieve O[nlog(n) + m] time complexity, where n is the number of vertices and m is the number of edges.
2.2.3 Constructing the biological pathway
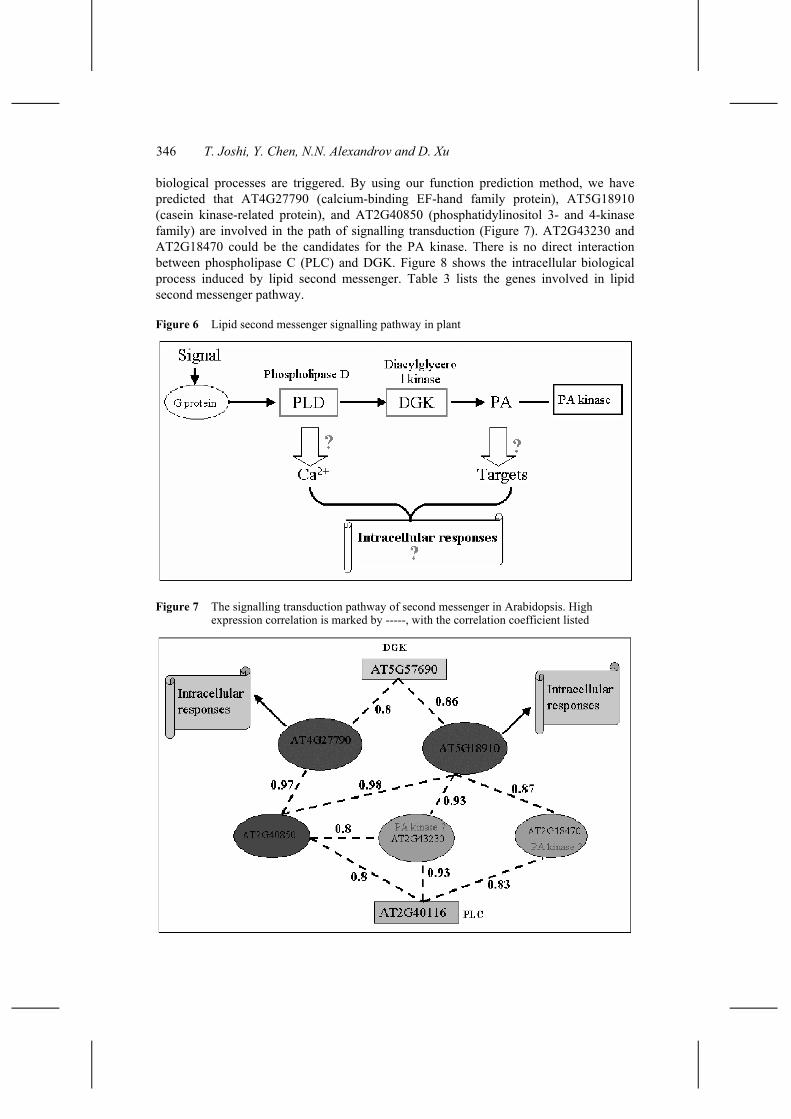
We have applied our methods to predict the signalling pathway of lipid as a second messenger in Arabidopsis. It has been shown that phosphatidic acid (PA) is a second messenger in plants (Laxalt and Munnik, 2002) (Figure 6). This pathway was experimentally verified but each individual pathway elements has not been fully characterised yet. In Arabidopsis, phospholipase D (PLD) (AT3G05630) is known to be involved in the pathway. However, we do not know the gene for PA kinase, which is known to be involved in the pathway in other species. Moreover, we do not know what other genes are involved in this signalling transduction pathway and how the intracellular
346 T. Joshi, Y. Chen, N.N. Alexandrov and D. Xu
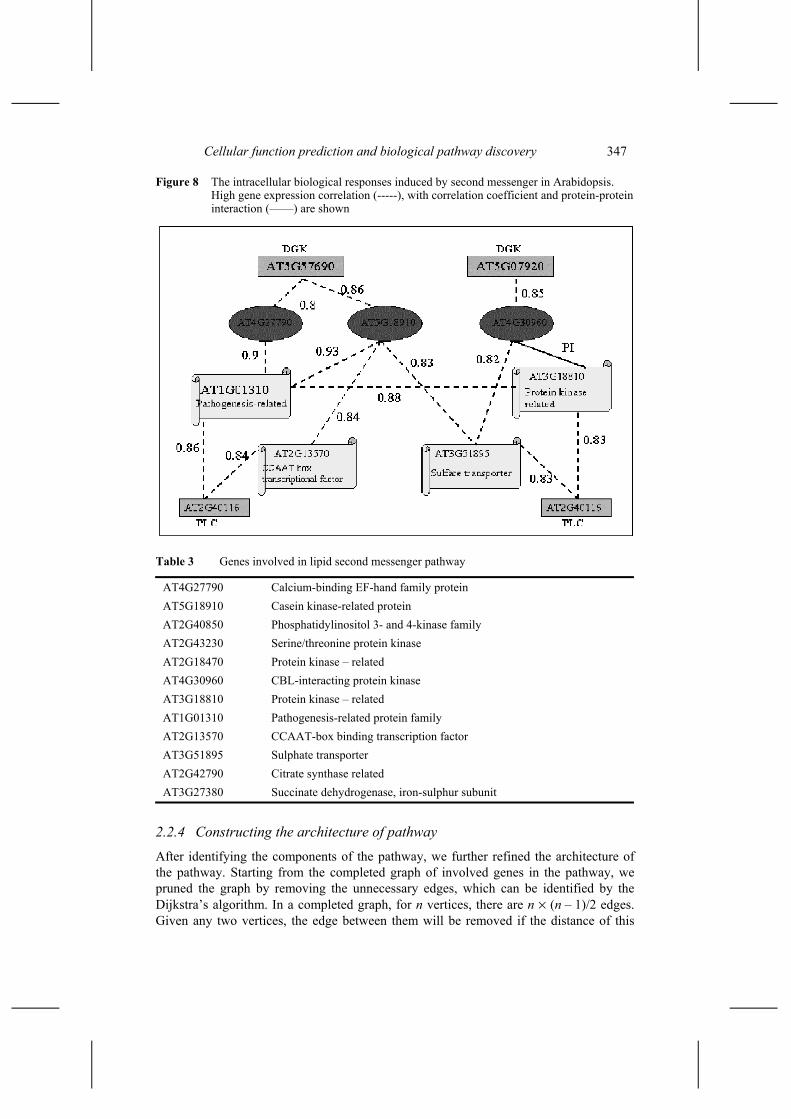
biological processes are triggered. By using our function prediction method, we have predicted that AT4G27790 (calcium-binding EF-hand family protein), AT5G18910 (casein kinase-related protein), and AT2G40850 (phosphatidylinositol 3- and 4-kinase family) are involved in the path of signalling transduction (Figure 7). AT2G43230 and AT2G18470 could be the candidates for the PA kinase. There is no direct interaction between phospholipase C (PLC) and DGK. Figure 8 shows the intracellular biological process induced by lipid second messenger. Table 3 lists the genes involved in lipid second messenger pathway.
Figure 6 Lipid second messenger signalling pathway in plant
Figure 7 The signalling transduction pathway of second messenger in Arabidopsis. High expression correlation is marked by -----, with the correlation coefficient listed
Cellular function prediction and biological pathway discovery 347
Figure 8 The intracellular biological responses induced by second messenger in Arabidopsis. High gene expression correlation (-----), with correlation coefficient and protein-protein interaction (––––) are shown
Table 3 Genes involved in lipid second messenger pathway
AT4G27790 Calcium-binding EF-hand family protein AT5G18910 Casein kinase-related protein AT2G40850 Phosphatidylinositol 3- and 4-kinase family AT2G43230 Serine/threonine protein kinase AT2G18470 Protein kinase – related AT4G30960 CBL-interacting protein kinase AT3G18810 Protein kinase – related AT1G01310 Pathogenesis-related protein family AT2G13570 CCAAT-box binding transcription factor AT3G51895 Sulphate transporter AT2G42790 Citrate synthase related AT3G27380 Succinate dehydrogenase, iron-sulphur subunit
2.2.4 Constructing the architecture of pathway
After identifying the components of the pathway, we further refined the architecture of the pathway. Starting from the completed graph of involved genes in the pathway, we pruned the graph by removing the unnecessary edges, which can be identified by the Dijkstra’s algorithm. In a completed graph, for n vertices, there are n × (n – 1)/2 edges. Given any two vertices, the edge between them will be removed if the distance of this
348 T. Joshi, Y. Chen, N.N. Alexandrov and D. Xu
edge is larger than the distance of the shortest path between those two vertices identified by Dijkstra’s algorithm. This architecture refining process is achieved by the algorithm OPTIMIZATION (G).
OPTIMIZATION (G)
for each edge {u, v} ∈ E
L{u, v} ← DIJKSTRA(G, W, S)
If L{u, v} < W{u, v}
W{u, v} ← NULL
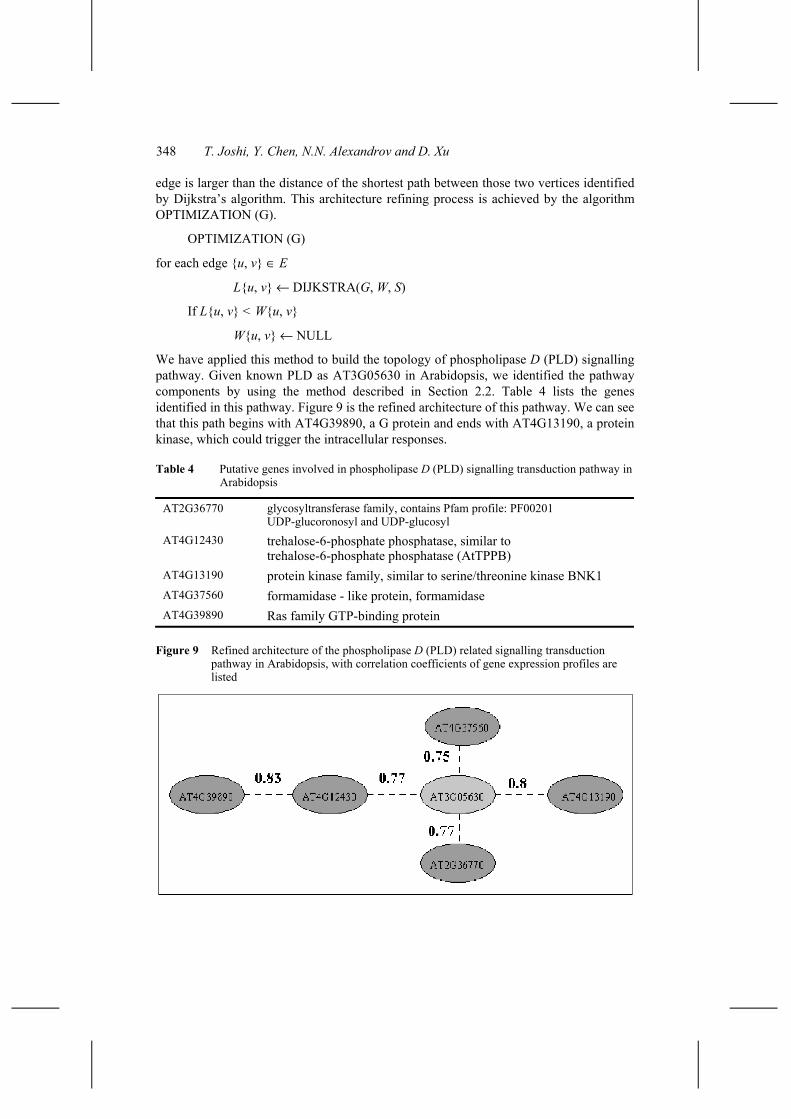
We have applied this method to build the topology of phospholipase D (PLD) signalling pathway. Given known PLD as AT3G05630 in Arabidopsis, we identified the pathway components by using the method described in Section 2.2. Table 4 lists the genes identified in this pathway. Figure 9 is the refined architecture of this pathway. We can see that this path begins with AT4G39890, a G protein and ends with AT4G13190, a protein kinase, which could trigger the intracellular responses.
Table 4 Putative genes involved in phospholipase D (PLD) signalling transduction pathway in Arabidopsis
AT2G36770 glycosyltransferase family, contains Pfam profile: PF00201 UDP-glucoronosyl and UDP-glucosyl
AT4G12430 trehalose-6-phosphate phosphatase, similar to trehalose-6-phosphate phosphatase (AtTPPB)
AT4G13190 protein kinase family, similar to serine/threonine kinase BNK1 AT4G37560 formamidase - like protein, formamidase AT4G39890 Ras family GTP-binding protein
Figure 9 Refined architecture of the phospholipase D (PLD) related signalling transduction pathway in Arabidopsis, with correlation coefficients of gene expression profiles are listed
Cellular function prediction and biological pathway discovery 349
3 Discussion
Systematic and automatic methods for predicting gene function using high-throughput data represent a major challenge in the post genomic era. To address this challenge, we developed a systematic method to assign function in an automated fashion using integrated computational analysis of high-throughput data together with the GO biological process functional annotation. In particular, this paper gives the first systematic study on the quantitative relationship between the correlation of microarray gene expression profiles and the functional similarity. Such relationship provides a unique approach for function prediction. Our approach differs from sequence comparison based methods to identify the relationship between an unannotated protein and any protein with known function, as our method was developed on the foundation of patterns and dependencies retrieved from the experimental data (microarray data), thus giving higher confidence for the prediction. Of course, considering the noisy nature of the high-throughput data, some predictions may not be correct and it is important to check the confidence levels for predictions. Nevertheless, our predictions can provide biologists with hypotheses to study and design specific experiments to validate the predicted functions using tools such as mutagenesis. Such combination of computational methods and experiments may discover biological functions for unannotated proteins much more efficiently than traditional methods. Our method can be applied to other species as well.
Acknowledgement
This work has been supported by a research contract with Ceres Inc., Malibu, CA.
References Altschul, S., Madden, T., Schaffer, A., Zhang, J., Zhang, Z., Miller, W. and Lipman, D. (1997)
‘Gapped BLAST and PSI-BLAST: a new generation of protein database search programs’, Nucleic Acids Res., Vol. 25, pp.3389–3402.
Brown, M., Grundy, W., Lin, D., Cristianini, N., Sugnet, C., Furey, T., Ares, M. and Haussler, D. (2000) ‘Knowledge-based analysis of microarray gene expression data by using support vector machines’, Proc. Natl. Acad. Sci. USA, Vol. 97, pp.262–267.
Chen, Y. and Xu, D. (2003) ‘Computation analysis of high-throughput protein-protein interaction data’, Current Peptide and Protein Science, Vol. 4, pp.159–181.
Chien, C., Bartel, P., Sternglanz, R. and Fields, S. (1991) ‘The two-hybrid system: a method to identify and clone genes for proteins that interact with a protein of interest’, Proc. Natl. Acad. Sci. USA, Vol. 88, pp.9578–9582.
Clare, A. and King, R.D. (2003) ‘Predicting gene function in Saccharomyces cerevisiae’, ECCB 2003, also published as a journal supplement in Bioinformatics, Vol. 19, pp.ii42–ii49.
Cormen, T.H., Leiserson, C.E. and Rivest, R.L. (1989) Introduction to Algorithms, The MIT Press, Cambridge.
Deng, M., Chen, T. and Sun, F. (2003) ‘Integrated probabilistic model for functional prediction of proteins’, RECOMB2003, also published in Journal of Computational Biology, Vol. 11, pp.463–476.
Deng, M., Zhang, K., Mehta, S., Chen, T. and Sun, F. (2002) ‘Prediction of protein function using protein-protein interaction data’, Proceedings of the IEEE Computer Society Bioinformatics Conference (CSB2002), IEEE Computer Society, Los Alamitos, California, pp.197–206.
350 T. Joshi, Y. Chen, N.N. Alexandrov and D. Xu
Eisen, M., Spellman, P., Brown, P. and Bostein, D. (1998) ‘Cluster analysis and display of genome-wide expression patterns’, Proc. Natl. Acad. Sci. USA, Vol. 95, pp.14863–14868.
Gavin, A., Bosche, M., Krause, R., Grandi, P., Marzioch, M., Bauer, A., Schultz, J., Rick, J., Michon, A. and Cruciat, C. (2002) ‘Functional organization of yeast proteome by systematic analysis of protein complexes’, Nature, Vol. 415, pp.141–147.
Goehring, A., Mitchell, D., Tong, A., Keniry, M., Boone, C. and Sprague, G. (2003) ‘Synthetic lethal analysis implicates Ste20p, a p21-activated potein kinase, in polarisome activation’, Mol. Bio. Cell., Vol. 4, pp.1501–1516.
Hishigaki, H., Nakai, K., Ono, T., Tanigami, A. and Takagi, T. (2001) ‘Assessment of prediction accuracy of protein function from protein-protein interaction data’, Yeast, Vol. 18, pp.523–531.
Ho, Y., Gruhler, A., Heilbut, A., Bader, G.D., Moore, L., Adams, S., Millar, A., Taylor, P., Bennett, K., Boutilier, K. et al. (2002) ‘Systematic identification of protein complexes in saccharomyces cerevisiae by mass spectrometry’, Nature, Vol. 415, pp.180–183.
Laxalt, A. and Munnik, T. (2002) ‘Phospholipid signalling in plant defense’, Curr. Opin. Plant Biol., Vol. 5, No. 4, pp.332–338.
Letovsky, S. and Kasif, S. (2003) ‘A probabilistic approach to gene function assignment and propagation in protein interaction networks’, Bioinformatics, Vol. 19, Suppl., pp.i197–i204.
Marcotte, E., Pellegrini, M., Thompson, M., Yeates, T. and Eisenberg, D. (1999) ‘A combined algorithm for genome-wide prediction of protein function’, Nature, Vol. 402, pp.83–86.
Pavlidis, P. and Weston, J. (2001) ‘Gene functional classification from heterogeneous data’, Proceedings of the Fifth International Conference on Computational Molecular Biology (RECOMB2001), pp.249–255.
Pearson, W. and Lipman, D. (1998) ‘Improved tools for biological sequence comparison’, Proc. Natl. Acad. Sci. USA, Vol. 85, pp.2444–2448.
Pellegrini, M., Marcotte, E., Thompson, M., Eisenberg, D. and Yeates, T. (1999) ‘Assigning protein functions by comparative genome analysis: protein phylogenetic profiles’, Proc. Natl. Acad. Sci. USA, Vol. 96, pp.4285–4288.
Schwikowski, B., Uetz, P. and Fields, S. (2000) ‘A network of protein-protein interactions in yeast’, Nature Biotechnology, Vol. 18, pp.1257–1261.
The Gene Ontology Consortium (2000) Nature Genetics, Vol. 25, pp.25–29. Tong, A., Evangelista, M., Parsons, A., Xu, H., Bader, G., Page, N., Robinson, M.,
Raghibizadeh, S., Hogue, C., Bussey, H., Andrews, B., Tyers, M. and Boone, C. (2001) ‘Systematic genetic analysis with ordered arrays of yeast deletion mutants’, Science, Vol. 294, pp.2364–2368.
Troyanskaya, O., Dolinski, K., Owen, A., Altman, R. and Botstein, D. (2003) ‘A bayesian framework for combining heterogeneous data sources for gene function prediction (in Saccharomyces cerevisiae)’, Proc. Natl. Acad. Sci., Vol. 100, pp.8348–8353.
Zheng, Y., Szustakowski, J., Fortnow, L., Roberts, R. and Kasif, S. (2002) ‘Computational identification of operons in microbial genomes’, Genome Research, Vol. 12, No. 8, pp.1221–1230.