Embed Size (px)
Citation preview
Cellular Dosimetry of 111In Using MonteCarlo N-Particle Computer Code:Comparison with Analytic Methods andCorrelation with In Vitro Cytotoxicity
Zhongli Cai1, Jean-Philippe Pignol2, Conrad Chan1, and Raymond M. Reilly1,3,4
1Department of Pharmaceutical Sciences, University of Toronto, Toronto, Ontario, Canada; 2Department of Radiation Oncology,Sunnybrook Health Sciences Centre, Toronto, Ontario, Canada; 3Toronto General Hospital Research Institute, University HealthNetwork, Toronto, Ontario, Canada; and 4Department of Medical Imaging, University of Toronto, Toronto, Ontario, Canada
Our objective was to compare Monte Carlo N-particle (MCNP)self- and cross-doses from 111In to the nucleus of breast cancercells with doses calculated by reported analytic methods (Godduet al. and Farragi et al.). A further objective was to determinewhether the MCNP-predicted surviving fraction (SF) of breastcancer cells exposed in vitro to 111In-labeled diethylenetriamine-pentaacetic acid human epidermal growth factor (111In-DTPA-hEGF) could accurately predict the experimentally determinedvalues. Methods: MCNP was used to simulate the transportof electrons emitted by 111In from the cell surface, cytoplasm,or nucleus. The doses to the nucleus per decay (S values) werecalculated for single cells, closely packed monolayer cells, orcell clusters. The cell and nucleus dimensions of 6 breast cancercell lines were measured, and cell line–specific S values werecalculated. Results: For self-doses, MCNP S values of nucleusto nucleus agreed very well with those of Goddu et al. (ratio ofS values using analytic methods vs. MCNP 5 0.962–0.995) andFaraggi et al. (ratio 5 1.011–1.024). MCNP S values of cyto-plasm and cell surface to nucleus compared fairly well with thereported values (ratio 5 0.662–1.534 for Goddu et al.; 0.944–1.129 for Faraggi et al.). For cross doses, the S values to thenucleus were independent of 111In subcellular distribution butincreased with cluster size. S values for monolayer cells weresignificantly different from those of single cells and cell clusters.The MCNP-predicted SF for monolayer MDA-MB-468, MDA-MB-231, and MCF-7 cells agreed with the experimental data(relative error of 3.1%, 21.0%, and 1.7%). The single-cell andcell cluster models were less accurate in predicting the SF. ForMDA-MB-468 cells, relative error was 8.1% using the single-cell model and 254% to 267% using the cell cluster model. In-dividual cell-line dimensions had large effects on S values andwere needed to estimate doses and SF accurately. Conclusion:MCNP simulation compared well with the reported analyticmethods in the calculation of subcellular S values for single cellsand cell clusters. Application of a monolayer model was most ac-curate in predicting the SF of breast cancer cells exposed in vitroto 111In-DTPA-hEGF.
Key Words: Monte Carlo dosimetry; S-values; Auger electrons;breast cancer cells; 111In-DTPA-hEGF; 111In
J Nucl Med 2010; 51:462–470DOI: 10.2967/jnumed.109.063156
Targeted Auger electron radiotherapy of malignancies isa promising novel therapeutic strategy that aims to depositlethal DNA-damaging radiation selectively into the nucleiof tumor cells while sparing normal cells. For example,111In-labeled diethylenetriaminepentaacetic acid humanepidermal growth factor (111In-DTPA-hEGF) is a targetedAuger electron–emitting radiotherapeutic agent discoveredin our laboratory that is selectively bound, internalized,and translocated to the nucleus of epidermal growth factorreceptor–overexpressing breast cancer cells, where it causesDNA double-strand breaks and cell death (1–3). 111In-DTPA-hEGF exhibited potent antiproliferative effects invitro on epidermal growth factor receptor–overexpressingMDA-MB-468 human breast cancer cells as well as strongantitumor effects in vivo in athymic mice implanted sub-cutaneously with MDA-MB-468 tumor xenografts (4,5).No major normal-tissue toxicities were observed in mice orrabbits administered high doses of 111In-DTPA-hEGF (6),and the agent is completing phase I clinical trial evaluationin patients with chemotherapy-refractory epidermal growthfactor receptor–positive metastatic disease (7).
Because of the nanometer-to-micrometer ranges ofAuger electrons and the nonuniform subcellular distributionof radiopharmaceuticals such as 111In-DTPA-hEGF thatpartition between the cell surface, cytoplasm, and cellnucleus, estimates of the radiation absorbed dose to thenucleus would inform on their potential therapeutic benefit.The gold standard to calculate the dose to the nucleus fromAuger electron–emitting radionuclides in subcellular com-partments such as the cell surface, cytoplasm, or nucleus is
Received Feb. 9, 2009; revision accepted Aug. 17, 2009.For correspondence or reprints contact: Raymond M. Reilly, Leslie Dan
Faculty of Pharmacy, University of Toronto, 144 College St., Toronto, ON,M5S 3M2 Canada.
E-mail: [email protected] ª 2010 by the Society of Nuclear Medicine, Inc.
462 THE JOURNAL OF NUCLEAR MEDICINE • Vol. 51 • No. 3 • March 2010
by on April 11, 2019. For personal use only. jnm.snmjournals.org Downloaded from
the self-dose S value (in Gy�Bq21�s21), that is, the dose tothese compartments per unit cumulated radioactivity in thesame cell, reported by Goddu et al. (8,9). They applied theanalytic method to calculate the self-dose S value for aspherically symmetric single cell. The diameters of the celland nucleus used in the calculation ranged from 2 to 20 mm.Cole’s experimental electron range and energy relationshipin unit density matter were applied in the calculation (10),and the self-dose S values for a range of Auger electron-emitters were tabulated (8,9). Similarly, Faraggi et al. alsocalculated self-dose S values for 5 radionuclides using theanalytic method. But they used the scaled electron dose pointkernels and the continuous slowing-down approximationrange in their calculation (11).
The self-dose S value is adequate to assess the dose to thenucleus for isolated cells. However, for clusters of cells, thecross-dose from surrounding cells becomes more importantas the size of the cluster increases. Goddu et al. calculatedcross-dose S values for only one cell dimension (cell andnucleus diameters of 10 and 8 mm, respectively) usingclosely packed cubic geometry. They assessed the effect ofcluster diameters (from 26 to 400 mm) on cross-dose S values(12). Faraggi et al. reported cross-dose S values for concen-tric spheric cells of various dimensions (cell diameters from 6to 24 mm and nucleus diameters from 4 to 22 mm) inunbounded close-packed hexagonal geometry (11).
Both Goddu et al. and Faraggi et al. used analyticmethods and idealized concentric spheres of cell andnucleus to calculate self- and cross-dose S values. It isdifficult to extend their methods to cells of different con-figurations (e.g., the cell and nucleus are not concentric)or geometry (e.g., a monolayer of cells in a culture dish).In this report, we propose a more versatile evaluation ofthe dose deposited in the nucleus based on Monte Carlosimulation. This stochastic calculation method allows thetransport of radiation through a realistic 3-dimensionalgeometry. We used the Monte Carlo N-particle (MCNP)computer code (13), which is capable of following thephoton and electron transport down to an energy of 1 keVin generalized geometries. This energy corresponds to anelectron range of about 50 nm in a tissue-equivalent
medium. We hypothesized that MCNP would be able toassess both self- and cross-doses to the cell nucleus withaccuracy comparable to the reported analytic methods butwould be more flexible to model different cell geometriesand experimental settings. In this study, we calculated Svalues to the nucleus from cell surface, cytoplasm, andnucleus compartments for a single cell, closely packedmonolayer cells, or a cluster of cells of various dimensions.Our results were compared with those reported by Godduet al. (8,9,12) and Faraggi et al. (11), and the dose-predictedsurviving fraction (SF) was compared with the experimen-tal data reported previously by us for treatment of MDA-MB-468, MDA-MB-231, and MCF-7 human breast cancercells with 111In-DTPA-hEGF (2).
MATERIALS AND METHODS
Monte Carlo SimulationMCNP code (version 5; Los Alamos National Laboratory) (13)
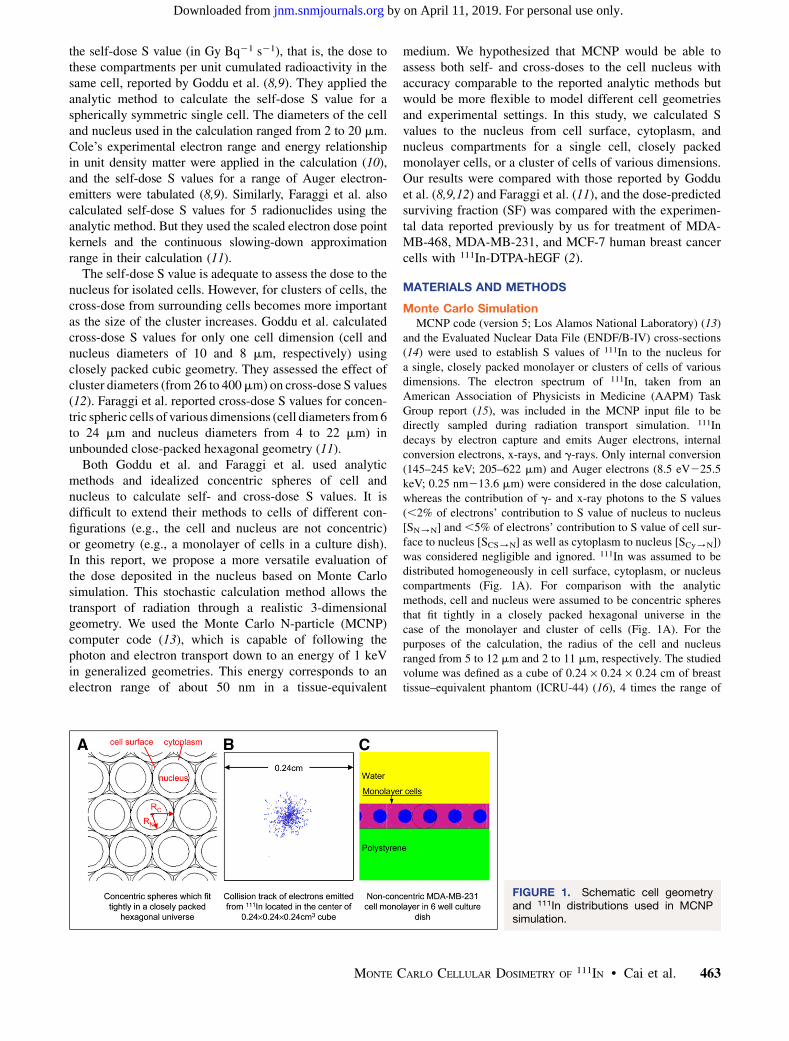
and the Evaluated Nuclear Data File (ENDF/B-IV) cross-sections(14) were used to establish S values of 111In to the nucleus fora single, closely packed monolayer or clusters of cells of variousdimensions. The electron spectrum of 111In, taken from anAmerican Association of Physicists in Medicine (AAPM) TaskGroup report (15), was included in the MCNP input file to bedirectly sampled during radiation transport simulation. 111Indecays by electron capture and emits Auger electrons, internalconversion electrons, x-rays, and g-rays. Only internal conversion(145–245 keV; 205–622 mm) and Auger electrons (8.5 eV225.5keV; 0.25 nm213.6 mm) were considered in the dose calculation,whereas the contribution of g- and x-ray photons to the S values(,2% of electrons’ contribution to S value of nucleus to nucleus[SN/N] and ,5% of electrons’ contribution to S value of cell sur-face to nucleus [SCS/N] as well as cytoplasm to nucleus [SCy/N])was considered negligible and ignored. 111In was assumed to bedistributed homogeneously in cell surface, cytoplasm, or nucleuscompartments (Fig. 1A). For comparison with the analyticmethods, cell and nucleus were assumed to be concentric spheresthat fit tightly in a closely packed hexagonal universe in thecase of the monolayer and cluster of cells (Fig. 1A). For thepurposes of the calculation, the radius of the cell and nucleusranged from 5 to 12 mm and 2 to 11 mm, respectively. The studiedvolume was defined as a cube of 0.24 · 0.24 · 0.24 cm of breasttissue–equivalent phantom (ICRU-44) (16), 4 times the range of
FIGURE 1. Schematic cell geometryand 111In distributions used in MCNPsimulation.
MONTE CARLO CELLULAR DOSIMETRY OF 111IN • Cai et al. 463
by on April 11, 2019. For personal use only. jnm.snmjournals.org Downloaded from
most energetic internal conversion electrons (Fig. 1B). The effectof studied volumes (up to 20 · 20 · 20 cm) on the S values wasexamined for cells with cell and nucleus diameters of 16 and10 mm, respectively, and was found to be less than 0.1%. Only forimitating exposure of cells seeded into wells of a 6-well tissueculture plate containing 1 mL of culture medium, the studied volumewas defined as a cylinder with a diameter of 1.745 cm and a thick-ness of 0.105 cm of water and 0.1 cm of polystyrene on which amonolayer of breast cancer cells is attached (Fig. 1C). To comparecross-dose S values with those of Goddu et al. (12), we used closelypacked cubic universal geometry and corresponding cell cluster sizeas the study volume. Cell nuclei were tallied. The energy depositionfunction (*F8) was used to record the doses in units of megaelectronvolts per starting particle per tally volume, which were thenconverted into grays per decay (13). For each calculation, 104
electrons were launched to reach an SD of less than 1%. All theenergy of emitted electrons lower than 1 keV was deposited locallywithin the cell compartment where 111In was located.
Live Cell ImagingMDA-MB-468, MDA-MB-361, MDA-MB-231, MCF-7, BT-474,
and SKBr-3 human breast cancer cells were purchased from theAmerican Type Culture Collection and cultured in the recommendedmedium supplemented with 10%220% fetal bovine serum (GIBCOInvitrogen). We seeded 1 · 105 cells into wells in Lab-Tek II Chamberslides (Thermo Fisher Scientific, Inc.), cultured the cells overnight,and then stained them using Image-iT LIVE Plasma Membrane andNuclear Labeling Kit (Molecular Probes, Inc.), following the man-ufacturer’s protocol. Hoechst 33342 dye (Molecular Probes, Inc.) andwheat germ agglutinin-Alexa Fluor 594 (Molecular Probes, Inc.)conjugate selectively stain cell nuclei and plasma membrane, re-spectively. Live cell images were acquired with an LSM 510 ConfocalMicroscope (Carl Zeiss MicroImaging, Inc.). Optical sections (1.2mm) through the cells were imaged. At least 30 cells were imaged foreach cell line. ImageJ software (U.S. National Institutes of Health)was used to measure the diameter of the cell and nucleus.
Comparison of Radiation Absorbed Dose withClonogenic Survival
Cell survival curves, that is, SF versus radiation absorbed dose,were assumed to follow the linear-quadratic model and aredescribed by Equation 1 (17,18):
SF 5 e2(aD 1 bD2); Eq. 1
where a and b are constants and D is radiation absorbed dose. a
and b were 0.4748 and 0.0109 for MDA-MB-468, 0.1086 and0 for MDA-MB-231, and 0.2119 and 0 for MCF-7 (2).
D in Equation 1 was assumed to be the absorbed dose to the cellnucleus. For 111In-DTPA-hEGF–treated breast cancer cells, cellkilling results from 3 independent events (2,4): radiation from 111Inspecifically localized to the cell surface, in cytoplasm and nucleus,leading to SF1; radiation from nonspecifically bound 111In at the cellsurface and 111In in the surrounding growth medium, leading to SF2;and the cytotoxic effects of unlabeled DTPA-EGF, leading to SF3.Thus, the overall SF can be calculated using Equation 2:
SF 5 SF1 · SF2 · SF3: Eq. 2
The percentage relative error (RE) of the MCNP estimated tothe experimentally measured SF was calculated by subtracting the
calculated from the experimental SF and then dividing by theexperimental SF multiplied by 100%.
RESULTS
S Values for 111In Uniformly Distributed inCell Compartments
Single-Cell Model. To verify the feasibility of usingMCNP to calculate subcellular S values, self-dose to thenucleus for 111In uniformly distributed in either nucleus,cytoplasm, or cell surface compartments of a single cell ofvarious dimensions was assessed (Table 1) and comparedwith the published values by Goddu et al. (8,9) and Farragiet al. (11) (Supplemental Table 1; supplemental materialsare available online only at http://jnm.snmjournals.org).SN/N of Goddu et al. were slightly smaller than thosefor MCNP (ratio of S values using analytic methods vs.MCNP 5 0.962–0.995 (8) and 0.971–0.992 (9)), whereasthose from Farragi et al. (11) were slightly larger (ratio =1.011–1.024). Most of the MCNP-calculated SCy/N andSCS/N fell within those reported by Goddu et al. (ratio 5
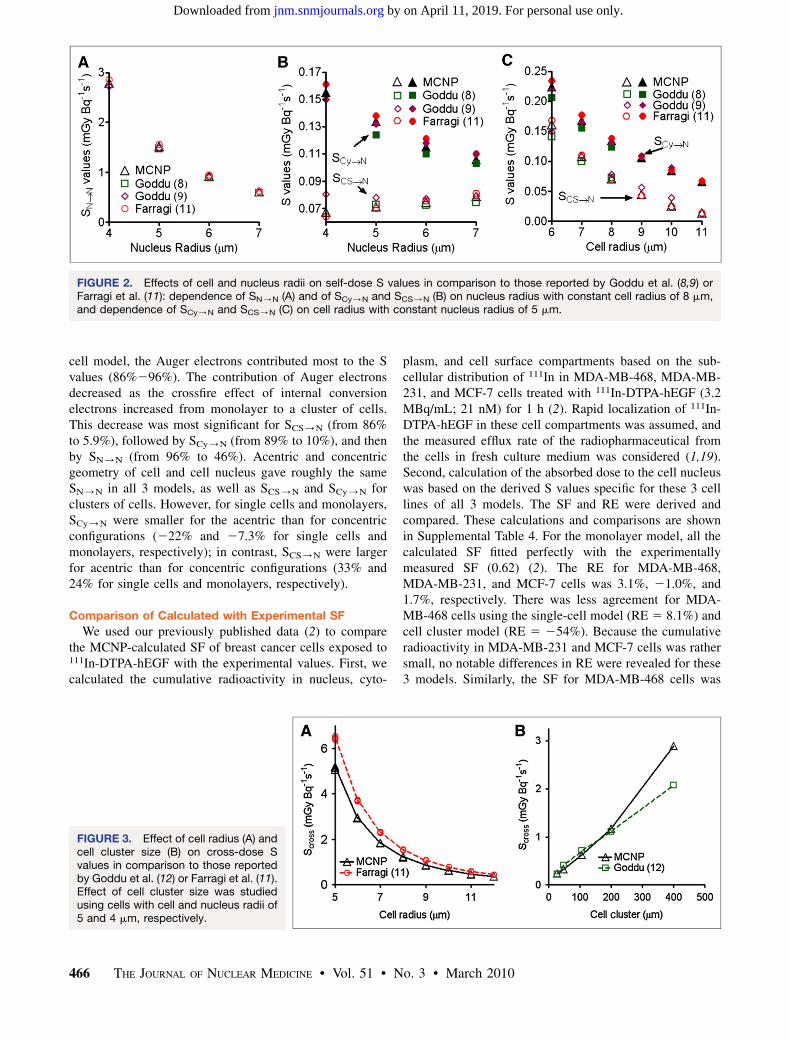
0.662–1.534 (8,9)) and Farragi et al. (ratio 5 0.944–1.129(11)) and agreed well, especially for larger cells (cell radius$ 8 mm). For a single cell of the same radius, as the radiusof the nucleus increased, both SN/N and SCy/N decreased(Figs. 2A and 2B). The decrease of SN/N was much moreapparent than that of SCy/N. The influence of nucleus sizeon SCS/N was much more subtle than that on SCy/N (Fig.2B). For a single cell with the same nucleus radius, the cellradius had no effect on SN/N. However, as the cell radiusincreased, both SCy/N and SCS/N decreased (Fig. 2C).These trends were in good agreement with reports byGoddu et al. (8,9) and Farragi et al. (11). Their data wereincluded in Figure 2 for comparison.
3-Dimensional Cell Cluster Model. For single cells,the electron energy deposited in the nucleus by 111In wasonly from the self-dose. In contrast, for cell clusters, thecontribution of cross dose to the total dose was not neg-ligible. To test the ability of MCNP to calculate cross-dose Svalues, we calculated S values to the nucleus for 111Inuniformly distributed in various cell compartments of hex-agonally closely packed cell clusters and derived cross-doseS values by subtracting self-dose. The cross-dose S values arelisted in Table 1 in comparison to the published values(Supplemental Table 2) (11,12). For all calculated celldimensions, cross-dose S values were independent of sub-cellular distribution of 111In and the size of cell nuclei butincreased as the cell radii decreased. Figure 3A shows anexample of the dependence of cross-dose S values on cellradii. The cross-dose S values reported by Farragi et al. (11)were consistently about 25% larger than those calculatedby MCNP. To compare with the cross-dose S values reportedby Goddu et al. (12), as well as to examine the effect of cellcluster size, we calculated cross-dose S values for variousclusters of cells with cell and nucleus radii of 5 and 4 mm,respectively. As shown in Figure 3B, cross-dose S valueincreased as the cluster size increased. The agreement
464 THE JOURNAL OF NUCLEAR MEDICINE • Vol. 51 • No. 3 • March 2010
by on April 11, 2019. For personal use only. jnm.snmjournals.org Downloaded from
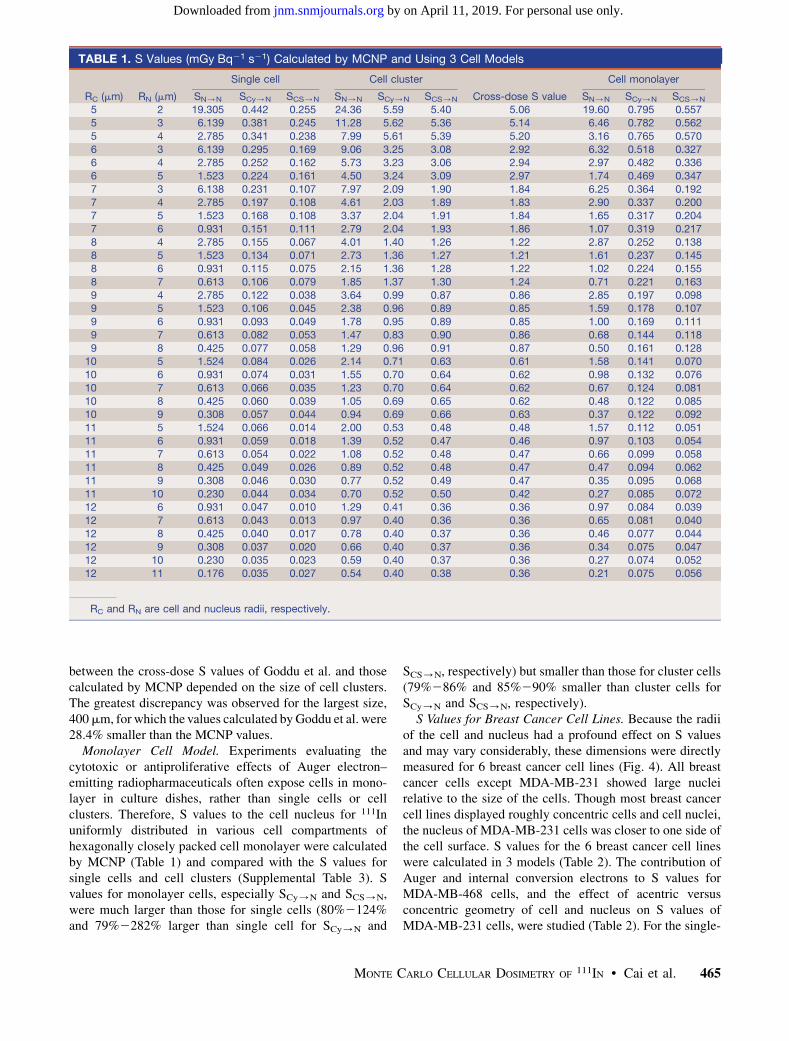
between the cross-dose S values of Goddu et al. and thosecalculated by MCNP depended on the size of cell clusters.The greatest discrepancy was observed for the largest size,400 mm, for which the values calculated by Goddu et al. were28.4% smaller than the MCNP values.
Monolayer Cell Model. Experiments evaluating thecytotoxic or antiproliferative effects of Auger electron–emitting radiopharmaceuticals often expose cells in mono-layer in culture dishes, rather than single cells or cellclusters. Therefore, S values to the cell nucleus for 111Inuniformly distributed in various cell compartments ofhexagonally closely packed cell monolayer were calculatedby MCNP (Table 1) and compared with the S values forsingle cells and cell clusters (Supplemental Table 3). Svalues for monolayer cells, especially SCy/N and SCS/N,were much larger than those for single cells (80%2124%and 79%2282% larger than single cell for SCy/N and
SCS/N, respectively) but smaller than those for cluster cells(79%286% and 85%290% smaller than cluster cells forSCy/N and SCS/N, respectively).
S Values for Breast Cancer Cell Lines. Because the radiiof the cell and nucleus had a profound effect on S valuesand may vary considerably, these dimensions were directlymeasured for 6 breast cancer cell lines (Fig. 4). All breastcancer cells except MDA-MB-231 showed large nucleirelative to the size of the cells. Though most breast cancercell lines displayed roughly concentric cells and cell nuclei,the nucleus of MDA-MB-231 cells was closer to one side ofthe cell surface. S values for the 6 breast cancer cell lineswere calculated in 3 models (Table 2). The contribution ofAuger and internal conversion electrons to S values forMDA-MB-468 cells, and the effect of acentric versusconcentric geometry of cell and nucleus on S values ofMDA-MB-231 cells, were studied (Table 2). For the single-
TABLE 1. S Values (mGy�Bq21�s21) Calculated by MCNP and Using 3 Cell Models
RC (mm) RN (mm)
Single cell Cell cluster
Cross-dose S value
Cell monolayer
SN/N SCy/N SCS/N SN/N SCy/N SCS/N SN/N SCy/N SCS/N
5 2 19.305 0.442 0.255 24.36 5.59 5.40 5.06 19.60 0.795 0.557
5 3 6.139 0.381 0.245 11.28 5.62 5.36 5.14 6.46 0.782 0.562
5 4 2.785 0.341 0.238 7.99 5.61 5.39 5.20 3.16 0.765 0.570
6 3 6.139 0.295 0.169 9.06 3.25 3.08 2.92 6.32 0.518 0.3276 4 2.785 0.252 0.162 5.73 3.23 3.06 2.94 2.97 0.482 0.336
6 5 1.523 0.224 0.161 4.50 3.24 3.09 2.97 1.74 0.469 0.347
7 3 6.138 0.231 0.107 7.97 2.09 1.90 1.84 6.25 0.364 0.192
7 4 2.785 0.197 0.108 4.61 2.03 1.89 1.83 2.90 0.337 0.2007 5 1.523 0.168 0.108 3.37 2.04 1.91 1.84 1.65 0.317 0.204
7 6 0.931 0.151 0.111 2.79 2.04 1.93 1.86 1.07 0.319 0.217
8 4 2.785 0.155 0.067 4.01 1.40 1.26 1.22 2.87 0.252 0.1388 5 1.523 0.134 0.071 2.73 1.36 1.27 1.21 1.61 0.237 0.145
8 6 0.931 0.115 0.075 2.15 1.36 1.28 1.22 1.02 0.224 0.155
8 7 0.613 0.106 0.079 1.85 1.37 1.30 1.24 0.71 0.221 0.163
9 4 2.785 0.122 0.038 3.64 0.99 0.87 0.86 2.85 0.197 0.0989 5 1.523 0.106 0.045 2.38 0.96 0.89 0.85 1.59 0.178 0.107
9 6 0.931 0.093 0.049 1.78 0.95 0.89 0.85 1.00 0.169 0.111
9 7 0.613 0.082 0.053 1.47 0.83 0.90 0.86 0.68 0.144 0.118
9 8 0.425 0.077 0.058 1.29 0.96 0.91 0.87 0.50 0.161 0.12810 5 1.524 0.084 0.026 2.14 0.71 0.63 0.61 1.58 0.141 0.070
10 6 0.931 0.074 0.031 1.55 0.70 0.64 0.62 0.98 0.132 0.076
10 7 0.613 0.066 0.035 1.23 0.70 0.64 0.62 0.67 0.124 0.081
10 8 0.425 0.060 0.039 1.05 0.69 0.65 0.62 0.48 0.122 0.08510 9 0.308 0.057 0.044 0.94 0.69 0.66 0.63 0.37 0.122 0.092
11 5 1.524 0.066 0.014 2.00 0.53 0.48 0.48 1.57 0.112 0.051
11 6 0.931 0.059 0.018 1.39 0.52 0.47 0.46 0.97 0.103 0.05411 7 0.613 0.054 0.022 1.08 0.52 0.48 0.47 0.66 0.099 0.058
11 8 0.425 0.049 0.026 0.89 0.52 0.48 0.47 0.47 0.094 0.062
11 9 0.308 0.046 0.030 0.77 0.52 0.49 0.47 0.35 0.095 0.068
11 10 0.230 0.044 0.034 0.70 0.52 0.50 0.42 0.27 0.085 0.07212 6 0.931 0.047 0.010 1.29 0.41 0.36 0.36 0.97 0.084 0.039
12 7 0.613 0.043 0.013 0.97 0.40 0.36 0.36 0.65 0.081 0.040
12 8 0.425 0.040 0.017 0.78 0.40 0.37 0.36 0.46 0.077 0.044
12 9 0.308 0.037 0.020 0.66 0.40 0.37 0.36 0.34 0.075 0.04712 10 0.230 0.035 0.023 0.59 0.40 0.37 0.36 0.27 0.074 0.052
12 11 0.176 0.035 0.027 0.54 0.40 0.38 0.36 0.21 0.075 0.056
RC and RN are cell and nucleus radii, respectively.
MONTE CARLO CELLULAR DOSIMETRY OF 111IN • Cai et al. 465
by on April 11, 2019. For personal use only. jnm.snmjournals.org Downloaded from
cell model, the Auger electrons contributed most to the Svalues (86%296%). The contribution of Auger electronsdecreased as the crossfire effect of internal conversionelectrons increased from monolayer to a cluster of cells.This decrease was most significant for SCS/N (from 86%to 5.9%), followed by SCy/N (from 89% to 10%), and thenby SN/N (from 96% to 46%). Acentric and concentricgeometry of cell and cell nucleus gave roughly the sameSN/N in all 3 models, as well as SCS/N and SCy/N forclusters of cells. However, for single cells and monolayers,SCy/N were smaller for the acentric than for concentricconfigurations (222% and 27.3% for single cells andmonolayers, respectively); in contrast, SCS/N were largerfor acentric than for concentric configurations (33% and24% for single cells and monolayers, respectively).
Comparison of Calculated with Experimental SF
We used our previously published data (2) to comparethe MCNP-calculated SF of breast cancer cells exposed to111In-DTPA-hEGF with the experimental values. First, wecalculated the cumulative radioactivity in nucleus, cyto-
plasm, and cell surface compartments based on the sub-cellular distribution of 111In in MDA-MB-468, MDA-MB-231, and MCF-7 cells treated with 111In-DTPA-hEGF (3.2MBq/mL; 21 nM) for 1 h (2). Rapid localization of 111In-DTPA-hEGF in these cell compartments was assumed, andthe measured efflux rate of the radiopharmaceutical fromthe cells in fresh culture medium was considered (1,19).Second, calculation of the absorbed dose to the cell nucleuswas based on the derived S values specific for these 3 celllines of all 3 models. The SF and RE were derived andcompared. These calculations and comparisons are shownin Supplemental Table 4. For the monolayer model, all thecalculated SF fitted perfectly with the experimentallymeasured SF (0.62) (2). The RE for MDA-MB-468,MDA-MB-231, and MCF-7 cells was 3.1%, 21.0%, and1.7%, respectively. There was less agreement for MDA-MB-468 cells using the single-cell model (RE 5 8.1%) andcell cluster model (RE 5 254%). Because the cumulativeradioactivity in MDA-MB-231 and MCF-7 cells was rathersmall, no notable differences in RE were revealed for these3 models. Similarly, the SF for MDA-MB-468 cells was
FIGURE 2. Effects of cell and nucleus radii on self-dose S values in comparison to those reported by Goddu et al. (8,9) orFarragi et al. (11): dependence of SN/N (A) and of SCy/N and SCS/N (B) on nucleus radius with constant cell radius of 8 mm,and dependence of SCy/N and SCS/N (C) on cell radius with constant nucleus radius of 5 mm.
FIGURE 3. Effect of cell radius (A) andcell cluster size (B) on cross-dose Svalues in comparison to those reportedby Goddu et al. (12) or Farragi et al. (11).Effect of cell cluster size was studiedusing cells with cell and nucleus radii of5 and 4 mm, respectively.
466 THE JOURNAL OF NUCLEAR MEDICINE • Vol. 51 • No. 3 • March 2010
by on April 11, 2019. For personal use only. jnm.snmjournals.org Downloaded from

projected using the single-cell model of Goddu et al. (8,9)and Farragi et al. (11) and the 3-dimensional cell clustermodel of Farragi et al. (11). These projected SF weretabulated and compared (Table 3). Irrespective of whetherMCNP or analytic methods were used, the single-cellmodel was less accurate in predicting the SF; the cellcluster model was much less accurate. In contrast, themonolayer model was the most reliable in projecting theexperimental SF, because this model most closely resem-bled the in vitro experimental conditions.
DISCUSSION
This study used the emission spectrum of 111In fromAAPM (15). This spectrum was quite similar to that fromthe MIRD publication (20), except that 2 Auger electrons(8.47 and 183 eV) were included in the AAPM report butnot in the MIRD monograph. The difference in total energyreleased per decay and the contribution of these 2 Augerelectrons to the total energy released were both lower than0.3%. Besides, MCNP followed electron transport onlydown to 1 keV. Thus, even though we used an earlierpublished emission spectrum of 111In rather than the most
updated spectrum from the MIRD publication, the resultingerror in calculated S values should not be significant. Totest this assumption, the S values of monolayer MDA-MB-468 cells were recalculated by MCNP using the MIRDspectrum. The ratio of recalculated SN/N, SCy/N, andSCS/N versus those in Table 2 was 1.01, 0.959, and 0.958,respectively, and validated our assumption.
The slight discrepancy between MCNP-generated self-and cross-dose S values and those from the earlier studies ofGoddu et al. (8,12) and Farraggi et al. (11) (SupplementalTables 1 and 2) solely resulted from fundamental differencesin energy deposition modeling, because the same 111In decaydata from the AAPM report (15) was used in their work andthe current study. Various monoenergetic electron (5- to 500-keV) S values for cells of 5-mm cell radius and 4-mm nucleusradius were generated by MCNP and compared with theMIRD S values (9). Depending on energies, the ratio of Svalues by MCNP versus MIRD ranged from 0.91 to 1.18,0.80 to 1.31, and 0.81 to 1.32 for SN/N, SCy/N, and SCS/N,respectively. These results further confirmed that the dis-crepancy came from the modeling.
MCNP was more flexible for modeling various cellgeometries in different experimental settings than the
FIGURE 4. Live cell images (centralslices) of 6 breast cancer (BC) cell lines(MDA-MB-468, MDA-MB-231, MDA-MB-361, MCF-7, BT-474, and SKBr-3).Cell surfaces (red) were stained bywheat germ agglutinin-Alexa Fluor 594conjugate, whereas cell nuclei (blue)were stained by Hoechst 33342 dye.RC and RN are mean cell and nucleusradii, respectively.
TABLE 2. S Values (mGy�Bq21�s21) for Individual Breast Cancer Cell Lines
Cell line
Single cell Cell monolayer Cell cluster
SN/N SCy/N SCS/N SN/N SCy/N SCS/N SN/N SCy/N SCS/N
MDA-MB-468 1.30 0.143 0.089 1.40 0.26 0.18 2.78 1.66 1.56By Auger electron 1.25 0.127 0.077 1.26 0.15 0.080 1.27 0.16 0.09
By internal conversion electron 0.04 0.017 0.011 0.14 0.11 0.102 1.49 1.47 1.46
S (Auger electron)/S (all electrons) 0.963 0.888 0.864 0.899 0.573 0.44 0.455 0.097 0.059
MDA-MB-361 1.02 0.100 0.053 1.09 0.17 0.12 1.93 1.03 0.95MCF-7 0.89 0.097 0.057 0.96 0.18 0.08 1.84 1.06 0.99
BT-474 0.89 0.086 0.044 0.95 0.15 0.10 1.66 0.87 0.81
SKBr-3 0.82 0.084 0.044 0.87 0.15 0.06 1.59 0.87 0.81
MDA-MB-231 1.30 0.088 0.034 1.36 0.15 0.08 2.00 0.79 0.72Acentric MDA-MB-231 1.30 0.069 0.045 1.36 0.14 0.10 2.00 0.78 0.74
S (acentric)/S (concentric) 1.00 0.78 1.33 1.00 0.93 1.24 1.00 0.98 1.02
MONTE CARLO CELLULAR DOSIMETRY OF 111IN • Cai et al. 467
by on April 11, 2019. For personal use only. jnm.snmjournals.org Downloaded from
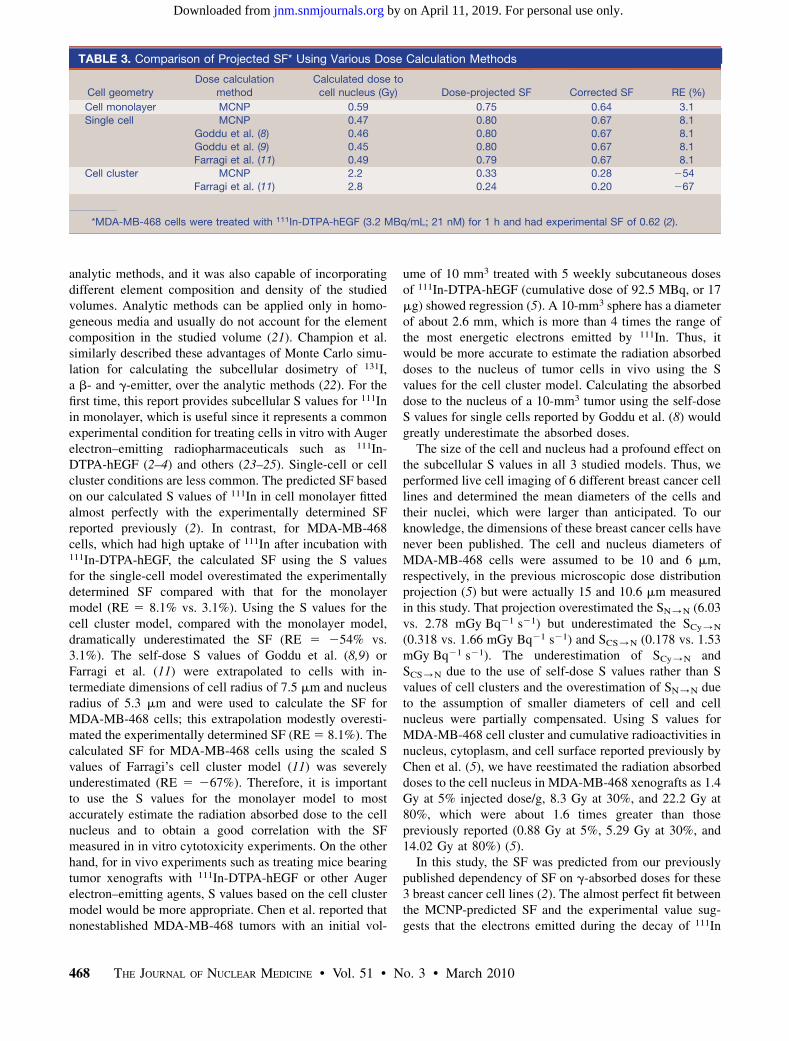
analytic methods, and it was also capable of incorporatingdifferent element composition and density of the studiedvolumes. Analytic methods can be applied only in homo-geneous media and usually do not account for the elementcomposition in the studied volume (21). Champion et al.similarly described these advantages of Monte Carlo simu-lation for calculating the subcellular dosimetry of 131I,a b- and g-emitter, over the analytic methods (22). For thefirst time, this report provides subcellular S values for 111Inin monolayer, which is useful since it represents a commonexperimental condition for treating cells in vitro with Augerelectron–emitting radiopharmaceuticals such as 111In-DTPA-hEGF (2–4) and others (23–25). Single-cell or cellcluster conditions are less common. The predicted SF basedon our calculated S values of 111In in cell monolayer fittedalmost perfectly with the experimentally determined SFreported previously (2). In contrast, for MDA-MB-468cells, which had high uptake of 111In after incubation with111In-DTPA-hEGF, the calculated SF using the S valuesfor the single-cell model overestimated the experimentallydetermined SF compared with that for the monolayermodel (RE 5 8.1% vs. 3.1%). Using the S values for thecell cluster model, compared with the monolayer model,dramatically underestimated the SF (RE 5 254% vs.3.1%). The self-dose S values of Goddu et al. (8,9) orFarragi et al. (11) were extrapolated to cells with in-termediate dimensions of cell radius of 7.5 mm and nucleusradius of 5.3 mm and were used to calculate the SF forMDA-MB-468 cells; this extrapolation modestly overesti-mated the experimentally determined SF (RE 5 8.1%). Thecalculated SF for MDA-MB-468 cells using the scaled Svalues of Farragi’s cell cluster model (11) was severelyunderestimated (RE 5 267%). Therefore, it is importantto use the S values for the monolayer model to mostaccurately estimate the radiation absorbed dose to the cellnucleus and to obtain a good correlation with the SFmeasured in in vitro cytotoxicity experiments. On the otherhand, for in vivo experiments such as treating mice bearingtumor xenografts with 111In-DTPA-hEGF or other Augerelectron–emitting agents, S values based on the cell clustermodel would be more appropriate. Chen et al. reported thatnonestablished MDA-MB-468 tumors with an initial vol-
ume of 10 mm3 treated with 5 weekly subcutaneous dosesof 111In-DTPA-hEGF (cumulative dose of 92.5 MBq, or 17mg) showed regression (5). A 10-mm3 sphere has a diameterof about 2.6 mm, which is more than 4 times the range ofthe most energetic electrons emitted by 111In. Thus, itwould be more accurate to estimate the radiation absorbeddoses to the nucleus of tumor cells in vivo using the Svalues for the cell cluster model. Calculating the absorbeddose to the nucleus of a 10-mm3 tumor using the self-doseS values for single cells reported by Goddu et al. (8) wouldgreatly underestimate the absorbed doses.
The size of the cell and nucleus had a profound effect onthe subcellular S values in all 3 studied models. Thus, weperformed live cell imaging of 6 different breast cancer celllines and determined the mean diameters of the cells andtheir nuclei, which were larger than anticipated. To ourknowledge, the dimensions of these breast cancer cells havenever been published. The cell and nucleus diameters ofMDA-MB-468 cells were assumed to be 10 and 6 mm,respectively, in the previous microscopic dose distributionprojection (5) but were actually 15 and 10.6 mm measuredin this study. That projection overestimated the SN/N (6.03vs. 2.78 mGy�Bq21�s21) but underestimated the SCy/N
(0.318 vs. 1.66 mGy�Bq21�s21) and SCS/N (0.178 vs. 1.53mGy�Bq21�s21). The underestimation of SCy/N andSCS/N due to the use of self-dose S values rather than Svalues of cell clusters and the overestimation of SN/N dueto the assumption of smaller diameters of cell and cellnucleus were partially compensated. Using S values forMDA-MB-468 cell cluster and cumulative radioactivities innucleus, cytoplasm, and cell surface reported previously byChen et al. (5), we have reestimated the radiation absorbeddoses to the cell nucleus in MDA-MB-468 xenografts as 1.4Gy at 5% injected dose/g, 8.3 Gy at 30%, and 22.2 Gy at80%, which were about 1.6 times greater than thosepreviously reported (0.88 Gy at 5%, 5.29 Gy at 30%, and14.02 Gy at 80%) (5).
In this study, the SF was predicted from our previouslypublished dependency of SF on g-absorbed doses for these3 breast cancer cell lines (2). The almost perfect fit betweenthe MCNP-predicted SF and the experimental value sug-gests that the electrons emitted during the decay of 111In
TABLE 3. Comparison of Projected SF* Using Various Dose Calculation Methods
Cell geometry
Dose calculation
method
Calculated dose to
cell nucleus (Gy) Dose-projected SF Corrected SF RE (%)
Cell monolayer MCNP 0.59 0.75 0.64 3.1
Single cell MCNP 0.47 0.80 0.67 8.1
Goddu et al. (8) 0.46 0.80 0.67 8.1Goddu et al. (9) 0.45 0.80 0.67 8.1
Farragi et al. (11) 0.49 0.79 0.67 8.1
Cell cluster MCNP 2.2 0.33 0.28 254
Farragi et al. (11) 2.8 0.24 0.20 267
*MDA-MB-468 cells were treated with 111In-DTPA-hEGF (3.2 MBq/mL; 21 nM) for 1 h and had experimental SF of 0.62 (2).
468 THE JOURNAL OF NUCLEAR MEDICINE • Vol. 51 • No. 3 • March 2010
by on April 11, 2019. For personal use only. jnm.snmjournals.org Downloaded from

had a relative biologic effect on breast cancer cells similarto that of g-rays. This means that even if 111In-DTPA-hEGFwas translocated to the nucleus of MDA-MB-468 cells,111In was not sufficiently closely associated with DNA toexhibit high-linear-energy transfer. Nonetheless, nuclearimportation is necessary to maximize the radiation ab-sorbed dose. According to the calculation of Chen (26),a distance between 111In and DNA greater than 1 mmresults in low-linear-energy transfer and thus RBE similarto g-rays. MCNP follows electron transport down to 1 keV.The resolution of microscopic dose mapping should bebetter than 0.1 mm. Therefore, MCNP is capable ofmodeling the radiation absorbed dose to the cell nucleus(micrometer scale) from Auger electron–emitting radio-therapeutic agents that are not intimately associated withDNA. To model the dose to DNA at the nanometer scale forDNA-binding radiotherapeutics such as 125I-iododeoxyur-idine, a detailed history Monte Carlo code that follows thetransport of electrons down to 100 eV would be necessary(27). Other methods, such as the inner shell ionizationmodel, have been proposed (28). This model uses a hybridMonte Carlo simulation method to calculate the amount ofinner shell ionization generated by the degraded photonspectrum in the tissues and electron knock-on. Then, anequivalent dose of 0.05 Gy per inner shell ionization isapplied, derived from the work of Kassis et al. (29).
CONCLUSION
MCNP is a feasible and reliable method to assess thesubcellular radiation absorbed dose from Auger electron–emitting radionuclides in real experimental settings. For thefirst time, this study calculated the S values to the cellnucleus for 111In at the cell surface, in the cytoplasm, and inthe nucleus of cells in monolayer and having various celland nucleus dimensions. S values obtained from this cell-monolayer model were more appropriate to estimate theabsorbed dose for in vitro experiments than those fromsingle-cell or cell cluster models. The cell and nucleusdiameters of 6 commonly used breast cancer cell lineswere measured and reported for the first time. Theseindividual cell line–specific dimensions had large effectson the calculation of S values and, thus, were important toestimate radiation-absorbed doses accurately in experimen-tal settings.
ACKNOWLEDGMENTS
This research was supported by a grant from theCanadian Breast Cancer Research Alliance (grant019513) with funds from the Canadian Cancer Society.
REFERENCES
1. Reilly RM, Kiarash R, Cameron RG, et al. 111In-labeled EGF is selectively
radiotoxic to human breast cancer cells overexpressing EGFR. J Nucl Med.
2000;41:429–438.
2. Cai Z, Chen Z, Bailey KE, Scollard DA, Reilly RM, Vallis KA. Relationship
between induction of phosphorylated H2AX and survival in breast cancer cells
exposed to 111In-DTPA-hEGF. J Nucl Med. 2008;49:1353–1361.
3. Bailey KE, Costantini DL, Cai Z, et al. Epidermal growth factor receptor
inhibition modulates nuclear localization and cytotoxicity of the Auger electron
emitting radiopharmaceutical 111In-DTPA human epidermal growth factor.
J Nucl Med. 2007;48:1562–1570.
4. Chen P, Mrkobrada M, Vallis K, et al. Comparative antiproliferative effects of111In-DTPA-hEGF, chemotherapeutic agents and gamma-radiation on EGFR-
positive breast cancer cells. Nucl Med Biol. 2002;29:693–699.
5. Chen P, Wang J, Vallis KA, Reilly RM. Antitumor effects and normal tissue
toxicity of 111In-labeled epidermal growth factor administered to athymic
mice bearing epidermal growth factor receptor-positive human breast cancer
xenografts. J Nucl Med. 2003;44:1469–1478.
6. Reilly RM, Chen P, Wang J, Scollard D, Cameron R, Vallis KA. Preclinical
pharmacokinetic, biodistribution, toxicology, and dosimetry studies of 111In-
DTPA-human epidermal growth factor: an Auger electron-emitting radio-
therapeutic agent for epidermal growth factor receptor-positive breast cancer.
J Nucl Med. 2006;47:1023–1031.
7. Vallis K, Reilly RM, Scollard DA, Petronis J, Caldwell C, Hendler AA. Phase I
clinical trial of 111In-human epidermal growth factor (111In-hEGF) in patients
with metastatic EGFR-positive breast cancer [abstract]. J Nucl Med. 2005;
46(suppl):152P.
8. Goddu SM, Howell RW, Rao DV. Cellular dosimetry: absorbed fractions for
monoenergetic electron and alpha particle sources and S-values for radionuclides
uniformly distributed in different cell compartments. J Nucl Med. 1994;35:
303–316.
9. Goddu SM, Howell RW, Bouchet LG, Bolch WE, Rao DV. MIRD Cellular S
Values: Self-Absorbed Dose per Unit Cumulated Activity for Selected
Radionuclides and Monoenergetic Electron and Alpha Particle Emitters
Incorporated into Different Cell Compartments. Reston, VA: Society of Nuclear
Medicine; 1997:15, 87.
10. Cole A. Absorption of 20 eV to 50,000 eV electron beams in air and plastic.
Radiat Res. 1969;38:7–33.
11. Faraggi M, Gardin I, Stievenart JL, Bok BD, Le Guludec D. Comparison of
cellular and conventional dosimetry in assessing self-dose and cross-dose
delivered to the cell nucleus by electron emissions of 99mTc, 123I, 111In, 68Ga and201Tl. Eur J Nucl Med. 1998;25:205–214.
12. Goddu SM, Rao DV, Howell RW. Multicellular dosimetry for micrometastases:
dependence of self-dose versus cross-dose to cell nuclei on type and energy of
radiation and subcellular distribution of radionuclides. J Nucl Med. 1994;35:
521–530.
13. Briesmeister JF. X-5 Monte Carlo Team: MCNP—A General Monte Carlo
N-Particle Transport Code. Version 5. Los Alamos, NM: Los Alamos National
Laboratory; 2003. UR-03-1987.
14. White MC. Photoatomic Data Library MCPLIB04: A New Photoatomic Library
Based on Data from ENDF/B-VI Release 8. Los Alamos, NM: Los Alamos
National Laboratory; 2002. Los Alamos National Laboratory internal memo-
randum X-5:MCW-02-111.
15. Howell RW. Radiation spectra for Auger-electron emitting radionuclides: report
no. 2 of AAPM Nuclear Medicine Task Group no. 6. Med Phys. 1992;19:1371–
1383.
16. International Commission on Radiation Units and Measurements (ICRU). Tissue
Substitutes in Radiation Dosimetry and Measurement. Oxford, U.K.: Oxford
University Press; 1989. Report 44.
17. Chadwick KH, Leenhouts HP. A molecular theory of cell survival. Phys Med
Biol. 1973;18:78–87.
18. Kassis AI. Therapeutic radionuclides: biophysical and radiobiologic principles.
Semin Nucl Med. 2008;38:358–366.
19. Hu M, Scollard DA, Chan C, Chen P, Vallis KA, Reilly RM. Effect of EGFR
density of breast cancer cells on the nuclear importation, in vitro cytotoxicity and
tumour and normal tissue uptake of 111In-DTPA-hEGF. Nucl Med Biol. 2007;
34:887–896.
20. Eckerman KF, Endo A. MIRD: Radionuclide Data and Decay Schemes. 2nd ed.
Reston, VA: Society of Nuclear Medicine; 2008:271–272.
21. Roeske JC, Aydogan B, Bardies M, Humm JL. Small-scale dosimetry:
challenges and future directions. Semin Nucl Med. 2008;38:367–383.
22. Champion C, Zanotti-Fregonara P, Hindie E. Celldose: a Monte Carlo code to
assess electron dose distribution—S values for 131I in spheres of various sizes.
J Nucl Med. 2008;49:151–157.
23. Costantini DL, Chan C, Cai Z, Vallis KA, Reilly RM. 111In-labeled trastuzumab
(Herceptin) modified with nuclear localization sequences (NLS): an Auger
electron-emitting radiotherapeutic agent for HER2/neu-amplified breast cancer.
J Nucl Med. 2007;48:1357–1368.
MONTE CARLO CELLULAR DOSIMETRY OF 111IN • Cai et al. 469
by on April 11, 2019. For personal use only. jnm.snmjournals.org Downloaded from

24. Kersemans V, Cornelissen B, Minden MD, Brandwein J, Reilly RM. Drug-
resistant AML cells and primary AML specimens are killed by 111In-anti-CD33
monoclonal antibodies modified with nuclear localizing peptide sequences.
J Nucl Med. 2008;49:1546–1554.
25. Kriehuber R, Kadenbach K, Schultz F, Weiss DG. Study on cell survival,
induction of apoptosis and micronucleus formation in SCL-II cells after
exposure to the auger electron emitter 99mTc. Int J Radiat Biol. 2004;
80:875–880.
26. Chen J. A compilation of microdosimetry for uniformly distributed Auger
emitters used in medicine. Int J Radiat Biol. 2008;84:1027–1033.
27. Emfietzoglou D, Kostarelos K, Hadjidoukas P, et al. Subcellular S-factors for
low-energy electrons: a comparison of Monte Carlo simulations and continuous-
slowing-down calculations. Int J Radiat Biol. 2008;84:1034–1044.
28. Pignol JP, Rakovitch E, Beachey D, Le Sech C. Clinical significance of atomic
inner shells ionisation (ISI) and Auger cascade for radiosensitization using IUdR,
BUdR, platinum salts or gadolinium porphyrin compounds. Int J Radiat Oncol
Biol Phys. 2003;55:1082–1091.
29. Kassis AI, Sastry KSR, Adelstein SJ. Kinetics of uptake, retention, and
radiotoxicity of 125IUdR in mammalian cells: implications of localized energy
deposition by Auger processes. Radiat Res. 1987;109:78–89.
Erratum
Table 1 was inadvertently omitted from the article ‘‘Evaluation of the Serotonin Transporter Ligand 123I-ADAM forSPECT Studies on Humans,’’ by Frokjaer et al. (J Nucl Med. 2008;49:247–254). The table appears below. Theauthors regret the error.
TABLE 1. Comparison of Outcomes from Full Kinetic Modeling and Simplified Methods
Region
1TC SRTM(BPND)
Logan reference(BPND)
Ratio, 200–240min (BPND)VT BPP BPND
Cerebellum 8.7 6 2.3 — — — — —
Midbrain 19.2 6 4.9 10.4 6 3.3 1.2 6 0.3 1.4 6 0.2* 1.3 6 0.2 1.7 6 0.4Thalamus 21.6 6 6.8 12.9 6 4.8 1.5 6 0.40 1.5 6 0.4 1.4 6 0.4 1.8 6 0.4
Putamen 20.1 6 6.3 11.4 6 4.3 1.3 6 0.3 1.2 6 0.3 1.2 6 0.3 1.4 6 0.3
Caudatus 18.7 6 5.8 10.0 6 3.8 1.1 6 0.3 1.1 6 0.3 1.1 6 0.3 1.4 6 0.3
Superior frontal cortex 14.5 6 4.4 5.8 6 2.7 0.7 6 0.3 0.7 6 0.3 0.7 6 0.3 0.6 6 0.3Occipital cortex 11.8 6 2.7 3.1 6 1.3 0.4 6 0.2 0.3 6 0.2 0.3 6 0.2 0.3 6 0.2
*Mean BPND in midbrain from SRTM was calculated after exclusion of 2 outliers.
1TC 5 1-tissue-compartment model; SRTM 5 simplified reference tissue model; VT 5 total distribution volume; BPP 5 binding
potential, calculated as VT(ROI) 2 VT(Cerebellum); BPND 5 ratio at equilibrium of specific to nondisplaceable radioligand binding,
calculated as BPP/VT(Cerebellum) for 1TC model.Values are mean 6 SD (n 5 7). VT and BPP were determined with 1TC analysis. BPND values were derived using 1TC model,
SRTM, Logan reference with individual estimation of k29 by SRTM model, or ratio method based on data 200–240 min after
injection.
470 THE JOURNAL OF NUCLEAR MEDICINE • Vol. 51 • No. 3 • March 2010
by on April 11, 2019. For personal use only. jnm.snmjournals.org Downloaded from
Doi: 10.2967/jnumed.109.063156Published online: February 11, 2010.
2010;51:462-470.J Nucl Med. Zhongli Cai, Jean-Philippe Pignol, Conrad Chan and Raymond M. Reilly Comparison with Analytic Methods and Correlation with In Vitro Cytotoxicity
In Using Monte Carlo N-Particle Computer Code:111Cellular Dosimetry of
http://jnm.snmjournals.org/content/51/3/462This article and updated information are available at:
http://jnm.snmjournals.org/site/subscriptions/online.xhtml
Information about subscriptions to JNM can be found at:
http://jnm.snmjournals.org/site/misc/permission.xhtmlInformation about reproducing figures, tables, or other portions of this article can be found online at:
(Print ISSN: 0161-5505, Online ISSN: 2159-662X)1850 Samuel Morse Drive, Reston, VA 20190.SNMMI | Society of Nuclear Medicine and Molecular Imaging
is published monthly.The Journal of Nuclear Medicine
© Copyright 2010 SNMMI; all rights reserved.
by on April 11, 2019. For personal use only. jnm.snmjournals.org Downloaded from