Embed Size (px)
Citation preview

Cellular and molecular aspects of the response of
the testis to nutrition in sexually mature sheep
Yongjuan Guan
21004548
This thesis is presented for the degree of Doctor of Philosophy of
The University of Western Australia
School of Animal Biology
Institute of Agriculture
March 2015

Declaration
1
Declaration
The work presented in this thesis is original work of the author, and none of the material
in this thesis has been submitted either in full, or part, for a degree at this university or
any other universities or institutions before. The experimental designs and manuscript
preparation were carried out by myself after discussion with my supervisors Prof
Graeme Martin, A/Prof Irek Malecki and Dr Penny Hawken.
Yongjuan Guan
March 2015
Contents
2
Contents
Summary ....................................................................................................................................... 4
Acknowledgements ....................................................................................................................... 8
Publications ................................................................................................................................. 10
Chapter 1: General Introduction ................................................................................................. 12
Chapter 2: Literature Review ...................................................................................................... 16
2.1 Male reproduction ............................................................................................................. 18
2.1.1 Organization of the testis ........................................................................................... 18
2.1.2 Spermatogenesis ........................................................................................................ 21
2.1.3 Physiological control of male reproduction .............................................................. 23
2.1.4 Morphological changes associated with puberty ....................................................... 25
2.2 Environmental factors affecting male reproduction .......................................................... 26
2.2.1 Photoperiod ................................................................................................................ 26
2.2.2 Social-sexual signals .................................................................................................. 28
2.2.3 Stress and temperament ............................................................................................. 29
2.2.4 Nutrition ..................................................................................................................... 30
2.3 Small RNAs affect spermatogenesis and germ cell apoptosis in testis ............................. 35
2.3.1 Small RNA categories ................................................................................................ 35
2.3.2 miRNAs and spermatogenesis .................................................................................... 37
2.3.3 miRNAs and germ cell apoptosis ............................................................................... 37
2.3.4 piRNAs affect spermatogenesis .................................................................................. 38
2.4 Alternative pre-mRNAs splicing affects spermatogenesis and apoptosis ......................... 38
2.4.1 Alternative pre-mRNA splicing and spermatogenesis ................................................ 39
2.4.2 Alternative pre-mRNA splicing and spermatogenesis ................................................ 40
2.5 Conclusions and hypotheses .............................................................................................. 41
Chapter 3: General Materials and Methods ................................................................................ 42
3.1 Experimental location ....................................................................................................... 42
3.2 Experimental animals ........................................................................................................ 42
3.3 Nutrition treatment ............................................................................................................ 42
3.4 Body mass and scrotal circumference ............................................................................... 43
3.5 Semen collection and processing ...................................................................................... 44
3.6 Semen analysis .................................................................................................................. 44
3.7 Tissue collection and preservation .................................................................................... 46

Contents
3
3.8 Sperm concentration in testicular tissue ............................................................................ 46
3.9 Morphometric and histological analysis ........................................................................... 46
3.10 Molecular analysis .......................................................................................................... 50
3.11 Bioinformatics analysis ................................................................................................... 52
Chapter 4: Under nutrition reduces spermatogenic efficiency and sperm velocity, and increases sperm DNA damage in sexually mature male sheep .................................................................. 57
4.1 Abstract ............................................................................................................................. 57
4.2 Introduction ....................................................................................................................... 58
4.3 Materials and methods ...................................................................................................... 60
4.4 Results ............................................................................................................................... 64
4.5 Discussion ......................................................................................................................... 71
Chapter 5: Under-nutrition decreases Sertoli cell function in sexually mature male sheep ....... 77
5.1 Abstract ............................................................................................................................. 77
5.2 Introduction ....................................................................................................................... 78
5.3 Materials and methods ...................................................................................................... 81
5.4 Results ............................................................................................................................... 90
5.5 Discussion ......................................................................................................................... 99
Chapter 6: Roles of small RNAs in the effects of nutrition on apoptosis and spermatogenesis in the adult testis ........................................................................................................................... 104
6.1 Abstract ........................................................................................................................... 104
6.2 Introduction ..................................................................................................................... 105
6.3 Materials and methods .................................................................................................... 107
6.4 Results ............................................................................................................................. 115
6.5 Discussion ....................................................................................................................... 125
Chapter 7: Functional changes in mRNA expression and alternative pre-mRNA splicing associated with the effects of nutrition on apoptosis and spermatogenesis in the adult testis .. 131
7.1 Abstract ........................................................................................................................... 131
7.2 Introduction ..................................................................................................................... 132
7.3 Materials and methods .................................................................................................... 134
7.4 Results ............................................................................................................................. 139
7.5 Discussion ....................................................................................................................... 148
Chapter 8 ................................................................................................................................... 155
General Discussion ................................................................................................................... 155
References ................................................................................................................................. 161

Summary
4
Summary
The reproductive system of small ruminants is affected by a variety of environmental
factors, including socio-sexual signals, photoperiod and nutrition. Genotype controls the
final outcome, but nutrition is particularly important in geographical regions where the
quality and quantity of pasture are poor during the breeding season. In males, the
problem of poor feed availability is exacerbated by a decrease in appetite and the end
result is major losses in both body mass and testis mass, and therefore sperm
production. It is not clear whether the reductions in testis mass and numbers of sperm
are accompanied by changes in the quality of the sperm. Moreover, we know little of
the physiological, cellular and molecular processes involved. In this thesis, these
processes are explored.
Sertoli cells were the focus of attention because they provide nutritional and structural
support for germ cells. We therefore expected the reduction in sperm production by
under-fed sheep to be correlated with decreases in the number or function of the Sertoli
cells. Another possibility is that, in underfed animals, there is an increase in apoptosis of
the germ cells, thus explaining the reductions in sperm output and perhaps explaining
any changes in the quality of the sperm that are eventually ejaculated.
It seems likely that the responses to changes in nutrition are mediated by small RNAs
(including micro-RNAs and piwi-RNAs), mRNAs and alternative pre-mRNA splicing,
within the Sertoli cells. These mRNA-based mechanisms are thought to be associated
with apoptosis and spermatogenesis. In this thesis, therefore, I tested the general
hypothesis that, in adult male sheep, under-nutrition will reduce sperm quality, due to
germ cell apoptosis, that these responses will be explained by reductions in Sertoli cell

Summary
5
function, and that such effects are mediated by changes in the expression of small RNAs
and mRNAs, and by alternative pre-mRNA splicing.
The foundation of my experimental work was a single large study with sexually mature
Merino rams that provided baseline data and tissue samples for cellular and molecular
studies. Three diets (High, Maintenance, Low) were fed for 65 days and induced
changes in testis mass, sperm production and spermatogenic efficiency (sperm per gram
of testis tissue). The quality of ejaculated sperm was analyzed at the end of the
nutritional treatment period. Underfeeding reduced sperm velocity, increased sperm
DNA damage, and decreased spermatogenic efficiency, compared to the other two
dietary treatments. There were no differences in terms of sperm morphology or sperm
viability among the three treatments. Germ cell apoptosis was evaluated by the TUNEL
method and by assessing the expression of some of the major genes that control the
process of apoptosis. The results showed that underfeeding increased the number of
apoptotic germ cells and increased the expression of apoptosis-related genes in
testicular tissue.
Potential effects of nutrition on the number of Sertoli cells were evaluated by counting
cells using GATA4 as a marker for Sertoli cell nuclei, and by evaluating the
proliferation status of the Sertoli cells using immunoreactivity to proliferation cell
nuclear antigen (PCNA). The numbers of Sertoli cells did not differ among the
treatments and was not related to changes in testis mass, although 1% of the Sertoli cells
retained proliferative ability.
The function of the Sertoli cells was evaluated by assessing tight junctions and the
expression of the genes involved in Sertoli cell maturation. Our results showed that,
compared with High and Maintenance diets, the Low diet led to disorganized
localization of the tight junction protein, Claudin 11. In addition, mRNA expression for

Summary
6
Claudin 11 was increased and mRNA expression for ZO1 was decreased. These three
observations are coherent and suggest that, in the Sertoli cells of underfed sheep, tight
junctions are disrupted and there seems to be a reversal of the ‘terminal differentiation’
that is associated with puberty. These cells had lower levels of expression of GATA1, a
marker of mature Sertoli cells, and higher levels of expression of AMH, a marker of
immature Sertoli cells. These observations are consistent with reversal of maturation,
thus explaining the disruption of tight junctions in underfed rams.
To investigate the processes through which nutrition can induce these responses, we
studied the effect of nutrition on the expression of small RNAs, including miRNAs and
piRNAs. We identified 44 miRNAs and 35 putative piRNAs that were differentially
expressed in well-fed and underfed animals. Of particular interest were those related to
reproductive system development, apoptosis (miRNAs), and sperm production and
sperm quality (piRNAs). More importantly, one of the novel miRNAs, miR-144 (a
homologue to miR-98), was found to target three apoptotic genes (TP53, CASP3,
FASL). These observations suggest changes in the expression of miRNAs and piRNAs
were responsible for the effects of under-nutrition on spermatogenesis and germ cell
apoptosis.
We also tested the effect of nutrition on mRNA expression and alternative pre-mRNA
splicing. A total of 2243 mRNAs were differentially expressed in underfed and well-fed
sheep, and functional analysis suggests that they were predominantly related to germ
cells, testis size, apoptosis and spermatogenesis. In addition, 788 genes were spliced
differently in the two dietary treatments, most of which were related to protein
localization, cellular metabolic processes, post-translational protein modification, and
spermatogenesis. These observations suggest that the changes in mRNA expression and

Summary
7
alternative pre-mRNA splicing regulate spermatogenesis and apoptosis and are
responsible for the effects on nutrition on ram fertility.
In conclusion, in sexually mature male sheep, under-nutrition reduces spermatogenic
efficiency and sperm velocity, and increases sperm DNA damage. These processes are
not associated with the changes of Sertoli cell number, but are associated with increased
germ cell apoptosis and disrupted Sertoli cell function (including the disorganization of
tight junctions and reversal of cell maturity). These effects seem to be explained by
changes in small RNAs, mRNAs and alternative pre-mRNA splicing. These discoveries
are major steps towards the development of processes for mitigating the negative effects
of under-nutrition on male fertility.

Acknowledgements
8
Acknowledgements
It was my great honor to do my PhD in the School of Animal Biology in the University
of Western Australia, funded by a Scholarship for International Research Fees (SIRF). I
am indebted to my supervisors Prof Graeme Martin, A/Prof Irek Malecki and Dr Penny
Hawken and I want to express my deepest thanks to them for their strong support,
invaluable guidance, tireless corrections of the manuscripts and their willingness to help
whenever I need them in my research and my life. They will be the ones that I miss
most when I leave Australia and I wish them all the best, especially good health. I will
treasure their great kindness my whole life and look forward to collaborating with them
in the future.
I owe appreciation to those who have contributed to this work. I especially would like to
express my sincere gratitude to Prof Philip Vercoe for his financial support for my
project; Dr John Milton for his nutritional analysis of the diets; Mr Tom Stewart for his
experienced guidance with histological techniques; and the other staff and postgraduate
students in the livestock science group, Dr Trina Jorre de St Jorre, Dr César Rosales
Nieto, Mrs Margaret Blackberry, Mr Sheng Zhang and Mr Fahad Almohsen for their
help during my studies. Thank you to everyone who has shared your experience with
me and contributed to the pleasant atmosphere in the animal science discipline at UWA.
I would like to thank A/Prof Leluo Guan from University of Alberta, Canada, for her
generous financial help and research guidance and also her group members for their
patient help with techniques and data analysis. Dr Sarah Meachem and Mr Seungmin
Ham from Prince Henry’s Institute of Medical Research at Melbourne also provided
excellent guidance and constructive suggestions. Dr Matthew Linden from the Centre

Acknowledgements
9
for Microscopy, Characterisation & Analysis at UWA kindly helped with the flow
cytometry, and Prof Geoff Meyer and Dr Greg Cozens from School of Anatomy and
Human Biology at UWA provided excellent technical support. Dr. Anne Jequier (Pivet
Medical Centre, Perth, Western Australia) made many suggestions for the techniques
for assessment of the testis.
I am very grateful to Mike Carroll Travelling Fellowship Committee for funding the
travel for my collaboration in Canada, and to the UWA Graduates Association for
offering me a Postgraduate Research Travel Award to attend an international conference
in Vancouver.
I would like to say thank you to my beloved boyfriend Guanxiang Liang for his
everlasting love, encouragement and support although he is physically in Canada. I am
thankful to my family in China for their unconditional love and support during the last
30 years.
Finally, the last congratulation goes on to me, potential Dr. Guan. I was a scientific
baby 1276 days ago, now I am proud to say I am a scientific child, at least not a baby
any more. Thanks to my hard work during the last three and half years, I believe the
1276 days’ overseas’ research life will be one of the most beautiful sceneries in my life.

Publications
10
Publications
Refereed journal articles
Guan, Y., Malecki, I.A., Hawken, P.A.R., Linden, M.D. & Martin, G.B. (2014). Under
nutrition reduces spermatogenic efficiency and sperm velocity, and increases sperm
DNA damage in sexually mature male sheep. Animal Reproduction Science 149,
163-172. See Chapter 4.
Guan, Y., Liang, G., Hawken, P.A.R., Meachem, S., Malecki, I.A., Ham, S., Stewart,
T., Guan, L.L. & Martin, G.B. (2014). Nutrition affects Sertoli cell function but not
Sertoli cell numbers in sexually mature male sheep. Reproduction, Fertility and
Development (RD14368, DOI: 10.1071/RD14368). See Chapter 5.
Guan, Y., Liang, G., Hawken, P.A.R., Malecki, I.A., Cozens, G., Vercoe, P.E., Martin,
G.B. & Guan, L.L. (2014). Roles of small RNAs in the effects of nutrition on
apoptosis and spermatogenesis in the adult testis. Scientific Report (Nature
publishing group, SREP-14-10126-B, under revision). See Chapter 6.
Conference papers
Guan, Y., Meachem, S., Malecki, I.A., Hawken, P.A.R., Jequier, A. & Martin, G.B.
(2013). Sperm quality and Sertoli cell function are compromised in underfed
Merino rams. Annual Symposium of the Endocrine and Reproductive Society of WA
(Perth, Australia), page 30.
Guan, Y., Meachem, S., Malecki, I.A., Hawken, P.A.R., Jequier, A. & Martin, G.B.
(2013). Sperm quality and Sertoli cell function are compromised in underfed
Publications
11
Merino rams. Abstracts of the 11th World Conference on Animal Production
(Beijing, China), page 33 (abstract WCAP2013-7-M2).
Almohsen, F., Guan, Y., Malecki, I.A., Hawken, P.A.R. & Martin, G.B. (2012).
Nutrition, testicular mass and sperm viability in the sexually mature male sheep.
Proceedings of the 44th Annual Conference, Society for Reproductive Biology
(Gold Coast, Australia).
Guan,Y., Almohsen F., Malecki, I.A., Hawken, P.A.R. & Martin, G.B. (2012).
Nutrition, testicular mass and sperm viability in the sexually mature male sheep.
Annual Symposium of the Endocrine and Reproductive Society of WA (Perth,
Australia), page 30.
Guan, Y., Almohsen, F., Tawang, A., Malecki, I.A. & Martin, G.B. (2012). Nutrition,
seminal plasma protein concentration and sperm viability in the mature male sheep.
Abstracts of the 17th International Congress on Animal Reproduction (Vancouver,
Canada). Reproduction in Domestic Animals 47 (Supplement 4), 526 (Abstract
2052).
Almohsen F., Guan,Y., Malecki, I.A., Hawken, P.A.R. & Martin, G.B. (2012).
Nutrition, seminal plasma protein concentration and sperm viability in the mature
male sheep. Association for Applied Animal Andrology (Vancouver, Canada).

Chapter 1-General Introduction
12
Chapter 1
General Introduction
The reproductive system of small ruminants is affected by environmental factors such
as socio-sexual signals, photoperiod and nutrition, with genotype controlling the final
outcome (review: Martin and Walkden-Brown 1995). The effects of nutrition on gamete
production have been studied extensively in females (Lozano et al. 2003), but much less
attention has been paid to males. This disparity is surprising because, in sheep and
goats, testis mass is lost during the normal breeding season as a consequence of the poor
quantity and quality of pasture during the autumn in many parts of the world (Martin et
al. 1999). In addition, during the breeding season, male goats and sheep lose their
appetite and their behavioural drive for mating reduces the time available for feeding.
The combination of these circumstances results in major losses in both body mass and
testis mass (Knight et al. 1987) and therefore sperm production (Oldham et al. 1978;
Cameron et al. 1988). Conversely, it is not clear whether the reductions in testis mass
and sperm production in underfed rams are also accompanied by reductions in the
quality of the sperm that are ejaculated. In addition, we do not understand the
physiological, cellular and molecular processes involved. In this thesis, I have explored
these issues.
Spermatogenic efficiency, as indicated by the number of sperm produced per gram of
testicular tissue, is also affected by nutrition (Oldham et al. 1978; Cameron et al. 1988),
probably due to changes in the rate of cell loss during spermatogenesis, perhaps through
effects on the process of apoptosis (Sakkas et al. 1999; Santos et al. 1999). In addition,
changes in testis mass would also be accompanied by changes in blood flow (Setchell et

Chapter 1-General Introduction
13
al. 1965) and thus oxidative stress, a major cause of sperm damage (Review:Aitken et
al. 2012). Therefore, germ cell apoptosis is one possible mechanism responsible for the
reduction in sperm production by under-fed sheep.
As germ cells develop, they receive nutritional and structural support from the Sertoli
cells in the testis. However, each Sertoli cell has a fixed capacity for the number of
germ cells it can support (review: Sharpe et al. 2003), so the reduction in sperm
production by under-fed sheep could be related to changes in number or function of
Sertoli cells. In sexually mature male sheep, an assessment of the testes using classical
morphological techniques indicated effects of nutrition on the number and volume of
Sertoli cells (Hötzel et al. 1998). This finding is controversial because it contradicts the
dogma that the number of Sertoli cells in the testis is stable after puberty (Monet-Kuntz
et al. 1984). Therefore, there is a clear need to use more specific techniques to re-
examine the effects of under-nutrition on Sertoli cell number in sexually mature male
sheep.
We know little of the physiological, cellular and molecular processes involved in the
above processes. Recently, regulatory small RNAs including microRNAs (miRNAs)
and PIWI-interacting RNAs (piRNAs) have emerged as important regulators of
spermatogenesis and apoptosis (Ro et al. 2007; Hayashi et al. 2008; Papaioannou and
Nef 2010; Li et al. 2011). miRNAs are small (~22 nucleotides) endogenous RNAs that
negatively regulate gene expression by targeting the 3’-untranslated region (Krutzfeldt
and Stoffel 2006) and/or coding region of mRNAs (Hausser et al. 2013). It has been
reported that a global loss of miRNAs, in germ cells or in Sertoli cells, is detrimental for
male fertility (Niu et al. 2011). By contrast, piRNAs are longer (26–32 nt) than
miRNAs and can bind PIWI proteins, which are spermatogenesis-specific proteins
belonging to the Argonaute protein family (Liu et al. 2012a). The main function of

Chapter 1-General Introduction
14
piRNAs is to guide PIWI protein to sites where it can suppress the transposable
elements that protect genomic integrity (Luteijn and Ketting 2013). To date, piRNAs
have been mainly found in the testis in males, suggesting that their roles are specific to
spermatogenesis (Ro et al. 2007). We have therefore postulated that changes in small
RNAs would explain the difference of sperm output in male sheep treated with different
diets.
Another possibility is that the effects of under-nutrition on Sertoli cell function are
mediated by changes in the expression of mRNAs, and by alternative pre-mRNA
splicing. Of particular interest are the mRNAs of genes such as CASP3 and TP53 that
are related to apoptosis (Shaw et al. 1992; Ni et al. 1998), and genes such as Claudin 11
and ZO1 that are associated with spermatogenesis (Tarulli et al. 2008). Alternative pre-
mRNA splicing is being seen as an important mechanism for regulating gene expression
and for increasing transcriptome plasticity and proteome diversity. Indeed, it has been
reported that approximately 60% of human gene products undergo alternative splicing
(Modrek and Lee 2002). It has also been reported that spermatogenesis and many
apoptotic factors are regulated by alternative pre-mRNA splicing (Walker et al. 1996;
Moore et al. 2010), so we expected mRNA expression and alternative pre-mRNA
splicing to be affected by under-nutrition in sexually mature male sheep testis. Rather
than focusing on particular genes, however, we used RNA-Seq for a more general, a
large scale exploration of the expression of mRNAs and alternative splicing events.
In conclusion, the general hypothesis tested in this thesis is that, in adult male sheep,
under-nutrition will decrease sperm quality, and that this effect is associated with
changes in the number or function of Sertoli cells, and with changes of germ cell
apoptosis. To gain an understanding of the processes involved, we studied small RNAs,
mRNAs and alternative pre-mRNA splicing. The experimental work in this thesis

Chapter 1-General Introduction
15
therefore focused on the effects of nutrition on sperm quality and testis function in
sexually mature Merino rams and pursued the following aims: 1) To measure the sperm
quality including motility, viability and morphology, as well as sperm DNA damage
and germ cell apoptosis; 2) To explore Sertoli cell number and function; 3) To
investigate the expression of small RNAs, especially miRNAs and piRNAs; 4) To
investigate the expression of mRNAs and functional relationships between miRNAs and
mRNAs; 5) To explore the possible role of alternative pre-mRNA splicing in
spermatogenesis and apoptosis.
Chapter 2-Literature Review
16
Chapter 2
Literature Review
Background
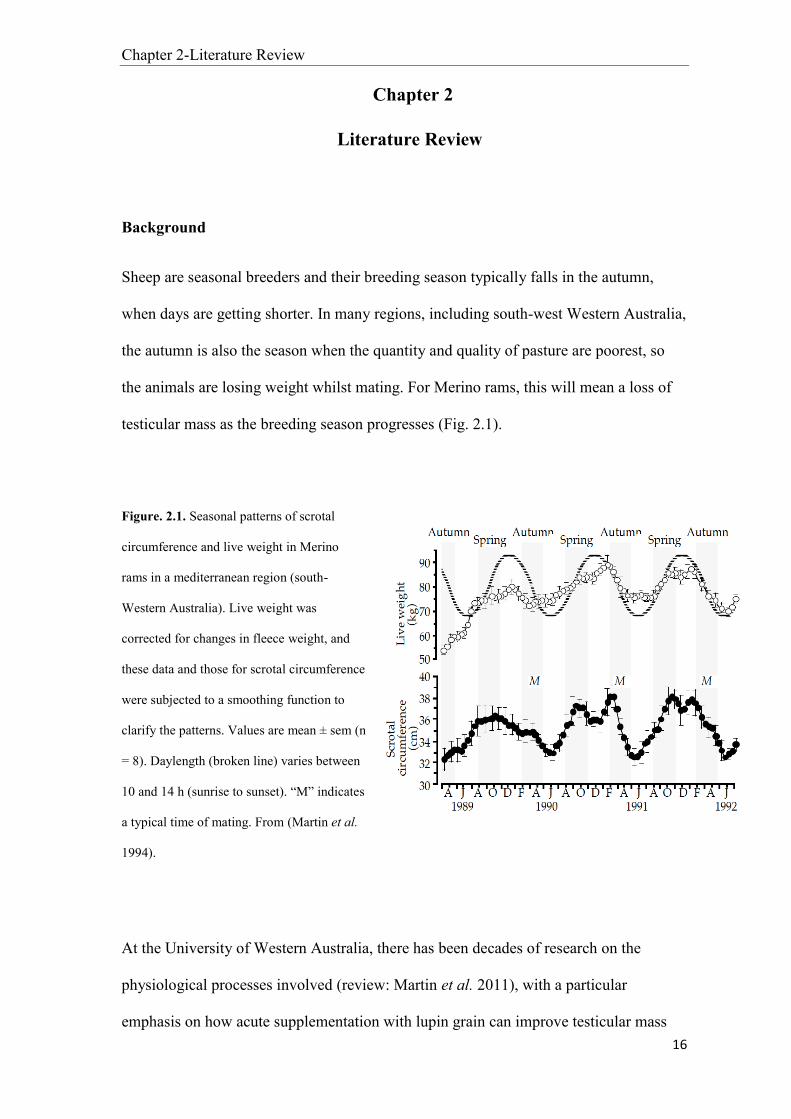
Sheep are seasonal breeders and their breeding season typically falls in the autumn,
when days are getting shorter. In many regions, including south-west Western Australia,
the autumn is also the season when the quantity and quality of pasture are poorest, so
the animals are losing weight whilst mating. For Merino rams, this will mean a loss of
testicular mass as the breeding season progresses (Fig. 2.1).
Figure. 2.1. Seasonal patterns of scrotal
circumference and live weight in Merino
rams in a mediterranean region (south-
Western Australia). Live weight was
corrected for changes in fleece weight, and
these data and those for scrotal circumference
were subjected to a smoothing function to
clarify the patterns. Values are mean ± sem (n
= 8). Daylength (broken line) varies between
10 and 14 h (sunrise to sunset). “M” indicates
a typical time of mating. From (Martin et al.
1994).
At the University of Western Australia, there has been decades of research on the
physiological processes involved (review: Martin et al. 2011), with a particular
emphasis on how acute supplementation with lupin grain can improve testicular mass
Chapter 2-Literature Review
17
86%
0
100
200
300
400
Paired testis mass (g)
High diet
Low diet
250%
Spermatozoa (billions per day)
0
2
4
6
8
High diet
Low diet
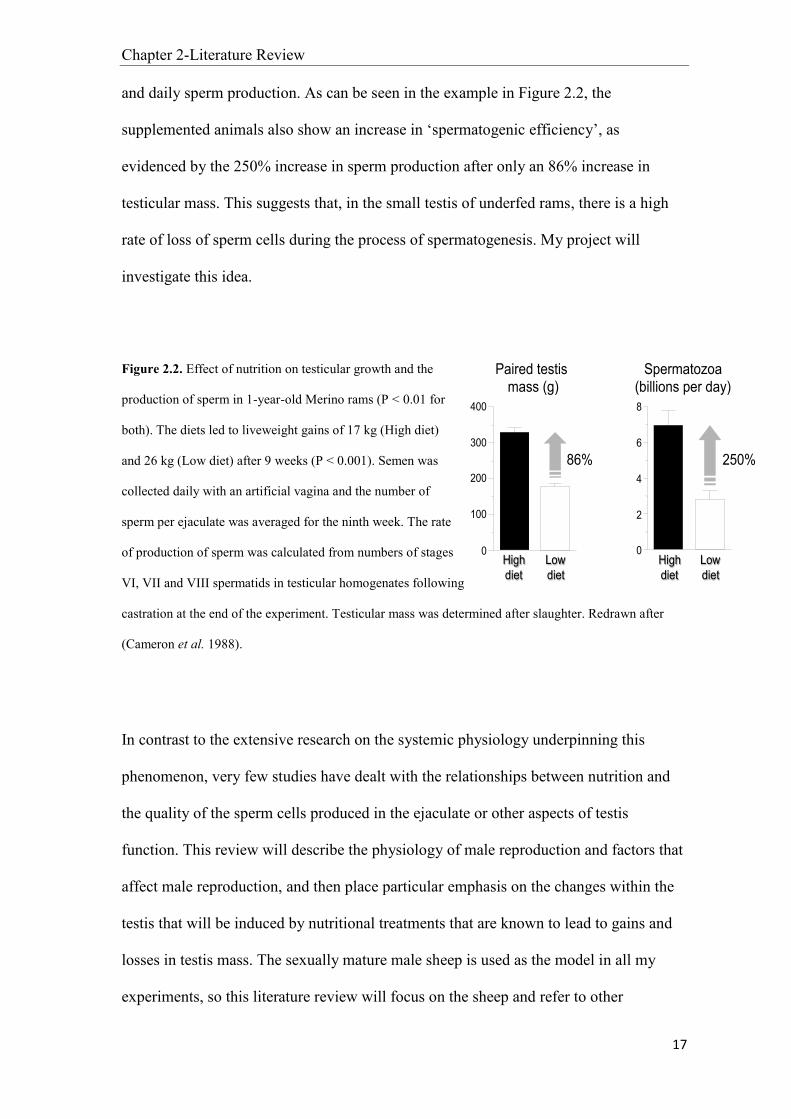
and daily sperm production. As can be seen in the example in Figure 2.2, the
supplemented animals also show an increase in ‘spermatogenic efficiency’, as
evidenced by the 250% increase in sperm production after only an 86% increase in
testicular mass. This suggests that, in the small testis of underfed rams, there is a high
rate of loss of sperm cells during the process of spermatogenesis. My project will
investigate this idea.
Figure 2.2. Effect of nutrition on testicular growth and the
production of sperm in 1-year-old Merino rams (P < 0.01 for
both). The diets led to liveweight gains of 17 kg (High diet)
and 26 kg (Low diet) after 9 weeks (P < 0.001). Semen was
collected daily with an artificial vagina and the number of
sperm per ejaculate was averaged for the ninth week. The rate
of production of sperm was calculated from numbers of stages
VI, VII and VIII spermatids in testicular homogenates following
castration at the end of the experiment. Testicular mass was determined after slaughter. Redrawn after
(Cameron et al. 1988).
In contrast to the extensive research on the systemic physiology underpinning this
phenomenon, very few studies have dealt with the relationships between nutrition and
the quality of the sperm cells produced in the ejaculate or other aspects of testis
function. This review will describe the physiology of male reproduction and factors that
affect male reproduction, and then place particular emphasis on the changes within the
testis that will be induced by nutritional treatments that are known to lead to gains and
losses in testis mass. The sexually mature male sheep is used as the model in all my
experiments, so this literature review will focus on the sheep and refer to other

Chapter 2-Literature Review
18
mammals when information for sheep is lacking or controversial, or where species
comparisons can provide insight.
2.1 Male reproduction
2.1.1 Organization of the testis
The general anatomy of the testis is similar for all mammalian species. The testis
consists of a series of elongated convoluted tubules, among which lie the blood vessels
and Leydig cells, the whole covered by a tough fibrous capsule (Leeson 1974).
a. Seminiferous tubules and the rete testis
i. Seminiferous tubules
The seminiferous tubules are two-ended loops with both ends opening into the rete
testis. Each tubule is extensively convoluted and the number of tubules differs among
species. For example, there are less than five in dasyurid marsupials (Woolley 1975),
approximately 30 in the rat (Tuck et al. 1970), and more in sheep and human. In most
species, the diameter of each tubule is between 200 and 275 µm (Wing and Christensen
1982; Hötzel et al. 1998). The tubules contain various germinal cells and the somatic
Sertoli cells within a compartment bounded by lymphatic endothelium (Fawcett et al.
1973), myoid cells (Maekawa et al. 1996) and acellular elements (Leeson and Forman
1981) that together form a well-defined boundary tissue. There are basement
membranes between the lymphatic endothelial cells and between the myoid cells and
the cells within the tubule. There may be many layers of myoid cells (Maekawa et al.
1996) and they probably provide the motive force for the propulsion of fluid and sperm
along the seminiferous tubules to the rete testis (Russell et al. 1989).
ii. Sertoli cells and the blood-testis barrier
Chapter 2-Literature Review
19
These cells were named after Enrico Sertoli who first described them 150 years ago
(Sertoli 1865). They lie inside the boundary tissue of the seminiferous tubules and
surround the undeveloped germinal cells. In the adult, the cytoplasm of the Sertoli cells
extends from the boundary tissue to the lumen of the tubule. There is a complex
nucleus, with infolding or lobulation, with a central mass and two lateral associated
bodies, the perinucleolar spheres (Lipshultz et al. 1982). The mitochondria are
numerous and have an orthodox internal appearance, although they tend to be longer
and thinner than those of germ cells (Bawa 1963). There are multiple separate Golgi
elements and numerous membrane-limited dense bodies of varying size. There is both
rough and smooth endoplasmic reticulum (ER) (Steinberger et al. 1975). The rough ER
is found mainly in the basal part of the cell, in the form of tubules or stacks of cisternae,
whereas some of the smooth ER is arranged in dense masses around the developing
acrosome of the spermatids. Microtubules are also abundant in the Sertoli cells at
certain stages of the spermatogenic cycle (Inoue et al. 2014).
Sertoli cells produce inhibin in response to follicle-stimulating hormone (FSH) released
from the pituitary gland (Bicsak et al. 1987) and are associated with the development of
the germinal cells, but exactly how they provide nutritional and structural support for
germ cells is still unclear. Some studies indicate specific functions, such as secretion of
fluid, phagocytosis, and the maturation of sperm and their release into the tubule lumen
(Valles et al. 2014). Importantly, pairs of adjacent Sertoli cells show specialized
junctions that form the main component of the blood-testis barrier after puberty (Tarulli
et al. 2012). The blood-testis barrier segregates the meiotic and post-meiotic cells into
the immunologically privileged adluminal compartment (Meng et al. 2005) and, when it
is disrupted, the result is germ cell atresia and the cessation of spermatogenesis (Tarulli
et al. 2008). The function and dynamic regulation of the blood-testis barrier are still
poorly understood.

Chapter 2-Literature Review
20
It generally accepted that Sertoli cells do not divide after puberty – in the rat, for
example, cessation of Sertoli cell division coincides with differentiation of the germinal
cells up to the early pachytene stage of meiotic prophase during the initial
spermatogenic wave (Steinberger and Steinberger 1971). Similar studies have been
reported in other mammals (Franca et al. 2000; Plant and Marshall 2001) and also in
non-mammalian species, such as the African catfish and Nile tilapia, in which Sertoli
cell proliferation is strongly reduced when germ cells have proceeded into meiosis, and
stops in postmeiotic cysts (Schulz et al. 2005).
Whether Sertoli cells in mature testes can resume division under certain conditions
remains an open question. It was suggested that an increase in the number of Sertoli
cells observed after artificial cryptorchidism in adult rats is due to amitotic divisions
(Clegg 1963), but amitosis is generally not considered to be the mode of cell division in
mammalian tissues (Steinberger and Steinberger 1971).
iii. Lumen and rete testis
The lumen of the tubule is filled with a fluid that is necessary for the development of
germ cells and also for the transport of sperm to the rete testis, efferent ducts and
epididymis (Levine and Marsh 1971). The seminiferous tubules open into short tubuli
recti (or straight tubules) that, in turn, open into the rete testis. The rete testis is the
beginning of the excurrent duct system and, in some species, is embedded in a fibrous
mediastinum. The size and position of the rete varies greatly between species
(Jahnukainen et al. 2011).
b. The interstitial tissue and Leydig cells
The seminiferous tubules are basically cylindrical and these cylinders are stacked,
leading to the formation of a series of 3-sided spaces that contain the interstitial tissue.
The interstitial tissue contains the blood vessels, lymph vessels, fibrocytes, fibroblasts

Chapter 2-Literature Review
21
and Leydig cells (Mori and Christensen 1980). Leydig cells are named after Franz
Leydig who described them in 1850 (Roe et al. 1964). These cells have a complex
ultrastructure and contain large amounts of smooth endoplasmic reticulum, plentiful
mitochondria, a prominent Golgi complex, centrioles and a number of lipid droplets
(Kerr et al. 1979). They are responsible for synthesizing and releasing androgens in
response to luteinizing hormone (LH) released from the pituitary gland (Li et al. 2013).
c. The capsule of the testis
The testis is encased in a tough fibrous capsule, usually referred to as the tunica
albuginea. There are really three tunicas: the tunica albuginea in the middle; the visceral
tunica vaginalis on the outside; and the tunica vasculosa nearest to the parenchyma
(Buetow 1995). The main tunica albuginea consists of fibroblasts and bundles of
collagenous fibres running in all directions with a number of smooth muscle cells and
nerve endings. The tunica vaginalis is the peritoneal lining that surrounds the testis and
consists of a single layer of flattened mesothelial cells. The tunica vasculosa can be
considered as a sub-tunical extension of the interstitial tissue and consists of networks
of minute blood vessels held together by delicate areolar tissue (Buetow 1995).
2.1.2 Spermatogenesis
Spermatogenesis is the process in which spermatogonia form sperm (Brinster and
Zimmermann 1994). It may be divided into three phases based on functional
considerations: a) the proliferative phase, b) the meiotic phase, and c) the spermiogenic
phase (Clermont and Morgentaler 1955).
a. Proliferative Phase
Most mammalian species produce millions of sperm each day during their
reproductively active periods and the population of spermatogonia fulfil this need. In

Chapter 2-Literature Review
22
the proliferative phase, these relatively immature cells undergo numerous mitoses to
build up a large number of cells that subsequently undergo meiosis and differentiation
to form sperm.
The spermatogonia reside basally within the tubule, generally showing one surface
flattened along the basal lamina and a rounded surface in contact with the Sertoli cells
(Russell 1977). There are three types of spermatogonia: stem cell spermatogonia,
proliferative spermatogonia, and differentiated spermatogonia (Tegelenbosch and de
Rooij 1993; Brinster and Zimmermann 1994). The first two groups are known as
undifferentiated spermatogonia (Shinohara et al. 2000; Ohbo et al. 2003).
Spermatogenesis begins with differentiated spermatogonia that replicate and
differentiate and thus become divided into A, intermediate and B classes. In sheep, A0,
A1, A2, A3, intermediate, B1 and B2 spermatogonia are present (Hochereau-de Reviers
1976).
b. Meiotic Phase
The type B spermatogonia differentiate into primary (preleptotene) spermatocytes
(Yuan et al. 2000) that morphologically resemble the B spermatogonia except that they
are smaller. In addition, slightly less chromatin is seen protruding inward toward the
centre of the nucleus (Costa et al. 2011). The preleptotene spermatocytes undergo two
meiotic divisions during which germ cell number is quadrupled, chromosomes are
recombined, and genetic material is halved in each cell. This whole process can be
divided into two major stages: the first meiotic division (Meiosis I) in which primary
spermatocytes yield secondary spermatocytes, and the second meiotic division (Meiosis
II) yields spermatids (differentiation without proliferation) that differentiate into sperm
(Howard and Pelc 1950). Each major stage is subdivided into prophase, metaphase,

Chapter 2-Literature Review
23
anaphase and telophase (Staiger and Cande 1990). The process of differentiation into
sperm is known as spermiogenesis (Li et al. 2014).
c. Spermiogenic Phase
This phase described the process through which the round spermatids differentiate into
elongated spermatids. To be transformed into the very complex sperm, they need to
undergo condensation of the nucleus, formation of the acrosome, virtual elimination of
the cytoplasm, development of a tail, and arrangement of the mitochondria into a helix
that produces the midpiece (Santos et al. 2010). This process occurs without cell
division and is one of the most phenomenal cell transformations in the body. How these
changes are achieved is not fully understood but, as the spermatids develop, they
become closely associated with Sertoli cells (Payne et al. 2010), so it is assumed that
the Sertoli cells are involved.
2.1.3 Physiological control of male reproduction
a. The hypothalamic-pituitary-testicular axis in male sheep
Reproduction is mainly regulated by the neurons in the brain that produce
gonodotrophin-releasing hormone (GnRH). In sheep, the GnRH cell bodies are mainly
located in the preoptico-hypothalamic area, the lateral and medial preoptic area, medial
septum, ventrolateral anterior hypothalamus, lateral hypothalamus and mediobasal
hypothalamus (Caldani et al. 1988). GnRH is synthesized by these neurons and
transported to the organum vasculosum of the lamina terminals (OVLT), where it fulfils
an unknown function, or to the median eminence where it is released into the
hypophyseal portal system. The portal blood transports the GnRH to the anterior
pituitary gland where it interacts with a G-protein-coupled receptor on the surface of the
gonadotrophs, and thus regulates the synthesis and release of the two gonadotrophins,
luteinizing hormone (LH) and follicle stimulating hormone (FSH) (Lincoln 1979). The

Chapter 2-Literature Review
24
LH and FSH are released into the bloodstream, transported to the testes, and stimulate
the synthesis and secretion of testosterone and inhibin (Kishi et al. 2000).
Interestingly, GnRH secretion is pulsatile rather than continuous, and this pattern is
reflected in a one-to-one relationship by pulses of LH (Caraty and Locatelli 1988) so it
is possible to use the pattern of LH secretion as a bioassay of GnRH secretion. Unlike
LH, FSH is released in a non-pulsatile pattern, but its secretion still depends on GnRH
(Lincoln 1979), although some studies suggest that the secretion of FSH is independent
on the availability of GnRH (Fraser and McNeilly 1983; Clarke et al. 1986).
b. The internal and external factors controlling the reproductive axis
The hypothalamic-pituitary-testicular axis responds to internal and external factors. The
internal regulatory mechanisms include sex steroids and inhibin (negative feedback) and
metabolic hormones and non-hormonal factors. The external factors include nutrition,
photoperiod, social-sexual signals and stress. Since external factors will be discussed in
details in Section 2.2, here we concentrate on steroids and inhibin (negative feedback).
The primary testicular steroid, testosterone, can be converted to oestradiol-17β by the
action of aromatase (Jones et al. 2003) and to dihydrotestosterone by the action of 5α-
reductase (Trainor and Marler 2002). Both oestradiol-17β and dihydrotestosterone are
thought to inhibit LH secretion by direct effects on the pituitary gland or by indirect
effects on hypothalamic GnRH secretion. In rams, the hypothalamus has been reported
to be the major site for negative feedback (Jackson et al. 1991; Tilbrook et al. 1991) and
responds within minutes (Lincoln and Fraser 1990).
Aromatisation in testis, liver and brain appears to be an important aspect of the
endocrine regulation of reproduction in male sheep (Sharma et al. 2004). For example,
treatment with fadrozole, a non-steroidal aromatase inhibitor, decreases plasma

Chapter 2-Literature Review
25
oestradiol-17β concentrations and increases LH pulse frequency in both testis-intact
rams and testosterone-treated castrates, suggesting that non-testicular sites of
aromatization are important in the control of pulsatile LH secretion (Sharma et al.
1999). In addition, LH pulse frequency increases after infusion of fadrozole into the
third ventricle of testis-intact rams (Sharma et al. 1999).
2.1.4 Morphological changes associated with puberty
a. Morphological changes in seminiferous tubules during puberty
During puberty, spermatogenesis is accomplished step by step. At first, spermatogonia
are located within the basement membrane and their number increase. Subsequently,
primary spermatocytes appear in large numbers, followed by secondary spermatocytes,
spermatids, and sperm.
During puberty, a most profound change is seen in the Sertoli cells. In terms of
morphology, immature Sertoli cells show a pseudostratified disposition and they
possess a round-elongated nucleus that has a regular outline and one small nucleolus
close to the nuclear envelope. By contrast, the nuclei of mature Sertoli cells show a
more irregular outline and the nucleoli are more prominent (Sniffen 1952; Nistal et al.
1982). With respect to function, at puberty, Sertoli cells lose their proliferative ability
and form the blood-testis barrier, and so they can perform new functions. These changes
in Sertoli cells at puberty, from fetal to adult phenotype, are termed “maturation” or
“differentiation” (Sharpe et al. 2003).
b. Morphological changes in interstitial tissue during puberty
In the pubertal testis, Leydig cells develop from mesenchymal cells that resemble
fibroblasts. These cells contain neither crystalloids nor pigment, but do contain lipoid
granules. After puberty, Leydig cells gain large amounts of smooth endoplasmic

Chapter 2-Literature Review
26
reticulum and mitochondria, reflecting their capability for steroidogenesis (Neaves et al.
1985). In bulls (McCarthy et al. 1979), rats (Odell et al. 1974) and rams (Foster et al.
1978), the ability of LH to increase testosterone concentrations in serum increases at
puberty, indicating acquisition by the Leydig cells of an ability to respond to LH.
2.2 Environmental factors affecting male reproduction
Male reproduction can be affected by several environmental factors, including nutrition,
photoperiod, social-sexual signal and stress. These factors do not act independently but
interact with each other to influence reproductive ability, as discussed here.
2.2.1 Photoperiod
Seasonal changes in testicular mass have been documented in many laboratories over
many decades, especially for sheep and goats. Photoperiod is generally considered to be
the main determinant of seasonal patterns of reproduction through its influences on the
secretion of LH and FSH (Martin et al. 1999). The degree of seasonality depends
largely on genotype and the evolutionary history of the genotype within the
environment in which it evolved (Martin et al. 2011). For this reason, the annual
reproductive cycles of Australian Merino sheep with their Mediterranean origins are
different to those of Suffolk sheep with their temperate origins (Hötzel et al. 2003).
a. The effect of photoperiod on sperm production and sperm quality
In a study of sperm motility and morphology in Suffolk and Lincoln yearling rams
(Mickelsen et al. 1981), the authors observed marked seasonal variations in both breeds.
Reflecting the importance of photoperiod, a change from long days to short days
increases sperm number in rams (Langford et al. 1987). This relationship is not only
seen in sheep but also mammalian species as distant as cats (Nunez Favre et al. 2012).

Chapter 2-Literature Review
27
Overall, the evidence is very clear that there is direct relationship between photoperiod
and sperm production and quality.
b. The effect of photoperiod on testis function
In adult hamsters, at least 12.5 hours of light per day are needed to maintain
spermatogenesis and prevent degeneration (Gaston and Menaker 1967), and exposure to
short photoperiods induces germ cell degeneration and drastic involution of testes and
accessory glands (Hoffmann 1974; Russell et al. 1994). Exposure to long photoperiod
increases testis weight, tubular lumen volume, interstitial parameters, and numbers of
preleptotene spermatocytes, although adluminal germ cells did not increase in number
(Russell et al. 1994). In addition, the increase in testis weight was associated with a 65%
decrease in apoptosis in testicular tissue within 5 days (Furuta et al. 1994). The
importance of photoperiod therefore seems to be overwhelming but, in one study, testis
development was similar in the short-day and long-day groups and the authors
suggested that the transition from winter to summer condition is partly based on an
endogenous mechanism which continues even in the absence of stimulating long
photoperiods (Lerchl and Schlatt 1993). The phenomenon, often termed
‘photorefractoriness’ is now considered to explain seasonal cycle in both sexes in many
species, and seems to be linked to the thyroid axis (Dardente et al. 2014).
c. The effect of photoperiod on Sertoli cell number and function
The factors that can affect Sertoli cell number and function are not well documented but
photoperiod has been relatively well studied. In the viscacha, during the annual
reproductive cycle, Sertoli cells exhibit changes in nuclear size and shape, chromatin
texture, and nucleolus characteristics (Munoz et al. 2001). There were only minimal
changes after 4-6 weeks of exposure to short photoperiod but, after the animals were
transferred to long photoperiod, there were increases in the volume of cytoplasm and

Chapter 2-Literature Review
28
smooth and rough endoplasmic reticulum (Russell et al. 1994). In the ram, the season of
birth influences the formation of Sertoli cell stocks (de Reviers et al. 1980), and, in the
adult, the testis shrinks and the cross-sectional nuclear area of Sertoli cells becomes
smaller when photoperiod is changed from short to long days, but the number of Sertoli
cells per testis is not affected (Hochereau-de Reviers et al. 1985). In the adult stallion,
by contrast, testis weight and the number of Sertoli cells per testis was reported to be
greater in the breeding season than in the non-breeding season (Johnson and Nguyen
1986). This observation, along with a few others, challenges the dogma that Sertoli cell
number is stable after puberty and suggests that, in these specific settings at least, the
adult Sertoli cell is not terminally differentiated. Even if we accept changes in Sertoli
cell number after puberty, we are left with the mystery of whether it is caused directly
by change in photoperiod or indirectly as a consequence of change in testis size.
Photoperiod also affects Sertoli cell function. In seasonally breeding golden (Syrian)
hamster, Sertoli cell function was virtually shut-down during testicular regression
induced by short photoperiod (Hikim et al. 1989). In addition, the localization of tight
junctions was disordered within the Sertoli cell cytoplasm by short photoperiod (Tarulli
et al. 2006). These studies have generally been restricted to tight junction activity, a
factor that defines mature, differentiated Sertoli cells, but there are few studies of the
effects of photoperiod on the expression of Sertoli cell specific genes. Of particular
interest would be AMH and GATA-1, two genes related to Sertoli cell maturation status
(Rey 1998; Beau et al. 2000).
2.2.2 Social-sexual signals
The sudden introduction of novel rams can induce ovulation in anoestrous ewes through
a phenomenon known as the ‘ram effect’ in which socio-sexual signals from the ram
cause a rapid increase in pulsatile LH secretion in ewes. Similarly, rams show an
Chapter 2-Literature Review
29
increase in LH and testosterone concentrations beginning at 12 h after being introduced
to ewes (Ungerfeld and Silva 2004). This response is also mediated by an increase in
pulsatile LH secretion that is induced primarily by the odour of the ewes (Hawken et al.
2009). However, to date, the effect of social-sexual signals on spermatogenic cellular
function in the ram testis has not been studied.
2.2.3 Stress and temperament
Stress affects the secretion of GnRH and gonadotrophins by activating the
hypothalamic-pituitary-adrenal axis, and also impacts on the reproductive axis, mainly
at the level of hypothalamus and pituitary gland (Dobson et al. 1999; Breen et al. 2007;
Hawken et al. 2013). Some previous studies demonstrated that stress had inhibitory
effects on reproduction. For instance, LH secretion is reduced in gonadectomised rams
and ewes that have been isolated and restrained for 3-4h (Matteri et al. 1984). At the
level of the testis, studies in mice have demonstrated that heat stress induces germ cell
apoptosis (Yin et al. 1997; Paul et al. 2009) and that chronic restraint stress decreases
testosterone secretion, an effect that is associated with a decrease in plasma
gonadotropin levels (Lopez-Calderon et al. 1991).
In terms of the relationship between temperament and reproduction, there are reports in
humans, for instance, that high self-confidence, extraversion, and social assertiveness
correspond negatively with male fertility parameters (Hellhammer et al. 1985; Conrad
et al. 2002). However, there are very few studies in sheep, although one interesting
study reported that the least docile rams had higher reproductive success early in life
whereas, at the other extreme, most docile rams attained higher reproductive success
later in life (Reale et al. 2009).

Chapter 2-Literature Review
30
Importantly, stress and temperament are not independent of each other because
temperament can modify the responsiveness of an animal to some stressors (Gutteling et
al. 2005). For example, isolation decreases LH secretion in nervous sheep but not in
calm sheep (Hawken et al. 2013) suggesting that animals of calm temperament will
have less reproductive problems when confronted by a stressor.
As with social-sexual signals, the studies of stress and temperament on male
reproduction have not touched the details in the change of testis function, an area for
future study.
2.2.4 Nutrition
The availability of food must be the most important role among all the environment
factors that influence male reproduction (Blache et al. 2003), It is widely accepted that
there is strong and direct relationship between plane of nutrition, testicular mass and the
number of sperm available for ejaculation, for the small ruminants at least. Therefore, in
this review, I will discuss the effect of nutrition in more detail, but with a focus on the
sexually mature ram.
a. The effect of nutrition on testis mass and sperm production
The relationships among nutrition, testis mass and sperm production have been well
documented in rams, bulls and goats (Mori 1959; Moule 1963; Hiroe and Tomizuka
1965; Walkden-Brown et al. 1994a). In sheep, the production of sperm has been shown
to be responsive to nutrition in a number of studies using a variety of techniques
(Salamon 1964; Setchell et al. 1965; Braden et al. 1974; Cameron et al. 1988).
Changing nutrition alters not only testis size, but also the spermatogenic efficiency of
testicular tissue, as evidenced by the observation that changes in sperm production are
relatively greater than the changes in testicular mass. For example, in one study, a 25%

Chapter 2-Literature Review
31
increase in testicular size led to an 81% increase in production of sperm (Oldham et al.
1978) and, in another study, an 86% increase in testicular size led to a 250% increase in
production of sperm (Fig.2.2; Cameron et al. 1988). Moreover, it took at least 7 weeks
of nutritional treatment to affect the number of ejaculated sperm (Parker and Thwaites
1972), suggesting that spermatogenic efficiency is affected after the last spermatogonial
division.
b. The effect of nutrition on sperm quality
Compared with the change in sperm production, the studies on the effects of nutrition
on semen and sperm cell quality are scarce. However, some early work demonstrated
the effects of nutrition on the classical measures of semen and sperm quality in both
sheep and goats (Mori 1959; Salamon 1964; Tilton et al. 1964; Hiroe and Tomizuka
1965; Parker and Thwaites 1972). For example, Parker and Thwaites (1972) showed
that sperm count and motility are reduced if under-nutrition lasts longer than 7 weeks.
In Ethiopian highland sheep, these effects can be reversed by dietary supplementation
(Dana et al. 2000; Tufarelli et al. 2011) and, in Sardinian rams, feeding concentrates
results in a greater semen volume and sperm concentration, and lower numbers of
abnormal sperm (Tufarelli et al. 2011). By contrast, in mature Assaf rams, sperm
motility and percentage of live and abnormal cells were not affected by diet (Fernandez
et al. 2004). All these studies were restricted to traditional variables such as sperm
concentration, viability, morphology and subjective motility, and inaccuracy and
imprecision in the techniques might explain the disagreements. There is a clear need to
confirm the effects of nutrition on sperm quality with modern, objective, precise
techniques for semen assessment.
c. The effect of nutrition on testis morphology

Chapter 2-Literature Review
32
Gross histological studies have shown that nutrition markedly affects the diameter of
the seminiferous tubules, the relative proportion of testis occupied by the seminiferous
tubules, and the proportion of the seminiferous tubule occupied by the seminiferous
epithelium, the relative proportion of interstitial tissue and total volume of Leydig cells
and tubule length (Hötzel et al. 1998), as shown in Table 2.1. The number of Leydig
cells per testis was not affected by diet, but the total volume of Leydig cells was,
indicating changes in the volume of individual cells. Due to the direct relationship
between Leydig cells and testosterone secretion, therefore, an effect of diet on
testosterone secretion and the peripheral concentrations of testosterone might be
expected, and this is an important consideration because testosterone plays a major role
in spermatogenesis. However, initial studies disagreed in terms of the outcome – for
example, the early study showed a significant effect on testosterone secretion (Setchell
et al. 1965) but recent work showed that nutritional treatments were not associated with
changes in the amplitude of testosterone response to LH (Martin et al. 1994). The
disagreement could due to differences between genotype, age, or methodology, the most
likely explanation is the severity of the nutritional treatments (Hötzel et al. 1998).

Chapter 2-Literature Review
33
Table 2.1. Morphometric analysis of the testicular tissue from mature Merino rams (n = 5 per group) fed
a supra-maintenance (high) or a sub-maintenance (low) diet for 69 days (Hötzel et al. 1998). * P < 0.05
Variable High diet Low diet
Body weight (kg) 79 ± 3 48 ± 4*
Mean testis weight (g) 288 ± 14 117 ± 10*
Tubule diameter (µm) 229 ± 6 167 ± 12*
Lumen diameter (µm) 69 ± 3 66 ± 7
Tubule length (m) 3503 ± 104 2378 ± 329*
Leydig cells (x108) per testis 75 ± 8 60 ± 11
Sertoli cells (x108) per testis 120 ± 5 77 ± 6.7*
d. The effect of nutrition on Sertoli cell number
Sertoli cells provide nutritional and structural support for germ cells and each Sertoli
cell has a fixed capacity for the number of germ cells it can support (Sharpe et al. 2003),
so changes in production of sperm may result from alterations in Sertoli cell number.
Unfortunately, very few studies have addressed this question. For instance, the Sertoli
cell numbers appeared to increase in ram lambs fed a nutritional supplement (Bielli et al.
2001), and low maternal nutrition during pregnancy reduced the number of Sertoli cells
in the newborn male lamb (Alejandro et al. 2002). These two studies were both
restricted to sexually immature animals and, so far, there has been only one
comprehensive study investigating whether nutrition associated with Sertoli cell number
in adult rams (Table 2.1; Hötzel et al. 1998). In this study, total volume of Sertoli cell
nucleus and Sertoli cell number per testis were both higher in well-fed adult Merino
sheep than in underfed animals. This finding makes sense when considering the higher
sperm production in well-fed sheep, but it contradicts the dogma that Sertoli cells stop
proliferating at puberty, leaving the number fixed during adult life (Kluin et al. 1984;

Chapter 2-Literature Review
34
Monet-Kuntz et al. 1984; Hochereau-de Reviers et al. 1987). This problem could be
dismissed as histological artefact, so there is a clear need to again test whether nutrition
affects Sertoli cell number in the sexually mature male sheep using modern
stereological techniques. Even if the number of Sertoli cells is stable after puberty, it is
possible that a few Sertoli cells retain proliferative ability, but perhaps too few to
change the total number. Clearly, we need to use modern techniques for assessing
proliferative ability if we want to obtain a definitive answer.
e. The effect of nutrition on Sertoli cell function
At around the onset of puberty, Sertoli cells undergo radical changes as they switch
from an immature, proliferative state to a mature, non-proliferative state. Adjacent
Sertoli cells form tight junctions with each other to create a unique adluminal
compartment within which the meiotic and post-meiotic steps of spermatogenesis can
proceed, as well as allowing formation of a fluid-filled lumen. As a result, the germ cells
developing in the adluminal compartment become effectively sealed off from direct
access to many nutrients, so the mature Sertoli cell take on new functions which are
lacking in fetal, proliferating Sertoli cells (McLaren et al. 1993). Studies on the effects
of nutrition on Sertoli cell function are very rare. Peripheral inhibin concentration was
used to reflect the function of Sertoli cells but nutrition treatment did not affect inhibin
concentration (Martin et al. 1994) despite changes in the plasma concentration of FSH
(Hötzel et al. 1998). These observations have become difficult to interpret now that we
know that we were probably measuring inhibin B; it was subsequently reported that
sheep testes produce and secrete only inhibin A (McNeilly et al. 2002). However,
effects of nutrition on other important aspects of Sertoli cell function have not been
investigated, such as the change of Sertoli cell-specific gene expression.

Chapter 2-Literature Review
35
2.3 Small RNAs affect spermatogenesis and germ cell apoptosis in testis
Small RNA molecules have recently emerged as potent regulators of gene expression at
the post-transcriptional or translational level. They have diverse biological functions in
the regulation of transcription, RNA stability, and translation (Plasterk 2006). There are
three major categories of small RNA: small interfering RNA (siRNA); microRNA
(miRNA); and piwi-interacting RNA (piRNA).
2.3.1 Small RNA categories
a. Small interfering RNA (siRNA)
The siRNA is a small (~21 nucleotides (nt)) double-stranded RNA (dsRNA) that has
been used in ‘RNA interference’ (RNAi) to block the expression of a gene of interest
(review: He et al. 2009). The technique is seen as an alternative to knocking out genes
in mice because it is less laborious and more economical.
b. microRNAs (miRNAs)
Micro RNAs (miRNAs) contain approximately 22 nucleotides in single-strand non-
coding molecules that bind to target messenger RNAs (mRNAs) and thus inhibit their
expression. MiRNAs were first discovered in 1993 in Caenorhabditis elegans and were
found to regulate the expression of complementary mRNA (Lee et al. 1993; Wightman
et al. 1993). In 2001, miRNAs were also identified in mammals (Lagos-Quintana et al.
2001). miRNAs are highly conserved across species, and importantly, miRNAs appear
to regulate up to 30% of all genes in the human genome (Lewis et al. 2005).
The biogenesis of miRNAs is a multi-step process. Usually, miRNA genes are first
transcribed to primary transcripts (pri-miRNA) by RNA Polymerase II (Kim et al.
2009). Pri-miRNA form specific stem loop structures that undergo cleavage in the
nucleus by the ribonuclease, RNase Drosha, to form isolated hairpin loops (pre-miRNA)
Chapter 2-Literature Review
36
(Kim et al. 2009), that are then transported into the cytoplasm via an exportin-5-
dependent mechanism (Yi et al. 2003). In the cytoplasm, the RNase III enzyme (the
Dicer) catalyses the pre-miRNA to form double-stranded miRNAs (Hutvagner et al.
2001). Normally, one strand of the miRNA is loaded into the effector miRNA-induced
silencing complex (miRISC); however, recently, it was reported that the complementary
strand can also be loaded (Mah et al. 2010). The miRISC complex, comprising
Argonaute (AGO) proteins, mediates the post-translational regulation of the mRNA
targets of the loaded miRNA (Shomron and Levy 2009). Most commonly, miRNAs
bind to target sequences in the 3’ untranslated region (3’UTR) of mRNA, but it has
been reported that miRNA could also bind to the 5’ untranslated region (5’UTR) and
open reading frame of a subset of the target mRNA (Moretti et al. 2010). The seed
region, nucleotides 2–7 on the miRNAs, is the most influential factor for target binding
(Bartel 2009). Thousands of miRNAs have been discovered: 2588 in the human and
1915 in the mouse (miRBase Release 21.0, as of June, 2014,
http://www.mirbase.org/index.shtml).
c. piwi-interacting RNA (piRNA)
This newly identified class of small RNAs that are slightly longer (26–32 nt) than
miRNAs and siRNAs. They bind to ‘PIWI’, a spermatogenesis-specific protein
belonging to the Argonaute protein family (Aravin et al. 2006; Girard et al. 2006). The
synthesis of piRNAs is not clear yet, although the “ping pong” mechanism has been
suggested (Liu et al. 2012a). They are distinct from the siRNAs or miRNAs in that they
are 24–30 nt in length and are expressed predominantly in the germline of a variety of
organisms (Klattenhoff and Theurkauf 2008). They are essential for germ cell
maintenance and spermatogenesis in Drosophila and mammals (Thomson and Lin
2009), and so are of interest in our quest to understand the effects of nutrition on
spermatogenesis.

Chapter 2-Literature Review
37
2.3.2 miRNAs and spermatogenesis
During spermatogenesis, the spatial and temporal regulation of gene expression is of
vital importance, and translation is periodically silenced in germ cells by miRNAs
(Papaioannou and Nef 2010). The importance of miRNAs for spermatogenesis is
indicated by, for example, the infertility in male mice that follows removal of Dicer1, a
gene necessary for the synthesis of miRNAs (Maatouk et al. 2008). Specifically, in
Dicer1 knock-out mice, only a few tubules contain elongating spermatids and the germ
cells which did differentiate to elongating spermatids exhibited abnormal morphology
and motility. Similar findings were reported in human as well (Hayashi et al. 2008).
Although the functions of miRNAs in the development of male germ cells are still
largely unclear, expression profiling studies have identified a number of miRNAs that
seem to be particularly important in the mammalian testis. For instance, miR-17 and
miR-290 are important for the proliferation of primordial germ cells and spermatogonia
(Hayashi et al. 2008), and miR-122a, could be involved in the posttranscriptional
regulation of mRNAs such as transition protein 2 (Yu et al. 2005).
2.3.3 miRNAs and germ cell apoptosis
Three miRNAs (miR-15 miR-16 and miR-31) are able to induce apoptosis by targeting
the major anti-apoptotic factor, BCL2 (Cimmino et al. 2005; Korner et al. 2013). In
recent years, it has also become clear that apoptosis in male germ cells also involve
regulation by miRNAs. For example, miR-34c was detected in mouse pachytene
spermatocytes and highly expressed in spermatids, and when it was silenced, the Bcl-
2/Bax ratio increased, preventing the induction of germ cell apoptosis by testosterone
deprivation (Liang et al. 2012). In another study, transient inhibition of miR-21 in
spermatogonial stem cell-enriched germ cell cultures increased the number of germ
Chapter 2-Literature Review
38
cells undergoing apoptosis (Niu et al. 2011). Clearly, miRNAs could play a major role
in germ cell apoptosis in the shrinking testis of underfed rams.
2.3.4 piRNAs affect spermatogenesis
A role for piRNAs in spermatogenesis is primarily supported by the known functions of
their partners, the Piwi proteins, including MIWI, MIWI2 and MILI, that are known to
be necessary for stem cell self-renewal and the development of male germ cells (Cox et
al. 1998). In Mili-knockout mice, spermatogenesis is disordered at the pachytene
spermatocyte stage (Kuramochi-Miyagawa et al. 2004) and, in Miwi-deficient mice, no
elongated spermatids or mature sperm are observed (Deng and Lin 2002). In addition,
small non-coding RNAs, Nct1 and Nct2, have been reported to be piRNA precursors
and they are expressed predominantly in pachytene spermatocytes in mice (Xu et al.
2008). However, unlike miRNAs, piRNAs are not conserved among species, so might
not be expressed in male germ cells in all mammals. Therefore the functions of piRNAs
in different species require further study, for which the male sheep fed high and low
levels of nutrition is an attractive experimental paradigm.
2.4 Alternative pre-mRNAs splicing affects spermatogenesis and apoptosis
Alternative pre-mRNA splicing (AS) is an important mechanism for regulating gene
expression and for increasing transcriptome plasticity and proteome diversity. It has
been reported that approximately 60% of human gene products undergo alternative
splicing (Modrek and Lee 2002).
The complicated process of generating alternative splicing has been reviewed in detail
(Schwerk and Schulze-Osthoff 2005), so will be addressed only briefly here. In a typical
multiexon mRNA, the splicing pattern can be altered in many ways and, to date, eight
types have been reported. The most common pattern is a cassette exon that can be

Chapter 2-Literature Review
39
included in the mRNA or skipped, inserting or deleting a portion of internal sequence
(Gurskaya et al. 2012). Two special cases of paired-cassette exons are mutually
exclusive splicing (only one exon is included) and coordinate cassette exons (both
exons are included). The fourth and fifth patterns are alternative 5' or 3' splice sites, in
which exons can be extended or shortened in length (Fu et al. 1992). The sixth pattern is
alternative first exon, in which transcriptional initiation at different promoters generates
alternative 5'-terminal exons that can be joined to a common 3' exon downstream
(Mironov et al. 1999). Similarly, for the seventh pattern, alternative last exons, with
alternative polyadenylation sites, can be joined to a common upstream exon (Wang et al.
2008). Finally, we have intron retention to leave the retained intronic sequence in the
mRNA (Galante et al. 2004).
2.4.1 Alternative pre-mRNA splicing and spermatogenesis
It has been reported that spermatogenesis is regulated by alternative pre-mRNA splicing
that generates multiple transcript species from a common mRNA precursor. For
example, some specific CREB mRNA isoforms generated by alternative splicing are
expressed at a high level in the adult testis, and these isoforms are expressed after
spermatogenesis has started (Ruppert et al. 1992). In addition, transcripts from several
testis-specific genes that regulate gene expression are themselves alternatively spliced.
For instance, a testis-specific splice of the Sry-related transcription factor, Sox17, which
lacks the exon containing a single high mobility group box near the NH2-terminus,
replaces the normal message during male meiosis, and results in an inactive N-terminal
truncation that lacks the DNA-binding domain in spermatids (Kanai et al. 1996).
Another example is prolactin receptor, a pivotal factor for spermatogenesis in the mouse
– one of its isoform lacks two exons and leads to a down-regulation of the expression of
the full length prolactin receptor, with the potential for explaining the role of prolactin

Chapter 2-Literature Review
40
in the annual cycles of testis growth in seasonal breeders such as red deer (Jabbour et al.
1998). These examples are probably the tip of an iceberg, and we expect many more
candidates to be discovered experimentally by, for example, knock-out of testis-specific
splicing factors (Feng et al. 2002).
To date, the effect of environmental factors, such as nutrition, on alternative splicing
within the testis has not been studied and, again, the male sheep fed high and low levels
of nutrition is an attractive experimental paradigm.
2.4.2 Alternative pre-mRNA splicing and apoptosis
Alternative splicing also plays a major role in the control of apoptosis, as evidenced by
its effects on the expression of a huge number of proteins directly involved in the
apoptotic pathways. Moreover, the proteins belonging to each family of apoptotic
factors are alternatively spliced and, normally, the different isoforms produced in this
process have distinct and even opposing functions during apoptosis. For example, by
alternative splicing, C. elegans CED-4 is expressed in two isoforms, CED-4L and CED-
4S, that have opposite functions during apoptosis. Interestingly, splice site mutations in
CED-4 lead to increased expression of anti-apoptotic CED-4L (Shaham and Horvitz
1996). In addition, alternative splicing inhibits apoptosis by removing the intracellular
domain and part of the extracellular domain from FasL (Ayroldi et al. 1999). To date,
there have been no studies of the role of alternative splicing apoptosis in the adult testis.
Although the above findings indicate strong relationships between alternative splicing
and apoptosis, the understanding of this process is in still at the early stage. To gain a
fuller understanding, it would be worthwhile to explore alternative splicing events on a
large scale. This task has become feasible with the recent developments in gene
expression profiling such as microarrays and RNA-Seq.

Chapter 2-Literature Review
41
2.5 Conclusions and hypotheses
This literature review has highlighted the external factors that control male sheep
reproduction with particular emphasis on nutrition. Alterations in the plane of nutrition
result in changes in testis size and gross histology, and sperm production. Sertoli cell
number might also be affected, but the concept is controversial so needs verification
with alternative methods. More importantly, we do not know how sperm quality and
Sertoli cell function are affected by nutrition, and we have little idea of the molecular
mechanisms involved.
The general hypothesis tested in this thesis is that, in the sexually mature male sheep,
nutrition will affect sperm quality, due to germ cell apoptosis, that these responses will
be explained by changes in Sertoli cell function, and that effects are mediated by
changes in the expression of small RNAs and alternative pre-mRNA splicing. My PhD
project therefore focused on the effects of nutrition on sperm quality and testis function
in adult Merino rams and pursued the following main aims: 1) To measure sperm
quality, including sperm motility, sperm DNA damage, sperm viability, sperm
morphology, and germ cell apoptosis; 2) To examine number and function of Sertoli
cells; 3) To investigate the expression of small RNAs, especially miRNAs and piRNAs,
and their possible roles in spermatogenesis and apoptosis; 4) To investigate the
functional relationships between miRNAs and mRNAs; 5) To explore the functions of
alternative pre-mRNA splicing in spermatogenesis and apoptosis.

Chapter 3-General Materials and Methods
42
Chapter 3
General Materials and Methods
3.1 Experimental location
The animal experiment was conducted in the animal house at CSIRO Floreat, Perth,
Western Australia. Perth is located at latitude 31°56’S, longitude 115°E and has a
Mediterranean climate with mild winters and hot, dry summers. Natural day-length
(sunrise to sunset) ranges from 10 h during winter to 14 h during summer. The animals
were kept in individual pens under natural lighting, for 3.5 months, starting in early
May. This is after the end of the breeding season for Merino sheep, but sexually mature
rams of this genotype can respond to nutritional inputs year-round (Martin et al. 2004).
3.2 Experimental animals
Sexually mature Merino rams (n = 24) were obtained from Allandale Farm (UWA).
They were 24 months old, weighed 65.7 ± 4.7 kg and had a scrotal circumference of
31.8 ± 2.5 cm. They were selected from the ‘Allandale Temperament Flock’, sheep that
had been selected for over 18 generations for high and low reactivity to humans and to
isolation (Bickell et al. 2009). To avoid any confounding effects of genetic background,
the treatments used in the current study were balanced for temperament.
3.3 Nutrition treatment
During a 3-week acclimatization period, all rams were fed daily with 750 g oaten chaff
(8.4% crude protein; 8.0 MJ/Kg metabolisable energy) and 200 g lupin grain (35.8%
crude protein; 13.0 MJ/Kg metabolisable energy). Quantitative details of the dietary
components and descriptions of the endocrine responses can be seen in the report by

Chapter 3-General Materials and Methods
43
(Boukhliq et al. 1997). The rams were then allocated among three dietary treatments
(high, maintenance, low) with the groups balanced for training success to semen
collection (see below), body mass, scrotal circumference, temperament, polled or
horned, and sperm quality. Animals fed to maintenance requirements were expected to
maintain constant body mass. The high diet was designed to allow the animals to gain
10% live weight over 65 days whereas the low diet was designed to allow 10% loss in
weight. At the start of the treatment period, individual daily allowance was 1.2 kg oaten
chaff plus 0.3 kg lupin grain for the rams in the high-diet group, 0.7 kg chaff and 0.18
kg lupin grain for the maintenance group, and 0.51 kg chaff and 0.13 kg lupin grain for
the low-diet group. Every week, the animals were weighed and the amount of feed
offered to each individual was adjusted to ensure achievement of target live weight. In
Chapters 4 and 5, sheep fed with all three diets were included in the analysis to obtain
the baseline data. However, in Chapters 6 and 7, assessment was only performed in
underfed sheep and well-fed sheep for two reasons: 1) the two extreme groups (high diet
and low diet) offered the opportunity of comparing testes that were shrinking and
growing, the thrust of our hypotheses; 2) we have limited resources, so needed to make
strategic decisions about which measurements would allow the greatest gains in
understanding.
3.4 Body mass and scrotal circumference
Body mass was measured once every week before feeding. Scrotal circumference was
measured every week with a tape measure at the point of maximum diameter when the
skin of the scrotum was stretched taut around both testes.
Chapter 3-General Materials and Methods
44
3.5 Semen collection and processing
Attempts were made to train all rams for semen collection with an artificial vagina and a
teaser ewe (Wulster-Radcliffe et al. 2001) and, by the end of the acclimatization period,
training was successful for 18 rams. Semen collected on Day 56 and Day 63 was
immediately immersed in a 37°C water bath. Within 20 min of collection, all samples
were analyzed for sperm concentration, semen volume, sperm motility, sperm viability
and morphology, as described below. A portion of each sample was quickly transferred
to 200 μl straws, labeled and plunged into liquid nitrogen to await DNA fragmentation
analysis.
3.6 Semen analysis
3.6.1 Ejaculate quality
Semen volume was measured with an automatic pipette by carefully drawing the entire
ejaculate into a tip and reading the volume. The sperm concentration was determined by
spectrophotometer (8001 UV-vis Metertech, Inc., Taipei Taiwan). We followed the
protocol described by (Prathalingam et al. 2006): 20 μl semen was diluted 1: 400 (v/v)
with a mixture of phosphate-buffered saline (PBS) and formalin and the suspension was
placed in a spectrophotometer for measurement of absorbance at 580 nm. Sperm
concentration was determined by reference to a standard curve that had been developed
for ram sperm. The total number of sperm per ejaculate was estimated by multiplying
ejaculate volume (ml) by the concentration of sperm (109/ml).
3.6.2 Sperm morphology and viability
Sperm morphology and viability were evaluated after eosin-nigrosin staining (Bjorndahl
et al. 2003): 3 μl semen was mixed with 27 μl eosin-nigrosin mixture, and 5 μl of the
mixture was transferred to a labeled glass microscope slide and smeared using another

Chapter 3-General Materials and Methods
45
slide. Two smears were made for each sample. At least 300 sperm per slide were
counted on each of the 2 slides using an oil immersion objective on an Olympus BX60
microscope (Olympus, Australia Pty, Ltd., Mt Waverley, VIC, Australia). The
percentages of live, dead, morphologically normal and abnormal sperm were calculated.
3.6.3 Computer-assisted semen analysis (CASA)
An aliquot (5.5 μl) of sperm suspension was diluted to 20 x 106 sperm/mL with motility
buffer (8 g/L sodium chloride, 0.1% bovine serum albumen, adjusted to pH 8.2 with 1.0
M NaOH) at 37°C, and 5 μl of the mixture was placed in a 20 μm sperm motility slide
chamber (Leja, Nieuw-Vennep, Netherlands). A video image was recorded using a
Basler A602fc digital camera (Basler AG, Ahrensburg, Germany) mounted on Olympus
BX53 microscope (Olympus Optical Co., Australia) equipped with phase contrast optics
and a motorized heated stage (Prior Optiscan II, Prior Scientific Intl.). In each sample,
500-600 sperm were evaluated. The percentages of motile and progressively motile
sperm and straight-line velocity (VSL), curvilinear velocity (VCL) and average path
velocity (VAP) were estimated using CASA software (SCA®, Microptics, V5, SL,
Spain). Sperm with VCL greater than 10 µm/sec were considered motile and sperm with
STR (VCL/VAP x 100) greater than 80% were classified as progressive.
3.6.4 Sperm chromatin structure assay (SCSA)
We followed the protocol described by (Evenson et al. 1999). In brief: frozen aliquots
of semen were placed in a 37°C water bath until just thawed and then diluted to 1-2 x
106 sperm cells per ml with TNE buffer (0.15 M NaCl, 0.01 M Tris-HCl, 0.001 M
disodium EDTA, pH 7.4, 10% glycerol). Aliquots (200 µl) were then mixed with 400 µl
acid-detergent solution (0.08 M HCl, 0.15 M NaCl, 0.1% Triton X-100, pH 1.2). After
30 s, the cells were stained with 1.2 ml acridine orange (AO) solution containing 6 mg
Chapter 3-General Materials and Methods
46
AO (Cat. # 04539, Polysciences Inc., Warrington, PA, USA) per ml buffer (0.037 M
citric acid, 0.126 M Na2HPO4, 0.0011 M di-sodium EDTA, 0.15 M NaCl, pH 6.0).
Fluorescence was then measured on 5000 cells per sample by FACSCalibur (Becton
Dickinson, Franklin Lakes, NJ, USA) with an excitation wavelength of 488 nm. AO
bound to double-stranded DNA emits a green signal, collected using a 530/30 nm BP
filter, while AO bound to fragmented, single-stranded DNA emits a red signal, collected
using a 670 nm LP filter. Sperm cells were identified and debris excluded using
characteristic forward and side laser scatter. The percentage DNA fragmentation index
(%DFI = the percentage of cells outside the main sperm population) was calculated
using FlowJo v7.6 software (Tree Star, Inc. USA).
3.7 Tissue collection and preservation
After 65 days, all male sheep were killed with intravenous overdose of sodium
pentobarbitone, and the testes were immediately removed, dissected and weighed. Three
samples were chosen from top, middle and bottom parts of both testes; those from the
right testis were snap-frozen in liquid nitrogen and stored at –80°C for total RNA
preparation; those from the left testis were washed by 0.9% saline and then fixed by 4%
paraformaldehyde for 6 h, then dehydrated and processed for routine embedding in
paraffin wax for histological analysis (Francavilla et al. 2000).
3.8 Sperm concentration in testicular tissue
A sample of tissue (10 g) from the left testis was excised, weighed accurately, and
homogenized in 100 ml of equal volumes 0.9% NaCl plus 0.1% TritonX-100. The
sperm number per gram of testicular tissue was determined using a haemocytometer and
a phase contrast microscope (Olympus BX60, Olympus, Australia).
3.9 Morphometric and histological analysis

Chapter 3-General Materials and Methods
47
We used an Olympus BX50 microscope coupled with a digital imaging system (DP2-
BSW) to assess 5 µm paraffin sections. Images of cells and structures were displayed on
a high-resolution colour monitor and were traced using a computerized mouse. Fields
were selected using a systematic random approach. All slides were masked to avoid
personal bias.
3.9.1 Analysis of testicular compartments
Sections were stained with Periodic Acid Schiff (PAS) reagent. The point-counting
method was used to determine the volume fraction of each structure: the number of
points landing on each structure divided by the number of the points hitting the entire
testis (Meachem et al. 1996). The total volume of each structure per testis was
determined from the product of the volume fraction and testicular volume.
Tubule and lumen diameter were estimated for 30-40 tubules per animal, ensuring the
standard error was <10% within each animal. For elliptical profiles, the short axis of the
ellipse was measured. The length of the tubule as calculated as the absolute volume of
tubules per unit area of tubule cross-section (calculated from the estimated tubule
diameter), assuming a cylindrical model. No correction factor for shrinkage or swelling
was applied.
Sertoli cells were identified by positive GATA4 reactivity (McCoard et al. 2003), as
described below. Sertoli cell nuclear volume was measured using the longest and
shortest diameters of the nucleus at magnification of 1000, with the aid of ImageJ
software (Schneider et al. 2012). For each animal, measurements were made on 12
cross-sections of tubules from the top, middle and bottom of the testis (ie, 36 tubules per
animal), and on at least 300 Sertoli cell nuclei, to ensure that the standard error was
<10% within each animal. The volume fraction of Sertoli cell nuclei was determined by

Chapter 3-General Materials and Methods
48
the point-counting method as described above. Mean nucleus volume was calculated
using the formula for a prolate spheroid (4/3 πab2, where a = longest radius and b =
shortest radius) (McCoard et al. 2001). The total number of Sertoli cells per testis was
estimated by dividing the absolute volume of Sertoli cell nuclei per testis by the mean
volume of Sertoli cell nucleus (Wreford 1995).
3.9.2 Immunohistochemistry
Immunoreactivity for GATA4, Claudin11 and PCNA was detected, as described before
(Tarulli et al. 2006), 5 µm sections (two adjacent serial sections from male sheep for
GATA4 and PCNA). Three sections per testis were de-waxed in xylene (twice for 3
min) and 100% ethanol (twice for 3 min) and then rehydrated through graded
concentrations of ethanol (90%, 75% and 50%) to deionized water. Antigen retrieval
was then performed by immersing sections in 600 ml 1 mM EDTA-NaOH (pH 8.0) and
heated in an 800-W microwave oven set on high for 5 min and medium for 5 min and
cooled for 1 h in EDTA buffer. After washing with 0.01 M phosphate-buffered saline
(PBS), sections were blocked in 0.3% H2O2 at 37°C for 1 h. Sections were then blocked
in Avidin, Biotin (SP-2001, Vector Laboratories), CAS-Block (Invitrogen, Australia)
with 10% normal goat serum (Vector Laboratories, California, USA), for 20 min each at
room temperature, with a PBS wash between each treatment. Rabbit antibodies to
GATA4, PCNA and Claudin11 (1 µg ml-1, Santa Cruz Biotechnology, Texas, USA)
were then applied for 2 h. The specificity of the primary antibodies was verified by
incubating sections in normal rabbit IgG (1 µg ml-1; Santa Cruz Biotechnology, Texas,
USA). After washing with PBS, the samples were treated with goat anti-rabbit second
antibody for 1 h, followed by application of ABC reagent (Vector Laboratories,
California, USA) (1 drop of A + 1 drop of B in 1ml PBS), then DAB (DAKO,
Australia) for 5 min. The sections were then washed with deionized water for 3 min,

Chapter 3-General Materials and Methods
49
counterstained with Mayer’s haemotoxylin (Vendor, Australia) for 2 min, and
dehydrated through graded concentrations of ethanol (50%, 75%, 90%, 100%), and
briefly immersed in xylene. Sections were mounted in Entellan (Merck, Australia)
under 50 mm coverslips (HD Scientific, Australia). To detect Sertoli cells that can
proliferate, the same tubules were located in the serial sections used for GATA4 and
PCNA staining, and cells with double staining were counted in 30 tubule cross-sections
for each animal.
3.9.3 Immunofluorescence
To verify the result of double-staining for GATA4 and PCNA, immunofluorescence
was performed using a protocol adapted from (Tarulli et al. 2006). The primary
antibodies were polyclonal rabbit anti-GATA4 (1 µg ml-1; catalogue number sc-9053,
Santa Cruz Biotechnology, Texas, USA), and monoclonal mouse anti-proliferating cell
nuclear antigen clone pc10 (1 µg ml-1, catalog no. M0879, DAKO, Sydney, Australia).
The primary antibodies were replaced by PBS as a negative control (Anttonen et al.
2003; Salonen et al. 2010). Secondary antibodies used were goat anti-rabbit Alexa 488
(10 µg ml-1, catalog no. A-11034, Molecular Probes) and goat anti-mouse Alexa 546
(10 µg ml-1, catalog no. A-11030, Molecular Probes). In addition, Hoechst 33342
(Invitrogen, Australia) was used as a nuclear stain.
3.9.4 Evaluation of apoptosis
For terminal deoxynucleotidyl transferase mediated dUTP nick-end labeling (TUNEL),
we followed the instructions of the ApopTag plus peroxidase in situ Apoptosis
Detection Kit (Chemicon International, USA). Briefly, deparaffinized tissue sections
(top part of left testes) were incubated with proteinase K (20µg/ml), subjected to 3%
H2O2 at 37°C for 30 min to inhibit endogenous peroxidase, and then incubated with
Chapter 3-General Materials and Methods
50
equilibration buffer at room temperature for 1 min. Each section was incubated with
TdT (terminal deoxynucleotidyl transferase) at 37°C for 1 h and then washed in
stop/wash buffer for 10 min. The sections were incubated in anti-Digoxigenin
Peroxidase Conjugate at room temperature for 30 min and were stained with
diaminobenzidine (DAB) as a peroxidase substrate. After counterstaining with methyl
green, numbers of TUNEL-positive cells per tubule were counted in 50 tubules per
animal with the aid of a light microscope. All counting procedures were performed
‘blindly’.
3.10 Molecular analysis
3.10.1 Isolation of RNA and reverse transcription
The trizol protocol was used to isolate total RNA (Hellani et al. 2000). The quality and
quantity of RNA were determined by Agilent 2100 Bioanalyzer (Agilent Technologies,
Santa Clara, CA) and Qubit 2.0 Fluorometer (Invitrogen, Carlsbad, CA) and only RNA
with an integrity number (RIN) > 7.0 was used for further analysis. High capacity RNA-
to-cDNA kits (Applied Biosystems, USA) were used to reverse-transcribe 2 µg RNA to
cDNA in a final volume of 20 µl, according to the manufacturer’s protocol. The absence
of contaminating genomic DNA in total RNA samples was confirmed using reactions in
which reverse transcriptase was omitted.
3.10.2 Quantitative real-time PCR
QPCR was performed using SYBR Green (Fast SYBR® Green Master Mix; Applied
Biosystems) to detect mRNA expression of target genes. Oligonucleotide primer
sequences for these genes were designed using NCBI primer blast
(http://www.ncbi.nlm.nih.gov/tools/primer-blast/index.cgi?LINK_LOC=BlastHome).
Fluorescence signal was detected with StepOnePlus™ Real-Time PCR System (Applied

Chapter 3-General Materials and Methods
51
Biosystems). In total, each reaction contained 10 μl Fast SYBR Green Master Mix
(Applied Biosystems), 1 μl of forward primer (20 pmol/μl), 1 μl of reverse primer (20
pmol/μl), 7 μl nuclease-free water, and 1 μl DNA template (50 ng/μl). Samples were
measured in triplicate using the following protocol: 95°C for 10 min for initial
denaturation and then 40 cycles of 95°C for 20 s, followed by annealing/extension for
30 s at 60°C. Analysis of melting curves was used to monitor PCR product purity.
Amplification of a single PCR product was confirmed by agarose gel electrophoresis
and DNA sequencing (data not shown).
3.10.3 Small RNA library sequencing
For each sample, 1.0 µg of total RNA was used to construct miRNA libraries with a
unique index using the TruSeq Small RNA Sample Preparation kit (Illumina, San
Diego, CA) by following the manufacturer’s instructions. PCR amplification was
performed for 11 cycles and gel purification was used to individually purify libraries
with unique indices. Quantitative real-time PCR (qRT-PCR) was performed for library
quantification using the StepOnePlus™ Real-Time PCR System (Applied Biosystems,
Carlsbad, CA) and KAPA SYBR Fast ABI Prism qPCR kit (Kapa Biosystems, Woburn,
MA). Individual libraries were then pooled for sequencing at Génome Québec
(Montréal, Canada) using the HiSeq 2000 system (Illumina) to generate 50 b single
reads. All the reads were de-multiplexed according to their index sequences using
CASAVA version 1.8 (Illumina) and reads that did not pass the Illumina chastity filter
were removed from the dataset. The small RNA sequencing reads with good quality
were subjected to 3’ adaptor sequence trimming, and all reads were mapped by blastn to
the non-coding RNA sequences (Rfam) to remove sequences belonging to tRNA,
snoRNA, rRNA, and other non-coding RNAs.
3.10.4 Construction and sequencing of the RNA-seq library

Chapter 3-General Materials and Methods
52
In each sample, total RNA (1.0 µg) was used to construct miRNA libraries with a
unique index, according to the instructions of the TruSeq Small RNA Sample
Preparation kit (Illumina, San Diego, CA). Quantitative real time PCR (qPCR) was
performed for library quantification using the StepOnePlus™ Real-Time PCR System
(Applied Biosystems, Carlsbad, CA) and KAPA SYBR Fast ABI Prism qPCR kit (Kapa
Biosystems, Woburn, MA). Individual libraries were then pooled for sequencing at
Génome Québec (Montréal, Canada) using the HiSeq 2000 system (Illumina).
Sequencing was performed as 100 bp paired-end reads. All reads were de-multiplexed
according to their index sequences with CASAVA version 1.8 (Illumina) and reads that
did not pass the Illumina chastity filter were discarded.
3.11 Bioinformatics analysis
3.11.1 Identification of miRNAs
The miRNAs were identified using the methods outlined by (Liang et al. 2014). Briefly,
known miRNAs were identified by mapping the filtered 18 to 25 nt sequences to
miRbase (miRBase release version 20), and all reads from 16 libraries were pooled to
predict novel miRNA using miRDeep2 based on the reference genome sequence of
OAR3.1 (http://www.livestockgenomics.csiro.au/). Small RNA sequences with a
miRDeep2 score higher than 5 and read numbers larger than 10 were defined as novel
miRNAs in sheep. The novel miRNA precursor sequences were then combined with the
known miRNA precursor sequences to form a new custom reference database.
Sequencing reads from different samples were mapped to the new custom reference
database to get the read number for the known and novel miRNAs for each sample.
Homologous miRNAs were identified with the method described by (Jin et al. 2014).

Chapter 3-General Materials and Methods
53
The conservation of known miRNAs was analyzed based on the definitions from
Targetscan (Lewis et al. 2003) for “highly conserved” (conserved across most
vertebrates), “conserved” (conserved across most mammals, but usually not beyond
placental mammals) and “poorly conserved” (not present in the above two groups). In
the present study, ovine-specific miRNAs were defined by using two criteria: 1) they
belong to a poorly conserved group; 2) their seed region sequences have only been
reported previously in sheep.
The genomic location of the miRNAs was searched for using the UCSC Genome
Browser (http://genome.ucsc.edu/) based on the reference genome sequence of OAR3.1
(http://www.livestockgenomics.csiro.au/). The miRNA genes are distributed across
chromosomes either individually, or in “clusters”, groups of miRNA genes located
within a short distance (10 Kb) on the same chromosome, based on the definition in the
miRBase database (http://www.mirbase.org). In the present study, all the known and
novel miRNAs were grouped into various clusters based on their genomic location.
3.11.2 piRNA characterization
To identify piRNAs, sequencing reads that ranged from 26 to 32 nt were mapped to the
ovine genome by Bowtie (version 1.0.1). Reads that could not be perfectly mapped to
the genome were discarded, and those remaining were de-duplicated to unique
sequences. The filtered unique reads were subjected to an online predictor
(http://59.79.168.90/piRNA/analysis.php) to predict piRNA candidates (Zhang et al.
2011). The genomic positions in the ovine genome of piRNA candidates were obtained
by Bowtie. piRNA candidates with multiple genomic locations may confuse the
derivation of piRNAs, so only piRNA candidates with a single location in the genome
were further analyzed. The piRNAs in each library were quantified by blastn and
customized perl scripts. All the sequencing data were deposited in the publicly available

Chapter 3-General Materials and Methods
54
NCBI’s Gene Expression Omnibus (GEO) Database
(http://www.ncbi.nlm.nih.gov/geo/).
3.11.3 Identification of differentially expressed (DE) mRNAs, miRNAs and piRNAs
The effects of nutritional treatment on the expression of mRNAs, miRNAs and piRNAs
were determined by analysis of differential expression (DE) using the bioinformatics
tool, edgeR (Robinson et al. 2010), which uses a negative binomial distribution to
model sequencing data. The expression of mRNAs, miRNAs and piRNAs in each
library was normalized to counts per million reads (CPM) by the following formula:
CPM = (number of mRNAs/miRNAs/piRNAs reads/total reads number per library) ×
1,000,000. mRNAs/miRNAs/piRNAs with CPM > 5 in at least 50% of the samples
were subjected to DE analysis. Fold change (FC) was defined as the ratio (low diet/high
diet) of the arithmetic means of CPM values. Significance of the differential expression
of mRNAs, miRNAs and piRNAs was determined by false discovery rate (FDR) < 0.05
based on Benjamini and Hochberg multiple-testing correction (Benjamini et al. 2001) as
well as FC > 1.5 (McCarthy and Smyth 2009).
3.11.4 Validation of miRNA expression using stem-loop qRT-PCR
The TAQMAN miRNA assay was used to validate miRNA expression following the
manufacturer’s recommendation (Applied Biosystems, USA). In brief, cDNAs were
reverse transcribed from 10 ng total RNA, using 5 X specific miRNA RT primer, and
then amplified using a 20 X TAQMAN miRNA assay. StepOnePlus™ Real-Time PCR
System (Applied Biosystems) was used to detect the fluorescence signal. miRNAs with
cycle threshold (Ct) > 35 were considered as having not been expressed. In this study,
U6 snRNA was used as an internal control (Liu et al. 2013) and three biological
replicates were performed. The 2-ΔΔCt method was used to analyze the expression level

Chapter 3-General Materials and Methods
55
and all statistical analyses were carried out using SPSS software (Version 20). One-way
ANOVA was used to compare the groups, and P < 0.05 was considered significant.
Data are expressed as Mean ± SEM.
3.11.5 miRNA target prediction and functional analysis
TargetScan Release 6.0 (http://www.targetscan.org/) (Liu et al. 2012b) and miRanda
(http://www.microrna.org/microrna/home.do) (Birney et al. 2006) were used to predict
the target genes for selected miRNAs. The 3'UTR sequences of genes from sheep were
obtained from Ensembl Gene 75 Ovis aries genes (Oar_v3.1)
(http://uswest.ensembl.org/). The target genes predicted by both TargetScan (default
parameters; Bao et al. 2013) and miRanda (Total score >= 145, Total energy <=- 10;
Bao et al. 2014) for each miRNA were further analyzed through ingenuity pathway
analysis (IPA; Ingenuity Systems, www.ingenuity.com). The significance of the
predicted function in IPAs was determined using a corrected P value calculated by the
Benjamini-Hochberg method (FDR: Benjamini et al. 2001). Threshold FDR < 0.05 and
molecule number > 2 were used to enrich significant biological functions for each
miRNA.
3.11.6 miRNA target validation using dual luciferase reporter assay
The entire 3’UTR of target genes was amplified from sheep genomic DNA by PCR.
The details of each primer can be found in Chapter 6. Both PCR products were cloned
into the pmirGLO Dual-Luciferase miRNA Target Expression Vector (Promega) using
the Xho1 and Sal1 restriction sites.
A sheep fetal testis cell line (ATCC® CRL-6546) was cultured in ATCC-formulated
Dulbecco's Modified Eagle's Medium (ATCC, Catalog No. 30-2002), supplemented
with 10% fetal bovine serum (Gibco, Invitro-gen, Carlsbad, CA, USA), in a 37°C
Chapter 3-General Materials and Methods
56
incubator with 5% CO2. The 60 nM target miRNA mimics/miRNA mimic negative
control (Ambion) was co-transfected with 200 ng luciferase reporter containing 3’UTR
of target genes using Lipofectamine 2000 reagent (Invitrogen) in 24-well plates. After
transfection for 48 h, the Dual-Glo luciferase assay system (Promega) and SpectraMax
M3 system were used to obtain readouts of firefly and Renilla luciferase. All the firefly
luciferase readouts were normalized to their matching renilla luciferase readouts.
3.11.7 Identification and annotation of alternative splicing (AS) events
TopHat2 was used to predict the splice junctions with the RNA-seq data. Based on the
gene annotation information, splice junctions were classified into known and novel
groups. Splicing analysis was performed for events that had at least 20 total RNA-seq
reads (Wang et al. 2008). JuncBASE (Brooks et al. 2011) was used to annotate all AS
events (cassette exons, alternative 5' splice site, alternative 3' splice site, mutually
exclusive exons, coordinate cassette exons, alternative first exons, alternative last exons,
and intron retention). Values for Percentage Spliced Index (PSI) were calculated using
the formulas provided by (McManus et al. 2014).
3.11.8 Identification of differential AS events
Statistical significance was determined using the software package, R (source). Fisher’s
exact test was used to compare PSI values for pairwise comparison, and the P value was
adjusted to false discovery rate (FDR). In addition, only splicing events with FDR <
0.05 and PSI differences (ΔPSI) > 10% were further considered. The number of
differential AS events per chromosome length was calculated.
Chapter 4-Under nutrition reduces sperm quality
57
Chapter 4
Under nutrition reduces spermatogenic efficiency and sperm velocity,
and increases sperm DNA damage in sexually mature male sheep
4.1 Abstract
We tested whether the quality of sperm from mature male sheep would be affected
during nutrition-induced changes in testicular mass. Merino rams were fed for 65 days
with diets that increased, maintained or decreased body and testis mass (n = 8 per
group). In semen collected on Days 56 and 63, underfed rams had less sperm per
ejaculate than well-fed rams (P < 0.05) and a lower sperm velocity (computer-assisted
semen analysis) than well-fed or maintenance-fed rams (P < 0.05). Sperm chromatin
structure assay revealed more sperm DNA damage in underfed rams than in well-fed
rams (P < 0.05). The amount of sperm DNA damage was inversely correlated with
change in scrotal circumference (r = – 0.6; P < 0.05), the percentages of progressive
motile sperm (r = – 0.8; P < 0.01) and motile sperm (r = – 0.6; P < 0.05), and the
numbers of sperm per gram of testis (r = – 0.55, P < 0.05). In testicular tissue collected
on Day 65, underfed rams had fewer sperm per gram of testis than rams in the other two
groups (P < 0.001). We conclude that, in adult rams, underfeeding reduces
spermatogenic efficiency and that this response is associated with a reduction in sperml
quality.
Key words: ram, sperm number, sperm motility, DNA damage

Chapter 4-Under nutrition reduces sperm quality
58
4.2 Introduction
The reproductive system of small ruminants is affected by environmental factors such
as socio-sexual signals, photoperiod and nutrition, with genotype controlling the final
outcome (Martin and Walkden-Brown 1995). With respect to the effects of nutrition on
gamete production, the responses in females (ovulation rate) have been studied
extensively (Lozano et al. 2003), but less attention has been paid to male fertility. For
example, Pubmed lists only 8 research articles on the effect of nutrition on sheep testis
compared to 74 articles for the sheep ovary (http://www.ncbi.nlm.nih.gov/pubmed).
This disparity is surprising considering that testis mass is lost during the normal
breeding season of sheep and goats because, in many environments, the quantity and
quality of pasture are very poor at that time of the year (Martin and Walkden-Brown
1995). In addition, during the breeding season, male goats and sheep lose their appetite
and their behavioural drive for mating reduces the time available for feeding. The
combination of all these circumstances leads to major losses in both body mass and
testis mass, and therefore the capacity for sperm production (Review: Martin et al.
2011).
Reduction of sperm output by under-nutrition has been demonstrated in adult rams
(Salamon 1964; Setchell et al. 1965; Oldham et al. 1978; Cameron et al. 1988), but it is
not clear whether the loss in testis mass and reduction in sperm production are
associated with changes in the quality of the sperm. We have postulated that the sperm
produced when the testis is shrinking are of a lower quality than those produced when
the testis is growing (Review: Martin et al. 2011) because of changes in ‘spermatogenic
efficiency’ – the number of sperm produced per gram of testicular tissue (Cameron et
al. 1988; Walkden-Brown et al. 1994b). Spermatogenic efficiency depends on the rate
of cell loss, probably through apoptosis, during spermatogenesis (Sakkas et al. 1999;

Chapter 4-Under nutrition reduces sperm quality
59
Santos et al. 1999). In addition, changes in testis mass would also be accompanied by
changes in blood flow (Setchell et al. 1965) and thus oxidative stress, a major cause of
sperm damage (Review: Aitken et al. 2012).
Semen quality has been studied in respect to under nutrition but there were limitations
to their experimental approach. For example, Parker and Thwaites (1972) showed that
sperm count and motility are reduced if under-nutrition lasts longer than 7 weeks
(Parker and Thwaites 1972), and these effects can be reversed by dietary
supplementation (Dana et al. 2000; Tufarelli et al. 2011). In addition, dietary level with
higher concentrate supplementation result in higher semen volume and sperm
concentration, lower abnormal sperm in Sardinian rams (Tufarelli et al. 2011).
However, these studies were restricted to traditional variables such as sperm
concentration, viability, morphology and subjective motility (Ollero et al. 1998). There
is a clear need to confirm the negative effects of under nutrition on sperm quality with
modern, objective, precise techniques for assessment of sperm cell function, such as
computer-aided semen analysis (CASA), a technology that has been applied to species
as diverse as catfish and humans (Rurangwa et al. 2001; Sigurdson et al. 2007; Gil et al.
2009). The value of CASA motility parameters is evident from studies showing that, for
example, straight-line velocity [VSL], curvilinear velocity [VCL], and average path
velocity [VAP] are related to the number of newborn in pigs (Broekhuijse et al. 2012).
Another important indicator of sperm quality is DNA damage because it can have
severe long-term impacts on fetal development and on the health of the offspring
throughout its life (Evenson and Jost 2000). Consequently, Evenson and colleagues
developed a sperm chromatin structure assay (SCSA), based on computer-aided flow
cytometry, as a means for evaluating DNA damage in sperm cells (Evenson et al. 1999).
The technology has been widely used to assess DNA damage in sperm produced by

Chapter 4-Under nutrition reduces sperm quality
60
rams, bulls and humans (Reichart et al. 2000; Bochenek et al. 2001; Boe-Hansen et al.
2005) and is likely to provide a valuable insight into the effects of under-nutrition on
sperm cell quality in rams.
Overall, therefore, we expected the testicular regression and reduced in spermatogenic
efficiency caused by under-nutrition to be associated with degradation of sperml cell
quality. To test this hypothesis, we used computer-assisted sperm analysis (CASA) and
sperm chromatin structure assay (SCSA) as well as conventional methods to assess
sperm quality in sexually mature male sheep in which testicular mass was changing
under the influence of nutrition.
4.3 Materials and methods
The experimental protocol was approved by the Animal Ethics Committee of the
CSIRO Centre for Environment and Life Sciences, Floreat, Western Australia (Project
No.1202).
4.3.1 Animals and treatments
In early May, 24 Merino rams (24 months old, 65.7 ± 4.7 kg, scrotal circumference 31.8
± 2.5 cm) were selected from the ‘Allandale Temperament Flock’. These animals have
been selected for over 18 generations for high and low reactivity to humans and to
isolation (Bickell et al. 2009) so, to avoid any confounding effects of genetic
background, the treatments used in the current study were balanced for temperament.
All the rams were housed in individual pens in a sheep shed with windows allowing
good penetration of natural light (CSIRO Floreat, Western Australia, latitude 31o59’S).
During the 3-week acclimatization period, all rams were fed daily with 750 g oaten
chaff (8.4% crude protein; 8.0 MJ/Kg metabolisable energy) and 200 g lupin grain
(35.8% crude protein; 13.0 MJ/Kg metabolisable energy). Attempts were made to train

Chapter 4-Under nutrition reduces sperm quality
61
all rams for semen collection with an artificial vagina and a teaser ewe (Wulster-
Radcliffe et al. 2001) and this training regime was eventually successful for 18 rams.
At the end of May (mid-autumn), rams were allocated among three dietary treatments
(high, maintenance, low) with the groups balanced for training success to semen
collection, body mass, scrotal circumference, temperament, polled or horned, and sperm
quality. Animals fed to maintenance requirements were expected to maintain constant
body mass. The high diet was designed to allow the animals to gain 10% live weight
over 65 days whereas the low diet was designed to allow 10% loss in weight. At the
start of the treatment period, individual daily allowance was 1.2 kg oaten chaff plus 0.3
kg lupin grain for the rams in the high-diet group, 0.7 kg chaff and 0.18 kg lupin grain
for the maintenance group, and 0.51 kg chaff and 0.13 kg lupin grain for the low-diet
group. Every week, the animals were weighed and the amount of feed offered to each
individual was adjusted to ensure achievement of target live weight.
4.3.2 Body mass and scrotal circumference
Body mass was measured once every week before feeding. Scrotal circumference was
measured every week with a tape measure at the point of maximum diameter when the
skin of the scrotum was stretched taut around both testes.
4.3.3 Semen collection and processing
Semen collected on Day 56 and Day 63 was immediately immersed in a warm (37°C)
water bath until analysis for sperm concentration, semen volume, sperm motility, sperm
viability and morphology. All analyses were done within 20 min of collection. A
portion of each sample was quickly transferred to 200 μl straws, labeled and plunged
into liquid nitrogen to await DNA fragmentation analysis.
4.3.4 Ejaculate quality

Chapter 4-Under nutrition reduces sperm quality
62
Semen volume was measured with an automatic pipette by carefully drawing the entire
ejaculate into a tip and reading the volume. The sperm concentration was determined by
spectrophotometer (8001 UV-vis Metertech, Inc., Taipei Taiwan). We followed the
protocol described by (Prathalingam et al. 2006): 20 μl semen was diluted 1: 400 (v/v)
with a mixture of phosphate-buffered saline (PBS) and formalin and the suspension was
placed in a spectrophotometer; absorbance was measured at 580 nm and sperm
concentration determined from a standard curve that had been developed for ram sperm.
The total number of sperm per ejaculate was estimated by multiplying ejaculate volume
(ml) by the concentration of sperm (109/ml).
4.3.5 Sperm morphology and viability
Sperm morphology and viability were evaluated after eosin-nigrosin staining (Bjorndahl
et al. 2003): 3 μl semen was mixed with 27 μl eosin-nigrosin mixture, and 5 μl of the
mixture was transferred to a labeled glass microscope slide and smeared using another
slide. Two smears were made for each sample. At least 300 sperm per slide were
counted on each of the 2 slides using an oil immersion objective on an Olympus BX60
microscope (Olympus, Australia Pty, Ltd., Mt Waverley, VIC, Australia). The
percentages of live, dead, morphologically normal and abnormal sperm were calculated.
4.3.6 Computer assisted semen analysis (CASA)
An aliquot (5.5 μl) of sperm suspension was diluted to 20 x 106 sperm/mL with motility
buffer (8 g/L sodium chloride, 0.1% bovine serum albumen, adjusted to pH 8.2 with 1.0
M NaOH) at 37°C, and 5 μl of the mixture was placed in a 20 μm sperm motility slide
chamber (Leja, Nieuw-Vennep, Netherlands). The video image was recorded using a
Basler A602fc digital camera (Basler AG, Ahrensburg, Germany) mounted on Olympus
BX53 microscope (Olympus Optical Co., Australia) equipped with phase contrast optics

Chapter 4-Under nutrition reduces sperm quality
63
and a motorized heated stage (Prior Optiscan II, Prior Scientific Intl.). In each sample,
500-600 sperm were evaluated. The percentages of motile and progressively motile
sperm and straight-line velocity (VSL), curvilinear velocity (VCL) and average path
velocity (VAP) were estimated using CASA software (SCA®, Microptics, V5, SL,
Spain). Sperm with VCL greater than 10 µm/sec were considered motile and sperm with
STR (VCL/VAP x 100) greater than 80% were classified as progressive.
4.3.7 Sperm chromatin structure assay (SCSA)
We followed the protocol described by (Evenson et al. 1999). In brief: frozen aliquots
of semen were placed in a 37°C water bath until just thawed and then diluted to 1-2 x
106 sperm cells per ml with TNE buffer (0.15 M NaCl, 0.01 M Tris-HCl, 0.001 M
disodium EDTA, pH 7.4, 10% glycerol). Aliquots (200 µl) were then mixed with 400 µl
acid-detergent solution (0.08 M HCl, 0.15 M NaCl, 0.1% Triton X-100, pH 1.2). After
30 s, the cells were stained with 1.2 ml acridine orange (AO) solution containing 6 mg
AO (Cat. # 04539, Polysciences Inc., Warrington, PA, USA) per ml buffer (0.037 M
citric acid, 0.126 M Na2HPO4, 0.0011 M di-sodium EDTA, 0.15 M NaCl, pH 6.0).
Fluorescence was then measured on 5000 cells per sample by FACSCalibur (Becton
Dickinson, Franklin Lakes, NJ, USA) with an excitation wavelength of 488 nm. AO
bound to double-stranded DNA emits a green signal, collected using a 530/30 nm BP
filter, while AO bound to fragmented single-stranded DNA emits a red signal, collected
using a 670 nm LP filter. Sperm cells were identified and debris excluded using
characteristic forward and side laser scatter. The percentage DNA fragmentation index
(%DFI = the percentage of cells outside the main sperm population) was calculated
using FlowJo v7.6 software (Tree Star, Inc. USA).
4.3.8 Sperm concentration in testicular tissue

Chapter 4-Under nutrition reduces sperm quality
64
At the end of the 65-day treatment period, all rams were killed with an intravenous
overdose of sodium pentobarbitone. Testes were collected, dissected and weighed. A
sample of tissue (10 g) from the left testis was excised, weighed accurately, and
homogenized in 100 ml of equal volumes 0.9% NaCl plus 0.1% TritonX-100. The
density of sperm was determined using a haemocytometer and a phase contrast
microscope (Olympus BX60, Olympus, Australia).
4.3.9 Statistical analysis
All statistical analyses were carried out using SPSS software (Version 20). The
differences among the dietary groups were analysed by one-way ANOVA and ANOVA
for repeated measurements followed by LSD’s (least significant different procedure)
multiple range test. For semen parameters, the average of the two collections (Days 56
and 63) was used. For the variables that were not normally distributed, logarithm
and square-root transformations were used where appropriate. P < 0.05 was considered
significant. Data are expressed as Mean ± SEM. In addition, the change in scrotal
circumference during the treatment period (the difference between Day 1 and Day 65
values) was calculated for each animal, pooled for the three groups, and used as an
independent variable in correlations with measures of treatment response. This allowed
us to test whether changes in testicular mass affected the quantity and quality of sperm
produced if dietary treatment could be ignored. By doing the correlation analysis with
the low diet group included and with it excluded, we could assess the possibility that the
outcomes reflected a general response to loss of testis mass or were specifically
associated with undernutrition.
4. 4 Results
4.4.1 Body mass, scrotal circumference and testis mass

Chapter 4-Under nutrition reduces sperm quality
65
Body mass increased in rams fed the high diet, decreased in rams fed the low diet, and
remained unchanged in rams fed maintenance diet (Fig. 4.1A). At the end of treatment
(Day 65), there were differences (P < 0.001, Fig. 4.1B) of 17.5 kg between high and low
dietary treatments, 9.5 kg between high and maintenance treatments and 8.0 kg between
maintenance and low dietary treatments. For scrotal circumference (Fig. 4.1C), the
dietary treatments had similar effects after an initial 2-week lag period during which
changes were not detectable. By Day 65, the high and low dietary groups differed by
5.3 cm (P < 0.01, Fig. 4.1D), but differences between the maintenance group and the
other two treatments were not significant (Fig. 4.1D). The outcomes for scrotal
circumference were reflected in paired testis weight at slaughter: 581 ± 31 g for the high
diet, 441 ± 44 g for maintenance, and 349 ± 49 g for the low diet. Testes were heavier
for the high diet than the maintenance or low diets (P < 0.05), but testis weight did not
differ significantly between the maintenance and low diets.

Chapter 4-Under nutrition reduces sperm quality
66
Fig. 4.1. Body mass (A, B) and scrotal circumference (C, D) in sexually mature rams fed a high diet
(black circles and columns), a maintenance diet (grey circles and columns), or a low diet (white circles
and columns) for 65 days. All values are mean ± SEM (n = 8). * P < 0.05 for high versus low diet. a-c: P
< 0.05 for different letters.
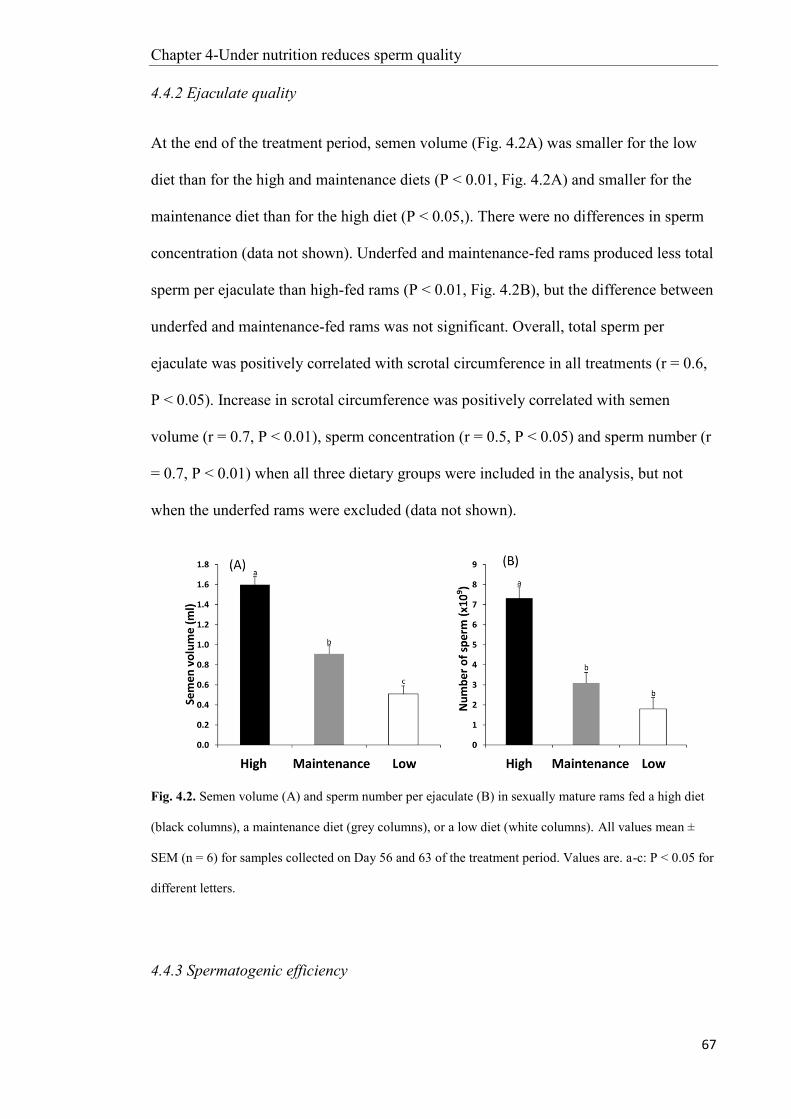
Chapter 4-Under nutrition reduces sperm quality
67
4.4.2 Ejaculate quality
At the end of the treatment period, semen volume (Fig. 4.2A) was smaller for the low
diet than for the high and maintenance diets (P < 0.01, Fig. 4.2A) and smaller for the
maintenance diet than for the high diet (P < 0.05,). There were no differences in sperm
concentration (data not shown). Underfed and maintenance-fed rams produced less total
sperm per ejaculate than high-fed rams (P < 0.01, Fig. 4.2B), but the difference between
underfed and maintenance-fed rams was not significant. Overall, total sperm per
ejaculate was positively correlated with scrotal circumference in all treatments (r = 0.6,
P < 0.05). Increase in scrotal circumference was positively correlated with semen
volume (r = 0.7, P < 0.01), sperm concentration (r = 0.5, P < 0.05) and sperm number (r
= 0.7, P < 0.01) when all three dietary groups were included in the analysis, but not
when the underfed rams were excluded (data not shown).
Fig. 4.2. Semen volume (A) and sperm number per ejaculate (B) in sexually mature rams fed a high diet
(black columns), a maintenance diet (grey columns), or a low diet (white columns). All values mean ±
SEM (n = 6) for samples collected on Day 56 and 63 of the treatment period. Values are. a-c: P < 0.05 for
different letters.
4.4.3 Spermatogenic efficiency
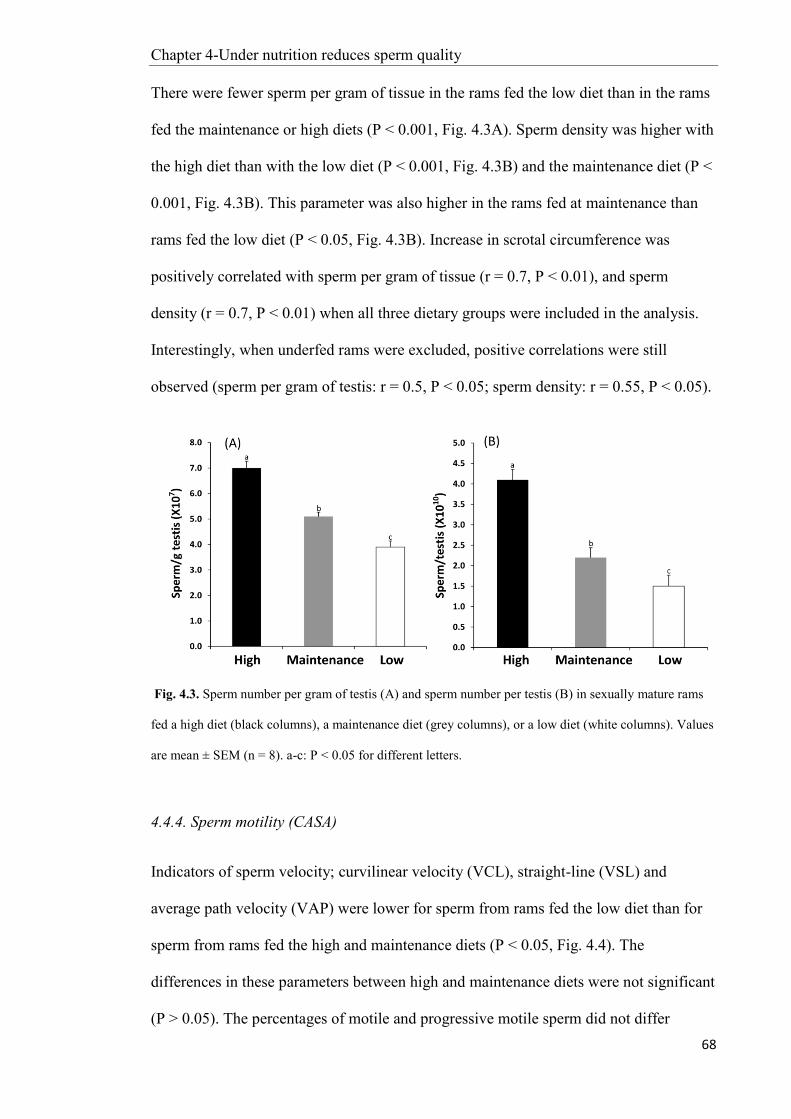
Chapter 4-Under nutrition reduces sperm quality
68
There were fewer sperm per gram of tissue in the rams fed the low diet than in the rams
fed the maintenance or high diets (P < 0.001, Fig. 4.3A). Sperm density was higher with
the high diet than with the low diet (P < 0.001, Fig. 4.3B) and the maintenance diet (P <
0.001, Fig. 4.3B). This parameter was also higher in the rams fed at maintenance than
rams fed the low diet (P < 0.05, Fig. 4.3B). Increase in scrotal circumference was
positively correlated with sperm per gram of tissue (r = 0.7, P < 0.01), and sperm
density (r = 0.7, P < 0.01) when all three dietary groups were included in the analysis.
Interestingly, when underfed rams were excluded, positive correlations were still
observed (sperm per gram of testis: r = 0.5, P < 0.05; sperm density: r = 0.55, P < 0.05).
Fig. 4.3. Sperm number per gram of testis (A) and sperm number per testis (B) in sexually mature rams
fed a high diet (black columns), a maintenance diet (grey columns), or a low diet (white columns). Values
are mean ± SEM (n = 8). a-c: P < 0.05 for different letters.
4.4.4. Sperm motility (CASA)
Indicators of sperm velocity; curvilinear velocity (VCL), straight-line (VSL) and
average path velocity (VAP) were lower for sperm from rams fed the low diet than for
sperm from rams fed the high and maintenance diets (P < 0.05, Fig. 4.4). The
differences in these parameters between high and maintenance diets were not significant
(P > 0.05). The percentages of motile and progressive motile sperm did not differ

Chapter 4-Under nutrition reduces sperm quality
69
among the three groups (0.05 < P < 0.1). In addition, change in scrotal circumference
was positively correlated with progressive motile sperm percentage (r = 0.8, P < 0.01),
VCL (r = 0.6, P < 0.05), VSL (r = 0.6, P < 0.05) and VAP (r = 0.7, P < 0.01), but not
when the underfed rams were omitted from the analysis (data not shown).
Fig. 4.4. Curvilinear (A), straight-line (B) and the average path (C) velocities of sperm from sexually
mature rams fed a high diet (black columns), a maintenance diet (grey columns), or a low diet (white
columns). VCL = curvilinear velocity; VSL = straight-line velocity; VAP = average path velocity. All
values are means ± SEM (n = 6) for semen collected on Days 56 and 63 of the treatment period. Values
are. a-c: P < 0.05 for different letters.
4.4.5 Sperm cell quality
Sperm morphology and viability: the major abnormalities observed in the sperm were
bent tail, bent mid-piece, broken tail, and coiled tail, detached head and tag defects.
However, eosin-nigrosin staining did not reveal any significant differences among diets
in the percentage of abnormal and live sperm (Fig. 4.5A and Fig. 4.5B).
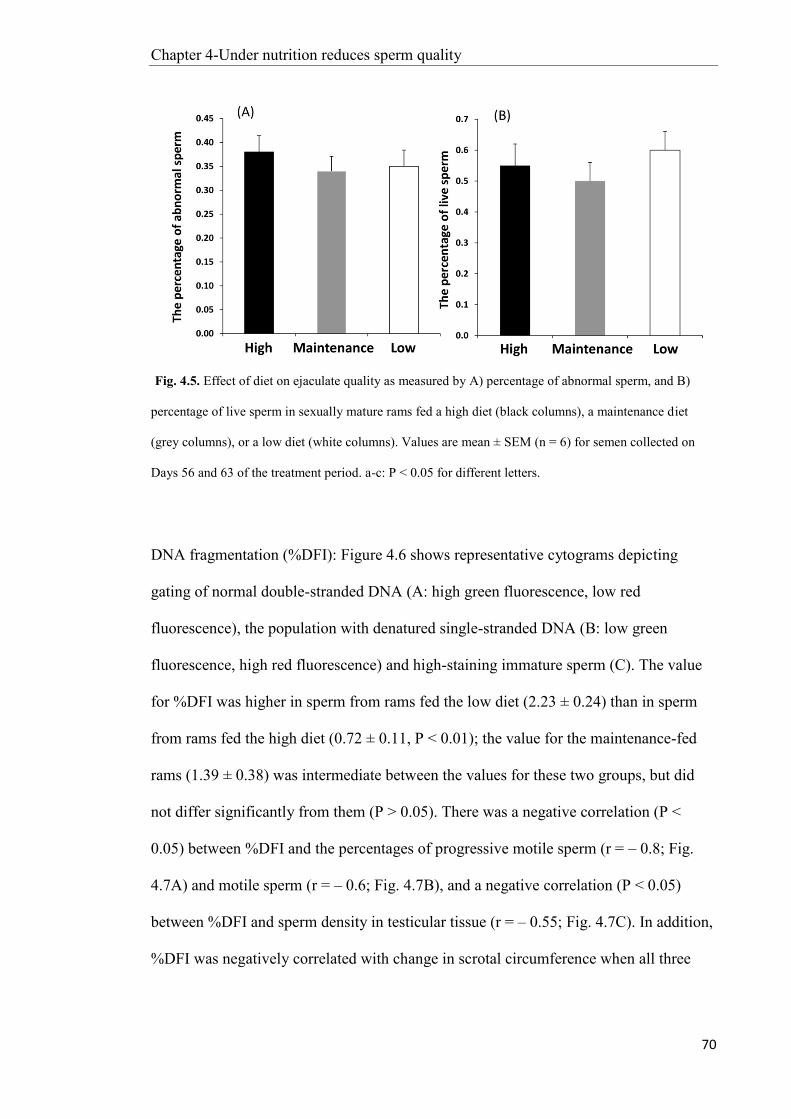
Chapter 4-Under nutrition reduces sperm quality
70
Fig. 4.5. Effect of diet on ejaculate quality as measured by A) percentage of abnormal sperm, and B)
percentage of live sperm in sexually mature rams fed a high diet (black columns), a maintenance diet
(grey columns), or a low diet (white columns). Values are mean ± SEM (n = 6) for semen collected on
Days 56 and 63 of the treatment period. a-c: P < 0.05 for different letters.
DNA fragmentation (%DFI): Figure 4.6 shows representative cytograms depicting
gating of normal double-stranded DNA (A: high green fluorescence, low red
fluorescence), the population with denatured single-stranded DNA (B: low green
fluorescence, high red fluorescence) and high-staining immature sperm (C). The value
for %DFI was higher in sperm from rams fed the low diet (2.23 ± 0.24) than in sperm
from rams fed the high diet (0.72 ± 0.11, P < 0.01); the value for the maintenance-fed
rams (1.39 ± 0.38) was intermediate between the values for these two groups, but did
not differ significantly from them (P > 0.05). There was a negative correlation (P <
0.05) between %DFI and the percentages of progressive motile sperm (r = – 0.8; Fig.
4.7A) and motile sperm (r = – 0.6; Fig. 4.7B), and a negative correlation (P < 0.05)
between %DFI and sperm density in testicular tissue (r = – 0.55; Fig. 4.7C). In addition,
%DFI was negatively correlated with change in scrotal circumference when all three

Chapter 4-Under nutrition reduces sperm quality
71
dietary groups were included in the analysis (r = – 0.6; Fig. 4.7D), but not when the
underfed rams were excluded (data not shown).
Fig. 4.6. Representative cytograms from the sperm chromatin structure assay (SCSA) for ejaculated
sperm from sexually mature rams that had been fed a high diet (A), a maintenance diet (B), or a low diet
(C). Mean fluorescence intensity (MFI) of green (488 530/30 nm BP) and red (488 670 nm LP) emission
produced by 5000 acridine orange stained sperm are plotted. Population A has high green fluorescence
and low red fluorescence, representing cells with normal double-stranded DNA; Population B are cells
outside of the main population which have low green fluorescence and high red fluorescence,
representing cells with denatured single-stranded DNA; Population C are cells outside of the main
population with high green staining, representing immature cells. Debris (Population D) was excluded
from analysis by characteristic forward and side light scatter. From these data, the percentage of DNA
fragmentation index (%DFI) is calculated: 100% x (number of sperm with denatured single-stranded
DNA)/(sperm with normal double-stranded DNA + sperm with denatured single-stranded DNA).
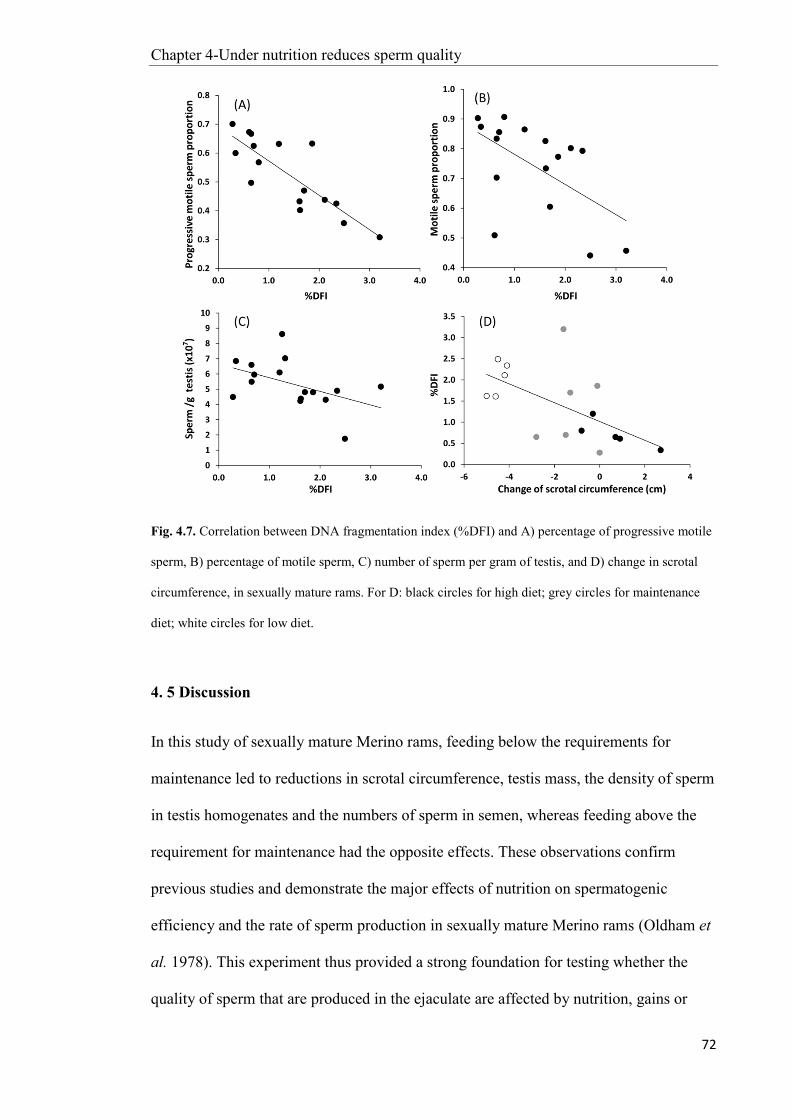
Chapter 4-Under nutrition reduces sperm quality
72
Fig. 4.7. Correlation between DNA fragmentation index (%DFI) and A) percentage of progressive motile
sperm, B) percentage of motile sperm, C) number of sperm per gram of testis, and D) change in scrotal
circumference, in sexually mature rams. For D: black circles for high diet; grey circles for maintenance
diet; white circles for low diet.
4. 5 Discussion
In this study of sexually mature Merino rams, feeding below the requirements for
maintenance led to reductions in scrotal circumference, testis mass, the density of sperm
in testis homogenates and the numbers of sperm in semen, whereas feeding above the
requirement for maintenance had the opposite effects. These observations confirm
previous studies and demonstrate the major effects of nutrition on spermatogenic
efficiency and the rate of sperm production in sexually mature Merino rams (Oldham et
al. 1978). This experiment thus provided a strong foundation for testing whether the
quality of sperm that are produced in the ejaculate are affected by nutrition, gains or
Chapter 4-Under nutrition reduces sperm quality
73
losses in testis mass, and the capacity of the testis to produce sperm. Using several
indicators of sperml quality (CASA-based measures of motility; SCSA-based measures
of sperm DNA damage; eosin-nigrosin-based detection of abnormal and live sperm), we
have shown that under-nutrition decreases sperm velocity and increases DNA damage,
but has little effect on the percentages of abnormal or live sperm.
Underfed rams produced sperm that had a lower curvilinear velocity (VCL), straight-
line velocity (VSL) and average path velocity (VAP), than was observed in sperm from
rams fed the high and maintenance diets. These effects of under-nutrition on objective
measures of motility are supported by previous studies in other laboratories that used
subjective assessment of motility in other breeds of sheep (Chiboka 1980; Dana et al.
2000), as well as in nutritional studies in humans (Review: Sinclair 2000). The reason
why under-nutrition reduces sperm motility is still not clear, although it has been
reported that reduction in sperm motility is correlated with increases in the formation of
reactive oxygen species (ROS) (Agarwal et al. 2003). This suggests that under-nutrition
would increase oxidative stress and further decrease sperm motility (Review: Aitken et
al. 2012). In the present study, we did not test whether the effects of under-nutrition on
sperm velocity are correlated with fertility in sheep, but parameters derived from
CASA, such as VAP, have been shown to be positively correlated (r = 0.87) with
fertility in species as diverse as cattle (Farrell et al. 1998) and humans (Youn et al.
2011). We would therefore expect the negative effect of under-nutrition on sperm
velocity to lead to a reduction in fertility at mating in sheep, a hypothesis that needs to
be tested in further studies.
DNA damage in ram sperm has been investigated previously, with respect to
temperature stress (Malama et al. 2013), but the present study is the first to investigate
the effects of nutrition. The higher levels of DNA fragmentation in sperm from underfed
Chapter 4-Under nutrition reduces sperm quality
74
rams than in sperm from well-fed rams adds further support for our hypothesis that
under nutrition reduces sperm cell quality. The values for %DFI in the current study
were similar to those from some previous studies with rams (Kasimanickam et al. 2007;
Peris et al. 2007) but were lower than the values in other reports (Garcia-Macias et al.
2006; Malama et al. 2013), even though all were using the SCSA technique. In the
study by Malama et al. (2013), the %DFI values differed between Chios rams and East
Friesian rams, so variation among genotypes is one possible reason for the lower values
in our Merinos. In addition, semen was collected weekly in Malama’s study and twice
per week in Garcia-Macias’s study, whereas the samples we analyzed were only
collected twice, near the end of the 65-day nutritional treatment. In boars, at least,
collection frequency affects DNA damage (Strzeiek et al. 1995), so this difference in
collection frequency may have contributed to the lower %DFI values in the current
study. Distinct cutoff values for %DFI that are associated with reduced fertility (15%)
and sterility (30%) have been established for human sperm (Evenson et al. 1999) but
not for rams. The %DFI in rams is much lower than humans due to well established
differences between the density of chromatin packaging between species (Evenson et al.
2002). However, in humans, failure to achieve pregnancy occurs even where 70% of the
sperm are not deemed abnormal on the basis of SCSA (Evenson and Jost 2000).
Therefore, it is likely that fertility in low-fed rams may be affected, despite apparently
low values for %DFI. Indeed, we found that %DFI was negatively correlated with the
percentages of motile sperm and progressive motile sperm, and the relationship was
quantitatively similar (r = – 0.39) to that reported for humans (Mahfouz et al. 2010),
suggesting a cause-effect relationship that should be related to fertility. Therefore,
studies involving fertility measurement are needed to test this relationship in rams.
The cause of the DNA damage in ejaculated sperm is still not clear but two possibilities
have been proposed (Sakkas et al. 1999): apoptosis during spermatogenesis and

Chapter 4-Under nutrition reduces sperm quality
75
incomplete maturation during spermiogenesis. Apoptosis during spermatogenesis
contributes to spermatogenic efficiency and is thought to facilitate functional
elimination of defective germ cells. This process implicitly involves destruction of
DNA so it is feasible that, in some sperm, the DNA breakdown has been only partially
completed by the time of ejaculation, leading to a higher %DFI in otherwise intact
sperm (Sakkas et al. 1999). Incomplete maturation during spermiogenesis is also a
plausible explanation for the increase in DFI% because of the positive association
between DNA damage and poor chromatin packaging due to under-protamination in
mature sperm (Gorczyca et al. 1993). To test which of these possibilities applies to the
effects of nutrition on ram sperm, we need to study germ cell apoptosis in the testis, and
the transition from round to elongated spermatids.
The percentages of abnormal sperm and dead sperm in the ejaculate are an important
indicator of sperm quality (Ombelet et al. 1995; Januskauskas et al. 2003). However,
neither sperm morphology nor mortality appeared to be affected by under-nutrition in
the present study, in agreement with previous work on Bakhtiary rams (Kheradmand et
al. 2006) and yearling bulls (Ohl et al. 1996). The duration and intensity of nutritional
imposition could be explanatory factors. We chose 65 days of nutritional treatment
because it easily exceeded the duration of the spermatogenic cycle of the ram (48 days:
Zeng et al. 2006), and we targeted 10% loss of body mass in the underfed group
because it approximated seasonal changes in live weight under field conditions (Masters
and Fels 1984). These conditions were sufficient to reduce sperm velocity and DNA
integrity in the underfed group, but a longer and more severe period of under-nutrition
might have led to detectable effects on sperm morphology and viability. For example, in
ram lambs, 86 days of zinc supplementation was needed to change the percentage of
live sperm (Kendall et al. 2000).

Chapter 4-Under nutrition reduces sperm quality
76
There were strong correlations between changes in scrotal circumference and some of
the measures of semen production and function when data for all three dietary groups
were included, but not when the data for the under-fed group were omitted from the
analysis. This observation raises the possibility that factors associated with the loss in
testis mass, rather than direct effects of the nutritional treatments, are responsible for the
observed changes in the production and quality of sperm. This concept is supported by a
study in adult fallow deer in which ejaculate volume, sperm density and the percentage
of normal sperm were directly correlated with annual changes in testis volume that were
probably driven by photoperiod rather than nutrition (Gosch and Fischer 1989). If this
were to be the case, then the relationship between testis mass and semen parameters
observed in this study could be applied more generally to other factors that can cause
changes in the testis mass, such as genotype, photoperiod or physical fitness.
In conclusion, the reductions in testis mass and sperm production caused by
underfeeding in sexually mature rams are associated with adverse outcomes for sperml
quality, as indicated by reduced sperm velocity (as indicated by CASA) and increased
DNA damage. Further research is required to determine whether the negative effect of
under-nutrition on these objective measures of sperm quality are associated with a
reduction in fertility.

Chapter 5-Under nutrition decreases Sertoli cell function
77
Chapter 5
Under-nutrition decreases Sertoli cell function in sexually
mature male sheep
5. 1 Abstract
We tested whether the reversible effects of nutrition on spermatogenesis in sexually
mature sheep were mediated by Sertoli cells. Rams were fed with diets designed to
achieve a 10% increase (High), no change (Maintenance) or a 10% decrease (Low) in
body mass after 65 days. At the end of treatment, testes were lighter in the Low than the
High group (P < 0.01). The Maintenance group had intermediate values that were not
significantly different to those of the other two groups. Spermatogenesis (Johnsen
score) was impaired in the Low group, but normal in both other groups. There was no
effect of treatment on Sertoli cell numbers, although 1% of Sertoli cells retained their
ability to proliferate. By contrast, Sertoli cell function was affected by dietary treatment,
as evidenced by differences between the High and Low groups (P < 0.05) in the
expression of seven Sertoli cell-specific genes. Under-nutrition appeared to reverse
cellular differentiation leading to disruption of tight-junction morphology. In
conclusion, in sexually mature sheep, reversible reductions in testis mass and
spermatogenesis caused by under-nutrition were associated with impairment of basic
aspects of Sertoli cell function but not with changes in the number of Sertoli cells.
Key words: Spermatogenesis, tight junction, Sertoli cell number, Sertoli cell activity

Chapter 5-Under nutrition decreases Sertoli cell function
78
5.2 Introduction
In sexually mature sheep, sperm output is positively correlated with testis mass, and
both sperm output and testis mass are affected by interactions between genotype and
environmental factors such as photoperiod and nutrition, with nutrition being the
dominant factor in genotypes like the Merino (Blache et al. 2003; Hötzel et al. 2003).
These effects are reversible, as demonstrated by annual cycles in testis mass (Martin et
al. 2002). The loss of testis mass with underfeeding involves mild cellular degeneration
and decreases in the diameter of the seminiferous tubules and the volume of the
seminiferous epithelium (Oldham et al. 1978; Hötzel et al. 1998). These outcomes are
not pathological but a reflection of the normal and reversible changes in testis function
that occur naturally under field conditions (Colas et al. 1986; Martin et al. 2002) and are
mediated by normal processes in the control of spermatogenesis.
We would expect the effects of nutrition on germ cell output to be mediated by the
Sertoli cells because there is a strict relationship between Sertoli cell numbers and
sperm production (Sharpe et al. 2003) and because a population of fully functional
Sertoli cells is considered essential for providing the structural and nutritional support
for germ cell development and sperm output (Meachem et al. 1996). Before Sertoli cells
can perform these tasks successfully, they must undergo several maturational changes
during the transition from fetal to adult life, most of which occur around puberty,
including the loss of proliferative activity and the formation of the blood-testis barrier
(Tarulli et al. 2012). With the loss of proliferative ability, the number of Sertoli cells in
the testis should be stable and un-modifiable after puberty but, following a study using
classical morphological techniques, we reported a substantial reduction in both the
number and volume of Sertoli cells in the sexually mature male sheep after nutritional
restriction (Hötzel et al. 1998). This contradiction of a dogma of testis biology might be

Chapter 5-Under nutrition decreases Sertoli cell function
79
dismissed as histological artifact, but a growing body of evidence suggests that the adult
Sertoli cell population can be modified (Johnson and Nguyen 1986; Hess et al. 1993;
Tarulli et al. 2006). In these specific settings, at least, it appears that the adult Sertoli
cell might not be terminally differentiated. The implications are profound: if Sertoli cell
number could be changed, it would lead to exciting prospects for basic and clinical
research in testis biology and perhaps realization of the potential to replenish adult
Sertoli cells (Sharpe et al. 2003; Tarulli et al. 2012). We therefore decided to again test
whether nutrition affects the proliferation of Sertoli cells in the sexually mature male
sheep. This time, rather than using conventional histology, we adopted GATA4 as a
marker for Sertoli cells (Ketola et al. 2000) and combined stereological cell counts with
assessment of Sertoli cell differentiation status and activity by analysis of
immunoreactivity to proliferation cell nuclear antigen (PCNA).
Independently of changes in Sertoli cell numbers, we need to test whether nutrition
affects Sertoli cell function, particularly the blood-testis barrier that divides the
seminiferous epithelium into basal and adluminal compartments (Cheng and Mruk
2012; Tarulli et al. 2013). A critical component of the blood-testis barrier is the tight
junctions created basally between Sertoli cells (McCabe et al. 2010), the disruption of
which leads to germ cell atresia and the cessation of spermatogenesis (Tarulli et al.
2008). Sertoli cell tight junctions seem to be regulated by a wide array of signaling
pathways and molecules (Lui et al. 2003) but, for the present study, we have focused on
Claudin11 and ZO1, two proteins that are expressed in Sertoli cells and rarely in other
cell types in testis (Byers et al. 1991; Morita et al. 1999). In men with extreme
conditions, such as primary seminiferous tubule failure, the localization of Claudin11
protein is disorganized (Haverfield et al. 2013). Similar studies have not been reported
for normal, reversible changes in spermatogenesis, such as the response to nutrition, so
we analyzed ram tissue for mRNA expression for Claudin11 and ZO1, and assessed the

Chapter 5-Under nutrition decreases Sertoli cell function
80
localization of Claudin11, to test whether they are affected by nutrition-induced growth
and regression of the testis.
We also studied other Sertoli cell-specific genes that are important for spermatogenesis.
For example, the maturity of Sertoli cells can be assessed using two genes, Anti-
Müllerian Hormone (AMH) and GATA1. AMH is expressed throughout fetal life and
decreases to a barely detectable level at the onset of puberty, so it is normally used as a
marker of immature Sertoli cells (Al-Attar et al. 1997; Sharpe et al. 2003). By contrast,
GATA1, a transcription factor that is first expressed in Sertoli cells as they are maturing,
is used as a marker for Sertoli cell maturation (Rey 1998; Beau et al. 2000). Other
specific genes that are crucial for Sertoli cell function and spermatogenesis include:
SRY-box containing gene 9 (SOX9) because it is associated with initiation of testis
development and is essential for the differentiation of Sertoli cells (Sekido et al. 2004);
the membrane-bound form of Kit-ligand (KLm) that is essential for spermatogenesis
(Johnston et al. 2004); Musashi homolog 1 (MSI1) that is involved in the differentiation
of germ cells in a variety of species (Saunders et al. 2002); follicle-stimulating hormone
receptor (FSHR) and Sertoli cell-specific androgen receptor (AR) (Collins et al. 2003;
Allan et al. 2006); and aquaporin 8 (AQP8), a trigger for the onset of spermatogenesis,
controls water secretion and thus fluid-filling of the seminiferous tubular lumen
(Calamita et al. 2001). We hypothesize that the expression of these eight Sertoli cell-
specific genes would decrease in underfed sheep.
The present study, based on nutrition-induced change of spermatogenesis in sheep as a
model of reversible, non-pathological change in spermatogenesis, therefore used a
variety of morphological, histological and molecular approaches to test whether the
responses are associated with changes in several fundamental aspects of Sertoli cell
function: proliferative ability, tight junctions, and cellular differentiation.
Chapter 5-Under nutrition decreases Sertoli cell function
81
5.3 Materials and methods
The experimental protocol was approved by the Animal Ethics Committee of the
CSIRO Centre for Environment and Life Sciences, Floreat, Western Australia (Project
No.1202).
5.3.1 Animals and treatments
From May to July (autumn-winter), 24 sexually mature Merino male sheep (24 months
old; 65.7 ± 4.7 kg body mass; scrotal circumference 31.8 ± 2.5 cm) were housed in
individual pens under natural light at Floreat, Western Australia, where the 24-h
photoperiod cycles annually from 10 to 14 h light. They were acclimatized for 3 weeks,
with ad libitum access to water and a daily allocation of 750 g of oaten chaff (8.4%
crude protein; 8.0 MJ/kg metabolizable energy) plus lupin grain (35.8% crude protein;
13.0 MJ/kg metabolizable energy).
After acclimatization, the animals were allocated among three dietary groups, with
stratification based on body weight, scrotal circumference, and sperm viability. The
dietary treatments were designed to alter body weight over 65 days: an increase of 10%
in the high diet group, no change in the maintenance group, and a decrease of 10% in
the low diet group. At the start of the treatment period, the daily allocations for each
animal were 1.24 kg oaten chaff plus 0.31 kg lupin grain (high diet), 0.73 kg of chaff
plus 0.18 kg lupin grain (maintenance diet), and 0.51 kg chaff plus 0.13 kg lupin grain
(low diet). The animals were weighed every week and the amount of feed allocated was
modified for each individual to ensure the target body weights were reached.
Quantitative details of the dietary components and descriptions of the endocrine
responses can be seen in the report by (Boukhliq et al. 1997). The data from the present

Chapter 5-Under nutrition decreases Sertoli cell function
82
experiment showing the effects of treatments on body mass, scrotal circumference,
semen quality and sperml quality are presented elsewhere (Chapter 4).
5.3.2 Tissue collection and preservation
After 65 days, all male sheep were killed with intravenous overdose of sodium
pentobarbitone, and the testes were immediately removed, dissected and weighed. Three
samples were chosen from top, middle and bottom parts of both testes; those from the
right testis were snap-frozen in liquid nitrogen and stored at –80˚C for total RNA
preparation; those from the left testis were washed by 0.9% saline and then fixed by 4%
paraformaldehyde for 6 h, then dehydrated and processed for routine embedding in
paraffin wax for histological analysis (Francavilla et al. 2000).
5.3.3 Morphometric analysis
We used an Olympus BX50 microscope coupled with a digital imaging system (DP2-
BSW) to assess 5 µm paraffin sections stained with Periodic Acid Schiff (PAS) reagent.
Images of cells and structures were displayed on a high-resolution color monitor and
were traced using a computerized mouse. Fields were selected using a systematic
random approach. All slides were masked to avoid personal bias.
5.3.4 Qualitative assessment of spermatogenesis
Spermatogenesis status was scored for 60 tubules from each animal, using a modified
Johnsen scoring system with values that range from 1 to 10 (Johnsen 1970) based on
criteria detailed in Figure 5.1. Two independent observers scored each section to avoid
bias, with all slides being masked. In the current study, we did not observe any
seminiferous tubules with no Sertoli cells (Score 1), so the Johnsen scores ranged from
2 to 10.

Chapter 5-Under nutrition decreases Sertoli cell function
83
Figure 5.1. Representative testis histology (Periodic Acid Schiff) associated with the criteria for the
Johnsen score in sexually mature male sheep: A) Score 10, full spermatogenesis; B) Score 9, slightly
impaired spermatogenesis, many late spermatids; C) Score 8, few late spermatids; D) Score 7, no late
spermatids, many early spermatids; E) Score 6, no sperm, no late spermatids, few early spermatids; F)
Score 5, no sperm or spermatids, many spermatocytes; G) Score 4, no sperm or spermatids, few
spermatocytes; H) Score 3, spermatogonia only; I) Score 2, no germinal cells, Sertoli cells only. Scale bar
represents 50 µm.
5.3.5 Analysis of testicular compartments
Point-counting method (Meachem et al. 1996) was used to determine the volume
fraction of each structure. Volume fraction of each structure = the number of points
landing on each structure /the number of the points hitting the entire testis. The total
volume of each structure per testis was determined from the product of the volume

Chapter 5-Under nutrition decreases Sertoli cell function
84
fraction and testicular volume. Tubule and lumen diameter were estimated for 30-40
tubules per animal, ensuring the standard error was <10% within each animal. For
elliptical profiles, the short axis of the ellipse was measured. The length of the tubule =
the absolute volume of tubules/the area of the tubule cross-section (calculated from the
estimated tubule diameter), assuming a cylindrical model. No correction factor for
shrinkage or swelling was applied.
Sertoli cells were identified by positive GATA4 reactivity (McCoard et al. 2003), as
described below. Sertoli cell nuclear volume was measured using the longest and
shortest diameters of the nucleus at magnification of 1000, with the aid of scientific
image analysis software, ImageJ (Schneider et al. 2012). For each animal,
measurements were made on 12 cross-sections of tubules from the top, middle and
bottom of the testis (ie, 36 tubules per animal), and at least 300 Sertoli cell nuclei, to
ensure that the standard error was <10% within each animal. The volume fraction of
Sertoli cell nuclei was determined by the point-counting method as described above.
Mean nucleus volume was calculated using the formula for a prolate sphere (4/3 πab2,
where a = longest radius and b = shortest radius) (McCoard et al. 2001). The total
number of Sertoli cells per testis was estimated by dividing the absolute volume of
Sertoli cell nuclei per testis by the mean volume of Sertoli cell nucleus (Wreford 1995).
5.3.6 Immunohistochemistry
Immunoreactivity for GATA4, Claudin11 and PCNA was detected, as described before
(Tarulli et al. 2006), in 5 µm sections (two adjacent serial sections from male sheep for
GATA4 and PCNA). Three sections per testis were dewaxed in xylene (twice for 3 min)
and 100% ethanol (twice for 3 min) and then rehydrated through graded ethanols (90%,
75% and 50%) to deionized water. Antigen retrieval was then performed by immersing
sections in 600 ml of 1 mM EDTA-NaOH (pH 8.0) and heated in an 800-W microwave

Chapter 5-Under nutrition decreases Sertoli cell function
85
oven set on high for 5 min and medium for 5 min and cooled for 1 h in EDTA buffer.
After washing with 0.01 M phosphate-buffered saline (PBS), sections were blocked in
0.3% H2O2 at 37˚C for 1 h. Sections were then blocked in Avidin, Biotin (SP-2001,
Vector Laboratories), CAS-Block (Invitrogen, Australia) with 10% normal goat serum
(Vector Laboratories, California, USA) (20 min each at room temperature), with a PBS
wash between each treatment. Rabbit antibodies to GATA4, PCNA and Claudin11 (1
µg ml-1, Santa Cruz Biotechnology, Texas, USA) were then applied for 2 h. Specificity
of primary antibodies was verified by incubating sections in normal rabbit IgG (1 µg ml-
1; Santa Cruz Biotechnology, Texas, USA). After washing with PBS, the samples were
treated with goat anti-rabbit second antibody for 1 h, followed by application of ABC
reagent (Vector Laboratories, California, USA) (1 drop of A + 1 drop of B in 1ml PBS),
then DAB (DAKO, Australia) for 5 min. The sections were then washed with deionized
water for 3 min, counterstained with Mayer’s haemotoxylin (Vendor, Australia) for 2
min, and dehydrated through graded ethanol (50%, 75%, 90%, and 100%), and briefly
immersed in xylene. Sections were mounted in Entellan (Merck, Australia) under 50-
mm coverslips (HD Scientific, Australia) and observed under Olympus BX50
microscope. To detect Sertoli cells that can proliferate, the same tubules were located in
the serial sections used for GATA4 and PCNA staining, and cells with double staining
were counted in 30 tubule cross-sections for each animal.
5.3.7 Immunofluorescence
In order to verify the result of double staining of GATA4 and PCNA,
immunofluorescence for PCNA and GATA4 on sheep testis tissue was performed using
a protocol adapted from (Tarulli et al. 2006). Primary antibodies used were as follows:
polyclonal rabbit anti-GATA4 (1 µg ml-1; catalogue number sc-9053, Santa Cruz
Biotechnology, Texas, USA), monoclonal mouse anti-proliferating cell nuclear antigen

Chapter 5-Under nutrition decreases Sertoli cell function
86
clone pc10 (1 µg ml-1, catalog no.M0879, DAKO, Sydney, Australia). Primary
antibodies were replaced by PBS as negative control (Anttonen et al. 2003; Salonen et
al. 2010). Secondary antibodies used were goat anti-rabbit Alexa 488 (10 µg ml-1,
catalog no. A-11034, Molecular Probes) and goat anti-mouse Alexa 546 (10 µg ml-1,
catalog no. A-11030, Molecular Probes). In addition, Hoechst 33342 (Invitrogen,
Australia) was used for nuclear stain.
5.3.8 Assessment of Claudin11 protein organization
Claudin11 staining was assessed by morphological evaluation of the immuno-staining
pattern (absent, filamentous or punctate), and by localization of staining within the
tubule (Haverfield et al. 2013). Based on these two observations, four different
organizational patterns (I–IV) were identified, as described in Table 5.1. The four
patterns indicate progressive loss of blood-testis junction. Pattern I indicates well
functional blood-testis junction. Pattern 4 is linked to disrupted blood-testis junction.

Chapter 5-Under nutrition decreases Sertoli cell function
87
Table 5.1: Morphological descriptions of the four staining patterns observed for Claudin-11 in
seminiferous tubules from sexually mature male sheep.
5.3.9 Isolation of RNA and reverse transcription
Staining Pattern Morphologic description of spatial organization
Pattern Ⅰ The protein presented a filamentous staining
pattern around the basal aspect of the tubule,
with no staining in the adluminal aspect.
Pattern Ⅱ The protein presented a filamentous staining
pattern around the basal aspect of the tubule,
with additional staining present in the
adluminal aspect representing <10% of total
tubule area, appearing as a small cluster
disconnected from the basal staining.
Pattern Ⅲ The protein presented a filamentous staining
pattern around the basal aspect of the tubule,
with additional staining in the adluminal aspect
representing > 10% of total tubule area.
Pattern Ⅳ The protein staining did not follow a filamentous
pattern; rather, the protein staining was
punctate and cytoplasmic in localization, with
diffuse staining present throughout both basal
and adluminal aspects of the tubule.

Chapter 5-Under nutrition decreases Sertoli cell function
88
The trizol protocol was used to isolate total RNA (Hellani et al. 2000). The quality and
quantity of RNA were determined by Agilent 2100 Bioanalyzer (Agilent Technologies,
Santa Clara, CA) and Qubit 2.0 Fluorometer (Invitrogen, Carlsbad, CA) and only RNA
with an integrity number (RIN) > 7.0 was used for further analysis. High capacity RNA-
to-cDNA kits (Applied Biosystems, USA) were used to reverse-transcribe 2 µg RNA to
cDNA in a final volume of 20 µl, according to the manufacturer’s protocol. The absence
of contaminating genomic DNA in total RNA samples was confirmed using reactions in
which reverse transcriptase was omitted.
5.3.10 Quantitive real-time PCR
QPCR was performed using SYBR Green (Fast SYBR® Green Master Mix; Applied
Biosystems) to detect mRNA expression of ten Sertoli cell-specific genes: ZO1,
Claudin11, AMH, GATA1, AR, KLm, FSHR, AQP8, SOX9, MSI1 (Johnston et al. 2004;
Abel et al. 2008; O'Shaughnessy et al. 2008). Oligonucleotide primer sequences for
these genes were designed using NCBI primer blast
(http://www.ncbi.nlm.nih.gov/tools/primer-blast/index.cgi?LINK_LOC=BlastHome)
and the primer for glyceraldehyde 3-phosphate dehydrogenase (GAPDH) was obtained
from a published source (Table 5.2; Yu et al. 2010). Fluorescence signal was detected
with StepOnePlus™ Real-Time PCR System (Applied Biosystems). In total, each
reaction contained 10 μl Fast SYBR Green Master Mix (Applied Biosystems), 1 μl of
forward primer (20 pmol/μl), 1 μl of reverse primer (20 pmol/μl), 7 μl nuclease-free
water, and 1 μl DNA template (50 ng/μl). Samples were measured in triplicate using the
following protocol: 95 ºC for 10 min for initial denaturation and then 40 cycles of 95 ºC
for 20 s, followed by annealing/extension for 30 s at 60 ºC. Analysis of melting curves
was used to monitor PCR product purity. Amplification of a single PCR product was
confirmed by agarose gel electrophoresis and DNA sequencing (data not shown).

Chapter 5-Under nutrition decreases Sertoli cell function
89
Table 5.2. Details of primers used for RT-QPCR.
GATA6 is known to be expressed exclusively and constantly by the Sertoli cells, with
little expression in other cell types in testis (Florin et al. 2005; Tarulli et al. 2008). In
addition, in this study, the quantification cycles (Ct) of GATA6 were constant in the
testes from 16 sheep (Data not shown), so GATA6 was used as housekeeper gene. The
ΔΔCt method was used to analyze the relative expression of Sertoli cell-specific genes
(Livak and Schmittgen 2001; Blais et al. 2008). Gene expression (ΔCt value) was
Gene Abbrev. Primer Sequence Product size (bp) Gene Bank
Claudin11 CLDN11 F:CTGATGATTGCTGCCTCCGT 75 XM_004003841.1
R:CATTCGGATGCACGGGAGAA
Tight junction protein 1 ZO1 F:AGCAAGCACCGAATCTTCCA 101 XM_004018080.1
R:ATTGGGCAGGACACCATCAG
Anti-Mullerian homone AMH F: TCCATCTCTCTCTCTGGCCC 150 XM_004009377.1
R:CAGTCCCAGCCTTGCTGAAA
GATA-binding factor 1 GATA1 F: GGACTGCACCACCTTCATCA 148 XM_004003841.1
R:GGGGTTAAGGGCAGAGTTCC
Androgen receptor AR F:GTACAGCCAGTGTGTCCGAA 99 XM_004022146.1
R:AAGAGCAGCAGTGCCTTCAT
Kit ligand, membrane-bound KLm F:GTGGAACAACTGTCAGTCAGC 127 NM_001267888.1
R:CCATGCACTCCACAAGGTCA
Follicle-stimulating hormone receptor FSHR F:TGTCCACACCAAAAGCCAGT 85 NM_001009289.1
R:GACAGTGAAAAAGCCCGCAG
Aquaporin 8 AQP8 F:GGAACAGCACAACAGAAGCG 116 XM_004020851.1
R:AATCGGGGCACAAGAGAAGG
SRY-box containing gene 9 SOX9 F:TAATTCGGAGGCGAACCCTG 126 XM_004013527.1
R:GGAGCGAGGGTTTAGGAAGG
Musashi homolog 1 MSI1 F:GTCTCGAGTCATGCCCTACG 109 XM_004017605.1
R:GAGGCCTGTATAACTCCGGC
Glyceraldehyde 3-phosphate
dehydrogenase GAPDH F:CTGCTGACGCTCCCATGTTTGT
150 NM_001190390.1
R:TAAGTCCCTCCACGATGCCAAA
GATA-binding factor 6 GATA6 F:TCGTTTGGTACACACCTCCG 76 XM_004020625.1
R: CAGTCCTGCAAACCGAGTGA

Chapter 5-Under nutrition decreases Sertoli cell function
90
calculated based on quantification cycles (Ct) (ΔCt = Ct target gene – Ct GATA6) and levels
of Sertoli cell transcript expression were calculated relative to maintenance group
(ΔΔCt = mean ΔCt sample – mean ΔCt maintenance). Relative expression (RQ) was
calculated using the StepOnePlus™ Real-Time PCR System (Applied Biosystems) and
the formula RQtarget gene = 2-ΔΔCt. This experiment was tested by a more commonly
employed housekeeper, GAPDH, which is highly and constantly expressed during sheep
testis development (Yu et al. 2010) .
5.3.11 Statistical analysis
All statistical analyses were carried out using IBM SPSS statistics data editor (Version
20). One-way ANOVA was used to test the effect of nutrition on Johnsen score, all the
morphometric data, and Sertoli cell gene expression. For the variables that were not
normally distributed, logarithm and square-root transformations were used. P < 0.05
was considered as statistically significant. Data are expressed as Mean ± SEM.
5.4 Results
5.4.1 Paired testes weight
One-way ANOVA revealed a significant effect of treatment on paired testes weight at
slaughter (P < 0.05). Specifically, rams from the High group had a higher paired testes
weight than rams in the Low group (581 ± 31 g versus 349 ± 49 g; P < 0.01). This
variable did not differ significantly between rams in the Maintenance and Low groups
(441 ± 44 g versus 349 ± 49 g; P = 0.09) or between the High and Maintenance groups
(581 ± 31 g versus 441 ± 44 g; P = 0.06).
5.4.2 Spermatogenesis

Chapter 5-Under nutrition decreases Sertoli cell function
91
One-way ANOVA revealed a significant effect of treatment on spermatogenic status, as
indicated by the Johnsen score (P < 0.01). Specifically, rams from the Low group had a
lower Johnson score (6.3 ± 0.3) than rams from both the Maintenance group (8.0 ± 0.2;
P < 0.001) and the High group (8.1 ± 0.3, P < 0.001). Late spermatids were absent in the
Low group and only a few early spermatids were observed, whereas spermatogenesis
was qualitatively normal in the High and Maintenance groups.
One-way ANOVA revealed a significant effect of treatment on the diameter of the
seminiferous tubules (P < 0.01) and the volume fractions and absolute volume of the
seminiferous tubules (P < 0.05) and epithelium (P < 0.05). However, there was no effect
of treatment on tubule length and lumen diameter (P > 0.05; Table 5.3) or in the
absolute volumes of lumen and interstitial tissue (P > 0.05; Table 5.3). Specifically,
rams in the Low group had narrower seminiferous tubules (P < 0.01), lower volume
fractions (P < 0.05) and absolute volume (P < 0.05) of seminiferous tubule and
epithelium (P < 0.05; Table 5.3) than High group and Maintenance group. In contrast,
the volume fraction of the lumen and interstitial tissue was higher in the Low group than
the other two groups (P < 0.05; Table 5.3).
5.4.3 Sertoli cell numbers
Sertoli cell nuclei were detected by GATA4 immunoreactivity (Fig. 5.2). No significant
differences were observed between the three groups for mean Sertoli cell nuclear
volume, Sertoli cell nuclei volume fraction, absolute volume of the Sertoli cell nuclei,
total number of Sertoli cells per testis, or number of Sertoli cells per tubule cross section
(Table 5.4).

Chapter 5-Under nutrition decreases Sertoli cell function
92
Table 5.3. Morphometric analysis of the testicular tissue from sexually mature male sheep after feeding
for 65 days with a diet that increased (High diet), maintained (Maintenance diet), or reduced (Low diet)
body mass and testis mass. All values are mean ± SEM (n = 8 per treatment). a, b: different letters denote
statistically significant differences among dietary treatments.
Variable High diet Maintenance diet Low diet
Tubule diameter (µm) 216.5 ± 7.2a 203.2 ± 7.7a 170.5 ± 7.9b
Lumen diameter (µm) 93.2 ± 4.4 98.2± 3.2 98.3 ± 4.8
tubule length (m) 5794 ± 383 5102 ± 243 4975 ± 829
Volume fraction (%)
Seminiferous tubules 0.73 ± 0.02a 0.71 ± 0.02a 0.64 ± 0.02b
Tubular lumen 0.14± 0.02a 0.17 ± 0.01a 0.21 ± 0.02b
Seminiferous epithelium 0.59 ± 0.03a 0.53 ± 0.03a 0.40 ± 0.03b
interstitial tissue 0.27 ± 0.02a 0.29 ± 0.02a 0.36 ± 0.02b
Absolute volume of testicular components (cm3)
Seminiferous tubules 211.3 ± 14.1a 167.4 ± 14.4a 115.2± 21.7b
Tubular lumen 40.0± 4.6 38.2 ± 1.6 37.7± 6.4
Seminiferous epithelium 172.5 ± 13.9a 129.0± 14.1a 76.1 ± 16.0b
interstitial tissue 78.6 ± 6.0 68.7 ± 7.4 62.5 ± 7.7

Chapter 5-Under nutrition decreases Sertoli cell function
93
Table 5.4. Sertoli cell measurements in sexually mature male sheep after feeding for 65 days with a diet
that increased (High diet), maintained (Maintenance diet), or reduced (Low diet) body mass and testis
mass. All values are mean ± SEM (n = 8 per treatment).
5.4.4 Sertoli cell proliferative ability
Cells that were positive to both GATA4 and PCNA, and thus considered to be
displaying proliferative ability, were observed in all dietary groups (Fig. 5.2). Of the 30
tubules counted for each animal, proliferating Sertoli cells were detected in 1.6 ± 0.3
tubules from the High group, 1.8 ± 0.4 tubules from the Maintenance group, and 1.7 ±
0.3 tubules from the Low group, with no significant differences among treatments. This
result was validated by confocal immunofluorescence of GATA4 and PCNA (Fig. 5.3).
PCNA reactivity was detected in 0.83% ± 0.002 of Sertoli cells in High group, 1.0% ±
0.002 of Sertoli cells in Maintenance group, 0.92 % ± 0.001 of Sertoli cells in Low
Variable High diet Maintenance diet Low diet
Nuclear volume (µm3) 199.1± 16.1 206.5 ± 17.21 159.9 ± 15.0
Nuclei volume fraction 0.018 ± 0.001 0.022 ± 0.004 0.025 ± 0.002
Absolute volume of Sertoli cell nuclei per testis (cm3) 5.24 ± 0.49 5.33 ± 1.07 4.24 ± 0.57
Number per testis (x 109) 26.9 ± 2.6 24.9± 4.9 26.5 ± 1.9
Number per tubule cross section 23.8 ± 1.5 22.5 ± 1.2 20.9 ± 0.9
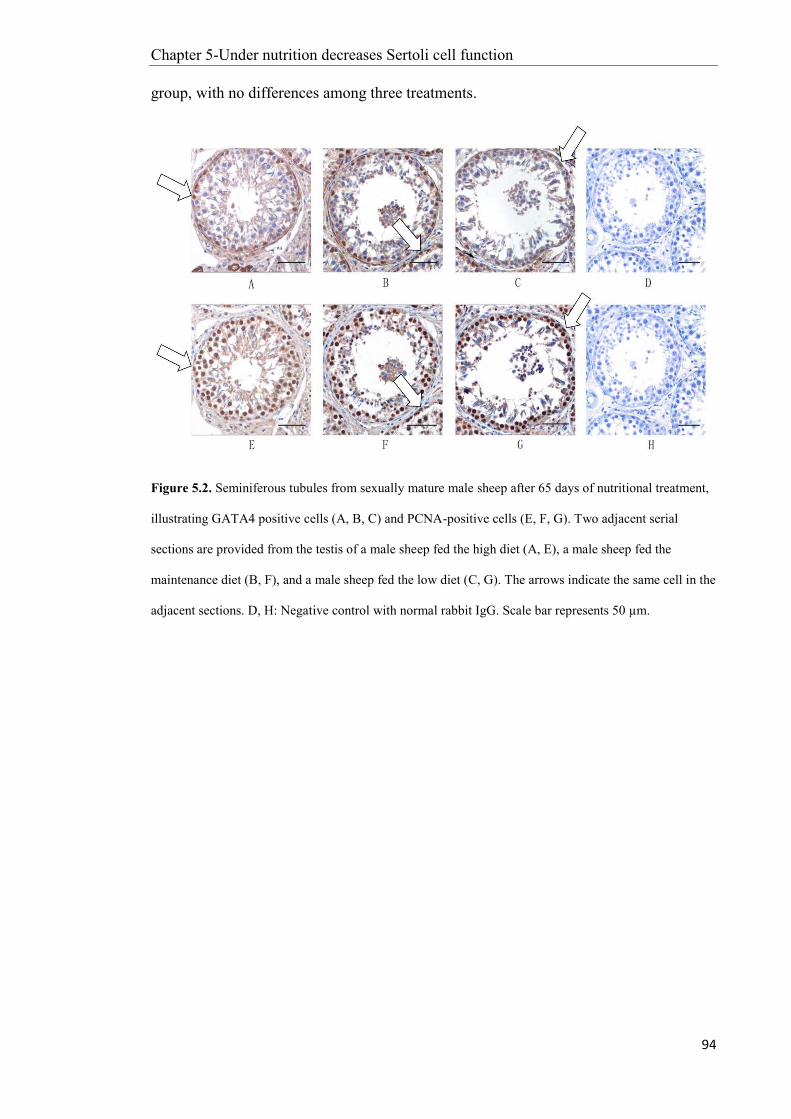
Chapter 5-Under nutrition decreases Sertoli cell function
94
group, with no differences among three treatments.
Figure 5.2. Seminiferous tubules from sexually mature male sheep after 65 days of nutritional treatment,
illustrating GATA4 positive cells (A, B, C) and PCNA-positive cells (E, F, G). Two adjacent serial
sections are provided from the testis of a male sheep fed the high diet (A, E), a male sheep fed the
maintenance diet (B, F), and a male sheep fed the low diet (C, G). The arrows indicate the same cell in the
adjacent sections. D, H: Negative control with normal rabbit IgG. Scale bar represents 50 µm.
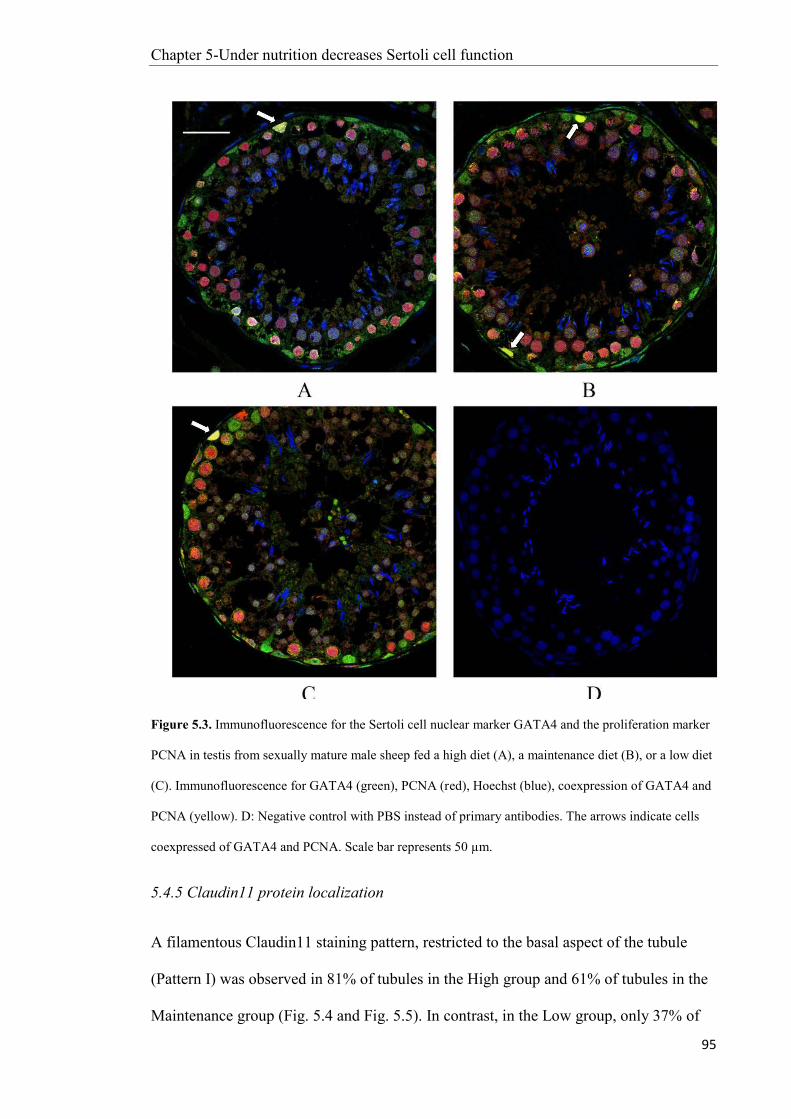
Chapter 5-Under nutrition decreases Sertoli cell function
95
Figure 5.3. Immunofluorescence for the Sertoli cell nuclear marker GATA4 and the proliferation marker
PCNA in testis from sexually mature male sheep fed a high diet (A), a maintenance diet (B), or a low diet
(C). Immunofluorescence for GATA4 (green), PCNA (red), Hoechst (blue), coexpression of GATA4 and
PCNA (yellow). D: Negative control with PBS instead of primary antibodies. The arrows indicate cells
coexpressed of GATA4 and PCNA. Scale bar represents 50 µm.
5.4.5 Claudin11 protein localization
A filamentous Claudin11 staining pattern, restricted to the basal aspect of the tubule
(Pattern I) was observed in 81% of tubules in the High group and 61% of tubules in the
Maintenance group (Fig. 5.4 and Fig. 5.5). In contrast, in the Low group, only 37% of
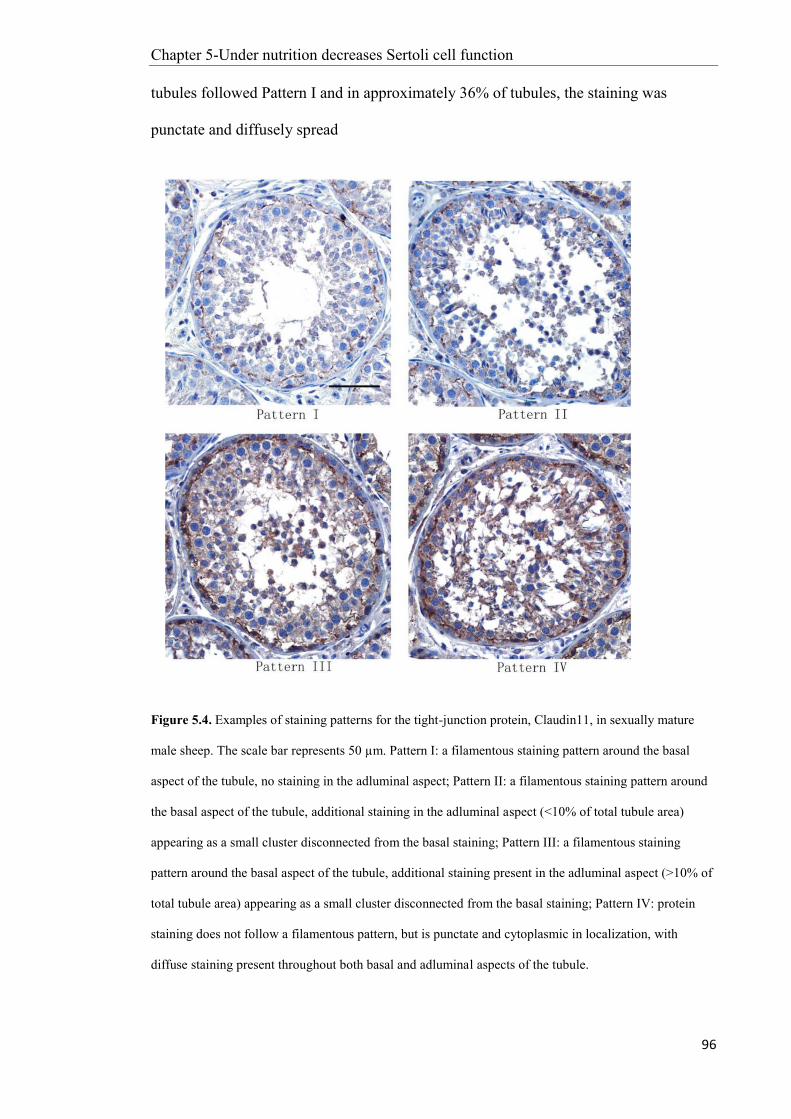
Chapter 5-Under nutrition decreases Sertoli cell function
96
tubules followed Pattern I and in approximately 36% of tubules, the staining was
punctate and diffusely spread
Figure 5.4. Examples of staining patterns for the tight-junction protein, Claudin11, in sexually mature
male sheep. The scale bar represents 50 µm. Pattern I: a filamentous staining pattern around the basal
aspect of the tubule, no staining in the adluminal aspect; Pattern II: a filamentous staining pattern around
the basal aspect of the tubule, additional staining in the adluminal aspect (<10% of total tubule area)
appearing as a small cluster disconnected from the basal staining; Pattern III: a filamentous staining
pattern around the basal aspect of the tubule, additional staining present in the adluminal aspect (>10% of
total tubule area) appearing as a small cluster disconnected from the basal staining; Pattern IV: protein
staining does not follow a filamentous pattern, but is punctate and cytoplasmic in localization, with
diffuse staining present throughout both basal and adluminal aspects of the tubule.
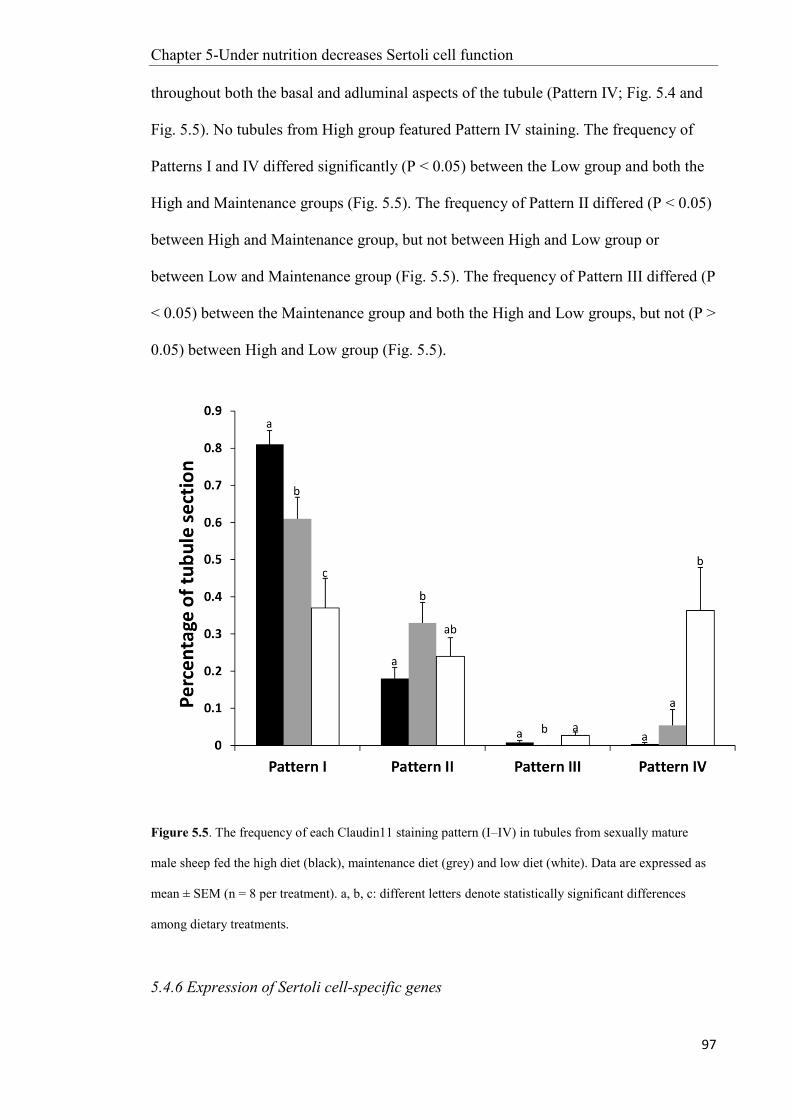
Chapter 5-Under nutrition decreases Sertoli cell function
97
throughout both the basal and adluminal aspects of the tubule (Pattern IV; Fig. 5.4 and
Fig. 5.5). No tubules from High group featured Pattern IV staining. The frequency of
Patterns I and IV differed significantly (P < 0.05) between the Low group and both the
High and Maintenance groups (Fig. 5.5). The frequency of Pattern II differed (P < 0.05)
between High and Maintenance group, but not between High and Low group or
between Low and Maintenance group (Fig. 5.5). The frequency of Pattern III differed (P
< 0.05) between the Maintenance group and both the High and Low groups, but not (P >
0.05) between High and Low group (Fig. 5.5).
Figure 5.5. The frequency of each Claudin11 staining pattern (I–IV) in tubules from sexually mature
male sheep fed the high diet (black), maintenance diet (grey) and low diet (white). Data are expressed as
mean ± SEM (n = 8 per treatment). a, b, c: different letters denote statistically significant differences
among dietary treatments.
5.4.6 Expression of Sertoli cell-specific genes

Chapter 5-Under nutrition decreases Sertoli cell function
98
There were significant effects of treatment on the expression of MSI1, GATA1, KLm,
SOX9, ZO1, AMH and Claudin11 (one-way ANOVA, P < 0.05; Fig. 5.6). Treatment did
not affect the expression of FSHR, AQP8 or AR (P > 0.05; Fig. 5.6). Specifically, the
expression of MSI1 was higher in High group than the Maintenance and Low groups (P
< 0.05, Fig. 5.6), but there was no difference between Maintenance group and Low
group. The expression of GATA1 and KLm were higher in tissues from rams in the High
group and Maintenance group than in tissues from the Low group (P < 0.05, Fig. 5.6),
but there was no difference between the High and Maintenance groups. The expression
of SOX9 and ZO1 was higher in the High group than the other two groups, and the
expression of these two genes was greater in the Maintenance group than in the Low
group. By contrast, the expression of AMH and Claudin11 was greater in tissue from
rams in the Low group than in tissue from the High and Maintenance groups (P < 0.05,
Fig. 5.6), but High and Maintenance groups did not differ. All the genes for which
expression differed between groups were also tested against a more commonly
employed housekeeper, GAPDH, with the same outcomes (data not shown).

Chapter 5-Under nutrition decreases Sertoli cell function
99
Figure 5.6. mRNA expression for Sertoli cell-specific genes normalized to GATA-6 from sexually mature
male sheep fed the high diet (black), maintenance diet (grey) and low diet (white). MSI1 (Musashi
homolog 1), GATA1 (GATA-binding factor 1), KLm (Kit ligand membrane-bound), SOX9 (SRY-box
containing gene 9), ZO1 (Tight junction protein 1), AMH (Anti- Müllerian hormone), Claudin11, FSHR
(Follicle-stimulating hormone receptor), AQP8 (Aquaporin 8), AR (Androgen receptor). Values are mean
± SEM (n = 8 per treatment). a, b, c: different letters denote statistically significant differences among
dietary treatments.
5.5 Discussion
This is apparently the first comprehensive evaluation of the morphological and
functional processes that underlie a natural, reversible, non-pathological change in
spermatogenesis during gain or loss of testicular tissue, in this case induced by nutrition
in the sexually mature male sheep. The nutritional treatments led to a 10% change in
body mass but a 25% change in testis mass. Within the testis, nutrition changed tubule
diameter, volume of seminiferous epithelium, Johnsen score, germ cell density,
spermatogenic efficiency, sperm output and sperm cell quality in the semen (Chapter 4).

Chapter 5-Under nutrition decreases Sertoli cell function
100
As we shall discuss below, these responses were associated with changes in the
function, but not numbers, of Sertoli cells.
We did not detect any change in the numbers of Sertoli cells, per testis or per tubule
cross-section, thus directly contradicting our previous observation (Hötzel et al. 1998)
and neutralizing controversy concerning the stability of Sertoli cell number after
puberty (Kluin et al. 1983; Kluin et al. 1984; Monet-Kuntz et al. 1984; Hochereau-de
Reviers et al. 1987). The most obvious explanation of the disagreement is technique –
in our initial study, we used conventional histology and counted Sertoli cell nuclei
based on their shape and location. This approach has several drawbacks: i) the Sertoli
cell nucleus is usually sitting among more prominent nuclei, such as those of germ cells;
ii) the shape of Sertoli cell nuclei can change, perhaps due to nutrition treatment; iii) the
apparent location of the nucleus can be affected by the sectioning process. We can now
avoid most of these problems by using GATA4 as a marker for Sertoli cells, and thus
generate more robust data and interpretations. Indeed, with the benefit of hindsight, the
outcomes of our initial study could be explained by the effects of nutritional treatment
on the ease with which Sertoli nuclei can be definitively identified, reflecting de-
differentiation (see below). The only caveat would be that, in the study by Hötzel et al.
(1998), the dietary treatments were more stringent and had a much larger effect on testis
mass, to the extent that the length of the seminiferous tubules was affected. It is thus
still feasible that Sertoli cell numbers might change under extreme circumstances.
Indeed, in the present study, we detected a few PCNA-positive Sertoli cells, indicating
the retention of some proliferative ability after puberty (Tarulli et al. 2006), although
there were only 1.6 PCNA-positive cells per tubule and this value was not affected by
nutritional treatment and not related to changes in testis mass. The possibility that
Sertoli cells can proliferate after puberty suggests that, in future we might find ways to
replenish damaged testes and restore germ cell production.

Chapter 5-Under nutrition decreases Sertoli cell function
101
Conversely, Sertoli cell function was clearly affected by nutritional treatment, as
evidenced by changes in the several groups of molecular regulators that reflect critical
Sertoli-cell-specific processes:
1. Tight junctions – The pattern of distribution of the tight junction protein,
Claudin11, was disrupted in testis from underfed animals, as reported for adult
Djungarian hamsters and humans in which spermatogenesis had been severely
disrupted, experimentally or pathologically (Tarulli et al. 2008; Haverfield et al.
2013). In addition, underfeeding, loss of testis mass and disruption of
spermatogenesis, were associated with increased expression of Claudin11 and
decreased expression of ZO1, as reported for some non-reversible, pathological
models of defective spermatogenesis (Singh et al. 2009; Nah et al. 2011). It has
been hypothesized that the increase in Claudin11 expression is caused by an
insufficiency of inhibitory factors such as TGF-β during the later stages of the
spermatogenic wave (Nah et al. 2011) but, in the present study, testicular TGF-β
expression did not differ among treatments (data not shown), so we need to
investigate other factors that regulate Sertoli cell tight junctions. Interestingly,
the localization of Claudin11 protein was disorganized in the testis from
underfed rams, but the level of Claudin11 mRNA was increased, supporting the
hypothesis that the disruption of Sertoli cell tight junctions is due to post-
translational processing (Tarulli et al. 2008; Fink et al. 2009; Chihara et al.
2010).
2. Markers of Sertoli cell maturity – Compared to well-fed sheep, underfed sheep
had lower expression of GATA1, a marker of mature Sertoli cells (Beau et al.
2000) but higher expression of AMH, a marker for immature Sertoli cells (Rey
1998), suggesting that the Sertoli cells in underfed sheep were going through de-

Chapter 5-Under nutrition decreases Sertoli cell function
102
differentiation and reversal of maturation, thus regaining proliferative ability and
losing tight junctions (Kliesch et al. 1998; Steger et al. 1999; Sharpe et al.
2003). This hypothesis is consistent with our observation of PCNA-positive
Sertoli cells, indicating proliferative ability, and with the data for Claudin11 and
ZO1, indicating disruption of tight junctions. It is also feasible that these
responses lead to difficulty in counting Sertoli cells using classical histology,
thus explaining our earlier observation of changes in Sertoli cell numbers in the
sexually mature male sheep (Hötzel et al. 1998).
3. Other Sertoli cell-specific genes – As expected, KLm, SOX9 and MSI1 were
down-regulated in the testicular tissue from underfed sheep compared to tissue
from well-fed sheep. Comparable outcomes for KLm have been reported for
other experimental models of defective spermatogenesis (Packer et al. 1995;
Kissel et al. 2000), including the FSH β-subunit knock-out mouse (Johnston et
al. 2004). Similarly, testicular function is disrupted in mice lacking the Sox9
protein in their Sertoli cells (Lardenois et al. 2010). Aberrant expression of MSI1
is associated with abnormal spermatogenesis (Sutherland et al. 2014) and, in
mice with abnormal spermatogenesis caused by knock-out of FSH receptors or
androgen receptors, expression of MSI1 is lower than normal (Abel et al. 2008).
It is therefore likely that down-regulation of KLm, Sox9 and MSI1 is among the
causes for reduced spermatogenic efficiency in underfed sheep and, since these
three genes are mainly expressed in Sertoli cells (Abel et al. 2008;
O'Shaughnessy et al. 2008), these observations add further support to our
hypothesis that Sertoli cell function is compromised in underfed rams
experiencing a loss of testicular mass. However, mRNA expression of FSHR,
AQP8 and AR was not affected by nutritional treatment. This finding was not
surprising – in the mouse, it had been reported that germ cell ablation did not

Chapter 5-Under nutrition decreases Sertoli cell function
103
change the expression of AQP8 and FSHR (O'Shaughnessy et al. 2008) and that
expression of AR was positively correlated with FSHR expression (Johnston et
al. 2004). The expression of FSHR, AQP8 and AR might only be affected by
extreme under-nutrition rather than the relatively benign treatments used in the
present study.
In conclusion, in sexually mature male sheep, underfeeding reduces testicular mass and
leads to a reduction in spermatogenesis, and these responses are associated with a
reduction in the functional ability of the Sertoli cells, apparently by inducing a reversal
of differentiation evidenced by disorganized tight junction, up-regulation of Sertoli cell
immature marker and down-regulation of Sertoli cell mature marker. There was no
reduction in the number of Sertoli cells with the loss of testicular mass, although some
Sertoli cells in sexually mature male sheep do retain proliferative ability, suggesting a
capacity for some regeneration of the population. Further study is required to determine
whether the molecular mechanisms that are responsible for the reversible and non-
pathological change in spermatogenesis induced by under-nutrition can be applied to
other models, such as normal cycles or pathological disruption of gamete production.

Chapter 6-Small RNAs affect apoptosis and spermatogenesis
104
Chapter 6
Roles of small RNAs in the effects of nutrition on apoptosis
and spermatogenesis in the adult testis
6.1 Abstract
We tested whether reductions in sperml quality induced by under-nutrition are
associated with increased germ cell apoptosis and disrupted spermatogenesis, and
whether these effects are mediated by small RNAs. Groups of 8 male sheep were fed for
a 10% increase or 10% decrease in body mass over 65 days. Underfeeding increased the
number of apoptotic germ cells (P < 0.05) and increased the expression of apoptosis-
related genes (P < 0.05) in testicular tissue. We identified 44 miRNAs and 35 putative
piRNAs that were differentially expressed in well-fed and underfed males (FDR <
0.05). Some were related to reproductive system development, apoptosis (miRNAs),
and sperm production and quality (piRNAs). Novel-miR-144 (miR-98), was found to
target three apoptotic genes (TP53, CASP3, FASL). The proportion of miRNAs as a
total of small RNAs was greater in well-fed males than in underfed males (P < 0.05) and
was correlated (r = 0.8, P < 0.05) with the proportion of piRNAs in well-fed and
underfed males. In conclusion, the reductions in sperml quality induced by under-
nutrition are caused, at least partly, by disruptions to Sertoli cell function and increased
germ cell apoptosis, mediated by changes in the expression of miRNAs and piRNAs.
Key words: nutrition, spermatogenesis, apoptosis, miRNAs, piRNAs
Chapter 6-Small RNAs affect apoptosis and spermatogenesis
105
6.2 Introduction
Spermatogenesis is regulated by a specific and complex genetic program that is
susceptible to many disorders that can induce infertility (Eddy 2002). In addition to
disease situations, spermatogenesis can be affected by environmental factors, such as
nutrition, that operate through normal physiological processes to profoundly change
testicular mass and the efficiency of sperm production, thus affecting sperm output
(Martin et al. 1994). In the male sheep, for example, 2 months of mild under-nutrition
leads to a reversible reduction in testis mass, impaired spermatogenesis, a reduction in
the numbers of sperm produced per unit mass of testis (efficiency of spermatogenesis),
and a reduction in sperm motility (Chapter 4). These effects seem to be mediated, at
least partly, by changes in the activity of the Sertoli cells (Chapter 5). However, a
thorough understanding of the effects of nutrition on spermatogenesis is elusive because
of the complexity of the process of spermatogenesis, and the breadth of the spectrum of
endocrine and paracrine signals that coordinate events from the initiation of meiosis
through the differentiation of germ cells to the generation of mature sperm (Brinster
2007).
Disruption of spermatogenesis by under-nutrition also seems to involve the pathways of
apoptosis (Martin et al. 2011), a crucial event in many physiological and pathological
conditions (Santos et al. 1999) that was detected long ago in the seminiferous
epithelium and is thought to be an important determinant of sperm output (Billig et al.
1996). The efficiency of spermatogenesis depends on the total number of cells at
successive stages of spermatogenesis (F.M. Cardoso 1985), so is probably regulated by
programmed cell death. Indeed, factors that disrupt spermatogenesis can induce
apoptosis in the testis – for example, suppression of FSH activity, which reduces Sertoli
cell proliferation and germ cell number, leads to loss of germ cells through apoptosis

Chapter 6-Small RNAs affect apoptosis and spermatogenesis
106
rather than through a decrease in proliferation (McLachlan et al. 1995; Meachem et al.
1999). Similarly, selenium deficiency results in apoptosis of germ cells by arresting the
cell cycles (Kaushal and Bansal 2007). Conversely, a relationship between the rate of
apoptosis and the level of nutrition has not been reported, not even for the sheep, a
model in which acute but reversible responses to nutrition are well documented (Martin
and Walkden-Brown 1995). The present study was therefore designed to test whether
nutrition affects germ cell apoptosis in the testis of the sexually mature male sheep. It
was also designed to investigate the molecular regulatory processes involved in the
responses to changes in nutrition.
Among the regulators of spermatogenesis, small RNAs, including microRNAs
(miRNAs) and PIWI-interacting RNAs (piRNAs), have recently become prominent.
miRNAs are small (~22 nucleotides) endogenous RNAs that negatively regulate gene
expression by targeting the 3’-untranslated region (3’UTR)(Krutzfeldt and Stoffel 2006)
and/or coding region (Hausser et al. 2013) of mRNAs. It has been reported that a global
loss of miRNAs, in germ cells or Sertoli cells, is detrimental for male fertility (Niu et al.
2011). By contrast, piRNAs are longer (26–32 nt) than miRNAs and can bind to PIWI,
a spermatogenesis-specific protein belonging to the Argonaute protein family (Lau et al.
2006; Liu et al. 2012a). The main function of piRNAs is to guide PIWI protein to
repress the transposable elements that protect genomic integrity (Luteijn and Ketting
2013). In addition, piRNAs derived from mRNAs play a role in the regulation of gene
expression (Lee et al. 2012). To date, piRNAs have been mainly found in the testis,
suggesting their role specific to spermatogenesis (Ro et al. 2007). Indeed, we have a
confluence of hypotheses here because it has been reported that some miRNAs are
crucial for the process of apoptosis (Li et al. 2011). For example, miR-98 expression is
reduced during apoptosis (Wang et al. 2011), miR-14 is a dose-dependent suppressor of
apoptosis, miR-278 antagonizes apoptosis (Jovanovic and Hengartner 2006), and
Chapter 6-Small RNAs affect apoptosis and spermatogenesis
107
transient inhibition of miR-21 in germ cell cultures increases the rate of apoptosis (Niu
et al. 2011).
As important regulators of spermatogenesis and germ cell apoptosis, miRNAs and
piRNAs should help explain the effects of nutrition on sperm production and sperm
quality in males, for example, male sheep. In the present study, we used sexually mature
male sheep as a model because the reversible effects of nutrition on testis mass, sperm
production and sperm quality are well documented (Cameron et al. 1988), thus
providing a solid foundation for studying the roles of small RNAs. We therefore 1)
profiled miRNAs and piRNAs in sheep testis; 2) investigated the relationships among
miRNA functions, spermatogenesis and germ cell apoptosis, particularly during
responses to nutrition; and 3) explored the potential for gene-derived piRNAs as
regulators of spermatogenesis in the testis of the sexually mature sheep.
6.3 Materials and methods
The experimental protocol was approved by the Animal Ethics Committee of the
CSIRO Centre for Environment and Life Sciences, Floreat, Western Australia (Project
No.1202) and all procedures were conducted in accordance with the approved protocol.
6.3.1 Animals and treatments
From late autumn to mid-winter, 16 Merino male sheep were housed in individual pens
in a building with windows allowing good penetration of natural light (CSIRO Floreat,
Western Australia, latitude 31o59’S). On entry, the rams were 24 months old, weighed
65.7 ± 4.7 kg, and had a scrotal circumference of 31.8 ± 2.5 cm. During a 3-week
acclimatization period, they were all fed daily with 750 g oaten chaff (8.4% crude
protein; 8.0 MJ/Kg Metabolisable Energy) and 200 g lupin grain (35.8% crude protein;
13.0 MJ/Kg Metabolisable Energy). They were then allocated into two dietary

Chapter 6-Small RNAs affect apoptosis and spermatogenesis
108
treatments (‘high’ and ‘low’) with the groups balanced for training success to semen
collection, body mass, scrotal circumference, temperament, poll-horn type, and sperm
quality (the percentage of live and motile sperm, sperm concentration). The high diet
was designed to allow the animals to gain 10% body mass over 65 days whereas the low
diet was designed to allow 10% loss in body mass. At the start of the treatment period,
individual daily allowance was adjusted to provide two dietary groups: animals fed the
High diet were offered 1.2 kg oaten chaff plus 0.3 kg lupin grain; animals fed the Low
diet were offered 0.51 kg chaff and 0.13 kg lupin grain. Every week, the animals were
weighed and the amount of feed offered to each individual was adjusted to ensure
achievement of target change in body mass. The outcomes for body and testis growth,
and for sperm production, have been reported before (Chapter 4).
6.3.2 Tissue collection and preservation
After 65 days of treatment, the animals were killed with an intravenous overdose of
sodium pentobarbitone, and the testes were immediately removed, dissected and
weighed. Three samples were chosen from the top, middle and bottom of both testes;
those from the right testis were snap-frozen in liquid nitrogen and stored at –80˚C for
total RNA preparation; those from the left testis were washed with 0.9% saline and then
fixed with 4% paraformaldehyde for 6 h, dehydrated and processed for routine
embedding in paraffin wax for histological analysis.
6.3.3 Evaluation of apoptosis
Terminal deoxynucleotidyl transferase mediated dUTP nick-end labeling (TUNEL) was
performed under the instruction of the ApopTag plus peroxidase in situ Apoptosis
Detection Kit (Chemicon International, USA). Briefly, deparaffinised tissue sections
(top part of left testes) were incubated with proteinase K (20 µg/ml), subjected to 3%
Chapter 6-Small RNAs affect apoptosis and spermatogenesis
109
H2O2 at 37˚C for 30 min to inhibit endogenous peroxidase, and then incubated with
equilibration buffer at room temperature for 1 min. Each section was incubated with
TdT (terminal deoxynucleotidyl transferase) at 37˚C for 1 h and then washed in
stop/wash buffer for 10 min. The sections were incubated in anti-Digoxigenin
Peroxidase Conjugate at room temperature for 30 min and were stained with
diaminobenzidine (DAB) as a peroxidase substrate. After counterstaining with methyl
green, numbers of TUNEL-positive cells per tubule were counted in 50 tubules per
animal with the aid of a light microscope. All counting procedures were performed
‘blindly’.
6.3.4 Isolation of RNA and Reverse transcription
The trizol method was used to isolate total RNA (Hellani et al. 2000) with the quality
and quantity of RNA determined by Agilent 2100 Bioanalyzer (Agilent Technologies,
Santa Clara, CA) and Qubit 2.0 Fluorometer (Invitrogen, Carlsbad, CA), RNA with an
integrity number (RIN) higher than 7.0 was used for further analysis. A high capacity
RNA-to-cDNA kit from Applied Biosystems was used for reverse transcription.
6.3.5 Quantitative real-time PCR (qRT-PCR)
QRT-PCR was performed using SYBR Green (Fast SYBR® Green Master Mix;
Applied Biosystems) to detect mRNA relative expression, with primers specifically
targeting sheep fas ligand (FASL), tumor protein p53 (TP53) and caspase3 (CASP3)
genes designed using NCBI primer blast
(http://www.ncbi.nlm.nih.gov/tools/primerblast/index.cgi?LINK_LOC=BlastHome).
Primer sequences for GAPDH were obtained from a published source (Appendix Table
6.1) (Yu et al. 2010). Fluorescence signal was detected with StepOnePlus™ Real-Time
PCR System (Applied Biosystems). The primer specificity was confirmed by PCR

Chapter 6-Small RNAs affect apoptosis and spermatogenesis
110
amplification, agarose gel electrophoresis and amplicon sequencing (data not shown).
The total volume of each reaction contained 10 μl Fast SYBR Green Master Mix
(Applied Biosystems), 1 μl of each primer (20 pmol/μl), 7 μl of nuclease-free water, and
1 μl of DNA template (50 ng/μl). Samples were measured in triplicate using the
following program: 95 °C for 10 min for initial denaturation and then 40 cycles of 95 °C
for 20 s, followed by annealing/extension for 30 s at 60 °C. Analysis of melting curves
was used to monitor PCR product purity. Previous work had shown that the level of
expression of GAPDH is relatively high and consistent during testicular development in
the sheep, indicating its suitability as a housekeeping gene expressed at similar levels in
somatic and germ cell populations (Yu et al. 2010). The ΔΔCt method was used to
analyze relative gene expression (Blais et al. 2008). The same sample was always used
as calibrator. The gene expression (ΔCt value) was calculated on the basis of
quantification cycles (Ct) (ΔCt = Ct target gene – Ct GAPDH). The levels of expression of
apoptosis-related genes were calculated in relation to the calibrator (ΔΔCt = mean ΔCt
sample – mean ΔCt calibrator). Relative expression (RQ) was calculated using
StepOnePlus™ Real-Time PCR System (Applied Biosystems) and the formula: RQtarget
gene = 2-ΔΔCt.
6.3.6 Small RNA library sequencing
In each sample, 1.0 µg of total RNA was used to construct miRNA libraries with a
unique index using the TruSeq Small RNA Sample Preparation kit (Illumina, San
Diego, CA) according to the manufacturer’s instruction. PCR amplification was
performed for 11 cycles and gel purification was used to individually purify libraries
with unique indices. Quantitative real-time PCR (qRT-PCR) was performed for library
quantification using the StepOnePlus™ Real-Time PCR System (Applied Biosystems,
Carlsbad, CA) and KAPA SYBR Fast ABI Prism qPCR kit (Kapa Biosystems, Woburn,
Chapter 6-Small RNAs affect apoptosis and spermatogenesis
111
MA). Individual libraries were then pooled for sequencing at Génome Québec
(Montréal, Canada) using the HiSeq 2000 system (Illumina) to generate 50 b single
reads. All the reads were demultiplexed according to their index sequences using
CASAVA version 1.8 (Illumina) and reads that did not pass the Illumina chastity filter
were removed from the dataset. The small RNAs sequencing reads with good quality
were subjected to 3’ adaptor sequence trimming, and all reads were mapped by blastn to
the non-coding RNA sequences (Rfam) to remove sequences belonging to tRNA,
snoRNA, rRNA, and other non-coding RNAs.
6.3.7 Identification of miRNAs
The miRNAs were identified using the methods outlined in a previous study (Liang et
al. 2014). Briefly, known miRNAs were identified by mapping the filtered 18 to 25 nt
sequences to miRBase (release version 20), a searchable database of published miRNA
sequences and annotation (Kozomara and Griffiths-Jones 2014). All reads from 16
libraries were pooled to predict novel miRNA using miRDeep2 based on the reference
genome sequence of OAR3.1 (http://www.livestockgenomics.csiro.au/). Small RNA
sequences with a miRDeep2 score higher than 5 and read numbers larger than 10 were
defined as novel miRNAs in sheep. The novel miRNA precursor sequences were then
combined with the known miRNA precursor sequences to form a new custom reference
database. Sequencing reads from different samples were mapped to the new custom
reference database to get the read number for the known and novel miRNAs for each
sample. Homologous miRNAs were identified by the method described previously (Jin
et al. 2014).
The conservation of known miRNAs was analyzed based on the definitions for “highly
conserved”, “conserved”, and “poorly conserved” from Targetscan (Lewis et al. 2003).
More specifically, highly conserved miRNAs are those conserved across most

Chapter 6-Small RNAs affect apoptosis and spermatogenesis
112
vertebrates; conserved miRNAs are those conserved across most mammals, but usually
not beyond placental mammals; poorly conserved miRNAs are those not present in the
above two groups. In this study, ovine-specific miRNAs were defined by using two
criteria: 1) they belong to a poorly conserved group; 2) their seed region sequences have
only been reported previously in sheep.
The genomic location of the miRNAs was searched for using the UCSC Genome
Browser (http://genome.ucsc.edu/) based on the reference genome sequence of OAR3.1
(http://www.livestockgenomics.csiro.au/). The miRNA genes are distributed across
chromosomes either individually, or in clusters. A cluster is a group of miRNA genes
located within a short distance (10 Kb) on the same chromosome, based on the
definition in the miRBase database (http://www.mirbase.org). In the present study, all
the known and novel miRNAs were grouped into various clusters based on their
genomic location.
6.3.8 piRNA characterization
To identify piRNAs, sequencing reads that ranged from 26 to 32 nt were mapped to the
ovine genome by Bowtie (version 1.0.1). Reads that could not be perfectly mapped to
the genome were discarded, and the remainders were de-duplicated to unique
sequences. The filtered unique reads were subjected to an online predictor
(http://59.79.168.90/piRNA/analysis.php), that relies on the training sets from non-
piRNA and piRNA sequences of five model species sequenced: rat, mouse, human, fruit
fly and nematode, to predict piRNA candidates (Zhang et al. 2011). The positions in the
ovine genome of these candidates were obtained by Bowtie and, to avoid confusion
caused by multiple locations, only those with a single location were further analyzed.
The piRNAs in each library were quantified by blastn and customized perl scripts. All
the sequencing data were deposited in a publicly available Gene Expression Omnibus

Chapter 6-Small RNAs affect apoptosis and spermatogenesis
113
database (http://www.ncbi.nlm.nih.gov/geo/), the data are accessible through GEO
accession number GSE62797.
6.3.9 Identification of differentially expressed (DE) miRNAs and piRNAs
Differential expression (DE) of miRNA/piRNAs between the nutritional treatments was
investigated using the bioinformatics tool, edgeR (Robinson et al. 2010), that utilizes a
negative binomial distribution to model sequencing data. The expression of
miRNAs/piRNAs in each library was normalized to counts per million reads (CPM) by
the following formula: CPM = (number of miRNAs/piRNAs reads/total reads number
per library) × 1,000,000. miRNAs/piRNAs with CPM > 5 in at least 50% of the samples
were subjected to analysis of differential expression. Fold change (FC) was defined as
the ratio (low diet/high diet) of the arithmetic means of CPM values. Significant
differential expression was accepted when false discovery rate (FDR) was < 0.05 based
on Benjamini and Hochberg multiple-testing correction (Benjamini et al. 2001), as well
as FC < 0.67 or > 1.5 (McCarthy and Smyth 2009).
6.3.10 Validation of miRNA expression using stem-loop qRT-PCR
The TAQMAN miRNA assay was used to validate miRNA expression following the
manufacturer’s recommendation (Applied Biosystems). In brief, cDNAs were reverse
transcribed from 10 ng total RNA, using 5 X specific miRNA RT primer, and then
amplified using a 20 X TAQMAN miRNA assay. StepOnePlus™ Real-Time PCR
System (Applied Biosystems) was used to detect the fluorescence signal. miRNAs with
cycle threshold (Ct) values > 35 were considered as having not been expressed. In this
study, U6 snRNA was used as an internal control (Liu et al. 2013) and three biological
replicates were performed. The 2-ΔΔCt method was used to analyze the expression level
and all statistical analyses were carried out using SPSS software (Version 20). One-way

Chapter 6-Small RNAs affect apoptosis and spermatogenesis
114
ANOVA was used to compare the groups, and P < 0.05 was considered significant.
Data are expressed as Mean ± SEM.
6.3.11 miRNA target prediction and functional analysis
TargetScan Release 6.0 (http://www.targetscan.org/) (Liu et al. 2012b) and miRanda
(http://www.microrna.org/microrna/home.do) (Birney et al. 2006) were used to predict
the target genes for selected miRNAs. The 3'UTR sequences of genes from sheep were
obtained from Ensembl Gene 75 Ovis aries genes (Oar_v3.1)
(http://uswest.ensembl.org/). The predicted target genes by both TargetScan (default
parameters; Bao et al. 2013) and miRanda (Total score ≥145, Total energy ≤ –10;
Bao et al. 2014) for each miRNA were further analyzed through ingenuity pathway
analysis (IPA; Ingenuity Systems, www.ingenuity.com). The significance of the
predicted function in IPAs was determined using a corrected P value calculated by the
Benjamini-Hochberg method (FDR: Benjamini et al. 2001). Threshold with FDR < 0.05
and molecule number > 2 were used to enrich significant biological functions of each
miRNA.
6.3.12 miRNA target validation using dual luciferase reporter assay
The entire 3’UTRs of TP53, BCL2-like 1(BCL2L1), CASP3 and FASL were amplified
from sheep genomic DNA by the method of PCR. All the primers are shown in
Appendix Table 6.2. Both PCR products were cloned into the pmirGLO Dual-
Luciferase miRNA Target Expression Vector (Promega) using the Xho1 and Sal1
restriction sites.
A sheep fetal testis cell line (ATCC® CRL-6546) was cultured in ATCC-formulated
Dulbecco's Modified Eagle's Medium (Catalog No. 30-2002), supplemented with 10%
fetal bovine serum (Gibco, Invitro-gen, Carlsbad, CA, USA), in a 37 °C incubator with

Chapter 6-Small RNAs affect apoptosis and spermatogenesis
115
5% CO2. The 60 nM miR-98 mimics/miRNA mimic negative control (Ambion) was co-
transfected with 200 ng luciferase reporter containing BCL2L1, CASP3 or FASL 3’UTR
using Lipofectamine 2000 reagent (Invitrogen) in 24-well plates. After transfection for
48 h, the Dual-Glo luciferase assay system (Promega) and SpectraMax M3 system were
used to obtain readouts of firefly and Renilla luciferase. All the firefly luciferase
readouts were normalized to their matching renilla luciferase readouts.
6.4 Results
6.4.1 Relationship between nutrition and apoptosis
TUNEL-positive germ cells were observed in all treatments (Fig. 6.1A - Fig. 6.1C), but
most were seen in the early stages of spermatogenesis (spermatogonia and
spermatocytes) and none were seen amongst spermatids or sperm. The number of
TUNEL-positive germ cells per tubule was greater in underfed (1.4 ± 0.3) than in well-
fed males (0.49 ± 0.06; P < 0.05). A relationship between under-nutrition and apoptosis
was further supported by the expression of the apoptosis-related genes, FASL, TP53 and
CASP3, with all three showing greater expression in underfed sheep than well-fed sheep
(P < 0.05, Fig. 6.1D - Fig. 6.1F).
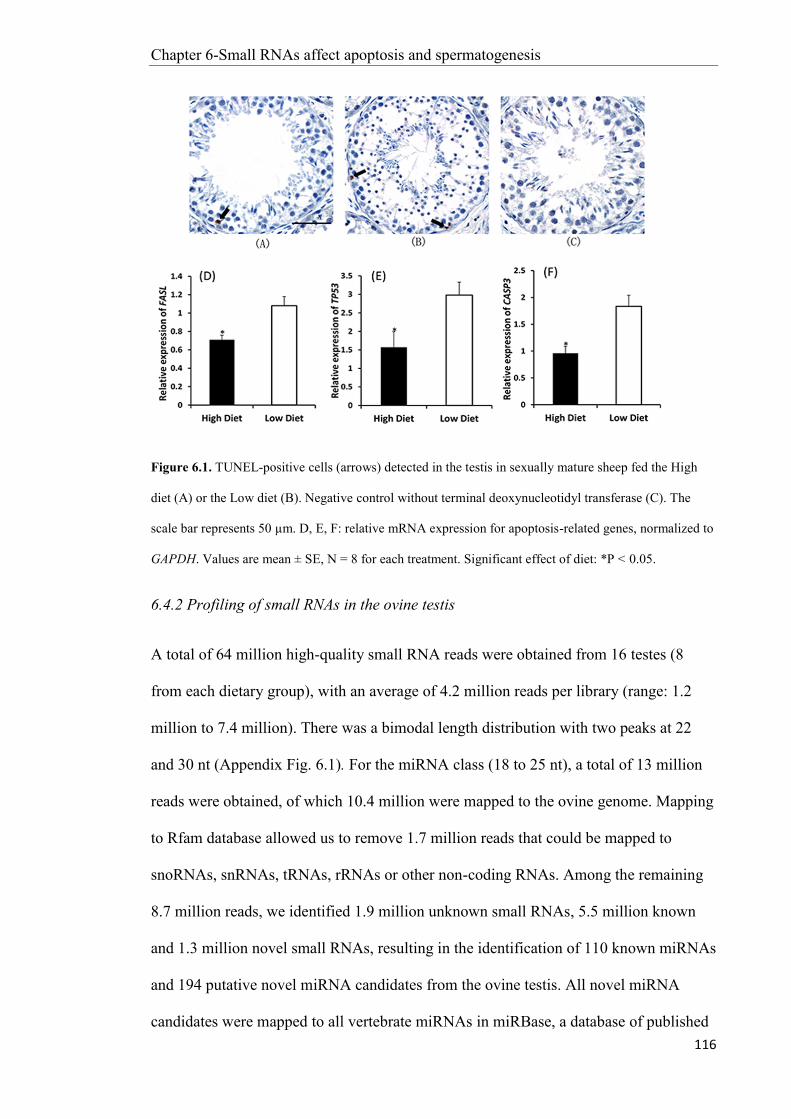
Chapter 6-Small RNAs affect apoptosis and spermatogenesis
116
Figure 6.1. TUNEL-positive cells (arrows) detected in the testis in sexually mature sheep fed the High
diet (A) or the Low diet (B). Negative control without terminal deoxynucleotidyl transferase (C). The
scale bar represents 50 µm. D, E, F: relative mRNA expression for apoptosis-related genes, normalized to
GAPDH. Values are mean ± SE, N = 8 for each treatment. Significant effect of diet: *P < 0.05.
6.4.2 Profiling of small RNAs in the ovine testis
A total of 64 million high-quality small RNA reads were obtained from 16 testes (8
from each dietary group), with an average of 4.2 million reads per library (range: 1.2
million to 7.4 million). There was a bimodal length distribution with two peaks at 22
and 30 nt (Appendix Fig. 6.1). For the miRNA class (18 to 25 nt), a total of 13 million
reads were obtained, of which 10.4 million were mapped to the ovine genome. Mapping
to Rfam database allowed us to remove 1.7 million reads that could be mapped to
snoRNAs, snRNAs, tRNAs, rRNAs or other non-coding RNAs. Among the remaining
8.7 million reads, we identified 1.9 million unknown small RNAs, 5.5 million known
and 1.3 million novel small RNAs, resulting in the identification of 110 known miRNAs
and 194 putative novel miRNA candidates from the ovine testis. All novel miRNA
candidates were mapped to all vertebrate miRNAs in miRBase, a database of published

Chapter 6-Small RNAs affect apoptosis and spermatogenesis
117
miRNA sequences and annotation, to identify the homologues of novel miRNAs
(Appendix Table 6.3). Based on the definition in Targetscan, among the 110 known and
194 novel miRNA candidates identified in sheep testis, 41 known and 62 novel miRNA
candidates were highly conserved, 28 known and 21 novel miRNA candidates were
conserved, and 36 known and 42 novel miRNA candidates were poorly conserved.
From the poorly conserved group, 5 known and 69 novel miRNA candidates were
sheep-specific and found in all of our animals. In the genomic context, 16 clusters of
miRNAs were identified on 9 chromosomes and two large clusters comprising 40
miRNA precursors were identified on Chromosome 18 (Appendix Table 6.4).
The sequences of piRNA were predicted based on previously published databases, as
described above. There were approximately 44 million reads of length 26 to 32 nt, of
which 23.8 million reads mapped perfectly to the ovine genome. In total, 6 million reads
representing 13567 putative piRNAs were identified and named with the prefix “oar-
piR” followed by a number (data deposited in Gene Expression Omnibus). There were
13241 putative piRNA candidates mapping to unique loci, and these putative piRNAs
were selected for direct comparison between the well-fed and underfed sheep.
6.4.3 Identification of differentially expressed (DE) miRNAs and piRNAs
There were 44 DE miRNAs in testicular tissue from underfed and well-fed males, of
which 21 were known and the rest were novel. Among all the DE miRNAs, 20 miRNAs
including novel-miR-144 showed greater expression in underfed than in well-fed males
(Fig. 6.2). For putative piRNAs, a total of 35 were DE in underfed and well-fed male
sheep (Appendix Table 6.5), and among them, two (oar-piR-12568, oar-piR-6442) were
derived from the 3’UTR of mRNAs (FLVCR2, KRTAP10-2). One putative piRNA, piR-
9006, was derived from the 5’UTR of mRNA (ATP2B4), and 11 putative piRNAs were
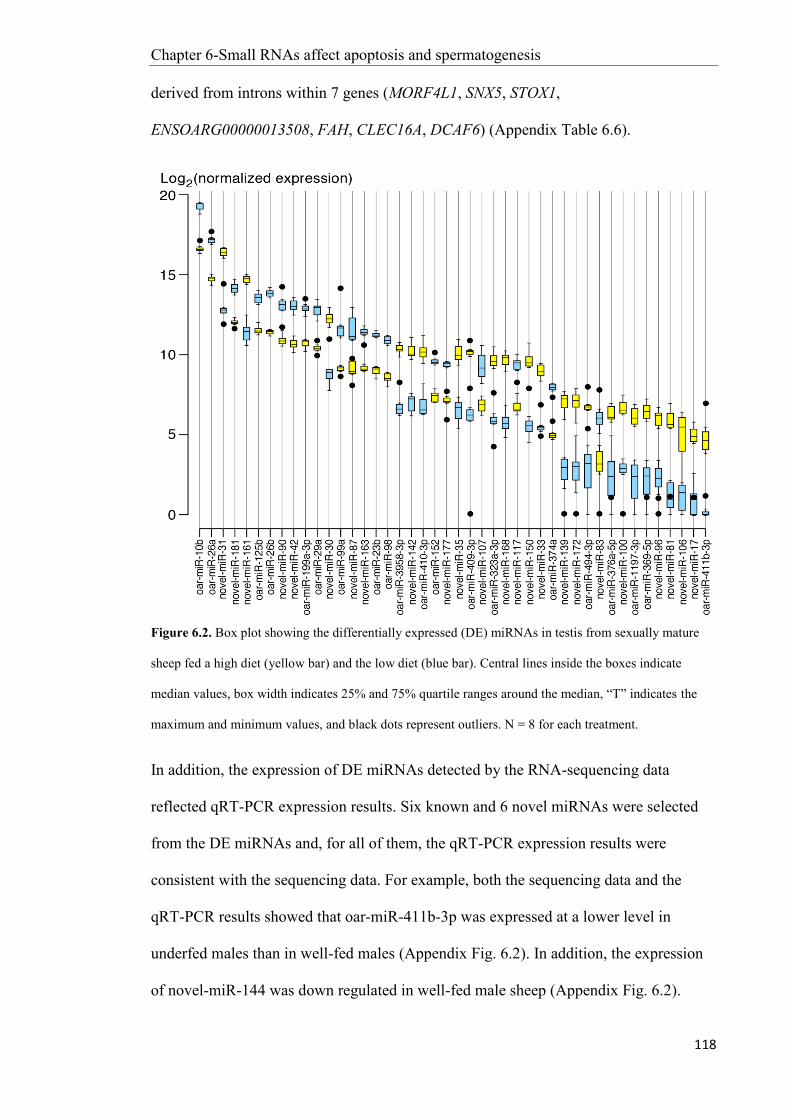
Chapter 6-Small RNAs affect apoptosis and spermatogenesis
118
derived from introns within 7 genes (MORF4L1, SNX5, STOX1,
ENSOARG00000013508, FAH, CLEC16A, DCAF6) (Appendix Table 6.6).
Figure 6.2. Box plot showing the differentially expressed (DE) miRNAs in testis from sexually mature
sheep fed a high diet (yellow bar) and the low diet (blue bar). Central lines inside the boxes indicate
median values, box width indicates 25% and 75% quartile ranges around the median, “T” indicates the
maximum and minimum values, and black dots represent outliers. N = 8 for each treatment.
In addition, the expression of DE miRNAs detected by the RNA-sequencing data
reflected qRT-PCR expression results. Six known and 6 novel miRNAs were selected
from the DE miRNAs and, for all of them, the qRT-PCR expression results were
consistent with the sequencing data. For example, both the sequencing data and the
qRT-PCR results showed that oar-miR-411b-3p was expressed at a lower level in
underfed males than in well-fed males (Appendix Fig. 6.2). In addition, the expression
of novel-miR-144 was down regulated in well-fed male sheep (Appendix Fig. 6.2).

Chapter 6-Small RNAs affect apoptosis and spermatogenesis
119
6.4.4 Relationship between nutrition and top ten expressed miRNAs
The top ten expressed miRNAs were the same in tissues from underfed males and well-
fed males, and their total expression did not differ between treatments (68% versus and
75% of the total miRNAs) (Appendix Fig. 6.3). However, expression of three of the top
ten miRNAs did differ between treatments – specifically, oar-miR-10b and oar-miR-26a
showed greater expression in underfed than well-fed males, whereas novel-miR-31
showed the opposite effect (Fig. 6.2).
6.4.5 Relationship between nutrition and genomic location of miRNAs
There were two large clusters of miRNAs on Chromosome 18 and they included 10
miRNAs for which expression was significantly lower (FDR < 0.05, FC > 1.5) in
underfed than well-fed males (Appendix Table 6.4).
6.4.6 Relationships between miRNAs and piRNAs
The proportion of miRNAs/piRNAs was defined by the ratio: miRNAs or putative
piRNAs reads number /total small RNAs reads number. Interestingly, the proportion of
putative piRNAs was greater than the proportion of miRNAs in well-fed males (P <
0.05, Fig. 6.3A) whereas the proportion of miRNAs was greater in underfed males (P <
0.05, Fig. 6.3A). In addition, there was a positive correlation between the proportion of
miRNAs and proportion of putative piRNAs in testicular tissue from well-fed males (r =
0.8, P < 0.05, Fig. 6.3B) and underfed males (r = 0.8, P < 0.05, Fig. 6.3C).

Chapter 6-Small RNAs affect apoptosis and spermatogenesis
120
Figure 6.3. Proportions of putative piRNAs (black columns) and miRNAs (white columns) in each
dietary treatment (A). Correlation between proportions of piRNAs and miRNAs in testis from sheep fed
the High diet (B) or the Low diet (C). N = 8 for each treatment. The proportions of miRNAs or piRNAs
were calculated as number of miRNAs or piRNAs reads divided by the total number of small RNA reads.

Chapter 6-Small RNAs affect apoptosis and spermatogenesis
121
6.4.7 Functional analysis of miRNAs
The targets of the miRNAs were predicted with TargetScan and miRanda and it was
found that 74 sheep-specific miRNAs would target 7783 genes. The function of these
targeted genes was analyzed by IPA. The most common functions are listed in Table 6.1
Table 6.1. Functions or diseases linked to 74 sheep-specific miRNAs detected in the testis of sexually
mature sheep. P values indicate the relevance of the function, with lower values suggesting greater
relevance.
Category Function or Disease p-Value
Small Molecule Biochemistry Synthesis of lipid 3.04E-03
Endocrine System Development and Function Synthesis of hormone 8.24E-03
Lipid Metabolism Synthesis of steroid 8.24E-03
Organ Morphology Abnormal morphology of enlarged testis 1.12E-02
Reproductive System Development and Function Abnormal morphology of enlarged testis 1.12E-02
Cell Morphology Size of connective tissue cells 1.26E-02
Small Molecule Biochemistry Steroidogenesis 1.33E-02
Endocrine System Development and Function Steroidogenesis 1.33E-02
Reproductive System Development and Function Production of sperm 2.37E-02
Cellular Function and Maintenance Production of sperm 2.37E-02
Cellular Growth and Proliferation Production of sperm 2.37E-02
Tissue Morphology Quantity of macrophages 2.37E-02
Cell Morphology Size of cells 2.37E-02
Connective Tissue Development and Function Quantity of connective tissue cells 3.82E-02

Chapter 6-Small RNAs affect apoptosis and spermatogenesis
122
where it can be seen that, in general, they are related to synthesis of lipids and
hormones, to testis morphology, and production of sperm. Also, 3567 genes were
predicted to be targeted by the miRNAs clustered on Chromosome 18. Their most
common functions were related to testis morphology (P < 0.05).
In addition, 44 DE miRNAs were predicted to target 1,597 genes (data not shown), and
a total of 14 functional categories were identified, including those involved in the
development and function of the hematological and reproductive systems (Table 6.2).
We identified 11 biological processes that were targeted within the category of
development and function of the reproductive system, including apoptosis and Sertol
cell number (Fig. 6.4). Furthermore, IPA analysis revealed that these DE miRNAs were
also involved in 76 signaling pathways, of which apoptosis signaling, germ cell-Sertoli
cell junction signaling, Sertoli cell-Sertoli cell junction signaling are among the most
relevant pathways (Appendix Fig. 6.4). To test our hypothesis that apoptosis explains
the poor sperm quality in underfed animals, we further analyzed the DE miRNAs in the
apoptosis-signaling pathway. We found that 12 genes involved in apoptosis could be
targeted by 9 DE miRNAs, with novel-miR-144 targeting four of the apoptosis-related
genes (FASL, CASP3, BCL2L1, TP53).

Chapter 6-Small RNAs affect apoptosis and spermatogenesis
123
Table 6.2. The predicted functions of the DE miRNAs analyzed by ingenuity pathway analysis (IPA).
values indicate relevance of the function, with lower values suggesting greater relevance.
Category p-value Number of molecules
Hematological system development and function 1.3E-03-1.3E-03 3
Tissue morphology 1.3E-03-3.31E-02 19
Connective tissue development and function 1.45E-03-3.31E-02 14
Reproductive system development and function 3.49E-03-4.77E-02 40
Organ morphology 3.92E-03-4.77E-02 38
Cell morphology 1.09E-02-1.8E-02 10
Molecular transport 1.13E-02-4.77E-02 7
Small molecule biochemistry 1.19E-02-4.77E-02 6
Cellular growth and proliferation 2.2E-02-4.01E-02 11
Lipid metabolism 3.24E-02-4.77E-02 6
Cell death and survival 3.31E-02-3.31E-02 2
Cellular function and maintenance 3.31E-02-3.31E-02 2
Drug metabolism 4.77E-02-4.77E-02 3
Endocrine system development and function 4.77E-02-4.77E-02 3

Chapter 6-Small RNAs affect apoptosis and spermatogenesis
124
Figure 6.4. The top 11 functions of DE miRNAs related to development and function of the reproductive
system. X-axis represents the –lg (p-value) and indicates the relevance of the function to the DE miRNAs,
with a lower p-value (a higher value of – lg(p-value)) suggesting greater relevance.
6.4.8 Validation of predicted miRNA targets
We validated FASL, CASP3, BCL2L1 and TP53 as direct targets for novel-miR-144 in a
biological process using a dual luciferase reporter assay on a sheep fetal testis cell line.
Co-transfection of novel-miRNA-144 mimics and pmirGLO vector containing 3'UTR of
TP53 decreased normalized luciferase activity by 72% compared to the pmirGLO
vector no-insert control (P < 0.01, Fig. 6.5). There was no difference between the
pmirGLO vector no-insert control and miRNA mimics negative control. Similar results
were observed with CASP3 and FASL for which there were 67% and 74% decreases
compared with the no-insert control (P < 0.01, Fig. 6.5). However, normalized

Chapter 6-Small RNAs affect apoptosis and spermatogenesis
125
luciferase activity of pmirGLO that contained BCL2L1 was not affected by novel-miR-
144 (Fig. 6.5).
Figure 6.5. Normalized luciferase activity. Black column: co-transfection of novel-miRNA-144 mimics
and reconstructed pmirGLO vector (containing 3'UTR of target genes). Grey column: co-transfection of
novel-miRNA-144 mimics and pmirGLO vector (without 3'UTR of target genes). White column: co-
transfection of miRNA mimics negative control and reconstructed pmirGLO vector (containing 3'UTR of
target genes). Values are mean ± SE (N = 8 per treatment). a, b, c: different letters denote statistically
significant differences within each target gene.
6.5 Discussion
This is the first comprehensive description of small RNAs in sheep testis and, by
combining these observations with bio-informatics analysis and experimental
validation, in the context of an experimental model of reversible testis growth in the
sexually mature males, we have been able to identify miRNAs and piRNAs that are
associated with the control of testis function. Importantly, we have also shown how the
expression of these small RNAs changes in response to under-nutrition in association

Chapter 6-Small RNAs affect apoptosis and spermatogenesis
126
with apoptosis in germ cells. Our findings strongly support the hypothesis that the
decline in sperm production and sperm quality induced by under-nutrition (Chapter 4)
in the sexually mature sheep are mediated at least partly by increased apoptosis in germ
cells.
Profile of small RNAs in sheep testis
Approximately 63% of the known miRNAs and 43% of the novel miRNAs that we
detected are conserved or highly conserved, suggesting that their biological functions
are conserved across species (Yan et al. 2009). The present study also revealed 5 known
and 69 novel miRNAs that are sheep-specific, most with functions focused on synthesis
of lipid or hormones, or production of sperm. This differed from the conserved
miRNAs, suggesting that sheep-specific miRNAs may represent an important source of
novel functionalities during evolution, an idea previously raised for the human and the
mouse (Guo et al. 2009). The ten most highly ranked miRNAs are relatively well
conserved across species – for example, four miRNAs (miR-143, let-7a, let-7f, miR-
148a) in pig testis (Li et al. 2011) and two miRNAs (let-7a, let-7f) in human testis
(Yang et al. 2013) ranked within the ten most highly expressed miRNAs found in this
study. This suggests that they play similar roles in the control of testis function for a
variety of mammalian species. To our knowledge, the present study is the first to profile
piRNAs in sheep testis. Approximately 10% of the small RNAs were predicted to be
putative piRNAs, similar to pigs (13%), mice (10%) and humans (9%) (Gan et al. 2011;
Liu et al. 2012a; Yang et al. 2013). However, in contrast to miRNAs, the sequences of
the putative piRNAs are weakly conserved among species (Aravin et al. 2006).
Impact of undernutrition on miRNAs and apoptosis

Chapter 6-Small RNAs affect apoptosis and spermatogenesis
127
The predicted targets of the 44 miRNAs that were differentially expressed between
well-fed and under-fed sheep were related to tissue morphology and development of the
reproductive system. Among all the DE miRNAs, there were 24, including novel-miR-
31, that were more highly expressed in well-fed sheep than in under-fed sheep. Novel-
miR-31 is homologous with miR-34 which has been shown to enhance germ cell
phenotype during the late stages of spermatogenesis in other species (Bouhallier et al.
2010). Under-nutrition was associated with greater expression of 20 miRNAs, including
miR-99a, which reduces the expression of the tight-junction-related protein, ZO-1
(Turcatel et al. 2012).
The predicted targets of top ten expressed miRNAs were functionally related to diseases
of the reproductive system, connective tissue function and development, tissue
morphology and cellular growth and proliferation, suggesting a critical role in
regulating reproductive performance. Under-nutrition did not affect the composition of
the top ten, but did affect the expression of three of them - specifically, underfed males
showed higher expression of oar-miR-10b and oar-miR-26a, and lower expression of
novel-miR-31 (miR-34c), than well-fed males. The genes that were up-regulated in
underfed males have been implicated in the induction of apoptosis (miR-26a: Kota et al.
2009) and testis dysfunction (miR-10b: Abu-Halima et al. 2014), whereas novel-miR-
31(miR-34c), which was up-regulated in well-fed males, enhances the expression of
germ cell-specific genes in late spermatogenesis (Bouhallier et al. 2010). These roles
are consistent with the conclusion that, during the loss of testis mass with under-
nutrition, apoptosis is induced and spermatogenesis is disrupted.
We had hypothesized that increased apoptosis is one of the main causes of the negative
effect of under-nutrition on sperm production and spermatogenic efficiency (Chapter 4).
Underfed sheep had more TUNEL-positive germ cells and higher expression of

Chapter 6-Small RNAs affect apoptosis and spermatogenesis
128
apoptosis-related genes (FASL, TP53, CASP3: Stuart et al. 1997; Janicke et al. 1998;
Benard et al. 2003) than well fed sheep, thus supporting our hypothesis. Interestingly,
TUNEL-positive germ cells were observed only in the early stages of spermatogenesis
(spermatogonia and spermatocytes) and not in spermatids or sperm. This observation
agrees with reports for other species (Blanco-Rodriguez and Martinez-Garcia 1996;
Rodriguez et al. 1997; Weinbauer et al. 2001), suggesting that spermatogenic cells are
mostly eliminated before the first meiotic division. However, there are a few reports of
apoptosis in spermatids or sperm (Heninger et al. 2004). It is therefore possible that our
TUNEL assay was not able to adequately label spermatids or sperm due to either the
compact nature of their DNA or their limited production of mRNA, generally thought to
be necessary for apoptotic death (Heninger et al. 2004).
We focused our investigation on novel-miR-144 (homolog: miR-98) for two reasons:
first, novel-miR-144 was up-regulated in underfed sheep; second, novel-miR-144
targets four of the apoptosis-related genes (FASL, CASP3, TP53 and BCL2L1: Wang
and Lee 2009; Wang et al. 2011). Our working hypothesis, that the negative effects of
under-nutrition on spermatogenic efficiency are mediated by increased apoptosis, is
supported by studies in mice (Siragam et al. 2012) where the homologue to novel-miR-
144 has been shown to be pro-apoptotic. However, our finding contradicts some
previous reports showing that miR-98 is up-regulated in small-cell lung cancer (Du et
al. 2009) and breast cancer (Deng et al. 2014), two conditions associated with cell
proliferation rather than apoptosis. We also found a positive correlation between
expression of novel-miR-144 and the apoptosis-related genes, FASL, CASP3 and TP53,
and therefore contradict the conventional wisdom that the expression of miRNAs is
negatively correlated with their target genes (Iorio et al. 2005). However, this type of
positive correlation has been reported previously in mice (Nunez et al. 2013) and could
be interpreted as miRNAs playing a role in homeostatic mechanisms that maintain

Chapter 6-Small RNAs affect apoptosis and spermatogenesis
129
stability within the organism. The underfed sheep had increased TUNEL staining
indicating increased apoptosis, most due to increased expression of the apoptosis-related
genes, FASL, CASP3 and TP53. miRNAs are thought to ‘fine tune’ the physiological
balance within an organism, so it is possible that the increased expression of novel-miR-
144 was a response to the increase in apoptosis, rather than a cause of the apoptosis.
Novel-miR-144 relationships are obviously complex, but we propose that miR-98, and
thus its sheep homologue (novel-miR-144), is both pro-apoptotic and anti-apoptotic
depending on the physiological condition of organism.
Impact of nutrition on putative piRNAs
Of the 35 differentially expressed piRNAs found in well-fed and underfed sheep, 60%
were derived from intergenic and repeated regions of the genome. Based on
observations in pigs, these DE piRNAs may have specific germline functions, including
the repression of transposons and other repetitive elements (Liu et al. 2012a). The
remaining 40% of the piRNAs that were differentially expressed in the current study
were derived from genes. It is difficult to predict the specific functions of the piRNAs
identified in the present study because our current understanding of their function is
limited and their sequence identities are poorly conserved among species. We therefore
focused only on the gene-derived DE piRNAs and predicted their functions based on
previous references – for example, feline leukemia virus subgroup C receptor-related
protein 2 (FLVCR2), which produces piR-12568 and functions as a calcium transporter
and affects reproduction and respiration (Meyer et al. 2010). In addition, P-type Ca2+-
ATPase isoform 4 of the plasma membrane (ATP2B4), which produces piR-9006, is
responsible for sperm motility (Gong et al. 2009). Furthermore, five piRNAs (piR-
10216, piR-10217, piR-10729, piR-10730, piR-10731) that showed higher expression in
underfed than well-fed sheep, were derived from MORF4L1, a gene that is highly

Chapter 6-Small RNAs affect apoptosis and spermatogenesis
130
expressed during male meiosis and spermatogenesis (Smirnova et al. 2006) and seems
likely to play a crucial role in male reproduction. To date, the mechanism through which
piRNAs regulate sperm production and sperm quality is not clear. However, there has
been a suggestion that a piRNA pathway was active in Sertoli cells (Lim et al. 2013)
and, as we have shown, Sertoli cell function is reduced in underfed males (Chapter 5).
We therefore expect that piRNAs affect male reproduction by regulating the function of
Sertoli cells, a hypothesis that needs to be tested in further studies.
Relationships between miRNAs and piRNAs
In well-fed males, the proportion of putative piRNAs, as a percentage of total small
RNAs, was greater than the proportion of miRNAs. This relationship was reversed in
underfed males. These observations suggest that nutrition has distinct, differential
effects on the expression of small RNAs in sheep testis. This relationship could be
explained by the higher rate of sperm production in well-fed males compared to
underfed males (Chapter 4), because piRNAs are specifically expressed in germ line
cells (Girard et al. 2006). Interestingly, there was a positive correlation between the
proportions of miRNAs and putative piRNAs in testicular tissue, for both underfed and
well-fed males, indicating a synergistic relationship between these classes of small
RNAs. Further studies are needed to test this hypothesis.
In conclusion, under-nutrition is associated with increased germ cell apoptosis, as
evidenced by increases in TUNEL-positive germ cells and in the expression of genes
and miRNAs that are related to apoptosis. Furthermore, in under-fed males, the
differential expression of miRNAs and piRNAs is likely to help explain the negative
effects of nutrition on spermatogenesis, spermatogenic efficiency and sperm quality.

Chapter 7-mRNAs and alternative pre-mRNA splicing affect apoptosis and spermatogenesis
131
Chapter 7
Functional changes in mRNA expression and alternative pre-mRNA
splicing associated with the effects of nutrition on apoptosis and
spermatogenesis in the adult testis
7.1 Abstract
In this study, we tested whether defective spermatogenesis and increased germ cell
apoptosis induced by under-nutrition is associated with a change of mRNA expression
and pre-mRNAs alternative splicing in the genes of testis. Groups of 8 male sheep were
fed for a 10% increase or 10% decrease in body mass over 65 days. We identified 2243
mRNAs, including TP53 and Claudin 11 were differentially expressed in underfed and
well-fed sheep (FDR < 0.1), and found they were predominantly related to germ cells,
testis size, cell cycle and spermatogenesis. Furthermore, 940 miRNA-mRNA pairs (48
miRNAs, 269 mRNAs) were indentified based on the target prediction and the negative
regulatory effect miRNAs on mRNA expression levels. Their functions are involved in
abnormal morphology of reproductive system, apoptosis and male infertility. Nutrition
did not affect the total number of alternative splicing junctions between treatments, but
it affected 1040 alternative splicing events (FDR < 0.05, ∆PSI > 10%). In total of 788
genes, including CREM, MAP2, HIPK3 and TRa2β, were differentially spliced between
dietary treatments, the functions of these genes were related to protein localization,
cellular metabolic process, post-translational protein modification and spermatogenesis.
We conclude that the changes of mRNAs and pre-mRNA alternative splicing induced
by under-nutrition are, at least partly, contributing to disrupted spermatogenesis and
increased germ cell apoptosis.

Chapter 7-mRNAs and alternative pre-mRNA splicing affect apoptosis and spermatogenesis
132
Key words: nutrition, spermatogenesis, apoptosis, mRNAs, pre-mRNA alternative
splicing
7.2 Introduction
The development of mature haploid sperm from diploid spermatogonial cells (Hecht
1998) can be affected by many factors, including photoperiod, hormones, temperature
and nutrition. The effects of nutrition on testis mass in the sexually mature male have
long been known, as has the direct relationship between testicular mass and sperm
production (Oldham et al. 1978). In addition, with change in testicular size, the
efficiency of sperm production also changes (Walkden-Brown et al. 1994b). We have
been investigating the cellular and molecular processes of the testis response to
nutrition, and we have found that under-nutrition despaired spermatogenesis in adult
sheep (Chapter 5).
Within the testis, spermatogenesis is a strictly regulated process, at both the
transcriptional and the post-transcriptional level (review: Papaioannou and Nef 2010).
In recent years, a novel mechanism of post-transcriptional control, mediated by
microRNAs (miRNAs), has emerged as an important regulator of spermatogenesis
(review: Papaioannou and Nef 2010). miRNAs (miRNAs) are small (~22 nucleotides)
endogenous RNAs that negatively regulate gene expression by targeting the
3’untranslated region (3’UTR) (Krutzfeldt and Stoffel 2006) and/or coding region
(Hausser et al. 2013) of mRNAs. We have recently found that the expression of a
number of miRNAs is affected by nutrition in sexually mature male sheep, and most of
the predicted targets of the differentially expressed miRNAs were mainly involved in
reproductive system development and function (Chapter 6). However, the regulatory
relationship between these miRNAs and their corresponding mRNAs targets in testis
remains to be verified. We therefore decided to profile mRNA expression in the testes
Chapter 7-mRNAs and alternative pre-mRNA splicing affect apoptosis and spermatogenesis
133
of well-fed and underfed male sheep using RNA-seq so we could explore the
relationships between the miRNAs we had identified and their putative targets.
In addition to the disruption of spermatogenesis, under-nutrition of sexually mature
male sheep increased apoptosis in germ cells (Chapter 6). In this situation, we were
especially interested in miR-98 because it is critical for apoptosis (Wang et al. 2011),
and observed higher levels of expression in underfed sheep than in well-fed sheep
(Chapter 6). Surprisingly, miR-98 expression was positively correlated with the
expression of apoptosis-linked genes (FASL, CASP3, TP53), contradicting the
conventional view that there is always a negative correlation between miRNA
expression and the expression of their target genes (Iorio et al. 2005). A positive
correlation between miRNAs and their corresponding targets has been reported in
humans and mice (Nunez-Iglesias et al. 2010; Nunez et al. 2013). Since the molecular
mechanisms through which miRNAs regulate the expression of apoptosis-related genes
are still controversial, we decided to explore these processes further using our nutrition
model.
It has also been reported that spermatogenesis and a large number of apoptotic factors
are regulated by alternative pre-mRNA splicing that generates multiple transcript
species from a common mRNA precursor and thus raises protein diversity and allows
the system to cope with the increasingly broad spectrum of functional and behavioural
complexity (Walker et al. 1996; Schwerk and Schulze-Osthoff 2005). To date, eight
types of alternative splicing have been reported: cassette exon, alternative 5' splice site,
alternative 3' splice site, mutually exclusive exon, coordinates cassette exons, alternative
first exon, alternative last exon and intron retention (Ding et al. 2014). We therefore
also tested the hypothesis that nutritional treatment will induce differences in alternative

Chapter 7-mRNAs and alternative pre-mRNA splicing affect apoptosis and spermatogenesis
134
splicing, and these changes will be related to the regulation of spermatogenesis and
germ cell apoptosis in the testis.
Overall, this study used testicular tissue from under-fed and well-fed sexually mature
sheep to pursue three objectives: 1) To investigate the differences of the expression of
mRNAs; 2) To investigate the influence of miRNAs on spermatogenesis and the
expression of apoptosis-related genes; 3) To investigate the relationships between
alternative pre-mRNA splicing and spermatogenesis and apoptosis.
7.3 Materials and methods
The experimental protocol was approved by the Animal Ethics Committee of the
CSIRO Centre for Environment and Life Sciences, Floreat, Western Australia (Project
No.1202).
7.3.1 Animals and treatments
From May to July (autumn-winter), 16 Merino male sheep (age 24 months, body mass
65.7 ± 4.7 kg, scrotal circumference 31.8 ± 2.5 cm) were housed in individual pens in a
building with windows that allowed good penetration of natural light at Floreat,
Western Australia. During the 3-week acclimatization period, all sheep were fed daily
with 750 g oaten chaff (8.4% crude protein; 8.0 MJ/Kg metabolisable energy) and 200 g
lupin grain (35.8% crude protein; 13.0 MJ/Kg metabolisable energy). At the start of the
treatment period (end of May; mid-autumn), the animals were allocated into two dietary
treatment groups (high and low) balanced for training success to semen collection, body
mass, scrotal circumference, temperament, poll-horn type, and sperm quality (the
percentage of live and motile sperm, sperm concentration). The high diet was designed
to allow a gain or a loss of 10% live weight over 65 days: animals fed the High diet
were initially offered 1.2 kg oaten chaff plus 0.3 kg lupin grain, whereas those fed the

Chapter 7-mRNAs and alternative pre-mRNA splicing affect apoptosis and spermatogenesis
135
Low diet were initially offered 0.51 kg chaff and 0.13 kg lupin grain. Every week, the
animals were weighed and the amount of feed offered to each individual was adjusted to
ensure the target change in body mass was achieved. The methodology details and
outcomes for body and testis growth, and for sperm production, have been reported
elsewhere (Chapter 4).
7.3.2 Tissue Collection and preservation
After 65 days, all male sheep were killed with intravenous overdose of sodium
pentobarbitone, and the testes were immediately removed, dissected and weighed. Three
samples were chosen from top, middle and bottom parts of both testes; those from the
right testis were snap-frozen in liquid nitrogen and stored at –80˚C for the present study.
7.3.3 Isolation of RNA
The trizol method was used to isolate total RNA (Hellani et al. 2000) from testis
samples. The quality and quantity of the RNA were determined by Agilent 2100
Bioanalyzer (Agilent Technologies, Santa Clara, CA) and Qubit 2.0 Fluorometer
(Invitrogen, Carlsbad, CA). Only RNA with an integrity number (RIN) greater than 7.0
was used for further analysis.
7.3.4 Small RNA library sequencing
For each sample, 1.0 µg of total RNA was used to construct miRNA libraries with a
unique index using the TruSeq Small RNA Sample Preparation kit (Illumina, San
Diego, CA) according to the manufacturer’s instructions. PCR amplification was
performed for 11 cycles and gel purification was used to individually purify libraries
with unique indices. Individual libraries were then pooled for sequencing at Génome
Québec (Montréal, Canada) using the HiSeq 2000 system (Illumina) to generate 50 bp
single reads. All the reads were de-multiplexed according to their index sequences using

Chapter 7-mRNAs and alternative pre-mRNA splicing affect apoptosis and spermatogenesis
136
CASAVA version 1.8 (Illumina) and reads that did not pass the Illumina chastity filter
were removed from the dataset. Good quality sequencing reads of small RNAs were
subjected to 3’ adaptor sequence trimming, and all reads were mapped by blastn to the
non-coding RNA sequences (Rfam) to remove sequences belonging to tRNA, snoRNA,
rRNA, and other non-coding RNAs.
7.3.5 Identification of miRNAs
The miRNAs were identified using the methods outlined previously (Liang et al. 2014).
Briefly, known miRNAs were identified by mapping the filtered 18 to 25 nt sequences
to miRbase (miRBase release version 20) and all reads from 16 libraries were pooled to
predict novel miRNA using miRDeep2 based on the reference genome sequence,
OAR3.1 (http://www.livestockgenomics.csiro.au/). Small RNA sequences with a
miRDeep2 score higher than 5 and read numbers greater than 10 were defined as novel
miRNAs in sheep. The novel miRNA precursor sequences were then combined with
known miRNA precursor sequences to form a new custom reference database.
Sequencing reads from different samples were mapped to the new custom reference
database to obtain the read number for the known and novel miRNAs for each sample.
7.3.6 Construction and sequencing of the RNA-seq library
In each sample, total RNA (1.0 µg) was used to construct miRNA libraries with a
unique index, according to the instructions of the TruSeq Small RNA Sample
Preparation kit (Illumina, San Diego, CA). Quantitative real time PCR (qPCR) was
performed for library quantification using the StepOnePlus™ Real-Time PCR System
(Applied Biosystems, Carlsbad, CA) and KAPA SYBR Fast ABI Prism qPCR kit (Kapa
Biosystems, Woburn, MA). Individual libraries were then pooled for sequencing at
Génome Québec (Montréal, Canada) using the HiSeq 2000 system (Illumina).
Sequencing was performed as 100 bp paired-end reads. All reads were de-multiplexed

Chapter 7-mRNAs and alternative pre-mRNA splicing affect apoptosis and spermatogenesis
137
according to their index sequences with CASAVA version 1.8 (Illumina) and reads that
did not pass the Illumina chastity filter were discarded.
7.3.7 Mapping and annotation of RNA-seq reads
RNA-seq reads were aligned to the ovine genome (OAR 3.1) using Tophat 2.0.10 with
default parameters (Kim et al. 2013). Each BAM output file from the TopHat2
alignment, along with the GTF file from ENSEMBL (http://uswest.ensembl.org/) ovine
gene annotation v75.30 were used in the htseq-count (http://www-
huber.embl.de/users/anders/HTSeq/) to determine the number of reads mapped to each
gene.
7.3.8 Identification of differentially expressed (DE) miRNAs and mRNAs
DE miRNAs and mRNAs were investigated with the bioinformatics tool, edgeR
(Robinson et al. 2010) that utilizes a negative binomial distribution to model sequencing
data. The expression of miRNAs and mRNAs in each library was normalized to counts
per million reads (CPM) with the formula: CPM = (reads number/total reads number per
library) × 1,000,000. miRNAs and mRNAs with CPM > 5 in at least 50% of the
samples were subjected to DE analysis. Fold changes were defined as ratios of
arithmetic means of CPM within each comparison group. Significant DE miRNAs and
mRNAs were determined by an adjusted P value (False discovery rate, FDR < 0.1)
based on Benjamini and Hochberg multiple testing correction (Benjamini et al. 2001) as
well as fold change > 1.5 (McCarthy and Smyth 2009).
7.3.9 Construction of a miRNA-mRNA regulatory network
The results for miRNAs were all obtained from a previous study using the same
samples (Chapter 6). The predicted regulatory relationships between miRNAs and
mRNAs were identified on the basis of two criteria: negative correlation and

Chapter 7-mRNAs and alternative pre-mRNA splicing affect apoptosis and spermatogenesis
138
computational target prediction. Genes targeted by miRNAs were predicted by
TargetScan Release 6.0 (http://www.targetscan.org/) and miRanda
(http://www.microrna.org/microrna). Target genes predicted by both TargetScan
(default parameters) and miRanda (total score > 145, total energy < –10 kcal/mol) were
used. Pairwise Pearson correlation coefficient (R) was computed for each miRNA and
their predicted target genes, and multiple testing corrections were done by calculating
FDR (Benjamini et al. 2001). Significant miRNA-mRNA pairs were defined as R < –
0.9 and FDR < 0.1.
7.3.10 Functional analysis for DE mRNAs/mRNAs in the miRNA-mRNA regulatory
network
The identities of the DE mRNAs/mRNAs in the miRNA-mRNA regulatory network
were uploaded into IPA software (Ingenuity Systems, www.ingenuity.com) to detect the
top functions. A threshold of P < 0.01 was applied to enrich significant biological
functions. The IPA regulation z-score algorithm was used to predict the direction of
change for a given function (increase or decrease), with a z-score > 2 suggesting a
significant increase whereas a z-score < –2 suggesting a significant decrease.
The GO terms defined and the KEGG pathways enriched using Database for
Annotation, Visualization and Integrated Discovery (DAVID,
http://david.abcc.ncifcrf.gov) (Huang da et al. 2009). For each analysis, the functional
annotation clustering option was used and significant GO terms and KEGG pathways
were declared at P < 0.05 and molecule number > 2.
7.3.11 Identification and annotation of alternative splicing (AS) events
TopHat2 was used to predict the splice junctions. Based on the gene annotation
information, splice junctions were classified into known and novel groups. Splicing

Chapter 7-mRNAs and alternative pre-mRNA splicing affect apoptosis and spermatogenesis
139
analysis was performed for events that had at least 20 total RNA-seq reads (Wang et al.
2008). JuncBASE (Brooks et al. 2011) was used to annotate all AS events (cassette
exons, alternative 5' splice site, alternative 3' splice site, mutually exclusive exons,
coordinate cassette exons, alternative first exons, alternative last exons, and intron
retention). Values for Percentage Spliced Index (PSI) were calculated using the
formulas provided by (McManus et al. 2014).
7.3.12 Identification of differential AS events
Statistical significance was determined using the software package, R (source). Fisher’s
exact test was used to compare PSI values for pairwise comparison, and the P value was
adjusted to false discovery rate (FDR). In addition, only splicing events with FDR <
0.05 and PSI differences (ΔPSI) > 10% were further considered. The number of
differential AS events per chromosome length was calculated.
7.4 Results
7.4.1 High Quality RNA-seq data were obtained from all samples
More than 350 million sequenced paired-end reads were obtained from 16 libraries, of
which an average of 76% could be mapped to OAR3.1
(http://www.livestockgenomics.csiro.au/). The genomics region of reads, the RNA-seq
3'/5' bias and the sequencing depth were analysed to evaluate the quality of the RNA-
seq data. Approximately 81% of the reads were derived from exonic regions, intronic,
gene upstream and downstream regions, whereas 19% were derived from intergenic
regions (Fig. 7.1A and Fig. 7.1B). In general, the coverage of reads along each
transcript revealed no obvious 3'/5' bias, indicating good quality in the sequencing
libraries (Fig. 7.1C). As can be seen in Fig. 7.1D, the number of transcripts detected

Chapter 7-mRNAs and alternative pre-mRNA splicing affect apoptosis and spermatogenesis
140
increased as the number of the sequencing reads increased, and plateaued, suggesting
that almost all of the expressed transcripts were obtained in this study.
Figure 7.1. Quality and features of the RNA-seq datasets obtained from testis of male sheep. Distribution
of the RNA-seq reads from High Diet group (A) and Low Diet group (B) along the annotated features of
the sheep genome. (C) Relationship between the RNA-seq read coverage and the length of the
transcriptional unit. The x-axis indicates the relative length of the transcripts. (D) Saturation curve for
gene detection. Randomly sampled reads are plotted against the expressed genes.
7.4.2 Profile of mRNAs in sheep testis
An average of 13,980,416 (SD = 2,930,788) reads from high diet and 11,014,809 (SD =
2,524,631) from low diet were mapped to Ensembl gene annotation database (P < 0.05).
A total of 13,859 genes were detected in testicular tissue from the low diet group,
compared to 14,561 from the high diet group. In total, 11,748 genes were expressed in

Chapter 7-mRNAs and alternative pre-mRNA splicing affect apoptosis and spermatogenesis
141
all 16 animals. The most abundant transcript (~2% of total reads) was from the 7SK
gene, a small nuclear RNA involved in pre-mRNA splicing and processing. Functional
analysis with DAVID software revealed that the most highly expressed 3000 genes
were mainly related to cell cycles, protein catabolic processes, and spermatogenesis
(Table 7.1). Only genes (14,385) that were expressed in at least 8 libraries were used for
further analysis.
Table 7. 1. The 15 functions most commonly related to the most highly expressed 3000 genes by DAVID
software. P value indicates the relevance of the function (lower value means greater relevance).
Term Gene number P-Value
Cell cycle 232 5.49E-35
Cell cycle process 185 2.43E-33
Modification-dependent macromolecule catabolic process 177 2.43E-28
Modification-dependent protein catabolic process 177 2.43E-28
Proteolysis involved in cellular protein catabolic process 181 1.05E-27
Cellular protein catabolic process 181 2.03E-27
Protein catabolic process 184 4.97E-27
M phase 121 7.18E-27
Intracellular transport 190 1.39E-26
Male gamete generation 114 1.30E-25
Spermatogenesis 114 1.30E-25
Cellular macromolecule catabolic process 200 3.66E-25
Cell cycle phase 135 3.62E-24
Macromolecule catabolic process 208 4.51E-24
Sexual reproduction 144 5.26E-24
7.4.3 Effects of nutrition on mRNA expression

Chapter 7-mRNAs and alternative pre-mRNA splicing affect apoptosis and spermatogenesis
142
In total, 2,243 mRNAs were found to be differentially expressed when comparing
underfed with well-fed male sheep (Appendix Table 7.1), of which, 1,081 were
expressed more in underfed than well-fed sheep (eg, TP53 and Claudin 11) and 1,162
were expressed less in underfed than well-fed sheep (eg, CYP51A1 and SPATA4).
IPA analysis revealed that the functions of most of the DE mRNAs are related to
quantity of germ cells, testis size, quantity of Sertoli cells, and quantity of connective
tissue cells (Fig. 7.2). Among all the genes that were related to these functions, some
were particularly important because they were related to more than one function.
Specifically, the expression of IGF1R and INHBA was higher in well-fed sheep than
Figure 7.2. The 20 functions most commonly related to the mRNAs differentially expressed,in testis from
underfed and well-fed male sheep, as determined by IPA software. P value indicates the relevance of the
function (lower value means greater relevance).

Chapter 7-mRNAs and alternative pre-mRNA splicing affect apoptosis and spermatogenesis
143
under-fed sheep, in contrast with TP53 in which the opposite was observed.
Another functional analysis, DAVID, produced largely the same outcome, indicating
most common functions of DE mRNAs to be cell cycle, spermatid development,
spermatogenesis, and DNA replication (Appendix Table 7.2). Importantly, one gene,
PIWIL1 (MIWI) was associated with all of these functions.
7.4.4 miRNA-mRNA regulatory network
Putative miRNA-mRNA pairs were identified on the basis of target prediction and the
negative regulatory effect of miRNAs on mRNA expression levels. A total of 940
miRNA-mRNA pairs (48 miRNAs, 269 mRNAs) were identified. We focused on oar-
novel-miR-33 and oar-novel-miR-31, because they paired with the highest number of
mRNAs: oar-novel-miR-33 paired with 68 mRNAs and oar-novel-miR-31 paired with
52 mRNAs (Fig. 7.3).
Figure 7. 3. Regulatory networks for two pairs of miRNAs and mRNAs that were differentially expressed
in sheep testis following nutritional treatment: oar-novel-miR-33 with 68 mRNAs, and oar-novel-miR-31
with 52 mRNAs.
Chapter 7-mRNAs and alternative pre-mRNA splicing affect apoptosis and spermatogenesis
144
IPA analysis indicated that the mRNAs in the negative pairs were mainly involved with
organization of cytoplasm, morphology of cells, abnormal morphology of reproductive
system, cell death and male infertility (Fig. 7.4A). Among the 15 most common
functions, we focused on genes that are related to at least 8 functions: AR, FOXO3,
PMS2 and PTEN. The expression of these genes was higher in well-fed sheep than
underfed sheep, except for PTEN in which the opposite was observed. In addition, these
mRNAs were also involved in 76 signalling pathways, of which Sertoli cell-Sertoli cell
junction signalling, germ cell-Sertoli cell junction signalling, androgen signalling,
apoptosis signalling were among the 15 most relevant (Fig. 7.4B). Again, DAVID was
used to further confirm the analysis and identified 62 clustered functions, the 10 most
relevant including regulation of apoptosis, cell cycle, development of germ cells
(Appendix Table 7.3).
7.4.5 Identification of alternative splicing events
We initially obtained 42,945 exon-exon junctions from the 16 RNA-seq libraries with
the Tophat software. For further analysis, we focused on alternative splicing junctions
that could be detected in at least 8 animals and also be matched to genes. This process
provided a total of 19,370 junctions and 4,584 unique mRNAs. Among these junctions,
only 5,858 (30.2%) were previously annotated in the Ensembl Database. In terms of the
alternative splicing event, we identified 3,876 cassette exons, 3,496 alternative 5' splice
sites, 3,848 alternative 3' splice sites, 41 mutually exclusive exons, 612 coordinate
cassette exons, 1,204 alternative first exons, 428 alternative last exons, and 5,865 intron
retentions, from the 16 libraries.
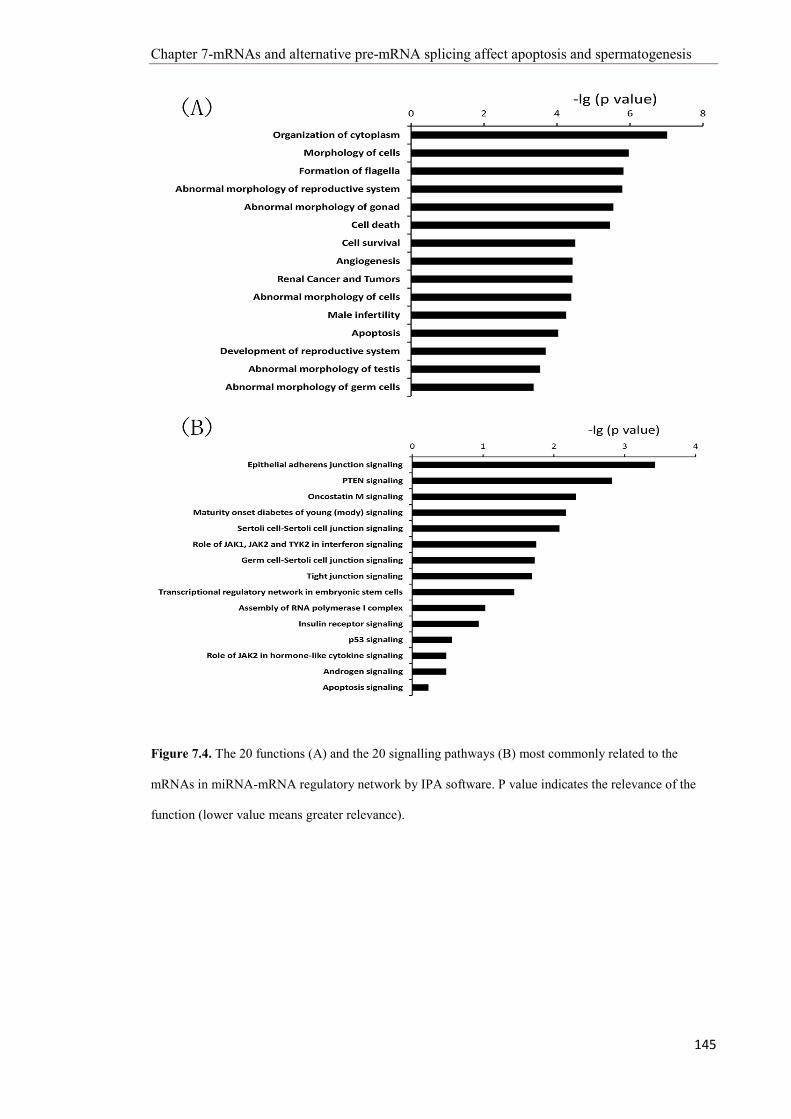
Chapter 7-mRNAs and alternative pre-mRNA splicing affect apoptosis and spermatogenesis
145
Figure 7.4. The 20 functions (A) and the 20 signalling pathways (B) most commonly related to the
mRNAs in miRNA-mRNA regulatory network by IPA software. P value indicates the relevance of the
function (lower value means greater relevance).

Chapter 7-mRNAs and alternative pre-mRNA splicing affect apoptosis and spermatogenesis
146
7.4.6 Effects of nutrition on alternative splicing
We found 16,650 ± 451 (Mean ± SD) junctions in the High Diet group and 15,847 ±
857 junctions in the Low Diet group (not significant). Each type of alternative splicing
event was counted for each treatment and, again, there were no significant differences
between treatments (Fig. 7.5). The Fisher’s Exact Test on the PSI value indicated that
1,040 alternative splicing events (284 alternative acceptor, 279 alternative donor, 164
alternative first exon, 52 alternative last exon, 218 cassette, 14 coordinate cassette exon,
25 intron retention events, 4 mutually exclusive exon) were affected by nutrition (FDR
< 0.05, ∆PSI > 10%). Underfeeding increased the PSIs of 608 alternative splicing
events and decreased the PSIs of the remaining 432 events (Appendix Table 7.4). Since
one mRNA can have more than one alternative splicing junction, a total of 788 unique
genes were identified as differential alternative splicing genes, including CREM, HIPK3
and MAP2 (Appendix Table 7.5). Interestingly, Chromosomes 11, 7 and 3 had the
greatest number of differential alternative splicing events per chromosome length
(Appendix Table 7.6). In addition, Wilcoxon tests indicated that the coefficient of
variation of the alternative splicing events was higher in underfed sheep than in well-fed
sheep (0.13 vs 0.06, P < 0.001), indicating a greater rate of change in underfed testis.

Chapter 7-mRNAs and alternative pre-mRNA splicing affect apoptosis and spermatogenesis
147
Figure 7.5. The counts of each type of alternative splicing event in testicular tissues from underfed and
well-fed male sheep. Values = Mean ± SEM (n = 8). Most common alternative splicing events were
cassette exon, intron retention, alternative first exon and alternative last exon. Conversely, four types
were not as common, they were alternative 3' splice site, mutually exclusive exons, alternative 5' splice
site, coordinate cassette exons.
DAVID functional analysis revealed the most common functions of differential
alternative splicing events were related to protein localization, cellular metabolic
process, post-translational protein modification, mRNA processing and spermatogenesis
(Fig. 7.6).

Chapter 7-mRNAs and alternative pre-mRNA splicing affect apoptosis and spermatogenesis
148
Figure 7.6. The 15 functions most commonly related to the differential alternative splicing events by
DAVID software. P value indicates the relevance of the function (lower value means greater relevance).
7.5 Discussion
This study appears to be the first to profile the whole transcriptome in sheep testis, to
construct the network between miRNAs and mRNAs in testis, and to explore the
relationships between pre-mRNA alternative splicing and testis function. In the context
of an experimental model of reversible testis growth in the sexually mature male, we
have been able to identify mRNAs that are associated with testis function and, more
importantly, apoptosis in germ cells. These findings strongly support the hypothesis that
the decline in spermatogenesis and increase in germ cell apoptosis induced by under-

Chapter 7-mRNAs and alternative pre-mRNA splicing affect apoptosis and spermatogenesis
149
nutrition in the sexually mature male sheep are, at least, partially due to changes in
mRNA expression and pre-mRNA alternative splicing.
The most abundant transcript was 7SK, as reported for mouse testis (Laiho et al. 2013).
The function of 7SK in the testis is still unknown, but 7SK is a RNA polymerase III type
III promoter, and a small nuclear RNA involved in pre-mRNA splicing and processing
(Cummins et al. 2008). It is therefore likely that 7SK regulates testis function by
affecting small RNAs and pre-mRNA splicing.
We found over 2000 mRNAs that were differentially expressed between treatments,
with over 1000 mRNAs, including TP53 and Claudin 11, that were more highly
expressed in underfed than in well-fed sheep. This result supports our previous
observations based on qPCR (Chapter 5). A high level of TP53 indicates more cells
going through apoptosis (Li and Jogl 2009), so we conclude that under-nutrition
increases apoptosis in germ cells. On the other hand, Claudin-11 is a tight junction
protein expressed in Sertoli cells and rarely in other cell types in the testis (Morita et al.
1999) and plays a central role in the formation of tight junctions (Gow et al. 1999;
Wolburg et al. 2001). In testicular tissue from underfed sheep, expression of Claudin 11
is increased and the localization of Claudin 11 protein is disorganized (Chapter 5)
strongly indicating impairment of tight junctions. In addition, in the present study, over
1000 mRNAs showed lower expression in underfed than in well-fed sheep, including
CYP51A1 and SPATA4. CYP51A1 is a member of the cytochrome P450 family and is
expressed strongly by germ cells (Rozman and Waterman 1998), illustrating its crucial
role in spermatogenesis. Therefore, the lower level of CYP51A1 expression in underfed
sheep is coherent with the decrease in numbers of germ cells and defective
spermatogenesis caused by undernutrition (Chapter 4 and 5). SPATA4 has also been
reported to be testis-specific and associated with spermatogenesis, and involved in

Chapter 7-mRNAs and alternative pre-mRNA splicing affect apoptosis and spermatogenesis
150
maintaining spermatogenesis (Liu et al. 2004). Therefore, the reduced expression of
SPATA4 in underfed sheep is also consistent with compromised spermatogenesis with
under-nutrition.
The functional analysis using IPA revealed that, for mRNAs that are differentially
expressed between nutritional treatments, the most common functions are quantity of
germ cells, testis size, quantity of Sertoli cells and quantity of connective tissue cells.
Therefore, the differentially expressed transcriptomes are consistent with the reductions
of testis mass and sperm production in underfed rams (Chapter 4). Among all the genes
that were related to these functions, we considered the most important to be those
related to more than one function, such as IGF1R, INHBA and TP53. In the testes of
adult mice lacking IGF1R in their Sertoli cells, there is a reduction in testis size and
daily sperm production (Pitetti et al. 2013), indicating a role for IGF1R in control of
sperm production by Sertoli cells. A protein product of the INHBA gene, activin A, is an
important regulator of testicular cell proliferation (Archambeault and Yao 2010). As
indicated above, TP53 regulates spermatogenesis by inducing apoptosis (Chen et al.
2012). We conclude that, the expression of IGF1R, INHBA and TP53 may be used as
biomarkers of sperm production.
Functional analysis based on DAVID indicated a similar range of functions for the
differentially expressed mRNAs, but highlighted one gene, PIWIL1 (MIWI) associated
with all the above functions. It has been reported that PIWI 1 (MIWI) encodes a
cytoplasmic protein specifically expressed in spermatocytes and spermatids (Bak et al.
2011). In addition, Miwinull mice display spermatogenic arrest at the beginning of the
round spermatid stage (Deng and Lin 2002). In recent years, piRNAs have been
reported to play important roles in spermatogenesis (Liu et al. 2012a), although the
exact mechanism of action have not yet been elucidated. One possibility is that piRNAs

Chapter 7-mRNAs and alternative pre-mRNA splicing affect apoptosis and spermatogenesis
151
and PIWI proteins form a complex, the PIWI-interacting RNA complex (piRC), that
triggers gene silencing, a possibility supported by the finding that piRC can be extracted
and purified from rat testis (Lau et al. 2006). The roles of piRNAs in spermatogenesis
are indicated by the known functions of their partner, the PIWI proteins, one of the most
important of which is MIWI (Beyret and Lin 2011). Therefore, one of the explanations
for the reduced spermatid development and spermatogenesis in underfed sheep is that
under-nutrition changes the function of piRNAs by affecting the expression of MIWI.
Based on target prediction and the negative effects of miRNAs on the expression of
mRNAs, a total of 940 miRNA-mRNA pairs were indentified, including 48 miRNAs
and 269 mRNAs. Of particular importance are oar-novel-miR-33 and oar-novel-miR-31
because they paired with the greatest number of mRNAs, indicating a crucial role in
testis function. Novel-miR-33 is homologous to miR-296 that is specific to embryonic
stem cells and has been reported to be highly conserved between species (Gangaraju
and Lin 2009). So far, there is no direct evidence for a role for miR-296 in testis
function. However, one study proved that miR-296 was more highly expressed in
mature testis than in immature testis, indicating a pivotal role in spermatogenesis in the
adult. In addition, miR-296 was also defined as anti-apoptotic (Cheng et al. 2005).
Therefore, the reduced expression of novel-miR-33 (miR-296) in underfed sheep
(Chapter 6) illustrates decreased testis function and increased cell apoptosis. By
contrast, novel-miR-31 is homologous with miR-34 which has been shown to enhance
the expression of germ cell-specific genes in late spermatogenesis in other species
(Bouhallier et al. 2010). In the current study, therefore, the lower level of novel-miR-31
in underfed sheep is coherent with the loss of germ cell function (Chapter 4).
Approximately 33% of genes in the sheep testis were alternatively spliced, a percentage
that agrees with the 21% found in the whole bovine transcripts (Chacko and

Chapter 7-mRNAs and alternative pre-mRNA splicing affect apoptosis and spermatogenesis
152
Ranganathan 2009). Approximately 70% of the junctions have not been annotated
previously, so they represent novel isoforms of known genes. Nutritional treatment did
not affect the total number of alternative splicing junctions, in contrast with some
previous reports of nutritional effects on other biological processes (Salati et al. 2004;
Kulseth et al. 2010). The lack of effect of nutritional treatment on the total number of
alternative splicing junctions suggests that alternative splicing is a fine-tuner in the
testis that stabilizes testis function, as suggested for other tissues (Elton and Martin
2003; Wu et al. 2013).
On the other hand, with respect to specific genes, we found almost 800 that were
differentially spliced between high diet and low diet groups. Functional analysis of
these genes indicated their roles in protein localization, cellular metabolic process, post-
translational protein modification, mRNA processing and spermatogenesis, and
suggests that nutrition affects protein localization and spermatogenesis by changing pre-
mRNA splicing. These findings may help us to explain the disrupted localization of the
tight junction-related protein, Claudin 11, and the reduced expression of the tight
junction-related gene, ZO-1, in testicular tissue from underfed sheep (Chapter 5).
However, it is difficult to define the specific gene(s) that control the localization of a
protein like Claudin 11, so future studies on verification of alternative splicing activity,
possibly involving construction of a shortened ‘minigene’ containing the regulated
exons and splicing signals (Stoss et al. 1999), will be required to better understand this
process.
Among the differentially spliced genes, we focused on CREM, MAP2, HIPK3 and
TRa2β, because the differences between nutritional treatments in their percentage
splicing index were higher than for other genes and their variant transcripts were crucial
in testis function. For example, the alternative splicing type for CREM (cAMP response
Chapter 7-mRNAs and alternative pre-mRNA splicing affect apoptosis and spermatogenesis
153
element modulator) is alternative last exon. It has been reported that CREM mRNA
exhibits a remarkable array of alternative splice variants (Sanborn et al. 1997). For
example, during male meiosis, the inactive CREM variant is switched to active CREM
variant (by incorporation of transactivating domains) directed by alternative splicing.
Therefore, in the mature male sheep, it is possible that nutrition affects the number of
active CREM isoforms, potentially explaining the disruption of spermatogenesis in
underfed sheep. Considering MAP2, previous studies suggest that a low molecular
weight isoform, resulting from alternative splicing of the MAP2 gene, is the
predominant isoform in the testis (Loveland et al. 1999). According to the PSI formula,
the higher number of reads of exclusion junctions results in a lower PSI value
(McManus et al. 2014), so the lower PSI value in underfed sheep suggests that most of
the MAP in testicular tissue in these animals is the exon-exclusion isotype and that this
isotype is responsible for the defective spermatogenesis. The third gene of interest,
alternatively spliced at the 5’ site, is homeodomain-interacting protein kinase (HIPK3),
a member of a gene family that has been implicated in apoptosis (Curtin and Cotter
2004). It has been reported that the splicing of HIPK3 is testis-specific (Venables et al.
2005), and thus plays an important role in spermatogenesis. Importantly, the alternative
splicing of HIPK3 is thought to be regulated by the fourth gene of interest, Transformer-
2 Protein Homolog Beta2 (TRa2β) (Venables et al. 2005), a gene that is known to be
highly expressed in testis (Venables et al. 2000). In the current study, nutritional
treatment did not affect the total expression of TRa2β, so differences in the splicing of
TRa2β rather than the amount of expression, might explain the differences in HIPK3
alternative splicing between treatments, and follow-on effects for spermatogenesis and
apoptosis.
In conclusion, we have identified two molecular mechanisms that could explain the
effect of nutrition on spermatogenesis and germ cell apoptosis in the adult male: 1)

Chapter 7-mRNAs and alternative pre-mRNA splicing affect apoptosis and spermatogenesis
154
nutrition-induced changes in the expression of mRNAs in sheep testis, the functions of
the differentially expressed mRNAs are mainly related to spermatogenesis and germ
cell apoptosis, an important regulator in these processes are the networks between
miRNAs and mRNAs; 2) nutritional treatment causes differences in pre-mRNA
alternative splicing, and these changes are closely involved in spermatogenesis and
germ cell apoptosis in testis. Some differentially spliced genes including CREM, MAP2,
HIPK3 and TRa2β should be able to work as potential biomarkers for spermatogenesis
and apoptosis. To move the study moving forward, confirming the predicted functions
of these genes using in vivo and in vitro experiments are required.

Chapter 8-General Discussion
155
Chapter 8
General Discussion
The general hypothesis of this thesis was that, in adult male sheep, under-nutrition will
reduce the quantity and quality of sperm produced, due to germ cell apoptosis, that
these responses will be explained by reductions in the number and function of Sertoli
cells, and that such effects are mediated by changes in the expression of small RNAs
and mRNAs, and by alternative pre-mRNA splicing. My observations support all of
these hypotheses except the change of Sertoli cell number.
The dietary treatments induced major changes in testis mass, sperm production and
spermatogenic efficiency. Importantly, these responses are reversible and non-
pathological, demonstrating the power of our experimental model for investigating the
cellular and molecular mechanisms that control the quantity and quality of sperm
produced in the ejaculate. The effects of under-nutrition on sperm number had been
known for some time, but it is now clear that sperm quality, including sperm velocity
and sperm cell DNA damage, are also affected. How this translates to fertility in the
field, with underfed rams mating in commercial sheep flocks, is yet to be determined.
Interestingly, when we used change in scrotal circumference as an independent variable,
combining the data for all dietary groups, strong correlations between some measures of
sperm production and function could be detected, but they disappeared when the data
for the under-fed group were omitted from the analysis. This observation suggests that
factors associated with a loss in testis mass, rather than direct effects of the nutritional
treatments, are responsible for the changes in the production and quality of sperm.
Moreover, in contrast with well-fed and maintenance-fed rams, spermatogenesis in
Chapter 8-General Discussion
156
testicular tissue of under-fed rams was generally disrupted, as evidenced by lower
Johnsen Score, narrower seminiferous tubules, and a smaller proportion of seminiferous
epithelium. Therefore, we conclude that nutrition affects sperm production by altering
spermatogenesis, and that the relationships between testis mass and semen parameters
could be applied more generally to other non-nutritional factors that affect testis mass,
such as genotype, photoperiod or physical fitness.
In contrast with the finding by (Hötzel et al. 1998), there was no evidence that the
number of Sertoli cells was affected by diet. The possible reasons for the contrasting
results have been comprehensively discussed in Chapter 5 and, in brief, it seems likely
that the histological techniques used in the original study were unsuitable for this
experimental model. Therefore, observations based on the effect of nutrition on the
testis of the sexually mature male sheep no longer contradict the dogma that Sertoli cell
number is stable and changes little after puberty. Conversely, the detection of
proliferating cell nuclear antigen (PCNA) in a number of Sertoli cells does suggest that
some of the cells retain an ability to divide after puberty, although the number of
PCNA-positive Sertoli cells was neither affected by nutritional treatment nor related to
changes in testis mass.
In contrast with the lack of change in Sertoli cell number, Sertoli cell function was
clearly affected by nutritional treatment, as evidenced by changes in cell tight junction
and maturation status, with loss of testis mass and under-nutrition apparently inducing a
reversal of these aspects of terminal differentiation. These changes in Sertoli cell
function seem likely to explain the outcomes for sperm quality and production with
underfeeding. At the level of spermatogenesis, the consequences seem to be an increase
in the rate of apoptosis in germ cells, an observation consistent with the reduction in
spermatogenic efficiency in the testis of under-fed sheep.

Chapter 8-General Discussion
157
To explore in the possible molecular mechanisms that might underpin the responses in
spermatogenesis and apoptosis, we investigated small RNAs and the combination of
this concept with our experimental model has opened up an entire new area of testicular
biology, for all species, not just sheep. In total, we found 44 miRNAs and 35 piRNAs
that were differentially expressed (DE) with the high and low diets. The targets of the
DE miRNAs are mainly involved in the synthesis of lipids and hormones, the
morphology of enlarged testis, and the production of sperm. Most importantly, we
found some potential biomarkers that were highly specific to spermatogenesis and
apoptosis. For example, novel-miR-144 (homologous with miR-98) is linked with
apoptosis, although we still do not know whether the increased expression of miR-144
in underfed rams is the cause or the consequence of enhanced apoptosis. In addition,
novel-miR-31 (homologous with miR-34) seems likely to be a biomarker of germ cell
phenotype during the late stages of spermatogenesis (Bouhallier et al. 2010). With
respect to the DE piRNAs, it is even more difficult to predict specific functions in sheep
because their sequences are poorly conserved among species. We therefore only focused
on the gene-derived DE piRNAs and predicted their functions based on previous
references – for instance, feline leukemia virus subgroup C receptor-related protein 2
(FLVCR2), which produces piR-12568 and functions as a calcium transporter, is know
to affect reproduction (Meyer et al. 2010). Overall, it is clear that changes in the
expression of small RNAs can help explain how nutrition affects sperm production and
quality, but it is early days for this field and there is room for a lot more work.
RNA-seq allowed us to profile gene expression in testis tissue that has been affected by
nutrition. More than 2200 mRNAs were differentially expressed in underfed and well-
fed sheep, and functional analysis suggests that they were predominantly related to
germ cells, testis size, apoptosis and spermatogenesis. Indeed, two of these mRNAs
code for the proteins that we used to reveal the effects of nutrition on Sertoli cell tight
Chapter 8-General Discussion
158
junctions (Claudin 11) and germ cell apoptosis (TP53). Meanwhile, based on target
prediction and the inhibition of mRNA expression by miRNAs, a total of 940 miRNA-
mRNA pairs were identified, including 48 miRNAs and 269 mRNAs. Functional
analysis indicates that the mRNAs inhibited by miRNAs are mainly involved with cell
morphology, abnormal morphology in the reproductive system, cell death and male
infertility. We therefore conclude that, in addition to changing small RNAs, under-
nutrition changes the expression of mRNAs that affect the quantity and quality of the
sperm produced.
In addition, approximately 800 genes, including CREM, HIPK3 and MAP2, were
spliced differentially in the dietary treatments. These genes were mostly related to
protein localization, cellular metabolic processes, post-translational protein modification
and spermatogenesis. It is therefore possible that changes in alternative pre-mRNA
splicing are responsible for the effects on nutrition on spermatogenesis and germ cell
apoptosis.
In conclusion, in sexually mature male sheep, under-nutrition reduces spermatogenic
efficiency and sperm velocity, and increases sperm DNA damage. These processes are
not associated with the changes of Sertoli cell number, but are associated with increased
germ cell apoptosis and disrupted Sertoli cell function. It seems very likely that these
outcomes are mediated by changes in three RNA-based processes: the expression of
small RNAs, the expression of mRNAs, and the alternative pre-mRNA splicing. Our
findings have led us to develop a working hypothesis that explains how nutrition affects
testis function (Fig. 8.1). Specifically, under-nutrition leads to a reduction in FSH
secretion (Zhang et al. 2004), a key hormone associated with the function of Sertoli
cells and, changes in Sertoli cell function, including the disorganization of tight
junctions and reversal of cell maturity (Chapter 5). The outcome is impaired

Chapter 8-General Discussion
159
spermatogenesis and reductions in the number of germ cells per unit mass of testis, and
Figure 8.1. A working hypothesis of the mechanisms through which nutrition affects testis function in the
sexually mature sheep, indicating roles that could be played by small RNAs. Stimulation is indicate by
“+ve” and inhibition is indicated by “–ve”. The effects of undernutrition on each regulatory factor are
indicated by vertical arrows. Solid lines denote pathways supported by strong evidence whereas broken
lines indicate pathways where the evidence is still accumulating. Nutritional and metabolic signals do not
seem to affect the proliferation of Sertoli cells but they do affect Sertoli cell function, notably the
organization of tight junctions and cellular maturation. The Sertoli cell responses, combined with
nutrition-induced changes in germ cell apoptosis, affect the quantity and quality of sperm produced.
Several small RNAs are strongly affected by undernutrition: miR-34c, miR-10b, piR-9006 and piR-12568
are directly associated with spermatogenesis; miR-98 and miR-26a regulate apoptosis of germ cells; miR-
99a is predicted to regulate tight junctions by targeting ZO-1 expression. In addition, there are
correlations between the proportions of miRNAs and piRNAs, although it is not clear whether this
reflects mutual regulation, and there appears to be a feedback loop linking apoptosis and miR-98
expression.

Chapter 8-General Discussion
160
increases in germ cell apoptosis that dramatically reduced the quantity and quality of
sperm (Chapter 4). Small RNAs seem to be involved in these processes. Specifically,
miR-98 appears to regulate germ cell apoptosis by changing the expression of CASP3,
TP53 and FASL in parallel with the direct effects of miR-26. Similarly, changes in
expression of miR-99a seem to affect the organization of Sertoli-cell tight junctions by
targeting ZO-1 (Turcatel et al. 2012). The other small RNAs that we have detected
(miR-26, miR-34c, miR-10b, piR-9006, piR-12568) are involved in the control of
reproductive function in other species, so might also contribute to the effects of
nutrition on spermatogenesis in the sexually mature sheep. The role of piRNAs in this
process is far from clear, but the distinct differences between well-fed and under-fed
males in piRNA expression, and in the proportion of piRNAs as a total of small RNAs,
suggest that they also play an important, possibly synergistic, role.
This new understanding of the control of Sertoli cell function and spermatogenesis will
contribute to efforts to find ways to mitigate the negative effects of under-nutrition on
male fertility.

References
161
References
Abel, M. H., Baker, P. J., Charlton, H. M., Monteiro, A., Verhoeven, G., De Gendt, K., Guillou, F., and O'Shaughnessy, P. J. (2008). Spermatogenesis and sertoli cell activity in mice lacking sertoli cell receptors for follicle-stimulating hormone and androgen. Endocrinology. 149, 3279-3285.
Abu-Halima, M., Backes, C., Leidinger, P., Keller, A., Lubbad, A. M., Hammadeh, M., and Meese, E. (2014). MicroRNA expression profiles in human testicular tissues of infertile men with different histopathologic patterns. Fertil. Steril. 101, 78-86 e72.
Agarwal, A., Saleh, R. A., and Bedaiwy, M. A. (2003). Role of reactive oxygen species in the pathophysiology of human reproduction. Fertil. Steril. 79, 829-843.
Aitken, R. J., De Iuliis, G. N., Gibb, Z., and Baker, M. A. (2012). The Simmet lecture: new horizons on an old landscape--oxidative stress, DNA damage and apoptosis in the male germ line. Reprod. Domest. Anim. 47 Suppl 4, 7-14.
Al-Attar, L., Noel, K., Dutertre, M., Belville, C., Forest, M. G., Burgoyne, P. S., Josso, N., and Rey, R. (1997). Hormonal and cellular regulation of Sertoli cell anti-Mullerian hormone production in the postnatal mouse. J. Clin. Invest. 100, 1335-1343.
Alejandro, B., Perez, R., Pedrana, G., Milton, J. T., Lopez, A., Blackberry, M. A., Duncombe, G., Rodriguez-Martinez, H., and Martin, G. B. (2002). Low maternal nutrition during pregnancy reduces the number of Sertoli cells in the newborn lamb. Reprod. Fertil. Dev. 14, 333-337.
Allan, C. M., Garcia, A., Spaliviero, J., Jimenez, M., and Handelsman, D. J. (2006). Maintenance of spermatogenesis by the activated human (Asp567Gly) FSH receptor during testicular regression due to hormonal withdrawal. Biol. Reprod. 74, 938-944.
Anttonen, M., Ketola, I., Parviainen, H., Pusa, A. K., and Heikinheimo, M. (2003). FOG-2 and GATA-4 Are coexpressed in the mouse ovary and can modulate mullerian-inhibiting substance expression. Biol. Reprod. 68, 1333-1340.
Aravin, A., Gaidatzis, D., Pfeffer, S., Lagos-Quintana, M., Landgraf, P., Iovino, N., Morris, P., Brownstein, M. J., Kuramochi-Miyagawa, S., Nakano, T., Chien, M., Russo, J. J., Ju, J., Sheridan, R., Sander, C., Zavolan, M., and Tuschl, T. (2006). A novel class of small RNAs bind to MILI protein in mouse testes. Nature. 442, 203-207.
Archambeault, D. R., and Yao, H. H. (2010). Activin A, a product of fetal Leydig cells, is a unique paracrine regulator of Sertoli cell proliferation and fetal testis cord expansion. Proc. Natl. Acad. Sci. U. S. A. 107, 10526-10531.

References
162
Ayroldi, E., D'Adamio, F., Zollo, O., Agostini, M., Moraca, R., Cannarile, L., Migliorati, G., Delfino, D. V., and Riccardi, C. (1999). Cloning and expression of a short Fas ligand: A new alternatively spliced product of the mouse Fas ligand gene. Blood. 94, 3456-3467.
Bak, C. W., Yoon, T. K., and Choi, Y. (2011). Functions of PIWI proteins in spermatogenesis. Clin. Exp. Reprod. Med. 38, 61-67.
Bao, H., Kommadath, A., Plastow, G. S., Tuggle, C. K., Guan le, L., and Stothard, P. (2014). MicroRNA buffering and altered variance of gene expression in response to Salmonella infection. PLoS One. 9, e94352.
Bao, H., Kommadath, A., Sun, X., Meng, Y., Arantes, A. S., Plastow, G. S., Guan le, L., and Stothard, P. (2013). Expansion of ruminant-specific microRNAs shapes target gene expression divergence between ruminant and non-ruminant species. BMC Genomics. 14, 609.
Bartel, D. P. (2009). MicroRNAs: target recognition and regulatory functions. Cell. 136, 215-233.
Bawa, S. R. (1963). Fine Structure of the Sertoli Cell of the Human Testis. J. Ultrastruct Res. 52, 459-474.
Beau, C., Rauch, M., Joulin, V., Jegou, B., and Guerrier, D. (2000). GATA-1 is a potential repressor of anti-Mullerian hormone expression during the establishment of puberty in the mouse. Mol. Reprod. Dev. 56, 124-138.
Benard, J., Douc-Rasy, S., and Ahomadegbe, J. C. (2003). TP53 family members and human cancers. Hum. Mutat. 21, 182-191.
Benjamini, Y., Drai, D., Elmer, G., Kafkafi, N., and Golani, I. (2001). Controlling the false discovery rate in behavior genetics research. Behav. Brain Res. 125, 279-284.
Beyret, E., and Lin, H. (2011). Pinpointing the expression of piRNAs and function of the PIWI protein subfamily during spermatogenesis in the mouse. Dev. Biol. 355, 215-226.
Bickell, S. L., Nowak, R., Poindron, P., Sebe, F., Chadwick, A., Ferguson, D., and Blache, D. (2009). Temperament does not affect the overall establishment of mutual preference between the mother and her young in sheep measured in a choice test. Dev. Psychobiol. 51, 429-438.
Bicsak, T. A., Vale, W., Vaughan, J., Tucker, E. M., Cappel, S., and Hsueh, A. J. (1987). Hormonal regulation of inhibin production by cultured Sertoli cells. Mol. Cell Endocrinol. 49, 211-217.
Bielli, A., Katz, H., Pedrana, G., Gastel, M. T., Morana, A., Castrillejo, A., Lundeheim, N., Forsberg, M., and Rodriguez-Martinez, H. (2001). Nutritional management during fetal and

References
163
postnatal life, and the influence on testicular stereology and Sertoli cell numbers in Corriedale ram lambs. Small Rumin. Res. 40, 63-71.
Billig, H., Chun, S. Y., Eisenhauer, K., and Hsueh, A. J. (1996). Gonadal cell apoptosis: hormone-regulated cell demise. Hum. Reprod. Update. 2, 103-117.
Birney, E., Andrews, D., Caccamo, M., Chen, Y., Clarke, L., Coates, G., Cox, T., Cunningham, F., Curwen, V., Cutts, T., Down, T., Durbin, R., Fernandez-Suarez, X. M., Flicek, P., Graf, S., Hammond, M., Herrero, J., Howe, K., Iyer, V., Jekosch, K., Kahari, A., Kasprzyk, A., Keefe, D., Kokocinski, F., Kulesha, E., London, D., Longden, I., Melsopp, C., Meidl, P., Overduin, B., Parker, A., Proctor, G., Prlic, A., Rae, M., Rios, D., Redmond, S., Schuster, M., Sealy, I., Searle, S., Severin, J., Slater, G., Smedley, D., Smith, J., Stabenau, A., Stalker, J., Trevanion, S., Ureta-Vidal, A., Vogel, J., White, S., Woodwark, C., and Hubbard, T. J. (2006). Ensembl 2006. Nucleic Acids Res. 34, D556-561.
Bjorndahl, L., Soderlund, I., and Kvist, U. (2003). Evaluation of the one-step eosin-nigrosin staining technique for human sperm vitality assessment. Hum. Reprod. . 18, 813-816.
Blache, D., Zhang, S., and Martin, G. B. (2003). Fertility in male sheep: modulators of the acute effects of nutrition on the reproductive axis of male sheep. Reprod. Suppl. 61, 387-402.
Blais, M. E., Brochu, S., Giroux, M., Belanger, M. P., Dulude, G., Sekaly, R. P., and Perreault, C. (2008). Why T cells of thymic versus extrathymic origin are functionally different. J. Immunol. 180, 2299-2312.
Blanco-Rodriguez, J., and Martinez-Garcia, C. (1996). Spontaneous germ cell death in the testis of the adult rat takes the form of apoptosis: re-evaluation of cell types that exhibit the ability to die during spermatogenesis. Cell Prolif. 29, 13-31.
Bochenek, M., Smorag, Z., and Pilch, J. (2001). Sperm chromatin structure assay of bulls qualified for artificial insemination. Theriogenology. 56, 557-567.
Boe-Hansen, G. B., Ersboll, A. K., and Christensen, P. (2005). Variability and laboratory factors affecting the sperm chromatin structure assay in human semen. J. Androl. 26, 360-368.
Bouhallier, F., Allioli, N., Lavial, F., Chalmel, F., Perrard, M. H., Durand, P., Samarut, J., Pain, B., and Rouault, J. P. (2010). Role of miR-34c microRNA in the late steps of spermatogenesis. RNA. 16, 720-731.
Boukhliq, R., Martin, G. B., White, C. L., Blackberry, M. A., and Murray, P. J. (1997). Role of glucose, fatty acids and protein in regulation of testicular growth and secretion of gonadotrophin, prolactin, somatotrophin and insulin in the mature ram. Reprod. Fertil. Dev. 9, 515-524.

References
164
Braden, A. W. H., Turnbull, K. E., Mattner, P. E., and Moule, G. R. (1974). Effect of protein and energy content of the diet on the rate of sperm production in rams. Aust. J. Biol. Sci. 27, 67-73.
Breen, K. M., Oakely, A. E., Pytiak, A. V., Tilbrook, A. J., Wagenmaker, E. R., and Karsch, F. J. (2007). Does cortisol acting via the type II glucocorticoid receptor mediate suppression of pulsatile LH secretion in response to psychosocial stress? . Endocrinology 148, 1882-1890.
Brinster, R. L. (2007). Male germline stem cells: from mice to men. Science. 316, 404-405.
Brinster, R. L., and Zimmermann, J. W. (1994). Spermatogenesis following male germ-cell transplantation. Proc. Natl. Acad. Sci. U. S. A. 91, 11298-11302.
Broekhuijse, M. L., Sostaric, E., Feitsma, H., and Gadella, B. M. (2012). Application of computer-assisted semen analysis to explain variations in pig fertility. J. Anim. Sci. 90, 779-789.
Brooks, A. N., Yang, L., Duff, M. O., Hansen, K. D., Park, J. W., Dudoit, S., Brenner, S. E., and Graveley, B. R. (2011). Conservation of an RNA regulatory map between Drosophila and mammals. Genome Res. 21, 193-202.
Buetow, S. A. (1995). Epidemiology of testicular cancer. Epidemiol. Rev. 17, 433-449.
Byers, S., Graham, R., Dai, H. N., and Hoxter, B. (1991). Development of Sertoli cell junctional specializations and the distribution of the tight-junction-associated protein ZO-1 in the mouse testis. Am. J. Anat. 191, 35-47.
Calamita, G., Mazzone, A., Bizzoca, A., and Svelto, M. (2001). Possible involvement of aquaporin-7 and -8 in rat testis development and spermatogenesis. Biochem. Biophys. Res. Commun. 288, 619-625.
Caldani, M., Batailler, M., Thiery, J. C., and Dubois, M. P. (1988). LHRH-immunoreactive structures in the sheep brain. Histochemistry. 89, 129-139.
Cameron, A. W. N., Murphy, P. M., and Oldham, C. M. (1988). Nutrition of rams and output of sperm. Proc. Aust. Soc. Anim. Prod. 17, 162-165.
Caraty, A., and Locatelli, A. (1988). Effect of time after castration on secretion of LHRH and LH in the ram. J. Reprod. Fertil. 82, 263-269.
Chacko, E., and Ranganathan, S. (2009). Genome-wide analysis of alternative splicing in cow: implications in bovine as a model for human diseases. BMC Genomics. 10 Suppl 3, S11.
Chen, D., Zheng, W., Lin, A., Uyhazi, K., Zhao, H., and Lin, H. (2012). Pumilio 1 suppresses multiple activators of p53 to safeguard spermatogenesis. Curr. Biol. 22, 420-425.
References
165
Cheng, A. M., Byrom, M. W., Shelton, J., and Ford, L. P. (2005). Antisense inhibition of human miRNAs and indications for an involvement of miRNA in cell growth and apoptosis. Nucleic Acids Res. 33, 1290-1297.
Cheng, C. Y., and Mruk, D. D. (2012). The blood-testis barrier and its implications for male contraception. Pharmacol. Rev. 64, 16-64.
Chiboka, O. (1980). Semen characteristics of west african dwarf rams. Anim. Prod. Sci. 3, 247-252.
Chihara, M., Otsuka, S., Ichii, O., Hashimoto, Y., and Kon, Y. (2010). Molecular dynamics of the blood-testis barrier components during murine spermatogenesis. Mol. Reprod. Dev. 77, 630-639.
Cimmino, A., Calin, G. A., Fabbri, M., Iorio, M. V., Ferracin, M., Shimizu, M., Wojcik, S. E., Aqeilan, R. I., Zupo, S., Dono, M., Rassenti, L., Alder, H., Volinia, S., Liu, C. G., Kipps, T. J., Negrini, M., and Croce, C. M. (2005). miR-15 and miR-16 induce apoptosis by targeting BCL2. Proc. Natl. Acad. Sci. U. S. A. 102, 13944-13949.
Clarke, I. J., Burman, K. J., Doughton, B. W., and Cummins, J. T. (1986). Effects of constant infusion of gonadotrophin-releasing hormone in ovariectomized ewes with hypothalamo-pituitary disconnection: further evidence for differential control of LH and FSH secretion and the lack of a priming effect. J. Endocrinol. 111, 43-49.
Clegg, E. J. (1963). Studies on Artificial Cryptorchidism: Morphological and Quantitative Changes in the Sertoli Cells of the Rat Testis. J. Endocrinol. 26, 567-574.
Clermont, Y., and Morgentaler, H. (1955). Quantitative study of spermatogenesis in the hypophysectomized rat. Endocrinology. 57, 369-382.
Colas, G., Guerin, Y., Lemaire, Y., Montassier, Y., and Despierres, J. (1986). Seasonal variation in the testis diameter and sperm morphology in the Vendean ram and Texel ram. Reprod. Nutr. Dev. 26, 863-875.
Collins, L. L., Lee, H. J., Chen, Y. T., Chang, M., Hsu, H. Y., Yeh, S., and Chang, C. (2003). The androgen receptor in spermatogenesis. Cytogenet. Genome Res. 103, 299-301.
Conrad, R., Schilling, G., Haidl, G., Geiser, F., Imbierowicz, K., and Liedtke, R. (2002). Relationships between personality traits, seminal parameters and hormones in male infertility. Andrologia. 34, 317-324.
Costa, K. L., da Matta, S. L., de Lucca Moreira Gomes, M., de Paula, T. A., de Freitas, K. M., de Araujo Resende Carvalho, F., de Assis Silveira, J., Dolder, H., and Chamindrani Mendis-Handagama, S. M. (2011). Histomorphometric evaluation of the neotropical brown brocket

References
166
deer Mazama gouazoubira testis, with an emphasis on cell population indexes of spermatogenic yield. Anim. Reprod. Sci. 127, 202-212.
Cox, D. N., Chao, A., Baker, J., Chang, L., Qiao, D., and Lin, H. (1998). A novel class of evolutionarily conserved genes defined by piwi are essential for stem cell self-renewal. Genes. Dev. 12, 3715-3727.
Cummins, D., Doran, T. J., Tyack, S., Purcell, D., and Hammond, J. (2008). Identification and characterisation of the porcine 7SK RNA polymerase III promoter for short hairpin RNA expression. J. RNAi Gene Silencing. 4, 289-294.
Curtin, J. F., and Cotter, T. G. (2004). JNK regulates HIPK3 expression and promotes resistance to Fas-mediated apoptosis in DU 145 prostate carcinoma cells. J. Biol. Chem. 279, 17090-17100.
Dana, N., Tegegneb, A., and Shenkorua, T. (2000). Feed intake, sperm output and seminal characteristics of Ethiopian highland sheep supplemented with different levels of leucaena (Leucaena leucocephala) leaf hay. Anim. Feed Sci. Technol. 86, 239-249.
Dardente, H., Hazlerigg, D. G., and Ebling, F. J. (2014). Thyroid hormone and seasonal rhythmicity. Front Endocrinol. 5, 19.
de Reviers, M., Hochereau-de Reviers, M. T., Blanc, M. R., Brillard, J. P., Courot, M., and Pelletier, J. (1980). Control of Sertoli and germ cell populations in the cock and sheep testes. Reprod. Nutr. Dev. 20, 241-249.
Deng, W., and Lin, H. (2002). miwi, a murine homolog of piwi, encodes a cytoplasmic protein essential for spermatogenesis. Dev. Cell. 2, 819-830.
Deng, Z. Q., Yin, J. Y., Tang, Q., Liu, F. Q., Qian, J., Lin, J., Shao, R., Zhang, M., and He, L. (2014). Over-expression of miR-98 in FFPE tissues might serve as a valuable source for biomarker discovery in breast cancer patients. Int. J. Clin. Exp. Pathol. 7, 1166-1171.
Ding, F., Cui, P., Wang, Z., Zhang, S., Ali, S., and Xiong, L. (2014). Genome-wide analysis of alternative splicing of pre-mRNA under salt stress in Arabidopsis. BMC Genomics. 15, 431.
Dobson, H., Tebble, J. E., Phogat, J. B., and Smith, R. F. (1999). Effect of transport on pulsatile and surge secretion of LH in ewes in the breeding season. J. Reprod. Fertil. 116, 1-8.
Du, L., Schageman, J. J., Subauste, M. C., Saber, B., Hammond, S. M., Prudkin, L., Wistuba, II, Ji, L., Roth, J. A., Minna, J. D., and Pertsemlidis, A. (2009). miR-93, miR-98, and miR-197 regulate expression of tumor suppressor gene FUS1. Mol. Cancer Res. 7, 1234-1243.
Eddy, E. M. (2002). Male germ cell gene expression. Recent Prog. Horm. Res. 57, 103-128.

References
167
Elton, T. S., and Martin, M. M. (2003). Alternative splicing: a novel mechanism to fine-tune the expression and function of the human AT1 receptor. Trends Endocrinol. Metab. 14, 66-71.
Evenson, D., and Jost, L. (2000). Sperm chromatin structure assay is useful for fertility assessment. Methods Cell Sci. 22, 169-189.
Evenson, D. P., Jost, L. K., Marshall, D., Zinaman, M. J., Clegg, E., Purvis, K., de Angelis, P., and Claussen, O. P. (1999). Utility of the sperm chromatin structure assay as a diagnostic and prognostic tool in the human fertility clinic. Hum. Reprod. 14, 1039-1049.
Evenson, D. P., Larson, K. L., and Jost, L. K. (2002). Sperm chromatin structure assay: its clinical use for detecting sperm DNA fragmentation in male infertility and comparisons with other techniques. J. Androl. 23, 25-43.
F.M. Cardoso, H. P. G. (1985). Daily sperm production of zebus estimated by quantitative histology of the testis. Theriogenology. 23, 7.
Farrell, P. B., Presicce, G. A., Brockett, C. C., and Foote, R. H. (1998). Quantification of bull sperm characteristics measured by computer-assisted sperm analysis (CASA) and the relationship to fertility. Theriogenology. 49, 871-879.
Fawcett, D. W., Neaves, W. B., and Flores, M. N. (1973). Comparative observations on intertubular lymphatics and the organization of the interstitial tissue of the mammalian testis. Biol. Reprod. 9, 500-532.
Feng, L. X., Chen, Y., Dettin, L., Pera, R. A., Herr, J. C., Goldberg, E., and Dym, M. (2002). Generation and in vitro differentiation of a spermatogonial cell line. Science. 297, 392-395.
Fernandez, M., Giraldez, F. J., Frutos, P., Lavin, P., and Mantecon, A. R. (2004). Effect of undegradable protein supply on testicular size, spermiogram parameters and sexual behavior of mature Assaf rams. Theriogenology. 62, 299-310.
Fink, C., Weigel, R., Fink, L., Wilhelm, J., Kliesch, S., Zeiler, M., Bergmann, M., and Brehm, R. (2009). Claudin-11 is over-expressed and dislocated from the blood-testis barrier in Sertoli cells associated with testicular intraepithelial neoplasia in men. Histochem. Cell Biol. 131, 755-764.
Florin, A., Maire, M., Bozec, A., Hellani, A., Chater, S., Bars, R., Chuzel, F., and Benahmed, M. (2005). Androgens and postmeiotic germ cells regulate claudin-11 expression in rat Sertoli cells. Endocrinology. 146, 1532-1540.
Foster, D. L., Mickelson, I. H., Ryan, K. D., Coon, G. A., Drongowski, R. A., and Holt, J. A. (1978). Ontogeny of pulsatile luteinizing hormone and testosterone secretion in male lambs. Endocrinology. 102, 1137-1146.

References
168
Franca, L. R., Silva, V. A., Jr., Chiarini-Garcia, H., Garcia, S. K., and Debeljuk, L. (2000). Cell proliferation and hormonal changes during postnatal development of the testis in the pig. Biol. Reprod. 63, 1629-1636.
Francavilla, S., D'Abrizio, P., Rucci, N., Silvano, G., Properzi, G., Straface, E., Cordeschi, G., Necozione, S., Gnessi, L., Arizzi, M., and Ulisse, S. (2000). Fas and Fas ligand expression in fetal and adult human testis with normal or deranged spermatogenesis. J. Clin. Endocrinol. Metab. 85, 2692-2700.
Fraser, H. M., and McNeilly, A. S. (1983). Differential effects of LH-RH immunoneutralization on LH and FSH secretion in the ewe. J. Reprod. Fertil. 69, 569-577.
Fu, X. D., Mayeda, A., Maniatis, T., and Krainer, A. R. (1992). General splicing factors SF2 and SC35 have equivalent activities in vitro, and both affect alternative 5' and 3' splice site selection. Proc. Natl. Acad. Sci. U. S. A. 89, 11224-11228.
Furuta, I., Porkka-Heiskanen, T., Scarbrough, K., Tapanainen, J., Turek, F. W., and Hsueh, A. J. (1994). Photoperiod regulates testis cell apoptosis in Djungarian hamsters. Biol. Reprod. 51, 1315-1321.
Galante, P. A., Sakabe, N. J., Kirschbaum-Slager, N., and de Souza, S. J. (2004). Detection and evaluation of intron retention events in the human transcriptome. RNA. 10, 757-765.
Gan, H., Lin, X., Zhang, Z., Zhang, W., Liao, S., Wang, L., and Han, C. (2011). piRNA profiling during specific stages of mouse spermatogenesis. RNA. 17, 1191-1203.
Gangaraju, V. K., and Lin, H. (2009). MicroRNAs: key regulators of stem cells. Nat. Rev. Mol. Cell Biol. 10, 116-125.
Garcia-Macias, V., Martinez-Pastor, F., Alvarez, M., Garde, J. J., Anel, E., Anel, L., and de Paz, P. (2006). Assessment of chromatin status (SCSA) in epididymal and ejaculated sperm in Iberian red deer, ram and domestic dog. Theriogenology. 66, 1921-1930.
Gaston, S., and Menaker, M. (1967). Photoperiodic control of hamster testis. Science. 158, 925-928.
Gil, M. C., Garcia-Herreros, M., Baron, F. J., Aparicio, I. M., Santos, A. J., and Garcia-Marin, L. J. (2009). Morphometry of porcine sperm and its functional significance in relation with the motility parameters in fresh semen. Theriogenology. 71, 254-263.
Girard, A., Sachidanandam, R., Hannon, G. J., and Carmell, M. A. (2006). A germline-specific class of small RNAs binds mammalian Piwi proteins. Nature. 442, 199-202.

References
169
Gong, E. Y., Park, E., Lee, H. J., and Lee, K. (2009). Expression of Atp8b3 in murine testis and its characterization as a testis specific P-type ATPase. Reproduction. 137, 345-351.
Gorczyca, W., Traganos, F., Jesionowska, H., and Darzynkiewicz, Z. (1993). Presence of DNA strand breaks and increased sensitivity of DNA in situ to denaturation in abnormal human sperm cells: analogy to apoptosis of somatic cells. Exp. Cell Res. 207, 202-205.
Gosch, B., and Fischer, K. (1989). Seasonal changes of testis volume and sperm quality in adult fallow deer (Dama dama) and their relationship to the antler cycle. J. Reprod. Fertil. 85, 7-17.
Gow, A., Southwood, C. M., Li, J. S., Pariali, M., Riordan, G. P., Brodie, S. E., Danias, J., Bronstein, J. M., Kachar, B., and Lazzarini, R. A. (1999). CNS myelin and sertoli cell tight junction strands are absent in Osp/claudin-11 null mice. Cell. 99, 649-659.
Guo, X., Su, B., Zhou, Z., and Sha, J. (2009). Rapid evolution of mammalian X-linked testis microRNAs. BMC Genomics. 10, 97.
Gurskaya, N. G., Staroverov, D. B., Zhang, L., Fradkov, A. F., Markina, N. M., Pereverzev, A. P., and Lukyanov, K. A. (2012). Analysis of alternative splicing of cassette exons at single-cell level using two fluorescent proteins. Nucleic Acids Res. 40, e57.
Gutteling, B. M., de Weerth, C., Willemsen-Swinkels, S. H., Huizink, A. C., Mulder, E. J., Visser, G. H., and Buitelaar, J. K. (2005). The effects of prenatal stress on temperament and problem behavior of 27-month-old toddlers. Eur. Child Adolesc. Psychiatry. 14, 41-51.
Hausser, J., Syed, A. P., Bilen, B., and Zavolan, M. (2013). Analysis of CDS-located miRNA target sites suggests that they can effectively inhibit translation. Genome Res. 23, 604-615.
Haverfield, J. T., Meachem, S. J., O'Bryan, M. K., McLachlan, R. I., and Stanton, P. G. (2013). Claudin-11 and connexin-43 display altered spatial patterns of organization in men with primary seminiferous tubule failure compared with controls. Fertil. Steril. 100, 658-666.
Hawken, P. A., Esmaili, T., Scanlan, V., Blache, D., and Martin, G. B. (2009). Can audio-visual or visual stimuli from a prospective mate stimulate a reproductive neuroendocrine response in sheep? Animal. 3, 690-696.
Hawken, P. A., Luckins, N., Tilbrook, A., Fiol, C., Martin, G. B., and Blache, D. (2013). Genetic selection for temperament affects behaviour and the secretion of adrenal and reproductive hormones in sheep subjected to stress. Stress. 16, 130-142.
Hayashi, K., Chuva de Sousa Lopes, S. M., Kaneda, M., Tang, F., Hajkova, P., Lao, K., O'Carroll, D., Das, P. P., Tarakhovsky, A., Miska, E. A., and Surani, M. A. (2008). MicroRNA biogenesis is required for mouse primordial germ cell development and spermatogenesis. PLoS One. 3, e1738.

References
170
He, Z., Kokkinaki, M., Pant, D., Gallicano, G. I., and Dym, M. (2009). Small RNA molecules in the regulation of spermatogenesis. Reproduction. 137, 901-911.
Hecht, N. B. (1998). Molecular mechanisms of male germ cell differentiation. Bioessays. 20, 555-561.
Hellani, A., Ji, J., Mauduit, C., Deschildre, C., Tabone, E., and Benahmed, M. (2000). Developmental and hormonal regulation of the expression of oligodendrocyte-specific protein/claudin 11 in mouse testis. Endocrinology. 141, 3012-3019.
Hellhammer, D. H., Hubert, W., Freischem, C. W., and Nieschlag, E. (1985). Male infertility: relationships among gonadotropins, sex steroids, seminal parameters, and personality attitudes. Psychosom. Med. 47, 58-66.
Heninger, N. L., Staub, C., Blanchard, T. L., Johnson, L., Varner, D. D., and Forrest, D. W. (2004). Germ cell apoptosis in the testes of normal stallions. Theriogenology. 62, 283-297.
Hess, R. A., Cooke, P. S., Bunick, D., and Kirby, J. D. (1993). Adult testicular enlargement induced by neonatal hypothyroidism is accompanied by increased Sertoli and germ cell numbers. Endocrinology. 132, 2607-2613.
Hikim, A. P., Amador, A. G., Klemcke, H. G., Bartke, A., and Russell, L. D. (1989). Correlative morphology and endocrinology of Sertoli cells in hamster testes in active and inactive states of spermatogenesis. Endocrinology. 125, 1829-1843.
Hiroe, K., and Tomizuka, T. (1965). Effects of nutrition on the 310 characteristics of goat semen. Bull Nat. Inst. Anim. Ind. 8, 17-24.
Hochereau-de Reviers, M. T. (1976). Variation in the stock of testicular stem cells and in the yield of spermatogonial divisions in ram and bull testes. Angrologia. 8, 137-146. Hochereau-de Reviers, M. T., Monet-Kuntz, C., and Courot, M. (1987). Spermatogenesis and Sertoli cell numbers and function in rams and bulls. J. Reprod. Fertil. Suppl. 34, 101-114.
Hochereau-de Reviers, M. T., Perreau, C., and Lincoln, G. A. (1985). Photoperiodic variations of somatic and germ cell populations in the Soay ram testis. J. Reprod. Fertil. 74, 329-334.
Hoffmann, K. (1974). Testicular involution in short photoperiods inhibited by melatonin. Naturwissenschaften. 61, 364-365.
Hötzel, M. J., Markey, C. M., Walkden-Brown, S. W., Blackberry, M. A., and Martin, G. B. (1998). Morphometric and endocrine analyses of the effects of nutrition on the testis of mature Merino rams. J. Reprod. Fertil. 113, 217-230.

References
171
Hötzel, M. J., Walkden-Brown, S. W., Fisher, J. S., and Martin, G. B. (2003). Determinants of the annual pattern of reproduction in mature male Merino and Suffolk sheep: responses to a nutritional stimulus in the breeding and non-breeding seasons. Reprod. Fertil. Dev. 15, 1-9.
Howard, A., and Pelc, S. R. (1950). P32 autoradiographs of mouse testis; preliminary observations of the timing of spermatogenic stages. Br. J. Radiol. 23, 634-641.
Huang da, W., Sherman, B. T., and Lempicki, R. A. (2009). Systematic and integrative analysis of large gene lists using DAVID bioinformatics resources. Nat. Protoc. 4, 44-57.
Hutvagner, G., McLachlan, J., Pasquinelli, A. E., Balint, E., Tuschl, T., and Zamore, P. D. (2001). A cellular function for the RNA-interference enzyme Dicer in the maturation of the let-7 small temporal RNA. Science. 293, 834-838.
Inoue, H., Hiradate, Y., Shirakata, Y., Kanai, K., Kosaka, K., Gotoh, A., Fukuda, Y., Nakai, Y., Uchida, T., Sato, E., and Tanemura, K. (2014). Site-specific phosphorylation of Tau protein is associated with deacetylation of microtubules in mouse spermatogenic cells during meiosis. FEBS Lett. 588, 2003-2008.
Iorio, M. V., Ferracin, M., Liu, C. G., Veronese, A., Spizzo, R., Sabbioni, S., Magri, E., Pedriali, M., Fabbri, M., Campiglio, M., Menard, S., Palazzo, J. P., Rosenberg, A., Musiani, P., Volinia, S., Nenci, I., Calin, G. A., Querzoli, P., Negrini, M., and Croce, C. M. (2005). MicroRNA gene expression deregulation in human breast cancer. Cancer Res. 65, 7065-7070.
Jabbour, H. N., Clarke, L. A., Bramley, T., Postel-Vinay, M. C., Kelly, P. A., and Edery, M. (1998). Alternative splicing of the prolactin receptor gene generates a 1.7 kb RNA transcript that is linked to prolactin function in the red deer testis. J. Mol. Endocrinol. 21, 51-59.
Jackson, G. L., Kuehl, D., and Rhim, T. J. (1991). Testosterone inhibits gonadotropin-releasing hormone pulse frequency in the male sheep. Biol. Reprod. 45, 188-194.
Jahnukainen, K., Ehmcke, J., Quader, M. A., Saiful Huq, M., Epperly, M. W., Hergenrother, S., Nurmio, M., and Schlatt, S. (2011). Testicular recovery after irradiation differs in prepubertal and pubertal non-human primates, and can be enhanced by autologous germ cell transplantation. Hum. Reprod. 26, 1945-1954.
Janicke, R. U., Sprengart, M. L., Wati, M. R., and Porter, A. G. (1998). Caspase-3 is required for DNA fragmentation and morphological changes associated with apoptosis. J. Biol. Chem. 273, 9357-9360.
Januskauskas, A., Johannisson, A., and Rodriguez-Martinez, H. (2003). Subtle membrane changes in cryopreserved bull semen in relation with sperm viability, chromatin structure, and field fertility. Theriogenology. 60, 743-758.

References
172
Jin, W., Ibeagha-Awemu, E. M., Liang, G., Beaudoin, F., Zhao, X., and Guan le, L. (2014). Transcriptome microRNA profiling of bovine mammary epithelial cells challenged with Escherichia coli or Staphylococcus aureus bacteria reveals pathogen directed microRNA expression profiles. BMC Genomics. 15, 181.
Johnsen, S. G. (1970). Testicular biopsy score count--a method for registration of spermatogenesis in human testes: normal values and results in 335 hypogonadal males. Hormones. 1, 2-25.
Johnson, L., and Nguyen, H. B. (1986). Annual cycle of the Sertoli cell population in adult stallions. J. Reprod. Fertil. 76, 311-316.
Johnston, H., Baker, P. J., Abel, M., Charlton, H. M., Jackson, G., Fleming, L., Kumar, T. R., and O'Shaughnessy, P. J. (2004). Regulation of Sertoli cell number and activity by follicle-stimulating hormone and androgen during postnatal development in the mouse. Endocrinology. 145, 318-329.
Jones, R. D., Pugh, P. J., Jones, T. H., and Channer, K. S. (2003). The vasodilatory action of testosterone: a potassium-channel opening or a calcium antagonistic action? Br. J. Pharmacol. 138, 733-744.
Jovanovic, M., and Hengartner, M. O. (2006). miRNAs and apoptosis: RNAs to die for. Oncogene. 25, 6176-6187.
Kanai, Y., Kanai-Azuma, M., Noce, T., Saido, T. C., Shiroishi, T., Hayashi, Y., and Yazaki, K. (1996). Identification of two Sox17 messenger RNA isoforms, with and without the high mobility group box region, and their differential expression in mouse spermatogenesis. J. Cell Biol. 133, 667-681.
Kasimanickam, R., Kasimanickam, V., Pelzer, K. D., and Dascanio, J. J. (2007). Effect of breed and sperm concentration on the changes in structural, functional and motility parameters of ram-lamb sperm during storage at 4 degrees C. Anim. Reprod. Sci. 101, 60-73.
Kaushal, N., and Bansal, M. P. (2007). Dietary selenium variation-induced oxidative stress modulates CDC2/cyclin B1 expression and apoptosis of germ cells in mice testis. J. Nutr. Biochem. 18, 553-564.
Kendall, N. R., McMullen, S., Green, A., and Rodway, R. G. (2000). The effect of a zinc, cobalt and selenium soluble glass bolus on trace element status and semen quality of ram lambs. Anim. Reprod. Sci. 62, 277-283.
Kerr, J. B., Rich, K. A., and De Kretser, D. M. (1979). Alterations of the fine structure and androgen secretion of interstitial cells in the experimentally cryptorchid rat testis. Biol. Reprod. 20, 409-422.

References
173
Ketola, I., Pentikainen, V., Vaskivuo, T., Ilvesmaki, V., Herva, R., Dunkel, L., Tapanainen, J. S., Toppari, J., and Heikinheimo, M. (2000). Expression of transcription factor GATA-4 during human testicular development and disease. J. Clin. Endocrinol. Metab. 85, 3925-3931.
Kheradmand, A., Babaei, H., and Batavani, R. A. (2006). Effect of improved diet on semen quality and scrotal circumference in the ram. VET. ARHIV. 76, 333-341.
Kim, D., Pertea, G., Trapnell, C., Pimentel, H., Kelley, R., and Salzberg, S. L. (2013). TopHat2: accurate alignment of transcriptomes in the presence of insertions, deletions and gene fusions. Genome Biol. 14, R36.
Kim, V. N., Han, J., and Siomi, M. C. (2009). Biogenesis of small RNAs in animals. Nat. Rev. Mol. Cell Biol. 10, 126-139.
Kishi, H., Itoh, M., Wada, S., Yukinari, Y., Tanaka, Y., Nagamine, N., Jin, W., Watanabe, G., and Taya, K. (2000). Inhibin is an important factor in the regulation of FSH secretion in the adult male hamster. Am. J. Physiol. Endocrinol. Metab. 278, E744-751.
Kissel, H., Timokhina, I., Hardy, M. P., Rothschild, G., Tajima, Y., Soares, V., Angeles, M., Whitlow, S. R., Manova, K., and Besmer, P. (2000). Point mutation in kit receptor tyrosine kinase reveals essential roles for kit signaling in spermatogenesis and oogenesis without affecting other kit responses. EMBO J. 19, 1312-1326.
Klattenhoff, C., and Theurkauf, W. (2008). Biogenesis and germline functions of piRNAs. Development. 135, 3-9.
Kliesch, S., Behre, H. M., Hertle, L., and Bergmann, M. (1998). Alteration of Sertoli cell differentiation in the presence of carcinoma in situ in human testes. J. Urol. 160, 1894-1898.
Kluin, P. M., Kramer, M. F., and de Rooij, D. G. (1983). Testicular development in Macaca irus after birth. Int. J. Androl. 6, 25-43.
Kluin, P. M., Kramer, M. F., and de Rooij, D. G. (1984). Proliferation of spermatogonia and Sertoli cells in maturing mice. Anat. Embryol. 169, 73-78.
Knight, T. W., Gherardi, S., and Lindsay, D. R. (1987). Effect of sexual stimulation on testicular size in the ram. Anim. Reprod. Sci. 13, 105-115.
Korner, C., Keklikoglou, I., Bender, C., Worner, A., Munstermann, E., and Wiemann, S. (2013). MicroRNA-31 sensitizes human breast cells to apoptosis by direct targeting of protein kinase C epsilon (PKCepsilon). J. Biol. Chem. 288, 8750-8761.
Kota, J., Chivukula, R. R., O'Donnell, K. A., Wentzel, E. A., Montgomery, C. L., Hwang, H. W., Chang, T. C., Vivekanandan, P., Torbenson, M., Clark, K. R., Mendell, J. R., and Mendell, J. T.
References
174
(2009). Therapeutic microRNA delivery suppresses tumorigenesis in a murine liver cancer model. Cell. 137, 1005-1017.
Kozomara, A., and Griffiths-Jones, S. (2014). miRBase: annotating high confidence microRNAs using deep sequencing data. Nucleic Acids Res. 42, D68-73.
Krutzfeldt, J., and Stoffel, M. (2006). MicroRNAs: a new class of regulatory genes affecting metabolism. Cell Metab. 4, 9-12.
Kulseth, M. A., Berge, K. E., Bogsrud, M. P., and Leren, T. P. (2010). Analysis of LDLR mRNA in patients with familial hypercholesterolemia revealed a novel mutation in intron 14, which activates a cryptic splice site. J. Hum. Genet. 55, 676-680.
Kuramochi-Miyagawa, S., Kimura, T., Ijiri, T. W., Isobe, T., Asada, N., Fujita, Y., Ikawa, M., Iwai, N., Okabe, M., Deng, W., Lin, H., Matsuda, Y., and Nakano, T. (2004). Mili, a mammalian member of piwi family gene, is essential for spermatogenesis. Development. 131, 839-849.
Lagos-Quintana, M., Rauhut, R., Lendeckel, W., and Tuschl, T. (2001). Identification of novel genes coding for small expressed RNAs. Science. 294, 853-858.
Laiho, A., Kotaja, N., Gyenesei, A., and Sironen, A. (2013). Transcriptome profiling of the murine testis during the first wave of spermatogenesis. PLoS One. 8, e61558.
Langford, G. A., Ainsworth, L., Marcus, G. J., and Shrestha, J. N. (1987). Photoperiod entrainment of testosterone, luteinizing hormone, follicle-stimulating hormone, and prolactin cycles in rams in relation to testis size and semen quality. Biol. Reprod. 37, 489-499.
Lardenois, A., Chalmel, F., Barrionuevo, F., Demougin, P., Scherer, G., and Primig, M. (2010). Profiling spermatogenic failure in adult testes bearing Sox9-deficient Sertoli cells identifies genes involved in feminization, inflammation and stress. Reprod. Biol. Endocrinol. 8, 154.
Lau, N. C., Seto, A. G., Kim, J., Kuramochi-Miyagawa, S., Nakano, T., Bartel, D. P., and Kingston, R. E. (2006). Characterization of the piRNA complex from rat testes. Science. 313, 363-367.
Lee, H. C., Gu, W., Shirayama, M., Youngman, E., Conte, D., Jr., and Mello, C. C. (2012). C. elegans piRNAs mediate the genome-wide surveillance of germline transcripts. Cell. 150, 78-87.
Lee, R. C., Feinbaum, R. L., and Ambros, V. (1993). The C. elegans heterochronic gene lin-4 encodes small RNAs with antisense complementarity to lin-14. Cell. 75, 843-854.
Leeson, C. R., and Forman, D. E. (1981). Postnatal development and differentiation of contractile cells within the rabbit testis. J. Anat. 132, 491-511.

References
175
Leeson, T. S. (1974). Proceedings: Muscle in the mammalian testicular capsule. J. Anat. 118, 363.
Lerchl, A., and Schlatt, S. (1993). Influence of photoperiod on pineal melatonin synthesis, fur color, body weight, and reproductive function in the female Djungarian hamster, Phodopus sungorus. Neuroendocrinology. 57, 359-364.
Levine, N., and Marsh, D. J. (1971). Micropuncture studies of the electrochemical aspects of fluid and electrolyte transport in individual seminiferous tubules, the epididymis and the vas deferens in rats. J. Physiol. 213, 557-570.
Lewis, B. P., Burge, C. B., and Bartel, D. P. (2005). Conserved seed pairing, often flanked by adenosines, indicates that thousands of human genes are microRNA targets. Cell. 120, 15-20.
Lewis, B. P., Shih, I. H., Jones-Rhoades, M. W., Bartel, D. P., and Burge, C. B. (2003). Prediction of mammalian microRNA targets. Cell. 115, 787-798.
Li, D., Sekhon, P., Barr, K. J., Marquez-Rosado, L., Lampe, P. D., and Kidder, G. M. (2013). Connexins and steroidogenesis in mouse Leydig cells. Can. J. Physiol. Pharmacol. 91, 157-164.
Li, G., Luna, C., Qiu, J., Epstein, D. L., and Gonzalez, P. (2011). Role of miR-204 in the regulation of apoptosis, endoplasmic reticulum stress response, and inflammation in human trabecular meshwork cells. Invest. Ophthalmol. Vis. Sci. 52, 2999-3007.
Li, H., and Jogl, G. (2009). Structural and biochemical studies of TIGAR (TP53-induced glycolysis and apoptosis regulator). J. Biol. Chem. 284, 1748-1754.
Li, W., Wu, J., Kim, S. Y., Zhao, M., Hearn, S. A., Zhang, M. Q., Meistrich, M. L., and Mills, A. A. (2014). Chd5 orchestrates chromatin remodelling during sperm development. Nat. Commun. 5, 3812.
Liang, G., Malmuthuge, N., McFadden, T. B., Bao, H., Griebel, P. J., Stothard, P., and Guan le, L. (2014). Potential regulatory role of microRNAs in the development of bovine gastrointestinal tract during early life. PLoS One. 9, e92592.
Liang, X., Zhou, D., Wei, C., Luo, H., Liu, J., Fu, R., and Cui, S. (2012). MicroRNA-34c enhances murine male germ cell apoptosis through targeting ATF1. PLoS One. 7, e33861.
Lim, S. L., Tsend-Ayush, E., Kortschak, R. D., Jacob, R., Ricciardelli, C., Oehler, M. K., and Grutzner, F. (2013). Conservation and expression of PIWI-interacting RNA pathway genes in male and female adult gonad of amniotes. Biol. Reprod. 89, 136.

References
176
Lincoln, G. A. (1979). Differential control of luteinizing hormone and follicle-stimulating hormone by luteinizing hormone releasing hormone in the ram. J. Endocrinol. 80, 133-140.
Lincoln, G. A., and Fraser, H. M. (1990). Negative feedback regulation of pulsatile LH secretion during treatment with an LHRH antagonist in rams. J. Androl. 11, 287-292.
Lipshultz, L. I., Murthy, L., and Tindall, D. J. (1982). Characterization of human Sertoli cells in vitro. J. Clin. Endocrinol. Metab. 55, 228-237.
Liu, G., Lei, B., Li, Y., Tong, K., Ding, Y., Luo, L., Xia, X., Jiang, S., Deng, C., Xiong, Y., and Li, F. (2012a). Discovery of potential piRNAs from next generation sequences of the sexually mature porcine testes. PLoS One. 7, e34770.
Liu, G., Liu, R., Li, Q., Tang, X., Yu, M., Li, X., Cao, J., and Zhao, S. (2013). Identification of microRNAs in wool follicles during anagen, catagen, and telogen phases in Tibetan sheep. PLoS One. 8, e77801.
Liu, R., Liao, J., Yang, M., Sheng, J., Yang, H., Wang, Y., Pan, E., Guo, W., Pu, Y., Kim, S. J., and Yin, L. (2012b). The cluster of miR-143 and miR-145 affects the risk for esophageal squamous cell carcinoma through co-regulating fascin homolog 1. PLoS One. 7, e33987.
Liu, S. F., He, S., Liu, B. W., Zhao, Y., and Wang, Z. (2004). Cloning and characterization of testis-specific spermatogenesis associated gene homologous to human SPATA4 in rat. Biol. Pharm. Bull. 27, 1867-1870.
Livak, K. J., and Schmittgen, T. D. (2001). Analysis of relative gene expression data using real-time quantitative PCR and the 2(-Delta Delta C(T)) Method. Methods. 25, 402-408.
Lopez-Calderon, A., Ariznavarreta, C., Gonzalez-Quijano, M. I., Tresguerres, J. A., and Calderon, M. D. (1991). Stress induced changes in testis function. J. Steroid. Biochem. Mol. Biol. 40, 473-479.
Loveland, K. L., Herszfeld, D., Chu, B., Rames, E., Christy, E., Briggs, L. J., Shakri, R., de Kretser, D. M., and Jans, D. A. (1999). Novel low molecular weight microtubule-associated protein-2 isoforms contain a functional nuclear localization sequence. J. Biol. Chem. 274, 19261-19268.
Lozano, J. M., Lonergan, P., Boland, M. P., and O'Callaghan, D. (2003). Influence of nutrition on the effectiveness of superovulation programmes in ewes: effect on oocyte quality and post-fertilization development. Reproduction. 125, 543-553.
Lui, W. Y., Lee, W. M., and Cheng, C. Y. (2003). Sertoli-germ cell adherens junction dynamics in the testis are regulated by RhoB GTPase via the ROCK/LIMK signaling pathway. Biol. Reprod. 68, 2189-2206.

References
177
Luteijn, M. J., and Ketting, R. F. (2013). PIWI-interacting RNAs: from generation to transgenerational epigenetics. Nat. Rev. Genet. 14, 523-534.
Maatouk, D. M., Loveland, K. L., McManus, M. T., Moore, K., and Harfe, B. D. (2008). Dicer1 is required for differentiation of the mouse male germline. Biol. Reprod. 79, 696-703.
Maekawa, M., Kamimura, K., and Nagano, T. (1996). Peritubular myoid cells in the testis: their structure and function. Arch. Histol. Cytol. 59, 1-13.
Mah, S. M., Buske, C., Humphries, R. K., and Kuchenbauer, F. (2010). miRNA*: a passenger stranded in RNA-induced silencing complex? Crit. Rev. Eukaryot. Gene. Expr. 20, 141-148.
Mahfouz, R., Sharma, R., Thiyagarajan, A., Kale, V., Gupta, S., Sabanegh, E., and Agarwal, A. (2010). Semen characteristics and sperm DNA fragmentation in infertile men with low and high levels of seminal reactive oxygen species. Fertil. Steril. 94, 2141-2146.
Malama, E., Bollwein, H., Taitzoglou, I. A., Theodosiou, T., Boscos, C. M., and Kiossis, E. (2013). Chromatin integrity of ram sperm. Relationships to annual fluctuations of scrotal surface temperature and temperature-humidity index. Theriogenology. 80, 533-541.
Martin, G. B., de St Jorre, T. J., Al Mohsen, F. A., and Malecki, I. A. (2011). Modification of sperm quality in mature small ruminants. Reprod. Fertil. Dev. 24, 13-18.
Martin, G. B., Hotzel, M. J., Blache, D., Walkden-Brown, S. W., Blackberry, M. A., Boukhliq, R. C., Fisher, J. S., and Miller, D. W. (2002). Determinants of the annual pattern of reproduction in mature male Merino and Suffolk sheep: modification of responses to photoperiod by an annual cycle in food supply. Reprod. Fertil. Dev. 14, 165-175.
Martin, G. B., Milton, J. T., Davidson, R. H., Banchero Hunzicker, G. E., Lindsay, D. R., and Blache, D. (2004). Natural methods for increasing reproductive efficiency in small ruminants. Anim. Reprod. Sci. 82-83, 231-245.
Martin, G. B., Tjondronegoro, S., and Blackberry, M. A. (1994). Effects of nutrition on testicular size and the concentrations of gonadotrophins, testosterone and inhibin in plasma of mature male sheep. J. Reprod. Fertil. 101, 121-128.
Martin, G. B., Tjondronegoro, S., Boukhliq, R., Blackberry, M. A., Briegel, J. R., Blache, D., Fisher, J. A., and Adams, N. R. (1999). Determinants of the annual pattern of reproduction in mature male merino and Suffolk sheep: modification of endogenous rhythms by photoperiod. Reprod. Fertil. Dev. 11, 355-366.
Martin, G. B., and Walkden-Brown, S. W. (1995). Nutritional influences on reproduction in mature male sheep and goats. J. Reprod. Fertil. Suppl. 49, 437-449.

References
178
Masters, D. G., and Fels, H. E. (1984). Seasonal changes in the testicular size of grazing rams. Proc. Aust. Soc. Anim. Prod. 15, 444-447.
Matteri, R. L., Watson, J. G., and Moberg, G. P. (1984). Stress or acute adrenocorticotrophin treatment suppresses LHRH-induced LH release in the ram. J. Reprod. Fertil. 72, 385-393.
McCabe, M. J., Tarulli, G. A., Meachem, S. J., Robertson, D. M., Smooker, P. M., and Stanton, P. G. (2010). Gonadotropins regulate rat testicular tight junctions in vivo. Endocrinology. 151, 2911-2922.
McCarthy, D. J., and Smyth, G. K. (2009). Testing significance relative to a fold-change threshold is a TREAT. Bioinformatics. 25, 765-771.
McCarthy, M. S., Convey, E. M., and Hafs, H. D. (1979). Serum hormonal changes and testicular response to LH during puberty in bulls. Biol. Reprod. 20, 1221-1227.
McCoard, S. A., Lunstra, D. D., Wise, T. H., and Ford, J. J. (2001). Specific staining of Sertoli cell nuclei and evaluation of Sertoli cell number and proliferative activity in Meishan and White Composite boars during the neonatal period. Biol. Reprod. 64, 689-695.
McCoard, S. A., Wise, T. H., Lunstra, D. D., and Ford, J. J. (2003). Stereological evaluation of Sertoli cell ontogeny during fetal and neonatal life in two diverse breeds of swine. J. Endocrinol. 178, 395-403.
McLachlan, R. I., Wreford, N. G., de Kretser, D. M., and Robertson, D. M. (1995). The effects of recombinant follicle-stimulating hormone on the restoration of spermatogenesis in the gonadotropin-releasing hormone-immunized adult rat. Endocrinology. 136, 4035-4043.
McLaren, T. T., Foster, P. M., and Sharpe, R. M. (1993). Effect of age on seminiferous tubule protein secretion and the adverse effects of testicular toxicants in the rat. Int. J. Androl. 16, 370-379.
McManus, C. J., Coolon, J. D., Eipper-Mains, J., Wittkopp, P. J., and Graveley, B. R. (2014). Evolution of splicing regulatory networks in Drosophila. Genome Res. 24, 786-796.
McNeilly, A. S., Souza, C. J., Baird, D. T., Swanston, I. A., McVerry, J., Crawford, J., Cranfield, M., and Lincoln, G. A. (2002). Production of inhibin A not B in rams: changes in plasma inhibin A during testis growth, and expression of inhibin/activin subunit mRNA and protein in adult testis. Reproduction. 123, 827-835.
Meachem, S. J., McLachlan, R. I., de Kretser, D. M., Robertson, D. M., and Wreford, N. G. (1996). Neonatal exposure of rats to recombinant follicle stimulating hormone increases adult Sertoli and spermatogenic cell numbers. Biol. Reprod. 54, 36-44.

References
179
Meachem, S. J., McLachlan, R. I., Stanton, P. G., Robertson, D. M., and Wreford, N. G. (1999). FSH immunoneutralization acutely impairs spermatogonial development in normal adult rats. J. Androl. 20, 756-762.
Meng, J., Holdcraft, R. W., Shima, J. E., Griswold, M. D., and Braun, R. E. (2005). Androgens regulate the permeability of the blood-testis barrier. Proc. Natl. Acad. Sci. U. S. A. 102, 16696-16700.
Meyer, E., Ricketts, C., Morgan, N. V., Morris, M. R., Pasha, S., Tee, L. J., Rahman, F., Bazin, A., Bessieres, B., Dechelotte, P., Yacoubi, M. T., Al-Adnani, M., Marton, T., Tannahill, D., Trembath, R. C., Fallet-Bianco, C., Cox, P., Williams, D., and Maher, E. R. (2010). Mutations in FLVCR2 are associated with proliferative vasculopathy and hydranencephaly-hydrocephaly syndrome (Fowler syndrome). Am. J. Hum. Genet. 86, 471-478.
Mickelsen, W. D., Paisley, L. G., and Dahmen, J. J. (1981). The effect of season on the scrotal circumference and sperm motility and morphology in rams. Theriogenology. 16, 45-51.
Mironov, A. A., Fickett, J. W., and Gelfand, M. S. (1999). Frequent alternative splicing of human genes. Genome Res. 9, 1288-1293.
Modrek, B., and Lee, C. (2002). A genomic view of alternative splicing. Nat. Genet. 30, 13-19.
Monet-Kuntz, C., Hochereau-de Reviers, M. T., and Terqui, M. (1984). Variations in testicular androgen receptors and histology of the lamb testis from birth to puberty. J. Reprod. Fertil. 70, 203-210.
Moore, M. J., Wang, Q., Kennedy, C. J., and Silver, P. A. (2010). An alternative splicing network links cell-cycle control to apoptosis. Cell. 142, 625-636.
Moretti, F., Thermann, R., and Hentze, M. W. (2010). Mechanism of translational regulation by miR-2 from sites in the 5' untranslated region or the open reading frame. RNA. 16, 2493-2502.
Mori, A. (1959). Studies on the reproductive failure of ram caused by underfeeding. I. On the effects of underfeeding upon the mating potency of ram, and the effects of normal feeding upon its recovery from impotence. Tohoku J. Agric. Res. 10, 263-281.
Mori, H., and Christensen, A. K. (1980). Morphometric analysis of Leydig cells in the normal rat testis. J. Cell Biol. 84, 340-354.
Morita, K., Sasaki, H., Fujimoto, K., Furuse, M., and Tsukita, S. (1999). Claudin-11/OSP-based tight junctions of myelin sheaths in brain and Sertoli cells in testis. J. Cell Biol. 145, 579-588.
Moule, G. R. (1963). Postpubertal nutrition and reproduction by the male. Aust. Vet. J. 39, 299-304.

References
180
Munoz, E. M., Fogal, T., Dominguez, S., Scardapane, L., and Piezzi, R. S. (2001). Ultrastructural and morphometric study of the Sertoli cell of the viscacha (Lagostomus maximus maximus) during the annual reproductive cycle. Anat. Rec. 262, 176-185.
Nah, W. H., Lee, J. E., Park, H. J., Park, N. C., and Gye, M. C. (2011). Claudin-11 expression increased in spermatogenic defect in human testes. Fertil. Steril. 95, 385-388.
Neaves, W. B., Johnson, L., and Petty, C. S. (1985). Age-related change in numbers of other interstitial cells in testes of adult men: evidence bearing on the fate of Leydig cells lost with increasing age. Biol. Reprod. 33, 259-269.
Ni, B., Wu, X., Su, Y., Stephenson, D., Smalstig, E. B., Clemens, J., and Paul, S. M. (1998). Transient global forebrain ischemia induces a prolonged expression of the caspase-3 mRNA in rat hippocampal CA1 pyramidal neurons. J. Cereb. Blood Flow Metab. 18, 248-256.
Nistal, M., Abaurrea, M. A., and Paniagua, R. (1982). Morphological and histometric study on the human Sertoli cell from birth to the onset of puberty. J. Anat. 134, 351-363.
Niu, Z., Goodyear, S. M., Rao, S., Wu, X., Tobias, J. W., Avarbock, M. R., and Brinster, R. L. (2011). MicroRNA-21 regulates the self-renewal of mouse spermatogonial stem cells. Proc. Natl. Acad. Sci. U. S. A. 108, 12740-12745.
Nunez-Iglesias, J., Liu, C. C., Morgan, T. E., Finch, C. E., and Zhou, X. J. (2010). Joint genome-wide profiling of miRNA and mRNA expression in Alzheimer's disease cortex reveals altered miRNA regulation. PLoS One. 5, e8898.
Nunez Favre, R., Bonaura, M. C., Tittarelli, C. M., Stornelli, M. C., de la Sota, R. L., and Stornelli, M. A. (2012). Effect of refractoriness to long photoperiod on sperm production and quality in tomcats. Reprod. Domest. Anim. 47 Suppl 6, 235-237.
Nunez, Y. O., Truitt, J. M., Gorini, G., Ponomareva, O. N., Blednov, Y. A., Harris, R. A., and Mayfield, R. D. (2013). Positively correlated miRNA-mRNA regulatory networks in mouse frontal cortex during early stages of alcohol dependence. BMC Genomics. 14, 725.
O'Shaughnessy, P. J., Hu, L., and Baker, P. J. (2008). Effect of germ cell depletion on levels of specific mRNA transcripts in mouse Sertoli cells and Leydig cells. Reproduction. 135, 839-850.
Odell, W. D., Swerdloff, R. S., Bain, J., Wollesen, F., and Grover, P. K. (1974). The effect of sexual maturation on testicular response to LH stimulation of testosterone secretion in the intact rat. Endocrinology. 95, 1380-1384.
Ohbo, K., Yoshida, S., Ohmura, M., Ohneda, O., Ogawa, T., Tsuchiya, H., Kuwana, T., Kehler, J., Abe, K., Scholer, H. R., and Suda, T. (2003). Identification and characterization of stem cells in prepubertal spermatogenesis in mice. Dev. Biol. 258, 209-225.

References
181
Ohl, M. W., Ott, R. S., Faulkner, D. B., Hornbuckle, T., 2nd, Hess, R. A., Cmarik, G. F., and Zinn, G. M. (1996). Effects of rate of gain on scrotal circumference and histopathologic features of the testes of half-sibling yearling beef bulls. Am. J. Vet. Res. 57, 844-847.
Oldham, C. M., Adams, N. R., Gherardi, P. B., Lindsay, D. R., and Mackintosh, J. B. (1978). The influence of level of feed intake on sperm-producing capacity of testicular tissue in the ram. Aust. J. Agric. Res. 29, 173-179.
Ollero, M., Perez-Pe, R., Muino-Blanco, T., and Cebrian-Perez, J. A. (1998). Improvement of ram sperm cryopreservation protocols assessed by sperm quality parameters and heterogeneity analysis. Cryobiology. 37, 1-12.
Ombelet, W., Menkveld, R., Kruger, T. F., and Steeno, O. (1995). Sperm morphology assessment: historical review in relation to fertility. Hum. Reprod. Update. 1, 543-557.
Packer, A. I., Besmer, P., and Bachvarova, R. F. (1995). Kit ligand mediates survival of type A spermatogonia and dividing spermatocytes in postnatal mouse testes. Mol. Reprod. Dev. 42, 303-310.
Papaioannou, M. D., and Nef, S. (2010). microRNAs in the testis: building up male fertility. J Androl. 31, 26-33.
Parker, G. V., and Thwaites, C. J. (1972). The effects of undernutrition on libido and semen quality in adult Merino rams. Aust. J. Agric. Res. 23, 109-115.
Paul, C., Teng, S., and Saunders, P. T. (2009). A single, mild, transient scrotal heat stress causes hypoxia and oxidative stress in mouse testes, which induces germ cell death. Biol. Reprod. 80, 913-919.
Payne, C. J., Gallagher, S. J., Foreman, O., Dannenberg, J. H., Depinho, R. A., and Braun, R. E. (2010). Sin3a is required by sertoli cells to establish a niche for undifferentiated spermatogonia, germ cell tumors, and spermatid elongation. Stem Cells. 28, 1424-1434.
Peris, S. I., Bilodeau, J. F., Dufour, M., and Bailey, J. L. (2007). Impact of cryopreservation and reactive oxygen species on DNA integrity, lipid peroxidation, and functional parameters in ram sperm. Mol. Reprod. Dev. 74, 878-892.
Pitetti, J. L., Calvel, P., Zimmermann, C., Conne, B., Papaioannou, M. D., Aubry, F., Cederroth, C. R., Urner, F., Fumel, B., Crausaz, M., Docquier, M., Herrera, P. L., Pralong, F., Germond, M., Guillou, F., Jegou, B., and Nef, S. (2013). An essential role for insulin and IGF1 receptors in regulating sertoli cell proliferation, testis size, and FSH action in mice. Mol. Endocrinol. 27, 814-827.

References
182
Plant, T. M., and Marshall, G. R. (2001). The functional significance of FSH in spermatogenesis and the control of its secretion in male primates. Endocr. Rev. 22, 764-786.
Plasterk, R. H. (2006). Micro RNAs in animal development. Cell. 124, 877-881.
Prathalingam, N. S., Holt, W. W., Revell, S. G., Jones, S., and Watson, P. F. (2006). The precision and accuracy of six different methods to determine sperm concentration. J. Androl. 27, 257-262.
Reale, D., Martin, J., Coltman, D. W., Poissant, J., and Festa-Bianchet, M. (2009). Male personality, life-history strategies and reproductive success in a promiscuous mammal. J. Evol. Biol. 22, 1599-1607.
Reichart, M., Kahane, I., and Bartoov, B. (2000). In vivo and in vitro impairment of human and ram sperm nuclear chromatin integrity by sexually transmitted Ureaplasma urealyticum infection. Biol. Reprod. 63, 1041-1048.
Rey, R. (1998). Endocrine, paracrine and cellular regulation of postnatal anti-mullerian hormone secretion by sertoli cells. Trends Endocrinol. Metab. 9, 271-276.
Ro, S., Park, C., Song, R., Nguyen, D., Jin, J., Sanders, K. M., McCarrey, J. R., and Yan, W. (2007). Cloning and expression profiling of testis-expressed piRNA-like RNAs. RNA. 13, 1693-1702.
Robinson, M. D., McCarthy, D. J., and Smyth, G. K. (2010). edgeR: a Bioconductor package for differential expression analysis of digital gene expression data. Bioinformatics. 26, 139-140.
Rodriguez, I., Ody, C., Araki, K., Garcia, I., and Vassalli, P. (1997). An early and massive wave of germinal cell apoptosis is required for the development of functional spermatogenesis. EMBO J. 16, 2262-2270.
Roe, F. J., Dukes, C. E., Cameron, K. M., Pugh, R. C., and Mitchley, B. C. (1964). Cadmium Neoplasia: Testicular Atrophy and Leydig Cell Hyperplasia and Neoplasia in Rats and Mice Following the Subcutaneous Injection of Cadmium Salts. Br. J. Cancer. 18, 674-681.
Rozman, D., and Waterman, M. R. (1998). Lanosterol 14alpha-demethylase (CYP51) and spermatogenesis. Drug Metab. Dispos. 26, 1199-1201.
Ruppert, S., Cole, T. J., Boshart, M., Schmid, E., and Schutz, G. (1992). Multiple mRNA isoforms of the transcription activator protein CREB: generation by alternative splicing and specific expression in primary spermatocytes. EMBO J. 11, 1503-1512.
Rurangwa, E., Volckaert, F. A., Huyskens, G., Kime, D. E., and Ollevier, F. (2001). Quality control of refrigerated and cryopreserved semen using computer-assisted sperm analysis (CASA),

References
183
viable staining and standardized fertilization in African catfish (Clarias gariepinus). Theriogenology. 55, 751-769.
Russell, L. (1977). Movement of spermatocytes from the basal to the adluminal compartment of the rat testis. Am. J. Anat. 148, 313-328.
Russell, L. D., Bartke, A., and Goh, J. C. (1989). Postnatal development of the Sertoli cell barrier, tubular lumen, and cytoskeleton of Sertoli and myoid cells in the rat, and their relationship to tubular fluid secretion and flow. Am. J. Anat. 184, 179-189.
Russell, L. D., Chandrashekar, V., Bartke, A., and Hikim, A. P. (1994). The hamster Sertoli cell in early testicular regression and early recrudescence: a stereological and endocrine study. Int. J. Androl. 17, 93-106.
Sakkas, D., Mariethoz, E., Manicardi, G., Bizzaro, D., Bianchi, P. G., and Bianchi, U. (1999). Origin of DNA damage in ejaculated human sperm. Rev. Reprod. 4, 31-37.
Salamon, S. (1964). The effect of nutritional regimen on the potential semen production of rams. Aust. J. Agric. Res. 15, 645-656.
Salati, L. M., Szeszel-Fedorowicz, W., Tao, H., Gibson, M. A., Amir-Ahmady, B., Stabile, L. P., and Hodge, D. L. (2004). Nutritional regulation of mRNA processing. J. Nutr. 134, 2437S-2443S.
Salonen, J., Rajpert-De Meyts, E., Mannisto, S., Nielsen, J. E., Graem, N., Toppari, J., and Heikinheimo, M. (2010). Differential developmental expression of transcription factors GATA-4 and GATA-6, their cofactor FOG-2 and downstream target genes in testicular carcinoma in situ and germ cell tumors. Eur. J. Endocrinol. 162, 625-631.
Sanborn, B. M., Millan, J. L., Meistrich, M. L., and Moore, L. C. (1997). Alternative splicing of CREB and CREM mRNAs in an immortalized germ cell line. J. Androl. 18, 62-70.
Santos, M., Marcos, R., and Caniatti, M. (2010). Cytologic study of normal canine testis. Theriogenology. 73, 208-214.
Santos, R. L., Silva, C. M., Ribeiro, A. F., Vasconcelos, A. C., Pesquero, J. L., Coelho, S. G., Serakides, R., and Reis, S. R. (1999). Effect of growth hormone and induced IGF-I release on germ cell population and apoptosis in the bovine testis. Theriogenology. 51, 975-984.
Saunders, P. T., Maguire, S. M., Macpherson, S., Fenelon, M. C., Sakakibara, S., and Okano, H. (2002). RNA binding protein Musashi1 is expressed in sertoli cells in the rat testis from fetal life to adulthood. Biol. Reprod. 66, 500-507.
Schneider, C. A., Rasband, W. S., and Eliceiri, K. W. (2012). NIH Image to ImageJ: 25 years of image analysis. Nat. Methods. 9, 671-675.

References
184
Schulz, R. W., Menting, S., Bogerd, J., Franca, L. R., Vilela, D. A., and Godinho, H. P. (2005). Sertoli cell proliferation in the adult testis--evidence from two fish species belonging to different orders. Biol. Reprod. 73, 891-898.
Schwerk, C., and Schulze-Osthoff, K. (2005). Regulation of apoptosis by alternative pre-mRNA splicing. Mol. Cell. 19, 1-13.
Sekido, R., Bar, I., Narvaez, V., Penny, G., and Lovell-Badge, R. (2004). SOX9 is up-regulated by the transient expression of SRY specifically in Sertoli cell precursors. Dev. Biol. 274, 271-279.
Sertoli, E. (1865). Dell' esistenza di particolari cellule ramifi cate nei canalicoli seminiferi del testicolo umano. Morgagni 7, 31-33.
Setchell, B. P., Waites, G. M., and Lindner, H. R. (1965). Effect of undernutrition on testicular blood flow and metabolism and the output of testosterone in the ram. J. Reprod. Fertil. 9, 149-162.
Shaham, S., and Horvitz, H. R. (1996). An alternatively spliced C. elegans ced-4 RNA encodes a novel cell death inhibitor. Cell. 86, 201-208.
Sharma, T. P., Blache, D., Blackberry, M. A., and Martin, G. B. (1999). Role of peripheral and central aromatization in the control of gonadotrophin secretion in the male sheep. Reprod. Fertil. Dev. 11, 293-302.
Sharma, T. P., Blache, D., Roselli, C. E., and Martin, G. B. (2004). Distribution of aromatase activity in brain and peripheral tissues of male sheep: effect of nutrition. Reprod. Fertil. Dev. 16, 709-715.
Sharpe, R. M., McKinnell, C., Kivlin, C., and Fisher, J. S. (2003). Proliferation and functional maturation of Sertoli cells, and their relevance to disorders of testis function in adulthood. Reproduction. 125, 769-784.
Shaw, P., Bovey, R., Tardy, S., Sahli, R., Sordat, B., and Costa, J. (1992). Induction of apoptosis by wild-type p53 in a human colon tumor-derived cell line. Proc. Natl. Acad. Sci. U. S. A. 89, 4495-4499.
Shinohara, T., Orwig, K. E., Avarbock, M. R., and Brinster, R. L. (2000). Spermatogonial stem cell enrichment by multiparameter selection of mouse testis cells. Proc. Natl. Acad. Sci. U. S. A. 97, 8346-8351.
Shomron, N., and Levy, C. (2009). MicroRNA-biogenesis and Pre-mRNA splicing crosstalk. J. Biomed. Biotechnol. 2009, 594678.

References
185
Sigurdson, A. J., Bhatti, P., Doody, M. M., Hauptmann, M., Bowen, L., Simon, S. L., Weinstock, R. M., Linet, M. S., Rosenstein, M., Stovall, M., Alexander, B. H., Preston, D. L., Struewing, J. P., and Rajaraman, P. (2007). Polymorphisms in apoptosis- and proliferation-related genes, ionizing radiation exposure, and risk of breast cancer among U.S. Radiologic Technologists. Cancer Epidemiol. Biomarkers Prev. 16, 2000-2007.
Sinclair, S. (2000). Male infertility: nutritional and environmental considerations. Altern. Med. Rev. 5, 28-38.
Singh, A. P., Harada, S., and Mishina, Y. (2009). Downstream genes of Sox8 that would affect adult male fertility. Sex. Dev. 3, 16-25.
Siragam, V., Rutnam, Z. J., Yang, W., Fang, L., Luo, L., Yang, X., Li, M., Deng, Z., Qian, J., Peng, C., and Yang, B. B. (2012). MicroRNA miR-98 inhibits tumor angiogenesis and invasion by targeting activin receptor-like kinase-4 and matrix metalloproteinase-11. Oncotarget. 3, 1370-1385.
Smirnova, N. A., Romanienko, P. J., Khil, P. P., and Camerini-Otero, R. D. (2006). Gene expression profiles of Spo11-/- mouse testes with spermatocytes arrested in meiotic prophase I. Reproduction. 132, 67-77.
Sniffen, R. C. (1952). Histology of the normal and abnormal testis at puberty. Ann. N. Y. Acad. Sci. 55, 609-618.
Staiger, C. J., and Cande, W. Z. (1990). Microtubule distribution in dv, a maize meiotic mutant defective in the prophase to metaphase transition. Dev. Biol. 138, 231-242.
Steger, K., Rey, R., Louis, F., Kliesch, S., Behre, H. M., Nieschlag, E., Hoepffner, W., Bailey, D., Marks, A., and Bergmann, M. (1999). Reversion of the differentiated phenotype and maturation block in Sertoli cells in pathological human testis. Hum. Reprod. 14, 136-143.
Steinberger, A., Heindel, J. J., Lindsey, J. N., Elkington, J. S., Sanborn, B. M., and Steinberger, E. (1975). Isolation and culture of FSH responsive Sertoli cells. Endocr. Res. Commun. 2, 261-272.
Steinberger, A., and Steinberger, E. (1971). Replication pattern of Sertoli cells in maturing rat testis in vivo and in organ culture. Biol. Reprod. 4, 84-87.
Stoss, O., Stoilov, P., Hartmann, A. M., Nayler, O., and Stamm, S. (1999). The in vivo minigene approach to analyze tissue-specific splicing. Brain Res. Brain Res. Protoc. 4, 383-394.
Strzeiek, A., Kordan, W., Glogowski, J., Wysocki, P., and Borkowski, K. (1995). Influence of Semen-collection Frequency on Sperm Quality in Boars, with Special Reference to Biochemical Markers. Reprod. Domest. Anim. 30, 85-94.
References
186
Stuart, P. M., Griffith, T. S., Usui, N., Pepose, J., Yu, X., and Ferguson, T. A. (1997). CD95 ligand (FasL)-induced apoptosis is necessary for corneal allograft survival. J. Clin. Invest. 99, 396-402.
Sutherland, J. M., Fraser, B. A., Sobinoff, A. P., Pye, V. J., Davidson, T. L., Siddall, N. A., Koopman, P., Hime, G. R., and McLaughlin, E. A. (2014). Developmental Expression of Musashi-1 and Musashi-2 RNA-Binding Proteins During Spermatogenesis: Analysis of the Deleterious Effects of Dysregulated Expression. Biol. Reprod. 90, 92-109.
Tarulli, G. A., Meachem, S. J., Schlatt, S., and Stanton, P. G. (2008). Regulation of testicular tight junctions by gonadotrophins in the adult Djungarian hamster in vivo. Reproduction. 135, 867-877.
Tarulli, G. A., Stanton, P. G., Lerchl, A., and Meachem, S. J. (2006). Adult sertoli cells are not terminally differentiated in the Djungarian hamster: effect of FSH on proliferation and junction protein organization. Biol. Reprod. 74, 798-806.
Tarulli, G. A., Stanton, P. G., Loveland, K. L., Meyts, E. R., McLachlan, R. I., and Meachem, S. J. (2013). A survey of Sertoli cell differentiation in men after gonadotropin suppression and in testicular cancer. Spermatogenesis. 3, e24014.
Tarulli, G. A., Stanton, P. G., and Meachem, S. J. (2012). Is the adult Sertoli cell terminally differentiated? Biol. Reprod. 87, 13, 11-11.
Tegelenbosch, R. A., and de Rooij, D. G. (1993). A quantitative study of spermatogonial multiplication and stem cell renewal in the C3H/101 F1 hybrid mouse. Mutat. Res. 290, 193-200.
Thomson, T., and Lin, H. (2009). The biogenesis and function of PIWI proteins and piRNAs: progress and prospect. Annu. Rev. Cell Dev. Biol. 25, 355-376.
Tilbrook, A. J., de Kretser, D. M., Cummins, J. T., and Clarke, I. J. (1991). The negative feedback effects of testicular steroids are predominantly at the hypothalamus in the ram. Endocrinology. 129, 3080-3092.
Tilton, W. A., Warnick, A. C., Cunha, T. J., Loggins, P. E., and Shirley, R. L. (1964). Effect of low energy and protein intake on growth and reproductive performance of young rams. J. Anim. Sci. 23, 645-650.
Trainor, B. C., and Marler, C. A. (2002). Testosterone promotes paternal behaviour in a monogamous mammal via conversion to oestrogen. Proc. Biol. Sci. 269, 823-829.
Tuck, R. R., Setchell, B. P., Waites, G. M., and Young, J. A. (1970). The composition of fluid collected by micropuncture and catheterization from the seminiferous tubules and rete testis of rats. Pflugers Arch. 318, 225-243.

References
187
Tufarelli, V., Lacalandra, G. M., Aiudi, G., Binetti, F., and Laudadio, V. (2011). Influence of feeding level on live body weight and semen characteristics of Sardinian rams reared under intensive conditions. Trop. Anim. Health Prod. 43, 339-345.
Turcatel, G., Rubin, N., El-Hashash, A., and Warburton, D. (2012). MIR-99a and MIR-99b modulate TGF-beta induced epithelial to mesenchymal plasticity in normal murine mammary gland cells. PLoS One. 7, e31032.
Ungerfeld, R., and Silva, L. (2004). Ewe effect: endocrine and testicular changes in experienced adult and inexperienced young Corriedale rams used for the ram effect. Anim. Reprod. Sci. 80, 251-259.
Valles, A. S., Aveldano, M. I., and Furland, N. E. (2014). Altered lipid homeostasis in Sertoli cells stressed by mild hyperthermia. PLoS One. 9, e91127.
Venables, J. P., Bourgeois, C. F., Dalgliesh, C., Kister, L., Stevenin, J., and Elliott, D. J. (2005). Up-regulation of the ubiquitous alternative splicing factor Tra2beta causes inclusion of a germ cell-specific exon. Hum. Mol. Genet. 14, 2289-2303.
Venables, J. P., Elliott, D. J., Makarova, O. V., Makarov, E. M., Cooke, H. J., and Eperon, I. C. (2000). RBMY, a probable human spermatogenesis factor, and other hnRNP G proteins interact with Tra2beta and affect splicing. Hum. Mol. Genet. 9, 685-694.
Walkden-Brown, S. W., Restall, B. J., Norton, B. W., Scaramuzzi, R. J., and Martin, G. B. (1994a). Effect of nutrition on seasonal patterns of LH, FSH and testosterone concentration, testicular mass, sebaceous gland volume and odour in Australian Cashmere goats. J. Reprod. Fertil. 102, 351-360.
Walkden-Brown, S. W., Restall, B. J., and Taylor, W. A. (1994b). Testicular and epididymal sperm content in grazing Cashmere bucks: seasonal variation and prediction from measurements in vivo. Reprod. Fertil. Dev. 6, 727-736.
Walker, W. H., Girardet, C., and Habener, J. F. (1996). Alternative exon splicing controls a translational switch from activator to repressor isoforms of transcription factor CREB during spermatogenesis. J. Biol. Chem. 271, 20145-21050.
Wang, E. T., Sandberg, R., Luo, S., Khrebtukova, I., Zhang, L., Mayr, C., Kingsmore, S. F., Schroth, G. P., and Burge, C. B. (2008). Alternative isoform regulation in human tissue transcriptomes. Nature. 456, 470-476.
Wang, S., Tang, Y., Cui, H., Zhao, X., Luo, X., Pan, W., Huang, X., and Shen, N. (2011). Let-7/miR-98 regulate Fas and Fas-mediated apoptosis. Genes Immun. 12, 149-154.

References
188
Wang, Y., and Lee, C. G. (2009). MicroRNA and cancer--focus on apoptosis. J. Cell Mol. Med. 13, 12-23.
Weinbauer, G. F., Aslam, H., Krishnamurthy, H., Brinkworth, M. H., Einspanier, A., and Hodges, J. K. (2001). Quantitative analysis of spermatogenesis and apoptosis in the common marmoset (Callithrix jacchus) reveals high rates of spermatogonial turnover and high spermatogenic efficiency. Biol. Reprod. 64, 120-126.
Wightman, B., Ha, I., and Ruvkun, G. (1993). Posttranscriptional regulation of the heterochronic gene lin-14 by lin-4 mediates temporal pattern formation in C. elegans. Cell. 75, 855-862.
Wing, T. Y., and Christensen, A. K. (1982). Morphometric studies on rat seminiferous tubules. Am. J. Anat. 165, 13-25.
Wolburg, H., Wolburg-Buchholz, K., Liebner, S., and Engelhardt, B. (2001). Claudin-1, claudin-2 and claudin-11 are present in tight junctions of choroid plexus epithelium of the mouse. Neurosci Lett. 307, 77-80.
Woolley, P. (1975). The seminiferous tubules in dasyurid marsupials. J. Reprod. Fertil. 45, 255-261.
Wreford, N. G. (1995). Theory and practice of stereological techniques applied to the estimation of cell number and nuclear volume in the testis. Microsc. Res. Tech. 32, 423-436.
Wu, C. T., Chiou, C. Y., Chiu, H. C., and Yang, U. C. (2013). Fine-tuning of microRNA-mediated repression of mRNA by splicing-regulated and highly repressive microRNA recognition element. BMC Genomics. 14, 438.
Wulster-Radcliffe, M. C., Williams, M. A., Stellflug, J. N., and Lewis, G. S. (2001). Technical note: Artificial vagina vs a vaginal collection vial for collecting semen from rams. J. Anim. Sci. 79, 2964-2967.
Xu, M., You, Y., Hunsicker, P., Hori, T., Small, C., Griswold, M. D., and Hecht, N. B. (2008). Mice deficient for a small cluster of Piwi-interacting RNAs implicate Piwi-interacting RNAs in transposon control. Biol. Reprod. 79, 51-57.
Yan, N., Lu, Y., Sun, H., Qiu, W., Tao, D., Liu, Y., Chen, H., Yang, Y., Zhang, S., Li, X., and Ma, Y. (2009). Microarray profiling of microRNAs expressed in testis tissues of developing primates. J. Assist. Reprod. Genet. 26, 179-186.
Yang, Q., Hua, J., Wang, L., Xu, B., Zhang, H., Ye, N., Zhang, Z., Yu, D., Cooke, H. J., Zhang, Y., and Shi, Q. (2013). MicroRNA and piRNA profiles in normal human testis detected by next generation sequencing. PLoS One. 8, e66809.
References
189
Yi, R., Qin, Y., Macara, I. G., and Cullen, B. R. (2003). Exportin-5 mediates the nuclear export of pre-microRNAs and short hairpin RNAs. Genes. Dev. 17, 3011-3016.
Yin, Y., Hawkins, K. L., DeWolf, W. C., and Morgentaler, A. (1997). Heat stress causes testicular germ cell apoptosis in adult mice. J. Androl. 18, 159-165.
Youn, J. S., Cha, S. H., Park, C. W., Yang, K. M., Kim, J. Y., Koong, M. K., Kang, I. S., Song, I. O., and Han, S. C. (2011). Predictive value of sperm motility characteristics assessed by computer-assisted sperm analysis in intrauterine insemination with superovulation in couples with unexplained infertility. Clin. Exp. Reprod. Med. 38, 47-52.
Yu, Y., Zhang, Y., Song, X., Jin, M., Guan, Q., Zhang, Q., Li, S., Wei, C., Lu, G., Zhang, J., Ren, H., Sheng, X., Wang, C., and Du, L. (2010). Alternative splicing and tissue expression of CIB4 gene in sheep testis. Anim. Reprod. Sci. 120, 1-9.
Yu, Z., Raabe, T., and Hecht, N. B. (2005). MicroRNA Mirn122a reduces expression of the posttranscriptionally regulated germ cell transition protein 2 (Tnp2) messenger RNA (mRNA) by mRNA cleavage. Biol. Reprod. 73, 427-433.
Yuan, L., Liu, J. G., Zhao, J., Brundell, E., Daneholt, B., and Hoog, C. (2000). The murine SCP3 gene is required for synaptonemal complex assembly, chromosome synapsis, and male fertility. Mol. Cell. 5, 73-83.
Zeng, W., Avelar, G. F., Rathi, R., Franca, L. R., and Dobrinski, I. (2006). The length of the spermatogenic cycle is conserved in porcine and ovine testis xenografts. J. Androl. 27, 527-533.
Zhang, S., Blache, D., Blackberry, M. A., and Martin, G. B. (2004). Dynamics of the responses in secretion of luteinising hormone, leptin and insulin following an acute increase in nutrition in mature male sheep. Reprod. Fertil. Dev. 16, 823-829.
Zhang, Y., Wang, X., and Kang, L. (2011). A k-mer scheme to predict piRNAs and characterize locust piRNAs. Bioinformatics. 27, 771-776.

Appendices
190
Appendix Figures and Tables
Appendix Fig. 6.1. Length distribution of small RNAs in testis from sexually mature male sheep (n = 16). Small RNAs displayed a bimodal length distribution with two peaks at 22 nt and 30 nt.
Appendix Fig. 6.2. Expression of DE miRNAs in testis from sexually mature sheep fed the High diet or
the Low diet, as detected by qRT-PCR and miRNA-seq. Measurement of relative expression by qRT-
PCR is shown by line graphs and right Y-axis. Measurement of expression by miRNA-seq is shown by
bar graphs and the left Y-axis (values are log2 of normalized number of reads). A, B, C: different letters
denote significant difference in the relative expression detected by qRT-PCR; a, b, c: different letters
denote significant difference in the expression detected by miRNA-seq. Values are mean ± SE (N = 8 per
treatment).

Appendices
191
Appendix Fig. 6.3. Top 30 highly expressed miRNAs detected in the testis of male sheep fed a high diet
(HD) and a low diet (LD). N = 8 for each treatment.
Appendix Fig. 6.4. The top 9 signaling pathways of DE miRNAs analyzed by ingenuity pathway analysis
(IPA). The X-axis is –lg(p-value) and indicates the relevance of the pathway to the DE miRNAs, with a
lower p-value (a higher value of – lg(p-value)) suggesting greater relevance.

Appendices
192
Appendix Table 6.1 Details of primers used for RT-QPCR
Note: * GAPDH primers were obtained from Yu et al. 2010.
Appendix Table 6.2 Details of primers used for amplification of 3'UTR of the predicted targets of novel-
miR-144.
Gene Primer Sequence Product size (bp) Gene Bank FASL F: CTCGAGAGCACTCTGGGATTCTCTCC
694 NM_004013705.1
R: GTCGACTGCCCTTCCCAATTTCCACAT CASP3 F: CTCGAGCCCAAGGCAAGAAGCTCCA
520 XM_004021690.1
R: GTCGACGGGCTGACATTCAGGGATGG BCL2L1 F: CTCGAGTTCATCCCCACCCTCCAAGA
985 NM_001009226
R: GTCGACAGCTGGAAAAAGTGTGGGCT TP53 F: GTCATCTAGCGTCCGACCTC
895 NM_001009403.1 R: TGTCTCCTGACTCAGAGGGG
Gene Primer Sequence Product size
(bp) Gene Bank FASL F:CCACGTGGCTGGTATCAACT
108 NM_001123003.1
R:GGCTGACAGCAAAACAGGTG TP53 F:GTCATCTAGCGTCCGACCTC
147 NM_001009403.1
R:TGTCTCCTGACTCAGAGGGG CASP3 F:GGCTCTGAGTGTTTGGGGAA
135 XM_004021690.1
R:AGCTCCTGGACAAAGTTCCG GAPDH F:CTGCTGACGCTCCCATGTTTGT
150 NM_001190390.1* R:TAAGTCCCTCCACGATGCCAAA

Appendices
193
Appendix Table 6.3 Identification of homologues of novel miRNAs in testis from sexually mature male
sheep.
Novel miRNAs homolog Conservation Novel-miR-1 ggo-miR-320a conserved Novel-miR-5 cgr-miR-181c-5p highly conserved Novel-miR-6 mse-miR-100 highly conserved Novel-miR-7 cgr-miR-193b-3p highly conserved Novel-miR-8 pma-miR-129a-3p poorly conserved Novel-miR-11 cgr-miR-1839-5p poorly conserved Novel-miR-14 bta-miR-363 highly conserved Novel-miR-16 aca-miR-214-3p poorly conserved Novel-miR-18 pol-miR-140-3p conserved Novel-miR-19 bta-miR-1247-5p poorly conserved Novel-miR-20 rno-miR-504 conserved Novel-miR-22 bta-miR-6119-5p poorly conserved Novel-miR-23 ssc-miR-219 poorly conserved Novel-miR-26 cgr-miR-222-3p highly conserved Novel-miR-27 cgr-miR-423-3p poorly conserved Novel-miR-28 ggo-miR-138 highly conserved Novel-miR-29 ssc-miR-31 highly conserved Novel-miR-30 cgr-miR-34b-5p highly conserved Novel-miR-31 cgr-miR-34c-5p highly conserved Novel-miR-33 ssc-miR-296-3p conserved Novel-miR-34 ggo-miR-491 conserved Novel-miR-38 bta-miR-1388-3p poorly conserved Novel-miR-39 cgr-miR-215-5p highly conserved Novel-miR-40 ggo-miR-502b poorly conserved Novel-miR-41 ggo-miR-628 poorly conserved Novel-miR-43 cgr-miR-186-5p conserved Novel-miR-44 ssc-miR-20b highly conserved Novel-miR-45 cgr-miR-93-5p highly conserved Novel-miR-46 aca-miR-490-3p highly conserved Novel-miR-47 bta-miR-224 conserved Novel-miR-51 ggo-miR-424 highly conserved Novel-miR-52 cgr-miR-497-5p highly conserved Novel-miR-54 ppy-miR-301b highly conserved Novel-miR-55 ccr-miR-130a poorly conserved Novel-miR-56 ggo-miR-188 poorly conserved Novel-miR-57 cgr-miR-532-5p poorly conserved Novel-miR-58 rno-miR-1306-5p poorly conserved Novel-miR-60 ggo-miR-142 poorly conserved Novel-miR-63 bta-miR-3431 poorly conserved Novel-miR-65 eca-miR-326 conserved Novel-miR-69 bta-miR-2483-5p poorly conserved Novel-miR-71 ssc-miR-1468 poorly conserved Novel-miR-72 ggo-miR-192 highly conserved

Appendices
194
Novel-miR-73 ssc-miR-874 conserved Novel-miR-74 cgr-miR-328 conserved Novel-miR-75 ccr-miR-129 poorly conserved Novel-miR-76 bta-miR-6529 poorly conserved Novel-miR-78 ppy-miR-873 conserved Novel-miR-80 ggo-miR-331 poorly conserved Novel-miR-83 eca-miR-345-5p poorly conserved Novel-miR-84 bta-miR-503-3p highly conserved Novel-miR-87 sha-miR-101 highly conserved Novel-miR-88 ggo-miR-877 poorly conserved Novel-miR-89 cgr-miR-505-3p poorly conserved Novel-miR-90 pma-miR-145-5p highly conserved Novel-miR-91 aca-miR-147 poorly conserved Novel-miR-93 ccr-miR-20a-5p highly conserved Novel-miR-95 cgr-miR-141 poorly conserved Novel-miR-96 rno-miR-212-3p highly conserved Novel-miR-97 ccr-miR-18a highly conserved Novel-miR-98 ccr-miR-429 highly conserved Novel-miR-99 ccr-miR-365 highly conserved Novel-miR-101 bta-miR-660 poorly conserved Novel-miR-103 eca-miR-508-5p poorly conserved Novel-miR-104 oan-miR-18-3p poorly conserved Novel-miR-107 ccr-miR-29a poorly conserved Novel-miR-108 cgr-miR-195 highly conserved Novel-miR-109 cgr-miR-15a-5p highly conserved Novel-miR-110 cgr-miR-15b-5p highly conserved Novel-miR-111 ccr-miR-196a highly conserved Novel-miR-112 dre-miR-196d highly conserved Novel-miR-113 ggo-miR-454 highly conserved Novel-miR-115 ccr-miR-183 highly conserved Novel-miR-116 ggo-miR-135b highly conserved Novel-miR-117 aca-miR-135-5p highly conserved Novel-miR-118 cgr-miR-455-5p highly conserved Novel-miR-120 cgr-miR-32-5p highly conserved Novel-miR-121 ccr-miR-92a highly conserved Novel-miR-122 eca-miR-105 highly conserved Novel-miR-123 bta-miR-105b poorly conserved Novel-miR-124 ccr-miR-128 highly conserved Novel-miR-127 cgr-miR-148b-3p highly conserved Novel-miR-128 ccr-miR-338 highly conserved Novel-miR-129 ssc-miR-339 conserved Novel-miR-131 cgr-miR-615-3p conserved Novel-miR-132 ggo-miR-486 conserved Novel-miR-134 bta-miR-342 conserved Novel-miR-135 ppy-miR-330-5p conserved Novel-miR-138 pol-miR-9b-5p highly conserved Novel-miR-140 ggo-miR-146b highly conserved

Appendices
195
Novel-miR-141 bta-miR-146a highly conserved Novel-miR-142 bta-miR-769 poorly conserved Novel-miR-143 ppy-let-7e highly conserved Novel-miR-144 cgr-miR-98 highly conserved Novel-miR-145 cgr-miR-190a highly conserved Novel-miR-146 ggo-miR-190b highly conserved Novel-miR-147 eca-miR-507 highly conserved Novel-miR-149 ppy-miR-767-5p poorly conserved Novel-miR-151 bta-miR-6123 poorly conserved Novel-miR-154 cgr-miR-744-5p poorly conserved Novel-miR-156 ccr-miR-7a highly conserved Novel-miR-157 ccr-miR-1c poorly conserved Novel-miR-158 cgr-miR-184 highly conserved Novel-miR-161 ppy-miR-449a highly conserved Novel-miR-162 ccr-miR-34 highly conserved Novel-miR-163 cgr-miR-24-3p highly conserved Novel-miR-165 bta-miR-30f highly conserved Novel-miR-166 sha-miR-30e highly conserved Novel-miR-169 ggo-miR-542-3p conserved Novel-miR-171 cgr-miR-19a highly conserved Novel-miR-173 ccr-miR-499-5p highly conserved Novel-miR-174 ppy-miR-155 highly conserved Novel-miR-175 mml-miR-1296 poorly conserved Novel-miR-176 cgr-miR-340-5p conserved Novel-miR-177 ggo-miR-361-5p conserved Novel-miR-178 rno-miR-3585-5p poorly conserved Novel-miR-179 ggo-miR-27b highly conserved Novel-miR-180 ggo-miR-197 conserved Novel-miR-181 cgr-miR-204 highly conserved Novel-miR-183 pma-miR-153-3p highly conserved Novel-miR-186 ppy-miR-592 conserved Novel-miR-188 mmu-miR-670-3p poorly conserved Novel-miR-191 pol-miR-133-3p poorly conserved Novel-miR-193 cgr-miR-450a poorly conserved Novel-miR-194 mmu-miR-335-3p poorly conserved

Appendices
196
Appendix Table 6.4 Identification of clustered miRNAs in testis from sexually mature male sheep. Note:
Fold change (FC) = CPM of low diet group/CPM of high diet group. CPM (counts per million) =
(piRNAs reads number/total reads number per library) × 1,000,000. The significant DE piRNAs were
determined by false discovery rate (FDR) < 0.05.
Cluster miRNA precusors Chromosome Start End FDR
1 oar-let-7c 1 138828281 138828348 0.12
1 oar-mir-99a 1 138829044 138829104 0.00
2 oar-let-7d 2 27312334 27312420 0.12
2 oar-let-7f 2 27314541 27314619 0.82
3 oar-mir-23a 2 31139258 31139316 0.17
3 oar-mir-23b 2 31139258 31139316 0.01
4 oar-mir-29a 4 94625756 94625815 0.00
4 oar-mir-29b 4 94626148 94626212 0.15
5 Novel-mir-97 10 66183231 66183294 0.72
5 Novel-mir-171 10 66183379 66183435 0.25
5 Novel-mir-93 10 66183541 66183600 0.82
5 Novel-mir-121 10 66183794 66183853 0.29
6 oar-mir-200a 12 49397310 49397370 0.06
6 oar-mir-200b 12 49397879 49397938 0.07
7 Novel-mir-151 13 56861602 56861671 0.12
7 Novel-mir-33 13 56861865 56861922 0.02
8 oar-mir-431 18 64480275 64480365 NA
8 oar-mir-433-3p 18 64481132 64481245 NA
8 oar-mir-127 18 64482256 64482312 1.00
8 oar-mir-432 18 64483745 64483814 0.11
8 oar-mir-136 18 64483932 64483988 0.32
9 oar-mir-299-5p 18 64620136 64620188 0.04
9 oar-mir-299-3p 18 64620136 64620188 NA
9 oar-mir-380-3p 18 64621337 64621394 0.06
9 oar-mir-411b-3p 18 64621498 64621554 0.02
9 oar-mir-1197-5p 18 64621814 64621942 NA
9 oar-mir-1197-3p 18 64621814 64621942 0.05
9 oar-mir-323a-3p 18 64622016 64622072 0.00
9 oar-mir-758-3p 18 64622312 64622370 0.06
9 oar-mir-329b-3p 18 64623030 64623089 0.59
9 oar-mir-494-3p 18 64626212 64626270 0.02
9 oar-mir-543-3p 18 64628562 64628619 0.60
9 oar-mir-495-3p 18 64629999 64630057 0.81
9 oar-mir-3958-5p 18 64631942 64631998 0.32
9 oar-mir-3958-3p 18 64631942 64631998 0.01
9 oar-mir-376b-3p 18 64634621 64634681 0.79
9 oar-mir-376c-3p 18 64634992 64635050 0.89
9 oar-mir-376d 18 64635363 64635421 0.94
9 oar-mir-376e-3p 18 64635739 64635798 0.07
9 oar-mir-376a-3p 18 64636085 64636187 0.05

Appendices
197
9 oar-mir-1185-5p 18 64638058 64638118 0.03
9 oar-mir-1185-3p 18 64638058 64638118 0.02
9 oar-mir-381-3p 18 64639738 64639801 0.06
9 oar-mir-381-3p 18 64639738 64639801 0.06
9 oar-mir-487b-3p 18 64640234 64640291 0.24
9 oar-mir-539-3p 18 64641003 64641061 0.36
9 oar-mir-544-5p 18 64642597 64642697 0.04
9 oar-mir-655-3p 18 64643523 64643583 0.82
9 oar-mir-3959-5p 18 64645543 64645597 0.26
9 oar-mir-3959-3p 18 64645543 64645597 0.90
9 oar-mir-487a-3p 18 64645957 64646015 0.06
9 oar-mir-382-5p 18 64648908 64648965 0.30
9 oar-mir-382-3p 18 64648908 64648965 0.25
9 oar-mir-134-5p 18 64649271 64649334 0.04
9 oar-mir-485-5p 18 64649969 64650028 0.82
9 oar-mir-485-3p 18 64649969 64650028 0.27
10 Novel-mir-7 24 13219122 13219181 0.72
10 Novel-mir-99 24 13223800 13223862 0.30
11 Novel-mir-101 X 52158377 52158433 0.45
11 Novel-mir-40 X 52160489 52160551 0.58
11 Novel-mir-56 X 52175957 52176017 0.91
11 Novel-mir-57 X 52176280 52176339 0.10
12 Novel-mir-123 X 78722115 78722173 0.69
12 Novel-mir-149 X 78723038 78723094 0.07
12 Novel-mir-122 X 78724306 78724365 0.29
13 Novel-mir-47 X 79046399 79046467 0.12
13 Novel-mir-63 X 79048337 79048399 0.11
14 Novel-mir-105 X 84537948 84538004 0.20
14 Novel-mir-17 X 84538978 84539035 0.04
15 Novel-mir-51 X 95343715 95343773 0.33
15 Novel-mir-84 X 95344046 95344109 1.00
15 Novel-mir-169 X 95348844 95348903 0.58
15 Novel-mir-193 X 95350011 95350066 0.13
16 Novel-mir-104 X 95607969 95608031 0.47
16 Novel-mir-44 X 95608208 95608268 0.82
16 Novel-mir-121 X 95608483 95608544 0.29
16 Novel-mir-14 X 95608637 95608702 0.94

Appendices
198
Appendix Table 6.5 Differentially expressed piRNAs in testis from sheep fed a low or high diet (N = 8
for each treatment). Note: Fold change (FC) = CPM of low diet group/CPM of high diet group. CPM
(Counts per million) = (piRNAs reads number/total reads number per library) × 1,000,000. The
significant DE piRNAs were determined by false discovery rate (FDR) < 0.05.
logFC logCPM PValue FDR
oar-piR-789 3.64 6.85 6.67E-17 3.33E-13 oar-piR-3085 -3.79 5.96 1.76E-14 4.39E-11 oar-piR-11578 3.50 4.07 6.88E-13 1.15E-09 oar-piR-6442 4.29 3.59 1.88E-11 2.35E-08 oar-piR-606 2.19 6.72 2.32E-10 2.32E-07 oar-piR-12439 -1.94 8.65 1.30E-09 1.08E-06 oar-piR-13207 2.10 5.03 1.32E-07 9.43E-05 oar-piR-2287 -1.98 8.89 2.06E-07 1.28E-04 oar-piR-1866 -2.06 4.89 3.68E-07 1.93E-04 oar-piR-6716 -2.57 4.41 3.85E-07 1.93E-04 oar-piR-3404 -2.91 5.14 5.10E-07 2.30E-04 oar-piR-11406 1.73 5.75 5.84E-07 2.30E-04 oar-piR-1617 -2.38 6.06 5.99E-07 2.30E-04 oar-piR-2194 -1.56 5.21 7.53E-07 2.69E-04 oar-piR-3337 -3.28 5.07 1.35E-06 4.50E-04 oar-piR-10216 2.45 3.93 1.95E-06 5.75E-04 oar-piR-10217 2.45 3.93 1.95E-06 5.75E-04 oar-piR-10729 2.13 4.19 3.02E-06 7.54E-04 oar-piR-10730 2.13 4.19 3.02E-06 7.54E-04 oar-piR-10731 2.13 4.19 3.02E-06 7.54E-04 oar-piR-2327 -2.20 8.53 3.36E-06 8.00E-04 oar-piR-300 -1.47 6.89 3.63E-06 8.24E-04 oar-piR-12568 0.56 6.63 3.90E-06 8.48E-04 oar-piR-2936 1.54 5.18 4.56E-06 9.50E-04 oar-piR-664 1.61 7.59 2.14E-05 4.28E-03 oar-piR-9120 -2.26 4.63 3.90E-05 7.49E-03 oar-piR-9006 -1.05 5.34 4.68E-05 8.53E-03 oar-piR-6573 1.54 6.39 4.78E-05 8.53E-03 oar-piR-223 -0.93 11.98 5.02E-05 8.65E-03 oar-piR-644 -1.98 4.11 6.04E-05 1.01E-02 oar-piR-2747 1.52 5.23 7.48E-05 1.21E-02 oar-piR-1189 -0.89 10.55 1.33E-04 2.07E-02 oar-piR-2886 1.13 9.77 1.42E-04 2.14E-02 oar-piR-7322 1.38 5.99 1.59E-04 2.34E-02 oar-piR-1248 -1.06 5.35 3.32E-04 4.74E-02

Appendices
199
Appendix Table 6.6 Gene-derived DE piRNAs in testis from sexually mature male sheep fed a high or
low diet (N = 8 for each treatment).
piRNA Genomic Location Gene full name Gene abbreviation name
oar-piR-12568 3'UTR feline leukemia virus subgroup C cellular receptor family, member 2 FLVCR2
oar-piR-6442 3'UTR keratin associated protein 10-2 KRTAP10-2
oar-piR-9006 5'UTR ATPase, Ca++ Transporting, Plasma Membrane 4 ATP2B4
oar-piR-10216 Intron Mortality Factor 4 Like 1 MORF4L1
oar-piR-10217 Intron Mortality Factor 4 Like 1 MORF4L1
oar-piR-10729 Intron Mortality Factor 4 Like 1 MORF4L1
oar-piR-10730 Intron Mortality Factor 4 Like 1 MORF4L1
oar-piR-10731 Intron Mortality Factor 4 Like 1 MORF4L1
oar-piR-11406 Intron sorting nexin 5 SNX5
oar-piR-1248 Intron Storkhead-Box Protein 1 STOX1
oar-piR-2194 Intron ENSOARG00000013508 ENSOARG00000013508
oar-piR-2936 Intron fumarylacetoacetate hydrolase FAH
oar-piR-7322 Intron C-Type Lectin Domain Family 16, Member CLEC16A
oar-piR-9006 Intron DDB1 And CUL4 Associated Factor 6 DCAF6

Appendices
200
Appendix Table 7.1 Differentially expressed mRNAs in testis from sheep fed a low or high diet (N = 8
for each treatment). Note: Fold change (FC) = CPM of low diet group/CPM of high diet group. CPM
(Counts per million) = (mRNAs reads number/total reads number per library) × 1,000,000. The
significant DE mRNAs were determined by false discovery rate (FDR) < 0.05.
ID logFC logCPM PValue symbol
ENSOARG00000007324 -3.156 4.693 7.57E-12 SETD9
ENSOARG00000012186 -1.990 6.099 2.10E-09 CATSPERB
ENSOARG00000000285 1.627 4.305 4.19E-08 INSR
ENSOARG00000003592 1.415 5.905 3.92E-08 LRP2
ENSOARG00000020906 1.907 4.181 7.21E-08 ENSOARG00000010318 1.597 4.435 1.43E-07 SVOPL
ENSOARG00000011728 1.776 2.432 1.14E-07 BCL9L
ENSOARG00000018288 1.946 4.219 1.35E-07 NCKAP5L
ENSOARG00000010474 1.852 3.191 2.24E-07 HR
ENSOARG00000003366 1.774 2.857 2.61E-07 PCNXL2
ENSOARG00000016970 1.766 2.696 3.79E-07 TPP1
ENSOARG00000002932 1.859 5.252 4.65E-07 ADCY9
ENSOARG00000009190 1.272 7.349 6.91E-07 ENSOARG00000012814 1.205 9.032 6.66E-07 ARHGAP36
ENSOARG00000004917 1.382 6.919 8.31E-07 SH3TC2
ENSOARG00000001626 1.299 4.256 9.66E-07 PPM1K
ENSOARG00000008998 1.462 5.272 1.16E-06 INADL
ENSOARG00000017603 1.300 4.872 1.26E-06 ENSOARG00000009323 1.622 4.356 1.58E-06 BCAM
ENSOARG00000009750 1.528 3.100 1.74E-06 NPNT
ENSOARG00000020222 1.405 5.593 2.06E-06 ITGB5
ENSOARG00000006648 1.422 2.409 2.37E-06 SLFN14
ENSOARG00000019276 -1.721 8.685 2.47E-06 SLC9C1
ENSOARG00000008143 -1.387 2.591 2.92E-06 SMPDL3A
ENSOARG00000011479 1.643 4.080 2.99E-06 CRTAC1
ENSOARG00000010005 -1.652 5.304 3.50E-06 IGF1R
ENSOARG00000007029 1.406 5.731 3.73E-06 SPOCK2
ENSOARG00000003922 1.500 2.757 4.70E-06 MXRA8
ENSOARG00000012369 1.659 5.789 4.59E-06 SLC4A5
ENSOARG00000014423 1.708 4.196 4.32E-06 DAB2IP
ENSOARG00000015885 1.455 3.469 4.74E-06 TOX
ENSOARG00000001269 -1.515 4.677 5.40E-06 STAR
ENSOARG00000003390 1.266 4.721 5.25E-06 ENSOARG00000020503 1.165 6.317 5.15E-06 COL4A4
ENSOARG00000012200 1.155 5.010 6.04E-06 MPZL1
ENSOARG00000012398 1.482 4.788 6.16E-06 ENSOARG00000016047 1.199 4.616 6.28E-06 TGFBR3
ENSOARG00000019011 1.354 5.014 6.19E-06 LRRFIP1
ENSOARG00000011536 1.393 5.299 6.47E-06 NCKAP5
ENSOARG00000005403 1.470 3.209 6.96E-06 BACE1
ENSOARG00000014938 1.650 2.661 6.82E-06 ZNF395

Appendices
201
ENSOARG00000010607 1.804 3.571 7.96E-06 CCDC8
ENSOARG00000012805 1.049 5.856 8.69E-06 TMEM2
ENSOARG00000014559 1.645 5.106 8.50E-06 LAMB2
ENSOARG00000014425 1.484 4.212 9.04E-06 MERTK
ENSOARG00000016334 1.209 4.740 9.28E-06 WT1
ENSOARG00000012739 1.339 5.895 9.98E-06 TANC2
ENSOARG00000020475 1.498 4.100 1.05E-05 LEPREL1
ENSOARG00000005659 -1.325 5.100 1.13E-05 ENSOARG00000010736 1.184 5.608 1.14E-05 DFNA5
ENSOARG00000011943 -1.341 8.826 1.11E-05 SLC9C2
ENSOARG00000020387 1.391 6.150 1.17E-05 TYRO3
ENSOARG00000005188 1.388 8.024 1.27E-05 MAP1B
ENSOARG00000012886 1.454 2.707 1.27E-05 THRA
ENSOARG00000016447 1.247 7.214 1.28E-05 KIAA1210
ENSOARG00000019687 1.614 3.478 1.32E-05 ARHGEF40
ENSOARG00000002130 -1.501 8.316 1.49E-05 ENSOARG00000004562 1.147 3.666 1.50E-05 ZADH2
ENSOARG00000005166 -1.339 8.276 1.47E-05 TEX30
ENSOARG00000009528 1.415 4.734 1.42E-05 AFF2
ENSOARG00000019074 1.703 4.752 1.48E-05 NYNRIN
ENSOARG00000005362 -1.456 7.646 1.56E-05 C1orf101
ENSOARG00000007820 -1.489 7.552 1.59E-05 MEIG1
ENSOARG00000018590 1.339 2.375 1.63E-05 MID2
ENSOARG00000019070 1.051 7.032 1.61E-05 PDGFRA
ENSOARG00000019400 1.304 3.671 1.53E-05 RAPGEF3
ENSOARG00000004441 1.715 3.625 1.75E-05 SLC41A1
ENSOARG00000008504 -1.503 5.174 1.75E-05 LRRC72
ENSOARG00000014858 -1.340 7.893 1.74E-05 PBK
ENSOARG00000016713 1.141 5.428 1.75E-05 TKT
ENSOARG00000005533 1.568 2.997 1.80E-05 UBQLN2
ENSOARG00000015255 -1.537 4.366 1.85E-05 ENSOARG00000019474 -1.553 8.053 1.86E-05 TDRD15
ENSOARG00000020961 1.218 4.612 1.85E-05 MARCKSL1
ENSOARG00000018517 1.458 3.670 1.92E-05 CORO2B
ENSOARG00000007688 1.071 5.287 1.95E-05 SLC25A6
ENSOARG00000000649 -1.429 6.344 2.02E-05 ENSOARG00000009155 1.151 4.022 2.05E-05 CCBL1
ENSOARG00000010354 0.999 5.164 2.12E-05 LRRC8D
ENSOARG00000019206 1.107 4.455 2.12E-05 PHLDB2
ENSOARG00000011436 1.090 6.486 2.16E-05 MGAT5
ENSOARG00000005688 1.181 3.060 2.23E-05 RAB30
ENSOARG00000016106 1.906 3.202 2.27E-05 OTOA
ENSOARG00000016294 -1.485 6.108 2.32E-05 CCDC172
ENSOARG00000020201 1.188 6.201 2.43E-05 MLCK
ENSOARG00000012066 1.835 3.248 2.51E-05 SEMA4B
ENSOARG00000005930 1.369 3.170 2.57E-05 FIGN
ENSOARG00000015492 1.251 3.079 2.59E-05 ABHD17C
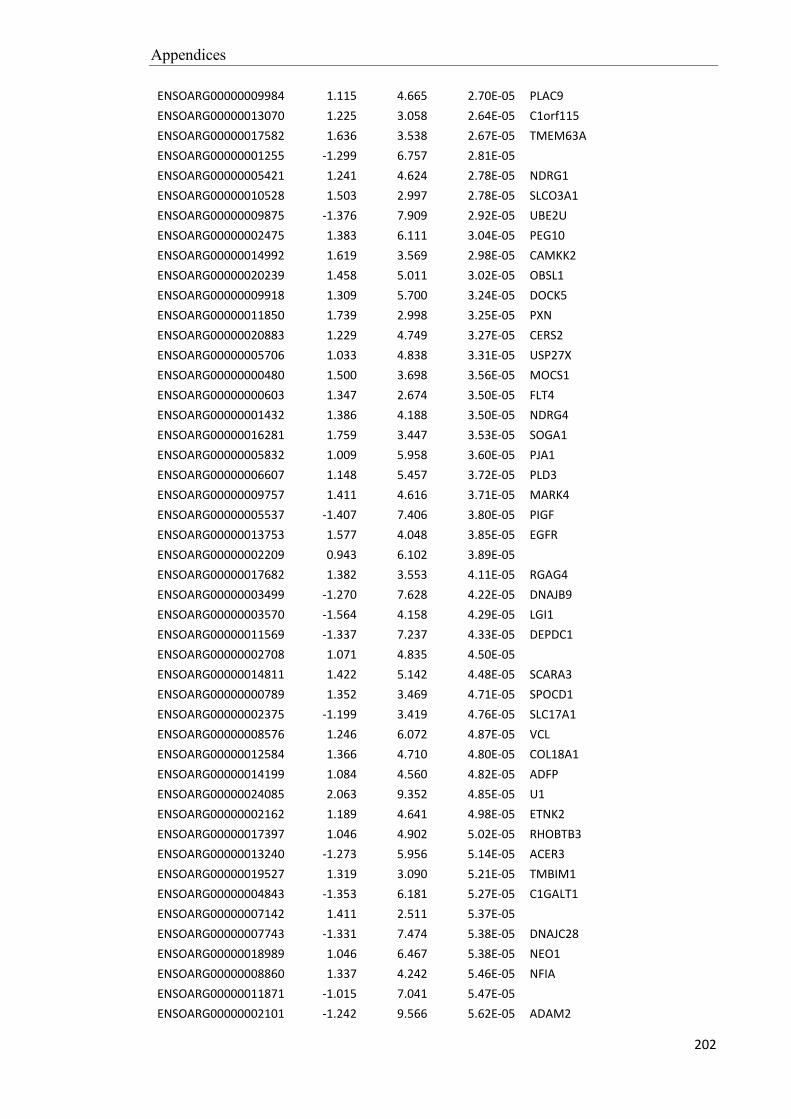
Appendices
202
ENSOARG00000009984 1.115 4.665 2.70E-05 PLAC9
ENSOARG00000013070 1.225 3.058 2.64E-05 C1orf115
ENSOARG00000017582 1.636 3.538 2.67E-05 TMEM63A
ENSOARG00000001255 -1.299 6.757 2.81E-05 ENSOARG00000005421 1.241 4.624 2.78E-05 NDRG1
ENSOARG00000010528 1.503 2.997 2.78E-05 SLCO3A1
ENSOARG00000009875 -1.376 7.909 2.92E-05 UBE2U
ENSOARG00000002475 1.383 6.111 3.04E-05 PEG10
ENSOARG00000014992 1.619 3.569 2.98E-05 CAMKK2
ENSOARG00000020239 1.458 5.011 3.02E-05 OBSL1
ENSOARG00000009918 1.309 5.700 3.24E-05 DOCK5
ENSOARG00000011850 1.739 2.998 3.25E-05 PXN
ENSOARG00000020883 1.229 4.749 3.27E-05 CERS2
ENSOARG00000005706 1.033 4.838 3.31E-05 USP27X
ENSOARG00000000480 1.500 3.698 3.56E-05 MOCS1
ENSOARG00000000603 1.347 2.674 3.50E-05 FLT4
ENSOARG00000001432 1.386 4.188 3.50E-05 NDRG4
ENSOARG00000016281 1.759 3.447 3.53E-05 SOGA1
ENSOARG00000005832 1.009 5.958 3.60E-05 PJA1
ENSOARG00000006607 1.148 5.457 3.72E-05 PLD3
ENSOARG00000009757 1.411 4.616 3.71E-05 MARK4
ENSOARG00000005537 -1.407 7.406 3.80E-05 PIGF
ENSOARG00000013753 1.577 4.048 3.85E-05 EGFR
ENSOARG00000002209 0.943 6.102 3.89E-05 ENSOARG00000017682 1.382 3.553 4.11E-05 RGAG4
ENSOARG00000003499 -1.270 7.628 4.22E-05 DNAJB9
ENSOARG00000003570 -1.564 4.158 4.29E-05 LGI1
ENSOARG00000011569 -1.337 7.237 4.33E-05 DEPDC1
ENSOARG00000002708 1.071 4.835 4.50E-05 ENSOARG00000014811 1.422 5.142 4.48E-05 SCARA3
ENSOARG00000000789 1.352 3.469 4.71E-05 SPOCD1
ENSOARG00000002375 -1.199 3.419 4.76E-05 SLC17A1
ENSOARG00000008576 1.246 6.072 4.87E-05 VCL
ENSOARG00000012584 1.366 4.710 4.80E-05 COL18A1
ENSOARG00000014199 1.084 4.560 4.82E-05 ADFP
ENSOARG00000024085 2.063 9.352 4.85E-05 U1
ENSOARG00000002162 1.189 4.641 4.98E-05 ETNK2
ENSOARG00000017397 1.046 4.902 5.02E-05 RHOBTB3
ENSOARG00000013240 -1.273 5.956 5.14E-05 ACER3
ENSOARG00000019527 1.319 3.090 5.21E-05 TMBIM1
ENSOARG00000004843 -1.353 6.181 5.27E-05 C1GALT1
ENSOARG00000007142 1.411 2.511 5.37E-05 ENSOARG00000007743 -1.331 7.474 5.38E-05 DNAJC28
ENSOARG00000018989 1.046 6.467 5.38E-05 NEO1
ENSOARG00000008860 1.337 4.242 5.46E-05 NFIA
ENSOARG00000011871 -1.015 7.041 5.47E-05 ENSOARG00000002101 -1.242 9.566 5.62E-05 ADAM2

Appendices
203
ENSOARG00000000327 1.341 7.555 5.91E-05 LAMA1
ENSOARG00000003586 1.721 3.118 5.97E-05 IGF2
ENSOARG00000005297 -1.267 8.059 5.78E-05 ENSOARG00000006178 1.199 3.020 6.03E-05 FAM20C
ENSOARG00000006760 1.149 4.301 5.91E-05 LPAR1
ENSOARG00000007866 1.152 4.317 5.76E-05 PSMB9
ENSOARG00000013541 1.133 5.466 5.98E-05 GSTT1
ENSOARG00000014988 1.095 10.283 5.94E-05 AHNAK
ENSOARG00000020060 1.004 7.056 6.04E-05 PABPC4
ENSOARG00000014682 -1.080 8.540 6.11E-05 ENSOARG00000013473 1.443 4.110 6.42E-05 NHS
ENSOARG00000018210 0.953 6.962 6.45E-05 TIMP3
ENSOARG00000002785 1.437 6.611 6.56E-05 KIAA1217
ENSOARG00000009144 1.030 3.565 6.68E-05 JAZF1
ENSOARG00000012327 -1.377 9.566 6.67E-05 ENSOARG00000013610 1.594 6.493 6.52E-05 MYO7A
ENSOARG00000016797 -1.507 7.048 6.60E-05 SPATA22
ENSOARG00000000338 1.789 4.291 6.77E-05 ABCA2
ENSOARG00000000692 1.138 5.227 6.96E-05 VILL
ENSOARG00000001888 -1.263 8.978 7.29E-05 ADAM32
ENSOARG00000004896 1.096 3.662 7.19E-05 SYTL2
ENSOARG00000005436 1.339 4.950 7.02E-05 FAM65B
ENSOARG00000011877 1.476 2.599 7.20E-05 ENSOARG00000013071 -1.051 7.472 7.29E-05 ENSOARG00000013365 1.278 5.826 7.14E-05 USP11
ENSOARG00000016052 0.996 6.936 7.33E-05 AOX1
ENSOARG00000016567 -1.290 6.860 7.20E-05 ZSWIM2
ENSOARG00000017517 1.068 6.227 7.03E-05 SERINC5
ENSOARG00000018262 1.308 3.547 7.25E-05 NKIRAS2
ENSOARG00000001507 1.106 3.531 7.38E-05 SETD6
ENSOARG00000009599 1.231 5.653 7.43E-05 ALDH1A3
ENSOARG00000006679 1.471 5.380 7.52E-05 ARHGEF11
ENSOARG00000020797 1.010 5.887 7.53E-05 TPM1
ENSOARG00000019806 1.388 5.293 7.64E-05 PLXNB2
ENSOARG00000020078 -1.462 4.174 7.69E-05 EAF2
ENSOARG00000006117 1.397 2.555 7.92E-05 SLC41A3
ENSOARG00000008570 1.171 3.394 7.99E-05 RBMS2
ENSOARG00000010071 1.040 4.412 7.95E-05 NKX3-1
ENSOARG00000010118 1.027 4.893 7.91E-05 VWA5A
ENSOARG00000014746 1.321 4.752 8.12E-05 MAP3K15
ENSOARG00000010288 1.681 5.821 8.21E-05 MAP1A
ENSOARG00000020192 -1.505 6.577 8.37E-05 MORN2
ENSOARG00000007061 1.233 3.439 8.48E-05 ENSOARG00000013044 0.954 6.700 8.59E-05 ZO2
ENSOARG00000014585 -1.318 5.832 8.68E-05 ENSOARG00000011766 1.260 4.413 8.75E-05 CDCA7L
ENSOARG00000013942 -1.551 7.266 8.89E-05

Appendices
204
ENSOARG00000004561 1.095 4.428 9.25E-05 TMTC4
ENSOARG00000007392 0.942 6.184 9.33E-05 MAP3K1
ENSOARG00000009531 -1.112 9.183 9.14E-05 LDHC
ENSOARG00000012117 1.016 5.236 9.24E-05 RAB11FIP3
ENSOARG00000015487 1.249 4.684 9.13E-05 ZBTB38
ENSOARG00000019354 1.224 3.709 9.29E-05 SLC7A8
ENSOARG00000020003 -1.472 4.356 9.37E-05 LYRM5
ENSOARG00000020999 -1.280 7.771 9.36E-05 FAM227B
ENSOARG00000000178 -1.450 8.757 9.49E-05 PPP1R42
ENSOARG00000014725 1.218 6.103 9.45E-05 APLP2
ENSOARG00000001975 -1.241 10.092 9.66E-05 ENSOARG00000003537 1.037 8.191 9.67E-05 SYNE1
ENSOARG00000008657 -1.141 6.418 9.84E-05 ZNF572
ENSOARG00000018805 -1.287 6.758 9.95E-05 FBXL13
ENSOARG00000002163 -1.171 6.593 0.000101358 ADAM18
ENSOARG00000001381 1.061 4.060 0.000102085 PSEN2
ENSOARG00000011347 1.636 3.191 0.000106031 FBRSL1
ENSOARG00000011582 1.075 4.868 0.000108399 CYP26B1
ENSOARG00000014016 1.365 5.807 0.000108589 TIAM1
ENSOARG00000005151 1.046 6.166 0.000111484 HMCN1
ENSOARG00000014525 1.117 4.878 0.000111891 AR
ENSOARG00000007281 1.467 4.817 0.000112983 SRGAP3
ENSOARG00000007332 1.575 7.480 0.000113611 LRP1
ENSOARG00000015806 -1.317 8.124 0.000113657 PIH1D2
ENSOARG00000000291 -1.307 3.800 0.000115762 FGB
ENSOARG00000001142 1.410 3.829 0.000115688 ITPKB
ENSOARG00000007284 0.973 6.342 0.000118708 ARHGAP10
ENSOARG00000019810 1.331 3.133 0.000120327 GPR55
ENSOARG00000020849 -1.456 7.696 0.0001202 HORMAD1
ENSOARG00000003402 -1.271 6.151 0.00012186 BBS5
ENSOARG00000006859 -1.295 5.600 0.000122305 C11orf70
ENSOARG00000005365 1.218 4.579 0.000124471 FHOD3
ENSOARG00000015849 -1.287 7.601 0.000124123 MRPL42
ENSOARG00000020243 1.255 5.183 0.000123896 INHA
ENSOARG00000013562 1.139 3.295 0.000126952 SCUBE2
ENSOARG00000006748 1.111 3.232 0.000134301 CTSO
ENSOARG00000008224 1.267 2.939 0.000134514 DAB1
ENSOARG00000010114 -1.278 3.435 0.000133138 ENSOARG00000012558 -1.262 6.478 0.000133036 ENSOARG00000017729 1.274 2.527 0.000134876 PCED1B
ENSOARG00000016465 -1.353 4.758 0.000136234 LIPI
ENSOARG00000019436 0.920 6.004 0.000137013 ABHD4
ENSOARG00000014769 0.920 6.287 0.000138417 OCRL
ENSOARG00000000803 1.551 3.690 0.000141707 SOGA2
ENSOARG00000013073 1.598 3.487 0.000141477 RIN3
ENSOARG00000017985 1.245 4.009 0.000142258 ARHGDIA
ENSOARG00000003224 1.218 2.448 0.000146016 SMPDL3B
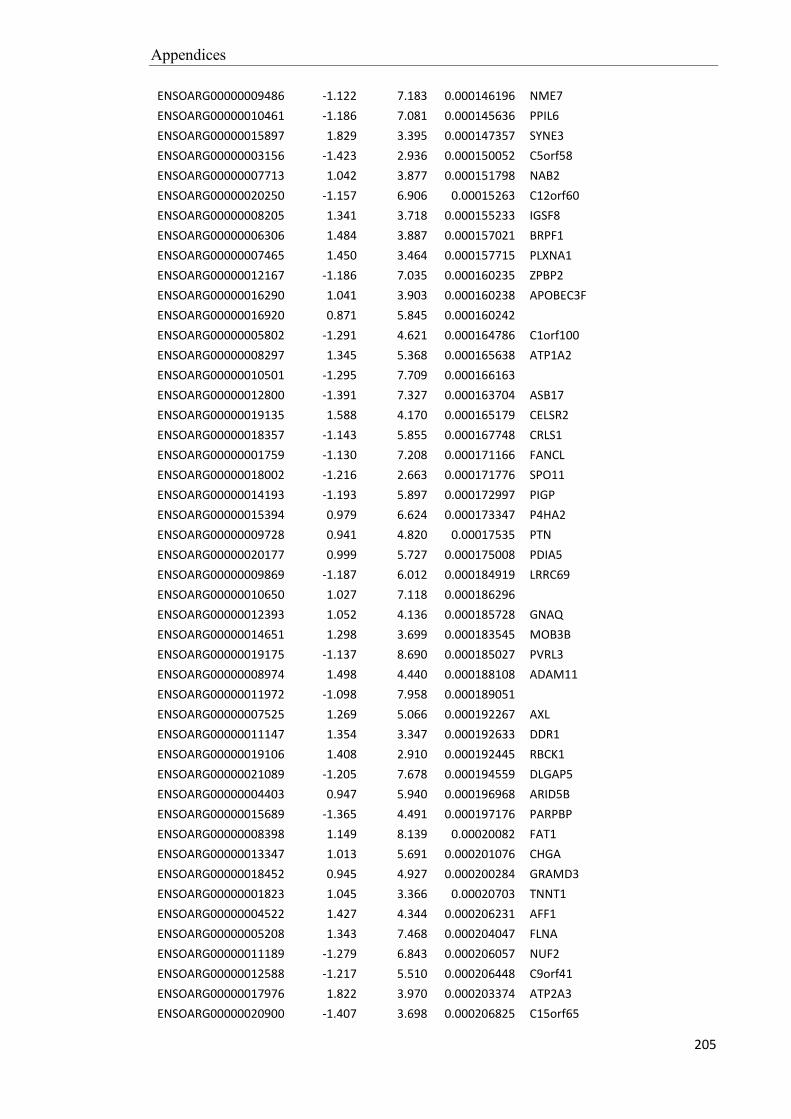
Appendices
205
ENSOARG00000009486 -1.122 7.183 0.000146196 NME7
ENSOARG00000010461 -1.186 7.081 0.000145636 PPIL6
ENSOARG00000015897 1.829 3.395 0.000147357 SYNE3
ENSOARG00000003156 -1.423 2.936 0.000150052 C5orf58
ENSOARG00000007713 1.042 3.877 0.000151798 NAB2
ENSOARG00000020250 -1.157 6.906 0.00015263 C12orf60
ENSOARG00000008205 1.341 3.718 0.000155233 IGSF8
ENSOARG00000006306 1.484 3.887 0.000157021 BRPF1
ENSOARG00000007465 1.450 3.464 0.000157715 PLXNA1
ENSOARG00000012167 -1.186 7.035 0.000160235 ZPBP2
ENSOARG00000016290 1.041 3.903 0.000160238 APOBEC3F
ENSOARG00000016920 0.871 5.845 0.000160242 ENSOARG00000005802 -1.291 4.621 0.000164786 C1orf100
ENSOARG00000008297 1.345 5.368 0.000165638 ATP1A2
ENSOARG00000010501 -1.295 7.709 0.000166163 ENSOARG00000012800 -1.391 7.327 0.000163704 ASB17
ENSOARG00000019135 1.588 4.170 0.000165179 CELSR2
ENSOARG00000018357 -1.143 5.855 0.000167748 CRLS1
ENSOARG00000001759 -1.130 7.208 0.000171166 FANCL
ENSOARG00000018002 -1.216 2.663 0.000171776 SPO11
ENSOARG00000014193 -1.193 5.897 0.000172997 PIGP
ENSOARG00000015394 0.979 6.624 0.000173347 P4HA2
ENSOARG00000009728 0.941 4.820 0.00017535 PTN
ENSOARG00000020177 0.999 5.727 0.000175008 PDIA5
ENSOARG00000009869 -1.187 6.012 0.000184919 LRRC69
ENSOARG00000010650 1.027 7.118 0.000186296 ENSOARG00000012393 1.052 4.136 0.000185728 GNAQ
ENSOARG00000014651 1.298 3.699 0.000183545 MOB3B
ENSOARG00000019175 -1.137 8.690 0.000185027 PVRL3
ENSOARG00000008974 1.498 4.440 0.000188108 ADAM11
ENSOARG00000011972 -1.098 7.958 0.000189051 ENSOARG00000007525 1.269 5.066 0.000192267 AXL
ENSOARG00000011147 1.354 3.347 0.000192633 DDR1
ENSOARG00000019106 1.408 2.910 0.000192445 RBCK1
ENSOARG00000021089 -1.205 7.678 0.000194559 DLGAP5
ENSOARG00000004403 0.947 5.940 0.000196968 ARID5B
ENSOARG00000015689 -1.365 4.491 0.000197176 PARPBP
ENSOARG00000008398 1.149 8.139 0.00020082 FAT1
ENSOARG00000013347 1.013 5.691 0.000201076 CHGA
ENSOARG00000018452 0.945 4.927 0.000200284 GRAMD3
ENSOARG00000001823 1.045 3.366 0.00020703 TNNT1
ENSOARG00000004522 1.427 4.344 0.000206231 AFF1
ENSOARG00000005208 1.343 7.468 0.000204047 FLNA
ENSOARG00000011189 -1.279 6.843 0.000206057 NUF2
ENSOARG00000012588 -1.217 5.510 0.000206448 C9orf41
ENSOARG00000017976 1.822 3.970 0.000203374 ATP2A3
ENSOARG00000020900 -1.407 3.698 0.000206825 C15orf65

Appendices
206
ENSOARG00000009896 -1.184 5.093 0.000208403 GTF3C6
ENSOARG00000004632 1.497 6.310 0.000212338 IGF2R
ENSOARG00000006836 -1.173 6.587 0.000213468 DPY19L4
ENSOARG00000003333 1.100 3.339 0.000219235 ZBTB7B
ENSOARG00000008975 1.164 7.622 0.000219048 MYH11
ENSOARG00000010884 0.926 4.512 0.000219358 RBMX
ENSOARG00000016774 1.425 3.174 0.000216903 SLC44A2
ENSOARG00000019706 1.201 4.273 0.000218847 NDRG2
ENSOARG00000010755 -1.163 4.902 0.000222525 CYP39A1
ENSOARG00000011687 1.060 4.056 0.000223293 GAMT
ENSOARG00000012252 1.453 2.730 0.000223129 CNNM1
ENSOARG00000018356 -1.161 7.784 0.000221725 SLCO6A1
ENSOARG00000018437 -1.108 6.221 0.000225462 GIN1
ENSOARG00000017897 1.451 3.727 0.000227884 PFKFB4
ENSOARG00000018405 0.855 7.533 0.000227656 PAM
ENSOARG00000025176 -1.153 9.520 0.00022672 ENSOARG00000017505 -1.188 7.759 0.000229878 SUGCT
ENSOARG00000017940 1.300 3.174 0.000229896 SRC
ENSOARG00000010379 -2.329 4.743 0.000230835 NRG3
ENSOARG00000011104 -1.223 2.844 0.000232297 ENSOARG00000015228 1.559 3.632 0.000232195 GATA4
ENSOARG00000008626 1.246 3.333 0.000233088 PRRG3
ENSOARG00000006832 1.505 4.692 0.000235829 PRRC2B
ENSOARG00000017220 -1.586 3.914 0.000235986 IL13RA2
ENSOARG00000002232 -1.279 7.420 0.000239356 CCDC79
ENSOARG00000005218 -1.018 7.867 0.000239032 EPCAM
ENSOARG00000012214 -1.401 7.043 0.000240107 LRRIQ3
ENSOARG00000014621 -1.356 5.358 0.000237827 CLCA2
ENSOARG00000013326 -1.232 8.114 0.000242064 DNAJB4
ENSOARG00000012148 -1.063 6.387 0.000246444 MANEA
ENSOARG00000017409 0.992 3.754 0.000245256 ENSOARG00000017596 -1.413 9.414 0.000245943 ENSOARG00000004237 1.546 4.944 0.00024856 G6PD
ENSOARG00000020321 -1.084 7.043 0.000250784
ENSOARG00000017040 0.886 5.188 0.000252045 FAM47E-STBD1
ENSOARG00000003563 -1.475 3.239 0.000253518 ENSOARG00000016498 1.647 3.877 0.000254289 SLC27A1
ENSOARG00000007151 -1.139 6.986 0.000257509 TTK
ENSOARG00000005495 -1.161 7.192 0.000261563 UQCRB
ENSOARG00000011948 -1.336 4.426 0.00026389 TPRKB
ENSOARG00000009905 1.016 2.890 0.000268328 MBOAT1
ENSOARG00000007201 1.175 4.463 0.00027162 SLC6A8
ENSOARG00000001243 1.194 4.273 0.000282372 RAB31
ENSOARG00000008915 -1.063 7.604 0.000278244 HNRNPLL
ENSOARG00000014317 1.537 3.974 0.000280211 ST5
ENSOARG00000014697 -1.557 7.315 0.000280373 GPR160
ENSOARG00000015665 -1.032 4.464 0.000281559 MAD2L1
Appendices
207
ENSOARG00000016966 0.920 4.934 0.000280145 NONO
ENSOARG00000018632 1.404 4.418 0.000281842 ENSOARG00000020442 1.374 6.431 0.000277343 NOTCH2
ENSOARG00000020613 -0.990 8.612 0.000277651 KLHDC2
ENSOARG00000009014 -1.135 4.579 0.000283372 KPNA5
ENSOARG00000017791 1.585 3.397 0.000286844 FGD5
ENSOARG00000018306 1.165 4.425 0.000286876 ARHGAP17
ENSOARG00000011475 -1.262 5.970 0.000289817 CNBD1
ENSOARG00000004439 -1.451 5.394 0.000294342 C1orf185
ENSOARG00000016505 0.883 6.336 0.000293781 CPT1A
ENSOARG00000017896 -1.066 5.712 0.000292722 FAM228A
ENSOARG00000006855 1.659 3.468 0.000295866 KCNA4
ENSOARG00000017914 -1.433 3.170 0.000296986 MCMDC2
ENSOARG00000015129 0.918 4.074 0.000297971 ENSOARG00000008240 -1.088 7.305 0.000303165 NME8
ENSOARG00000012389 1.311 3.554 0.00030452 GPRC5B
ENSOARG00000008891 0.938 4.518 0.000307965 NTRK2
ENSOARG00000009732 0.881 5.484 0.000308074 FYN
ENSOARG00000011801 -1.003 5.818 0.000312967 C3orf14
ENSOARG00000013006 1.310 3.042 0.000313233 MAPK13
ENSOARG00000011021 1.308 4.811 0.000315893 HEPACAM
ENSOARG00000015548 -1.323 3.574 0.000317092 ENSOARG00000003299 1.065 3.628 0.000318047 PEPT1
ENSOARG00000003730 1.258 4.244 0.000326935 STK10
ENSOARG00000012075 1.064 3.709 0.000324216 CDON
ENSOARG00000015194 1.031 3.062 0.000326203 CRYAB
ENSOARG00000015259 1.220 5.365 0.000326408 MAP7D2
ENSOARG00000019000 -1.092 7.862 0.000323046 RBM44
ENSOARG00000019413 1.545 3.204 0.000327396 FAM84A
ENSOARG00000004477 -1.062 6.631 0.000330518 EED
ENSOARG00000006623 -1.358 6.394 0.000332974 C9orf84
ENSOARG00000016690 -1.081 5.617 0.000333108 MEIOB
ENSOARG00000007102 1.063 6.181 0.000334622 PHF8
ENSOARG00000009294 1.002 6.244 0.000335072 MAGED1
ENSOARG00000018981 -1.030 7.606 0.000336923 GPSM2
ENSOARG00000010373 1.456 2.259 0.000339225 MICAL1
ENSOARG00000016324 -1.478 3.762 0.000339188 TEX12
ENSOARG00000000208 1.023 6.692 0.000342549 CLDN11
ENSOARG00000002758 -1.371 6.619 0.000350942 CLHC1
ENSOARG00000003669 1.429 4.735 0.000352999 ZFHX3
ENSOARG00000005598 -1.338 4.856 0.000349404 ENSOARG00000011004 -1.408 7.342 0.00035059 C1orf141
ENSOARG00000013771 0.941 3.568 0.000347122 L3MBTL3
ENSOARG00000013791 1.303 2.941 0.000354714 CPNE5
ENSOARG00000015356 1.420 2.930 0.000351819 ELF4
ENSOARG00000015569 1.267 3.478 0.000352426 PALLD
ENSOARG00000016755 -1.109 10.452 0.000354512
Appendices
208
ENSOARG00000016832 -1.027 7.775 0.000353036 ATP6V1C1
ENSOARG00000009812 1.386 3.766 0.000360691 FREM2
ENSOARG00000012437 1.055 4.462 0.00036029 DHDH
ENSOARG00000023607 1.470 3.711 0.000360986 SNORA71
ENSOARG00000008120 1.062 3.697 0.000363472 FBXL19
ENSOARG00000014078 -1.406 2.900 0.000363484 FAM177B
ENSOARG00000006066 0.995 4.010 0.000367191 JAKMIP1
ENSOARG00000016387 -1.037 6.756 0.000367767 SLC25A32
ENSOARG00000020283 -1.221 7.363 0.000368343 C2orf74
ENSOARG00000009376 0.958 3.906 0.000371015 USF1
ENSOARG00000020518 1.009 4.467 0.000370054 GGCX
ENSOARG00000019557 1.070 3.440 0.000374366 CTDSP1
ENSOARG00000014849 1.070 4.469 0.000375441 NEDD9
ENSOARG00000020662 -1.188 9.262 0.000377348 DCUN1D1
ENSOARG00000007689 -1.120 7.035 0.000379853 SLC38A9
ENSOARG00000018420 -1.122 4.909 0.000380916 ENSOARG00000004976 1.071 2.443 0.000384205 RPL10
ENSOARG00000007780 -1.223 9.702 0.000383749 CABS1
ENSOARG00000001511 0.965 4.894 0.000385534 STAT3
ENSOARG00000002365 1.380 5.096 0.000394223 USP22
ENSOARG00000012185 1.075 2.976 0.000392855 RCSD1
ENSOARG00000017962 1.474 6.838 0.000394493 MYO9B
ENSOARG00000005335 1.039 5.400 0.000397679 PGD
ENSOARG00000019547 -1.063 6.927 0.000397233 SPDYA
ENSOARG00000000633 -1.186 7.484 0.00040242 IQUB
ENSOARG00000007924 1.037 3.692 0.000401602 PDLIM3
ENSOARG00000014575 -1.170 7.857 0.00040117 ENSOARG00000016794 0.992 5.889 0.000402216 ZMYM3
ENSOARG00000009363 -1.088 5.932 0.000414072 GLRX2
ENSOARG00000012405 0.912 5.754 0.000416247 MBNL3
ENSOARG00000007105 -1.000 6.231 0.000420308 PSMA8
ENSOARG00000008571 -1.056 9.013 0.000420036 CCT6B
ENSOARG00000016868 1.147 2.850 0.000420438 NYAP1
ENSOARG00000020695 -1.044 6.803 0.000419971 TMX1
ENSOARG00000001836 1.179 3.427 0.000424361 PTRF
ENSOARG00000003898 1.203 4.596 0.000423459 SH3PXD2B
ENSOARG00000004649 1.151 2.708 0.000426503 RND2
ENSOARG00000013461 1.516 2.524 0.000428986 ITPK1
ENSOARG00000014181 -1.175 8.647 0.000428113 HAUS6
ENSOARG00000020362 1.028 4.308 0.000427476 CTNNA2
ENSOARG00000020525 0.920 6.588 0.000431875 COL4A3
ENSOARG00000009341 1.414 3.644 0.000435501 DKK3
ENSOARG00000018234 -1.033 5.983 0.000436895 ENSOARG00000008164 1.420 3.320 0.000438443 GRN
ENSOARG00000003046 -1.176 8.346 0.000446701 TFAM
ENSOARG00000003190 1.254 3.553 0.000447001 STK24
ENSOARG00000012723 -1.236 6.485 0.000446401 MSH4

Appendices
209
ENSOARG00000013258 1.133 5.854 0.000446144 TBC1D8
ENSOARG00000020761 1.143 5.708 0.000443736 TNIK
ENSOARG00000000690 -1.139 6.529 0.00044936 LRRC34
ENSOARG00000015354 1.549 4.096 0.000449566 ENSOARG00000014792 -1.024 4.727 0.000450947 FAM151B
ENSOARG00000018224 0.825 5.862 0.000454145 TAB3
ENSOARG00000010789 0.989 4.732 0.000455896 BTBD3
ENSOARG00000011822 0.785 6.693 0.000462195 PTPRG
ENSOARG00000014053 -1.032 9.603 0.000461999 BTBD1
ENSOARG00000019695 -1.011 8.179 0.000463397 ST7L
ENSOARG00000007585 1.354 3.494 0.000464795 TANC1
ENSOARG00000021127 -1.715 4.716 0.000469452 C14orf39
ENSOARG00000004652 1.011 3.861 0.000471841 ZNF792
ENSOARG00000006907 0.825 6.270 0.000471722 CDH2
ENSOARG00000008688 -1.149 8.927 0.000476834 C17orf104
ENSOARG00000005784 -1.214 9.088 0.000482029 BCAP29
ENSOARG00000006610 1.119 3.258 0.000481456 BCAR1
ENSOARG00000016442 1.145 4.625 0.00048405 USP31
ENSOARG00000003065 0.992 5.236 0.000489805 MTHFD1L
ENSOARG00000003694 -0.979 7.800 0.000489309 FNTA
ENSOARG00000005960 1.083 4.419 0.000486669 ACTR3B
ENSOARG00000008600 -1.074 8.011 0.000490451 PAIP1
ENSOARG00000015497 -1.009 5.899 0.00048922 CDKL2
ENSOARG00000002801 1.271 3.819 0.000492125 SLC4A2
ENSOARG00000014542 -1.171 6.196 0.000494353 TSPAN8
ENSOARG00000014663 -1.217 8.210 0.000495279 TBC1D15
ENSOARG00000020213 0.842 7.646 0.000493522 ATP1A1
ENSOARG00000020368 -1.500 5.307 0.000497619 YEATS4
ENSOARG00000001746 -1.225 9.783 0.000499922 CCDC54
ENSOARG00000021604 1.140 3.159 0.000503968 NEAT1_1
ENSOARG00000007794 -1.043 6.491 0.000509463 WDR64
ENSOARG00000020678 -1.201 7.796 0.000508685 CCDC39
ENSOARG00000003451 1.303 3.487 0.000513197 SLC20A2
ENSOARG00000002207 0.948 3.795 0.00051929 CLTB
ENSOARG00000008614 1.392 2.458 0.000520598 PHLDB3
ENSOARG00000013141 -1.006 9.329 0.000529751 MS4A13
ENSOARG00000000549 1.134 5.380 0.000531858 PTPRM
ENSOARG00000010792 -1.200 7.326 0.000537257 WDR78
ENSOARG00000011328 0.815 7.204 0.000538364 VIM
ENSOARG00000008503 -1.126 7.454 0.00054406 C7orf62
ENSOARG00000012262 0.912 4.887 0.000546613 GPC4
ENSOARG00000016151 1.687 3.846 0.000543384 CLUH
ENSOARG00000016654 -1.409 5.590 0.000545301 LYRM7
ENSOARG00000020344 -1.099 4.298 0.000545785 ENSOARG00000016983 -1.131 4.489 0.000550181 ENSOARG00000019852 -1.052 6.533 0.000550759 ASUN
ENSOARG00000020226 0.882 5.237 0.000551214 BAHD1

Appendices
210
ENSOARG00000005076 -0.998 6.915 0.00055393 DNA2
ENSOARG00000010804 -0.956 4.532 0.000557394 ENSOARG00000016483 1.134 2.851 0.000556254 MAPK15
ENSOARG00000004016 -1.050 7.171 0.000567665 NCAPG
ENSOARG00000007346 -1.204 8.237 0.000567542 CEP70
ENSOARG00000010741 1.072 5.455 0.000568862 FOXO3
ENSOARG00000012717 -1.062 11.526 0.000568582 CLGN
ENSOARG00000013376 1.230 3.849 0.000565079 ARHGAP32
ENSOARG00000013909 -0.938 6.774 0.000569088 BBS7
ENSOARG00000015455 -1.238 8.257 0.000563237 C12orf50
ENSOARG00000015546 -1.248 5.956 0.00056273 PKD2L2
ENSOARG00000015691 -1.101 8.548 0.000571691 PLK4
ENSOARG00000018034 1.566 3.727 0.000573268 ZYX
ENSOARG00000004567 -1.073 8.153 0.000577475 ENSOARG00000009866 0.933 5.367 0.000580839 TBL1Y
ENSOARG00000006172 -0.952 5.608 0.000582983 ENSOARG00000016899 1.427 2.772 0.000590223 TMEM132C
ENSOARG00000020185 1.003 3.630 0.000590941 DES
ENSOARG00000009951 -1.180 4.807 0.000595275 ENSOARG00000015422 0.779 5.468 0.000596829 AIFM1
ENSOARG00000017471 -1.156 5.650 0.00059989 PFDN1
ENSOARG00000020935 1.173 2.964 0.000598987 SEMA6C
ENSOARG00000005146 -1.041 5.000 0.000601842 COX20
ENSOARG00000004110 -1.046 6.475 0.000603987 LACTB2
ENSOARG00000006167 -0.844 8.115 0.000610977 HORMAD2
ENSOARG00000011736 -0.998 6.125 0.000611675 FAM8A1
ENSOARG00000021074 -1.068 5.931 0.000610642 CGRRF1
ENSOARG00000014750 -1.051 6.026 0.000613847 STK17B
ENSOARG00000019623 -1.096 7.009 0.000621022 ERGIC2
ENSOARG00000012535 1.338 5.143 0.000624262 TNS3
ENSOARG00000004252 1.059 3.451 0.000625623 ILVBL
ENSOARG00000002149 1.192 6.650 0.00063626 SND1
ENSOARG00000002579 -0.948 5.394 0.000627989 C10orf67
ENSOARG00000005305 0.869 4.619 0.000634963 ENSOARG00000008400 -1.103 4.573 0.000629312 C9orf57
ENSOARG00000017133 -0.978 7.488 0.00063141 PCNA
ENSOARG00000017240 0.979 4.492 0.000633262 HECW1
ENSOARG00000017989 -1.498 2.513 0.000633432 ENSOARG00000019404 1.484 4.382 0.000635088 FBLN1
ENSOARG00000014794 -1.056 4.846 0.000637598 CLCA4
ENSOARG00000007141 1.093 3.446 0.000639129 PLTP
ENSOARG00000006124 -1.190 7.846 0.000641403 RNF138
ENSOARG00000015794 -1.177 5.089 0.000642278 NME5
ENSOARG00000016739 1.032 4.554 0.000645637 ENSOARG00000004758 1.265 3.619 0.00064804 ENC1
ENSOARG00000008868 -1.082 4.259 0.000648225 FBXO4
ENSOARG00000012182 1.198 4.091 0.000651558 STX3

Appendices
211
ENSOARG00000001499 1.094 3.766 0.000661578 ADCK3
ENSOARG00000007299 -1.163 7.602 0.000661053 PPP2R3C
ENSOARG00000008789 1.321 2.765 0.000661218 PC
ENSOARG00000011007 -1.085 5.142 0.000663891 PLA2G7
ENSOARG00000016938 -1.225 4.918 0.000663031 CXorf58
ENSOARG00000001434 1.267 2.838 0.000671695 KCNH2
ENSOARG00000007742 1.205 2.515 0.0006717 ENSOARG00000015272 -1.087 6.683 0.000669451 RCHY1
ENSOARG00000016675 -1.307 11.587 0.000669305 FSIP2
ENSOARG00000021107 0.767 8.293 0.000667528 C14orf37
ENSOARG00000012994 -0.987 7.243 0.000676163 CRYZL1
ENSOARG00000014872 -0.900 6.605 0.000677943 ENSOARG00000002674 1.229 2.918 0.000680838 SHE
ENSOARG00000001057 1.595 2.406 0.000689208 TMEM43
ENSOARG00000001763 -1.119 6.595 0.000683097 HAT1
ENSOARG00000004389 -0.918 6.457 0.000685221 SYPL1
ENSOARG00000010186 -1.052 7.080 0.00068701 C8orf88
ENSOARG00000015325 -1.062 8.442 0.000688837 CEP44
ENSOARG00000019253 1.320 3.781 0.000685448 CARD10
ENSOARG00000016730 -0.933 8.479 0.000692842 HCFC2
ENSOARG00000017686 -1.061 5.804 0.000695871 YAE1D1
ENSOARG00000007344 1.021 7.709 0.000700242 ABCA1
ENSOARG00000012515 1.036 4.747 0.00070011 PCSK5
ENSOARG00000018066 1.314 4.223 0.000698615 QSOX1
ENSOARG00000001290 -0.973 7.028 0.000701628 PEX13
ENSOARG00000006514 1.321 3.885 0.000709736 FRMD4A
ENSOARG00000013552 1.191 5.252 0.000708756 INPP4A
ENSOARG00000020882 -1.243 7.202 0.000708492 TEX9
ENSOARG00000008188 1.013 5.302 0.000711156 ANXA6
ENSOARG00000012940 -1.103 8.095 0.000713403 CISD1
ENSOARG00000008801 -1.661 5.610 0.000716127 CCDC152
ENSOARG00000009522 1.384 5.823 0.000718917 ABCC1
ENSOARG00000016926 -1.023 7.830 0.000719937 FAM216A
ENSOARG00000005949 0.915 4.834 0.000724973 TMC6
ENSOARG00000007862 -1.394 10.312 0.0007257 CCDC110
ENSOARG00000020583 1.000 3.665 0.000725565 ST3GAL5
ENSOARG00000019142 -1.164 9.529 0.000729302 SHCBP1L
ENSOARG00000008430 -1.264 4.816 0.0007369 AMICA1
ENSOARG00000009370 0.927 5.447 0.000737097 PVRL2
ENSOARG00000012070 -1.139 7.743 0.000734793 C7orf63
ENSOARG00000008658 -0.938 4.850 0.00074263 SPRYD7
ENSOARG00000017669 -1.273 4.785 0.000743289 LRRD1
ENSOARG00000000942 0.995 8.831 0.000744692 RNF213
ENSOARG00000011666 -1.050 8.598 0.000750634 KIFAP3
ENSOARG00000006099 -1.195 4.700 0.000758112 ENSOARG00000007270 1.421 3.579 0.000756625 LAMC3
ENSOARG00000010624 -1.194 6.436 0.000759529 CEP57L1

Appendices
212
ENSOARG00000010632 1.068 3.599 0.000759173 TET2
ENSOARG00000021073 -0.933 4.937 0.000760347 GMFB
ENSOARG00000024133 1.039 4.218 0.000756039 NEAT1_2
ENSOARG00000007534 -0.955 6.839 0.0007693 LACC1
ENSOARG00000019457 -1.066 5.411 0.000769297 SLC38A4
ENSOARG00000000192 -0.940 7.831 0.000777836 ENSOARG00000000998 0.895 4.670 0.000774108 DHX35
ENSOARG00000002860 1.456 3.136 0.000778957 FHOD1
ENSOARG00000005088 -1.102 5.918 0.000783876 TCTE3
ENSOARG00000007003 -1.121 5.860 0.00077722 ENSOARG00000009880 0.776 5.114 0.000780996 ZEB2
ENSOARG00000017031 -1.469 5.317 0.000784702 ENSOARG00000020743 -1.145 4.421 0.000779413 KIAA0101
ENSOARG00000021031 -1.025 7.060 0.000783073 ENSOARG00000017507 -1.004 3.631 0.000787078 TMPRSS12
ENSOARG00000000982 1.228 2.593 0.000789566 TMEM180
ENSOARG00000001964 1.533 2.791 0.000794594 NUP210
ENSOARG00000014790 1.073 9.512 0.000802437 ENSOARG00000017475 -1.168 3.322 0.00080162 INHBA
ENSOARG00000021140 -1.268 4.293 0.000809897 ENSOARG00000000983 -1.109 4.467 0.00081413 WDR89
ENSOARG00000010850 -1.085 7.411 0.000813033 ENSOARG00000007824 -1.045 3.842 0.000821154 HINT3
ENSOARG00000016617 1.356 5.457 0.000822558 TRANK1
ENSOARG00000017203 -1.146 9.808 0.000825924 ALS2CR11
ENSOARG00000017552 1.340 4.596 0.000828608 DSP
ENSOARG00000019032 -1.192 3.236 0.000831928 ENSOARG00000019651 -0.992 9.784 0.000833244 DDX20
ENSOARG00000015150 -1.105 7.800 0.000837421 PDZD9
ENSOARG00000018674 -1.073 4.921 0.000840034 ENSOARG00000004832 0.931 3.115 0.000842957 PI3
ENSOARG00000016349 -0.992 8.755 0.000844416 ANKAR
ENSOARG00000015013 -1.154 4.964 0.000851686 ENSOARG00000000210 -1.075 7.566 0.000869921 ENSOARG00000007085 -0.947 7.601 0.000868565 HSPA14
ENSOARG00000010078 -1.148 6.550 0.000867376 C1orf227
ENSOARG00000021123 -1.067 6.822 0.000875977 LRRC9
ENSOARG00000002770 -1.136 4.586 0.000881461 MRPS18C
ENSOARG00000019733 1.149 5.248 0.000880069 MOV10
ENSOARG00000009965 -0.936 4.041 0.000889332 NR1I3
ENSOARG00000002951 0.989 2.750 0.000896066 CFB
ENSOARG00000011267 -0.941 5.735 0.00089471 CSMD3
ENSOARG00000013713 1.275 2.459 0.000891802 SEMA4C
ENSOARG00000019660 -1.109 6.636 0.000897245 CCDC91
ENSOARG00000020541 0.987 2.707 0.000896095 TMEM150A
ENSOARG00000000116 -1.040 9.373 0.000908816 ADAD1
ENSOARG00000005546 -1.089 4.909 0.000905947

Appendices
213
ENSOARG00000007900 -0.999 8.473 0.000908964 LRRC63
ENSOARG00000013671 0.978 3.270 0.000908791 GADD45B
ENSOARG00000018503 1.236 4.625 0.000911397 SIN3B
ENSOARG00000013260 1.119 2.655 0.000918989 PRR12
ENSOARG00000012433 -1.073 9.754 0.000921216 VPS13A
ENSOARG00000018567 -1.115 8.769 0.000925864 SPESP1
ENSOARG00000000388 -1.230 3.995 0.000936621 ENSOARG00000010733 1.027 5.641 0.000937598 MAGI1
ENSOARG00000011396 -1.012 5.440 0.000928349 THOC7
ENSOARG00000016313 -0.991 5.109 0.000938538 ORMDL1
ENSOARG00000018323 -0.961 7.980 0.000937677 DCUN1D4
ENSOARG00000018851 0.848 4.330 0.000936371 MORC4
ENSOARG00000019298 1.015 2.605 0.000929616 CD200
ENSOARG00000019757 -1.012 7.754 0.000931113 SMCO2
ENSOARG00000010385 -0.968 6.227 0.000941784 ENSOARG00000011327 1.265 3.085 0.000941869 GSE1
ENSOARG00000017530 -1.041 5.403 0.0009457 GNPNAT1
ENSOARG00000015713 -1.212 8.148 0.000956176 IFT81
ENSOARG00000014641 -0.986 9.599 0.000963157 RNF17
ENSOARG00000003329 1.009 5.336 0.000966482 SULF1
ENSOARG00000019955 1.166 2.794 0.000965237 ANKZF1
ENSOARG00000011114 1.038 3.010 0.000969456 VGLL1
ENSOARG00000009943 0.966 3.195 0.00097529 CD3EAP
ENSOARG00000004381 0.899 2.885 0.00097705 TMEM26
ENSOARG00000001546 1.006 4.333 0.000980432 NAA10
ENSOARG00000001591 1.009 4.062 0.000980535 FUCA2
ENSOARG00000000939 0.804 5.270 0.001007963 MAVS
ENSOARG00000002395 0.911 3.618 0.001008187 SLC14A1
ENSOARG00000004512 0.937 5.251 0.001021418 MRO
ENSOARG00000004546 -1.045 4.716 0.00101449 SERP1
ENSOARG00000005041 1.488 2.588 0.001016917 ZNF333
ENSOARG00000005329 -0.891 4.069 0.001013331 ZNF566
ENSOARG00000012370 -1.448 3.302 0.001016527 FMO6P
ENSOARG00000013628 -1.052 2.957 0.001021189 IL33
ENSOARG00000014782 -0.967 4.293 0.00102103 GLIPR1L2
ENSOARG00000016351 0.983 3.155 0.001012707 PGLS
ENSOARG00000016646 -0.902 8.472 0.001016241 PDHA2
ENSOARG00000018458 1.202 3.594 0.001010226 STX6
ENSOARG00000019334 1.095 3.454 0.001023878 EPS8L3
ENSOARG00000002377 -1.007 7.353 0.001032828 UGGT2
ENSOARG00000007434 -0.957 6.931 0.001032875 SUV39H2
ENSOARG00000016898 -0.934 6.950 0.001029731 SLC41A2
ENSOARG00000000924 -0.916 6.280 0.00103708 ENSOARG00000002298 -1.071 7.339 0.001039574 NAE1
ENSOARG00000016126 -1.239 4.924 0.001043297 MSMO1
ENSOARG00000019437 -1.048 7.491 0.001042771 ZMYM1
ENSOARG00000015812 -1.190 6.488 0.001045917 HFM1

Appendices
214
ENSOARG00000015078 1.175 3.393 0.001052606 IRF1
ENSOARG00000015328 0.881 4.972 0.001050001 MTA2
ENSOARG00000018990 1.164 3.208 0.001052425 RAMP1
ENSOARG00000005437 -1.315 5.703 0.001056968 ENSOARG00000008882 1.005 3.421 0.001059857 TNKS1BP1
ENSOARG00000014910 0.900 4.472 0.001070984 ELP3
ENSOARG00000001692 -1.031 9.693 0.001077755 RGS22
ENSOARG00000003935 1.300 2.554 0.001078472 FAM198A
ENSOARG00000006012 1.315 3.337 0.001084731 FOXO1
ENSOARG00000006957 0.969 8.330 0.001082059 PSAP
ENSOARG00000008575 -1.028 5.414 0.001083279 TRAPPC6B
ENSOARG00000010651 0.820 5.129 0.001074286 RAB5B
ENSOARG00000012831 0.972 3.895 0.001082066 LRRC14
ENSOARG00000019416 0.944 3.252 0.001080892 METTL20
ENSOARG00000008983 -1.223 2.934 0.001095569 ZNF404
ENSOARG00000010853 -0.881 6.169 0.001092921 MEMO1
ENSOARG00000012418 -0.903 6.457 0.001094501 GDPD1
ENSOARG00000020514 -1.168 8.197 0.001092775 PLCZ1
ENSOARG00000000434 -1.047 4.390 0.001107913 ENSOARG00000004706 1.301 2.282 0.001111892 FLOT2
ENSOARG00000009218 -0.991 8.068 0.001112925 ADAM29
ENSOARG00000013116 1.201 2.879 0.001109873 CA3
ENSOARG00000020182 -0.874 5.644 0.001114822 SEC22A
ENSOARG00000004736 1.062 4.167 0.001120496 LSR
ENSOARG00000014122 -0.992 6.837 0.001119696 C11orf88
ENSOARG00000001889 -1.474 7.355 0.0011243 PDCL2
ENSOARG00000018982 1.286 5.528 0.001123563 SLC52A3
ENSOARG00000020540 -1.030 5.176 0.001129939 HAUS2
ENSOARG00000016821 -1.187 4.624 0.001132699 ENSOARG00000007073 -0.983 6.102 0.001137746 ERCC8
ENSOARG00000009823 -0.989 5.861 0.001137278 ORC4
ENSOARG00000007712 1.146 5.507 0.00115164 ENSOARG00000012527 0.971 4.191 0.001150422 SFT2D2
ENSOARG00000020045 1.242 3.947 0.001148374 KIAA0754
ENSOARG00000010873 -0.900 5.939 0.001155408 DDX43
ENSOARG00000011789 0.777 6.540 0.001159057 PRDX6
ENSOARG00000012419 -1.279 4.378 0.001158444 C2orf76
ENSOARG00000013465 1.431 2.853 0.001156172 CAPN1
ENSOARG00000021115 -1.260 5.557 0.00116016 ENSOARG00000010415 1.242 4.188 0.001161862 WWC3
ENSOARG00000001527 -0.995 6.586 0.001179074 POT1
ENSOARG00000003020 -1.014 6.380 0.00117456 ENSOARG00000004650 -1.106 5.297 0.001192249 SCOC
ENSOARG00000005375 1.051 3.677 0.001183821 FGFR2
ENSOARG00000006006 1.433 4.862 0.001185951 MYO18A
ENSOARG00000008827 1.113 5.376 0.001173939 NCSTN
ENSOARG00000010180 1.393 5.980 0.001169916 ITPR3

Appendices
215
ENSOARG00000010204 -0.995 4.710 0.001188816 TMEM225
ENSOARG00000010803 -1.170 7.051 0.0011911 NBN
ENSOARG00000012529 -0.827 6.664 0.001193105 CENPL
ENSOARG00000013189 0.886 3.534 0.001188974 TXLNG
ENSOARG00000015147 0.986 2.570 0.001193636 ENSOARG00000016384 0.890 4.015 0.001167996 CDK14
ENSOARG00000017186 -0.868 7.467 0.001169355 PAPD5
ENSOARG00000017452 -0.942 5.947 0.001184882 MTX2
ENSOARG00000017656 1.213 2.937 0.001180334 TAF6
ENSOARG00000017905 -0.943 7.216 0.001170108 ENSOARG00000019402 -0.952 6.398 0.001186555 AMN1
ENSOARG00000004154 1.071 5.401 0.001197759 PEX5
ENSOARG00000009438 1.034 5.562 0.001200644 APOE
ENSOARG00000012065 -0.834 8.509 0.001206037 TCFL5
ENSOARG00000017034 -0.893 8.686 0.001203753 STK17A
ENSOARG00000017759 0.888 3.957 0.001204763 PAK3
ENSOARG00000020000 -1.123 5.281 0.001206053 C12orf40
ENSOARG00000020082 -1.365 7.298 0.001207123 SYCP1
ENSOARG00000007312 1.009 3.388 0.001210503 SCPEP1
ENSOARG00000015458 -1.248 9.388 0.001208886 SYCP2
ENSOARG00000017819 -1.054 5.797 0.001214376 ENSOARG00000002608 1.101 2.296 0.001231671 CITED2
ENSOARG00000010868 -0.794 8.004 0.001252612 ENSOARG00000012076 -1.018 4.839 0.001250261 SKA2
ENSOARG00000012406 0.830 4.417 0.00124589 GNA14
ENSOARG00000013865 -1.018 8.677 0.001251026 CDKL3
ENSOARG00000014762 1.353 3.811 0.001251413 AFAP1L2
ENSOARG00000004901 -1.116 4.844 0.001254959 EFCAB2
ENSOARG00000012972 1.241 6.450 0.001260396 MYO10
ENSOARG00000010097 0.879 5.365 0.001271731 CLC5
ENSOARG00000017733 -1.211 9.842 0.001274758 CCDC7
ENSOARG00000018979 -1.019 5.679 0.001274418 ASZ1
ENSOARG00000020827 -0.973 5.745 0.001274302 GTF2A2
ENSOARG00000001405 1.094 2.635 0.001283422 FRMPD2
ENSOARG00000005639 1.086 4.806 0.001283693 PLCB3
ENSOARG00000018479 0.869 5.341 0.001282671 AQP8
ENSOARG00000004834 -1.283 5.411 0.001289339 STARD6
ENSOARG00000016076 -1.158 9.025 0.001288895 BRDT
ENSOARG00000003400 1.234 5.955 0.00129687 RALGAPA2
ENSOARG00000012008 -0.906 7.388 0.001296418 GDE1
ENSOARG00000014853 -0.922 7.486 0.001298202 STK33
ENSOARG00000011941 1.174 2.339 0.001299986 ZO3
ENSOARG00000001491 -1.161 8.271 0.001302067 ZBBX
ENSOARG00000007432 -0.914 5.403 0.001304922 DNAJC15
ENSOARG00000015717 -0.999 5.131 0.001315288 ENSOARG00000008249 -1.315 3.590 0.001317345 ASPN
ENSOARG00000018793 -1.008 8.666 0.001325528 FASTKD2

Appendices
216
ENSOARG00000004103 0.747 8.132 0.001334395 PTPN13
ENSOARG00000021020 -1.344 4.072 0.001334397 CLEC1B
ENSOARG00000020905 -1.032 4.402 0.001343929 PIGB
ENSOARG00000003548 -1.145 6.982 0.001349844 ENKUR
ENSOARG00000011063 -0.970 8.285 0.001348482 STK31
ENSOARG00000015277 -0.982 5.939 0.001348899 ENSOARG00000017832 -1.084 5.445 0.001351272 ENSOARG00000001287 -0.870 5.424 0.001358284 ENSOARG00000007338 -0.984 4.881 0.001359122 C1orf27
ENSOARG00000017227 0.855 6.352 0.001359926 APPL2
ENSOARG00000020462 0.963 2.536 0.001360934 IL1RAP
ENSOARG00000012496 -1.058 7.714 0.001364795 RFK
ENSOARG00000017531 -0.922 7.126 0.001374852 PTBP2
ENSOARG00000017921 -1.129 6.926 0.001373995 SASS6
ENSOARG00000018975 1.187 6.167 0.001373406 KMT2D
ENSOARG00000000230 1.044 3.072 0.001386259 SKI
ENSOARG00000001631 -1.189 7.228 0.001390033 TIGD7
ENSOARG00000003012 0.968 5.296 0.001394541 PLEKHG1
ENSOARG00000003277 -0.852 5.339 0.001408863 MRPS10
ENSOARG00000004510 1.375 3.393 0.001400902 ZNF516
ENSOARG00000004745 0.956 3.184 0.001404197 USF2
ENSOARG00000005268 -1.072 7.579 0.001385375 G2E3
ENSOARG00000006758 -0.957 6.074 0.001403958 SNX6
ENSOARG00000007877 0.764 4.937 0.001407277 C1orf168
ENSOARG00000008619 0.869 7.333 0.001395356 FATE1
ENSOARG00000009391 0.973 5.098 0.001382265 TAPBP
ENSOARG00000012519 -1.110 6.188 0.001403835 TIPRL
ENSOARG00000013279 1.035 6.482 0.001379724 TRIO
ENSOARG00000013563 -1.268 5.836 0.001398882 ACTR6
ENSOARG00000013607 1.264 4.966 0.00140638 MICAL3
ENSOARG00000014124 1.132 2.688 0.001404415 PTPRE
ENSOARG00000018803 0.713 6.041 0.001408631 PGK1
ENSOARG00000020686 0.816 5.683 0.001409196 PYGL
ENSOARG00000015941 -0.965 11.371 0.001412292 HSPA4L
ENSOARG00000002269 1.080 3.831 0.001421399 IRF2BPL
ENSOARG00000007051 -1.113 8.992 0.001420493 KIAA1377
ENSOARG00000010969 0.822 5.227 0.001425585 GPAM
ENSOARG00000008231 -0.793 7.663 0.001428408 PRMT3
ENSOARG00000000493 1.029 4.968 0.001431389 KDM4A
ENSOARG00000003472 0.904 4.336 0.00143756 MARK2
ENSOARG00000002685 0.756 5.106 0.001447128 MBNL2
ENSOARG00000005116 -0.990 7.234 0.0014502 SSMEM1
ENSOARG00000010041 -1.439 3.478 0.001446891 POSTN
ENSOARG00000011685 -1.008 7.581 0.001453583 SLC35F5
ENSOARG00000011927 -1.044 7.762 0.001453118 EFCAB3
ENSOARG00000016176 1.087 4.873 0.001449095 CHD7
ENSOARG00000017013 -0.931 7.463 0.001445245 PAIP2
Appendices
217
ENSOARG00000021149 -1.091 8.840 0.001444648 ENSOARG00000001249 1.205 3.521 0.001466947 SCD5
ENSOARG00000003580 -1.088 6.957 0.001462403 ENSOARG00000006633 0.884 4.164 0.001465959 YIPF1
ENSOARG00000019661 -1.143 6.122 0.001467068 TWF1
ENSOARG00000015201 -0.971 7.073 0.001473286 TAF1B
ENSOARG00000013705 0.722 5.352 0.001483068 VDAC1
ENSOARG00000006841 -1.124 7.662 0.001486859 ENSOARG00000015604 0.908 3.500 0.001491944 SATB1
ENSOARG00000021187 1.172 2.819 0.001492963 KIAA0247
ENSOARG00000017967 1.058 4.459 0.001495515 SMARCD1
ENSOARG00000005976 1.207 4.124 0.001503132 HCFC1
ENSOARG00000000859 1.353 2.885 0.001508424 SLC22A23
ENSOARG00000009090 0.935 3.170 0.001513197 CYP1B1
ENSOARG00000018765 -0.919 7.993 0.001512218 LRRC49
ENSOARG00000016852 0.828 3.739 0.001521453 CFLAR
ENSOARG00000008136 0.825 5.049 0.001523771 SUSD3
ENSOARG00000006826 1.290 4.009 0.001535144 LTBP4
ENSOARG00000016834 0.775 6.973 0.001538063 SSFA2
ENSOARG00000017138 -0.959 8.960 0.001537705 C3orf38
ENSOARG00000009344 -1.229 2.438 0.001544568 FABP4
ENSOARG00000008936 0.929 5.466 0.001549199 KDM5C
ENSOARG00000020586 1.184 4.397 0.001547971 CLCN2
ENSOARG00000003246 1.231 2.661 0.001553875 IKKBETA
ENSOARG00000003263 1.038 4.981 0.001562194 FAM129A
ENSOARG00000021116 -1.376 5.145 0.00156644 ENSOARG00000008330 1.135 4.170 0.001568563 WDR91
ENSOARG00000007445 -0.950 5.829 0.001581484 RAD18
ENSOARG00000008327 -0.943 7.521 0.001582718 TBC1D32
ENSOARG00000011461 -1.041 7.892 0.001579651 SEL1L2
ENSOARG00000012480 1.198 5.360 0.001584794 EP400
ENSOARG00000014814 0.932 5.712 0.001592392 ACTB
ENSOARG00000013164 -0.885 6.575 0.001599883 ENSOARG00000008315 -1.002 7.479 0.001603857 CDKL4
ENSOARG00000013645 1.227 4.246 0.001604153 DAG1
ENSOARG00000009319 0.773 5.247 0.001619341 SLC29A1
ENSOARG00000012294 -1.188 5.835 0.001618719 C11orf65
ENSOARG00000016238 1.217 3.586 0.001616866 MED12
ENSOARG00000000891 -1.012 7.767 0.001631106 NDUFV2
ENSOARG00000006480 -1.027 5.816 0.001629576 ENSOARG00000006820 -1.050 7.745 0.00163146 DYNC2LI1
ENSOARG00000012129 1.635 3.807 0.001628465 SLC7A5
ENSOARG00000016672 1.243 2.580 0.001628468 ATXN7L3B
ENSOARG00000004723 1.187 2.526 0.001641573 CENPB
ENSOARG00000017042 -0.954 4.514 0.001644771 RAD9B
ENSOARG00000017028 -0.928 4.375 0.001649317 DEPDC7
ENSOARG00000001577 -0.833 7.726 0.001654415 FBXO43

Appendices
218
ENSOARG00000008843 -0.864 4.431 0.001663249 GALM
ENSOARG00000007484 -0.844 7.438 0.001668884 WDSUB1
ENSOARG00000019427 1.129 2.601 0.001669507 PPARA
ENSOARG00000000048 0.928 4.962 0.001691678 PIGS
ENSOARG00000002110 -1.035 7.746 0.001693005 IFT80
ENSOARG00000012853 -0.973 6.333 0.001690205 PIGK
ENSOARG00000015258 -1.064 4.416 0.001687451 SYCP3
ENSOARG00000016812 0.760 4.690 0.001683121 AGFG2
ENSOARG00000019804 -1.044 5.162 0.001686111 ENSOARG00000020651 -1.139 3.612 0.001691209 PTPRO
ENSOARG00000012026 0.879 4.706 0.00169551 ABHD11
ENSOARG00000006729 1.198 3.421 0.001700628 TACC2
ENSOARG00000007721 -0.831 5.632 0.001706958 CKS2
ENSOARG00000009491 -1.193 2.212 0.00172802 DTHD1
ENSOARG00000005496 -0.933 6.307 0.00173013 ENSOARG00000020301 1.132 3.909 0.001733227 TNK2
ENSOARG00000009711 -0.837 7.423 0.001743608 CERS3
ENSOARG00000006128 -1.014 4.699 0.001752819 RNF125
ENSOARG00000019619 1.032 4.610 0.00175389 ZBTB20
ENSOARG00000004699 -1.055 8.284 0.001769627 CCDC83
ENSOARG00000005193 0.929 7.577 0.001769852 KMT2C
ENSOARG00000010654 0.941 6.430 0.001766878 CTNND1
ENSOARG00000015796 0.839 6.083 0.001769561 KAT2B
ENSOARG00000018168 1.385 3.180 0.00177587 RREB1
ENSOARG00000016802 -0.900 6.044 0.001788389 PDE1A
ENSOARG00000008016 1.080 3.180 0.001792202 TNIP1
ENSOARG00000014147 -1.005 7.454 0.001799428 ENSOARG00000015196 -1.030 7.142 0.001800193 CHPT1
ENSOARG00000003556 -1.001 6.641 0.00180859 EFCAB10
ENSOARG00000006519 -0.907 7.553 0.001807942 HSDL2
ENSOARG00000007771 1.150 3.483 0.001804442 SEMA4D
ENSOARG00000014195 -1.296 3.439 0.001807955 TMEFF2
ENSOARG00000016346 -0.933 7.605 0.001813984 ENSOARG00000008353 -1.047 3.142 0.001824385 LINC00998
ENSOARG00000019578 0.845 5.219 0.001826998 ANO6
ENSOARG00000008756 1.144 2.392 0.001834446 H6PD
ENSOARG00000004238 -0.953 6.453 0.001839197 GPR87
ENSOARG00000020021 -1.115 8.072 0.001840197 CASC1
ENSOARG00000005420 -0.936 5.764 0.001852957 ZNF420
ENSOARG00000015316 -0.932 9.109 0.00185584 OXR1
ENSOARG00000007283 -0.876 5.894 0.001861144 FSD1L
ENSOARG00000020924 0.998 2.744 0.001861278 WDR72
ENSOARG00000021013 1.183 5.040 0.001862284 CGN
ENSOARG00000020330 -0.765 6.608 0.001876887 EXD1
ENSOARG00000003193 1.137 3.915 0.001882491 C1QTNF1
ENSOARG00000006604 1.076 3.033 0.001889733 FKBP9
ENSOARG00000004660 1.227 4.123 0.001917991 GRAMD1A

Appendices
219
ENSOARG00000013993 -1.111 7.731 0.001911801 LRRCC1
ENSOARG00000014440 -1.234 2.875 0.001917881 VNN1
ENSOARG00000015296 -0.945 7.780 0.001913536 MRPL39
ENSOARG00000019270 -0.884 6.145 0.001915681 SPAG16
ENSOARG00000020260 -0.831 6.658 0.001909008 ZFP69
ENSOARG00000001504 1.315 3.798 0.001922502 SREBF1
ENSOARG00000004909 0.979 2.285 0.001928749 ENSOARG00000002499 -0.946 9.547 0.001941945 MLF1
ENSOARG00000003818 -1.123 5.433 0.001943381 EFCAB9
ENSOARG00000004340 0.701 5.726 0.001941799 FSHR
ENSOARG00000009091 1.261 3.555 0.001937693 SMTN
ENSOARG00000015644 -0.907 8.519 0.001937826 BOLL
ENSOARG00000012684 -1.180 3.059 0.001952632 ENSOARG00000004685 -0.890 4.773 0.00195574 C18orf63
ENSOARG00000015191 0.865 3.881 0.001978205 SHBG
ENSOARG00000011878 1.228 3.260 0.001987867 ILDR2
ENSOARG00000011975 -0.930 6.581 0.001992096 MOB1B
ENSOARG00000003182 1.059 4.314 0.002013145 CD81
ENSOARG00000003593 0.910 4.578 0.002001187 ZNF805
ENSOARG00000005337 -1.024 7.185 0.002006685 VPS26A
ENSOARG00000006692 -0.999 7.806 0.00200119 CLK4
ENSOARG00000006896 -1.075 7.015 0.002004192 TXNDC8
ENSOARG00000014175 1.142 3.108 0.002010543 SLC9A7
ENSOARG00000016063 -0.933 8.369 0.002007984 USP44
ENSOARG00000017631 1.070 3.832 0.002011111 PRKCB
ENSOARG00000009128 -0.969 5.224 0.002024048 C7
ENSOARG00000019611 -0.868 8.118 0.002022352 CLIP4
ENSOARG00000009604 -0.867 5.926 0.002037906 NDC80
ENSOARG00000018769 -0.989 5.086 0.002036194 PIH1D3
ENSOARG00000001265 0.939 2.860 0.002059902 SLC27A3
ENSOARG00000002279 -0.796 8.673 0.002061124 TSPAN6
ENSOARG00000003916 0.994 3.510 0.002055339 SMARCD3
ENSOARG00000006126 -1.113 4.920 0.002056945 FAM46D
ENSOARG00000014908 0.859 4.244 0.002061631 LGR4
ENSOARG00000002545 0.857 4.020 0.00207384 EPB41
ENSOARG00000016737 1.196 4.278 0.002071932 TENC1
ENSOARG00000013264 -1.016 8.318 0.002077749 DBF4
ENSOARG00000015341 -1.245 5.493 0.0020789 TSPAN19
ENSOARG00000003150 0.740 5.098 0.002087052 MPP1
ENSOARG00000011952 -0.881 6.942 0.002082948 CCDC38
ENSOARG00000012955 -0.887 7.726 0.002086014 SPACA1
ENSOARG00000006146 0.904 8.483 0.002093379 ENSOARG00000011482 1.149 3.219 0.002103519 GRHPR
ENSOARG00000011806 -1.029 6.231 0.002095869 ENSOARG00000015571 1.189 2.126 0.002101953 TP53
ENSOARG00000017555 -1.169 3.782 0.002095867 ENSOARG00000019765 1.233 2.470 0.002103978 TEP1

Appendices
220
ENSOARG00000020578 -0.882 7.098 0.002098479 DAW1
ENSOARG00000011838 0.773 4.031 0.002108186 CAP2
ENSOARG00000004160 -0.880 6.026 0.002114312 ENSOARG00000007049 1.361 2.959 0.002125668 ABCD1
ENSOARG00000002721 1.022 3.810 0.002131162 CBX2
ENSOARG00000016547 -1.031 2.498 0.002135489 CALCRL
ENSOARG00000010862 0.788 5.212 0.002139706 ENSOARG00000001199 -0.841 6.599 0.00215355 KIAA1841
ENSOARG00000014022 -0.937 2.868 0.002154545 ENSOARG00000016907 0.952 2.523 0.002151916 UNC5C
ENSOARG00000017950 1.052 6.368 0.002155925 TNRC6A
ENSOARG00000019939 -0.841 5.609 0.00214744 RABL3
ENSOARG00000013845 0.749 5.314 0.002160834 FADS2
ENSOARG00000012454 1.247 3.388 0.002166596 MYO1C
ENSOARG00000004743 1.126 4.501 0.002182022 ATP6AP1
ENSOARG00000008746 -0.798 7.524 0.002202809 SAMD8
ENSOARG00000001979 1.263 2.904 0.002231258 NOS3
ENSOARG00000014489 -0.998 6.203 0.002235542 IZUMO3
ENSOARG00000016013 -0.909 6.094 0.002233861 TMEM161B
ENSOARG00000014785 -0.942 6.678 0.002238759 IDI1
ENSOARG00000004577 1.112 6.404 0.002247565 INPPL1
ENSOARG00000010531 0.779 5.507 0.002251198 KDM1B
ENSOARG00000013446 1.032 3.980 0.002255097 SFMBT2
ENSOARG00000005237 1.034 5.712 0.002263769 SEC61A1
ENSOARG00000007244 1.109 3.579 0.002262083 ACOT11
ENSOARG00000011447 1.101 3.349 0.002275314 FBXO10
ENSOARG00000015614 -0.946 5.211 0.002274118 XRCC4
ENSOARG00000020295 -1.198 3.764 0.002278703 VTCN1
ENSOARG00000008916 -0.905 5.735 0.002286527 TATDN1
ENSOARG00000007213 1.040 5.080 0.002289594 ZNF462
ENSOARG00000013210 -0.832 6.359 0.002292065 SEC11A
ENSOARG00000019441 1.022 2.783 0.002295955 RHOB
ENSOARG00000000135 0.731 4.739 0.002310106 PBX2
ENSOARG00000004845 -1.094 7.248 0.002324709 C18orf54
ENSOARG00000000420 -0.784 6.546 0.002344904 NDFIP2
ENSOARG00000007220 -0.916 8.642 0.002348111 ENSOARG00000006289 -0.919 6.407 0.002365175 PPWD1
ENSOARG00000006700 0.800 3.331 0.002357325 MXRA7
ENSOARG00000009170 -1.088 5.372 0.00236459 RMDN2
ENSOARG00000015847 1.126 3.230 0.002358768 MYL9
ENSOARG00000016915 -0.968 8.346 0.002363666 FAM81B
ENSOARG00000017842 1.235 4.166 0.002360419 RGAG1
ENSOARG00000000594 0.977 3.923 0.002368844 FAM199X
ENSOARG00000016311 -0.998 5.927 0.002371237 ENSOARG00000015400 1.003 2.694 0.002374653 WNT5A
ENSOARG00000006975 -0.997 3.948 0.002379664 CHST9
ENSOARG00000004668 0.843 3.966 0.002383022 PRP

Appendices
221
ENSOARG00000009336 -1.488 3.060 0.002394742 ENSOARG00000018662 -1.217 3.330 0.002395834 ENSOARG00000000754 0.854 3.469 0.002411163 PROSC
ENSOARG00000004967 1.079 2.892 0.002412876 DOK6
ENSOARG00000009476 1.347 4.470 0.002416503 DLG5
ENSOARG00000011417 1.163 5.744 0.002418671 FRMPD1
ENSOARG00000018928 -0.793 6.322 0.002421552 NAPEPLD
ENSOARG00000015814 0.831 3.685 0.002427979 METAP1
ENSOARG00000005806 1.371 2.462 0.002430983 MECP2
ENSOARG00000018255 -1.024 4.954 0.002434011 FAM174A
ENSOARG00000006994 -0.958 5.949 0.002440406 MTRF1
ENSOARG00000013890 -0.875 9.410 0.002438916 ENSOARG00000015718 0.793 4.695 0.002445648 PTPRC
ENSOARG00000003296 0.925 4.184 0.002450839 KLC2
ENSOARG00000019318 -0.921 7.091 0.002455267 ATG3
ENSOARG00000001193 -0.955 8.180 0.002458683 ENSOARG00000014119 0.984 3.905 0.002462216 RARA
ENSOARG00000007666 0.723 5.641 0.002473383 SLC25A4
ENSOARG00000018107 0.715 5.935 0.002481796 CFL1
ENSOARG00000002586 0.834 6.801 0.002491504 APOA1
ENSOARG00000003590 -1.050 7.326 0.002494032 C2orf73
ENSOARG00000014712 0.694 8.241 0.002498021 KIDINS220
ENSOARG00000009433 -0.897 7.645 0.002509788 CNOT7
ENSOARG00000019829 -0.945 7.052 0.002529537 FGFR1OP2
ENSOARG00000005682 -1.119 3.010 0.002533113 ENSOARG00000000869 1.094 4.560 0.002549867 LMTK2
ENSOARG00000016026 -0.903 6.235 0.002552931 ENSOARG00000001771 1.117 4.366 0.002563902 CAMSAP3
ENSOARG00000009584 -0.942 4.912 0.002564186 FMR1NB
ENSOARG00000011353 0.772 3.949 0.00257907 NAGK
ENSOARG00000019590 -1.010 7.284 0.002580919 C2orf88
ENSOARG00000003665 -0.795 10.359 0.002587492 DYNC2H1
ENSOARG00000008706 1.264 3.060 0.002585848 DAPK1
ENSOARG00000015202 -1.077 3.326 0.002602204 ENSOARG00000018238 1.160 3.664 0.002610521 TEF
ENSOARG00000017077 -0.901 7.335 0.00261401 ENSOARG00000019938 0.847 4.015 0.002621681 ZNF132
ENSOARG00000000357 1.195 4.767 0.002638554 NCOR2
ENSOARG00000020314 -0.879 7.778 0.002636603 ENSOARG00000013003 -0.884 6.815 0.002643238 RARS2
ENSOARG00000006529 -1.090 4.757 0.002654071 CIR1
ENSOARG00000009730 -1.153 3.298 0.002663882 CCDC169
ENSOARG00000007655 0.897 2.539 0.002682226 MSS51
ENSOARG00000009472 -0.772 4.643 0.002681733 ENSOARG00000012962 -1.140 7.373 0.002680462 ENSOARG00000007557 1.079 5.265 0.002706522 UBTF
ENSOARG00000002335 0.729 4.603 0.002725946 PKD2

Appendices
222
ENSOARG00000003850 1.254 3.190 0.002724952 FITM2
ENSOARG00000007857 -0.952 9.668 0.002720516 GK2
ENSOARG00000015330 -0.926 5.615 0.002727836 THAP6
ENSOARG00000001078 0.941 2.522 0.002734963 ENSOARG00000007429 -0.953 9.174 0.002741271 PSMA6
ENSOARG00000015211 -0.993 5.804 0.002743979 KIF18A
ENSOARG00000006375 0.833 5.988 0.002752682 FKBP15
ENSOARG00000020455 -0.863 6.171 0.002753538 ENSOARG00000013679 0.995 4.097 0.002756452 URB1
ENSOARG00000001299 -1.044 5.937 0.002766783 PDCD10
ENSOARG00000002903 -0.866 8.509 0.002786486 ENSOARG00000008667 -0.805 6.684 0.002784085 NUS1
ENSOARG00000013343 1.449 3.058 0.00278425 PIEZO1
ENSOARG00000020611 -0.944 4.642 0.002780903 KLHDC1
ENSOARG00000005714 -0.874 7.563 0.00278923 ATF7IP2
ENSOARG00000007238 0.660 5.396 0.002794959 PAK1
ENSOARG00000011138 1.099 4.141 0.002803951 ZDHHC7
ENSOARG00000016108 0.811 3.572 0.002804186 LZTS2
ENSOARG00000003256 0.881 2.902 0.002813803 LCAT
ENSOARG00000014457 0.703 5.412 0.002814188 RPL18A
ENSOARG00000003572 0.777 4.650 0.002825329 RPS6KA5
ENSOARG00000019707 1.108 3.668 0.002828925 ARHGAP31
ENSOARG00000017542 -1.033 5.567 0.002843217 STYX
ENSOARG00000017568 1.161 3.527 0.002847166 SSH1
ENSOARG00000003408 -0.928 6.060 0.002860913 ENSOARG00000008357 -0.843 7.136 0.002869312 STAM2
ENSOARG00000012034 0.982 3.495 0.002871523 FAM107A
ENSOARG00000018000 0.751 5.655 0.002883305 ZKSCAN8
ENSOARG00000021120 -1.196 4.547 0.002880796 CCDC175
ENSOARG00000016889 0.909 3.010 0.002887839 TSC22D4
ENSOARG00000019910 -0.925 6.575 0.002890449 ENSOARG00000015837 -0.833 5.752 0.002893633 C2orf69
ENSOARG00000016635 -1.280 2.946 0.00289883 PPIL3
ENSOARG00000011478 0.788 3.608 0.002905141 STARD3
ENSOARG00000012445 -0.909 6.479 0.002912907 PTP4A1
ENSOARG00000013168 0.894 3.106 0.002912876 IFNGR2
ENSOARG00000016136 1.022 4.467 0.002913066 GIGYF1
ENSOARG00000018344 0.760 4.452 0.002916325 ALDH7A1
ENSOARG00000006033 0.769 3.412 0.002933737 FAM198B
ENSOARG00000013995 0.873 5.556 0.002952063 EPM2AIP1
ENSOARG00000020263 -0.944 8.452 0.002964678 IQCG
ENSOARG00000001357 0.854 3.030 0.002969762 ENSOARG00000016080 -0.940 7.328 0.002984919 ENSOARG00000020247 -1.005 8.274 0.003012898 CASC5
ENSOARG00000004565 -0.984 8.873 0.003017018 USP15
ENSOARG00000016603 1.161 2.900 0.003021738 TAB1
ENSOARG00000017304 -0.966 7.283 0.003019957 SPATA9
Appendices
223
ENSOARG00000007184 0.708 7.232 0.003033037 BCAP31
ENSOARG00000005043 -0.857 6.714 0.003041212 PACRGL
ENSOARG00000013920 1.438 2.611 0.003040067 WDR81
ENSOARG00000006857 1.160 2.603 0.003048033 SVEP1
ENSOARG00000006838 -1.041 7.454 0.003057542 CFL2
ENSOARG00000007710 1.181 3.249 0.003055484 RNF157
ENSOARG00000014789 0.776 4.207 0.003056523 MBOAT2
ENSOARG00000018864 -1.000 3.661 0.00306678 CXorf30
ENSOARG00000004533 -0.824 8.806 0.003079852 UBA2
ENSOARG00000016937 0.847 4.557 0.003080866 F2R
ENSOARG00000008185 -0.935 4.440 0.00308567 PRIM1
ENSOARG00000012304 -0.891 6.235 0.003089436 ANKRD45
ENSOARG00000019607 -0.857 7.323 0.003096752 ENSOARG00000013748 0.847 2.749 0.003102345 HSPB1
ENSOARG00000019897 -1.008 5.352 0.003119777 APLF
ENSOARG00000013963 -0.917 7.808 0.003144136 TTC39B
ENSOARG00000007397 -0.816 7.100 0.003149252 FAR1
ENSOARG00000020524 0.825 2.733 0.003173053 FMO5
ENSOARG00000001559 -1.210 7.186 0.003181493 CYLC1
ENSOARG00000008990 -1.067 9.081 0.003197443 GKAP1
ENSOARG00000018795 -0.874 4.679 0.003199348 NTNG1
ENSOARG00000011279 0.906 4.151 0.003250295 PHF13
ENSOARG00000006804 -1.116 4.999 0.003255711 SPCS3
ENSOARG00000020547 0.662 6.087 0.00325894 CHD1L
ENSOARG00000010883 -0.894 4.486 0.003264541 OSTM1
ENSOARG00000013962 -0.886 6.768 0.003274571 FAM103A1
ENSOARG00000020567 -0.774 9.079 0.003288718 AGFG1
ENSOARG00000009072 -0.859 8.901 0.003296843 RNF139
ENSOARG00000006180 -0.870 4.864 0.003305008 CCNE2
ENSOARG00000012949 -0.955 7.161 0.003305475 C9orf135
ENSOARG00000001004 1.105 4.213 0.003315402 RAB11FIP1
ENSOARG00000004339 0.962 2.691 0.003316007 RHPN2
ENSOARG00000008817 0.955 4.151 0.003310259 HSP70
ENSOARG00000011889 0.718 4.827 0.003321465 TPM2
ENSOARG00000019207 1.003 3.852 0.003319026 ENSOARG00000002223 0.775 6.514 0.003329466 MYOF
ENSOARG00000011793 1.171 2.813 0.003338181 POGK
ENSOARG00000014323 0.838 3.704 0.003358701 ECHDC3
ENSOARG00000018756 -0.856 5.687 0.003357191 PPP1CC
ENSOARG00000019389 -0.719 4.795 0.003364508 CCDC121
ENSOARG00000014058 0.845 3.295 0.003377314 LPAR3
ENSOARG00000008588 1.093 3.793 0.003383744 GAS6
ENSOARG00000012922 0.978 2.708 0.003388708 ACOX3
ENSOARG00000003588 -0.861 6.428 0.00340306 THNSL1
ENSOARG00000013977 -0.923 8.905 0.003400389 SSX2IP
ENSOARG00000007899 -0.783 6.502 0.003419098 ENSOARG00000015049 0.833 5.110 0.00341945

Appendices
224
ENSOARG00000015905 -0.823 7.658 0.003416931 EIF4E
ENSOARG00000007644 -0.812 9.417 0.003424335 DDX4
ENSOARG00000003834 0.833 7.390 0.003441757 NSD1
ENSOARG00000018970 -0.894 7.776 0.003447742 KIAA1524
ENSOARG00000000263 1.200 4.360 0.003457752 SZT2
ENSOARG00000011215 0.631 7.557 0.003463253 ENSOARG00000014685 0.758 4.696 0.003467699 SLC2A12
ENSOARG00000001408 1.247 2.894 0.003489275 ACVR2B
ENSOARG00000003943 0.899 5.843 0.00348921 GLTSCR1L
ENSOARG00000004623 0.730 5.473 0.003488277 GDI1
ENSOARG00000017841 -0.788 5.884 0.003496102 PFN4
ENSOARG00000015555 -1.170 5.832 0.003500729 NCAM2
ENSOARG00000005228 1.016 5.422 0.00351562 ABAT
ENSOARG00000006205 1.348 4.745 0.003514459 ENSOARG00000000456 0.693 6.744 0.003533625 CTTN
ENSOARG00000003937 0.983 2.675 0.003543474 GBA
ENSOARG00000007413 -0.732 5.524 0.003540534 ENSOARG00000005893 -0.982 5.087 0.00354676 ENSOARG00000010324 0.906 3.035 0.003551621 ENSOARG00000008329 -0.824 6.466 0.003558699 RAB28
ENSOARG00000021109 -0.892 6.253 0.003565493 PSMA3
ENSOARG00000019608 -0.849 5.493 0.003581108 ENSOARG00000004104 -0.935 4.211 0.003588475 SPC25
ENSOARG00000006321 -1.367 4.602 0.003596733 CENPK
ENSOARG00000013650 0.946 4.282 0.003604031 MDH2
ENSOARG00000011001 -0.963 7.734 0.003611831 ENSOARG00000014201 0.917 5.053 0.003621481 MTCH1
ENSOARG00000008399 1.357 2.402 0.003627286 CCDC69
ENSOARG00000003602 1.155 2.665 0.003635219 ENSOARG00000012855 0.954 3.341 0.003636659 ST3GAL4
ENSOARG00000009419 0.863 5.300 0.003648503 ENSOARG00000020736 -0.828 5.716 0.003650852 ECT2
ENSOARG00000000634 -0.893 4.946 0.003679482 DNAL1
ENSOARG00000001930 -0.844 7.279 0.003670991 PTPN2
ENSOARG00000007255 -0.861 7.829 0.003659195 UBA6
ENSOARG00000007537 -0.878 7.691 0.003666968 CENPU
ENSOARG00000007619 -0.739 7.950 0.003687951 BTBD10
ENSOARG00000007648 -1.063 5.782 0.003654444 CCDC148
ENSOARG00000009602 -0.826 8.928 0.003689204 LDHA
ENSOARG00000016393 0.887 2.393 0.003686296 ATP5G2
ENSOARG00000018552 1.253 3.533 0.003683349 ENSOARG00000018747 -0.876 3.637 0.003689197 RAD21L1
ENSOARG00000019534 -0.716 6.739 0.003679277 IPO8
ENSOARG00000020445 -0.674 8.294 0.003669864 KCMF1
ENSOARG00000015144 0.836 9.081 0.003695805 SERPINA5
ENSOARG00000007139 -0.830 7.807 0.003711806 THUMPD3
ENSOARG00000013664 -0.831 5.871 0.003732681 SKA3
Appendices
225
ENSOARG00000004058 1.084 2.541 0.003738884 IKBKG
ENSOARG00000010989 -0.825 6.798 0.003754845 SOBP
ENSOARG00000018481 -0.816 5.957 0.003766951 RBM48
ENSOARG00000020665 -0.775 8.340 0.003774544 ATP11B
ENSOARG00000012489 0.828 2.626 0.00378783 AIP
ENSOARG00000002742 1.066 2.913 0.00381688 RAP2A
ENSOARG00000002873 -0.998 5.473 0.003815739 ENSOARG00000005743 -0.946 5.308 0.003804843 MRPS36
ENSOARG00000008268 1.151 2.571 0.003798029 AMOTL2
ENSOARG00000013652 -0.964 4.569 0.003814867 VAMP4
ENSOARG00000014393 0.970 4.516 0.003807452 BACH1
ENSOARG00000018220 0.770 4.012 0.003796866 CPED1
ENSOARG00000019700 0.868 3.183 0.003813451 B4GALT4
ENSOARG00000012911 -0.787 6.662 0.003837597 RNGTT
ENSOARG00000004647 0.898 2.948 0.003850165 ZNF385D
ENSOARG00000005356 1.068 3.045 0.003854577 MVP
ENSOARG00000005791 0.801 4.921 0.003869952 ACTN4
ENSOARG00000008734 1.207 2.966 0.003871972 TPCN1
ENSOARG00000013496 -0.820 7.582 0.003881552 MGAT4A
ENSOARG00000020500 -0.965 3.785 0.003880145 ENSOARG00000021090 -1.189 3.078 0.003888358 ENSOARG00000017793 0.879 3.583 0.003893839 IRF2BP2
ENSOARG00000001634 0.699 4.797 0.00391044 PHACTR2
ENSOARG00000013921 -0.976 7.186 0.003908605 UBE2B
ENSOARG00000014786 -0.912 7.945 0.003909757 EIF3E
ENSOARG00000015956 -0.888 4.494 0.003903703 DNAJC24
ENSOARG00000006055 0.922 3.408 0.003913859 SORBS1
ENSOARG00000000769 0.886 4.170 0.003951199 ENSOARG00000001745 -0.948 4.521 0.003955746 CDH8
ENSOARG00000019042 -0.779 4.052 0.003966064 BMP3
ENSOARG00000009374 -0.771 8.324 0.003984398 FBXL5
ENSOARG00000010163 0.773 3.230 0.003988153 GCDH
ENSOARG00000008725 0.826 4.202 0.004015521 LCOR
ENSOARG00000018763 0.842 4.362 0.004016516 UNC119
ENSOARG00000009087 -0.937 5.109 0.004025894 ZUFSP
ENSOARG00000012407 -0.913 9.208 0.004026466 C1orf173
ENSOARG00000006840 -0.844 5.420 0.004037394 DIMT1
ENSOARG00000015089 -0.806 6.784 0.004041323 OTOGL
ENSOARG00000018010 -0.780 7.476 0.004038028 TOMM70A
ENSOARG00000021161 -0.996 6.411 0.004038451 ENSOARG00000009536 0.750 4.130 0.004050611 PLCB4
ENSOARG00000015539 -1.001 2.706 0.004068754 ENSOARG00000015392 -0.763 5.104 0.004085822 SHCBP1
ENSOARG00000008151 1.080 2.742 0.00409635 ORAI3
ENSOARG00000014767 -0.908 7.149 0.004099695 GLIPR1L1
ENSOARG00000009819 -1.074 4.002 0.00410602 ENSOARG00000001850 0.751 6.708 0.004127962 GNB1

Appendices
226
ENSOARG00000014549 -1.105 6.150 0.004124973 ODF2L
ENSOARG00000015831 -0.759 6.730 0.004136407 ENSOARG00000007411 0.943 3.156 0.004149226 ASAP3
ENSOARG00000010805 -0.685 6.700 0.004148383 SNX3
ENSOARG00000005827 0.870 3.071 0.004162159 C1orf85
ENSOARG00000011637 -1.133 2.823 0.004162348 SAGE1
ENSOARG00000015999 -0.932 4.991 0.004164142 IMMP1L
ENSOARG00000013061 -0.916 5.114 0.004174011 UBLCP1
ENSOARG00000005856 -1.085 4.365 0.004192117 C6orf229
ENSOARG00000020386 0.716 6.148 0.004193504 APOD
ENSOARG00000000732 1.247 4.358 0.004198064 XPC
ENSOARG00000007621 -0.893 6.531 0.004201521 C21orf140
ENSOARG00000006192 -0.770 8.449 0.004208021 ATR
ENSOARG00000021063 -1.122 3.183 0.004212093 CD69
ENSOARG00000009317 -0.714 6.470 0.004226337 PRKAA1
ENSOARG00000003649 -0.871 5.393 0.004234335 ENSOARG00000014272 -0.998 5.028 0.004235 LIPJ
ENSOARG00000005569 1.066 4.663 0.004254405 ZNF532
ENSOARG00000009449 -0.839 5.073 0.004249711 ENSOARG00000020667 -0.898 5.044 0.004253397 FCGR1A
ENSOARG00000005629 -0.864 7.697 0.004259425 RAD17
ENSOARG00000017799 1.161 3.585 0.004282796 KANK2
ENSOARG00000018280 -0.860 3.264 0.004282519 SLCO4C1
ENSOARG00000016985 -0.808 6.553 0.004302558 ENSOARG00000021152 -0.865 7.892 0.004303487 PPP1R36
ENSOARG00000008130 -0.757 8.908 0.004317291 CCDC62
ENSOARG00000004868 -0.836 6.068 0.004321054 SPINK2
ENSOARG00000012388 -0.745 6.468 0.004330304 ENSOARG00000012639 -1.036 6.210 0.004334459 ENSOARG00000006486 -1.075 4.532 0.004343785 SREK1IP1
ENSOARG00000012773 -0.898 8.413 0.004355106 ATP5O
ENSOARG00000003774 0.842 3.912 0.004367883 SETD8
ENSOARG00000000299 -1.023 3.840 0.004380103 ENSOARG00000021045 0.623 6.890 0.004376918 GATM
ENSOARG00000004695 -0.866 9.326 0.004388624 GALNTL5
ENSOARG00000008666 -0.806 4.409 0.004390919 KCNRG
ENSOARG00000009824 -1.122 5.418 0.004395851 ENSOARG00000015002 1.046 3.667 0.00441899 ENSOARG00000018062 1.062 3.209 0.004422307 GUCY2F
ENSOARG00000020206 -0.930 8.356 0.004420779 TMCO2
ENSOARG00000011950 0.835 4.771 0.004439953 KIF16B
ENSOARG00000012207 0.869 2.550 0.004434272 EPHA7
ENSOARG00000016291 -1.151 3.445 0.004438164 POLR3G
ENSOARG00000014321 -0.772 9.003 0.004448825 TOP2A
ENSOARG00000017943 0.906 7.173 0.004448633 EP300
ENSOARG00000005015 0.905 4.272 0.004453874 PHB2
ENSOARG00000019701 -1.001 3.088 0.004462176

Appendices
227
ENSOARG00000006936 1.047 2.480 0.004469376 ABCC10
ENSOARG00000010076 -1.011 4.474 0.004474071 ENSOARG00000016782 -0.851 8.250 0.004472119 DNAJC10
ENSOARG00000002431 -0.968 7.718 0.004487707 ERICH2
ENSOARG00000014397 -0.744 5.721 0.004490421 TMEM217
ENSOARG00000002363 -0.772 7.531 0.004533744 EXOC1
ENSOARG00000010558 -0.879 8.384 0.004531613 SHOC2
ENSOARG00000006112 -0.830 3.694 0.004546895 ENSOARG00000007894 0.667 6.350 0.004548641 GAPDH
ENSOARG00000016406 -0.776 7.936 0.004543972 RBM46
ENSOARG00000000967 -0.857 5.716 0.00455561 ENSOARG00000004782 -0.951 5.394 0.004555936 NACA2
ENSOARG00000000324 -0.843 5.103 0.004562405 SCRN3
ENSOARG00000001811 0.807 5.266 0.004564424 TNNI3
ENSOARG00000011382 -0.942 3.166 0.004582789 ENSOARG00000020006 -0.999 6.118 0.004581014 ABCD2
ENSOARG00000001056 -0.834 7.202 0.00461253 ENSOARG00000014717 1.258 4.965 0.004621517 KIAA1462
ENSOARG00000010086 -0.786 6.934 0.004642833 UBA3
ENSOARG00000015309 -0.971 7.871 0.004650209 DIS3
ENSOARG00000000211 -1.103 3.401 0.00465669 ENSOARG00000004559 -1.005 4.636 0.004658799 DCUN1D5
ENSOARG00000007768 0.860 8.386 0.00466335 HUWE1
ENSOARG00000010768 -0.810 6.561 0.004675259 LACE1
ENSOARG00000003775 0.654 5.683 0.004688491 FOLH1
ENSOARG00000013789 0.896 4.537 0.004707396 ENSOARG00000019446 1.024 5.410 0.004716037 TNS1
ENSOARG00000017971 0.900 5.245 0.004729778 ZKSCAN1
ENSOARG00000002060 -0.759 5.786 0.004737767 DCAF17
ENSOARG00000005904 -0.982 7.314 0.004738589 CCDC178
ENSOARG00000006495 -0.772 7.476 0.004748431 ATP1B3
ENSOARG00000013295 1.462 3.016 0.004745729 SDK2
ENSOARG00000006944 -1.094 4.133 0.00476416 LSM5
ENSOARG00000019650 -1.201 4.826 0.004763224 PHOSPHO2
ENSOARG00000018060 -0.997 3.486 0.004793969 GPR128
ENSOARG00000016031 -1.046 7.663 0.004800518 SGOL2
ENSOARG00000021108 -0.814 7.690 0.004816976 ACTR10
ENSOARG00000015475 -0.780 5.129 0.00482188 ATG10
ENSOARG00000003653 1.374 2.932 0.004829498 MGRN1
ENSOARG00000004461 -0.825 5.741 0.004833679 RTKN2
ENSOARG00000002448 1.210 3.972 0.004846284 ATP8B2
ENSOARG00000011731 1.321 3.285 0.004846099 CCDC88C
ENSOARG00000017689 -0.869 4.937 0.004842168 UBXN2A
ENSOARG00000009408 -0.796 4.919 0.004868519 UEVLD
ENSOARG00000012601 -0.790 6.302 0.004881385 C9orf40
ENSOARG00000005048 0.926 4.405 0.004885187 RNF214
ENSOARG00000017055 -0.742 7.335 0.004893815 WDR41

Appendices
228
ENSOARG00000001375 0.889 3.175 0.004919828 PSMG4
ENSOARG00000008578 1.042 4.126 0.004919508 PTCH
ENSOARG00000020512 -0.789 7.008 0.004913804 RFC4
ENSOARG00000005933 -0.922 7.571 0.004933214 C17orf105
ENSOARG00000012040 0.745 4.811 0.004934637 DDX18
ENSOARG00000015477 0.731 6.539 0.004930599 GLB1
ENSOARG00000017449 1.503 4.146 0.004948595 CACNA1S
ENSOARG00000020389 -0.846 9.363 0.004965346 PPP1R2
ENSOARG00000017477 -0.765 7.898 0.004985402 CYP51A1
ENSOARG00000000637 0.925 4.555 0.004997619 EHMT1
ENSOARG00000018274 0.827 7.488 0.005000584 SORL1
ENSOARG00000015733 -0.879 3.959 0.005023294 ENSOARG00000015760 0.709 4.194 0.005021257 SLC25A14
ENSOARG00000007160 -1.019 8.416 0.005027527 SRP54
ENSOARG00000002888 -0.661 6.080 0.00505546 SPDL1
ENSOARG00000007206 -0.771 6.025 0.005043694 FAM177A1
ENSOARG00000009743 -0.804 5.901 0.005056787 EFCAB7
ENSOARG00000014545 -0.933 7.624 0.005058268 IFT74
ENSOARG00000016935 0.723 4.779 0.005049188 BCAR3
ENSOARG00000015824 -0.792 6.393 0.005090985 ENSOARG00000010707 -0.757 6.929 0.005097994 RAN
ENSOARG00000019628 -0.654 5.852 0.005100871 ENSOARG00000005869 0.807 3.655 0.005111981 BEND6
ENSOARG00000003158 -0.850 6.303 0.005121041 CEP55
ENSOARG00000016247 -1.157 6.006 0.005132478 CETN3
ENSOARG00000017292 0.714 5.445 0.005129871 CDS2
ENSOARG00000007767 -0.791 7.027 0.005142994 LRP2BP
ENSOARG00000010082 0.804 5.664 0.00518446 EGFLAM
ENSOARG00000003608 1.036 5.155 0.005203365 AMBRA1
ENSOARG00000019637 -0.919 7.803 0.005208552 ENSOARG00000006660 0.857 4.959 0.005220656 YAP1
ENSOARG00000008206 -0.818 6.312 0.005241395 CENPN
ENSOARG00000012574 -0.793 4.907 0.005235847 NMRK1
ENSOARG00000015462 -0.867 5.898 0.005242737 COQ10B
ENSOARG00000017457 -0.857 5.717 0.005245171 PIP
ENSOARG00000013374 1.036 2.716 0.005295217 CAPN5
ENSOARG00000007720 -0.620 6.424 0.005300911 PPAP2A
ENSOARG00000021079 0.772 3.574 0.005308499 S100A11
ENSOARG00000008620 1.166 4.215 0.00532688 LTF
ENSOARG00000003048 -0.908 2.972 0.005336186 ENSOARG00000012678 -0.691 6.993 0.00534509 ENSOARG00000015916 -1.014 6.579 0.005365166 CCDC41
ENSOARG00000001379 0.890 3.767 0.005390387 CAV2
ENSOARG00000003104 -0.810 4.793 0.005388001 AP1AR
ENSOARG00000000609 -0.857 7.417 0.005421622 RPGR
ENSOARG00000007529 -0.798 5.491 0.005429934 SVIP
ENSOARG00000002633 0.847 3.113 0.00544602 CDK5

Appendices
229
ENSOARG00000004854 -0.955 4.164 0.005454074 ENSOARG00000019451 -0.884 5.839 0.005451377 RPAP3
ENSOARG00000005787 1.318 2.924 0.005464253 WFS1
ENSOARG00000020696 -0.724 6.079 0.005470613 ACTL6A
ENSOARG00000010523 1.290 2.864 0.005481889 JAG1
ENSOARG00000004852 0.847 2.806 0.005496916 SCN1A
ENSOARG00000007048 0.734 4.783 0.005509637 ANKRD10
ENSOARG00000007473 -0.858 9.533 0.005505099 LUZP2
ENSOARG00000010256 -0.835 9.041 0.005521491 DYDC1
ENSOARG00000013675 -0.944 6.033 0.005508095 ENSOARG00000014002 -0.886 8.141 0.005520611 PSIP1
ENSOARG00000015776 -0.795 8.418 0.005520134 C21orf91
ENSOARG00000001463 -0.812 6.473 0.005529191 ENSOARG00000019156 -0.885 7.676 0.005529596 ZBTB26
ENSOARG00000015875 -0.828 7.654 0.005535497 DCDC1
ENSOARG00000000928 -0.651 5.876 0.005554672 ECT2L
ENSOARG00000008592 -0.876 6.689 0.005569797 ENSOARG00000012694 1.200 2.634 0.005559556 ARHGAP39
ENSOARG00000012858 -0.752 7.603 0.005565061 NSUN7
ENSOARG00000013104 -1.005 7.783 0.005561932 C6orf163
ENSOARG00000015526 1.122 3.436 0.005571049 ACHE
ENSOARG00000016586 -0.903 2.758 0.005558835 ENSOARG00000019140 0.973 4.230 0.005587553 PBR
ENSOARG00000003750 0.734 6.350 0.005604245 MTR
ENSOARG00000004122 0.847 2.734 0.005603542 RAB24
ENSOARG00000009818 0.793 7.556 0.005609207 NCOA3
ENSOARG00000001016 0.810 4.970 0.005615601 EPN1
ENSOARG00000003498 -0.944 5.430 0.005626754 RMI1
ENSOARG00000015327 -0.842 4.480 0.00563566 KRT10
ENSOARG00000016569 -0.870 4.020 0.005636715 FAM69A
ENSOARG00000014780 0.673 5.376 0.005641615 KIAA1324L
ENSOARG00000008840 -0.814 7.942 0.005647819 CEP57
ENSOARG00000013476 -0.774 8.091 0.005662398 UHRF1BP1L
ENSOARG00000015621 -0.805 6.551 0.005680359 RFTN2
ENSOARG00000020440 -0.793 7.486 0.00568417 HRASLS
ENSOARG00000007846 -0.868 6.141 0.005700066 C4orf47
ENSOARG00000009280 0.766 3.797 0.005696296 F11R
ENSOARG00000006701 0.940 2.973 0.005710403 PLD2
ENSOARG00000020023 0.846 9.871 0.005711983 MACF1
ENSOARG00000003229 1.246 3.631 0.005733293 TRAK1
ENSOARG00000008636 -0.740 4.750 0.005761328 C5orf34
ENSOARG00000012942 -0.652 7.996 0.005762169 RABEPK
ENSOARG00000014625 0.779 4.052 0.005771096 TMEM19
ENSOARG00000005327 -0.787 9.273 0.005776159 DPY19L2
ENSOARG00000019679 0.884 2.278 0.005779477 ZNF219
ENSOARG00000010266 -0.729 6.155 0.005788665 SPOPL
ENSOARG00000005094 1.108 5.098 0.0057998 CUL7

Appendices
230
ENSOARG00000019975 -0.781 6.731 0.00580258 IFLTD1
ENSOARG00000013284 0.608 6.735 0.005817296 NT5E
ENSOARG00000022521 0.783 4.502 0.005818359 NEAT1_3
ENSOARG00000005279 0.989 3.179 0.005824043 UBQLN4
ENSOARG00000017427 0.885 4.139 0.005851111 LDB1
ENSOARG00000007925 0.693 5.521 0.005865778 PCCB
ENSOARG00000005283 1.096 5.833 0.005886225 CDC42BPB
ENSOARG00000013887 0.860 3.324 0.005892939 NFIB
ENSOARG00000014278 -0.832 4.589 0.005897323 C1orf52
ENSOARG00000017508 0.655 5.276 0.005900783 ENSOARG00000014617 -0.725 6.645 0.005905612 PPP4R4
ENSOARG00000014238 -0.900 7.910 0.005915705 WDR63
ENSOARG00000016859 -0.787 7.842 0.005911887 AXDND1
ENSOARG00000000907 0.613 7.209 0.005931978 MUM1L1
ENSOARG00000017451 -0.802 3.712 0.00593083 GDPGP1
ENSOARG00000005290 -0.990 4.920 0.005945701 USMG5
ENSOARG00000012523 0.963 7.544 0.00594722 DCTN1
ENSOARG00000013666 -0.737 8.465 0.005956413 SCYL2
ENSOARG00000020690 -0.828 6.213 0.005956582 NDUFB5
ENSOARG00000004258 -0.778 4.613 0.005984616 ENSOARG00000015359 -0.966 6.943 0.005988292 LRRIQ1
ENSOARG00000007254 -0.668 4.847 0.006016112 MCU
ENSOARG00000014845 -0.725 5.562 0.006004942 ESCO2
ENSOARG00000016227 -0.729 6.735 0.006009902 DCAF13
ENSOARG00000019099 0.791 3.015 0.006015128 ENSOARG00000017309 -0.913 7.389 0.006028156 DNAJC5B
ENSOARG00000010759 -0.847 6.682 0.006056861 PPP2R5A
ENSOARG00000019369 0.679 5.787 0.006078954 AHCYL1
ENSOARG00000017503 -0.811 8.646 0.006099123 ENSOARG00000018434 0.932 3.409 0.006102218 NRP2
ENSOARG00000005102 -0.927 2.957 0.006117348 TMEM126B
ENSOARG00000005715 -0.855 7.333 0.00612977 DPY19L1
ENSOARG00000011313 0.674 5.223 0.006126546 ENSOARG00000013903 -0.841 10.510 0.006131996 STAT1
ENSOARG00000007414 0.679 6.431 0.006141031 ENSOARG00000004435 -0.796 6.538 0.006155672 ENSOARG00000020345 -0.849 6.466 0.006155097 WDR53
ENSOARG00000010135 0.748 3.596 0.006163655 F5
ENSOARG00000020554 -0.788 8.812 0.00617699 MFF
ENSOARG00000009208 -0.813 4.595 0.006186566 ENSOARG00000020936 -1.029 2.992 0.006197276 MAGOHB
ENSOARG00000004318 -1.190 4.448 0.006203866 CDC2
ENSOARG00000017168 1.092 6.392 0.006215865 FASN
ENSOARG00000005425 -0.813 5.200 0.006220494 ENSOARG00000012992 -0.708 5.829 0.006229831 ORC3
ENSOARG00000008434 0.635 4.948 0.006307549 ABHD3
ENSOARG00000018595 0.818 2.375 0.00632328

Appendices
231
ENSOARG00000006789 -0.786 4.578 0.00633697 IRAK1BP1
ENSOARG00000001687 0.634 5.134 0.006350713 ARMCX3
ENSOARG00000016413 1.110 2.838 0.006347856 ENSOARG00000017821 -0.753 7.810 0.006343011 CLPX
ENSOARG00000012863 -0.711 8.084 0.006359354 SRSF12
ENSOARG00000000237 1.064 4.673 0.006390449 DAAM2
ENSOARG00000010347 -0.710 5.654 0.006404832 C5orf54
ENSOARG00000010822 0.626 7.761 0.00642731 C17orf47
ENSOARG00000015017 0.927 4.827 0.006434064 INTS9
ENSOARG00000001956 1.179 3.790 0.006472548 SNX33
ENSOARG00000005515 1.197 3.306 0.006466809 PDPR
ENSOARG00000005900 -0.834 4.771 0.006480589 GMNN
ENSOARG00000009556 -0.949 5.337 0.006480267 MICU3
ENSOARG00000009814 1.010 2.659 0.006460123 ZMIZ1
ENSOARG00000011525 -0.824 7.576 0.006450252 SPATA17
ENSOARG00000014754 -0.731 4.759 0.006463095 CAPS2
ENSOARG00000019549 -0.887 5.235 0.006477394 ENSOARG00000003944 -0.761 8.521 0.006494867 TRAM1
ENSOARG00000013050 0.912 4.024 0.006514814 SLC9A2
ENSOARG00000000109 0.625 5.662 0.006522191 SLAIN1
ENSOARG00000003314 -0.808 8.551 0.006569655 POLB
ENSOARG00000005338 -0.765 5.500 0.006588592 ZNF345
ENSOARG00000002356 -0.792 5.986 0.006613854 RARRES1
ENSOARG00000005343 0.951 5.677 0.006606407 SRGAP2
ENSOARG00000006719 -0.812 6.147 0.006609891 EAPP
ENSOARG00000012384 0.792 4.812 0.006631021 ENSOARG00000016551 -0.698 4.394 0.006625163 STPG2
ENSOARG00000018225 -0.690 5.630 0.006634776 ZWILCH
ENSOARG00000020993 1.166 2.476 0.006627088 SELENBP1
ENSOARG00000006155 -0.983 3.647 0.006667367 ENSOARG00000016066 -0.793 6.194 0.006659826 ENSOARG00000016523 1.012 6.000 0.006664102 CAMSAP2
ENSOARG00000017414 -0.856 6.283 0.006679706 ENSOARG00000020605 1.032 3.043 0.006691137 PIAS3
ENSOARG00000005690 0.934 4.133 0.006701089 FBXW2
ENSOARG00000015653 1.144 4.422 0.00672786 EEF2K
ENSOARG00000012031 -0.723 8.347 0.006741627 CSE1L
ENSOARG00000000647 -0.769 6.720 0.006747279 ENSOARG00000006187 1.037 3.448 0.006806424 MAPKAPK2
ENSOARG00000011378 -0.853 5.629 0.006811304 SEC61G
ENSOARG00000018461 -0.994 4.561 0.006807411 ENSOARG00000001391 0.802 3.634 0.006820878 ENSOARG00000020535 -0.787 5.028 0.006817106 SNAP23
ENSOARG00000017948 1.035 4.956 0.006846245 DOCK6
ENSOARG00000001330 -0.813 5.335 0.006861159 NRG4
ENSOARG00000012362 -0.680 6.243 0.00685775 TC2N
ENSOARG00000007806 -0.856 4.136 0.006865935 ANKRD37

Appendices
232
ENSOARG00000020878 -0.936 7.103 0.006871446 MNS1
ENSOARG00000020998 -1.183 4.608 0.006877593 DTWD1
ENSOARG00000010011 -0.755 5.625 0.006890099 ENSOARG00000012703 -0.779 4.427 0.006894475 ZNF791
ENSOARG00000011769 1.125 2.754 0.006906835 PYROXD2
ENSOARG00000012612 -0.744 6.556 0.00691737 SLC44A5
ENSOARG00000015721 0.783 3.220 0.006917228 B3GAT3
ENSOARG00000012754 -0.837 7.187 0.006938805 ATXN3
ENSOARG00000002869 -0.902 4.640 0.006965783 ENSOARG00000008180 1.091 5.222 0.006966532 PTPRS
ENSOARG00000021111 -0.861 4.052 0.006967571 TOMM20L
ENSOARG00000010839 -0.690 7.355 0.006995337 MPP6
ENSOARG00000000772 1.058 3.219 0.007005776 PLCD1
ENSOARG00000000451 -0.825 6.131 0.007019116 ENSOARG00000005644 0.904 2.492 0.007034356 ENSOARG00000004426 -0.848 3.521 0.007052657 NSA2
ENSOARG00000007668 -1.157 2.739 0.007086081 GRM7
ENSOARG00000008254 -0.812 7.023 0.007091608 TTC6
ENSOARG00000015533 -0.780 6.586 0.007094049 CCDC53
ENSOARG00000020534 -0.684 7.302 0.007091778 TBCCD1
ENSOARG00000018154 0.856 3.844 0.007126053 CNP
ENSOARG00000018833 -0.776 4.474 0.00713598 ENSOARG00000019375 1.046 2.387 0.007133114 HDAC7
ENSOARG00000008955 -0.806 4.557 0.007143393 TM2D1
ENSOARG00000014482 -0.677 5.612 0.007154416 ENSOARG00000021162 0.670 5.209 0.007155572 GPHN
ENSOARG00000002195 -0.881 7.434 0.007181637 RNMT
ENSOARG00000005209 1.079 2.406 0.007183533 SDC4
ENSOARG00000014614 1.340 3.148 0.007186662 ENSOARG00000013492 -0.947 7.335 0.00720285 INSL6
ENSOARG00000003731 -0.807 8.413 0.007209992 PSME3
ENSOARG00000013178 -0.858 4.867 0.007239344 CCDC126
ENSOARG00000021101 -0.798 7.885 0.007244332 EXOC5
ENSOARG00000009688 0.763 5.359 0.007259326 RERE
ENSOARG00000015046 -0.906 4.591 0.007255425 GNPDA2
ENSOARG00000001833 1.008 2.624 0.007276336 ENSOARG00000015300 -0.768 8.794 0.007290482 LARP1B
ENSOARG00000000810 0.773 5.097 0.007304865 NHSL1
ENSOARG00000012153 -0.987 4.917 0.007311631 CCDC160
ENSOARG00000001254 1.138 2.937 0.007339792 TNXB
ENSOARG00000014555 1.166 3.960 0.007338918 BCR
ENSOARG00000014904 0.855 4.018 0.007352793 PAPD7
ENSOARG00000001870 0.903 3.723 0.007386685 VSTM4
ENSOARG00000002026 -0.805 8.274 0.007406689 COPS4
ENSOARG00000005374 -0.783 5.298 0.007409399 ENSOARG00000007738 0.911 3.834 0.007402348 TAP1
ENSOARG00000008310 -0.781 7.191 0.00741928 TTC29

Appendices
233
ENSOARG00000011500 0.940 4.434 0.007463182 DYSF
ENSOARG00000002953 -0.641 8.099 0.007479432 LRRC36
ENSOARG00000005346 -0.785 6.098 0.007537369 SCFD1
ENSOARG00000008048 0.756 4.926 0.007545958 FAM120A
ENSOARG00000013466 -0.792 9.587 0.007574131 TSGA10
ENSOARG00000019759 -0.742 7.160 0.00757915 GMCL1
ENSOARG00000006752 -0.699 7.650 0.007588976 SPATA4
ENSOARG00000013951 -1.088 4.306 0.007584436 NRIP3
ENSOARG00000013417 -0.814 5.859 0.007595858 TXNDC9
ENSOARG00000001068 -0.724 6.285 0.007613111 ADAM21
ENSOARG00000000519 1.049 4.923 0.007636334 PCDHAC2
ENSOARG00000015716 -0.943 2.570 0.007645878 COMMD8
ENSOARG00000016435 -0.834 5.596 0.00765332 ENSOARG00000006851 -0.805 6.409 0.007701879 LZIC
ENSOARG00000007704 1.037 3.657 0.007713103 ALS2CL
ENSOARG00000006805 -0.724 9.178 0.007727291 WDR96
ENSOARG00000008800 0.855 4.103 0.007733922 HSP70
ENSOARG00000012967 -0.835 6.492 0.007727388 AKIRIN2
ENSOARG00000016410 -0.748 7.097 0.007733275 WDR75
ENSOARG00000003080 -0.734 6.648 0.007747496 STK3
ENSOARG00000005287 -1.042 4.408 0.007764928 APOBEC4
ENSOARG00000007039 1.341 3.923 0.007768505 AGRN
ENSOARG00000020342 -0.745 5.838 0.007770229 OIP5
ENSOARG00000002528 0.953 3.976 0.007788405 TTYH1
ENSOARG00000009320 -0.749 7.268 0.007786763 MMADHC
ENSOARG00000003388 -0.860 4.233 0.007803794 KLHL41
ENSOARG00000015154 -0.724 7.726 0.007820942 ZPBP
ENSOARG00000019335 -0.895 6.766 0.007822015 PSIP1
ENSOARG00000018957 -0.889 4.623 0.007875368 AKNAD1
ENSOARG00000000347 1.009 8.332 0.00790089 TRRAP
ENSOARG00000005722 0.887 5.359 0.00792317 EPAS1
ENSOARG00000019744 -0.866 3.893 0.007934076 SNRNP27
ENSOARG00000016137 0.750 2.741 0.007948985 CTBP1
ENSOARG00000006724 -0.742 6.512 0.007961806 ENSOARG00000003276 -0.798 5.249 0.007989319 ENSOARG00000011351 -0.752 6.896 0.007998923 WDR76
ENSOARG00000007486 -0.947 5.012 0.00801086 CCDC122
ENSOARG00000012067 -0.800 5.036 0.008024283 TEFM
ENSOARG00000007764 -0.749 7.687 0.008039069 SKIV2L2
ENSOARG00000013165 0.669 5.738 0.008050871 ENSOARG00000011408 0.789 4.472 0.008073671 FRY
ENSOARG00000014007 0.839 3.988 0.008077851 JADE2
ENSOARG00000011541 -0.766 3.537 0.008085781 MELK
ENSOARG00000010350 0.791 3.326 0.008097841 QDPR
ENSOARG00000002606 -0.721 6.962 0.008103579 CCDC67
ENSOARG00000012299 0.932 3.623 0.008127989 TLE1
ENSOARG00000020093 -0.776 7.944 0.008146857 UBE2N

Appendices
234
ENSOARG00000001541 -0.731 5.394 0.008172247 PEX3
ENSOARG00000005736 0.847 6.150 0.008169347 GLG1
ENSOARG00000016793 -0.745 4.909 0.008171858 GGH
ENSOARG00000010875 -0.870 6.439 0.008181708 CUL5
ENSOARG00000020072 -0.795 7.668 0.008186378 FSIP1
ENSOARG00000017232 1.307 2.623 0.008238425 ACVR1B
ENSOARG00000020650 0.667 4.639 0.008237295 REEP1
ENSOARG00000000897 0.604 5.706 0.008260349 CUEDC2
ENSOARG00000006481 -0.855 6.984 0.008257838 TMEM30A
ENSOARG00000002762 0.950 2.654 0.008268853 TUBG2
ENSOARG00000000818 0.883 2.717 0.008278722 TRIM68
ENSOARG00000006293 -0.728 4.896 0.008292755 ENSOARG00000004487 0.627 6.729 0.00832923 YWHAB
ENSOARG00000013778 0.971 3.995 0.008321846 YWHAG
ENSOARG00000017713 0.805 4.817 0.008330819 TRAF7
ENSOARG00000014990 -0.673 6.700 0.008368813 ZNF613
ENSOARG00000015373 -0.759 7.107 0.008374908 EIF1AX
ENSOARG00000009729 -0.944 3.586 0.008407132 ITGB3BP
ENSOARG00000011659 -0.908 4.322 0.008406752 LYPLAL1
ENSOARG00000013745 0.764 3.641 0.008408763 FADS1
ENSOARG00000020153 -1.012 3.967 0.008413537 DTX3L
ENSOARG00000020022 -0.871 8.926 0.00841889 TMCO5A
ENSOARG00000016048 -0.760 5.474 0.008426857 C11orf57
ENSOARG00000018954 -0.743 5.346 0.008432188 SNX2
ENSOARG00000004081 0.927 2.236 0.008451071 ENSOARG00000004469 0.991 4.027 0.008459513 TAGAP
ENSOARG00000002282 0.874 4.944 0.008482876 SETBP1
ENSOARG00000006270 0.721 5.277 0.008478499 KDSR
ENSOARG00000009996 0.848 5.467 0.008502951 CACHD1
ENSOARG00000012812 1.095 2.468 0.008501266 CYB561A3
ENSOARG00000014400 -0.835 7.909 0.008510815 ENSOARG00000020803 0.979 4.805 0.008506504 TLN2
ENSOARG00000021070 -0.830 7.235 0.00851201 CDKN3
ENSOARG00000011071 1.260 3.243 0.008535789 FAM102A
ENSOARG00000001927 -0.906 3.072 0.008567646 ENSOARG00000020903 -0.894 9.096 0.00856417 CCPG1
ENSOARG00000013077 -0.710 6.617 0.008582122 FAM134B
ENSOARG00000002398 0.794 4.812 0.008591968 COLGALT2
ENSOARG00000019010 -0.796 5.740 0.008653158 DZIP3
ENSOARG00000016444 -0.832 5.722 0.008683954 ENSOARG00000003802 -0.610 8.060 0.008695604 SCCPDH
ENSOARG00000005402 -0.832 4.556 0.008694005 ZNF569
ENSOARG00000000938 -0.694 5.892 0.008715788 SOCS4
ENSOARG00000018707 0.786 5.415 0.008711831 SLC38A10
ENSOARG00000002484 0.875 6.216 0.008725397 CREBBP
ENSOARG00000013631 1.246 2.835 0.008753056 FAM65C
ENSOARG00000018627 0.731 3.155 0.00875151 TSC22D3

Appendices
235
ENSOARG00000013254 1.057 2.620 0.008772469 ARAF
ENSOARG00000014979 -0.770 6.802 0.00876984 GTF2B
ENSOARG00000005814 0.960 2.172 0.008782644 ENSOARG00000012135 -0.789 6.694 0.008811067 MROH9
ENSOARG00000013579 -1.022 6.263 0.008831224 ENSOARG00000016685 -1.048 6.912 0.00882738 CCDC18
ENSOARG00000007348 -0.663 4.609 0.008840941 P4HA1
ENSOARG00000017558 -0.795 5.920 0.008842812 ENSOARG00000009416 0.946 5.727 0.008849495 PTBP1
ENSOARG00000016837 -0.767 6.066 0.008861019 ZNF624
ENSOARG00000006664 0.799 2.862 0.008884992 LITAF
ENSOARG00000020626 1.052 2.902 0.008890599 SLC16A14
ENSOARG00000016831 -0.845 4.897 0.008898315 NDUFB3
ENSOARG00000011576 0.708 3.368 0.008921882 ENSOARG00000016153 0.666 4.039 0.00892067 CPE
ENSOARG00000019299 -0.812 4.969 0.008932263 ENSOARG00000018404 0.870 2.936 0.008937941 ENSOARG00000013149 0.762 4.890 0.008971659 HIST1H2BJ
ENSOARG00000015536 1.024 4.090 0.008984425 KIAA1199
ENSOARG00000000113 -0.914 6.556 0.009022782 FAM204A
ENSOARG00000005311 -0.700 5.556 0.009009223 C2orf61
ENSOARG00000010252 -0.739 8.656 0.009017546 AK9
ENSOARG00000018927 0.973 2.596 0.009012552 XK
ENSOARG00000014024 0.824 5.844 0.009059557 SPG7
ENSOARG00000008564 0.998 2.684 0.00906691 MAPKAPK3
ENSOARG00000006852 -0.804 3.451 0.009075418 NEIL3
ENSOARG00000000577 -0.783 7.765 0.009094714 ENSOARG00000001844 -0.692 6.204 0.009096337 VRK2
ENSOARG00000008738 0.794 4.275 0.00908796 SCRN1
ENSOARG00000017468 0.771 3.753 0.009116774 EPHX1
ENSOARG00000000898 -0.750 9.652 0.009129503 CCDC176
ENSOARG00000010098 -0.703 6.459 0.00913526 CDC40
ENSOARG00000018138 -0.731 6.776 0.009136101 RIOK2
ENSOARG00000011833 0.616 5.543 0.009157386 CREB3
ENSOARG00000010108 0.680 3.612 0.009193737 FEZ2
ENSOARG00000019802 -0.771 5.179 0.00920258 STK38L
ENSOARG00000008055 0.929 4.072 0.009257896 ENSOARG00000017293 -0.870 5.950 0.009257054 C6orf10
ENSOARG00000017760 -0.941 5.422 0.009263551 ENSOARG00000021096 -0.959 10.491 0.009262777 KTN1
ENSOARG00000021259 -1.031 11.739 0.009275606 U2
ENSOARG00000004263 0.808 2.468 0.009282017 ZDHHC14
ENSOARG00000011277 1.311 2.688 0.009318159 PRICKLE2
ENSOARG00000011981 0.764 2.763 0.009320221 FAM122B
ENSOARG00000015967 -0.711 7.125 0.009317736 NR2C1
ENSOARG00000012699 0.926 3.294 0.00932775 WASF3
ENSOARG00000003327 0.942 3.650 0.009345757 SIPA1L2

Appendices
236
ENSOARG00000005162 0.901 3.623 0.00933469 TRIP10
ENSOARG00000016030 -0.954 3.814 0.009342681 C6orf52
ENSOARG00000011342 1.046 3.439 0.009376415 ARRB1
ENSOARG00000002597 0.918 6.584 0.009400932 CHD6
ENSOARG00000003915 0.674 5.149 0.009437778 SRGAP1
ENSOARG00000006415 -0.889 4.140 0.009482 ENSOARG00000008158 -0.891 8.466 0.009474 PRPF40A
ENSOARG00000016649 0.703 4.667 0.009465845 CDC42SE2
ENSOARG00000019180 0.809 6.082 0.009478284 LAMC1
ENSOARG00000014098 -0.806 8.257 0.009511412 ATAD1
ENSOARG00000007249 -0.743 4.195 0.009533891 TMEM38B
ENSOARG00000007691 -0.783 5.554 0.009541913 RAD54B
ENSOARG00000018260 -0.767 4.433 0.009537714 ST8SIA4
ENSOARG00000023308 0.984 3.414 0.009557063 SCARNA16
ENSOARG00000007258 1.138 3.989 0.009575895 UBE2O
ENSOARG00000013924 1.039 5.854 0.009580179 ANKRD11
ENSOARG00000015317 -0.781 7.346 0.009569395 SRR
ENSOARG00000021193 -0.863 4.481 0.009583523 COX16
ENSOARG00000020674 -0.779 10.065 0.00967086 FXR1
ENSOARG00000004249 -1.105 4.719 0.009700292 ENSOARG00000011033 -0.693 5.630 0.009696974 MED7
ENSOARG00000013828 -0.855 9.004 0.009701016 DNAJB8
ENSOARG00000009863 -0.877 7.228 0.009730943 ENSOARG00000010050 0.824 3.454 0.009736405 GALNT18
ENSOARG00000014319 0.731 4.814 0.009749661 DDAH1
ENSOARG00000021006 -0.960 6.673 0.009791194 COPS2
ENSOARG00000009238 -0.804 7.712 0.009802868 THOC1
ENSOARG00000020774 0.700 3.730 0.009811151 EIF2AK3
ENSOARG00000006723 0.755 4.987 0.009832616 TXNDC11
ENSOARG00000009768 -0.940 7.876 0.009846786 CCDC181
ENSOARG00000009056 1.097 3.444 0.009855444 ATP7B
ENSOARG00000021126 -0.804 8.695 0.009859272 PPM1A
ENSOARG00000010931 -0.771 6.276 0.00989431 GOSR1
ENSOARG00000012096 0.983 2.446 0.009892269 SUV39H1
ENSOARG00000020899 -0.843 5.600 0.009887589 DYX1C1
ENSOARG00000004086 0.828 3.824 0.009925356 BICC1
ENSOARG00000018426 -0.731 6.353 0.00992966 ZNF184
ENSOARG00000006095 1.115 4.299 0.009955024 MINK1
ENSOARG00000008203 0.726 3.146 0.009956467 CD99
ENSOARG00000020978 1.040 3.916 0.009956269 ZNF687
ENSOARG00000016132 -0.735 9.137 0.009982948 PRKAR2A
ENSOARG00000005126 -0.925 3.183 0.010006588 EMR3
ENSOARG00000009659 0.602 6.128 0.010020198 EPHX2
ENSOARG00000010622 -0.703 5.354 0.010023454 YIPF4
ENSOARG00000014455 -0.806 7.006 0.010016306 ENSOARG00000007234 -0.568 6.748 0.010080592 PLK2
ENSOARG00000010127 0.780 5.551 0.01008491 CRIM1
Appendices
237
ENSOARG00000015809 -0.700 6.427 0.010108194 PSMD12
ENSOARG00000006311 0.581 5.814 0.010130295 HNRNPAB
ENSOARG00000011799 -0.845 6.419 0.010138101 TEX26
ENSOARG00000010020 -0.702 4.739 0.010154612 ERI1
ENSOARG00000010700 0.810 3.091 0.010149081 MSANTD2
ENSOARG00000000220 -0.798 5.128 0.010219355 LIN9
ENSOARG00000018855 -0.689 4.496 0.010216954 LNX1
ENSOARG00000017720 0.966 2.715 0.010237979 CASP2
ENSOARG00000020986 -0.842 8.816 0.010243313 USP50
ENSOARG00000012052 -0.685 5.770 0.010271743 UBE2K
ENSOARG00000021166 -0.790 3.287 0.010270087 EIF2S1
ENSOARG00000007660 0.635 4.297 0.010293944 KIAA0408
ENSOARG00000009665 0.700 4.115 0.010296153 MTPN
ENSOARG00000021174 1.061 4.526 0.010300295 ZFYVE26
ENSOARG00000012421 -0.724 5.039 0.01033119 HUS1
ENSOARG00000005937 0.897 4.533 0.010344173 MAST4
ENSOARG00000000726 -0.687 5.610 0.010355221 ENSOARG00000003335 -0.726 5.413 0.010365158 PDE6C
ENSOARG00000011197 -0.712 6.228 0.010383538 RIPK2
ENSOARG00000012536 -1.152 4.010 0.010368791 ENSOARG00000016006 0.959 4.643 0.010371505 TBCD
ENSOARG00000019665 -0.727 10.957 0.010381864 RPGRIP1
ENSOARG00000020238 0.985 3.837 0.0103876 IGSF3
ENSOARG00000003379 -0.833 6.384 0.010428525 EFCAB11
ENSOARG00000015267 0.937 2.817 0.010435227 MCAM
ENSOARG00000004097 -0.680 6.071 0.010460358 ENSOARG00000015582 0.685 4.684 0.010506187 TBC1D4
ENSOARG00000015976 0.930 5.407 0.010515715 SUN2
ENSOARG00000016012 0.982 3.044 0.010518551 TYK2
ENSOARG00000018821 -0.834 4.594 0.010515177 CHDC2
ENSOARG00000006337 -0.853 5.601 0.010539013 TMEM70
ENSOARG00000013957 -0.685 6.346 0.010538401 PPEF1
ENSOARG00000019620 -0.672 6.721 0.010529442 ENSOARG00000001863 0.922 4.318 0.010562357 SEMA6A
ENSOARG00000001667 0.667 5.224 0.010575458 EIF2AK1
ENSOARG00000002221 0.782 6.079 0.010579043 SIN3A
ENSOARG00000008248 1.198 2.954 0.010583619 HSPG2
ENSOARG00000007942 0.718 3.846 0.010606931 KIAA0226L
ENSOARG00000014643 -0.876 7.412 0.010654831 EQTN
ENSOARG00000000172 -1.026 2.436 0.010666998 ENSOARG00000015966 -0.735 5.573 0.010671354 ENSOARG00000019676 -0.726 2.476 0.010690849 GALNT14
ENSOARG00000002806 1.069 2.436 0.010697081 MBOAT7
ENSOARG00000013755 0.631 6.064 0.010798615 PTPRD
ENSOARG00000018491 -0.855 4.916 0.01086122 MTERFD3
ENSOARG00000019154 1.219 3.400 0.010859893 TTLL12
ENSOARG00000013893 -0.817 4.442 0.010887866 MGARP

Appendices
238
ENSOARG00000015846 0.989 6.731 0.010905841 PLEC
ENSOARG00000015122 -0.707 7.243 0.01091953 C11orf1
ENSOARG00000006202 0.790 7.992 0.010932234 ENSOARG00000013281 0.731 4.996 0.010929114 HIST2H2AC
ENSOARG00000006902 0.848 4.519 0.010944436 HDAC5
ENSOARG00000011626 0.710 6.798 0.010966157 TUBB
ENSOARG00000014615 -0.783 4.321 0.010970668 ZCWPW2
ENSOARG00000021133 -0.746 4.638 0.010971063 SLC38A6
ENSOARG00000005310 -0.701 5.222 0.010991816 CCDC90B
ENSOARG00000013256 -0.753 5.499 0.010990101 ERI2
ENSOARG00000004275 0.955 6.295 0.011035097 ARID1A
ENSOARG00000008013 -0.749 7.877 0.011035294 PNPLA8
ENSOARG00000003557 -0.808 5.304 0.01107576 EFHC2
ENSOARG00000004114 -0.831 6.042 0.011114723 ENSOARG00000005183 -0.662 4.568 0.011140587 DLG2
ENSOARG00000006144 -0.786 5.770 0.011215645 TRAPPC13
ENSOARG00000000582 0.812 2.877 0.011263257 SLC25A53
ENSOARG00000013080 0.802 5.524 0.01126 DOCK1
ENSOARG00000017509 1.001 4.052 0.01125844 PPRC1
ENSOARG00000022778 1.050 3.333 0.01129021 SNORA54
ENSOARG00000004438 0.752 3.121 0.011314972 ENSOARG00000014536 0.715 4.949 0.011318405 RPS12
ENSOARG00000009299 0.748 4.370 0.011330976 ENSOARG00000020818 0.657 5.411 0.011332126 PSD4
ENSOARG00000003489 -0.694 5.769 0.011416646 GGPS1
ENSOARG00000006863 -0.727 5.461 0.011420664 AGA
ENSOARG00000007045 0.683 4.723 0.01140482 TAF4B
ENSOARG00000009681 0.883 4.606 0.011404397 RRP12
ENSOARG00000011864 0.954 3.232 0.011403848 PFKL
ENSOARG00000012701 0.755 4.369 0.011410761 CA5B
ENSOARG00000012869 -0.835 3.896 0.011389081 ENSOARG00000016453 0.829 4.061 0.01137515 MAP3K12
ENSOARG00000019222 1.043 4.932 0.011363546 CAD
ENSOARG00000020652 -0.618 7.761 0.011382699 ATL1
ENSOARG00000021144 -0.713 6.031 0.011416753 PPP2R5E
ENSOARG00000008274 -0.745 7.613 0.011434445 HSF2
ENSOARG00000016372 -0.565 7.189 0.011439722 ART3
ENSOARG00000017769 0.723 5.323 0.011440669 CITED1
ENSOARG00000013480 -0.800 6.875 0.011507768 JAK2
ENSOARG00000011888 -0.615 8.824 0.01152282 MAEL
ENSOARG00000007481 -0.664 6.493 0.011541989 RWDD2A
ENSOARG00000016121 -0.577 8.703 0.011548513 MTL5
ENSOARG00000010417 -0.598 7.509 0.011568112 HSF5
ENSOARG00000008511 -0.954 3.961 0.01160355 DENR
ENSOARG00000003862 0.745 4.944 0.011633897 PHLPP2
ENSOARG00000008539 0.796 4.315 0.011637996 GREB1L
ENSOARG00000012141 1.077 2.739 0.01164406 ATXN1

Appendices
239
ENSOARG00000015416 -0.840 5.730 0.011632421 PIBF1
ENSOARG00000017911 -0.809 7.081 0.011636443 TMEM30C
ENSOARG00000001411 0.977 3.593 0.011670748 PRKAB1
ENSOARG00000002400 -0.785 10.036 0.011675058 CCDC88A
ENSOARG00000003647 0.717 3.126 0.011672764 EFNA1
ENSOARG00000002954 0.839 5.841 0.011698908 KAT6A
ENSOARG00000018582 -0.712 6.848 0.011701484 ZNF706
ENSOARG00000017662 -0.917 3.215 0.011738625 ENSOARG00000020246 -0.596 6.763 0.011740502 OSBPL11
ENSOARG00000014528 -0.812 5.781 0.011747845 ENSOARG00000006586 0.744 2.407 0.011761666 PDGFC
ENSOARG00000013437 -0.738 5.737 0.011795629 CDC37L1
ENSOARG00000017748 0.637 5.996 0.011789724 SLC3A2
ENSOARG00000008651 -0.713 4.992 0.011809948 UBE2D2
ENSOARG00000002642 -0.858 6.335 0.011819337 SLIRP
ENSOARG00000007744 -0.745 5.532 0.011833738 CENPW
ENSOARG00000016045 0.705 3.685 0.011827536 NAAA
ENSOARG00000000333 1.225 3.039 0.011905007 ADAMTS7
ENSOARG00000001861 -0.627 7.957 0.011902074 CEP76
ENSOARG00000002703 -0.735 2.598 0.011876261 VEPH1
ENSOARG00000002841 -0.634 6.405 0.011920128 NUP43
ENSOARG00000003199 0.957 3.637 0.011880065 SHC1
ENSOARG00000004075 0.827 6.449 0.011893357 NISCH
ENSOARG00000005768 0.795 3.001 0.011854595 ZNF397
ENSOARG00000006371 -0.640 5.531 0.011915902 ADAMTS6
ENSOARG00000014131 -0.704 6.593 0.011926398 ENSOARG00000014146 -0.708 7.826 0.011886403 PTEN
ENSOARG00000014557 -0.742 6.608 0.011931121 RARS
ENSOARG00000016714 -0.979 4.457 0.011870265 CCDC73
ENSOARG00000017269 0.866 5.400 0.011923891 SCN8A
ENSOARG00000020209 0.914 3.886 0.011895231 CHPF
ENSOARG00000023833 0.963 8.435 0.011877348 SNORD17
ENSOARG00000003508 -0.741 8.624 0.011955832 DHX36
ENSOARG00000016911 0.654 3.279 0.011956784 TTC9C
ENSOARG00000003800 -0.798 6.343 0.011995899 C19orf18
ENSOARG00000004979 0.893 2.442 0.011993048 CTSD
ENSOARG00000018316 0.858 3.045 0.012015378 TMCO6
ENSOARG00000008376 0.696 4.578 0.0120906 KIAA0196
ENSOARG00000005969 0.709 7.618 0.012097171 DST
ENSOARG00000015254 0.646 4.575 0.012110483 FBXO9
ENSOARG00000020746 -0.651 7.623 0.012119124 ENSOARG00000019782 -0.689 5.000 0.012135445 CCNB1IP1
ENSOARG00000007361 -0.635 5.712 0.012176613 ENSOARG00000016778 -0.764 5.514 0.012182268 POLK
ENSOARG00000008787 0.628 5.832 0.012193901 DDX39B
ENSOARG00000008479 0.732 2.655 0.012204726 SUMF1
ENSOARG00000021027 -0.772 7.930 0.012209752 MYEF2
Appendices
240
ENSOARG00000014356 0.955 4.222 0.012305758 HIVEP1
ENSOARG00000018778 -0.829 4.107 0.01232631 CXorf22
ENSOARG00000010908 -0.765 6.940 0.0123414 ERP44
ENSOARG00000021023 -0.674 4.812 0.012337977 ENSOARG00000003581 -0.787 4.892 0.012352778 CMPK1
ENSOARG00000013491 0.747 2.793 0.01236104 GRIA3
ENSOARG00000008241 0.939 2.530 0.012391617 XG
ENSOARG00000014500 -0.682 8.618 0.012390959 CCT8
ENSOARG00000019982 -0.725 4.804 0.012380935 ARHGAP11B
ENSOARG00000018007 0.973 5.018 0.012443644 SLC24A1
ENSOARG00000007109 -0.645 4.762 0.012451968 ELOVL4
ENSOARG00000008705 0.857 5.980 0.012472272 MICAL2
ENSOARG00000012427 0.646 6.390 0.012506926 NUCB1
ENSOARG00000006116 -0.601 6.047 0.012525696 ENSOARG00000021010 -0.604 6.909 0.01255905 SHC4
ENSOARG00000008971 -0.736 9.856 0.012587424 KIF27
ENSOARG00000017241 -0.601 5.677 0.012599252 DNAJC18
ENSOARG00000023720 1.158 4.293 0.012593557 SNORA74
ENSOARG00000002639 0.918 3.234 0.01261956 PIK3C2B
ENSOARG00000021112 -0.779 4.083 0.012639285 TIMM9
ENSOARG00000008814 0.549 5.998 0.012653417 HP1BP3
ENSOARG00000014599 -0.781 5.510 0.012667482 EMC2
ENSOARG00000019257 -0.808 2.839 0.012665369 C3orf52
ENSOARG00000016043 -0.737 7.910 0.012684772 METAP2
ENSOARG00000004929 0.744 5.496 0.012706675 ENSOARG00000014059 0.995 3.746 0.012789265 BNC2
ENSOARG00000014852 -0.776 4.770 0.01278501 BBS10
ENSOARG00000015319 0.928 3.146 0.012791072 KLF11
ENSOARG00000014495 0.790 3.267 0.012801201 ENSOARG00000016738 0.789 3.991 0.01282064 LRCH4
ENSOARG00000003650 -0.781 6.989 0.012874682 C12orf56
ENSOARG00000003971 -0.641 10.192 0.012905907 SPATA6
ENSOARG00000011718 0.587 4.829 0.012927612 DDX26B
ENSOARG00000011894 -0.684 7.905 0.012979157 ATM
ENSOARG00000014339 0.571 5.870 0.012976433 ENSOARG00000005557 -0.649 4.217 0.012987941 ENSOARG00000016119 -0.633 5.716 0.012995291 SLC25A31
ENSOARG00000000725 0.724 2.966 0.013053606 ENSOARG00000003284 -0.845 4.501 0.013050431 FASTKD1
ENSOARG00000004501 1.056 3.456 0.013060416 PCSK7
ENSOARG00000006800 0.785 2.323 0.013075205 ENSOARG00000013603 -0.790 6.261 0.013078966 CACYBP
ENSOARG00000014967 -0.615 7.603 0.013081993 AHI1
ENSOARG00000009517 -0.871 3.515 0.013104216 ENSOARG00000017357 -0.836 4.755 0.013139971 ENSOARG00000010129 0.849 2.086 0.013148047 BACE2
ENSOARG00000007444 0.820 2.997 0.013161394 MRAS

Appendices
241
ENSOARG00000013330 0.804 5.385 0.013176724 DNMBP
ENSOARG00000020068 -0.689 6.198 0.013193384 IQCB1
ENSOARG00000002533 0.617 5.783 0.0132033 VIPAS39
ENSOARG00000017299 -0.571 8.231 0.01320987 TDRD5
ENSOARG00000018277 -0.821 5.005 0.013225799 CD28
ENSOARG00000008213 0.786 4.253 0.013244239 VEZF1
ENSOARG00000012410 1.050 3.678 0.013257773 UNC45A
ENSOARG00000006848 0.678 2.743 0.013302905 ENSOARG00000020374 -0.679 7.960 0.0133254 ACSL3
ENSOARG00000003126 0.691 4.899 0.013405606 PBXIP1
ENSOARG00000011176 -0.846 6.144 0.013427671 TEX36
ENSOARG00000020302 0.957 3.060 0.013466417 VPS18
ENSOARG00000000638 0.840 2.345 0.013488445 CTDSPL
ENSOARG00000006509 0.938 3.310 0.013573855 IGF2BP1
ENSOARG00000009177 -0.750 9.924 0.01356861 ENSOARG00000015785 0.655 6.171 0.013568912 CYFIP1
ENSOARG00000010287 0.720 3.235 0.013609157 FAM213A
ENSOARG00000010576 -0.780 10.008 0.013658921 SP17
ENSOARG00000016835 -0.602 4.848 0.01365545 SLC35B3
ENSOARG00000017608 0.730 4.030 0.0136496 D2HGDH
ENSOARG00000017653 0.880 2.938 0.013682396 FAM117B
ENSOARG00000000757 -0.692 6.698 0.013714712 MYNN
ENSOARG00000002667 -0.869 3.717 0.01371161 KBTBD3
ENSOARG00000017837 -0.723 9.098 0.013715603 TOR1AIP1
ENSOARG00000006151 0.746 3.789 0.013734932 ANKFN1
ENSOARG00000012172 -0.618 6.007 0.013733885 ZNF330
ENSOARG00000017318 0.826 3.924 0.013737593 CTNS
ENSOARG00000000900 -0.608 3.781 0.013769438 GCNT3
ENSOARG00000004033 -0.673 4.560 0.013772796 TMEM5
ENSOARG00000018082 0.946 5.264 0.013758581 SART3
ENSOARG00000019330 -0.661 7.628 0.013765834 SLC35A5
ENSOARG00000012223 -0.777 4.720 0.013789416 SNRPB2
ENSOARG00000009272 0.658 5.201 0.013838945 SLC7A2
ENSOARG00000012669 0.759 2.657 0.013856112 INO80B
ENSOARG00000008766 0.718 3.516 0.01388791 RXRB
ENSOARG00000019386 -0.805 8.296 0.013894936 SMC1B
ENSOARG00000019714 0.581 5.814 0.013906996 METTL17
ENSOARG00000020712 -1.022 4.244 0.01390381 ERP27
ENSOARG00000012371 -0.635 6.799 0.013926566 CEP78
ENSOARG00000008014 0.637 2.661 0.013941354 LRCH1
ENSOARG00000017974 -0.795 5.211 0.013940839 NAA38
ENSOARG00000005538 -0.709 8.518 0.014000355 POLR2B
ENSOARG00000010903 -0.788 7.885 0.013997579 MIER1
ENSOARG00000011233 -0.652 7.940 0.014006465 NCBP1
ENSOARG00000017003 -0.869 3.652 0.014020748 ENSOARG00000020631 0.922 3.450 0.014024392 ABCC5
ENSOARG00000021036 -0.785 5.448 0.014054637 RIIAD1

Appendices
242
ENSOARG00000016355 -0.856 5.932 0.014062074 CCDC112
ENSOARG00000012354 0.592 5.823 0.014071526 PSAT1
ENSOARG00000008420 0.689 4.645 0.014086179 HSD17B10
ENSOARG00000013136 1.006 4.262 0.014099098 PITRM1
ENSOARG00000002727 0.812 6.994 0.014120847 SUPT6H
ENSOARG00000011690 -0.604 7.086 0.014134957 DIABLO
ENSOARG00000012522 0.899 2.550 0.014142542 FOXRED1
ENSOARG00000015629 0.819 4.539 0.014153527 TP53BP2
ENSOARG00000018579 -0.906 8.003 0.01415709 CCDC146
ENSOARG00000000843 -0.831 2.458 0.014190359 ENSOARG00000003856 1.150 2.835 0.014313989 ENSOARG00000000510 -0.718 5.397 0.01434099 IFNGR1
ENSOARG00000011415 0.910 6.224 0.014326526 PRR14L
ENSOARG00000019320 0.757 3.875 0.014340381 ATG16L1
ENSOARG00000007778 -0.572 6.127 0.014406862 ANO5
ENSOARG00000008209 0.563 5.831 0.014419274 FNBP1
ENSOARG00000016223 -0.630 7.539 0.014404594 YTHDC2
ENSOARG00000020244 -0.814 9.838 0.01441548 CAPZA3
ENSOARG00000014646 -0.765 8.204 0.014433244 TBPL1
ENSOARG00000020826 -0.732 5.574 0.014439415 BNIP2
ENSOARG00000011470 -0.624 4.460 0.014446841 RPE65
ENSOARG00000001009 -0.886 2.397 0.014461892 ENSOARG00000019034 0.791 3.119 0.014458805 PRKAG1
ENSOARG00000016040 -0.874 4.455 0.01451444 HECTD2
ENSOARG00000009671 -0.600 7.357 0.014575296 GTF2H1
ENSOARG00000001354 -0.823 5.068 0.014693529 COMMD3
ENSOARG00000003436 0.727 2.554 0.014657429 REXO4
ENSOARG00000007757 0.735 4.137 0.014697548 RBM15B
ENSOARG00000009763 0.907 2.570 0.01468087 PCGF2
ENSOARG00000010269 0.518 5.849 0.014696825 FAM114A1
ENSOARG00000014844 -0.715 7.708 0.014653273 KIF3A
ENSOARG00000017813 -0.902 5.808 0.014675236 MRPL1
ENSOARG00000018057 0.622 4.537 0.01466913 RLIM
ENSOARG00000016598 0.872 4.468 0.014710989 ABL2
ENSOARG00000016728 -0.726 6.651 0.014719134 NUP35
ENSOARG00000007180 0.856 6.597 0.014752987 SRCAP
ENSOARG00000016263 -0.569 9.040 0.014748284 PIWIL1
ENSOARG00000000956 -0.856 2.542 0.014765428 ENSOARG00000019579 -0.710 7.054 0.014768843 ENSOARG00000001809 -0.850 5.758 0.014806557 LARP7
ENSOARG00000016422 -0.620 6.971 0.014817199 EVI5
ENSOARG00000018044 -0.723 5.339 0.014802977 ENSOARG00000019219 0.579 4.729 0.014820587 PSME1
ENSOARG00000020692 -0.751 4.895 0.014800177 MRPL47
ENSOARG00000012232 0.610 7.322 0.014828221 WBSCR22
ENSOARG00000009770 0.723 5.656 0.014839559 DPYSL2
ENSOARG00000018752 -0.618 6.597 0.014849381 MDH1B

Appendices
243
ENSOARG00000010231 -1.054 3.489 0.014886818 MX2
ENSOARG00000004051 0.876 2.562 0.014909412 DVL1
ENSOARG00000003189 -0.620 5.762 0.014996872 INPP5F
ENSOARG00000013462 0.906 2.568 0.015005956 ENSOARG00000006313 0.736 5.229 0.015027087 ALDH18A1
ENSOARG00000010616 -0.877 3.389 0.015026002 ENSOARG00000007681 1.021 4.067 0.01506303 ZNF335
ENSOARG00000015368 -0.874 4.226 0.01507118 ENSOARG00000020991 -0.643 5.437 0.01508626 NRF-2
ENSOARG00000013864 -0.609 7.024 0.015157393 ENSOARG00000005197 1.021 3.060 0.015223147 CLIP3
ENSOARG00000006726 -0.988 3.430 0.015226624 HSPB11
ENSOARG00000008276 -0.754 5.074 0.015205416 ENSOARG00000010161 0.630 4.976 0.015214371 CHMP7
ENSOARG00000012137 -1.015 3.245 0.015203919 CENPQ
ENSOARG00000018612 0.588 4.693 0.015196005 NXPE3
ENSOARG00000007694 0.770 7.440 0.015252345 LAMA3
ENSOARG00000009203 -0.859 9.221 0.015271814 USP1
ENSOARG00000016123 0.810 2.582 0.015257533 ENSOARG00000016164 1.100 2.164 0.015271041 NT5DC3
ENSOARG00000020671 -0.601 7.226 0.015281238 CAB39
ENSOARG00000003004 -0.721 5.134 0.015297153 MND1
ENSOARG00000004704 0.678 4.170 0.01538793 LRIG3
ENSOARG00000006075 0.668 3.116 0.015398277 NLN
ENSOARG00000007314 -0.622 6.963 0.015408465 MIER3
ENSOARG00000011740 -0.633 5.696 0.015370556 LIAS
ENSOARG00000011803 -0.556 7.049 0.015410598 MEDAG
ENSOARG00000012889 -0.659 7.846 0.015375678 CPSF2
ENSOARG00000013173 0.747 4.256 0.015380714 DOCK8
ENSOARG00000016500 -0.670 5.521 0.015390594 ENSOARG00000006082 -0.664 6.863 0.01547227 ENSOARG00000017434 -0.667 7.380 0.015463257 CMYA5
ENSOARG00000020036 0.571 6.484 0.01546784 KIF21A
ENSOARG00000019841 -0.595 7.962 0.01548036 PHTF1
ENSOARG00000004957 0.593 4.702 0.015518475 PRKAR2B
ENSOARG00000020648 -0.650 8.622 0.015516092 KLHL24
ENSOARG00000000488 0.924 4.092 0.015540196 RPTOR
ENSOARG00000004731 -0.840 4.959 0.015603821 ENSOARG00000018772 0.874 3.222 0.015609224 ENSOARG00000015503 -0.884 6.871 0.015625609 KIF20B
ENSOARG00000006699 -0.674 5.072 0.015691483 PSMD14
ENSOARG00000016272 0.806 4.383 0.015698165 GNB2
ENSOARG00000019331 0.697 3.810 0.015693404 SLC22A17
ENSOARG00000004495 -0.748 5.821 0.0157123 HELLS
ENSOARG00000015895 0.648 6.607 0.015717028 PLXNC1
ENSOARG00000007389 0.963 2.468 0.015729169 ENSOARG00000002890 -0.717 8.108 0.015759667 PCMT1

Appendices
244
ENSOARG00000004713 -0.552 7.144 0.015759834 ENSOARG00000006977 0.698 6.549 0.015778974 SETD5
ENSOARG00000001397 0.714 2.748 0.015817032 GPR126
ENSOARG00000010912 -0.630 9.460 0.015850537 PDIA3
ENSOARG00000002309 -0.767 8.554 0.015880423 ENSOARG00000011086 0.844 3.947 0.0158931 ABR
ENSOARG00000016530 0.784 7.412 0.015887559 ZO1
ENSOARG00000009714 -0.626 6.657 0.015913042 ABCE1
ENSOARG00000016339 -0.626 4.883 0.015949084 ZNF214
ENSOARG00000017443 0.638 4.483 0.016027872 PDLIM5
ENSOARG00000014127 0.755 3.411 0.016058001 HLCS
ENSOARG00000020732 -0.736 9.719 0.016051514 SPATA16
ENSOARG00000008132 0.779 6.368 0.016072511 ITPR1
ENSOARG00000002440 -0.968 3.248 0.016159597 ENSOARG00000002998 -0.647 6.076 0.016195493 DDX52
ENSOARG00000003115 1.187 3.381 0.016194522 GALNT2
ENSOARG00000004362 0.931 3.202 0.016123994 KIF1C
ENSOARG00000008448 -0.693 7.127 0.01620574 CAB39L
ENSOARG00000009189 0.788 3.322 0.016160938 DDI2
ENSOARG00000010229 -0.725 6.377 0.016168923 EXOSC8
ENSOARG00000011135 0.817 3.660 0.016148794 ATXN1L
ENSOARG00000012192 -0.650 6.924 0.01613099 FAM126A
ENSOARG00000013802 -0.697 5.936 0.016204191 ENSOARG00000014977 -0.646 6.391 0.01614589 FZD3
ENSOARG00000017648 -0.675 6.189 0.016176258 TXNDC16
ENSOARG00000023519 -0.837 2.847 0.016159523 ENSOARG00000002919 -0.826 5.416 0.016231281 LLPH
ENSOARG00000005710 -0.636 5.902 0.016224992 C11orf82
ENSOARG00000013803 -0.620 3.921 0.016229548 MIS18A
ENSOARG00000013505 0.799 4.615 0.016269181 BCL2L13
ENSOARG00000003383 -0.886 3.191 0.01629111 ASB4
ENSOARG00000005980 -0.603 8.357 0.016296893 TRIM13
ENSOARG00000008193 -0.700 8.504 0.016284232 CEP63
ENSOARG00000001918 0.736 2.630 0.016320705 TK2
ENSOARG00000015932 0.688 4.071 0.016323015 ATP10D
ENSOARG00000015884 0.604 7.115 0.01635627 HELZ
ENSOARG00000017581 0.820 4.762 0.016349757 KDM6B
ENSOARG00000004391 -0.732 6.106 0.016391673 C10orf107
ENSOARG00000009636 -0.713 8.783 0.016404343 BLZF1
ENSOARG00000006823 -0.869 5.742 0.016417669 SUGT1
ENSOARG00000001333 -0.648 6.334 0.016470611 MDM1
ENSOARG00000003163 0.921 5.368 0.016474607 PTPN21
ENSOARG00000012113 -0.715 6.294 0.016490001 UFL1
ENSOARG00000010124 0.822 2.972 0.016500191 MYO1D
ENSOARG00000014090 -0.767 3.657 0.016517066 BTG4
ENSOARG00000003234 -0.724 4.518 0.016587401 C6orf211
ENSOARG00000016729 -0.675 6.705 0.016580375 KIAA0825

Appendices
245
ENSOARG00000009922 -0.602 6.058 0.016611274 C12orf4
ENSOARG00000017271 -0.609 6.728 0.016678736 CSTF3
ENSOARG00000011358 -0.651 8.575 0.016715203 RFC1
ENSOARG00000012785 0.722 3.474 0.016733193 DCPS
ENSOARG00000012880 0.902 3.291 0.016729767 COL6A2
ENSOARG00000015056 0.554 7.791 0.016735099 APP
ENSOARG00000019029 -0.803 6.353 0.016704511 DNAJC2
ENSOARG00000014876 -0.729 8.174 0.016808416 OSBPL8
ENSOARG00000009575 -0.892 5.704 0.016856992 MIS18BP1
ENSOARG00000009848 -0.714 4.999 0.016851838 ENSOARG00000000718 -0.909 2.988 0.016922228 TGDS
ENSOARG00000001384 0.643 4.723 0.016943337 PMS2
ENSOARG00000005526 -0.671 7.292 0.016916614 MCFD2
ENSOARG00000014126 -0.804 5.031 0.016929687 HMMR
ENSOARG00000015515 -0.736 5.990 0.016944968 ARL14EP
ENSOARG00000007130 0.960 7.783 0.016979161 CLSTN1
ENSOARG00000005160 -0.745 8.514 0.016996236 CCDC168
ENSOARG00000012402 0.664 4.015 0.017003726 SRSF9
ENSOARG00000020009 -0.624 8.102 0.017013534 POLQ
ENSOARG00000015288 -0.575 8.363 0.017026148 CNOT10
ENSOARG00000016933 -0.688 5.211 0.017033407 VPS29
ENSOARG00000018256 0.873 3.066 0.017041079 ENSOARG00000005558 0.997 5.903 0.017049499 PKN1
ENSOARG00000007819 0.561 6.258 0.017086662 CALD1
ENSOARG00000015763 -0.750 7.739 0.017105401 USO1
ENSOARG00000002153 -0.653 6.427 0.017128565 YIPF5
ENSOARG00000007849 0.678 3.039 0.017142137 PLEKHB1
ENSOARG00000024340 1.707 11.347 0.017141913 Metazoa_SRP
ENSOARG00000018122 -0.747 5.424 0.017248475 RTCA
ENSOARG00000011501 -0.626 6.307 0.017261865 GRIK2
ENSOARG00000020170 -0.694 8.188 0.017274176 FAM161A
ENSOARG00000012710 -0.702 3.747 0.01731476 ENSOARG00000005719 -0.721 6.846 0.017344815 CDK7
ENSOARG00000008584 -0.686 5.296 0.017333871 TBC1D19
ENSOARG00000013799 -0.958 2.641 0.01734413 SLC25A40
ENSOARG00000004315 0.726 3.132 0.017365685 ACSF2
ENSOARG00000008887 -0.606 9.542 0.017367888 INTS6
ENSOARG00000017866 1.133 3.455 0.017438565 ENSOARG00000017882 0.693 2.837 0.017428236 ENSOARG00000021059 -0.582 9.077 0.017440693 ENSOARG00000001704 0.644 4.354 0.017458707 PLEKHA2
ENSOARG00000003387 -0.666 8.718 0.017501066 UIMC1
ENSOARG00000008537 1.049 4.423 0.017495418 NAV2
ENSOARG00000008928 -0.681 3.814 0.01750607 ENSOARG00000009956 -0.631 5.647 0.017502125 GSTCD
ENSOARG00000003386 -0.678 8.755 0.01753243 ENSOARG00000003742 0.730 2.765 0.017528245
Appendices
246
ENSOARG00000020954 -0.631 8.640 0.017542335 MAPK6
ENSOARG00000011863 0.849 7.943 0.017682419 TLN1
ENSOARG00000018201 0.716 2.391 0.017697914 ARFIP2
ENSOARG00000000664 0.628 6.701 0.017725894 ACSBG1
ENSOARG00000008468 0.755 4.534 0.017783117 EMB
ENSOARG00000008905 -0.637 6.008 0.017779551 ACAD11
ENSOARG00000020937 0.569 5.128 0.017867883 UXS1
ENSOARG00000007186 -0.746 6.608 0.017883537 RWDD4
ENSOARG00000004948 -0.684 7.296 0.017928262 BTF3L4
ENSOARG00000017933 -0.621 6.923 0.017952987 CAGE1
ENSOARG00000020661 -0.753 3.877 0.017961684 ENSOARG00000012638 0.654 6.511 0.018042644 BAZ1B
ENSOARG00000019956 -0.700 6.123 0.018052369 ENSOARG00000012436 -0.752 10.199 0.018083065 CRISP2
ENSOARG00000016520 -0.713 9.412 0.018092785 BZW1
ENSOARG00000016957 0.576 5.922 0.018101919 N4BP1
ENSOARG00000001482 -0.596 4.959 0.018137707 ZNF200
ENSOARG00000003749 0.857 2.447 0.018138606 ZNF154
ENSOARG00000004329 -0.582 9.167 0.018191197 SRP72
ENSOARG00000013588 1.114 3.840 0.018223858 MED25
ENSOARG00000013516 -0.624 6.264 0.018233061 UNC50
ENSOARG00000005979 0.789 3.756 0.01825261 TBC1D10B
ENSOARG00000016332 -0.661 5.431 0.018296083 PGGT1B
ENSOARG00000019513 -1.040 3.559 0.018340019 GRAMD1C
ENSOARG00000020622 0.600 6.242 0.01833779 EPS8
ENSOARG00000014306 -0.715 6.760 0.018350368 CAMLG
ENSOARG00000017694 -0.572 6.873 0.018357133 CLDND1
ENSOARG00000014117 0.694 4.930 0.018434245 BEND4
ENSOARG00000006819 0.645 5.026 0.018465371 RBM33
ENSOARG00000020698 0.650 3.537 0.018464542 ARHGDIB
ENSOARG00000018825 0.902 4.840 0.018481234 FAM160A2
ENSOARG00000013955 -0.644 6.911 0.018490441 H2AFZ
ENSOARG00000013535 0.886 3.823 0.018500457 ITIH5
ENSOARG00000020763 0.693 2.642 0.018561263 GUCY2C
ENSOARG00000005128 0.616 4.124 0.018602955 CDK2AP1
ENSOARG00000008422 0.621 6.144 0.018599587 ENSOARG00000000131 -0.799 9.577 0.018620556 TEX15
ENSOARG00000006746 0.799 3.755 0.018659176 SHKBP1
ENSOARG00000015613 -0.662 5.016 0.018724992 NUP37
ENSOARG00000016001 0.784 2.991 0.018734326 CA8
ENSOARG00000001055 0.721 3.168 0.018760705 RARRES2
ENSOARG00000001261 -0.627 8.163 0.018826436 SPAG1
ENSOARG00000008556 0.732 3.745 0.01893168 RCBTB1
ENSOARG00000019643 0.688 7.223 0.018971456 CHD8
ENSOARG00000019963 0.558 5.387 0.018966168 GJA1
ENSOARG00000009480 -0.644 6.440 0.01900028 PSMG1
ENSOARG00000020673 0.657 4.214 0.019079724 ITM2C
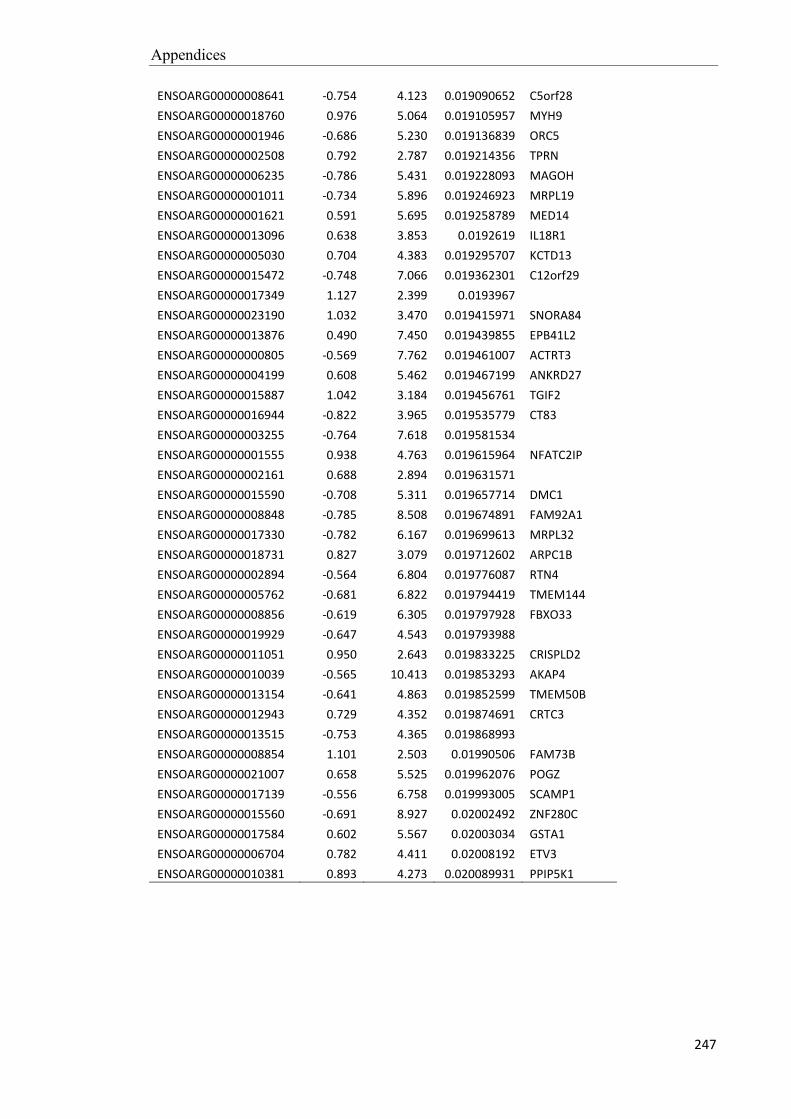
Appendices
247
ENSOARG00000008641 -0.754 4.123 0.019090652 C5orf28
ENSOARG00000018760 0.976 5.064 0.019105957 MYH9
ENSOARG00000001946 -0.686 5.230 0.019136839 ORC5
ENSOARG00000002508 0.792 2.787 0.019214356 TPRN
ENSOARG00000006235 -0.786 5.431 0.019228093 MAGOH
ENSOARG00000001011 -0.734 5.896 0.019246923 MRPL19
ENSOARG00000001621 0.591 5.695 0.019258789 MED14
ENSOARG00000013096 0.638 3.853 0.0192619 IL18R1
ENSOARG00000005030 0.704 4.383 0.019295707 KCTD13
ENSOARG00000015472 -0.748 7.066 0.019362301 C12orf29
ENSOARG00000017349 1.127 2.399 0.0193967 ENSOARG00000023190 1.032 3.470 0.019415971 SNORA84
ENSOARG00000013876 0.490 7.450 0.019439855 EPB41L2
ENSOARG00000000805 -0.569 7.762 0.019461007 ACTRT3
ENSOARG00000004199 0.608 5.462 0.019467199 ANKRD27
ENSOARG00000015887 1.042 3.184 0.019456761 TGIF2
ENSOARG00000016944 -0.822 3.965 0.019535779 CT83
ENSOARG00000003255 -0.764 7.618 0.019581534 ENSOARG00000001555 0.938 4.763 0.019615964 NFATC2IP
ENSOARG00000002161 0.688 2.894 0.019631571 ENSOARG00000015590 -0.708 5.311 0.019657714 DMC1
ENSOARG00000008848 -0.785 8.508 0.019674891 FAM92A1
ENSOARG00000017330 -0.782 6.167 0.019699613 MRPL32
ENSOARG00000018731 0.827 3.079 0.019712602 ARPC1B
ENSOARG00000002894 -0.564 6.804 0.019776087 RTN4
ENSOARG00000005762 -0.681 6.822 0.019794419 TMEM144
ENSOARG00000008856 -0.619 6.305 0.019797928 FBXO33
ENSOARG00000019929 -0.647 4.543 0.019793988 ENSOARG00000011051 0.950 2.643 0.019833225 CRISPLD2
ENSOARG00000010039 -0.565 10.413 0.019853293 AKAP4
ENSOARG00000013154 -0.641 4.863 0.019852599 TMEM50B
ENSOARG00000012943 0.729 4.352 0.019874691 CRTC3
ENSOARG00000013515 -0.753 4.365 0.019868993 ENSOARG00000008854 1.101 2.503 0.01990506 FAM73B
ENSOARG00000021007 0.658 5.525 0.019962076 POGZ
ENSOARG00000017139 -0.556 6.758 0.019993005 SCAMP1
ENSOARG00000015560 -0.691 8.927 0.02002492 ZNF280C
ENSOARG00000017584 0.602 5.567 0.02003034 GSTA1
ENSOARG00000006704 0.782 4.411 0.02008192 ETV3
ENSOARG00000010381 0.893 4.273 0.020089931 PPIP5K1

Appendices
248
Appendix Table 7.2. The 10 most related function clusters of differentially expressed mRNAs by DAVID analysis. The lower p value indicates greater relevance.
Cluster Number Term PValue
1 Cell cycle 6.34E-07
1 Cell cycle process 9.66E-07
1 Cell cycle phase 2.23E-06
1 M phase 2.38E-06
1 Mitotic cell cycle 5.08E-04
1 Nuclear division 5.40E-03
1 Mitosis 5.40E-03
1 M phase of mitotic cell cycle 7.09E-03
1 Cell division 8.12E-03
1 Organelle fission 9.81E-03
2 Spermatid development 1.02E-04
2 Spermatid differentiation 1.98E-04
2 Reproductive cellular process 5.26E-03
2 Germ cell development 1.37E-02
2 Reproductive developmental process 2.37E-02
3 Sexual reproduction 6.03E-04
3 Male gamete generation 7.12E-04
3 Spermatogenesis 7.12E-04
3 Reproduction 8.46E-04
3 Reproductive process 1.02E-03
3 Reproductive cellular process 5.26E-03
3 Gamete generation 5.94E-03
3 Reproductive process in a multicellular organism 1.44E-02
3 Multicellular organism reproduction 1.44E-02
3 Reproductive developmental process 2.37E-02
4 Regulation of DNA replication 4.31E-05
4 Regulation of DNA metabolic process 3.77E-04
4 Positive regulation of DNA replication 1.35E-02
4 Negative regulation of DNA replication 1.35E-02
4 Positive regulation of DNA metabolic process 1.47E-02
4 Negative regulation of DNA metabolic process 7.11E-02
5 Signal complex assembly 2.49E-03
5 Receptor clustering 4.12E-03
5 Receptor metabolic process 2.34E-02
6 Chromosome organization 1.34E-04
6 Covalent chromatin modification 2.81E-04
6 Histone modification 4.21E-04
6 Chromatin modification 6.59E-04
6 Chromatin organization 1.48E-02
6 Protein amino acid acetylation 2.25E-02
6 Histone acetylation 3.43E-02
6 Protein amino acid acylation 5.42E-02
6 Histone H2A acetylation 9.78E-02
6 Histone H4 acetylation 2.93E-01

Appendices
249
7 Macromolecule localization 2.37E-04
7 Protein localization 4.74E-04
7 Establishment of protein localization 1.35E-03
7 Protein transport 1.50E-03
7 Intracellular transport 1.81E-03
7 Establishment of localization in cell 3.80E-03
7 Cellular localization 5.47E-03
7 Cellular protein localization 5.49E-02
7 Cellular macromolecule localization 6.08E-02
7 Establishment of localization 6.45E-02
7 Transport 6.76E-02
7 Localization 7.36E-02
7 Intracellular protein transport 7.80E-02
8 Peptidyl-amino acid modification 5.26E-03
8 Peptidyl-tyrosine phosphorylation 9.71E-03
8 Peptidyl-tyrosine modification 1.31E-02
9 Cellular component assembly 1.19E-04
9 Cellular component biogenesis 1.38E-03
9 Protein complex biogenesis 4.40E-03
9 Protein complex assembly 4.40E-03
9 Macromolecular complex subunit organization 3.41E-02
9 Macromolecular complex assembly 4.91E-02
9 Cellular macromolecular complex subunit organization 3.72E-01
9 Cellular macromolecular complex assembly 5.40E-01
10 Positive regulation of cell communication 7.57E-03
10 Positive regulation of I-kappaB kinase/NF-kappaB cascade 9.26E-03
10 Regulation of signal transduction 1.25E-02
10 Positive regulation of signal transduction 1.31E-02
10 Regulation of cell communication 1.92E-02
10 Regulation of I-kappaB kinase/NF-kappaB cascade 2.33E-02
10 Positive regulation of protein kinase cascade 2.56E-02
10 Regulation of protein kinase cascade 1.02E-01
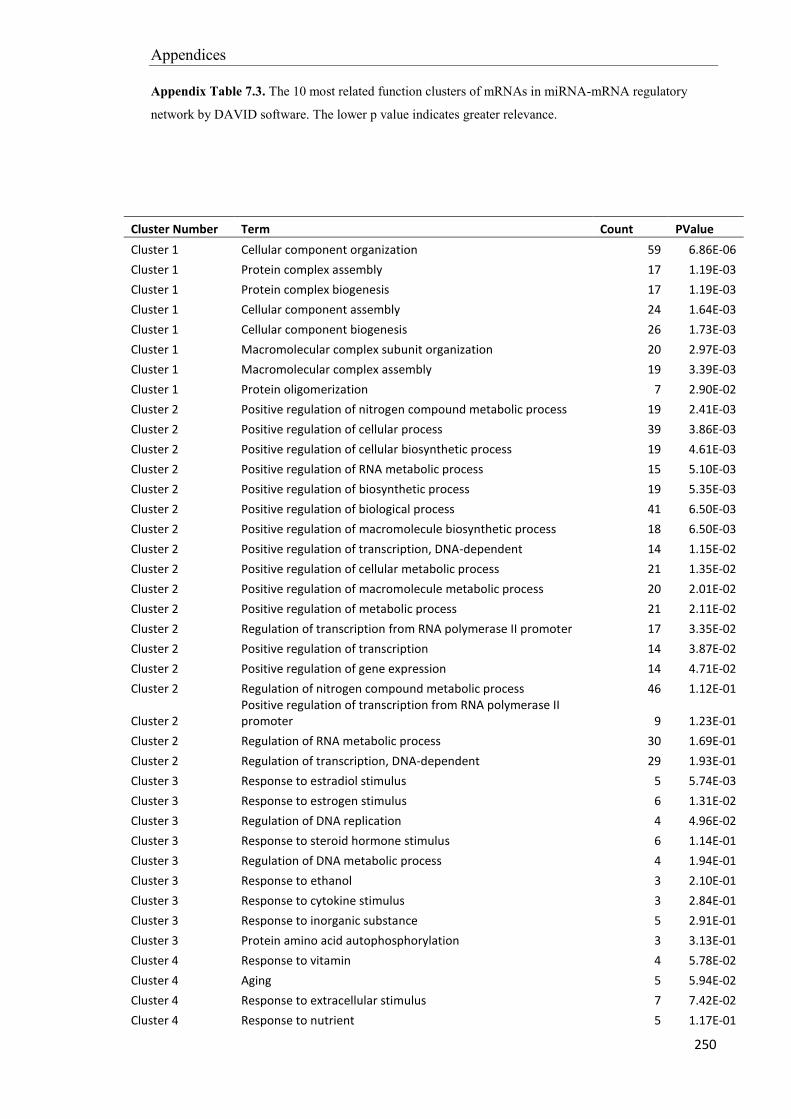
Appendices
250
Appendix Table 7.3. The 10 most related function clusters of mRNAs in miRNA-mRNA regulatory
network by DAVID software. The lower p value indicates greater relevance.
Cluster Number Term Count PValue
Cluster 1 Cellular component organization 59 6.86E-06
Cluster 1 Protein complex assembly 17 1.19E-03
Cluster 1 Protein complex biogenesis 17 1.19E-03
Cluster 1 Cellular component assembly 24 1.64E-03
Cluster 1 Cellular component biogenesis 26 1.73E-03
Cluster 1 Macromolecular complex subunit organization 20 2.97E-03
Cluster 1 Macromolecular complex assembly 19 3.39E-03
Cluster 1 Protein oligomerization 7 2.90E-02
Cluster 2 Positive regulation of nitrogen compound metabolic process 19 2.41E-03
Cluster 2 Positive regulation of cellular process 39 3.86E-03
Cluster 2 Positive regulation of cellular biosynthetic process 19 4.61E-03
Cluster 2 Positive regulation of RNA metabolic process 15 5.10E-03
Cluster 2 Positive regulation of biosynthetic process 19 5.35E-03
Cluster 2 Positive regulation of biological process 41 6.50E-03
Cluster 2 Positive regulation of macromolecule biosynthetic process 18 6.50E-03
Cluster 2 Positive regulation of transcription, DNA-dependent 14 1.15E-02
Cluster 2 Positive regulation of cellular metabolic process 21 1.35E-02
Cluster 2 Positive regulation of macromolecule metabolic process 20 2.01E-02
Cluster 2 Positive regulation of metabolic process 21 2.11E-02
Cluster 2 Regulation of transcription from RNA polymerase II promoter 17 3.35E-02
Cluster 2 Positive regulation of transcription 14 3.87E-02
Cluster 2 Positive regulation of gene expression 14 4.71E-02
Cluster 2 Regulation of nitrogen compound metabolic process 46 1.12E-01
Cluster 2 Positive regulation of transcription from RNA polymerase II promoter 9 1.23E-01
Cluster 2 Regulation of RNA metabolic process 30 1.69E-01
Cluster 2 Regulation of transcription, DNA-dependent 29 1.93E-01
Cluster 3 Response to estradiol stimulus 5 5.74E-03
Cluster 3 Response to estrogen stimulus 6 1.31E-02
Cluster 3 Regulation of DNA replication 4 4.96E-02
Cluster 3 Response to steroid hormone stimulus 6 1.14E-01
Cluster 3 Regulation of DNA metabolic process 4 1.94E-01
Cluster 3 Response to ethanol 3 2.10E-01
Cluster 3 Response to cytokine stimulus 3 2.84E-01
Cluster 3 Response to inorganic substance 5 2.91E-01
Cluster 3 Protein amino acid autophosphorylation 3 3.13E-01
Cluster 4 Response to vitamin 4 5.78E-02
Cluster 4 Aging 5 5.94E-02
Cluster 4 Response to extracellular stimulus 7 7.42E-02
Cluster 4 Response to nutrient 5 1.17E-01
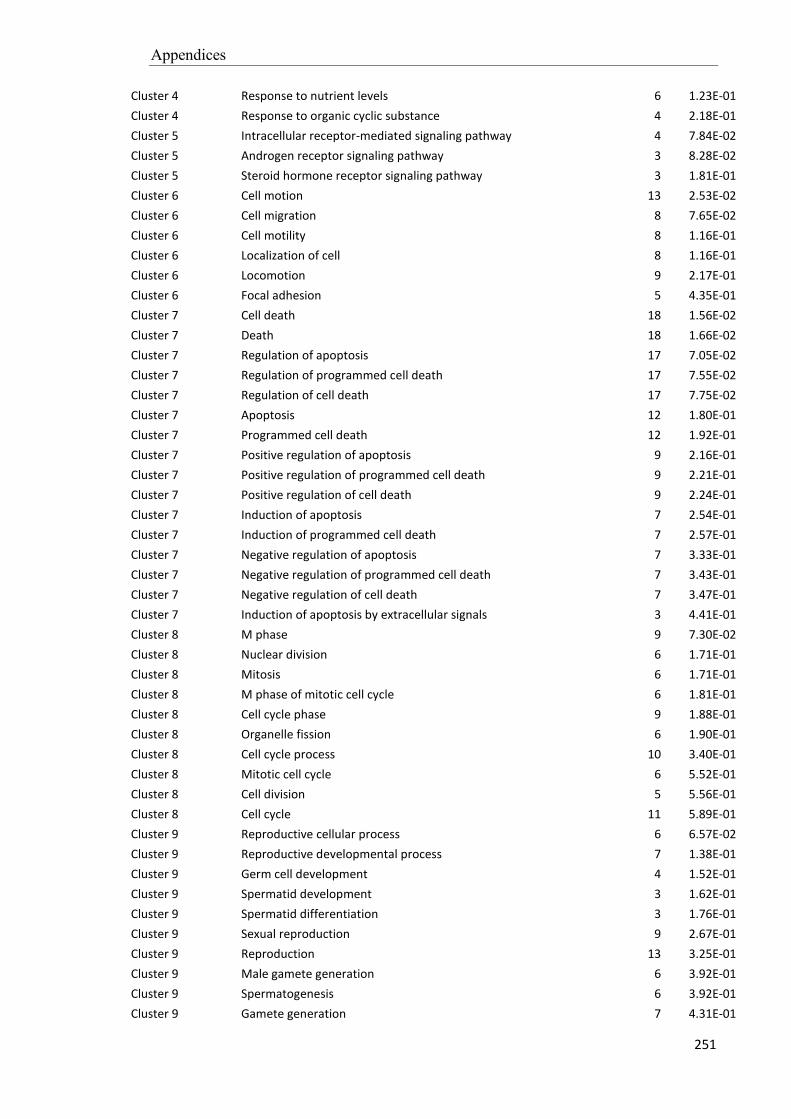
Appendices
251
Cluster 4 Response to nutrient levels 6 1.23E-01
Cluster 4 Response to organic cyclic substance 4 2.18E-01
Cluster 5 Intracellular receptor-mediated signaling pathway 4 7.84E-02
Cluster 5 Androgen receptor signaling pathway 3 8.28E-02
Cluster 5 Steroid hormone receptor signaling pathway 3 1.81E-01
Cluster 6 Cell motion 13 2.53E-02
Cluster 6 Cell migration 8 7.65E-02
Cluster 6 Cell motility 8 1.16E-01
Cluster 6 Localization of cell 8 1.16E-01
Cluster 6 Locomotion 9 2.17E-01
Cluster 6 Focal adhesion 5 4.35E-01
Cluster 7 Cell death 18 1.56E-02
Cluster 7 Death 18 1.66E-02
Cluster 7 Regulation of apoptosis 17 7.05E-02
Cluster 7 Regulation of programmed cell death 17 7.55E-02
Cluster 7 Regulation of cell death 17 7.75E-02
Cluster 7 Apoptosis 12 1.80E-01
Cluster 7 Programmed cell death 12 1.92E-01
Cluster 7 Positive regulation of apoptosis 9 2.16E-01
Cluster 7 Positive regulation of programmed cell death 9 2.21E-01
Cluster 7 Positive regulation of cell death 9 2.24E-01
Cluster 7 Induction of apoptosis 7 2.54E-01
Cluster 7 Induction of programmed cell death 7 2.57E-01
Cluster 7 Negative regulation of apoptosis 7 3.33E-01
Cluster 7 Negative regulation of programmed cell death 7 3.43E-01
Cluster 7 Negative regulation of cell death 7 3.47E-01
Cluster 7 Induction of apoptosis by extracellular signals 3 4.41E-01
Cluster 8 M phase 9 7.30E-02
Cluster 8 Nuclear division 6 1.71E-01
Cluster 8 Mitosis 6 1.71E-01
Cluster 8 M phase of mitotic cell cycle 6 1.81E-01
Cluster 8 Cell cycle phase 9 1.88E-01
Cluster 8 Organelle fission 6 1.90E-01
Cluster 8 Cell cycle process 10 3.40E-01
Cluster 8 Mitotic cell cycle 6 5.52E-01
Cluster 8 Cell division 5 5.56E-01
Cluster 8 Cell cycle 11 5.89E-01
Cluster 9 Reproductive cellular process 6 6.57E-02
Cluster 9 Reproductive developmental process 7 1.38E-01
Cluster 9 Germ cell development 4 1.52E-01
Cluster 9 Spermatid development 3 1.62E-01
Cluster 9 Spermatid differentiation 3 1.76E-01
Cluster 9 Sexual reproduction 9 2.67E-01
Cluster 9 Reproduction 13 3.25E-01
Cluster 9 Male gamete generation 6 3.92E-01
Cluster 9 Spermatogenesis 6 3.92E-01
Cluster 9 Gamete generation 7 4.31E-01

Appendices
252
Cluster 9 Reproductive process 12 4.36E-01
Cluster 9 Multicellular organism reproduction 7 6.34E-01
Cluster 9 Reproductive process in a multicellular organism 7 6.34E-01
Cluster 10 Reproductive developmental process 7 1.38E-01
Cluster 10 Development of primary sexual characteristics 3 5.06E-01
Cluster 10 Sex differentiation 3 6.00E-01

Appendices
253
Appendix Table 7.4. The differences of Percentage Splicing Index (PSI) in testis from sheep fed a low or
high diet (N = 8 for each treatment).
Symbol AS_event_type Chromosome High diet Low diet P value
TRA2B coord_cassette chr1 46.47 40.02 0.000
NDUFV3 cassette chr1 21.23 51.30 0.001
CC2D1B alternative_acceptor chr1 2.43 8.87 0.002
GOLGB1 cassette chr1 96.78 84.67 0.003
DCAF6 alternative_first_exon chr1 80.29 87.61 0.003
MIER1 alternative_acceptor chr1 71.36 54.16 0.003
OPA1 cassette chr1 52.92 35.43 0.003
GMPS cassette chr1 96.65 99.49 0.005
SEC62 alternative_donor chr1 22.87 6.94 0.005
TBC1D23 cassette chr1 24.55 38.01 0.005
NA alternative_acceptor chr1 1.09 3.93 0.006
ATP11B alternative_donor chr1 9.56 4.33 0.007
CFAP45 alternative_donor chr1 3.72 1.05 0.007
GOLGB1 cassette chr1 44.61 59.78 0.007
CFAP44 alternative_acceptor chr1 3.18 0.00 0.007
ST7L cassette chr1 64.05 74.00 0.007
USP24 alternative_donor chr1 0.58 4.71 0.008
ALDH9A1 alternative_donor chr1 1.89 8.36 0.008
GPSM2 alternative_first_exon chr1 94.29 88.44 0.008
DGKD alternative_donor chr1 0.94 3.92 0.008
NA alternative_acceptor chr1 2.03 4.35 0.010
LRRC40 alternative_donor chr1 2.43 7.99 0.010
ARHGAP29 alternative_acceptor chr1 93.15 98.46 0.011
TTC4 alternative_first_exon chr1 11.50 6.40 0.011
CHMP2B alternative_acceptor chr1 3.42 6.87 0.012
FXR1 alternative_first_exon chr1 10.38 1.76 0.012
ENSOARG00000002284 alternative_last_exon chr1 57.22 31.11 0.013
CRYBG3 alternative_donor chr1 5.79 11.30 0.013
FUBP1 alternative_acceptor chr1 18.37 11.59 0.013
SPATA16 cassette chr1 74.71 81.39 0.015
ENSOARG00000000941 alternative_acceptor chr1 0.62 2.97 0.015
ENSOARG00000019579 coord_cassette chr1 96.12 98.03 0.016
GPSM2 alternative_first_exon chr1 5.71 11.15 0.016
DCAF6 cassette chr1 0.95 3.18 0.019
RPRD2 cassette chr1 44.12 53.90 0.019
CDV3 alternative_donor chr1 1.55 3.80 0.020
MACF1 alternative_donor chr1 4.34 0.73 0.020
MGST3 alternative_donor chr1 28.45 69.44 0.020
NUP210L cassette chr1 95.90 100.00 0.022
MINA alternative_donor chr1 1.16 4.86 0.022
PRPF3 alternative_acceptor chr1 3.59 7.15 0.022
RYK cassette chr1 99.79 95.57 0.023
VPS8 alternative_donor chr1 6.67 1.77 0.024

Appendices
254
MRPS6 alternative_first_exon chr1 29.55 18.09 0.024
SLC9C1 cassette chr1 98.34 100.00 0.024
NRD1 alternative_acceptor chr1 1.01 3.30 0.025
KAT2B alternative_last_exon chr1 20.82 36.36 0.025
RBM44 alternative_acceptor chr1 1.96 0.00 0.026
RAB5A cassette chr1 98.63 92.94 0.026
DR1 alternative_donor chr1 1.16 2.99 0.027
PSMD4 alternative_donor chr1 7.16 4.88 0.027
BBX cassette chr1 9.70 15.72 0.027
NIT2 alternative_donor chr1 4.61 11.10 0.027
ATP2C1 alternative_donor chr1 1.20 2.88 0.028
KAT2B alternative_donor chr1 1.72 4.14 0.028
BTF3L4 alternative_acceptor chr1 4.05 7.15 0.028
SEC22A cassette chr1 90.27 98.04 0.029
PPM1J alternative_last_exon chr1 65.63 44.56 0.030
UAP1 alternative_donor chr1 90.44 94.86 0.031
SPATA16 cassette chr1 32.68 25.74 0.032
TPM3 alternative_acceptor chr1 59.41 40.37 0.032
EPS15 cassette chr1 95.71 99.55 0.032
SMC4 alternative_donor chr1 2.92 10.36 0.032
DCAF6 alternative_donor chr1 1.36 3.77 0.033
BBX alternative_first_exon chr1 26.65 7.54 0.033
ENSOARG00000001661 alternative_donor chr1 5.67 2.49 0.033
SPATA6 alternative_donor chr1 29.61 34.73 0.034
CRYZL1 alternative_donor chr1 3.44 7.39 0.034
LRRIQ3 alternative_first_exon chr1 4.87 15.10 0.036
MACF1 alternative_donor chr1 94.32 97.68 0.036
SETD4 alternative_donor chr1 2.09 7.58 0.037
FXR1 cassette chr1 90.93 87.55 0.037
HIPK1 alternative_last_exon chr1 70.92 58.00 0.037
UBAP2L alternative_donor chr1 8.85 4.28 0.037
PEX11B alternative_last_exon chr1 100.00 97.95 0.038
TBC1D5 alternative_donor chr1 5.47 10.48 0.038
COPA intron_retention chr1 6.33 13.44 0.039
DNAJB4 alternative_first_exon chr1 96.59 98.91 0.039
U2SURP cassette chr1 95.35 90.09 0.039
KALRN alternative_first_exon chr1 28.50 17.24 0.039
SCAMP3 alternative_acceptor chr1 0.37 3.86 0.039
HIPK1 cassette chr1 94.32 98.30 0.039
LRP8 alternative_acceptor chr1 6.38 9.42 0.039
THRAP3 alternative_donor chr1 15.21 8.86 0.040
SENP2 alternative_acceptor chr1 3.34 5.24 0.041
TF cassette chr1 100.00 97.10 0.042
SERBP1 alternative_acceptor chr1 33.19 27.85 0.042
TBC1D5 alternative_donor chr1 2.44 5.28 0.042
ATP13A3 cassette chr1 17.82 34.22 0.043
KPNA1 alternative_acceptor chr1 21.19 12.09 0.043
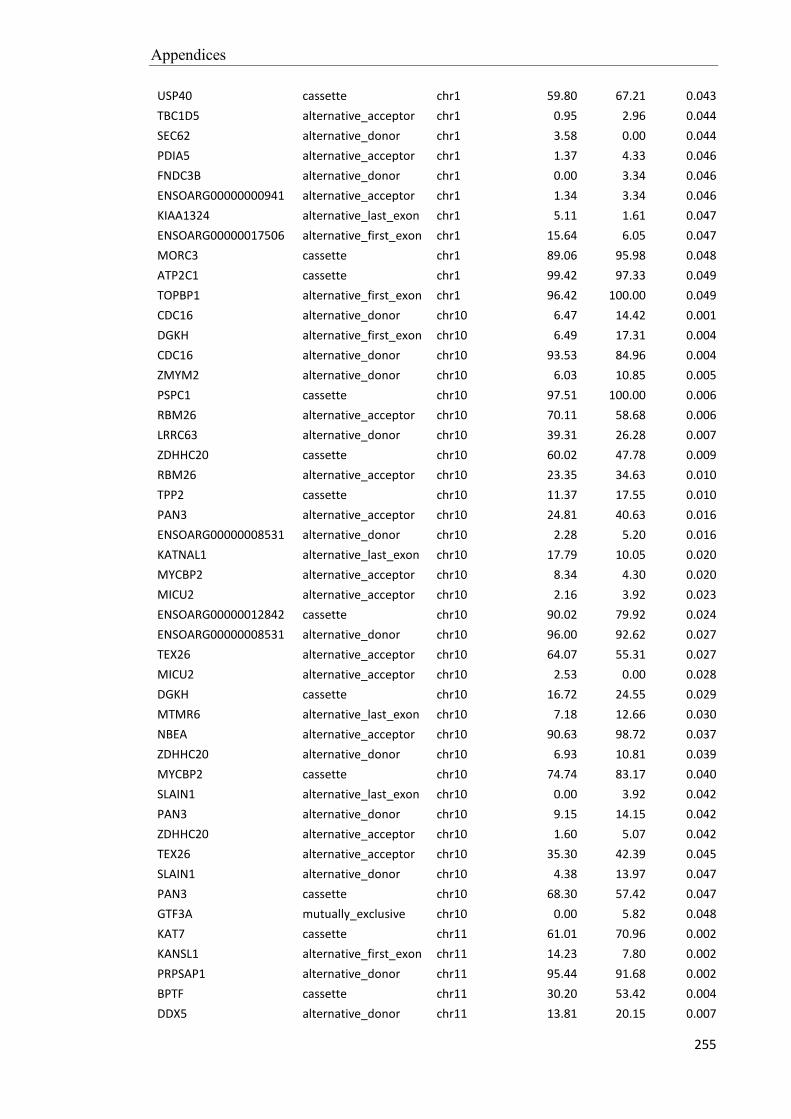
Appendices
255
USP40 cassette chr1 59.80 67.21 0.043
TBC1D5 alternative_acceptor chr1 0.95 2.96 0.044
SEC62 alternative_donor chr1 3.58 0.00 0.044
PDIA5 alternative_acceptor chr1 1.37 4.33 0.046
FNDC3B alternative_donor chr1 0.00 3.34 0.046
ENSOARG00000000941 alternative_acceptor chr1 1.34 3.34 0.046
KIAA1324 alternative_last_exon chr1 5.11 1.61 0.047
ENSOARG00000017506 alternative_first_exon chr1 15.64 6.05 0.047
MORC3 cassette chr1 89.06 95.98 0.048
ATP2C1 cassette chr1 99.42 97.33 0.049
TOPBP1 alternative_first_exon chr1 96.42 100.00 0.049
CDC16 alternative_donor chr10 6.47 14.42 0.001
DGKH alternative_first_exon chr10 6.49 17.31 0.004
CDC16 alternative_donor chr10 93.53 84.96 0.004
ZMYM2 alternative_donor chr10 6.03 10.85 0.005
PSPC1 cassette chr10 97.51 100.00 0.006
RBM26 alternative_acceptor chr10 70.11 58.68 0.006
LRRC63 alternative_donor chr10 39.31 26.28 0.007
ZDHHC20 cassette chr10 60.02 47.78 0.009
RBM26 alternative_acceptor chr10 23.35 34.63 0.010
TPP2 cassette chr10 11.37 17.55 0.010
PAN3 alternative_acceptor chr10 24.81 40.63 0.016
ENSOARG00000008531 alternative_donor chr10 2.28 5.20 0.016
KATNAL1 alternative_last_exon chr10 17.79 10.05 0.020
MYCBP2 alternative_acceptor chr10 8.34 4.30 0.020
MICU2 alternative_acceptor chr10 2.16 3.92 0.023
ENSOARG00000012842 cassette chr10 90.02 79.92 0.024
ENSOARG00000008531 alternative_donor chr10 96.00 92.62 0.027
TEX26 alternative_acceptor chr10 64.07 55.31 0.027
MICU2 alternative_acceptor chr10 2.53 0.00 0.028
DGKH cassette chr10 16.72 24.55 0.029
MTMR6 alternative_last_exon chr10 7.18 12.66 0.030
NBEA alternative_acceptor chr10 90.63 98.72 0.037
ZDHHC20 alternative_donor chr10 6.93 10.81 0.039
MYCBP2 cassette chr10 74.74 83.17 0.040
SLAIN1 alternative_last_exon chr10 0.00 3.92 0.042
PAN3 alternative_donor chr10 9.15 14.15 0.042
ZDHHC20 alternative_acceptor chr10 1.60 5.07 0.042
TEX26 alternative_acceptor chr10 35.30 42.39 0.045
SLAIN1 alternative_donor chr10 4.38 13.97 0.047
PAN3 cassette chr10 68.30 57.42 0.047
GTF3A mutually_exclusive chr10 0.00 5.82 0.048
KAT7 cassette chr11 61.01 70.96 0.002
KANSL1 alternative_first_exon chr11 14.23 7.80 0.002
PRPSAP1 alternative_donor chr11 95.44 91.68 0.002
BPTF cassette chr11 30.20 53.42 0.004
DDX5 alternative_donor chr11 13.81 20.15 0.007

Appendices
256
MED13 alternative_donor chr11 3.52 1.08 0.007
ALKBH5 alternative_acceptor chr11 1.98 4.34 0.008
TADA2A alternative_donor chr11 88.25 80.66 0.009
NDEL1 alternative_last_exon chr11 29.48 14.54 0.009
TADA2A alternative_donor chr11 5.73 10.42 0.010
MFSD11 alternative_donor chr11 2.53 5.56 0.010
ENSOARG00000015593 alternative_first_exon chr11 69.63 58.24 0.010
ULK2 alternative_donor chr11 5.29 8.55 0.011
GPATCH8 alternative_acceptor chr11 67.17 77.13 0.011
NT5C cassette chr11 90.14 99.53 0.011
ENSOARG00000011009 alternative_acceptor chr11 16.86 10.76 0.014
SAP30BP alternative_first_exon chr11 0.93 6.07 0.014
EXOC7 coord_cassette chr11 80.53 67.72 0.014
TOM1L1 coord_cassette chr11 70.19 79.53 0.017
TADA2A alternative_donor chr11 6.02 8.92 0.018
NA alternative_first_exon chr11 13.12 20.73 0.019
CAMTA2 alternative_donor chr11 0.00 3.43 0.021
SMURF2 alternative_donor chr11 1.41 4.29 0.021
PRPSAP1 alternative_donor chr11 3.06 5.09 0.022
MFSD11 alternative_acceptor chr11 6.58 12.66 0.024
RAD51C alternative_donor chr11 4.73 14.89 0.025
HELZ alternative_acceptor chr11 24.83 16.33 0.026
LSM12 cassette chr11 96.95 99.15 0.026
NUP88 alternative_acceptor chr11 3.27 6.75 0.026
TTLL6 cassette chr11 91.90 98.37 0.026
TOM1L1 cassette chr11 58.61 71.36 0.026
ZNF207 alternative_donor chr11 5.64 11.68 0.027
TIMM22 alternative_donor chr11 4.12 8.66 0.028
SYNRG alternative_acceptor chr11 89.31 77.76 0.029
LRRC46 alternative_acceptor chr11 91.75 96.53 0.030
HSF5 alternative_acceptor chr11 91.98 94.43 0.030
SRSF1 alternative_acceptor chr11 4.25 5.92 0.030
ENSOARG00000017636 alternative_acceptor chr11 3.24 0.57 0.031
DNAJC7 alternative_donor chr11 1.77 3.64 0.032
ACOX1 cassette chr11 66.41 80.87 0.033
40238 cassette chr11 98.87 95.89 0.033
SRSF1 alternative_acceptor chr11 95.52 93.72 0.034
ENSOARG00000015593 alternative_donor chr11 9.29 4.16 0.035
SPAG9 intron_retention chr11 3.74 0.18 0.036
NFE2L1 cassette chr11 36.78 27.35 0.037
SOCS7 alternative_acceptor chr11 10.10 6.69 0.037
SPEM1 alternative_first_exon chr11 18.05 20.64 0.038
DNAJC7 alternative_acceptor chr11 5.53 13.96 0.039
GPATCH8 alternative_acceptor chr11 26.03 19.76 0.039
KIAA0100 intron_retention chr11 14.61 27.79 0.040
ALKBH5 alternative_acceptor chr11 3.42 5.52 0.040
UTP18 cassette chr11 94.62 100.00 0.041

Appendices
257
MAPT cassette chr11 4.14 0.70 0.042
ZPBP2 alternative_donor chr11 2.13 4.33 0.042
NBR1 alternative_donor chr11 97.84 94.18 0.042
ENSOARG00000011009 alternative_acceptor chr11 11.99 19.76 0.042
PTGES3L-AARSD1 alternative_first_exon chr11 0.77 3.59 0.044
PSME3 alternative_first_exon chr11 78.61 69.68 0.047
TRIM37 alternative_acceptor chr11 6.06 4.20 0.048
ZSWIM7 alternative_donor chr11 21.72 26.21 0.048
YPEL2 alternative_first_exon chr11 95.25 85.52 0.048
GOSR1 alternative_donor chr11 1.50 5.88 0.048
NBR1 alternative_donor chr11 0.62 2.40 0.048
CDC27 alternative_acceptor chr11 8.40 3.85 0.049
GPATCH8 alternative_acceptor chr11 6.80 3.11 0.050
GPATCH8 alternative_donor chr11 17.36 12.64 0.050
C1orf101 cassette chr12 93.96 99.07 0.000
ETNK2 alternative_acceptor chr12 0.84 5.13 0.002
NVL cassette chr12 88.35 97.00 0.002
TRMT1L alternative_first_exon chr12 99.22 87.86 0.003
RGL1 cassette chr12 81.60 93.95 0.007
NVL alternative_donor chr12 1.85 4.93 0.008
RABGAP1L alternative_first_exon chr12 64.40 40.14 0.011
VPS13D alternative_acceptor chr12 4.97 9.24 0.012
PRRC2C alternative_donor chr12 10.78 22.19 0.015
SMG7 alternative_donor chr12 6.54 2.72 0.017
CEP170 alternative_acceptor chr12 19.36 26.18 0.019
KIF1B cassette chr12 1.31 4.29 0.020
GPATCH2 alternative_donor chr12 16.68 9.90 0.021
AKT3 alternative_donor chr12 2.23 5.44 0.022
UBE2T alternative_acceptor chr12 1.94 3.79 0.022
UCHL5 alternative_acceptor chr12 3.64 6.55 0.025
PRRC2C alternative_donor chr12 11.67 6.36 0.025
CAPN2 alternative_donor chr12 38.34 13.14 0.025
KLHL12 alternative_acceptor chr12 2.51 6.34 0.028
ENSOARG00000016755 cassette chr12 88.46 95.20 0.029
RGL1 alternative_donor chr12 4.38 7.01 0.033
AKT3 cassette chr12 94.28 98.14 0.034
SLC9C2 alternative_last_exon chr12 97.25 94.05 0.036
RPL22 alternative_acceptor chr12 2.17 4.45 0.037
CEP170 alternative_first_exon chr12 64.44 74.82 0.041
CYB5R1 cassette chr12 98.06 95.47 0.043
CDC73 alternative_donor chr12 1.26 3.99 0.043
CAPN2 alternative_first_exon chr12 14.39 8.64 0.045
ENSOARG00000016755 cassette chr12 97.04 99.32 0.047
PPP2R5A alternative_acceptor chr12 97.20 90.78 0.048
CREM alternative_last_exon chr13 5.86 11.89 0.000
SVIL alternative_first_exon chr13 58.50 35.49 0.001
GNAS alternative_first_exon chr13 5.37 1.87 0.002

Appendices
258
NELFCD cassette chr13 78.22 94.55 0.002
NELFCD coord_cassette chr13 87.90 96.86 0.003
ZMYND11 alternative_first_exon chr13 42.58 24.62 0.004
ENSOARG00000017106 cassette chr13 94.20 98.86 0.004
RBM39 intron_retention chr13 61.82 74.86 0.005
USP6NL alternative_donor chr13 4.36 9.88 0.005
RALY alternative_donor chr13 1.57 4.02 0.006
USP6NL alternative_donor chr13 0.57 4.45 0.008
TPD52L2 cassette chr13 91.12 78.75 0.008
SEC23B alternative_donor chr13 9.57 3.84 0.009
PHF20 alternative_donor chr13 27.94 17.82 0.011
RPN2 cassette chr13 56.13 49.29 0.013
PSMF1 alternative_first_exon chr13 6.63 4.01 0.015
ENSOARG00000000526 intron_retention chr13 0.48 3.46 0.018
ZMYND11 cassette chr13 72.12 62.23 0.018
RALY alternative_donor chr13 93.34 88.56 0.018
C20orf194 alternative_donor chr13 0.68 3.78 0.020
RAE1 alternative_acceptor chr13 1.75 4.25 0.025
UQCC1 alternative_acceptor chr13 5.08 10.06 0.026
RALGAPB alternative_first_exon chr13 94.22 97.95 0.028
ARMC3 alternative_donor chr13 74.77 83.05 0.029
ARMC4 cassette chr13 97.07 99.66 0.030
C20orf96 alternative_last_exon chr13 10.06 1.79 0.031
NCOA6 alternative_donor chr13 17.91 9.70 0.031
ANKRD60 alternative_first_exon chr13 7.41 1.80 0.033
ABI1 alternative_donor chr13 93.93 96.62 0.034
CRLS1 alternative_first_exon chr13 6.91 11.84 0.035
WDR37 alternative_acceptor chr13 14.72 19.28 0.036
PTPRA alternative_first_exon chr13 7.12 2.97 0.036
C20orf194 alternative_acceptor chr13 4.06 9.28 0.038
NCOA6 alternative_acceptor chr13 11.74 6.65 0.038
RAE1 alternative_donor chr13 1.65 4.02 0.039
C20orf85 alternative_first_exon chr13 1.38 2.94 0.039
NA alternative_acceptor chr13 3.63 1.10 0.039
CTNNBL1 alternative_last_exon chr13 1.30 7.15 0.042
NCOA5 alternative_acceptor chr13 24.38 18.10 0.045
NDRG3 alternative_acceptor chr13 5.27 6.55 0.046
PTPRA cassette chr13 2.53 9.07 0.046
TM9SF4 alternative_donor chr13 0.75 3.05 0.047
C20orf144 alternative_donor chr13 1.90 0.20 0.047
RBM38 alternative_last_exon chr13 69.26 49.26 0.047
OPTN alternative_acceptor chr13 18.03 10.32 0.047
YWHAB alternative_donor chr13 1.53 3.49 0.048
ADRM1 alternative_donor chr13 12.40 22.52 0.049
ABI1 alternative_donor chr13 4.07 1.79 0.049
HSPA14 alternative_first_exon chr13 2.36 8.61 0.049
UBOX5 cassette chr13 93.17 98.44 0.049
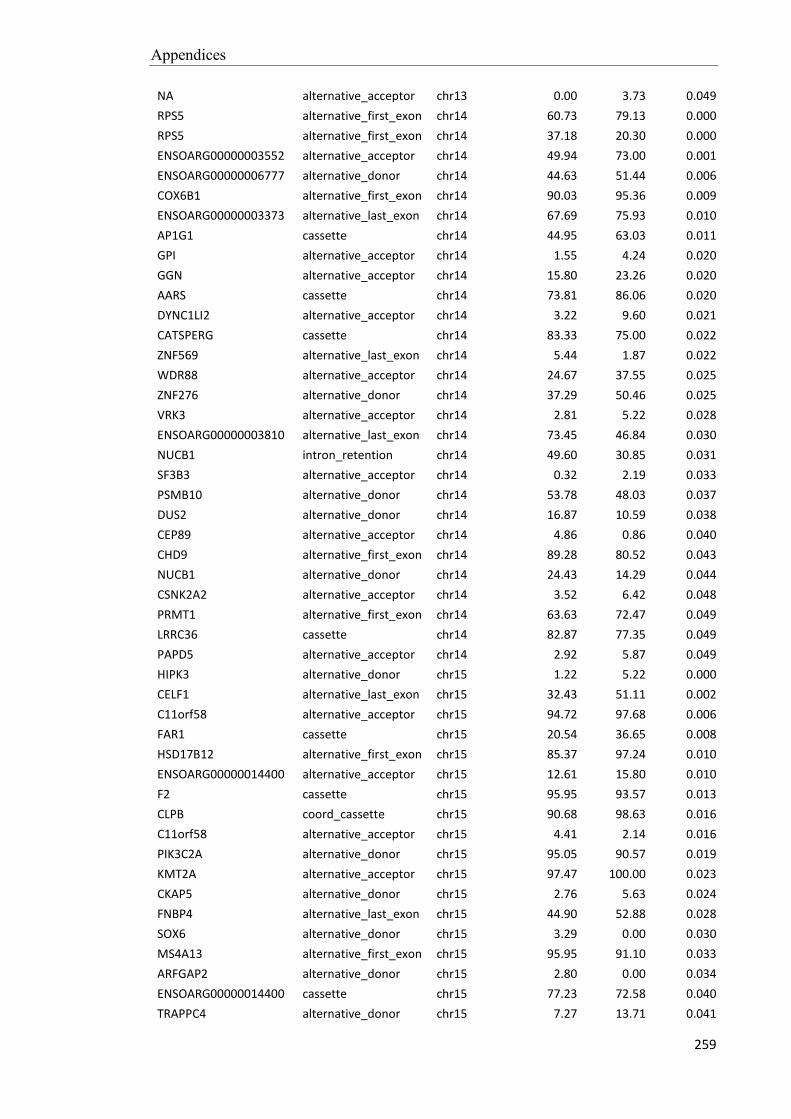
Appendices
259
NA alternative_acceptor chr13 0.00 3.73 0.049
RPS5 alternative_first_exon chr14 60.73 79.13 0.000
RPS5 alternative_first_exon chr14 37.18 20.30 0.000
ENSOARG00000003552 alternative_acceptor chr14 49.94 73.00 0.001
ENSOARG00000006777 alternative_donor chr14 44.63 51.44 0.006
COX6B1 alternative_first_exon chr14 90.03 95.36 0.009
ENSOARG00000003373 alternative_last_exon chr14 67.69 75.93 0.010
AP1G1 cassette chr14 44.95 63.03 0.011
GPI alternative_acceptor chr14 1.55 4.24 0.020
GGN alternative_acceptor chr14 15.80 23.26 0.020
AARS cassette chr14 73.81 86.06 0.020
DYNC1LI2 alternative_acceptor chr14 3.22 9.60 0.021
CATSPERG cassette chr14 83.33 75.00 0.022
ZNF569 alternative_last_exon chr14 5.44 1.87 0.022
WDR88 alternative_acceptor chr14 24.67 37.55 0.025
ZNF276 alternative_donor chr14 37.29 50.46 0.025
VRK3 alternative_acceptor chr14 2.81 5.22 0.028
ENSOARG00000003810 alternative_last_exon chr14 73.45 46.84 0.030
NUCB1 intron_retention chr14 49.60 30.85 0.031
SF3B3 alternative_acceptor chr14 0.32 2.19 0.033
PSMB10 alternative_donor chr14 53.78 48.03 0.037
DUS2 alternative_donor chr14 16.87 10.59 0.038
CEP89 alternative_acceptor chr14 4.86 0.86 0.040
CHD9 alternative_first_exon chr14 89.28 80.52 0.043
NUCB1 alternative_donor chr14 24.43 14.29 0.044
CSNK2A2 alternative_acceptor chr14 3.52 6.42 0.048
PRMT1 alternative_first_exon chr14 63.63 72.47 0.049
LRRC36 cassette chr14 82.87 77.35 0.049
PAPD5 alternative_acceptor chr14 2.92 5.87 0.049
HIPK3 alternative_donor chr15 1.22 5.22 0.000
CELF1 alternative_last_exon chr15 32.43 51.11 0.002
C11orf58 alternative_acceptor chr15 94.72 97.68 0.006
FAR1 cassette chr15 20.54 36.65 0.008
HSD17B12 alternative_first_exon chr15 85.37 97.24 0.010
ENSOARG00000014400 alternative_acceptor chr15 12.61 15.80 0.010
F2 cassette chr15 95.95 93.57 0.013
CLPB coord_cassette chr15 90.68 98.63 0.016
C11orf58 alternative_acceptor chr15 4.41 2.14 0.016
PIK3C2A alternative_donor chr15 95.05 90.57 0.019
KMT2A alternative_acceptor chr15 97.47 100.00 0.023
CKAP5 alternative_donor chr15 2.76 5.63 0.024
FNBP4 alternative_last_exon chr15 44.90 52.88 0.028
SOX6 alternative_donor chr15 3.29 0.00 0.030
MS4A13 alternative_first_exon chr15 95.95 91.10 0.033
ARFGAP2 alternative_donor chr15 2.80 0.00 0.034
ENSOARG00000014400 cassette chr15 77.23 72.58 0.040
TRAPPC4 alternative_donor chr15 7.27 13.71 0.041

Appendices
260
PIK3C2A alternative_acceptor chr15 2.34 6.83 0.045
C11orf65 cassette chr15 58.65 51.19 0.048
WDR70 alternative_donor chr16 3.09 0.00 0.000
ATP6V0E1 alternative_last_exon chr16 14.95 9.56 0.001
TNPO1 alternative_first_exon chr16 8.08 22.99 0.001
WDR70 mutually_exclusive chr16 2.46 0.00 0.005
GPBP1 cassette chr16 28.55 43.93 0.007
PARP8 alternative_acceptor chr16 7.65 14.30 0.008
RAD17 alternative_acceptor chr16 87.23 80.87 0.010
PARP8 alternative_donor chr16 7.00 18.19 0.014
DDX4 cassette chr16 86.53 91.24 0.015
RANBP17 cassette chr16 95.45 100.00 0.027
IPO11 alternative_donor chr16 2.30 4.78 0.030
DDX4 cassette chr16 90.22 93.43 0.035
BDP1 alternative_acceptor chr16 4.60 0.54 0.036
PARP8 alternative_donor chr16 2.83 4.99 0.036
TAF9 alternative_first_exon chr16 4.54 1.73 0.039
ZFR alternative_acceptor chr16 4.11 1.53 0.040
NA alternative_first_exon chr16 5.72 15.56 0.046
SKIV2L2 cassette chr16 95.18 99.29 0.047
LMBRD2 alternative_acceptor chr16 4.19 0.79 0.047
SUDS3 cassette chr17 96.72 100.00 0.001
CIT alternative_donor chr17 5.99 2.89 0.002
CIT alternative_donor chr17 88.70 95.24 0.003
ENSOARG00000010650 alternative_first_exon chr17 0.27 3.58 0.003
GTF2H3 alternative_donor chr17 3.37 7.18 0.010
FGF2 alternative_donor chr17 6.38 4.10 0.011
CIT alternative_donor chr17 5.31 1.86 0.014
PLK4 alternative_acceptor chr17 80.90 74.56 0.015
MMAA alternative_first_exon chr17 5.51 2.01 0.016
ENSOARG00000010650 intron_retention chr17 1.36 5.32 0.017
TTC29 alternative_first_exon chr17 33.53 22.52 0.020
CIT alternative_last_exon chr17 51.92 39.32 0.020
ZCCHC8 coord_cassette chr17 79.26 70.52 0.021
KIAA1109 cassette chr17 23.42 31.45 0.023
KIAA1109 alternative_first_exon chr17 2.67 0.72 0.025
ENSOARG00000007116 alternative_donor chr17 94.53 97.86 0.030
BRAP alternative_donor chr17 20.01 9.15 0.031
AACS alternative_donor chr17 0.28 2.34 0.033
PLK4 alternative_acceptor chr17 94.37 98.91 0.034
NAA15 alternative_donor chr17 4.28 6.91 0.036
GLT1D1 cassette chr17 94.65 97.31 0.037
PGRMC2 alternative_first_exon chr17 21.76 39.16 0.038
MORC2 alternative_acceptor chr17 22.75 14.91 0.040
TTC29 alternative_acceptor chr17 3.99 1.94 0.041
FBXO21 alternative_donor chr17 19.41 9.89 0.042
CDK2AP1 alternative_first_exon chr17 46.67 25.94 0.045

Appendices
261
ENSOARG00000016579 coord_cassette chr18 87.28 78.63 0.000
ARHGAP5 alternative_first_exon chr18 31.26 13.50 0.002
ENSOARG00000016579 cassette chr18 84.96 78.83 0.002
TP53BP1 alternative_acceptor chr18 6.08 1.97 0.002
ACSBG1 alternative_donor chr18 1.18 5.18 0.003
ENSOARG00000016579 cassette chr18 72.35 65.57 0.005
SNPRA1 intron_retention chr18 1.69 14.62 0.009
ACSBG1 alternative_donor chr18 1.18 6.70 0.011
ENSOARG00000014131 alternative_last_exon chr18 95.88 98.46 0.011
SETD3 alternative_acceptor chr18 1.24 3.86 0.015
CERS3 cassette chr18 3.68 6.40 0.016
EAPP alternative_first_exon chr18 13.47 6.81 0.016
CRABP1 alternative_first_exon chr18 16.84 28.89 0.017
ENSOARG00000014576 cassette chr18 46.84 58.93 0.019
UBE3A alternative_acceptor chr18 3.56 1.67 0.020
C15orf26 alternative_donor chr18 14.28 5.95 0.020
MARK3 alternative_donor chr18 5.77 1.75 0.023
SETD3 alternative_donor chr18 3.37 5.12 0.024
ACSBG1 alternative_last_exon chr18 68.85 54.11 0.024
ACSBG1 alternative_last_exon chr18 14.43 21.86 0.024
SETD3 intron_retention chr18 1.44 5.13 0.025
AKAP13 alternative_donor chr18 3.41 8.24 0.027
ENSOARG00000013996 alternative_first_exon chr18 3.08 10.61 0.029
MAN2C1 alternative_donor chr18 15.62 8.56 0.030
ACSBG1 alternative_last_exon chr18 9.22 18.41 0.030
TARSL2 cassette chr18 83.65 91.73 0.035
SETD3 coord_cassette chr18 95.35 99.45 0.036
APOPT1 alternative_acceptor chr18 2.47 0.69 0.042
HECTD1 cassette chr18 91.27 94.72 0.045
NA alternative_last_exon chr18 12.86 5.75 0.045
BAZ1A alternative_donor chr18 2.22 3.57 0.045
BAZ1A alternative_acceptor chr18 93.82 88.82 0.046
CRABP1 alternative_first_exon chr18 68.77 57.75 0.050
PLXNB1 alternative_first_exon chr19 37.95 27.22 0.001
CNBP alternative_donor chr19 73.62 64.40 0.001
GOLGA4 cassette chr19 96.49 89.41 0.001
SMARCC1 alternative_donor chr19 3.62 0.58 0.001
PTPRG alternative_first_exon chr19 34.35 17.12 0.002
DENND6A alternative_acceptor chr19 7.05 1.74 0.002
KIAA1143 alternative_donor chr19 22.17 13.44 0.004
CCDC174 alternative_donor chr19 0.57 2.94 0.005
ENSOARG00000006886 alternative_first_exon chr19 1.67 5.87 0.006
MLH1 alternative_acceptor chr19 2.23 4.78 0.008
PPP4R2 alternative_acceptor chr19 4.08 0.85 0.009
PPP4R2 alternative_first_exon chr19 4.13 0.29 0.010
CCDC37 alternative_acceptor chr19 1.67 3.64 0.012
FANCD2 alternative_acceptor chr19 4.75 1.35 0.012

Appendices
262
LANCL2 alternative_acceptor chr19 98.50 96.47 0.016
DYNC1LI1 cassette chr19 93.00 98.70 0.020
LANCL2 alternative_acceptor chr19 1.50 3.34 0.022
CMTM6 alternative_donor chr19 1.87 5.72 0.023
THUMPD3 alternative_acceptor chr19 97.36 94.74 0.026
LRRFIP2 cassette chr19 7.92 13.53 0.026
PLXNB1 alternative_first_exon chr19 9.84 23.62 0.026
ARL8B alternative_donor chr19 1.63 4.35 0.031
CRELD1 alternative_donor chr19 3.00 0.95 0.033
ENSOARG00000008041 cassette chr19 96.59 100.00 0.039
OXSR1 alternative_acceptor chr19 22.77 13.15 0.039
NCKIPSD cassette chr19 96.49 100.00 0.040
VPRBP alternative_last_exon chr19 90.25 80.56 0.040
CCDC36 alternative_acceptor chr19 3.20 1.17 0.040
NEK4 alternative_acceptor chr19 5.57 8.64 0.041
ITPR1 alternative_first_exon chr19 43.19 23.90 0.042
ENSOARG00000008041 intron_retention chr19 1.87 5.62 0.044
AZI2 cassette chr19 96.29 100.00 0.044
THUMPD3 alternative_donor chr19 1.38 3.71 0.047
NISCH alternative_first_exon chr19 1.19 5.85 0.048
RAD18 alternative_donor chr19 2.50 5.49 0.049
MAP2 cassette chr2 85.61 63.65 0.000
SYK alternative_first_exon chr2 93.30 100.00 0.000
KANK1 cassette chr2 69.97 94.27 0.000
DENND4C alternative_last_exon chr2 26.14 14.78 0.001
H-FABP alternative_acceptor chr2 8.13 22.69 0.002
ENSOARG00000003035 alternative_first_exon chr2 59.09 72.98 0.002
SRRM1 alternative_acceptor chr2 98.52 94.66 0.003
VPS13A cassette chr2 94.53 98.62 0.003
FAM126B cassette chr2 4.07 8.21 0.004
MFF cassette chr2 6.89 14.84 0.005
C9orf43 alternative_donor chr2 8.68 13.67 0.006
SPATA6L alternative_acceptor chr2 41.42 51.34 0.006
SPATA6L alternative_acceptor chr2 58.59 48.67 0.006
GKAP1 cassette chr2 97.55 100.00 0.006
MTFR1L alternative_acceptor chr2 3.51 8.75 0.006
CLASP1 alternative_acceptor chr2 99.84 96.50 0.006
SMARCA2 alternative_first_exon chr2 28.71 58.45 0.006
ENSOARG00000005386 alternative_first_exon chr2 19.44 10.58 0.007
UBQLN1 cassette chr2 27.59 35.43 0.008
H-FABP alternative_donor chr2 6.30 15.05 0.008
NEK1 alternative_acceptor chr2 20.37 10.22 0.008
CARF alternative_acceptor chr2 6.82 1.97 0.008
CLASP1 alternative_acceptor chr2 0.17 2.61 0.008
TTC39B cassette chr2 83.68 92.44 0.008
BAZ2B alternative_donor chr2 3.81 9.16 0.009
TTC21B alternative_donor chr2 2.31 5.03 0.009

Appendices
263
DCTN3 alternative_acceptor chr2 3.09 7.09 0.010
CCDC171 cassette chr2 92.00 99.41 0.012
SMC5 cassette chr2 45.12 59.08 0.013
KIF27 alternative_donor chr2 96.89 99.55 0.013
BIN3 alternative_acceptor chr2 3.61 8.79 0.014
RFX3 alternative_first_exon chr2 27.29 13.94 0.014
CAB39 alternative_acceptor chr2 1.35 3.67 0.015
C9orf43 cassette chr2 94.71 98.55 0.016
HERC2 alternative_first_exon chr2 39.12 25.46 0.016
SMARCA2 alternative_acceptor chr2 73.60 46.44 0.017
MYO1B cassette chr2 6.13 10.36 0.019
S100PBP alternative_first_exon chr2 10.22 4.77 0.020
PTPN4 alternative_donor chr2 90.40 97.64 0.021
PTAR1 cassette chr2 99.67 94.67 0.022
CCDC171 alternative_donor chr2 95.83 100.00 0.023
RGP1 alternative_acceptor chr2 11.71 21.44 0.023
SMARCA2 alternative_first_exon chr2 18.47 6.75 0.023
ALS2CR11 alternative_last_exon chr2 78.22 85.44 0.024
KIAA2026 cassette chr2 97.90 91.54 0.024
ENSOARG00000020917 alternative_donor chr2 1.45 5.95 0.025
RAB3GAP1 alternative_acceptor chr2 5.59 9.17 0.027
ENSOARG00000003035 alternative_first_exon chr2 33.78 23.39 0.027
ENSOARG00000013702 alternative_donor chr2 1.03 3.94 0.028
TTC39B cassette chr2 93.95 98.06 0.029
CCDC150 cassette chr2 89.80 94.64 0.031
CEP85 alternative_donor chr2 5.98 10.65 0.032
FSIP2 cassette chr2 95.71 98.38 0.033
ENSOARG00000008621 alternative_last_exon chr2 86.43 93.95 0.033
PTPN4 alternative_donor chr2 8.94 2.36 0.036
MAP2 intron_retention chr2 7.12 7.92 0.037
ARHGEF39 alternative_donor chr2 79.93 90.39 0.037
SNAPC3 cassette chr2 62.42 51.11 0.038
RAB3GAP1 alternative_donor chr2 6.12 2.86 0.038
39142 alternative_last_exon chr2 11.47 30.14 0.040
RAB3GAP1 alternative_first_exon chr2 20.56 13.58 0.040
ZO2 cassette chr2 96.78 88.43 0.040
SPATA21 cassette chr2 85.13 93.66 0.042
PTP4A2 alternative_donor chr2 5.86 2.88 0.042
ENSOARG00000020917 alternative_donor chr2 35.79 20.27 0.042
ARHGEF39 alternative_donor chr2 7.84 3.20 0.043
MAP2 alternative_first_exon chr2 3.13 3.24 0.044
TSSK3 alternative_first_exon chr2 4.36 5.94 0.046
MFF alternative_acceptor chr2 2.29 4.06 0.046
SPAG16 cassette chr2 94.68 84.62 0.046
SPAG16 coord_cassette chr2 97.64 90.24 0.047
CDC37L1 alternative_donor chr2 9.21 5.33 0.047
AGTPBP1 alternative_acceptor chr2 2.08 5.25 0.048

Appendices
264
IWS1 cassette chr2 96.94 99.32 0.049
HSDL2 cassette chr2 95.21 98.43 0.049
STK36 alternative_acceptor chr2 0.00 1.67 0.050
JARID2 alternative_acceptor chr20 1.31 5.32 0.000
TDP2 alternative_donor chr20 99.05 94.97 0.001
DST alternative_first_exon chr20 51.09 31.94 0.001
FARS2 alternative_last_exon chr20 9.09 0.86 0.003
TDP2 alternative_donor chr20 0.95 4.54 0.007
LY6G6C alternative_first_exon chr20 91.23 98.81 0.007
ABHD16A cassette chr20 96.26 91.19 0.007
SNRPC alternative_first_exon chr20 5.10 1.18 0.008
NELFE cassette chr20 95.91 93.00 0.011
CAGE1 cassette chr20 21.09 13.08 0.014
MRPS18A alternative_donor chr20 4.44 9.85 0.016
ENPP5 alternative_acceptor chr20 96.37 98.12 0.018
CAGE1 cassette chr20 89.37 94.78 0.021
POLR1C alternative_donor chr20 40.12 47.78 0.022
ATF6B alternative_donor chr20 8.68 1.67 0.024
LRRC1 alternative_donor chr20 2.58 7.09 0.028
ZNRD1 cassette chr20 71.28 82.40 0.031
ENPP5 alternative_acceptor chr20 3.28 1.88 0.034
FLOT1 cassette chr20 35.69 42.99 0.036
GPR116 cassette chr20 41.41 67.28 0.037
SLC29A1 alternative_acceptor chr20 0.00 2.02 0.039
ARMC12 alternative_acceptor chr20 7.26 9.61 0.040
FKBP5 alternative_first_exon chr20 2.90 0.00 0.040
SLC26A8 cassette chr20 85.18 77.11 0.044
BAG6 cassette chr20 2.69 4.29 0.046
ZNF76 alternative_donor chr20 8.59 13.07 0.046
ENSOARG00000001195 alternative_first_exon chr20 1.19 4.94 0.048
MRPS18A alternative_donor chr20 2.67 6.49 0.049
ZNF451 alternative_last_exon chr20 8.81 14.67 0.049
ATL3 alternative_first_exon chr21 88.12 73.73 0.008
ZBTB44 alternative_acceptor chr21 5.98 9.10 0.008
NA alternative_donor chr21 7.62 5.13 0.012
HPS5 alternative_acceptor chr21 7.70 1.56 0.017
ZBTB44 alternative_acceptor chr21 89.86 85.88 0.018
HPS5 alternative_donor chr21 9.18 4.11 0.018
PRMT3 alternative_acceptor chr21 3.97 7.32 0.019
PICALM cassette chr21 26.44 20.16 0.020
ENSOARG00000015269 alternative_acceptor chr21 8.04 12.53 0.022
ENSOARG00000007319 alternative_last_exon chr21 23.38 30.85 0.025
OTUB1 intron_retention chr21 3.00 6.38 0.027
PPP6R3 alternative_acceptor chr21 5.99 10.25 0.028
NA alternative_donor chr21 2.84 7.90 0.031
C11orf80 cassette chr21 78.28 64.77 0.031
CDCA5 alternative_acceptor chr21 5.51 9.03 0.031

Appendices
265
CDCA5 alternative_acceptor chr21 94.49 90.97 0.031
PICALM cassette chr21 4.75 9.50 0.032
CTTN cassette chr21 56.19 64.01 0.033
FIBP alternative_acceptor chr21 68.52 75.05 0.041
SUV420H1 alternative_acceptor chr21 5.64 14.63 0.041
GANAB cassette chr21 42.48 30.67 0.043
FAM178A alternative_first_exon chr22 65.88 86.72 0.000
FAM178A alternative_first_exon chr22 7.40 1.49 0.001
MXI1 alternative_acceptor chr22 1.49 6.42 0.002
ENTPD1 cassette chr22 94.83 98.85 0.003
INPP5A alternative_donor chr22 3.60 11.85 0.004
ATE1 cassette chr22 88.38 82.15 0.005
RAB11FIP2 alternative_acceptor chr22 83.61 75.86 0.005
ADD3 cassette chr22 63.99 49.99 0.008
PDZD8 alternative_donor chr22 2.73 5.11 0.009
ATE1 cassette chr22 10.98 15.60 0.011
PDCD4 alternative_acceptor chr22 90.88 95.30 0.015
BTBD16 cassette chr22 75.51 59.84 0.016
RAB11FIP2 cassette chr22 84.80 92.58 0.017
TM9SF3 cassette chr22 95.24 99.57 0.017
INPP5A alternative_acceptor chr22 4.35 11.77 0.017
FAM178A cassette chr22 98.64 96.20 0.018
FAM178A alternative_first_exon chr22 2.63 0.23 0.020
MGEA5 coord_cassette chr22 86.63 94.91 0.020
TM9SF3 alternative_acceptor chr22 97.78 93.37 0.020
GOT1 alternative_donor chr22 2.93 4.75 0.022
CPEB3 alternative_acceptor chr22 95.42 91.38 0.023
EDRF1 alternative_acceptor chr22 3.12 10.17 0.023
FAM178A alternative_first_exon chr22 7.14 1.25 0.023
TM9SF3 alternative_acceptor chr22 0.51 2.68 0.024
TM9SF3 alternative_acceptor chr22 1.72 3.95 0.028
TCTN3 cassette chr22 94.59 86.81 0.029
INPP5A alternative_donor chr22 98.46 95.93 0.029
TM9SF3 alternative_donor chr22 3.09 6.12 0.030
TM9SF3 alternative_donor chr22 1.84 3.95 0.034
MORN4 alternative_donor chr22 6.02 2.29 0.040
NA alternative_acceptor chr22 0.95 2.44 0.043
SEH1L alternative_acceptor chr23 12.87 6.23 0.001
LAMA3 alternative_first_exon chr23 67.68 48.71 0.002
SEH1L cassette chr23 95.93 88.99 0.006
KATNAL2 alternative_acceptor chr23 37.56 28.04 0.007
CFAP53 alternative_donor chr23 2.49 5.72 0.007
MBD2 alternative_first_exon chr23 30.48 11.79 0.007
TIMM21 alternative_first_exon chr23 15.16 7.95 0.008
NARS alternative_donor chr23 4.57 10.46 0.008
MBD1 alternative_last_exon chr23 53.84 61.44 0.011
NARS alternative_acceptor chr23 8.76 14.35 0.012

Appendices
266
MBD1 alternative_last_exon chr23 22.46 14.23 0.015
CDH2 alternative_first_exon chr23 39.63 17.48 0.019
TIMM21 alternative_acceptor chr23 3.44 6.39 0.019
LMAN1 alternative_acceptor chr23 0.95 6.36 0.020
KDSR alternative_donor chr23 0.00 3.03 0.026
SEH1L alternative_last_exon chr23 64.35 49.98 0.029
RAB27B alternative_first_exon chr23 8.50 28.01 0.029
RNF125 alternative_first_exon chr23 49.63 38.45 0.032
SMAD4 alternative_first_exon chr23 84.58 78.76 0.032
PIK3C3 coord_cassette chr23 3.90 1.21 0.037
SEH1L coord_cassette chr23 95.80 90.41 0.039
POLI alternative_donor chr23 4.97 8.53 0.040
SMCHD1 alternative_first_exon chr23 93.70 97.23 0.042
MBD2 alternative_first_exon chr23 7.60 2.96 0.044
GLYR1 alternative_donor chr24 4.57 11.06 0.002
GTF2I alternative_donor chr24 1.78 4.41 0.010
ECI1 cassette chr24 22.40 30.95 0.012
CUX1 alternative_last_exon chr24 42.21 33.78 0.013
41153 coord_cassette chr24 97.58 100.00 0.019
DNAH3 alternative_acceptor chr24 6.04 2.34 0.019
ENSOARG00000018278 alternative_donor chr24 95.75 98.97 0.026
GDE1 cassette chr24 94.58 98.88 0.026
TRRAP alternative_donor chr24 0.21 2.17 0.026
PDILT alternative_acceptor chr24 92.99 98.81 0.026
TEKT5 alternative_acceptor chr24 3.51 5.94 0.027
UBN1 alternative_donor chr24 4.11 1.36 0.030
SLX4 alternative_acceptor chr24 6.10 3.32 0.031
GTF2I alternative_donor chr24 7.14 14.58 0.033
FAM57B alternative_donor chr24 3.25 8.41 0.033
SLX4 alternative_acceptor chr24 93.91 96.57 0.035
ENSOARG00000010149 alternative_acceptor chr24 25.00 12.53 0.035
STAG3 cassette chr24 97.26 99.37 0.037
TMC7 cassette chr24 78.20 85.03 0.044
PRSS21 alternative_acceptor chr24 92.05 97.77 0.047
STAG3 intron_retention chr24 1.20 3.71 0.049
ENSOARG00000014682 alternative_donor chr24 1.83 4.69 0.050
CLEC16A alternative_acceptor chr24 2.39 4.69 0.050
DNA2 alternative_donor chr25 6.49 1.74 0.006
BMS1 alternative_first_exon chr25 98.24 95.10 0.006
TMEM254 alternative_first_exon chr25 66.37 45.52 0.006
ENSOARG00000002534 alternative_donor chr25 9.35 13.68 0.019
CCAR1 alternative_donor chr25 17.60 8.04 0.022
GNPAT alternative_donor chr25 0.94 2.48 0.022
ENSOARG00000002534 alternative_donor chr25 0.00 3.01 0.023
SIRT1 alternative_donor chr25 97.97 100.00 0.042
WAPAL intron_retention chr25 3.10 0.23 0.044
PSD3 cassette chr26 96.47 92.70 0.005

Appendices
267
PCM1 alternative_acceptor chr26 67.06 80.23 0.005
ADAM32 cassette chr26 93.94 90.22 0.007
PCM1 alternative_acceptor chr26 24.42 14.48 0.012
ADAM32 cassette chr26 93.75 91.54 0.021
HOOK3 alternative_first_exon chr26 79.66 65.64 0.023
LETM2 alternative_acceptor chr26 4.23 1.89 0.023
ADAM32 cassette chr26 99.28 97.14 0.026
PCM1 alternative_donor chr26 7.12 3.63 0.028
UBXN8 alternative_first_exon chr26 96.71 99.64 0.032
ADAM2 alternative_donor chr26 1.63 3.61 0.039
ADAM32 cassette chr26 93.17 87.78 0.041
SORBS2 alternative_last_exon chr26 2.37 5.46 0.041
SNX25 cassette chr26 95.63 97.73 0.048
RABGAP1 alternative_acceptor chr3 1.03 4.07 0.000
CHD4 alternative_donor chr3 0.00 4.16 0.001
ERGIC2 cassette chr3 80.12 89.51 0.001
KIDINS220 alternative_donor chr3 2.92 7.95 0.002
MYPT1 alternative_first_exon chr3 4.47 0.65 0.002
CCDC91 alternative_acceptor chr3 95.23 98.95 0.003
CTDSP2 alternative_donor chr3 96.35 89.46 0.004
SMCO2 cassette chr3 95.42 99.16 0.005
AK8 alternative_first_exon chr3 29.58 40.33 0.006
EIF4B intron_retention chr3 2.19 8.04 0.007
EML4 cassette chr3 60.85 86.19 0.007
C12orf50 cassette chr3 93.14 88.58 0.007
AMN1 alternative_first_exon chr3 8.31 2.03 0.008
CTDSP2 alternative_acceptor chr3 2.69 7.71 0.008
MAT2A alternative_first_exon chr3 83.55 88.39 0.008
CCDC38 alternative_donor chr3 5.42 11.64 0.008
CTDSP2 alternative_donor chr3 2.64 7.11 0.009
CTDSP2 alternative_donor chr3 1.01 3.43 0.009
SLC4A1AP alternative_donor chr3 88.13 79.22 0.009
CDK17 alternative_first_exon chr3 70.71 51.82 0.009
CAPRIN2 alternative_first_exon chr3 58.90 37.93 0.010
CAPRIN2 cassette chr3 96.05 91.04 0.011
DDX31 alternative_acceptor chr3 2.11 4.98 0.011
SPTBN1 alternative_first_exon chr3 70.22 53.79 0.011
USP34 alternative_first_exon chr3 56.11 41.36 0.011
SMEK2 alternative_acceptor chr3 19.72 26.22 0.012
IMMT cassette chr3 38.64 46.09 0.012
ASB8 cassette chr3 94.62 99.04 0.014
LMBR1L alternative_acceptor chr3 0.62 3.01 0.015
ENSOARG00000020362 alternative_first_exon chr3 19.95 4.91 0.015
C2CD5 cassette chr3 76.69 90.14 0.016
USP34 alternative_donor chr3 2.83 5.05 0.016
EFR3B alternative_first_exon chr3 97.29 92.33 0.016
ENSOARG00000014353 alternative_acceptor chr3 74.00 62.90 0.016

Appendices
268
SMC6 alternative_acceptor chr3 96.95 91.26 0.018
PUM2 alternative_donor chr3 6.36 1.04 0.018
REV1 alternative_donor chr3 0.32 3.83 0.019
PPHLN1 cassette chr3 42.64 62.94 0.019
FNBP1 alternative_first_exon chr3 57.83 39.80 0.019
SETX alternative_donor chr3 12.47 9.37 0.020
GOLGA1 alternative_acceptor chr3 2.55 0.00 0.021
SLC41A2 alternative_donor chr3 2.03 0.00 0.021
PAWR alternative_acceptor chr3 2.26 6.88 0.023
RABGAP1 alternative_donor chr3 8.12 14.88 0.023
PRDM4 alternative_first_exon chr3 24.84 10.31 0.024
NCOA1 alternative_acceptor chr3 1.50 3.91 0.025
SMC6 alternative_acceptor chr3 1.57 4.83 0.025
GOLGA1 alternative_donor chr3 1.16 4.37 0.025
OS9 cassette chr3 94.51 90.13 0.025
ASXL2 alternative_acceptor chr3 23.02 11.02 0.025
ODF2 alternative_donor chr3 62.49 57.95 0.025
TTC7A alternative_donor chr3 2.51 5.54 0.025
NA alternative_donor chr3 5.77 13.24 0.026
HNRNPLL cassette chr3 54.92 64.18 0.026
C12orf50 alternative_acceptor chr3 96.48 98.72 0.026
DCTN1 intron_retention chr3 5.41 15.08 0.026
SMCO2 alternative_acceptor chr3 4.84 2.38 0.027
TBC1D15 alternative_donor chr3 2.74 5.68 0.027
MGAT4A alternative_donor chr3 0.41 2.32 0.027
UNC50 alternative_acceptor chr3 2.01 4.11 0.027
ARID2 alternative_acceptor chr3 1.62 4.90 0.027
SMC6 alternative_acceptor chr3 1.49 3.91 0.028
PAWR alternative_acceptor chr3 94.69 86.11 0.028
FBXO7 alternative_acceptor chr3 0.00 4.61 0.028
UNC50 alternative_acceptor chr3 2.70 8.49 0.029
APPL2 alternative_donor chr3 11.36 17.20 0.029
GOLGA1 alternative_acceptor chr3 4.88 2.40 0.029
SOX5 alternative_acceptor chr3 5.55 3.29 0.030
C2CD5 cassette chr3 74.52 89.90 0.030
ENSOARG00000006929 alternative_donor chr3 3.20 0.28 0.030
MYPT1 cassette chr3 45.45 57.66 0.030
FUBP3 alternative_first_exon chr3 19.66 40.12 0.031
AGBL5 alternative_donor chr3 98.95 95.19 0.032
C12ORF29 alternative_donor chr3 32.29 22.59 0.032
MYPT1 mutually_exclusive chr3 100.00 93.33 0.032
CPSF6 alternative_acceptor chr3 15.50 12.12 0.033
AK8 alternative_donor chr3 1.08 3.33 0.033
ASXL2 alternative_donor chr3 23.70 11.33 0.033
CCDC38 alternative_donor chr3 6.25 17.78 0.033
PAWR alternative_donor chr3 0.60 3.57 0.034
ENSOARG00000014575 cassette chr3 99.16 97.20 0.034
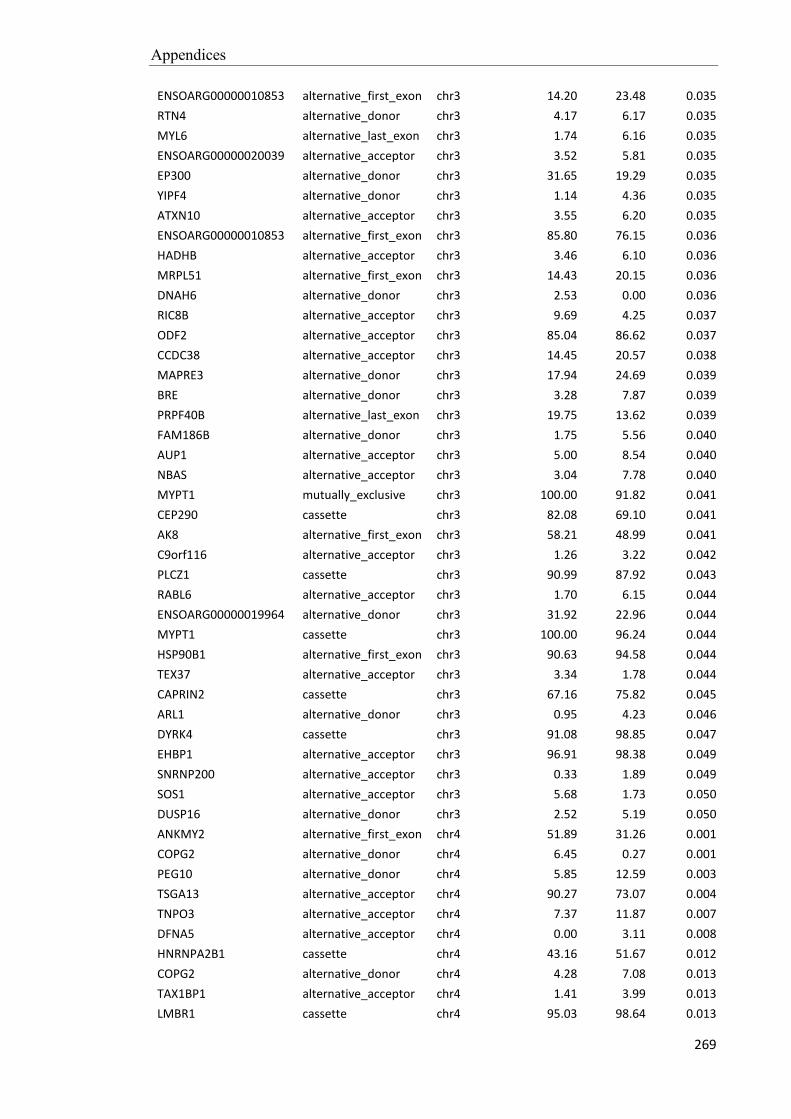
Appendices
269
ENSOARG00000010853 alternative_first_exon chr3 14.20 23.48 0.035
RTN4 alternative_donor chr3 4.17 6.17 0.035
MYL6 alternative_last_exon chr3 1.74 6.16 0.035
ENSOARG00000020039 alternative_acceptor chr3 3.52 5.81 0.035
EP300 alternative_donor chr3 31.65 19.29 0.035
YIPF4 alternative_donor chr3 1.14 4.36 0.035
ATXN10 alternative_acceptor chr3 3.55 6.20 0.035
ENSOARG00000010853 alternative_first_exon chr3 85.80 76.15 0.036
HADHB alternative_acceptor chr3 3.46 6.10 0.036
MRPL51 alternative_first_exon chr3 14.43 20.15 0.036
DNAH6 alternative_donor chr3 2.53 0.00 0.036
RIC8B alternative_acceptor chr3 9.69 4.25 0.037
ODF2 alternative_acceptor chr3 85.04 86.62 0.037
CCDC38 alternative_acceptor chr3 14.45 20.57 0.038
MAPRE3 alternative_donor chr3 17.94 24.69 0.039
BRE alternative_donor chr3 3.28 7.87 0.039
PRPF40B alternative_last_exon chr3 19.75 13.62 0.039
FAM186B alternative_donor chr3 1.75 5.56 0.040
AUP1 alternative_acceptor chr3 5.00 8.54 0.040
NBAS alternative_acceptor chr3 3.04 7.78 0.040
MYPT1 mutually_exclusive chr3 100.00 91.82 0.041
CEP290 cassette chr3 82.08 69.10 0.041
AK8 alternative_first_exon chr3 58.21 48.99 0.041
C9orf116 alternative_acceptor chr3 1.26 3.22 0.042
PLCZ1 cassette chr3 90.99 87.92 0.043
RABL6 alternative_acceptor chr3 1.70 6.15 0.044
ENSOARG00000019964 alternative_donor chr3 31.92 22.96 0.044
MYPT1 cassette chr3 100.00 96.24 0.044
HSP90B1 alternative_first_exon chr3 90.63 94.58 0.044
TEX37 alternative_acceptor chr3 3.34 1.78 0.044
CAPRIN2 cassette chr3 67.16 75.82 0.045
ARL1 alternative_donor chr3 0.95 4.23 0.046
DYRK4 cassette chr3 91.08 98.85 0.047
EHBP1 alternative_acceptor chr3 96.91 98.38 0.049
SNRNP200 alternative_acceptor chr3 0.33 1.89 0.049
SOS1 alternative_acceptor chr3 5.68 1.73 0.050
DUSP16 alternative_donor chr3 2.52 5.19 0.050
ANKMY2 alternative_first_exon chr4 51.89 31.26 0.001
COPG2 alternative_donor chr4 6.45 0.27 0.001
PEG10 alternative_donor chr4 5.85 12.59 0.003
TSGA13 alternative_acceptor chr4 90.27 73.07 0.004
TNPO3 alternative_acceptor chr4 7.37 11.87 0.007
DFNA5 alternative_acceptor chr4 0.00 3.11 0.008
HNRNPA2B1 cassette chr4 43.16 51.67 0.012
COPG2 alternative_donor chr4 4.28 7.08 0.013
TAX1BP1 alternative_acceptor chr4 1.41 3.99 0.013
LMBR1 cassette chr4 95.03 98.64 0.013

Appendices
270
COPG2 alternative_acceptor chr4 97.08 100.00 0.013
CDK13 alternative_donor chr4 1.97 5.86 0.014
BRAF alternative_acceptor chr4 6.62 3.80 0.017
GSAP alternative_acceptor chr4 3.62 7.17 0.019
GALNTL5 cassette chr4 95.56 92.62 0.020
TNPO3 alternative_first_exon chr4 34.90 25.38 0.020
GPNMB alternative_donor chr4 0.96 5.76 0.021
SUN3 alternative_first_exon chr4 71.25 79.62 0.021
PHTF2 alternative_last_exon chr4 17.11 9.43 0.023
PPP1R9A cassette chr4 100.00 95.79 0.024
NUDCD3 alternative_donor chr4 5.30 10.90 0.024
COA1 alternative_acceptor chr4 6.71 12.28 0.025
PHF14 alternative_donor chr4 0.37 4.66 0.027
NAMPT alternative_acceptor chr4 12.12 5.89 0.027
VPS41 alternative_donor chr4 4.47 7.58 0.029
TRIM24 alternative_acceptor chr4 2.41 4.83 0.030
SUN3 cassette chr4 96.81 98.58 0.031
SKAP2 alternative_first_exon chr4 0.00 2.81 0.036
DMTF1 alternative_acceptor chr4 5.11 7.31 0.039
BRAF alternative_acceptor chr4 95.22 100.00 0.039
UBE3C intron_retention chr4 1.94 10.47 0.041
ENSOARG00000004778 alternative_acceptor chr4 96.83 94.65 0.043
NA alternative_acceptor chr4 4.79 9.65 0.043
PEX1 alternative_first_exon chr4 19.09 12.06 0.047
HNRNPM cassette chr5 92.46 84.91 0.000
MIER2 alternative_donor chr5 8.90 2.20 0.001
SLCO6A1 cassette chr5 95.23 99.56 0.001
FAM13B alternative_first_exon chr5 35.92 19.47 0.002
AFF4 alternative_first_exon chr5 24.60 36.14 0.002
ENSOARG00000005912 alternative_first_exon chr5 69.52 81.88 0.003
NSD1 alternative_last_exon chr5 60.37 44.95 0.003
CLINT1 alternative_acceptor chr5 57.92 44.26 0.004
C19orf45 alternative_last_exon chr5 4.83 19.04 0.006
LNPEP cassette chr5 60.18 78.48 0.008
AFF4 alternative_first_exon chr5 28.76 14.10 0.008
PCSK4 alternative_acceptor chr5 2.15 4.35 0.011
ENSOARG00000007328 alternative_first_exon chr5 3.75 0.20 0.011
FAF2 alternative_acceptor chr5 0.93 6.55 0.011
FAM81B alternative_acceptor chr5 5.82 0.00 0.011
CANX alternative_first_exon chr5 55.54 35.92 0.011
TRIM11 alternative_acceptor chr5 7.11 2.89 0.013
NA alternative_acceptor chr5 55.45 43.50 0.013
PAM cassette chr5 64.48 50.35 0.014
PFDN1 alternative_acceptor chr5 4.85 12.17 0.014
ENSOARG00000017846 alternative_donor chr5 25.73 11.80 0.014
PPIP5K2 cassette chr5 99.54 90.88 0.016
MAPK9 alternative_acceptor chr5 7.43 14.54 0.016

Appendices
271
ENSOARG00000017846 alternative_donor chr5 11.18 4.46 0.017
THG1L alternative_first_exon chr5 80.49 64.56 0.020
ENSOARG00000005912 alternative_first_exon chr5 26.02 16.07 0.020
ENSOARG00000017846 alternative_acceptor chr5 8.60 2.50 0.020
PFDN1 alternative_donor chr5 0.91 3.44 0.023
FAM13B alternative_first_exon chr5 31.28 46.67 0.023
MATR3 cassette chr5 97.68 91.49 0.024
C19orf44 alternative_last_exon chr5 4.86 0.00 0.025
MATR3 alternative_acceptor chr5 34.40 23.04 0.029
ENSOARG00000017846 alternative_acceptor chr5 8.81 3.75 0.029
PPP2R2B cassette chr5 36.91 49.35 0.029
PFDN1 alternative_first_exon chr5 1.46 6.03 0.030
DNM2 cassette chr5 19.17 24.69 0.030
PCBD2 cassette chr5 82.32 92.48 0.032
REXO1 alternative_acceptor chr5 16.36 8.09 0.033
PLIN3 alternative_acceptor chr5 2.75 7.16 0.035
RAB11B alternative_donor chr5 0.38 2.23 0.037
PLIN3 alternative_donor chr5 2.40 10.34 0.039
CTNNA1 alternative_acceptor chr5 2.10 0.00 0.039
FBN2 alternative_acceptor chr5 9.70 4.82 0.039
FAM13B cassette chr5 56.03 70.84 0.040
TMEM161B alternative_donor chr5 2.63 5.71 0.040
ENSOARG00000016418 intron_retention chr5 4.14 0.51 0.041
GRAMD3 intron_retention chr5 0.00 6.36 0.041
PPIP5K2 cassette chr5 70.72 79.94 0.043
ATP8B3 cassette chr5 88.51 79.00 0.043
STK11 alternative_acceptor chr5 5.97 9.65 0.045
PPIP5K2 cassette chr5 11.57 26.92 0.047
FAM114A2 alternative_donor chr5 0.65 3.38 0.048
FER alternative_acceptor chr5 2.42 6.51 0.048
RNF145 alternative_acceptor chr5 2.02 4.70 0.049
PDS5A alternative_donor chr6 11.43 3.61 0.002
FIP1L1 cassette chr6 56.84 70.45 0.007
RFC1 alternative_acceptor chr6 97.94 95.91 0.007
TMEM33 alternative_donor chr6 10.51 16.93 0.008
RFC1 alternative_acceptor chr6 1.38 3.49 0.010
CCDC158 alternative_last_exon chr6 49.60 35.69 0.012
HNRNPD cassette chr6 45.46 37.11 0.012
SEC31A cassette chr6 69.75 83.19 0.014
EXOC1 alternative_donor chr6 3.15 8.62 0.015
PRDM5 cassette chr6 96.30 84.91 0.017
SMIM20 alternative_first_exon chr6 43.66 58.06 0.019
CCDC158 cassette chr6 72.87 79.99 0.023
WDR19 alternative_donor chr6 22.53 30.37 0.024
CDS1 alternative_donor chr6 3.21 5.96 0.026
ENSOARG00000016858 alternative_first_exon chr6 50.98 32.34 0.028
WDR19 alternative_acceptor chr6 20.97 27.40 0.028

Appendices
272
FBXL5 alternative_acceptor chr6 4.19 14.16 0.031
ENSOARG00000000434 cassette chr6 65.37 44.09 0.032
ENOPH1 cassette chr6 96.47 99.60 0.035
RAP1GDS1 alternative_donor chr6 4.63 8.51 0.036
TBC1D1 alternative_donor chr6 78.69 86.91 0.039
PPA2 alternative_donor chr6 3.16 5.99 0.040
TSPAN5 alternative_acceptor chr6 1.13 4.36 0.041
TMEM33 alternative_donor chr6 37.53 27.25 0.041
PDE5A cassette chr6 94.33 99.51 0.043
SMIM20 alternative_first_exon chr6 49.30 36.08 0.044
PTPN13 cassette chr6 100.00 97.39 0.045
LRRC74A alternative_donor chr7 11.23 19.00 0.000
RBM25 alternative_acceptor chr7 2.90 7.29 0.000
C15orf41 alternative_acceptor chr7 3.11 0.00 0.001
SPESP1 alternative_acceptor chr7 25.62 44.02 0.001
BNIP2 alternative_first_exon chr7 70.76 85.77 0.001
ALDH6A1 intron_retention chr7 93.97 87.98 0.001
YTHDC2 alternative_first_exon chr7 17.33 4.02 0.001
WDR41 cassette chr7 76.41 89.65 0.002
CGRRF1 alternative_first_exon chr7 45.37 64.58 0.002
BNIP2 alternative_first_exon chr7 27.21 13.85 0.002
ALDH6A1 alternative_donor chr7 87.21 75.93 0.002
TTLL5 alternative_donor chr7 94.45 97.59 0.002
AHSA1 alternative_first_exon chr7 13.79 5.39 0.003
AHSA1 alternative_first_exon chr7 75.90 87.52 0.003
RBM25 alternative_acceptor chr7 2.90 0.00 0.004
TEX9 cassette chr7 98.92 94.62 0.006
ANGEL1 alternative_acceptor chr7 6.81 11.79 0.007
DDHD1 alternative_acceptor chr7 3.49 1.42 0.007
MYO9A cassette chr7 11.48 18.55 0.007
AQR alternative_first_exon chr7 52.61 26.17 0.008
DENND4A alternative_first_exon chr7 23.58 16.75 0.009
ENSOARG00000021149 cassette chr7 84.51 91.71 0.009
ALDH6A1 alternative_acceptor chr7 33.00 40.90 0.012
FUT8 alternative_first_exon chr7 89.41 98.54 0.013
IQGAP2 cassette chr7 37.34 46.11 0.013
DCAF5 alternative_acceptor chr7 1.65 4.87 0.014
DDHD1 alternative_donor chr7 3.99 1.61 0.014
BCL2L2-PABPN1 alternative_first_exon chr7 5.89 2.08 0.016
AHSA1 alternative_donor chr7 5.57 9.08 0.017
HOMEZ alternative_first_exon chr7 2.24 10.24 0.018
YLPM1 alternative_donor chr7 32.22 18.74 0.019
BCL2L2-PABPN1 intron_retention chr7 12.14 21.02 0.020
GALK2 alternative_acceptor chr7 1.66 4.26 0.022
CLPX alternative_donor chr7 4.93 3.29 0.025
ENSOARG00000021161 alternative_first_exon chr7 4.45 8.36 0.026
GTF2A1 alternative_acceptor chr7 8.16 11.02 0.027

Appendices
273
BBS4 alternative_acceptor chr7 1.04 5.72 0.027
SNX1 alternative_first_exon chr7 9.32 15.84 0.027
MPP5 intron_retention chr7 14.70 4.18 0.029
C15orf41 cassette chr7 96.03 99.41 0.029
ENSOARG00000003198 alternative_first_exon chr7 7.28 19.27 0.029
FERMT2 cassette chr7 41.33 19.65 0.030
KTN1 cassette chr7 15.43 19.65 0.030
DDHD1 alternative_acceptor chr7 3.60 5.69 0.032
C15orf48 cassette chr7 85.04 90.56 0.032
CGRRF1 alternative_first_exon chr7 30.66 18.54 0.033
TPM1 intron_retention chr7 6.90 15.43 0.035
RAB8B alternative_acceptor chr7 1.13 4.73 0.035
AP3B1 alternative_acceptor chr7 2.37 4.86 0.037
ZNF106 alternative_acceptor chr7 7.59 15.13 0.037
ANGEL1 intron_retention chr7 4.15 10.67 0.037
MYO9A cassette chr7 12.50 25.25 0.037
HOMEZ alternative_first_exon chr7 54.21 42.49 0.038
SCAMP1 alternative_acceptor chr7 1.00 2.82 0.038
ENSOARG00000003198 alternative_first_exon chr7 91.39 80.40 0.039
OIP5 alternative_donor chr7 4.66 0.56 0.041
SYNE2 alternative_acceptor chr7 3.14 6.54 0.041
FUT8 alternative_donor chr7 92.36 98.05 0.041
TMEM260 alternative_donor chr7 92.93 87.73 0.041
IFT43 alternative_acceptor chr7 0.64 2.56 0.041
ZNF106 alternative_donor chr7 6.39 13.32 0.041
WDR41 cassette chr7 92.76 88.60 0.042
FUT8 alternative_donor chr7 3.70 0.67 0.042
FEM1C alternative_first_exon chr7 8.69 3.02 0.043
C15orf41 alternative_acceptor chr7 6.89 2.65 0.043
ALDH6A1 intron_retention chr7 87.71 81.37 0.044
FUT8 alternative_first_exon chr7 4.73 0.57 0.045
SCAMP1 alternative_acceptor chr7 0.45 2.08 0.045
DDHD1 alternative_acceptor chr7 96.25 94.31 0.046
SERINC5 cassette chr7 100.00 98.01 0.046
ANGEL1 alternative_donor chr7 9.20 12.93 0.046
CDKN3 cassette chr7 89.21 81.13 0.047
GALK2 alternative_donor chr7 2.11 4.88 0.049
RNGTT alternative_donor chr8 83.07 94.83 0.002
ENSOARG00000001675 alternative_acceptor chr8 6.40 11.60 0.005
ATG5 alternative_last_exon chr8 2.96 0.00 0.005
PPIL6 alternative_first_exon chr8 82.45 65.87 0.007
PPIL6 alternative_first_exon chr8 17.38 33.96 0.007
DYNLT1 alternative_last_exon chr8 95.28 98.03 0.010
HSF2 cassette chr8 78.05 67.30 0.010
SNX9 alternative_first_exon chr8 63.17 44.67 0.013
RNGTT alternative_donor chr8 8.42 2.06 0.013
KLHL32 alternative_acceptor chr8 0.93 5.40 0.013

Appendices
274
MAP3K7 alternative_acceptor chr8 1.04 9.01 0.014
SENP6 alternative_first_exon chr8 24.79 9.16 0.019
FHL5 alternative_acceptor chr8 99.28 97.22 0.020
REPS1 alternative_first_exon chr8 14.22 7.78 0.021
MYO6 alternative_acceptor chr8 9.66 6.65 0.024
CEP85L cassette chr8 80.01 86.61 0.033
DYNLT1 alternative_last_exon chr8 2.92 0.72 0.034
RNGTT alternative_first_exon chr8 4.89 0.00 0.034
TIAM2 alternative_acceptor chr8 0.79 4.27 0.035
SOBP cassette chr8 91.48 88.17 0.039
NA alternative_acceptor chr8 1.43 6.62 0.039
TCTE3 alternative_donor chr8 2.71 0.00 0.040
SNX9 alternative_donor chr8 99.19 97.21 0.040
MANEA alternative_acceptor chr8 0.29 6.02 0.040
ENSOARG00000001675 alternative_first_exon chr8 39.40 17.46 0.041
MANEA alternative_acceptor chr8 99.59 93.98 0.044
REPS1 alternative_first_exon chr8 5.35 0.36 0.045
MAP3K7 cassette chr8 49.30 39.20 0.046
PPIL6 alternative_donor chr8 3.32 13.26 0.049
PGM3 alternative_last_exon chr8 1.55 6.98 0.049
NA alternative_donor chr8 1.40 4.63 0.050
RIMS2 cassette chr9 70.55 33.69 0.001
PPP1R42 cassette chr9 93.77 88.46 0.004
ARFGEF1 alternative_acceptor chr9 6.01 14.22 0.008
EFR3A alternative_first_exon chr9 6.71 0.75 0.010
EMC2 alternative_acceptor chr9 4.82 1.82 0.011
TP53INP1 alternative_acceptor chr9 3.70 6.50 0.016
FAM49B alternative_acceptor chr9 2.96 4.96 0.016
EFR3A alternative_donor chr9 5.33 8.77 0.019
ENSOARG00000004224 alternative_donor chr9 0.28 2.31 0.020
NA alternative_donor chr9 2.51 5.31 0.021
VPS13B alternative_donor chr9 14.46 8.68 0.023
PHF20L1 alternative_acceptor chr9 14.30 6.84 0.025
FAM49B cassette chr9 21.45 33.21 0.030
TSTA3 alternative_donor chr9 1.14 5.13 0.033
FAM49B alternative_acceptor chr9 4.10 8.74 0.035
FAM92A1 alternative_acceptor chr9 1.44 3.73 0.036
CSPP1 alternative_acceptor chr9 4.13 7.88 0.036
KHDRBS3 cassette chr9 94.80 97.04 0.036
TAF2 alternative_acceptor chr9 3.45 1.20 0.036
ENPP2 cassette chr9 97.93 100.00 0.038
LMBRD1 alternative_donor chr9 3.30 9.65 0.041
EYA1 alternative_last_exon chr9 98.58 94.06 0.041
FAM91A1 alternative_first_exon chr9 62.48 48.72 0.042
FAM91A1 cassette chr9 92.34 95.82 0.043
NA alternative_donor chr9 1.58 4.41 0.044
INTS8 cassette chr9 92.85 85.58 0.048

Appendices
275
INTS8 cassette chr9 91.98 97.50 0.048
MROH5 alternative_donor chr9 48.73 31.67 0.049
ATP11C cassette chrX 91.98 81.66 0.003
LAS1L alternative_donor chrX 8.97 21.55 0.010
PRDX4 alternative_first_exon chrX 38.83 46.72 0.034
FMR1 cassette chrX 28.06 44.78 0.040
PHF8 alternative_donor chrX 9.03 13.55 0.041
MOSPD2 alternative_acceptor chrX 100.00 98.11 0.043
ENSOARG00000016540 alternative_donor chrX 5.33 1.50 0.044
PDK3 alternative_donor chrX 94.24 85.89 0.047

Appendices
276
Appendix Table 7.5. Differential alternative spliced genes in testis from sheep fed a low or high diet (N
= 8 for each treatment).
MAP2 PARP8 ENPP5 ARMC12 ENSOARG00000013702
CREM MLH1 NCKIPSD VRK3 ENSOARG00000016755
LRRC74A ARFGEF1 REV1 FBXO7 ENSOARG00000002534
C1orf101 UBQLN1 PPHLN1 BTF3L4 ENSOARG00000014576
TRA2B ADD3 CDH2 MPP5 ENSOARG00000003198
RPS5 AMN1 PRMT3 SEC22A ENSOARG00000013996
SYK USP24 SMIM20 FAM186B ENSOARG00000007116
HIPK3 AQR 41153 SYNRG ENSOARG00000016579
RBM25 ZBTB44 KIAA0100 TCTN3 VPRBP
KANK1 ALDH9A1 YLPM1 ARMC3 ZFR
HNRNPM SNRPC SENP6 APPL2 AUP1
FAM178A TIMM21 DNAH3 CEP89 TMEM161B
TCTE3 DFNA5 GSAP RAB27B MORC2
JARID2 NARS PIK3C2A PPP2R2B CCDC36
WDR70 TMEM33 MYO1B VPS41 THRAP3
RABGAP1 TPD52L2 RPRD2 PPA2 NBAS
TDP2 MAT2A FNBP1 MTMR6 MORN4
MIER2 GPSM2 CEP170 UBN1 FKBP5
C15orf41 NEK1 THG1L MAN2C1 MANEA
CHD4 CARF TTC29 ARMC4 FMR1
DST DGKD GALNTL5 PPM1J POLI
ANKMY2 CCDC38 LMAN1 LRRC46 ZO2
ATP6V0E1 TTC39B CDV3 SOX5 ENSOARG00000021149
SPESP1 FAR1 MACF1 LMBRD1 OIP5
PLXNB1 LNPEP GPI SOX6 SYNE2
SLCO6A1 ALKBH5 MGEA5 HSF5 UTP18
CDC16 COX6B1 C20orf194 FERMT2 TSPAN5
CNBP DENND4A FHL5 TRAPPC4 ENSOARG00000016418
TNPO1 PDZD8 S100PBP TRIM24 ENSOARG00000006929
SUDS3 TADA2A KIF1B CEP290 ENSOARG00000003810
BNIP2 BAZ2B GGN IPO11 ENSOARG00000004224
COPG2 SNPRA1 EYA1 KTN1 ENSOARG00000003552
ALDH6A1 TTC21B AARS SRSF1 ENSOARG00000017636
TMEM260 SLC4A1AP UBE3A DNM2 ENSOARG00000015593
ERGIC2 PPP4R2 KATNAL1 BRAP PHF8
RIMS2 NDEL1 DYNC1LI1 C20orf96 GRAMD3
SVIL ZDHHC20 C15orf26 NUCB1 SENP2
DENND4C SEC23B SETX ZNRD1 ENSOARG00000003373
GOLGA4 CDK17 MYCBP2 NEK4 SORBS2
SMARCC1 IFT43 PICALM FBXL5 UBE3C
NDUFV3 MFSD11 MGST3 ARL8B SUV420H1
SEH1L DYNLT1 GOLGA1 NCOA6 SMCHD1
YTHDC2 FIBP REPS1 FUBP3 FBXO21
LAMA3 HSD17B12 DYNC1LI2 C11orf80 SLAIN1
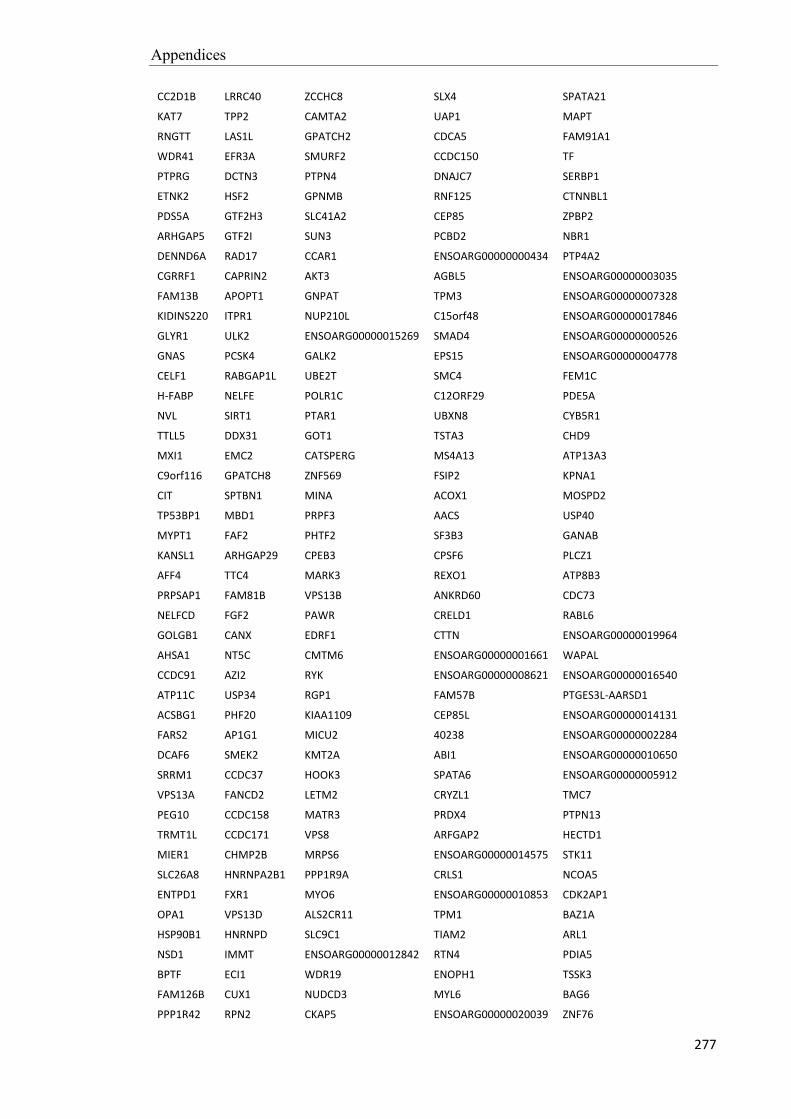
Appendices
277
CC2D1B LRRC40 ZCCHC8 SLX4 SPATA21
KAT7 TPP2 CAMTA2 UAP1 MAPT
RNGTT LAS1L GPATCH2 CDCA5 FAM91A1
WDR41 EFR3A SMURF2 CCDC150 TF
PTPRG DCTN3 PTPN4 DNAJC7 SERBP1
ETNK2 HSF2 GPNMB RNF125 CTNNBL1
PDS5A GTF2H3 SLC41A2 CEP85 ZPBP2
ARHGAP5 GTF2I SUN3 PCBD2 NBR1
DENND6A RAD17 CCAR1 ENSOARG00000000434 PTP4A2
CGRRF1 CAPRIN2 AKT3 AGBL5 ENSOARG00000003035
FAM13B APOPT1 GNPAT TPM3 ENSOARG00000007328
KIDINS220 ITPR1 NUP210L C15orf48 ENSOARG00000017846
GLYR1 ULK2 ENSOARG00000015269 SMAD4 ENSOARG00000000526
GNAS PCSK4 GALK2 EPS15 ENSOARG00000004778
CELF1 RABGAP1L UBE2T SMC4 FEM1C
H-FABP NELFE POLR1C C12ORF29 PDE5A
NVL SIRT1 PTAR1 UBXN8 CYB5R1
TTLL5 DDX31 GOT1 TSTA3 CHD9
MXI1 EMC2 CATSPERG MS4A13 ATP13A3
C9orf116 GPATCH8 ZNF569 FSIP2 KPNA1
CIT SPTBN1 MINA ACOX1 MOSPD2
TP53BP1 MBD1 PRPF3 AACS USP40
MYPT1 FAF2 PHTF2 SF3B3 GANAB
KANSL1 ARHGAP29 CPEB3 CPSF6 PLCZ1
AFF4 TTC4 MARK3 REXO1 ATP8B3
PRPSAP1 FAM81B VPS13B ANKRD60 CDC73
NELFCD FGF2 PAWR CRELD1 RABL6
GOLGB1 CANX EDRF1 CTTN ENSOARG00000019964
AHSA1 NT5C CMTM6 ENSOARG00000001661 WAPAL
CCDC91 AZI2 RYK ENSOARG00000008621 ENSOARG00000016540
ATP11C USP34 RGP1 FAM57B PTGES3L-AARSD1
ACSBG1 PHF20 KIAA1109 CEP85L ENSOARG00000014131
FARS2 AP1G1 MICU2 40238 ENSOARG00000002284
DCAF6 SMEK2 KMT2A ABI1 ENSOARG00000010650
SRRM1 CCDC37 HOOK3 SPATA6 ENSOARG00000005912
VPS13A FANCD2 LETM2 CRYZL1 TMC7
PEG10 CCDC158 MATR3 PRDX4 PTPN13
TRMT1L CCDC171 VPS8 ARFGAP2 HECTD1
MIER1 CHMP2B MRPS6 ENSOARG00000014575 STK11
SLC26A8 HNRNPA2B1 PPP1R9A CRLS1 NCOA5
ENTPD1 FXR1 MYO6 ENSOARG00000010853 CDK2AP1
OPA1 VPS13D ALS2CR11 TPM1 BAZ1A
HSP90B1 HNRNPD SLC9C1 TIAM2 ARL1
NSD1 IMMT ENSOARG00000012842 RTN4 PDIA5
BPTF ECI1 WDR19 ENOPH1 TSSK3
FAM126B CUX1 NUDCD3 MYL6 BAG6
PPP1R42 RPN2 CKAP5 ENSOARG00000020039 ZNF76

Appendices
278
INPP5A TEX37 ATF6B EP300 FNDC3B
DGKH FUT8 PRDM4 RAB8B NDRG3
CLINT1 SNX9 KIAA2026 YIPF4 SERINC5
CTDSP2 IQGAP2 NCOA1 PLIN3 SPAG16
ZMYND11 SMC5 UCHL5 TARSL2 CDKN3
PUM2 TAX1BP1 C19orf44 ATXN10 DYRK4
KIAA1143 LMBR1 COA1 ENSOARG00000010149 PRSS21
TSGA13 KIF27 NRD1 SLC9C2 PSME3
CCDC174 F2 ENSOARG00000020917 FAM92A1 SKIV2L2
GMPS CRYBG3 PHF20L1 CSPP1 KIAA1324
PSD3 KLHL32 KAT2B NAA15 LMBRD2
SEC62 TRIM11 RAD51C BDP1 TM9SF4
RBM39 FUBP1 WDR88 HADHB ENSOARG00000017506
ATE1 CDC37L1 ENSOARG00000007319 LRRIQ3 ENSOARG00000017106
PDK3 DCAF5 RAE1 KHDRBS3 ENSOARG00000001675
ZMYM2 CDK13 OS9 FLOT1 ENSOARG00000011009
TBC1D23 SAP30BP ASXL2 SPAG9 PEX1
PCM1 BIN3 CLPX RAP1GDS1 RBM38
SMCO2 CAGE1 ODF2 WDR37 OPTN
MFF PAM TTC7A SKAP2 AGTPBP1
RAB11FIP2 SEC31A CAPN2 MRPL51 CSNK2A2
ATG5 MAP3K7 ZNF276 DNAH6 NISCH
USP6NL RFX3 ENSOARG00000018278 PTPRA TRIM37
C9orf43 PFDN1 THUMPD3 TAF2 ZSWIM7
C19orf45 C20orf144 HELZ AP3B1 YPEL2
C11orf58 EXOC7 LSM12 ZNF106 FAM114A2
SPATA6L ASB8 ENSOARG00000021161 GPR116 INTS8
NA PLK4 GDE1 GLT1D1 GTF3A
PSPC1 LMBR1L LRRFIP2 RPL22 ENSOARG00000001195
RALY PDCD4 RBM44 PIK3C3 FER
RBM26 DDX4 CDS1 STAG3 ENSOARG00000006886
DNA2 SETD3 HNRNPLL NFE2L1 ENSOARG00000006777
GKAP1 PSMF1 KDSR SOCS7 ENSOARG00000000941
GOSR1 SPATA16 NUP88 SETD4 ENSOARG00000020362
BMS1 YWHAB TRRAP ARHGEF39 C11orf65
TMEM254 PRRC2C DCTN1 PSMB10 SNX25
AK8 CAB39 TTLL6 NBEA IWS1
PPP2R5A MORC3 PDILT RIC8B CDC27
MTFR1L EXOC1 RAB5A HIPK1 MROH5
CLASP1 C2CD5 UQCC1 UBAP2L ADRM1
TEX9 CERS3 GTF2A1 RAB11B HSDL2
SMARCA2 LANCL2 RAB3GAP1 DUS2 HSPA14
KATNAL2 TP53INP1 DR1 ENPP2 RAD18
ATP11B CLPB BBS4 PEX11B RNF145
GPBP1 HERC2 TBC1D15 SPEM1 ZNF451
EIF4B MRPS18A PHF14 TBC1D5 UBOX5
CFAP45 LRP8 RANBP17 SNAPC3 PRMT1

Appendices
279
RGL1 EFR3B TEX26 PGRMC2 TOPBP1
CFAP44 PPIP5K2 SNX1 SCAMP1 LRRC36
ANGEL1 PAN3 ZNF207 DMTF1 EHBP1
PPIL6 FAM49B AKAP13 SLC29A1 PGM3
ADAM32 BTBD16 MGAT4A ADAM2 PAPD5
CFAP53 MMAA UNC50 ENSOARG00000008041 SNRNP200
DDX5 BCL2L2-PABPN1 ARID2 OXSR1 STK36
TNPO3 MYO9A PSMD4 COPA ENSOARG00000014682
LRRC63 MAPK9 BBX MAPRE3 SOS1
LY6G6C SMC6 TEKT5 DNAJB4 DUSP16
PRPF40B EAPP NAMPT TAF9 CLEC16A
ABHD16A SMG7 OTUB1 SOBP RFC1
MBD2 TOM1L1 NIT2 C20orf85 HOMEZ
DDHD1 HPS5 RALGAPB U2SURP TIMM22
FIP1L1 PRDM5 FBN2 CTNNA1 ENSOARG00000019579
EML4 TM9SF3 ATP2C1 KALRN ENSOARG00000014353
C12orf50 BRAF LRRC1 SCAMP3 ENSOARG00000008531
ST7L CRABP1 KLHL12 TBC1D1 ENSOARG00000005386
MED13 PPP6R3 FNBP4 BRE ENSOARG00000016858
ATL3

Appendices
280
Appendix Table 7.6. The number of differential alternative splicing events per chromosome length.
Chromosome chromosome length AS-number ratio
chr11 62248096 66 10.60
chr7 100079507 73 7.29
chr13 83079144 51 6.14
chr22 50832532 31 6.10
chr19 60464314 35 5.79
chr20 51176841 29 5.67
chr24 42034648 23 5.47
chr3 224283230 118 5.26
chr5 107901688 54 5.00
chr18 68604602 33 4.81
chr14 62722625 28 4.46
chr21 50073674 21 4.19
chr23 62330649 24 3.85
chr12 79100223 30 3.79
chr1 275612895 101 3.66
chr17 72286588 26 3.60
chr10 86447213 31 3.59
chr8 90695168 31 3.42
chr26 44077779 14 3.18
chr2 248993846 76 3.05
chr9 94726778 28 2.96
chr4 119255633 34 2.85
chr16 71719816 19 2.65
chr15 80923592 20 2.47
chr6 117031472 27 2.31
chr25 45367442 9 1.98
chrX 135437088 8 0.59