Embed Size (px)
Citation preview

Celliant (formerly Holofiber)
Blood Flow Studies
Dr. Lawrence A. Lavery, DPM, MPH Loyola Medical University Center
2160 South First Avenue Maywood IL 60153
March 3, 2003

Holofiber Blood Flow Studies
Objective: To evaluate changes in peripheral blood flow in the hands and feet of persons
with diabetes when Holofiber gloves and stockings are worn. We expect that patients that
wear the Holofiber garments will have an increase in local tissue perfusion compared to
baseline and control garments. The study outcomes are transcutaneous oxygen and laser
Doppler flowometry measurements over the course of one hour while the study subjects
wear Holofiber garments and placebo garments.
Study Design: This will be a double blind evaluation of changes in peripheral perfusion.
Subjects will act as their own controls. We plan to enroll 20 subjects with a history of
diabetes and vascular impairment. Subjects will be evaluated for baseline blood flow
status. They will then have transcutaneous oxygen (Perimed Inc. North Royalton, Ohio,
PF5040 transcutaneous module) and laser Doppler flowometry measurements
(PF5010Laser Doppler Perfusion module) with stockings and gloves made with and
without Holofiber. Measurements will be made prior to wearing the garments and
continuously over a one hour period. We will analyze data at ten minute intervals. The
tester and subject will be blinded to the study garment. Garments will be randomly
selected and tested from a computer generated randomization list. We will take
measurements of both the hand and foot with study subjects wearing Holofiber versus
standard fiber gloves and stockings.
The diagnosis of diabetes mellitus will be based on World Health Organization criteria.8
For the purposes of this study, the diagnosis of peripheral vascular disease will be a
transcutaneous oxygen measurement > 30mm Hg taken at the transmetatarsal level on the
day of enrollment. 5, 9
Inclusion Criteria:
1. Diagnosis of Diabetes Mellitus by the World Health Organization Criteria
2. Patient 18 -80 years old.

Exclusion Criteria:
1. Patient currently being treated by dialysis, or having serum creatinine greater than
or equal to 3.0 mg/dl.
2. Patient known to be an active alcohol or substance abuser for the six months prior
to the start of the study.
3. Patient currently receiving systemic corticosteriods in a dose equivalent to greater
than or equal to 10 mg of prednisone per day.
4. Patient currently receiving immunosuppressive agents.
5. Patient currently receiving radiation therapy.
6. Patient currently receiving cytotoxic agents.
7. Patient currently receiving antiviral agents.
8. Patient having history of widespread malignant or systemically
immunocompromising disease.
9. Patient is a female who is breast feeding, pregnant, or attempting to become
pregnant.
10. Patient has other conditions considered by the investigator to be sound reasons
for disqualification (e.g., acute illness or exacerbation of chronic illness, lack of
motivation, and history of poor compliance).
11. Amputation proximal toLisfranc’s(tarsometatarsal) joint or if amputation/surgical
debridement has destroyed the venous plexus of the plantar arch.
12. Acute deep venous thrombosis.
13. Active congestive heart failure.
14. Uncontrolled osteomyelitis.
15. Vascular surgery in the past 4 weeks.
16. Patient has a full thickness skin ulcer.
The dynamic non-invasive vascular assessment will consist of transcutaneous oxygen
pressure (TcPO2) measurement, and laser Doppler flowmetric measurement. We will use
the PeriFlux 5000 System It is a multifunctional system that incorporates four functional
units that combine transcutansous oxygen and laser Doppler function units.

The transcutaneous oxygen electrodes are warmed to 44°C and allowed to equilibrate on
the skin for 5 minutes (until stable values are achieved). The resultant values are
measured in mmHg. 5, 9
The laser Doppler monitor will be used to continuously measure
tissue blood perfusion (PF5010 Laser Doppler Perfusion module). The application is non-
invasive. Two stick-on probes similar to standard EKG probes are applied to the skin. In
the tissue, the laser light is scattered and Doppler shifted by interaction with the moving
blood cells according to the well-known Doppler principle. The sampling depth is on the
order of 200-500 micrometers. A fraction of the backscattered light is detected by a
remotely positioned photo detector.
We will measure transcutaneous oxygen and laser Doppler flowometry measurements
continuously during the one hour evaluation period and record values for 60 seconds at
ten minute intervals on the dorsum of the foot and hand. In addition, we will measure a
two minute interval at the conclusion of each data collection period to compare the
change in blood flow parameters in placebo and Holofiber treatment groups.
Results:
We used a paired t-test to compare transcutaneous oxygen (TCOM) and laser Doppler
(LD) values on the hand and foot. Treanscutaneous oxygen measures the partial pressure
of oxygen at the surface of the skin, and the laser Doppler measures capillary blood flow.
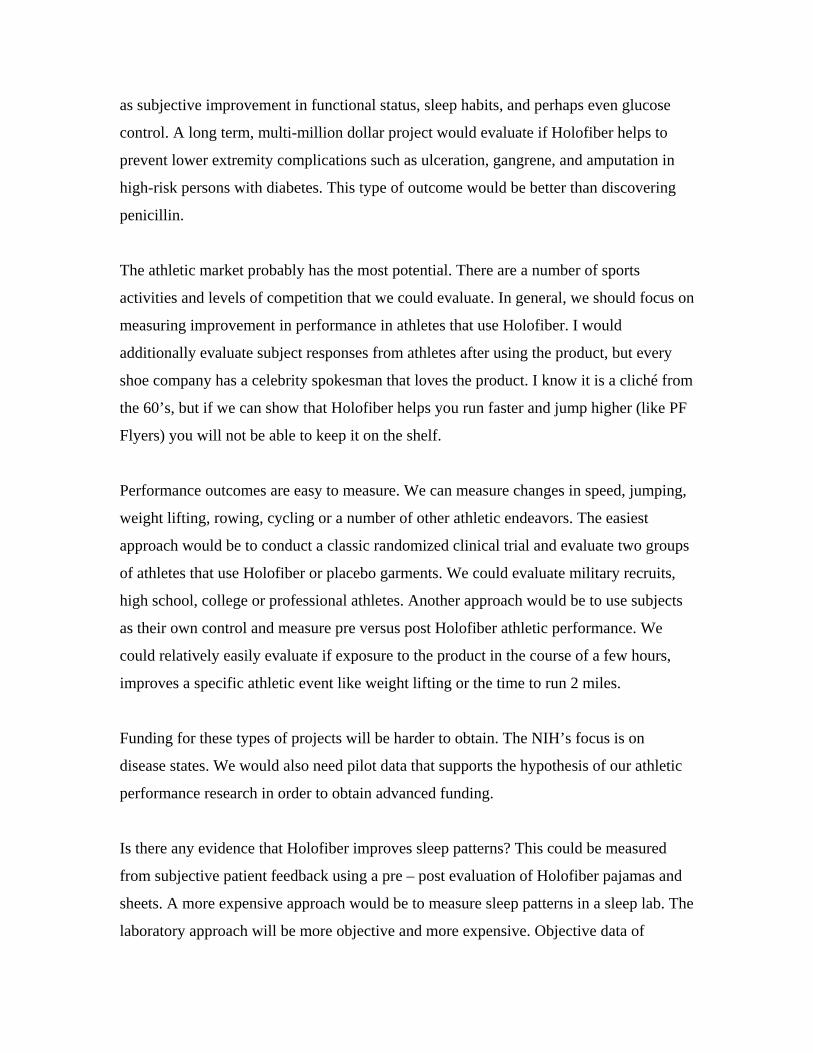
As part of the descriptive evaluation of the data we, stratified TCOM and LD into three
levels: increase when comparing Holofiber to placebo, no change or a decrease when
comparing Holofiber to placebo. If there was less than a 4% change when the placebo vs.
Holofiber was used, this was determined to represent “no change”. TCOM’s in the hand
showed 10 subjects with an increase, 4 unchanged and 6 with a decrease when using
Holofiber compared to the placebo garment. TCOM’s in the foot again showed 10
subjects with an increase when using Holofiber, 4 were unchanged and 6 were decreased.
There was a statistically significant change in transcutaneous oxygen or the oxygen
delivery to the skin in the hand and foot when using the paired t-test to compare data
collected at time periods 40 and 50 minutes after initiation of testing. The Laser Doppler

studies did not show a difference in blood flow in placebo versus Holofiber in either the
hand or the foot. The significant changes observed are very compelling for this type of
product. An 8-12% improvement in skin oxygenation could improve marginal circulation
enough to improve wound healing or eliminate ischemic pain of the legs.
All 10 Minute Interval Data (Paired) Paired T-Test and CI: TCOM HAND-Placebo, TCOM HAND-Holofiber Paired T for TCOM HAND-Placebo - TCOM HAND-Holofiber N Mean St Dev SE Mean TCOM HAND-Pl 120 15.284 7.613 0.695 TCOM HAND-ho 120 17.323 10.505 0.959 Difference 120 -2.039 7.718 0.705 95% CI for mean difference: (-3.434, -0.644) T-Test of mean difference = 0 (vs not = 0): T-Value = -2.89 P-Value = 0.005
20100-10-20-30-40-50
60
40
20
0
Differences
Freq
uenc
y
Histogram of Differences(with Ho and 95% t-confidence interval for the mean)
[ ]X_
Ho

All 10 Minute Interval Data (Paired) Paired T-Test and CI: TCOM FOOT-Placebo, TCOM FOOT-Holofiber Paired T for TCOM FOOT-Placebo - TCOM FOOT-Holofiber N Mean St Dev SE Mean TCOM FOOT-pl 120 52.22 20.39 1.86 TCOM FOOT-ho 120 56.35 20.01 1.83 Difference 120 -4.13 11.25 1.03 95% CI for mean difference: (-6.16, -2.10) T-Test of mean difference = 0 (vs not = 0): T-Value = -4.02 P-Value = 0.000
20100-10-20-30-40
20
10
0
Differences
Freq
uenc
y
Histogram of Differences(with Ho and 95% t-confidence interval for the mean)
[ ]X_
Ho

All 10 Minute Interval Data (Paired) Paired T-Test and CI: LASER HAND-Placebo, LASER HAND-Holofiber Paired T for LASER HAND-Placebo - LASER HAND-Holofiber N Mean St Dev SE Mean LASER HAND-p 120 35.00 28.84 2.63 LASER HAND-h 120 33.91 25.62 2.34 Difference 120 1.09 15.67 1.43 95% CI for mean difference: (-1.74, 3.92) T-Test of mean difference = 0 (vs. not = 0): T-Value = 0.76 P-Value = 0.447
500-50
60
40
20
0
Differences
Freq
uenc
y
Histogram of Differences(with Ho and 95% t-confidence interval for the mean)
[ ]X_
Ho
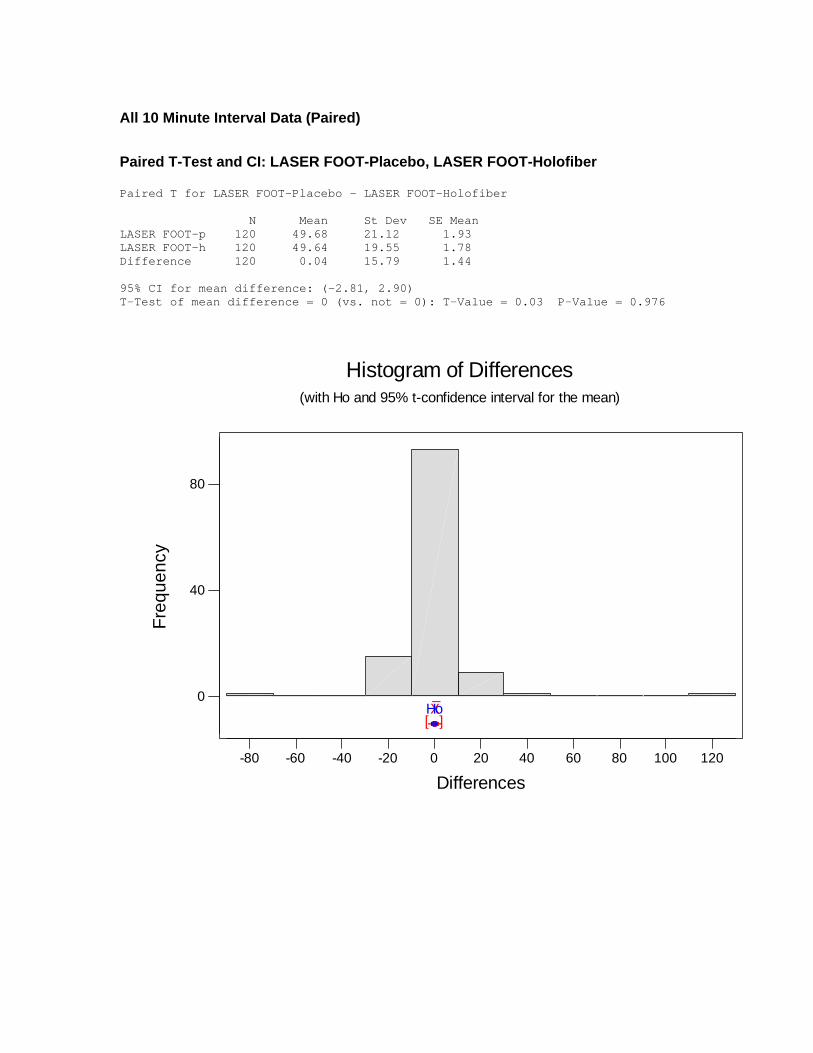
All 10 Minute Interval Data (Paired) Paired T-Test and CI: LASER FOOT-Placebo, LASER FOOT-Holofiber Paired T for LASER FOOT-Placebo - LASER FOOT-Holofiber N Mean St Dev SE Mean LASER FOOT-p 120 49.68 21.12 1.93 LASER FOOT-h 120 49.64 19.55 1.78 Difference 120 0.04 15.79 1.44 95% CI for mean difference: (-2.81, 2.90) T-Test of mean difference = 0 (vs. not = 0): T-Value = 0.03 P-Value = 0.976
120100806040200-20-40-60-80
80
40
0
Differences
Freq
uenc
y
Histogram of Differences(with Ho and 95% t-confidence interval for the mean)
[ ]X_
Ho
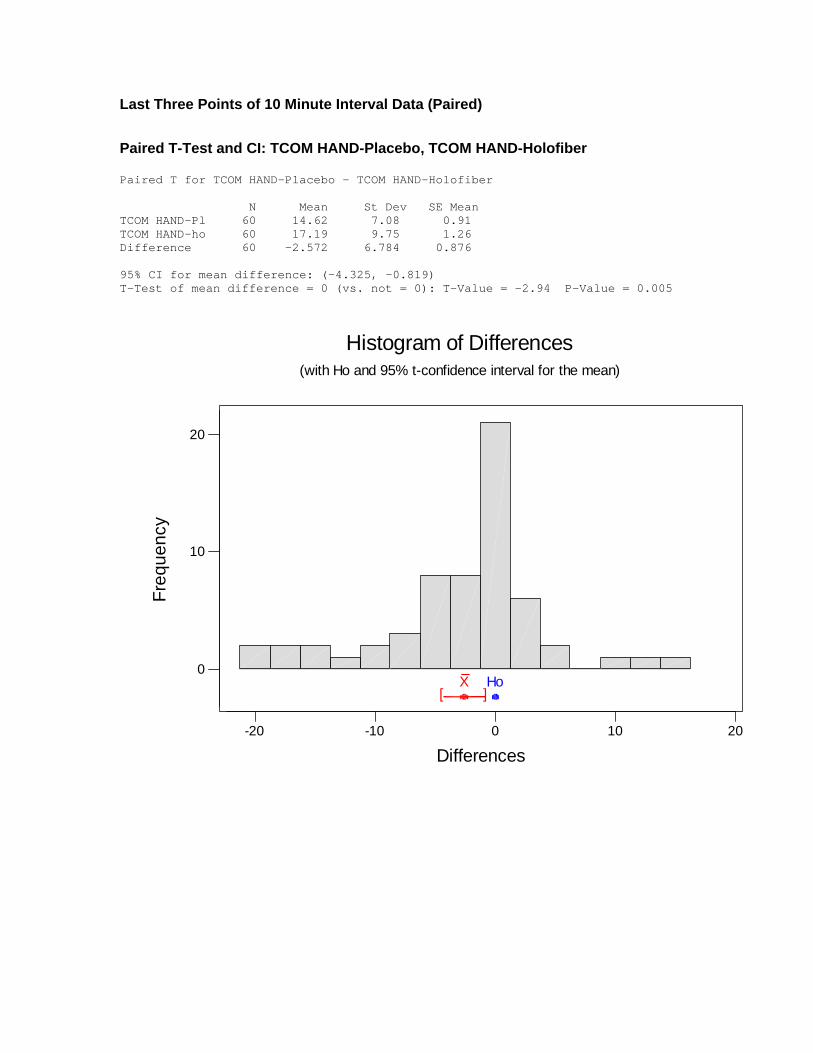
Last Three Points of 10 Minute Interval Data (Paired) Paired T-Test and CI: TCOM HAND-Placebo, TCOM HAND-Holofiber Paired T for TCOM HAND-Placebo - TCOM HAND-Holofiber N Mean St Dev SE Mean TCOM HAND-Pl 60 14.62 7.08 0.91 TCOM HAND-ho 60 17.19 9.75 1.26 Difference 60 -2.572 6.784 0.876 95% CI for mean difference: (-4.325, -0.819) T-Test of mean difference = 0 (vs. not = 0): T-Value = -2.94 P-Value = 0.005
20100-10-20
20
10
0
Differences
Freq
uenc
y
Histogram of Differences(with Ho and 95% t-confidence interval for the mean)
[ ]X_
Ho

Last Three Points of 10 Minute Interval Data (Paired) Paired T-Test and CI: TCOM FOOT-Placebo, TCOM FOOT-Holofiber Paired T for TCOM FOOT-Placebo - TCOM FOOT-Holofiber N Mean St Dev St Dev SE Mean TCOM FOOT-pl 60 54.19 19.90 2.57 TCOM FOOT-ho 60 58.57 21.29 2.75 Difference 60 -4.38 12.27 1.58 95% CI for mean difference: (-7.55, -1.21) T-Test of mean difference = 0 (vs. not = 0): T-Value = -2.76 P-Value = 0.008
20100-10-20-30-40
15
10
5
0
Differences
Freq
uenc
y
Histogram of Differences(with Ho and 95% t-confidence interval for the mean)
[ ]X_
Ho

Last Three Points of 10 Minute Interval Data (Paired) Paired T-Test and CI: LASER HAND-Placebo, LASER HAND-Holofiber Paired T for LASER HAND-Placebo - LASER HAND-Holofiber N Mean St Dev SE Mean LASER HAND-p 60 33.52 28.32 3.66 LASER HAND-h 60 33.48 25.89 3.34 Difference 60 0.05 15.24 1.97 95% CI for mean difference: (-3.89, 3.98) T-Test of mean difference = 0 (vs. not = 0): T-Value = 0.02 P-Value = 0.981 Paired T-Test and CI: LASER FOOT-Placebo, LASER FOOT-Holofiber Paired T for LASER FOOT-Placebo - LASER FOOT-Holofiber N Mean St Dev SE Mean LASER FOOT-p 60 49.90 19.48 2.51 LASER FOOT-h 60 51.56 21.49 2.77 Difference 60 -1.65 14.80 1.91 95% CI for mean difference: (-5.48, 2.17) T-Test of mean difference = 0 (vs. not = 0): T-Value = -0.86 P-Value = 0.391

Last Point of 10 Minute Interval Data (Paired) Paired T-Test and CI: TCOM HAND-Placebo, TCOM HAND-Holofiber Paired T for TCOM HAND-Placebo - TCOM HAND-Holofiber N Mean St Dev SE Mean TCOM HAND-Pl 20 15.15 8.08 1.81 TCOM HAND-ho 20 17.17 10.17 2.28 Difference 20 -2.02 6.60 1.48 95% CI for mean difference: (-5.11, 1.07) T-Test of mean difference = 0 (vs. not = 0): T-Value = -1.37 P-Value = 0.187
105-0-5-10-15-20
10
5
0
Differences
Freq
uenc
y
Histogram of Differences(with Ho and 95% t-confidence interval for the mean)
[ ]X_
Ho
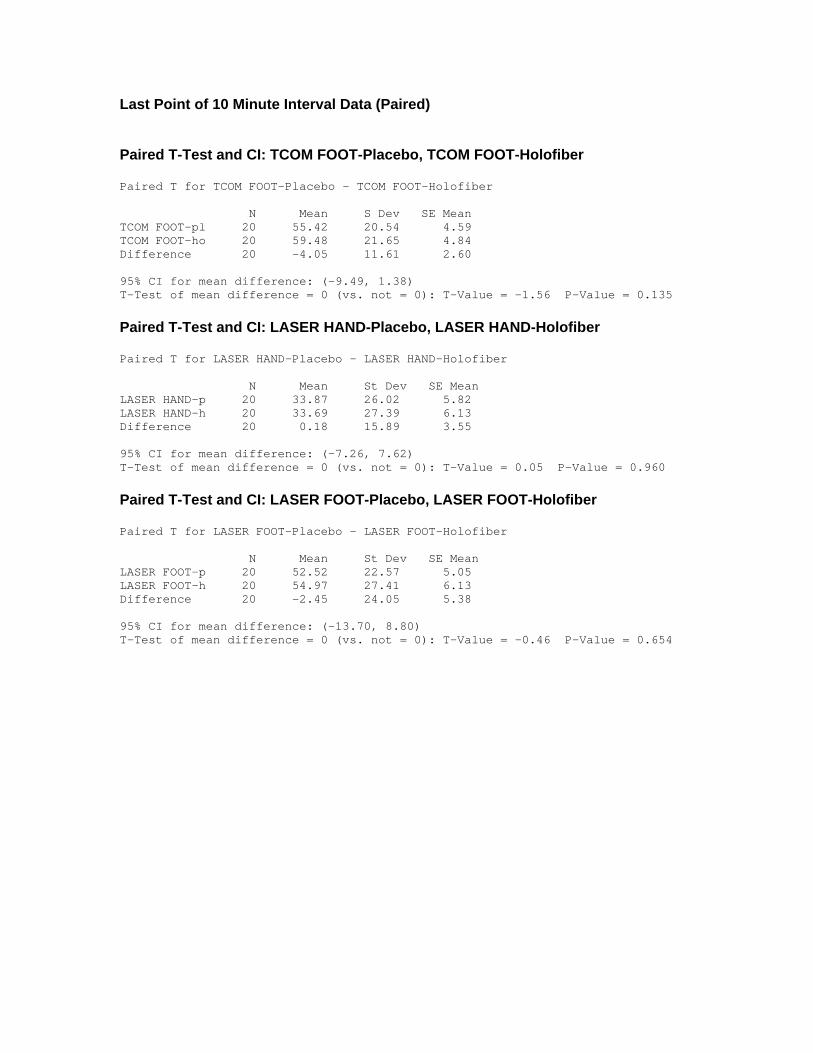
Last Point of 10 Minute Interval Data (Paired) Paired T-Test and CI: TCOM FOOT-Placebo, TCOM FOOT-Holofiber Paired T for TCOM FOOT-Placebo - TCOM FOOT-Holofiber N Mean S Dev SE Mean TCOM FOOT-pl 20 55.42 20.54 4.59 TCOM FOOT-ho 20 59.48 21.65 4.84 Difference 20 -4.05 11.61 2.60 95% CI for mean difference: (-9.49, 1.38) T-Test of mean difference = 0 (vs. not = 0): T-Value = -1.56 P-Value = 0.135 Paired T-Test and CI: LASER HAND-Placebo, LASER HAND-Holofiber Paired T for LASER HAND-Placebo - LASER HAND-Holofiber N Mean St Dev SE Mean LASER HAND-p 20 33.87 26.02 5.82 LASER HAND-h 20 33.69 27.39 6.13 Difference 20 0.18 15.89 3.55 95% CI for mean difference: (-7.26, 7.62) T-Test of mean difference = 0 (vs. not = 0): T-Value = 0.05 P-Value = 0.960 Paired T-Test and CI: LASER FOOT-Placebo, LASER FOOT-Holofiber Paired T for LASER FOOT-Placebo - LASER FOOT-Holofiber N Mean St Dev SE Mean LASER FOOT-p 20 52.52 22.57 5.05 LASER FOOT-h 20 54.97 27.41 6.13 Difference 20 -2.45 24.05 5.38 95% CI for mean difference: (-13.70, 8.80) T-Test of mean difference = 0 (vs. not = 0): T-Value = -0.46 P-Value = 0.654

1st Half to 2nd Half of Test Paired T-Test and CI: 1 Holofiber-TCOM Hand, 2 Holofiber-TCOM Hand Paired T for 1 Holofiber-TCOM Hand - 2 Holofiber-TCOM Hand N Mean St Dev SE Mean 1 Holofiber-TCOM 60 17.45 11.29 1.46 2 Holofiber-TCOM 60 17.19 9.75 1.26 Difference 60 0.256 4.321 0.558 95% CI for mean difference: (-0.860, 1.372) T-Test of mean difference = 0 (vs. not = 0): T-Value = 0.46 P-Value = 0.648
3020100
20
10
0
Differences
Freq
uenc
y
Histogram of Differences(with Ho and 95% t-confidence interval for the mean)
[ ]X_
Ho

1st Half to 2nd Half of Test Paired T-Test and CI: 1 Holofiber-TCOM Foot, 2 Holofiber-TCOM Foot Paired T for 1 Holofiber-TCOM Foot - 2 Holofiber-TCOM Foot N Mean St Dev SE Mean 1 Holofiber-TCOM 60 54.14 18.55 2.39 2 Holofiber-TCOM 60 58.57 21.29 2.75 Difference 60 -4.43 9.14 1.18 95% CI for mean difference: (-6.79, -2.07) T-Test of mean difference = 0 (vs. not = 0): T-Value = -3.76 P-Value = 0.000
1050-5-10-15-20-25-30-35-40
20
10
0
Differences
Freq
uenc
y
Histogram of Differences(with Ho and 95% t-confidence interval for the mean)
[ ]X_
Ho

1st Half to 2nd Half of Test Paired T-Test and CI: 1 Placebo-TCOM Hand, 2 Placebo-TCOM Hand Paired T for 1 Placebo-TCOM Hand - 2 Placebo-TCOM Hand N Mean St Dev SE Mean 1 Placebo -TC 60 15.94 8.12 1.05 2 Placebo -TC 60 14.62 7.08 0.91 Difference 60 1.322 5.102 0.659 95% CI for mean difference: (0.004, 2.640) T-Test of mean difference = 0 (vs. not = 0): T-Value = 2.01 P-Value = 0.049
20100-10
20
10
0
Differences
Freq
uenc
y
Histogram of Differences(with Ho and 95% t-confidence interval for the mean)
[ ]X_
Ho
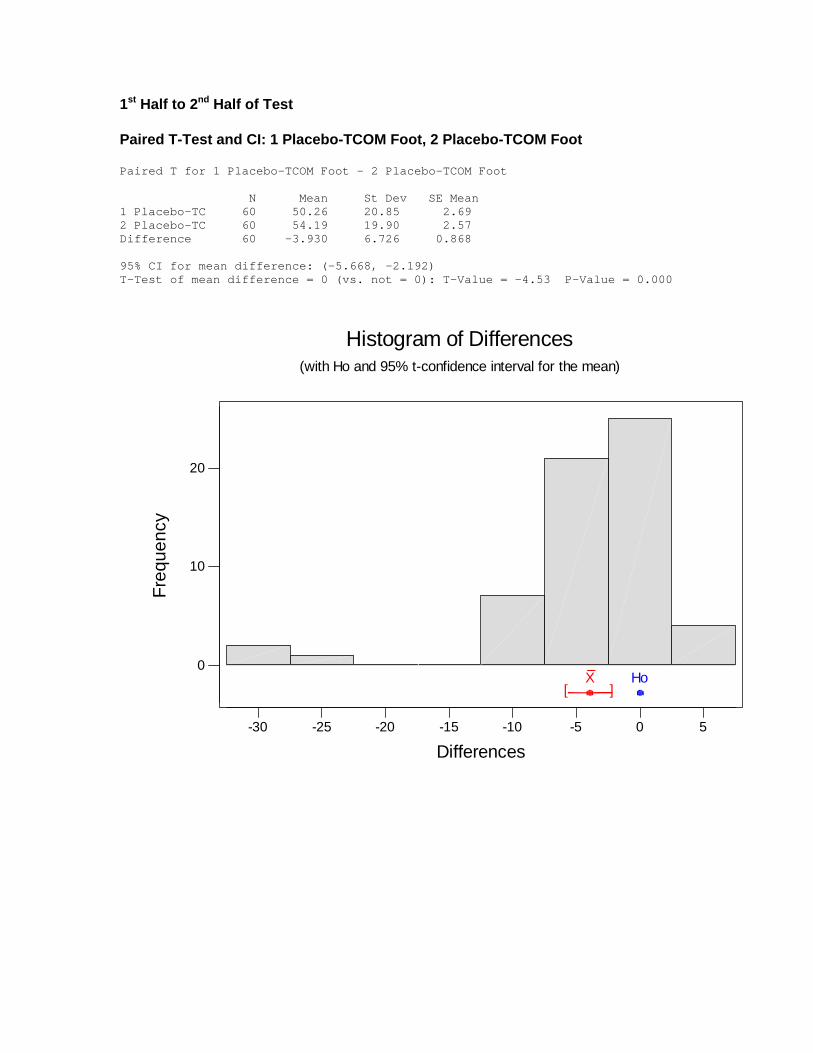
1st Half to 2nd Half of Test Paired T-Test and CI: 1 Placebo-TCOM Foot, 2 Placebo-TCOM Foot Paired T for 1 Placebo-TCOM Foot - 2 Placebo-TCOM Foot N Mean St Dev SE Mean 1 Placebo-TC 60 50.26 20.85 2.69 2 Placebo-TC 60 54.19 19.90 2.57 Difference 60 -3.930 6.726 0.868 95% CI for mean difference: (-5.668, -2.192) T-Test of mean difference = 0 (vs. not = 0): T-Value = -4.53 P-Value = 0.000
50-5-10-15-20-25-30
20
10
0
Differences
Freq
uenc
y
Histogram of Differences(with Ho and 95% t-confidence interval for the mean)
[ ]X_
Ho

Last Two Points 10 Minute Interval Data (Paired) Paired T-Test and CI: Placebo-TCOM Hand, Holofiber-TCOM Hand Paired T for Placebo-TCOM Hand - Holofiber-TCOM Hand N Mean St Dev SE Mean Placebo-TCOM 40 14.68 7.32 1.16 Holofiber-TCOM Ha 40 17.49 9.91 1.57 Difference 40 -2.82 6.67 1.05 95% CI for mean difference: (-4.95, -0.68) T-Test of mean difference = 0 (vs. not = 0): T-Value = -2.67 P-Value = 0.011
1284-0-4-8-12-16-20
15
10
5
0
Differences
Freq
uenc
y
Histogram of Differences(with Ho and 95% t-confidence interval for the mean)
[ ]X_
Ho

Last Two Points 10 Minute Interval Data (Paired) Paired T-Test and CI: Placebo-TCOM Foot, Holofiber-TCOM Foot Paired T for Placebo-TCOM Foot - Holofiber-TCOM Foot N Mean St Dev SE Mean Placebo-TCOM 40 54.76 19.92 3.15 Holofiber-TCOM 40 59.10 21.02 3.32 Difference 40 -4.33 12.85 2.03 95% CI for mean difference: (-8.44, -0.22) T-Test of mean difference = 0 (vs. not = 0): T-Value = -2.13 P-Value = 0.039
20100-10-20-30-40
10
5
0
Differences
Freq
uenc
y
Histogram of Differences(with Ho and 95% t-confidence interval for the mean)
[ ]X_
Ho

Average of All
0
10
20
30
40
50
60
70
0 10 20 30 40 50 60 70
Time
Placebo-TCOM HandPlacebo-TCOM FootHolo-TCOM HandHolo-TCOM Foot
Limitations: This preliminary study provides some insight into the potential for
Holofiber. This project should be considered as a pilot project to build on. Prior to
beginning the project we had little scientific information about the effect that Holofiber
might have on perfusion to the extremities. There is obviously a lot that we still do not
understand about Holofiber and the best way to optimize its use.
Patient selection: We enrolled diabetic males with an abnormal clinical vascular
examination. Our results may have been better if we included patients with more severe
vascular impairment. The subjects that may benefit the most may be diabetics with very
severe disease, patients with Raynaud’s disease, or peripheral arterial occlusive disease.

For instance, in the future we may want to include patients with baseline transcutaneous
oxygen values less than 20 or 30 mm Hg.
Duration of the evaluation: The study period for this project was one hour. This may
not have been a long enough period to observe the greatest impact of the product. Several
of the patients that have voiced strong subjective improvement related their symptoms
did not change until they wore the garment for more than an hour.
Wash out period: It is unclear if a “wash out” period was needed for subjects that were
treated with the Holofiber and subsequently were treated with the placebo garments. This
would suggest that there was a lasting effect of the Holofiber material. The current
analysis did not indicate there was a trend to support this theory.
Light Exposure: Since one of the theories regarding the mechanism of action of
Holofiber involves infrared light, Holofiber may be more effective when the patient is
exposed to natural light during the evaluation period. The current study was conducted in
a room without any exposure to natural light.
Recommendations: The pilot data is compelling. I am very optimistic that we could
pursue additional funding through the National Institute of Health. Probably the best bet
would be to apply for a Technology Transfer Grant or through an award from the
Alternative Medicine Institute of the NIH.
Future research should focus on the target markets for this product. In addition, we
should identify the mechanism of action of Holofiber, if that is possible. Initially, I would
build on the data from the current project and focus on vascular improvement and
subjective improvement in persons with diabetes mellitus. My recommendations would
be to expand the scope of the pilot study. We should expand the study population and
evaluate specific “risk groups’ within the diabetic population that would benefit form the
product such as dialysis patients. We need to evaluate patients after they wear Holofiber
over the course of hours days or weeks. We should measure vascular parameters as well
as subjective improvement in functional status, sleep habits, and perhaps even glucose
control. A long term, multi-million dollar project would evaluate if Holofiber helps to
prevent lower extremity complications such as ulceration, gangrene, and amputation in
high-risk persons with diabetes. This type of outcome would be better than discovering
penicillin.
The athletic market probably has the most potential. There are a number of sports
activities and levels of competition that we could evaluate. In general, we should focus on
measuring improvement in performance in athletes that use Holofiber. I would
additionally evaluate subject responses from athletes after using the product, but every
shoe company has a celebrity spokesman that loves the product. I know it is a cliché from
the 60’s, but if we can show that Holofiber helps you run faster and jump higher (like PF
Flyers) you will not be able to keep it on the shelf.
Performance outcomes are easy to measure. We can measure changes in speed, jumping,
weight lifting, rowing, cycling or a number of other athletic endeavors. The easiest
approach would be to conduct a classic randomized clinical trial and evaluate two groups
of athletes that use Holofiber or placebo garments. We could evaluate military recruits,
high school, college or professional athletes. Another approach would be to use subjects
as their own control and measure pre versus post Holofiber athletic performance. We
could relatively easily evaluate if exposure to the product in the course of a few hours,
improves a specific athletic event like weight lifting or the time to run 2 miles.
Funding for these types of projects will be harder to obtain. The NIH’s focus is on
disease states. We would also need pilot data that supports the hypothesis of our athletic
performance research in order to obtain advanced funding.
Is there any evidence that Holofiber improves sleep patterns? This could be measured
from subjective patient feedback using a pre – post evaluation of Holofiber pajamas and
sheets. A more expensive approach would be to measure sleep patterns in a sleep lab. The
laboratory approach will be more objective and more expensive. Objective data of

enhanced REM sleep and other sleep parameters would attract significant attention to the
product.
There are a number of areas and questions that we could pursue.
1. Does Holofiber improve in persons with diabetes?
Does Holofiber improve blood flow in diabetics?
Does Holofiber improve pain-free walking in diabetic with intermittent claudication?
Does Holofiber improve wound healing in venous stasis ulcers, diabetic neuropathic
ulcers, and ischemic ulcers?

Transcutaneous measurement of
the foot mean mean
id no. Order of treatment values values Percentage change Change with
Holofiber
121 placebo - Holofiber 14.48 27.39 89.07 increase
119 placebo - Holofiber 78.74 70.92 -9.93 decrease
118 placebo - Holofiber 20.3 43.9 116.3 increase
116 placebo - Holofiber 82.35 92.58 12.42 increase
113 placebo - Holofiber 45.76 52.44 14.61 increase
112 placebo - Holofiber 57.88 60.65 4.79 increase
102 placebo - Holofiber 54.65 50.82 -7 decrease
104 placebo - Holofiber 65.5 57.96 -11.52 decrease
105 placebo - Holofiber 68.51 106.61 55.61 increase
109 placebo - Holofiber 91.73 85.74 -6.53 decrease
106 placebo - Holofiber 35.79 23.17 -35.25 decrease
107 Holofiber -
placebo 53.42 37.5 29.8 increase
108 Holofiber -
placebo 55.63 53.63 3.59 no change
101 Holofiber -
placebo 54.34 55.82 -2.72 no change
110 Holofiber -
placebo 92.91 81.88 11.86 increase
111 Holofiber -
placebo 57.53 48 16.58 increase
114 Holofiber -
placebo 60.69 62.37 -2.77 no change
115 Holofiber -
placebo 55.1 57.75 -4.81 decrease
117 Holofiber -
placebo 44.28 40.93 7.56 increase
120 Holofiber -
placebo 51.06 51.92 -1.69 no change
Transcutaneous measurment of
the hand mean mean
id no. Order of treatment values values
Percentage change
Change with Holofiber
121 placebo - Holofiber 14.82 12.63 -14.81 decrease
119 placebo - Holofiber 21.19 31.45 48.4 increase
118 placebo - Holofiber 32.5 42.77 31.61 increase
116 placebo - Holofiber 5.91 5.98 1.23 no change
113 placebo - Holofiber 13.63 14.35 5.34 decrease
112 placebo - Holofiber 14.72 15.04 2.18 no change
102 placebo - Holofiber 9.51 13.33 40.22 increase
104 placebo - Holofiber 11.19 9.95 -11.08 decrease
105 placebo - Holofiber 7.28 9.31 27.91 increase
109 placebo - Holofiber 11.64 11.95 2.69 no change
106 placebo - Holofiber 5.57 7.86 41.18 increase
107 Holofiber -
placebo 5.64 4.36 22.69 increase
108 Holofiber -
placebo 16.18 14.6 9.73 increase
101 Holofiber -
placebo 19.91 14.46 27.36 increase
110 Holofiber -
placebo 9.56 9.64 -0.89 no change
111 Holofiber -
placebo 32.73 17.34 47.02 increase
114 Holofiber -
placebo 22.13 28.45 -28.53 decrease
115 Holofiber -
placebo 14.58 29.75 -104.02 decrease
117 Holofiber -
placebo 25.59 12.93 49.47 increase
120 Holofiber -
placebo 25.81 27.42 -6.27 decrease

Laser doppler of
the hand mean mean
id no. Order of treatment values values percentage change
Change with Holofiber
121 placebo - Holofiber 33.81 43.19 27.74 increase
119 placebo - Holofiber 84.94 69.28 -18.44 decrease
118 placebo - Holofiber 46.02 46.49 1.03 no change
116 placebo - Holofiber 51.9 30.88 -40.51 decrease
113 placebo - Holofiber 20.18 14.83 -26.5 decrease
112 placebo - Holofiber 26.66 29.35 10.08 increase
102 placebo - Holofiber 34.82 46.63 33.93 increase
104 placebo - Holofiber 27.83 29.44 5.8 increase
105 placebo - Holofiber 18.17 13.44 -26.03 decrease
109 placebo - Holofiber 15.75 15.22 -3.33 no change
106 placebo - Holofiber 6.6 5.5 -16.6 increase
107 Holofiber -
placebo 12.64 19.07 -50.93 decrease
108 Holofiber -
placebo 12.96 18.07 -39.48 decrease
101 Holofiber -
placebo 15.52 22.87 -47.4 decrease
110 Holofiber -
placebo 11.47 17.05 -48.7 decrease
111 Holofiber -
placebo 24.55 22.46 8.52 increase
114 Holofiber -
placebo 105.44 104.88 0.53 no change
115 Holofiber -
placebo 93.59 23.89 74.47 increase
117 Holofiber -
placebo 62.58 75.88 -21.25 decrease
120 Holofiber -
placebo 33.81 43.19 -27.74 decrease

Laser doppler of the
foot mean mean
Id no.
Order of treatment values values Percentage change Change with
Holofiber
121 placebo - Holofiber 47.9 60.84 27.01 increase
119 placebo - Holofiber 84.28 75.54 -10.37 decrease
118 placebo - Holofiber 53.29 62.79 17.84 increase
116 placebo - Holofiber 2.71 5.57 105.29 increase
113 placebo - Holofiber 63.47 64.87 2.2 no change
112 placebo - Holofiber 63.47 64.87 2.2 no change
102 placebo - Holofiber 50.23 140.23 179.18 increase
104 placebo - Holofiber 65.84 63.16 -4.08 no change
105 placebo - Holofiber 56.78 61.78 8.79 increase
109 placebo - Holofiber 49.26 50.22 1.96 increase
106 placebo - Holofiber 61.37 57.53 -6.25 decrease
107 Holofiber - placebo 59.35 63.08 -6.27 decrease
108 Holofiber - placebo 57.21 79.87 -39.61 decrease
101 Holofiber - placebo 49.06 45.84 6.55 increase
110 Holofiber - placebo 40.44 43.57 -7.73 decrease
111 Holofiber - placebo 31.69 32.89 -3.81 no change
114 Holofiber - placebo 59.05 62.31 -5.52 decrease
115 Holofiber - placebo 58 59.67 -2.87 no change
117 Holofiber - placebo 4.31 2.3 46.72 increase
120 Holofiber - placebo 46.13 52.08 -12.89 decrease

LITERATURE CITED
1. Most RS, Sinnock P. The epidemiology of lower extremity amputations in diabetic
individuals. Diabetes Care. 1983;6:87-91.
2. Armstrong DG, Lavery LA, Harkless LB. Validation of a diabetic wound
classification system. The contribution of depth, infection, and ischemia to risk of
amputation [see comments]. Diabetes Care. 1998;21:855-9.
3. Lavery LA, Armstrong DG, Vela SA, Quebedeaux TL, Fleischli JG. Practical
Criteria for Screening Patients at High Risk for Diabetic Foot Ulceration. Arch
Intern Med. 1998;158:158-162.
4. LaVan FB, Hunt TK. Oxygen and Wound Healing. Clinics in Plastic Surgery.
1990;17:463-472.
5. Hauser CJ, Klein SR, Mehringer CM, Appel P, Shoemaker WC. Assessment of
perfusion in the diabetic foot by regional transcutaneous oximetry. Diabetes.
1984;33:527-531.
6. Pecoraro RE. Chronology and determinants of Tissue Repair in Diabetic Lower
Extremity Ulcers. Diabetes. 1991;40:1305-1313.
7. Tooke JE. Microcirculation and diabetes. British Medical Bulletin. 1989;45:206-
223.
8. World Health Organization. Second Report on Diabetes Mellitus. . Geneva: World
Health Organization; 1980.
9. Wyss CR, Matsen FA, Simmons CW, Burgess EM. Transcutaneous oxygen tension
measurements on limbs of diabetic and nondiabetic patients with peripheral
vascular disease. Surgery. 1984;95:339-346.
10. Apelqvist J, Castenfors J, Larsson J. Prognostic value of ankle and toe blood
pressure levels in outcome of diabetic foot ulcers. Diabetes Care. 1989;12:373-378.
11. Arnold F, He CYJ, Cherry GW. Perfusion imaging of skin island blood flow by a
scanning laser Doppler device. Brit J Plast Surg. 1995;48:280-287.
12. Kirkwood BR. Essentials of Medical Statistics. . Oxford: Blackwell; 1988.

Patient ID: 101
Holofiber - placebo
BASELINE TCOM HAND LASER HAND TCOM FOOT LASER FOOT
Mean value (Unit) 24.52 16.82 55.6 49.82 Standard Deviation (Unit) 3.57 6.9 0.48 0.29 Standard Error (Unit) 0.13 0.24 0.02 0.01 Area under curve (Unit*sec.) 1228.34 842.67 2785.16 2495.65 10 MINUTES HOLOFIBER Mean value (Unit) 19.89 13.29 54.6 44.08 Standard Deviation (Unit) 3.24 3.48 1.36 0.34 Standard Error (Unit) 0.11 0.12 0.05 0.01 Area under curve (Unit*sec.) 994.9 664.9 2731.59 2205.26 20M MINUTES HOLOFIBER Mean value (Unit) 17.93 12.42 53.86 44.25 Standard Deviation (Unit) 7.33 1.97 1.22 0.87 Standard Error (Unit) 0.26 0.07 0.04 0.03 Area under curve (Unit*sec.) 899.19 622.89 2701.65 2219.58 30 MINUTES HOLOFIBER Mean value (Unit) 16.01 13.11 55.61 48.34 Standard Deviation (Unit) 3.63 3.99 1.86 0.32 Standard Error (Unit) 0.13 0.14 0.07 0.01 Area under curve (Unit*sec.) 794.3 650.01 2758.62 2397.88 40 MINUTYES HOLOFIBER Mean value (Unit) 20.84 12.41 50.05 46.7 Standard Deviation (Unit) 4.55 1.68 1.05 0.21 Standard Error (Unit) 0.16 0.06 0.04 0.01 Area under curve (Unit*sec.) 1032.44 615.01 2479.3 2313.27 50 MINUTES HOLOFIBER Mean value (Unit) 23.19 15.32 51.7 49.39 Standard Deviation (Unit) 3.51 13.77 0.98 0.5 Standard Error (Unit) 0.12 0.48 0.03 0.02 Area under curve (Unit*sec.) 1157.26 764.74 2580.38 2464.88
60 MINUTES HOLOFIBER TCOM HAND LASER HAND TCOM FOOT LASER FOOT
Mean value (Unit) 18.76 12.15 54.42 46.87 Standard Deviation (Unit) 4.06 1.84 1.52 0.48 Standard Error (Unit) 0.14 0.06 0.05 0.02 Area under curve (Unit*sec.) 948.83 614.15 2752.92 2371.13 10 MINUTES PLACEBO Mean value (Unit) 17.96 16.39 48.23 48.87 Standard Deviation (Unit) 6 4.72 1.01 0.43 Standard Error (Unit) 0.22 0.17 0.04 0.02 Area under curve (Unit*sec.) 876.49 800.13 2353.08 2384.35 20 MINUTES PLACEBO Mean value (Unit) 16.23 14.01 50.2 43.88

Standard Deviation (Unit) 2.58 1.66 1.43 0.55 Standard Error (Unit) 0.09 0.06 0.05 0.02 Area under curve (Unit*sec.) 821.9 709.8 2542.56 2222.42 30 MINUTES PLACEBO Mean value (Unit) 17.15 14.56 56.02 46.79 Standard Deviation (Unit) 2.84 2.43 2.03 0.52 Standard Error (Unit) 0.1 0.09 0.07 0.02 Area under curve (Unit*sec.) 859.03 729.36 2805.87 2343.65 40 MINUTES PLACEBO Mean value (Unit) 16.14 13.25 52.87 45.3 Standard Deviation (Unit) 3.11 2.62 0.59 0.69 Standard Error (Unit) 0.11 0.09 0.02 0.02 Area under curve (Unit*sec.) 809.73 664.6 2651.61 2272.11 50 MINUTES PLACEBO Mean value (Unit) 15.44 14.36 60.51 58.32 Standard Deviation (Unit) 4.63 2.19 0.95 1.29 Standard Error (Unit) 0.17 0.08 0.03 0.05 Area under curve (Unit*sec.) 775.33 721.12 3038.74 2928.89 60 MINUTES PLACEBO Mean value (Unit) 16.08 22.06 55.53 48.87 Standard Deviation (Unit) 7.18 15.94 1.14 2.56 Standard Error (Unit) 0.26 0.57 0.04 0.09 Area under curve (Unit*sec.) 803.07 1100.69 2771.29 2439.26

Patient ID: 102 placebo-Holofiber
BASELINE TCOM HAND
LASER HAND
TCOM FOOT
LASER FOOT
Mean value (Unit) 8.66 45.65 55.22 40.67 Standard Deviation (Unit) 2.72 4.5 0.86 0.38 Standard Error (Unit) 0.1 0.16 0.03 0.01 Area under curve (Unit*sec.) 438.71 2312.2 2797.32 2059.9 10 MINUTE PLACEBO Mean value (Unit) 10.27 40.1 5.75 37.56 Standard Deviation (Unit) 3.28 6.94 0.96 0.44 Standard Error (Unit) 0.08 0.17 0.02 0.01 20 MINUTE PLACEBO Mean value (Unit) 10.15 36.71 22.45 40.96 Standard Deviation (Unit) 2.82 6.14 0.62 0.26 Standard Error (Unit) 0.1 0.22 0.02 0.01 Area under curve (Unit*sec.) 501.22 1813.7 1109.29 2023.98 30 MINUTE PLACEBO Mean value (Unit) 10.13 36.2 30.28 41.9 Standard Deviation (Unit) 3.92 3.14 0.83 0.75 Standard Error (Unit) 0.14 0.11 0.03 0.03 Area under curve (Unit*sec.) 514.53 1837.85 1537.66 2127.42 40 MINUTE PLACEBO Mean value (Unit) 11.57 34.57 33.95 47.01 Standard Deviation (Unit) 2.78 3.53 0.35 0.2 Standard Error (Unit) 0.1 0.12 0.01 0.01 Area under curve (Unit*sec.) 593.38 1772.94 1740.97 2410.22 50 MINUTE PLACEBO Mean value (Unit) 9.58 35.59 52.67 47.78 Standard Deviation (Unit) 1.97 3.18 0.1 0.16 Standard Error (Unit) 0.07 0.11 0 0.01 Area under curve (Unit*sec.) 484.85 1800.54 2664.69 2417.03 60 MINUTE PLACEBO Mean value (Unit) 8.99 33.82 55.02 50.6 Standard Deviation (Unit) 2.11 6.96 0.4 0.45 Standard Error (Unit) 0.07 0.24 0.01 0.02 Area under curve (Unit*sec.) 455.18 1712.98 2787.02 2563.31
10 MINUTE HOLOFIBER TCOM HAND
LASER HAND
TCOM FOOT
LASER FOOT
Mean value (Unit) 8.93 43.3 37.54 59.37 Standard Deviation (Unit) 1.85 3.14 0.27 0.3 Standard Error (Unit) 0.07 0.11 0.01 0.01 Area under curve (Unit*sec.) 444.79 2155.53 1869.08 2955.84

20 MINUTE HOLOFIBER Mean value (Unit) 9.53 41.92 38.65 57.8 Standard Deviation (Unit) 1.77 2.95 0.13 0.16 Standard Error (Unit) 0.06 0.1 0 0.01 Area under curve (Unit*sec.) 477.24 2099.87 1936.15 2895.57 30 MINUTE HOLOFIBER Mean value (Unit) 9.67 40.85 40.17 59.47 Standard Deviation (Unit) 1.86 3.69 0.34 0.96 Standard Error (Unit) 0.07 0.13 0.01 0.03 Area under curve (Unit*sec.) 474.01 2003.64 1969.91 2915.9 40 MINUTES HOLOFIBER Mean value (Unit) 12.06 41.65 40.43 57.87 Standard Deviation (Unit) 2.54 3.65 0.28 0.64 Standard Error (Unit) 0.09 0.13 0.01 0.02 Area under curve (Unit*sec.) 607.67 2099.4 2037.75 2916.84 50 MINUTRE HOLOFIBER Mean value (Unit) 13.04 43.7 39.8 59.2 Standard Deviation (Unit) 2.62 3.7 0.4 0.15 Standard Error (Unit) 0.09 0.13 0.01 0.01 Area under curve (Unit*sec.) 637.89 2137.86 1946.79 2895.96 60 MINUTES HOLOFIBER Mean value (Unit) 13.61 46.5 50.5 140.59 Standard Deviation (Unit) 3.61 5.91 1.13 2.51 Standard Error (Unit) 0.11 0.17 0.03 0.07 Area under curve (Unit*sec.) 978.71 3343.47 3630.78 10108.81
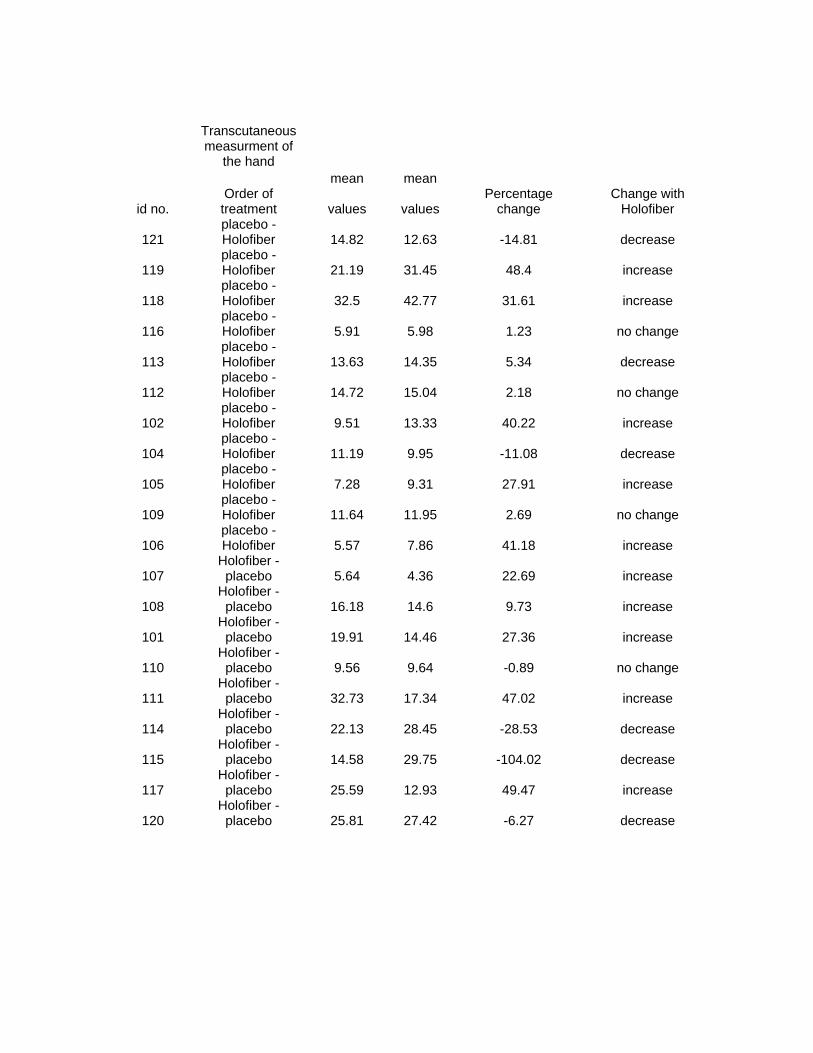
Patient ID:104 placebo - Holofiber
BASELINE TCOM HAND LASER HAND TCOM FOOT LASER FOOT Mean value (Unit) 9.59 27.27 58.95 74.86 Standard Deviation (Unit) 4.17 5.27 0.52 0.61 Standard Error (Unit) 0.15 0.19 0.02 0.02 Area under curve (Unit*sec.) 467.46 1330.34 2876.43 3652.55 10 MIN PLACEBO Mean value (Unit) 22.31 43.44 65.31 68.88 Standard Deviation (Unit) 10.72 6.89 0.5 0.16 Standard Error (Unit) 0.39 0.25 0.02 0.01 Area under curve (Unit*sec.) 1057.09 2057.66 3093.45 3262.85 20 MIN PLACEBO Mean value (Unit) 19.91 26.3 63.01 64.9 Standard Deviation (Unit) 11.08 7.04 0.65 0.24 Standard Error (Unit) 0.28 0.18 0.02 0.01 Area under curve (Unit*sec.) 1876.28 2478.22 5938.24 6116.34 30 MIN PLACEBO Mean value (Unit) 13.19 28.63 67.04 65 Standard Deviation (Unit) 5.24 5.72 1.51 0.98 Standard Error (Unit) 0.14 0.15 0.04 0.03 Area under curve (Unit*sec.) 1147.35 2489.99 5831.53 5654.23 40 MIN PLACEBO Mean value (Unit) 11.83 29.71 64.06 63.89 Standard Deviation (Unit) 2.87 17.62 1.09 0.84 Standard Error (Unit) 0.07 0.44 0.03 0.02 Area under curve (Unit*sec.) 1200.52 3015.51 6502.62 6485.27 50 MIN PLACEBO Mean value (Unit) 12.13 28.64 66.07 66.32 Standard Deviation (Unit) 6.49 5.6 1.09 0.86 Standard Error (Unit) 0.16 0.14 0.03 0.02 Area under curve (Unit*sec.) 1231.21 2907.27 6706.28 6731.59 60 MIN PLACEBO Mean value (Unit) 11.52 27.4 63.88 63.7 Standard Deviation (Unit) 3.33 4.68 0.7 1.02 Standard Error (Unit) 0.12 0.17 0.02 0.04 Area under curve (Unit*sec.) 563.45 1339.87 3124.95 3116.03 10 MIN HOLOFIBER Mean value (Unit) 13.06 29.95 59.11 64.74 Standard Deviation (Unit) 6.26 5.17 0.51 2.42 Standard Error (Unit) 0.23 0.19 0.02 0.09 Area under curve (Unit*sec.) 619.53 1420.55 2803.78 3070.87 20 MIN HOLOFIBER Mean value (Unit) 13.21 28.82 55.27 59.2 Standard Deviation (Unit) 4.51 4.23 0.52 0.59 Standard Error (Unit) 0.16 0.15 0.02 0.02 Area under curve (Unit*sec.) 661.85 1444.08 2768.75 2965.68

30 MIN HOLOFIBER Mean value (Unit) 13.79 26.41 55.19 61.7 Standard Deviation (Unit) 9.57 6.77 1.25 0.46 Standard Error (Unit) 0.33 0.24 0.04 0.02 Area under curve (Unit*sec.) 699.18 1338.76 2798.95 3129.3 40 MIN HOLOFIBER Mean value (Unit) 9.03 33.09 63.95 68.85 Standard Deviation (Unit) 2.84 8.03 0.37 0.38 Standard Error (Unit) 0.1 0.28 0.01 0.01 Area under curve (Unit*sec.) 448.06 1642.01 3172.03 3414.72 50 MIN HOLOFIBER Mean value (Unit) 14.5 31.61 61.32 67.89 Standard Deviation (Unit) 26.64 5.31 0.79 0.52 Standard Error (Unit) 0.94 0.19 0.03 0.02 Area under curve (Unit*sec.) 717.52 1563.87 3034.01 3359.13 60 MIN HOLOFIBER Mean value (Unit) 8.52 31.54 56.9 64.22 Standard Deviation (Unit) 2.5 5.65 1.04 0.69 Standard Error (Unit) 0.09 0.2 0.04 0.02 Area under curve (Unit*sec.) 427.27 1581.51 2853.88 3221.07

Patient ID:105 placebo - Holofiber BASELINE TCOM HAND LASER HAND TCOM FOOT LASER FOOT Mean value (Unit) 6.83 12.06 76.89 57.94 Standard Deviation (Unit) 0.58 1.88 0.27 0.18 Standard Error (Unit) 0.02 0.07 0.01 0.01 Area under curve (Unit*sec.) 349.89 617.69 3937.57 2967.1 10 MIN PLACEBO Mean value (Unit) 8.72 17.24 67.06 52.94 Standard Deviation (Unit) 2.44 1.29 0.17 0.13 Standard Error (Unit) 0.08 0.04 0.01 0 Area under curve (Unit*sec.) 447.72 884.73 3442.6 2717.89 20 MIN PLACEBO Mean value (Unit) 7.63 12.91 69.95 53.39 Standard Deviation (Unit) 0.99 8.66 0.27 0.42 Standard Error (Unit) 0.03 0.3 0.01 0.01 Area under curve (Unit*sec.) 386.29 654.39 3543.14 2704.38 Slope (Unit/sec.) 0.01 -0.11 -0.01 0 30 MIN PLACEBO Mean value (Unit) 7.22 9.8 74.77 62.03 Standard Deviation (Unit) 0.61 1.66 0.18 0.43 Standard Error (Unit) 0.02 0.06 0.01 0.01 Area under curve (Unit*sec.) 369.02 500.96 3824.49 3172.94 40 MIN PLACEBO Mean value (Unit) 7.32 9.89 72.97 60.38 Standard Deviation (Unit) 0.78 1.41 0.43 0.4 Standard Error (Unit) 0.03 0.05 0.01 0.01 Area under curve (Unit*sec.) 374.1 505.5 3727.86 3084.74 50 MIN PLACEBO Mean value (Unit) 7.28 11.94 68.44 57.22 Standard Deviation (Unit) 0.39 1.7 0.35 0.62 Standard Error (Unit) 0.01 0.06 0.01 0.02 Area under curve (Unit*sec.) 372.44 610.92 3500.89 2926.78 60 MIN PLACEBO Mean value (Unit) 7.33 12.98 68.36 57.73 Standard Deviation (Unit) 0.4 1.86 0.21 0.34 Standard Error (Unit) 0.01 0.07 0.01 0.01 Maximum value (Unit) 8.24 18.49 68.79 58.47 Area under curve (Unit*sec.) 360.89 638.56 3364.02 2840.72 10 MIN HOLOFIBER TCOM HAND LASER HAND TCOM FOOT LASER FOOT Mean value (Unit) 8.39 12.97 67.4 64.54 Standard Deviation (Unit) 0.96 1.22 0.33 0.25 Standard Error (Unit) 0.03 0.04 0.01 0.01 Area under curve (Unit*sec.) 427.72 660.83 3434.87 3289.18 20 MIN HOL0 Mean value (Unit) 8.21 15.47 68.53 63.36 Standard Deviation (Unit) 0.59 2.04 0.09 0.09

Standard Error (Unit) 0.02 0.07 0 0 Area under curve (Unit*sec.) 414.41 780.64 3458.52 3197.45 30 MIN HOLOFIBER Mean value (Unit) 8.09 13 69.57 61.65 Standard Deviation (Unit) 0.86 1.28 0.09 0.24 Standard Error (Unit) 0.03 0.04 0 0.01 Area under curve (Unit*sec.) 412.29 662.46 3545.72 3141.67 40 MIN HOLOFIBER Mean value (Unit) 7.94 10.71 100.73 63.74 Standard Deviation (Unit) 0.53 1.04 0.11 0.29 Standard Error (Unit) 0.02 0.04 0 0.01 Minimum value (Unit) 6.68 8.36 100.53 63.05 Area under curve (Unit*sec.) 406.62 548.54 5158.38 3264.19 50 MIN HOLOFIBER Mean value (Unit) 12.99 14.31 105.67 62.23 Standard Deviation (Unit) 10.5 3.56 0.46 0.27 Standard Error (Unit) 0.36 0.12 0.02 0.01 Area under curve (Unit*sec.) 667.91 735.84 5431.38 3198.7 60 MIN HOLOFIBER Mean value (Unit) 8.95 10.29 107.61 60.69 Standard Deviation (Unit) 2.4 1.61 0.11 0.18 Standard Error (Unit) 0.08 0.06 0 0.01 Area under curve (Unit*sec.) 456.04 524.2 5484.28 3092.83

Patient ID: 106 placebo - Holofiber BASELINE TCOM HAND LASER HAND TCOM FOOT LASER FOOT Mean value (Unit) 4.97 12.13 44.65 55.53 Standard Deviation (Unit) 2.5 7.93 0.5 0.17 Standard Error (Unit) 0.09 0.28 0.02 0.01 Area under curve (Unit*sec.) 250.45 610.53 2248 2795.7 10 MIN PLACEBO Mean value (Unit) 6.72 11.8 33.25 55.67 Standard Deviation (Unit) 5.08 13.08 1.14 0.46 Standard Error (Unit) 0.18 0.46 0.04 0.02 Area under curve (Unit*sec.) 339.01 595.11 1675.82 2806.24 20 MIN PLACEBO Mean value (Unit) 6.56 18.81 33.39 56.16 Standard Deviation (Unit) 3.11 17.69 0.58 0.5 Standard Error (Unit) 0.11 0.62 0.02 0.02 Area under curve (Unit*sec.) 333.41 955.97 1695.63 2851.61 30 MIN PLACEBO Mean value (Unit) 6.58 15.75 31.28 55.92 Standard Deviation (Unit) 2.5 17.71 0.51 0.57 Standard Error (Unit) 0.09 0.62 0.02 0.02 Area under curve (Unit*sec.) 334.68 801 1590.1 2843.11 40 MIN PLACEBO Mean value (Unit) 5.61 9.79 40.6 57.55 Standard Deviation (Unit) 1.19 6.29 1.02 0.32 Standard Error (Unit) 0.04 0.22 0.04 0.01 Area under curve (Unit*sec.) 286.31 499.27 2071.89 2936.59 50 MIN PLACEBO Mean value (Unit) 5.56 11.51 37.27 60.23 Standard Deviation (Unit) 2.11 3.21 0.74 0.5 Standard Error (Unit) 0.07 0.11 0.03 0.02 Area under curve (Unit*sec.) 281.46 581.88 1885.38 3047.07 60 MIN PLACEBO Mean value (Unit) 5.74 11.77 35.16 61.53 Standard Deviation (Unit) 2.03 12.41 0.46 0.57 Standard Error (Unit) 0.07 0.41 0.02 0.02 Area under curve (Unit*sec.) 324.7 665.94 1988.04 3478.76 10 MIN HOLOFIBER Mean value (Unit) 6.72 16.89 22.6 59.07 Standard Deviation (Unit) 2.81 11.83 0.06 0.32 Standard Error (Unit) 0.1 0.41 0 0.01 Area under curve (Unit*sec.) 342.8 862.07 1153.21 3014.17 20 MIN HOLOFIBER Mean value (Unit) 8.77 16.54 24.39 60.86 Standard Deviation (Unit) 2.97 7.36 0.22 0.21 Standard Error (Unit) 0.1 0.26 0.01 0.01 Minimum value (Unit) 3.97 6.84 24.11 60.55

Area under curve (Unit*sec.) 444.86 839.7 1238.67 3090.46 30 MIN HOLOFIBER Item 1 PU #1 2 PU #2 3 pO2 #3 4 pO2 #4 Mean value (Unit) 3.38 12.52 23.67 60.29 Standard Deviation (Unit) 1.68 5.84 0.06 0.42 Standard Error (Unit) 0.06 0.21 0 0.01 Area under curve (Unit*sec.) 167.23 618.67 1169.58 2979.33 40 MIN HOLOFIBER Mean value (Unit) 5.66 20.19 24.11 61.86 Standard Deviation (Unit) 5.75 11.57 0.1 0.58 Standard Error (Unit) 0.2 0.41 0 0.02 Area under curve (Unit*sec.) 283.09 1011.32 1209.52 3102.92 50 MIN HOLOFIBER Item 1 PU #1 2 PU #2 3 pO2 #3 4 pO2 #4 Mean value (Unit) 5.75 14.06 23.58 58.75 Standard Deviation (Unit) 3.19 9.45 0.19 0.43 Standard Error (Unit) 0.11 0.33 0.01 0.02 Area under curve (Unit*sec.) 286.12 700.39 1174.03 2925.03 60 MIN HOLOFIBER Mean value (Unit) 5.89 7.45 23.33 57.99 Standard Deviation (Unit) 2.92 2.55 0.15 0.13 Standard Error (Unit) 0.1 0.09 0.01 0 Area under curve (Unit*sec.) 284.39 359.42 1125.44 2797.23

Patient ID:107 Holofiber - placebo BASELINE Item TCOM HAND LASER HAND TCOM FOOT LASER FOOT Mean value (Unit) 3.52 6.05 80.02 63.82 Standard Deviation (Unit) 0.37 0.32 0.35 2.4 Standard Error (Unit) 0.01 0.01 0.01 0.09 Area under curve (Unit*sec.) 170.78 293.47 3879.61 3094.13 10 MIN HOLOFIBER Mean value (Unit) 4.04 6.07 60.06 52.45 Standard Deviation (Unit) 0.06 0.46 0.1 0.16 Standard Error (Unit) 0 0.02 0 0.01 Area under curve (Unit*sec.) 190.98 286.62 2837.57 2477.93 20 MIN HOLOFIBER Mean value (Unit) 4.31 6.69 61.73 57.14 Standard Deviation (Unit) 0.19 1.03 0.18 0.17 Standard Error (Unit) 0.01 0.04 0.01 0.01 Area under curve (Unit*sec.) 216.08 335.6 3096.23 2865.82 30 MIN HOLOFIBER Mean value (Unit) 4.51 5.9 57.26 55.5 Standard Deviation (Unit) 0.15 0.8 0.1 0.22 Standard Error (Unit) 0.01 0.03 0 0.01 Area under curve (Unit*sec.) 227.14 297.47 2886.1 2797.45 40 MIN HOLOFIBER Mean value (Unit) 4.54 5.84 58.9 55.27 Standard Deviation (Unit) 0.27 1.35 0.11 0.09 Standard Error (Unit) 0.01 0.05 0 0 Area under curve (Unit*sec.) 227.57 292.61 2950.67 2768.95 50 MIN HOLOFIBER Mean value (Unit) 4.41 4.82 56.98 54.73 Standard Deviation (Unit) 0.15 0.23 0.15 0.2 Standard Error (Unit) 0.01 0.01 0.01 0.01 Minimum value (Unit) 4.27 4.52 56.58 54.32 Area under curve (Unit*sec.) 221.8 242.44 2864.96 2752.06 60 MIN HOLOFIBER Mean value (Unit) 4.59 6.18 48.35 60.3 Standard Deviation (Unit) 0.37 0.87 0.36 0.31 Standard Error (Unit) 0.01 0.03 0.01 0.01
Area under curve (Unit*sec.) 228.04 306.87 2401.39 2994.84
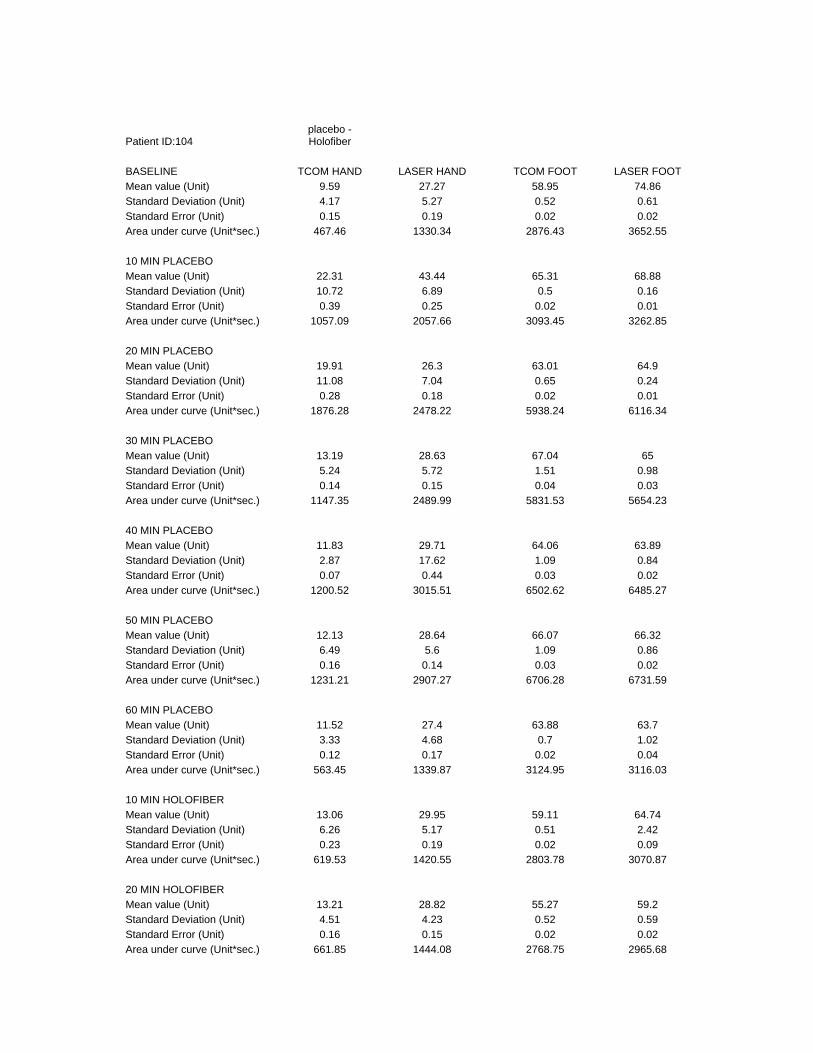
10 MIN PLACEBO Mean value (Unit) 4.55 6.92 37.97 62.03 Standard Deviation (Unit) 0.31 4.71 0.23 2.04 Standard Error (Unit) 0.01 0.17 0.01 0.07 Area under curve (Unit*sec.) 227.99 347.09 1904.27 3111.28 20 MIN PLACEBO Mean value (Unit) 4.53 5.56 36.89 65.09
Standard Deviation (Unit) 0.52 0.2 0.45 1.24 Standard Error (Unit) 0.02 0.01 0.02 0.04 Area under curve (Unit*sec.) 226.19 277.55 1841.35 3248.56 30 MIN PLACEBO Mean value (Unit) 5.01 4.89 38.65 64.81 Standard Deviation (Unit) 1.49 0.32 0.4 1.65 Standard Error (Unit) 0.05 0.01 0.01 0.06 Area under curve (Unit*sec.) 250.25 244.58 1931.42 3238.84 40 MIN PLACEBO Mean value (Unit) 4.54 5.83 37.83 62.23 Standard Deviation (Unit) 0.5 0.93 0.04 0.36 Standard Error (Unit) 0.02 0.03 0 0.01 Area under curve (Unit*sec.) 228.01 292.78 1899.64 3125.22 50 MIN PLACEBO Mean value (Unit) 4.57 7.16 37.71 62.6 Standard Deviation (Unit) 0.32 2.74 0.07 1.08 Standard Error (Unit) 0.01 0.1 0 0.04 Area under curve (Unit*sec.) 226.17 354.81 1868.13 3100.91 60 MIN PLACEBO Mean value (Unit) 4.51 5.44 37.1 63.37 Standard Deviation (Unit) 0.34 0.28 0.15 0.77 Standard Error (Unit) 0.01 0.01 0.01 0.03 Area under curve (Unit*sec.) 226.15 272.75 1860.74 3178.5
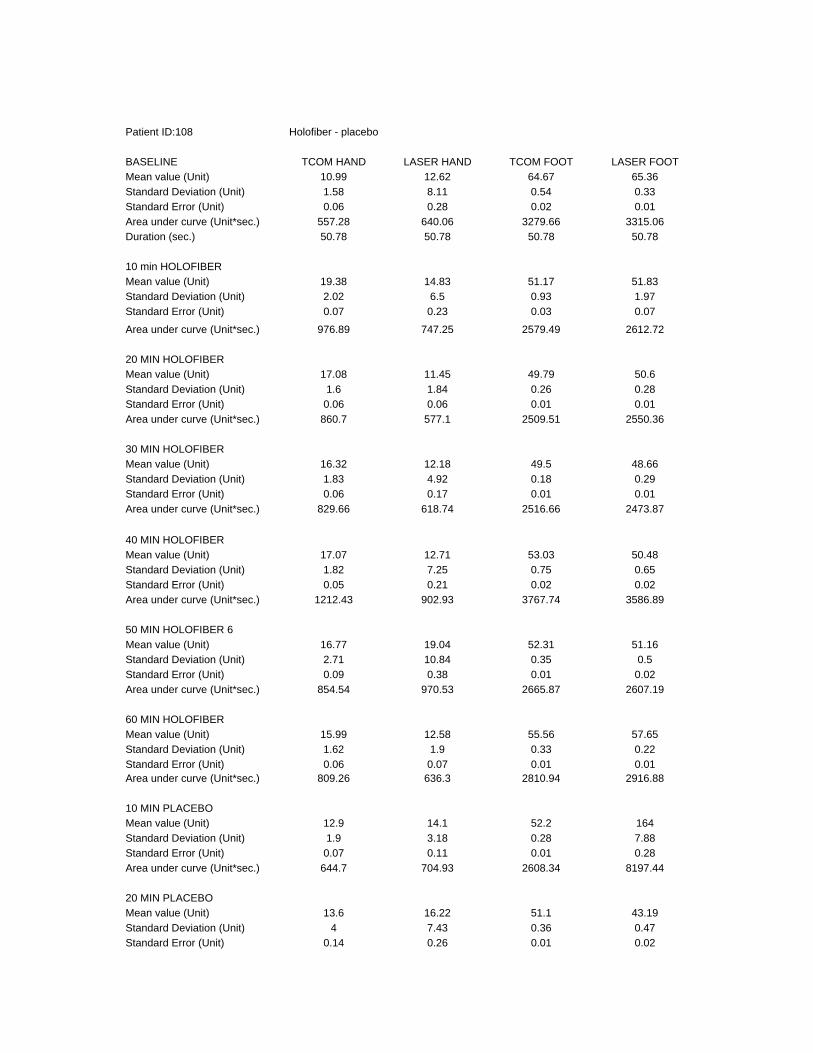
Patient ID:108 Holofiber - placebo BASELINE TCOM HAND LASER HAND TCOM FOOT LASER FOOT Mean value (Unit) 10.99 12.62 64.67 65.36 Standard Deviation (Unit) 1.58 8.11 0.54 0.33 Standard Error (Unit) 0.06 0.28 0.02 0.01 Area under curve (Unit*sec.) 557.28 640.06 3279.66 3315.06 Duration (sec.) 50.78 50.78 50.78 50.78 10 min HOLOFIBER Mean value (Unit) 19.38 14.83 51.17 51.83 Standard Deviation (Unit) 2.02 6.5 0.93 1.97 Standard Error (Unit) 0.07 0.23 0.03 0.07
Area under curve (Unit*sec.) 976.89 747.25 2579.49 2612.72 20 MIN HOLOFIBER Mean value (Unit) 17.08 11.45 49.79 50.6 Standard Deviation (Unit) 1.6 1.84 0.26 0.28 Standard Error (Unit) 0.06 0.06 0.01 0.01 Area under curve (Unit*sec.) 860.7 577.1 2509.51 2550.36 30 MIN HOLOFIBER Mean value (Unit) 16.32 12.18 49.5 48.66 Standard Deviation (Unit) 1.83 4.92 0.18 0.29 Standard Error (Unit) 0.06 0.17 0.01 0.01 Area under curve (Unit*sec.) 829.66 618.74 2516.66 2473.87 40 MIN HOLOFIBER Mean value (Unit) 17.07 12.71 53.03 50.48 Standard Deviation (Unit) 1.82 7.25 0.75 0.65 Standard Error (Unit) 0.05 0.21 0.02 0.02 Area under curve (Unit*sec.) 1212.43 902.93 3767.74 3586.89 50 MIN HOLOFIBER 6 Mean value (Unit) 16.77 19.04 52.31 51.16 Standard Deviation (Unit) 2.71 10.84 0.35 0.5 Standard Error (Unit) 0.09 0.38 0.01 0.02 Area under curve (Unit*sec.) 854.54 970.53 2665.87 2607.19 60 MIN HOLOFIBER Mean value (Unit) 15.99 12.58 55.56 57.65 Standard Deviation (Unit) 1.62 1.9 0.33 0.22 Standard Error (Unit) 0.06 0.07 0.01 0.01 Area under curve (Unit*sec.) 809.26 636.3 2810.94 2916.88 10 MIN PLACEBO Mean value (Unit) 12.9 14.1 52.2 164 Standard Deviation (Unit) 1.9 3.18 0.28 7.88 Standard Error (Unit) 0.07 0.11 0.01 0.28 Area under curve (Unit*sec.) 644.7 704.93 2608.34 8197.44 20 MIN PLACEBO Mean value (Unit) 13.6 16.22 51.1 43.19 Standard Deviation (Unit) 4 7.43 0.36 0.47 Standard Error (Unit) 0.14 0.26 0.01 0.02

Area under curve (Unit*sec.) 674.31 804.35 2534.63 2142.27 30 MIN PLACEBO Mean value (Unit) 13.69 14.34 51.85 44.83 Standard Deviation (Unit) 2.96 4.03 0.12 0.22 Standard Error (Unit) 0.1 0.14 0 0.01 Area under curve (Unit*sec.) 684.38 716.98 2591.1 2240.1 40 MIN PLACEBO Mean value (Unit) 12.48 15.28 51.48 44.11 Standard Deviation (Unit) 1.86 5.77 0.36 0.51 Standard Error (Unit) 0.07 0.2 0.01 0.02 Area under curve (Unit*sec.) 622.25 761.74 2565.95 2198.53 50 MIN PLACEBO Mean value (Unit) 13.56 16.21 52.09 41.92 Standard Deviation (Unit) 3.79 5.05 0.15 0.26 Standard Error (Unit) 0.13 0.18 0.01 0.01 Area under curve (Unit*sec.) 681.12 814.34 2615.75 2105.18 60 MIN PLACEBO Mean value (Unit) 13.9 15.36 54.05 107.15 Standard Deviation (Unit) 2.87 5.2 0.23 8.2 Standard Error (Unit) 0.1 0.18 0.01 0.29 Area under curve (Unit*sec.) 692.65 765.29 2692.18 5337.14

Patient ID:109 placebo - Holofiber
BASELINE TCOM HAND LASER HAND TCOM FOOT LASER FOOT Mean value (Unit) 12.37 17.97 69.93 22.66 Standard Deviation (Unit) 1.33 3.93 0.33 1.09 Standard Error (Unit) 0.05 0.14 0.01 0.04 Area under curve (Unit*sec.) 627.48 910.86 3546.44 1149.41 10 MIN PLACEBO Mean value (Unit) 10.94 16.36 80.45 39.43 Standard Deviation (Unit) 1.31 4.65 0.42 0.43 Standard Error (Unit) 0.05 0.16 0.02 0.02 Area under curve (Unit*sec.) 542.22 810.41 3985.22 1953.28 Slope (Unit/sec.) 0.02 0.01 -0.01 0.02 20 MIN PLACEBO 3 Mean value (Unit) 11.01 18.53 78.56 39.61 Standard Deviation (Unit) 1.2 2.43 0.51 0.74 Standard Error (Unit) 0.04 0.09 0.02 0.03 Area under curve (Unit*sec.) 543.17 914.79 3877.33 1954.83 30 MIN PLACEBO Mean value (Unit) 11.41 20.12 78.08 39.34 Standard Deviation (Unit) 1.05 2.77 0.56 0.67 Standard Error (Unit) 0.04 0.1 0.02 0.02 Area under curve (Unit*sec.) 559.43 986.78 3829.11 1929.46 40 MIN PLACEBO Mean value (Unit) 11.25 18.91 86.07 45.31 Standard Deviation (Unit) 1.01 3.88 0.46 0.39 Standard Error (Unit) 0.03 0.1 0.01 0.01 Area under curve (Unit*sec.) 980.23 1648.17 7501.65 3949.1 50 MIN PLACEBO Mean value (Unit) 11.31 16.76 90.1 48.17 Standard Deviation (Unit) 1.19 2.06 1.21 0.53 Standard Error (Unit) 0.03 0.06 0.03 0.01 Area under curve (Unit*sec.) 923.86 1369.05 7361.88 3935.63 60 MIN PLACEBO Mean value (Unit) 12.13 20.15 90.4 48.59 Standard Deviation (Unit) 1.21 2.28 0.63 0.44 Standard Error (Unit) 0.04 0.08 0.02 0.02 Area under curve (Unit*sec.) 613.82 1019.33 4573.49 2458.45 10 MIN HOLOFIBER Mean value (Unit) 11.92 14.63 80.47 40.44 Standard Deviation (Unit) 1.42 1.9 2.72 1.24 Standard Error (Unit) 0.05 0.07 0.1 0.04 Area under curve (Unit*sec.) 599.46 735.61 4046.39 2033.34 20 MIN HOLOFIBER Mean value (Unit) 11.88 13.37 72.12 38.02 Standard Deviation (Unit) 0.95 2.01 0.58 0.57 Standard Error (Unit) 0.03 0.07 0.02 0.02

Area under curve (Unit*sec.) 602.5 677.87 3657.6 1928.26
30 MIN HOLOFIBER Mean value (Unit) 11.77 16.7 76.19 42.17 Standard Deviation (Unit) 1.27 2.06 0.99 1.12 Standard Error (Unit) 0.04 0.07 0.03 0.04 Area under curve (Unit*sec.) 592.39 841.03 3835.59 2122.75 40 MIN HOLOFIBER Mean value (Unit) 12.15 11.44 83.75 47.17 Standard Deviation (Unit) 1 0.92 0.68 0.64 Standard Error (Unit) 0.04 0.03 0.02 0.02 Area under curve (Unit*sec.) 609.21 573.86 4200.81 2365.71 50 MIN HOLOFIBER Mean value (Unit) 12.43 18.18 76.08 44.63 Standard Deviation (Unit) 1.38 1.67 0.36 0.25 Standard Error (Unit) 0.05 0.06 0.01 0.01 Area under curve (Unit*sec.) 614.44 898.5 3759.35 2205.23 60 MIN HOLOFIBER Mean value (Unit) 11.87 13.32 88.75 53.17 Standard Deviation (Unit) 1.91 1.82 1.58 0.67 Standard Error (Unit) 0.07 0.06 0.06 0.02 Area under curve (Unit*sec.) 592.94 665.79 4435.1 2657.24

Patient ID:110 Holofiber - placebo
BASELINE TCOM HAND LASER HAND TCOM FOOT LASER FOOT
Mean value (Unit) 6.29 12.12 64.93 52.82 Standard Deviation (Unit) 0.57 1.56 0.77 0.24 Standard Error (Unit) 0.02 0.05 0.03 0.01 Maximum value (Unit) 7.48 15.66 66.35 53.28 Minimum value (Unit) 5.13 8.06 63.78 52.55 Area under curve (Unit*sec.) 321.5 619.35 3317.14 2698.66 Slope (Unit/sec.) 0 0.03 -0.05 -0.02 10 MIN HOLOFIBER Mean value (Unit) 8.38 14.3 90.03 43.66 Standard Deviation (Unit) 0.7 2.06 0.25 0.12 Standard Error (Unit) 0.02 0.07 0.01 0 Area under curve (Unit*sec.) 428.97 732.38 4610.73 2235.98 20 MIN HOLOFIBER Mean value (Unit) 8.69 14.92 100.01 43.02 Standard Deviation (Unit) 0.98 2.13 0.31 0.12 Standard Error (Unit) 0.03 0.07 0.01 0 Area under curve (Unit*sec.) 440.17 755.67 5065.99 2178.95 30 MIN HOLOFIBER Mean value (Unit) 9.12 15.77 84.96 41.59 Standard Deviation (Unit) 0.59 2.17 0.6 0.13 Standard Error (Unit) 0.02 0.08 0.02 0 Area under curve (Unit*sec.) 466.04 805.7 4340.29 2124.97 40 MIN HOLOFIBER Mean value (Unit) 9.36 15.97 89.88 40.61 Standard Deviation (Unit) 0.71 2.96 0.81 0.12 Standard Error (Unit) 0.02 0.1 0.03 0 Area under curve (Unit*sec.) 471.94 805.31 4530.55 2047.06 50 MIN HOLOFIBER Mean value (Unit) 9.33 15.41 89.14 40.4 Standard Deviation (Unit) 0.72 2.58 0.83 0.17 Standard Error (Unit) 0.02 0.09 0.03 0.01 Area under curve (Unit*sec.) 475.87 786.19 4548.24 2061.61 60 MIN HOLOFIBER Mean value (Unit) 9.45 14.8 92.8 40.26 Standard Deviation (Unit) 0.53 2.42 0.26 0.03 Standard Error (Unit) 0.02 0.09 0.01 0 Area under curve (Unit*sec.) 455.86 713.73 4476.48 1942.11 10 MIN PLACEBO Mean value (Unit) 8.16 15.96 78.26 48.44 Standard Deviation (Unit) 0.72 2.4 1.72 0.74 Standard Error (Unit) 0.03 0.08 0.06 0.03 Area under curve (Unit*sec.) 414.14 810.73 3974.03 2459.69 20 MIN PLACEBO

Mean value (Unit) 8.49 17.29 83.83 47.58 Standard Deviation (Unit) 0.85 2.65 2.09 0.88 Standard Error (Unit) 0.03 0.09 0.07 0.03 Area under curve (Unit*sec.) 430.46 877.06 4251.55 2412.81 30 MIN PLACEBO Mean value (Unit) 8.56 18.64 83.54 46.22 Standard Deviation (Unit) 0.97 3.92 0.28 0.14 Standard Error (Unit) 0.03 0.14 0.01 0.01 Area under curve (Unit*sec.) 431.51 939.79 4211.12 2329.88 40 MIN PLACEBO Mean value (Unit) 8.96 17.94 79.84 42.63 Standard Deviation (Unit) 0.95 2.99 0.65 0.28 Standard Error (Unit) 0.03 0.1 0.02 0.01 Area under curve (Unit*sec.) 456.31 913.03 4064.21 2169.69 50 MIN PLACEBO Mean value (Unit) 9.16 20.65 83.29 44.54 Standard Deviation (Unit) 1.04 4.5 0.5 0.08 Standard Error (Unit) 0.04 0.16 0.02 0 Area under curve (Unit*sec.) 465.88 1050.09 4234.54 2264.57 60 MIN PLACEBO Mean value (Unit) 9.99 22.16 91.47 48.61 Standard Deviation (Unit) 1.57 6.96 1.86 1.09 Standard Error (Unit) 0.04 0.18 0.05 0.03 Area under curve (Unit*sec.) 897.12 1989.09 8211.3 4363.73

Patient ID:111 Holofiber - placebo
BASELINE TCOM HAND LASER HAND TCOM FOOT LASER FOOT
Mean value (Unit) 33.49 8.71 57.58 68.57 Standard Deviation (Unit) 6.41 2.61 1.93 3.38 Standard Error (Unit) 0.09 0.04 0.03 0.05 Maximum value (Unit) 71.81 42.51 61.22 77.76 Minimum value (Unit) 17.27 5.07 54.87 63.23 Area under curve (Unit*sec.) 10328.53 2684.65 17756.92 21146.53 Slope (Unit/sec.) 0.01 0.01 0.02 0.03 10 MIN HOLOFIBER Mean value (Unit) 25.68 10.68 61.46 28.98 Standard Deviation (Unit) 3.14 2.6 1.09 0.41 Standard Error (Unit) 0.06 0.05 0.02 0.01 Area under curve (Unit*sec.) 4869.38 2025.36 11652.76 5495.14 20 MIN HOLOFIBER Mean value (Unit) 30.11 10.61 59.18 28.57 Standard Deviation (Unit) 4.43 2.14 2.06 1.44 Standard Error (Unit) 0.09 0.04 0.04 0.03 Area under curve (Unit*sec.) 5050.32 1780.16 9925.2 4791.03 30 MIN HOLOFIBER Mean value (Unit) 28.25 9.94 58.3 29.19 Standard Deviation (Unit) 4.34 1.65 2.66 2.33 Standard Error (Unit) 0.08 0.03 0.05 0.04 Area under curve (Unit*sec.) 4738.63 1666.57 9777.08 4895.74 40 MIN HOLOFIBER Mean value (Unit) 26.16 11.55 61.93 33.59 Standard Deviation (Unit) 2.94 2.21 2.88 2.44 Standard Error (Unit) 0.06 0.04 0.06 0.05 Area under curve (Unit*sec.) 4195.76 1853.45 9934.88 5389.17 50 MIN HOLOFIBER Mean value (Unit) 31.71 12.47 60.23 32.63 Standard Deviation (Unit) 2.81 2.27 0.92 0.75 Standard Error (Unit) 0.06 0.05 0.02 0.02 Area under curve (Unit*sec.) 4855.39 1909.35 9221.95 4997.09 60 MIN HOLOFIBER Mean value (Unit) 32.53 12.07 57.38 31.65 Standard Deviation (Unit) 3.11 2.27 0.52 0.71 Standard Error (Unit) 0.07 0.05 0.01 0.02 Area under curve (Unit*sec.) 4271.81 1585.26 7534.79 4155.52 10 MIN PLACEBO Mean value (Unit) 13.34 22 50.03 31.34 Standard Deviation (Unit) 2.72 4.44 0.91 0.78
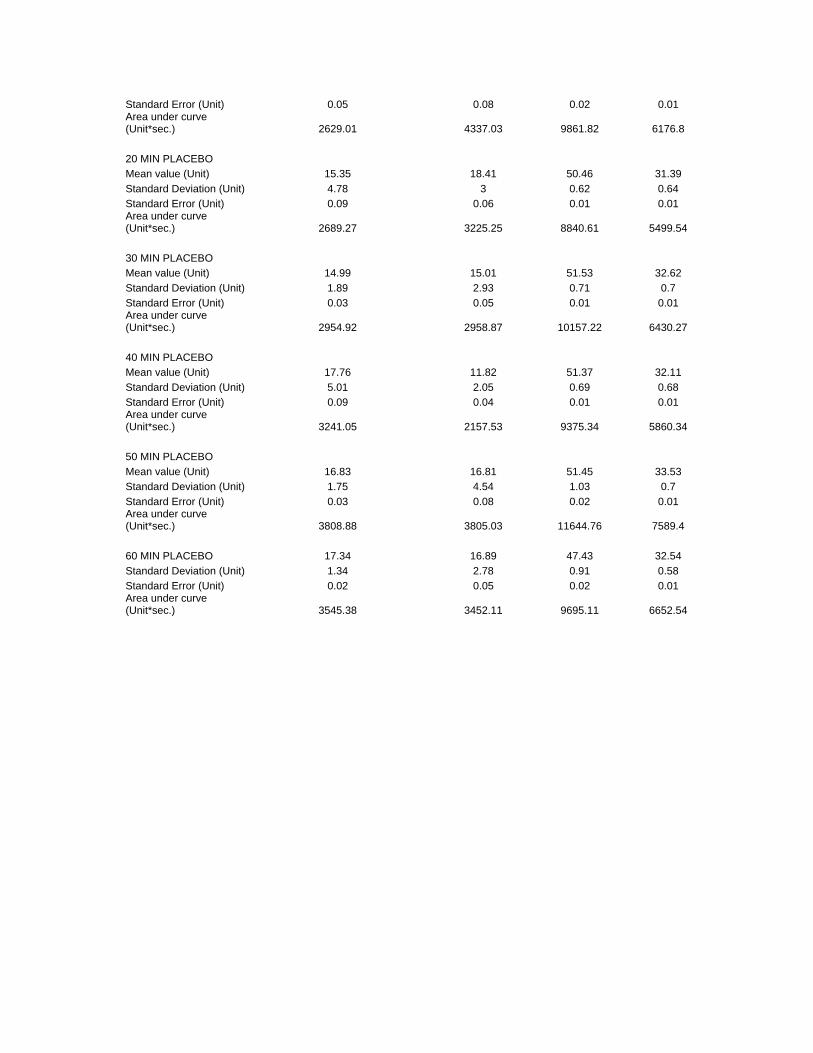
Standard Error (Unit) 0.05 0.08 0.02 0.01 Area under curve (Unit*sec.) 2629.01 4337.03 9861.82 6176.8 20 MIN PLACEBO Mean value (Unit) 15.35 18.41 50.46 31.39 Standard Deviation (Unit) 4.78 3 0.62 0.64 Standard Error (Unit) 0.09 0.06 0.01 0.01 Area under curve (Unit*sec.) 2689.27 3225.25 8840.61 5499.54 30 MIN PLACEBO Mean value (Unit) 14.99 15.01 51.53 32.62 Standard Deviation (Unit) 1.89 2.93 0.71 0.7 Standard Error (Unit) 0.03 0.05 0.01 0.01 Area under curve (Unit*sec.) 2954.92 2958.87 10157.22 6430.27 40 MIN PLACEBO Mean value (Unit) 17.76 11.82 51.37 32.11 Standard Deviation (Unit) 5.01 2.05 0.69 0.68 Standard Error (Unit) 0.09 0.04 0.01 0.01 Area under curve (Unit*sec.) 3241.05 2157.53 9375.34 5860.34 50 MIN PLACEBO Mean value (Unit) 16.83 16.81 51.45 33.53 Standard Deviation (Unit) 1.75 4.54 1.03 0.7 Standard Error (Unit) 0.03 0.08 0.02 0.01 Area under curve (Unit*sec.) 3808.88 3805.03 11644.76 7589.4 60 MIN PLACEBO 17.34 16.89 47.43 32.54 Standard Deviation (Unit) 1.34 2.78 0.91 0.58 Standard Error (Unit) 0.02 0.05 0.02 0.01 Area under curve (Unit*sec.) 3545.38 3452.11 9695.11 6652.54
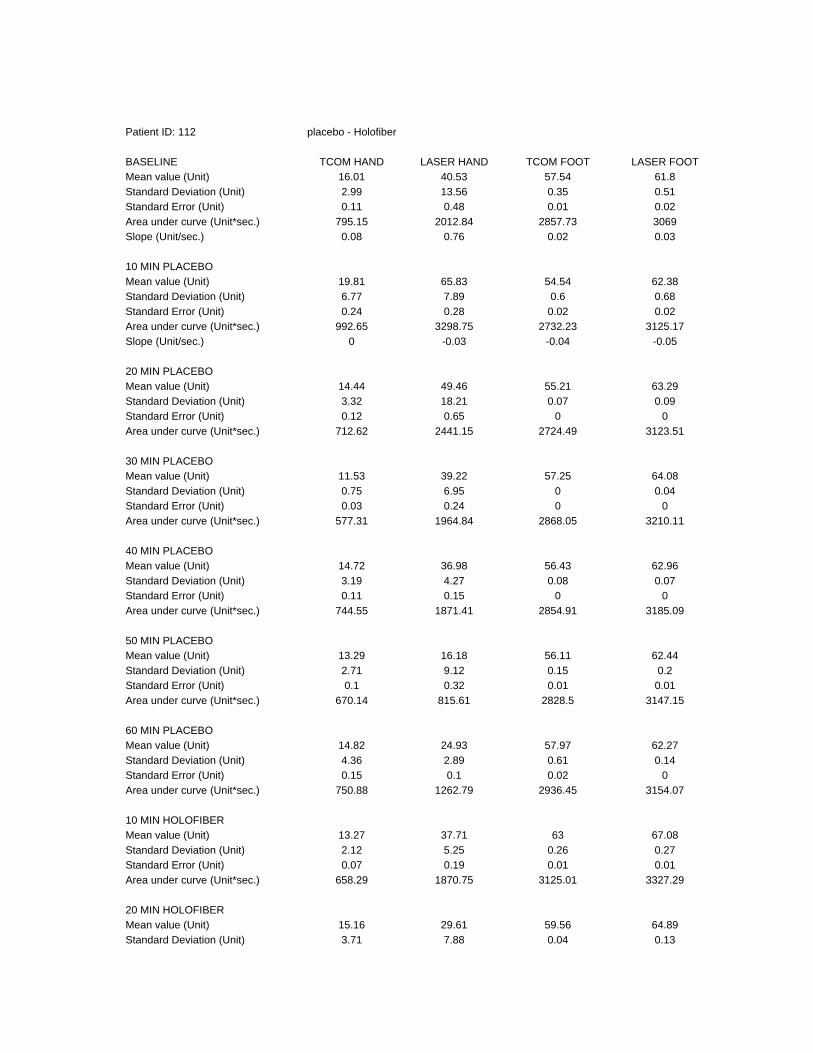
Patient ID: 112 placebo - Holofiber BASELINE TCOM HAND LASER HAND TCOM FOOT LASER FOOT Mean value (Unit) 16.01 40.53 57.54 61.8 Standard Deviation (Unit) 2.99 13.56 0.35 0.51 Standard Error (Unit) 0.11 0.48 0.01 0.02 Area under curve (Unit*sec.) 795.15 2012.84 2857.73 3069 Slope (Unit/sec.) 0.08 0.76 0.02 0.03 10 MIN PLACEBO Mean value (Unit) 19.81 65.83 54.54 62.38 Standard Deviation (Unit) 6.77 7.89 0.6 0.68 Standard Error (Unit) 0.24 0.28 0.02 0.02 Area under curve (Unit*sec.) 992.65 3298.75 2732.23 3125.17 Slope (Unit/sec.) 0 -0.03 -0.04 -0.05 20 MIN PLACEBO Mean value (Unit) 14.44 49.46 55.21 63.29 Standard Deviation (Unit) 3.32 18.21 0.07 0.09 Standard Error (Unit) 0.12 0.65 0 0 Area under curve (Unit*sec.) 712.62 2441.15 2724.49 3123.51 30 MIN PLACEBO Mean value (Unit) 11.53 39.22 57.25 64.08 Standard Deviation (Unit) 0.75 6.95 0 0.04 Standard Error (Unit) 0.03 0.24 0 0 Area under curve (Unit*sec.) 577.31 1964.84 2868.05 3210.11 40 MIN PLACEBO Mean value (Unit) 14.72 36.98 56.43 62.96 Standard Deviation (Unit) 3.19 4.27 0.08 0.07 Standard Error (Unit) 0.11 0.15 0 0 Area under curve (Unit*sec.) 744.55 1871.41 2854.91 3185.09 50 MIN PLACEBO Mean value (Unit) 13.29 16.18 56.11 62.44 Standard Deviation (Unit) 2.71 9.12 0.15 0.2 Standard Error (Unit) 0.1 0.32 0.01 0.01 Area under curve (Unit*sec.) 670.14 815.61 2828.5 3147.15 60 MIN PLACEBO Mean value (Unit) 14.82 24.93 57.97 62.27 Standard Deviation (Unit) 4.36 2.89 0.61 0.14 Standard Error (Unit) 0.15 0.1 0.02 0 Area under curve (Unit*sec.) 750.88 1262.79 2936.45 3154.07 10 MIN HOLOFIBER Mean value (Unit) 13.27 37.71 63 67.08 Standard Deviation (Unit) 2.12 5.25 0.26 0.27 Standard Error (Unit) 0.07 0.19 0.01 0.01 Area under curve (Unit*sec.) 658.29 1870.75 3125.01 3327.29 20 MIN HOLOFIBER Mean value (Unit) 15.16 29.61 59.56 64.89 Standard Deviation (Unit) 3.71 7.88 0.04 0.13

Standard Error (Unit) 0.13 0.28 0 0 Area under curve (Unit*sec.) 759.79 1484.62 2983.51 3250.59 30 MIN HOLOFIBER Mean value (Unit) 15.61 24.5 60.51 65 Standard Deviation (Unit) 2.6 4.56 0.75 0.51 Standard Error (Unit) 0.09 0.16 0.03 0.02 Area under curve (Unit*sec.) 781.98 1227.67 3031.34 3256.38 40 MIN HOLOFIBER Mean value (Unit) 13.91 28.46 60.96 65.65 Standard Deviation (Unit) 3 5.51 0.19 0.19 Standard Error (Unit) 0.11 0.19 0.01 0.01 50 MIN HOLOFIBER Mean value (Unit) 17.37 27.45 63.52 67.55 Standard Deviation (Unit) 6.72 4.78 1.02 0.72 Standard Error (Unit) 0.24 0.17 0.04 0.03 Area under curve (Unit*sec.) 871.64 1377.42 3186.25 3388.11 60 MIN HOLOFIBER Mean value (Unit) 14.3 28.04 60.31 64.34 Standard Deviation (Unit) 2.5 5.69 0.08 0.11 Standard Error (Unit) 0.09 0.2 0 0 Area under curve (Unit*sec.) 718.24 1408.51 3029.02 3231.07
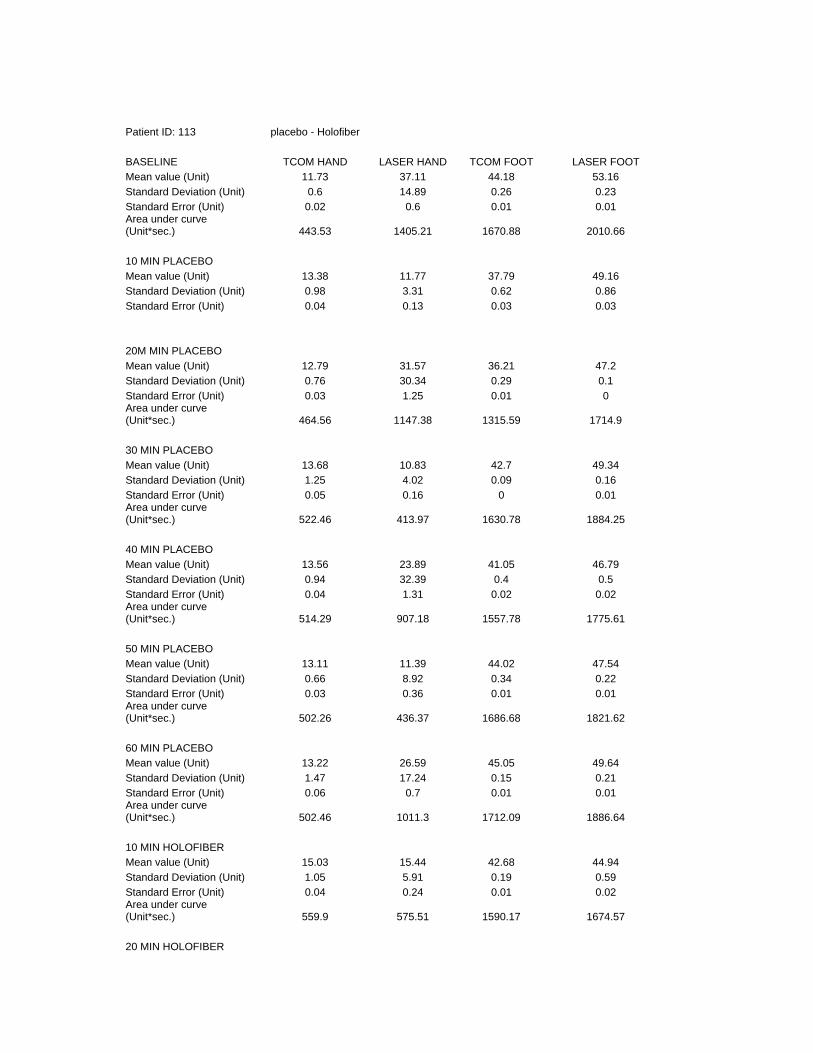
Patient ID: 113 placebo - Holofiber BASELINE TCOM HAND LASER HAND TCOM FOOT LASER FOOT Mean value (Unit) 11.73 37.11 44.18 53.16 Standard Deviation (Unit) 0.6 14.89 0.26 0.23 Standard Error (Unit) 0.02 0.6 0.01 0.01 Area under curve (Unit*sec.) 443.53 1405.21 1670.88 2010.66 10 MIN PLACEBO Mean value (Unit) 13.38 11.77 37.79 49.16 Standard Deviation (Unit) 0.98 3.31 0.62 0.86 Standard Error (Unit) 0.04 0.13 0.03 0.03 20M MIN PLACEBO Mean value (Unit) 12.79 31.57 36.21 47.2 Standard Deviation (Unit) 0.76 30.34 0.29 0.1 Standard Error (Unit) 0.03 1.25 0.01 0 Area under curve (Unit*sec.) 464.56 1147.38 1315.59 1714.9 30 MIN PLACEBO Mean value (Unit) 13.68 10.83 42.7 49.34 Standard Deviation (Unit) 1.25 4.02 0.09 0.16 Standard Error (Unit) 0.05 0.16 0 0.01 Area under curve (Unit*sec.) 522.46 413.97 1630.78 1884.25 40 MIN PLACEBO Mean value (Unit) 13.56 23.89 41.05 46.79 Standard Deviation (Unit) 0.94 32.39 0.4 0.5 Standard Error (Unit) 0.04 1.31 0.02 0.02 Area under curve (Unit*sec.) 514.29 907.18 1557.78 1775.61 50 MIN PLACEBO Mean value (Unit) 13.11 11.39 44.02 47.54 Standard Deviation (Unit) 0.66 8.92 0.34 0.22 Standard Error (Unit) 0.03 0.36 0.01 0.01 Area under curve (Unit*sec.) 502.26 436.37 1686.68 1821.62 60 MIN PLACEBO Mean value (Unit) 13.22 26.59 45.05 49.64 Standard Deviation (Unit) 1.47 17.24 0.15 0.21 Standard Error (Unit) 0.06 0.7 0.01 0.01 Area under curve (Unit*sec.) 502.46 1011.3 1712.09 1886.64 10 MIN HOLOFIBER Mean value (Unit) 15.03 15.44 42.68 44.94 Standard Deviation (Unit) 1.05 5.91 0.19 0.59 Standard Error (Unit) 0.04 0.24 0.01 0.02 Area under curve (Unit*sec.) 559.9 575.51 1590.17 1674.57 20 MIN HOLOFIBER

Mean value (Unit) 14.3 26.8 46.36 49.38 Standard Deviation (Unit) 3.32 44.74 0.09 0.59 Standard Error (Unit) 0.13 1.81 0 0.02 Area under curve (Unit*sec.) 539.98 1010.99 1750.52 1864.47 30 MIN HOLOFIBER Mean value (Unit) 14.98 17.83 49.69 60.29 Standard Deviation (Unit) 1.81 7.41 1 0.66 Standard Error (Unit) 0.07 0.3 0.04 0.03 Area under curve (Unit*sec.) 565.73 673.1 1876.23 2276.41 40 MIN HOLOFIBER Mean value (Unit) 14.24 13.77 53.91 59.06 Standard Deviation (Unit) 1.67 13.84 0.14 2.54 Standard Error (Unit) 0.07 0.56 0.01 0.1 Area under curve (Unit*sec.) 536.5 519.01 2032.21 2226.07 50 MIN HOLOFIBER Mean value (Unit) 15.09 19.44 55.61 61.52 Standard Deviation (Unit) 2.35 14.84 0.29 0.18 Standard Error (Unit) 0.1 0.6 0.01 0.01 Area under curve (Unit*sec.) 570.79 735.48 2103.19 2326.66 60 MIN HOLOFIBER Mean value (Unit) 14.49 12.54 52.19 52.64 Standard Deviation (Unit) 1.29 3.37 0.44 0.6 Standard Error (Unit) 0.05 0.14 0.02 0.02 Area under curve (Unit*sec.) 551.5 476.94 1986.72 2003.69

Patient ID: 114 Holofiber -
placebo BASELINE TCOM HAND LASER HAND TCOM FOOT LASER FOOT Mean value (Unit) 16.16 29.8 53.82 26.28 Standard Deviation (Unit) 1.21 5.2 0.88 0.25 Standard Error (Unit) 0.05 0.22 0.04 0.01 Area under curve (Unit*sec.) 569.29 1049.13 1895.28 925.65 10 MIN HOLOFIBER Mean value (Unit) 28.72 47.2 49.62 48.58 Standard Deviation (Unit) 1.08 30.98 0.23 0.3 Standard Error (Unit) 0.04 1.26 0.01 0.01 Area under curve (Unit*sec.) 1066.78 1753.81 1842.96 1804.27 20 MIN HOLOFIBER Mean value (Unit) 23.56 21.1 53.96 49.08 Standard Deviation (Unit) 1.88 8.68 0.38 0.23 Standard Error (Unit) 0.08 0.35 0.02 0.01 Area under curve (Unit*sec.) 885.25 792.98 2027.29 1844.15 30 MIN HOLOFIBER Mean value (Unit) 24.46 23.72 53.66 51.29 Standard Deviation (Unit) 5.94 3.84 0.21 0.12 Standard Error (Unit) 0.28 0.18 0.01 0.01 Area under curve (Unit*sec.) 684.21 663.36 1500.47 1434.21 40 MIN HOLOFIBER Mean value (Unit) 22.82 25.35 55.94 52.34 Standard Deviation (Unit) 1.23 4.94 0.12 0.12 Standard Error (Unit) 0.06 0.22 0.01 0.01 Area under curve (Unit*sec.) 697.48 774.94 1709.74 1599.74 50 MIN HOLOFIBER Mean value (Unit) 23.18 22.17 58.83 55.01 Standard Deviation (Unit) 1.78 2.96 1.58 0.46 Standard Error (Unit) 0.07 0.12 0.06 0.02 Area under curve (Unit*sec.) 865.23 827.2 2195.65 2053.21 60 MIN HOLOFIBER Mean value (Unit) 23.22 34.93 61.01 59.54 Standard Deviation (Unit) 1.79 36.16 0.4 0.19 Standard Error (Unit) 0.07 1.47 0.02 0.01 Area under curve (Unit*sec.) 865.21 1302.78 2273.16 2218.5 10 MIN PLACEBO Mean value (Unit) 25.53 18.31 57.44 61.32 Standard Deviation (Unit) 2 2.59 0.56 0.69 Standard Error (Unit) 0.08 0.11 0.02 0.03 Area under curve (Unit*sec.) 925.79 664.25 2083.34 2223.99 20 MIN PLACEBO Mean value (Unit) 23.72 23.8 58.36 63.01 Standard Deviation (Unit) 1.47 3.55 0.06 0.13 Standard Error (Unit) 0.06 0.15 0 0.01 Area under curve (Unit*sec.) 776.45 778.68 1910.64 2062.73

Slope (Unit/sec.) 0.04 0.04 0 0.01 30M MIN PLACEBO Mean value (Unit) 23.61 22.49 59.07 61.56 Standard Deviation (Unit) 1.49 4.2 0.41 0.16 Standard Error (Unit) 0.06 0.18 0.02 0.01 Area under curve (Unit*sec.) 834.35 794.72 2087.6 2175.4 40 MIN PLACEBO Mean value (Unit) 27.04 22.16 64.38 65.88 Standard Deviation (Unit) 2.05 3.85 0.67 0.18 Standard Error (Unit) 0.08 0.16 0.03 0.01 Area under curve (Unit*sec.) 1009.22 826.95 2402.88 2459.07 50 MIN PLACEBO Mean value (Unit) 26.4 25.38 61.35 62.59 Standard Deviation (Unit) 1.85 6.67 0.14 0.09 Standard Error (Unit) 0.08 0.28 0.01 0 Area under curve (Unit*sec.) 959.01 922.03 2228.99 2273.99 60 MIN PLACEBO Mean value (Unit) 28 22.28 62.41 60.32 Standard Deviation (Unit) 1.61 2.87 0.58 0.11 Standard Error (Unit) 0.07 0.12 0.02 0 Area under curve (Unit*sec.) 973.76 775.08 2170.64 2098.21

Patient ID:115 Holofiber -
placebo
BASELINE TCOM HAND LASER HAND TCOM FOOT LASER FOOT
Mean value (Unit) 8.01 74 59.65 61.72 Standard Deviation (Unit) 1.56 7.98 0.33 0.52 Standard Error (Unit) 0.07 0.34 0.01 0.02 Area under curve (Unit*sec.) 273.12 2523.81 2034.05 2104.71 10 MIN HOLOFIBER Mean value (Unit) 8.98 97.65 50.25 52.22 Standard Deviation (Unit) 1.26 7.4 0.17 0.13 Standard Error (Unit) 0.04 0.26 0.01 0 Area under curve (Unit*sec.) 457.48 4976.38 2560.96 2661.17 20 MIN HOLOFIBER Mean value (Unit) 9.42 96.64 49.54 51.55 Standard Deviation (Unit) 1.21 6.74 0.05 0.1 Standard Error (Unit) 0.05 0.26 0 0 Area under curve (Unit*sec.) 402.27 4128.6 2116.07 2202.22 30 MIN HOLOFIBER Mean value (Unit) 13.03 103.33 49.93 51.77 Standard Deviation (Unit) 12.79 7.62 0.19 0.16 Standard Error (Unit) 0.41 0.25 0.01 0.01 Area under curve (Unit*sec.) 774.99 6143.45 2968.93 3078.16 40 MIN HOLOFIBER Mean value (Unit) 12.19 104.22 52.59 54.61 Standard Deviation (Unit) 2.28 10.22 0.45 0.51 Standard Error (Unit) 0.07 0.31 0.01 0.02 Area under curve (Unit*sec.) 797.03 6816.43 3439.7 3571.91 50 MIN HOLOFIBER Mean value (Unit) 13.19 108.65 53.26 55.23 Standard Deviation (Unit) 2.2 10.52 0.29 0.29 Standard Error (Unit) 0.07 0.33 0.01 0.01 Area under curve (Unit*sec.) 836.74 6891.66 3378.19 3503.05 60 MIN HOLOFIBER Mean value (Unit) 14.97 107.18 55.44 58.77 Standard Deviation (Unit) 3.1 10.43 0.32 0.22 Standard Error (Unit) 0.09 0.32 0.01 0.01 Area under curve (Unit*sec.) 1010.21 7234.09 3742.32 3967.38 10 MIN PLACEBO Mean value (Unit) 21.3 100.68 58.51 62 Standard Deviation (Unit) 4.84 33.08 0.29 0.51 Standard Error (Unit) 0.15 1.05 0.01 0.02 Area under curve (Unit*sec.) 1308.59 6185.51 3595.11 3809.65 20 MIN PLACEBO Mean value (Unit) 21.82 110.34 57.2 59.93 Standard Deviation (Unit) 4.03 22.22 0.3 0.3 Standard Error (Unit) 0.13 0.69 0.01 0.01

Area under curve (Unit*sec.) 1383.84 6998.02 3627.8 3801.03 30 MIN PLACEBO Mean value (Unit) 24.02 119.21 57.44 59.5 Standard Deviation (Unit) 4.86 29.74 0.22 0.28 Standard Error (Unit) 0.16 0.96 0.01 0.01 Area under curve (Unit*sec.) 1427.97 7087.93 3415.21 3537.56 40 MIN PLACEBO Mean value (Unit) 26.29 102.83 57.06 59.07 Standard Deviation (Unit) 5.46 17.63 0.23 0.25 Standard Error (Unit) 0.17 0.54 0.01 0.01 Area under curve (Unit*sec.) 1719.79 6726.44 3732.44 3863.84 50 MIN PLACEBO Mean value (Unit) 24.5 112.79 56.39 58.63 Standard Deviation (Unit) 5.63 38.24 0.25 0.41 Standard Error (Unit) 0.18 1.21 0.01 0.01 Area under curve (Unit*sec.) 1506.26 6934.67 3466.66 3604.71 60 MIN PLACEBO Mean value (Unit) 25.4 94.83 58.13 60.06 Standard Deviation (Unit) 5.18 23.13 0.48 0.6 Standard Error (Unit) 0.15 0.68 0.01 0.02 Area under curve (Unit*sec.) 1816.98 6780.63 4158.57 4296.31

Patient ID:116 placebo - Holofiber BASELINE TCOM HAND LASER HAND TCOM FOOT LASER FOOT Mean value (Unit) 7.41 8.01 87.64 3.96 Standard Deviation (Unit) 6.55 0.79 0.44 0.19 Standard Error (Unit) 0.16 0.02 0.01 0 Area under curve (Unit*sec.) 764.23 825.69 9036.03 408.23 GENERAL CALCULATIONS : AREA 2 Mean value (Unit) 6.4 27.82 83 7.83 Standard Deviation (Unit) 7.08 13.25 1.09 0.21 Standard Error (Unit) 0.25 0.46 0.04 0.01 Area under curve (Unit*sec.) 323.81 1406.45 4193.85 395.74 GENERAL CALCULATIONS : AREA 3 Mean value (Unit) 10.5 35.26 80.84 8.39 Standard Deviation (Unit) 17.81 5.49 0.4 0.38 Standard Error (Unit) 0.63 0.19 0.01 0.01 Area under curve (Unit*sec.) 515.83 1731.63 3969.49 412.08 GENERAL CALCULATIONS : AREA 4 Mean value (Unit) 5.47 28.88 78.47 6.85 Standard Deviation (Unit) 0.7 12.07 0.27 1.34 Standard Error (Unit) 0.02 0.42 0.01 0.05 Area under curve (Unit*sec.) 279.74 1476.97 4013.99 350.46 GENERAL CALCULATIONS : AREA 5 Mean value (Unit) 6.3 21.09 85.28 3.87 Standard Deviation (Unit) 0.48 13.81 1.99 0.57 Standard Error (Unit) 0.02 0.48 0.07 0.02 Area under curve (Unit*sec.) 321.65 1077.17 4356.58 197.95 GENERAL CALCULATIONS : AREA 6 Mean value (Unit) 6.13 29.34 77.64 6.47 Standard Deviation (Unit) 0.96 10.12 0.35 0.71 Standard Error (Unit) 0.03 0.36 0.01 0.03 Area under curve (Unit*sec.) 291.96 1397.47 3696.87 308.07 GENERAL CALCULATIONS : AREA 7 Mean value (Unit) 6.2 40.39 85.05 2.62 Standard Deviation (Unit) 3.4 32.59 1.12 0.11 Standard Error (Unit) 0.12 1.17 0.04 0 Area under curve (Unit*sec.) 296.25 1927.41 4060.2 124.92 Mean value (Unit) 5.65 36.77 77.14 4.02 Standard Deviation (Unit) 0.47 16.61 0.93 0.12 Standard Error (Unit) 0.02 0.75 0.04 0.01 Area under curve (Unit*sec.) 172.76 1123.05 2358.01 122.96 GENERAL CALCULATIONS : AREA 9 Mean value (Unit) 5.84 55.19 80.92 4.04
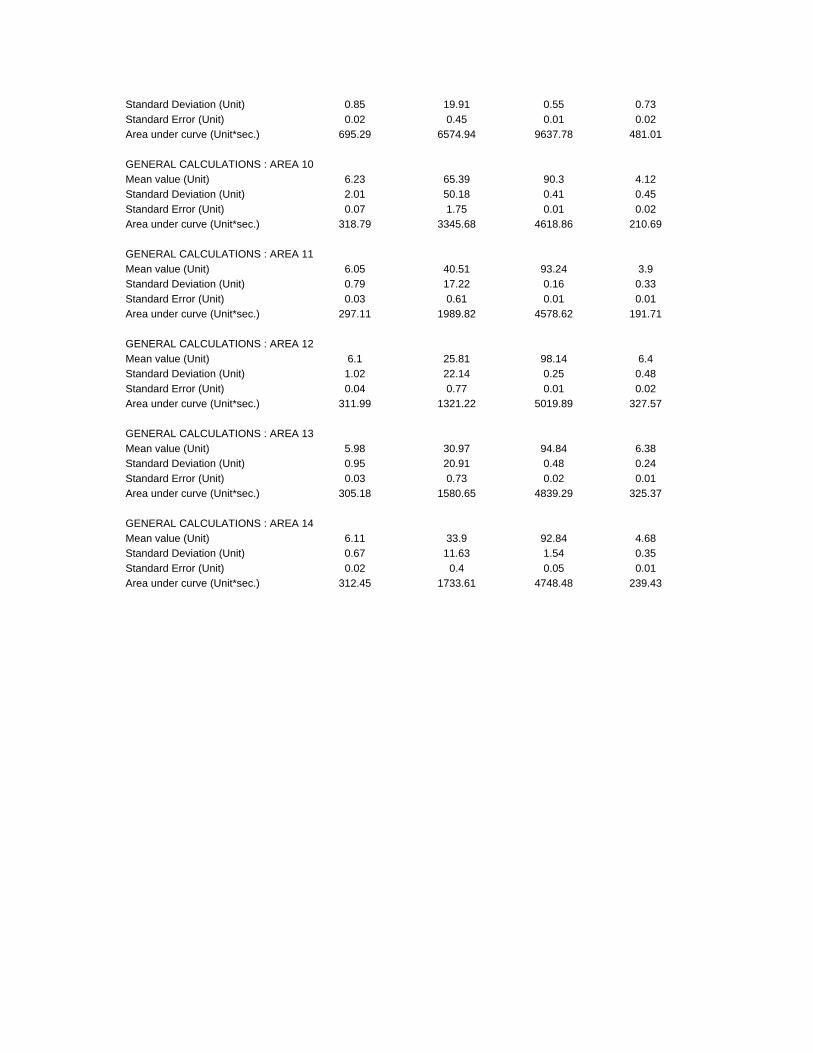
Standard Deviation (Unit) 0.85 19.91 0.55 0.73 Standard Error (Unit) 0.02 0.45 0.01 0.02 Area under curve (Unit*sec.) 695.29 6574.94 9637.78 481.01 GENERAL CALCULATIONS : AREA 10 Mean value (Unit) 6.23 65.39 90.3 4.12 Standard Deviation (Unit) 2.01 50.18 0.41 0.45 Standard Error (Unit) 0.07 1.75 0.01 0.02 Area under curve (Unit*sec.) 318.79 3345.68 4618.86 210.69 GENERAL CALCULATIONS : AREA 11 Mean value (Unit) 6.05 40.51 93.24 3.9 Standard Deviation (Unit) 0.79 17.22 0.16 0.33 Standard Error (Unit) 0.03 0.61 0.01 0.01 Area under curve (Unit*sec.) 297.11 1989.82 4578.62 191.71 GENERAL CALCULATIONS : AREA 12 Mean value (Unit) 6.1 25.81 98.14 6.4 Standard Deviation (Unit) 1.02 22.14 0.25 0.48 Standard Error (Unit) 0.04 0.77 0.01 0.02 Area under curve (Unit*sec.) 311.99 1321.22 5019.89 327.57 GENERAL CALCULATIONS : AREA 13 Mean value (Unit) 5.98 30.97 94.84 6.38 Standard Deviation (Unit) 0.95 20.91 0.48 0.24 Standard Error (Unit) 0.03 0.73 0.02 0.01 Area under curve (Unit*sec.) 305.18 1580.65 4839.29 325.37 GENERAL CALCULATIONS : AREA 14 Mean value (Unit) 6.11 33.9 92.84 4.68 Standard Deviation (Unit) 0.67 11.63 1.54 0.35 Standard Error (Unit) 0.02 0.4 0.05 0.01 Area under curve (Unit*sec.) 312.45 1733.61 4748.48 239.43

Patient ID:117 Holofiber - placebo BASELINE TCOM HAND LASER HAND TCOM FOOT LASER FOOT Mean value (Unit) 16.44 56.95 52.26 11.02 Standard Deviation (Unit) 2.73 5.94 0.32 0.08 Standard Error (Unit) 0.13 0.28 0.02 0 Area under curve (Unit*sec.) 449.51 1557.22 1428.92 301.3 10 MIN HOLOFIBER Mean value (Unit) 28.09 57.14 45.32 8.1 Standard Deviation (Unit) 2.3 5.74 0.1 0.12 Standard Error (Unit) 0.1 0.26 0 0.01 Area under curve (Unit*sec.) 879.4 1789.04 1418.89 253.64 20 MIN HOLOFIBER Mean value (Unit) 32.55 62.1 45.13 6.71 Standard Deviation (Unit) 2.98 10.82 0.13 0.01 Standard Error (Unit) 0.12 0.45 0.01 0 Area under curve (Unit*sec.) 1168.61 2229.22 1620.09 241.01 30 MIN HOLOFIBER Mean value (Unit) 31.87 63.74 44.1 7.75 Standard Deviation (Unit) 2.61 6.48 0.14 0 Standard Error (Unit) 0.12 0.29 0.01 0 Area under curve (Unit*sec.) 983.99 1968.15 1361.57 239.33 40 MIN HOLOFIBER Mean value (Unit) 31.84 59.1 42.44 5.46 Standard Deviation (Unit) 2.28 6.92 0.06 0.16 Standard Error (Unit) 0.1 0.3 0 0.01 Area under curve (Unit*sec.) 1026.69 1905.51 1368.12 176.01 50 MIN HOLOFIBER Mean value (Unit) 24.35 68.6 43.17 3.88 Standard Deviation (Unit) 1.3 4.9 0.44 0.12 Standard Error (Unit) 0.06 0.21 0.02 0.01 Area under curve (Unit*sec.) 795.71 2241.93 1410.59 126.72 60 MIN HOLOFIBER Mean value (Unit) 28.58 77.73 43.03 4.14 Standard Deviation (Unit) 3.11 4.23 0.32 0.14 Standard Error (Unit) 0.14 0.18 0.01 0.01 Area under curve (Unit*sec.) 934.08 2539.68 1405.82 135.37 10 MIN PLACEBO Mean value (Unit) 26.63 67.56 39.01 5.79 Standard Deviation (Unit) 1.2 90.84 0.39 0.12 Standard Error (Unit) 0.06 4.33 0.02 0.01 Area under curve (Unit*sec.) 726.47 1845.6 1064.31 157.92 20 MIN PLACEBO Mean value (Unit) 29.83 26.3 39.28 5.85 Standard Deviation (Unit) 1.74 2.51 0.12 0.19 Standard Error (Unit) 0.07 0.1 0 0.01 Area under curve (Unit*sec.) 1083.71 955.64 1427.11 212.48
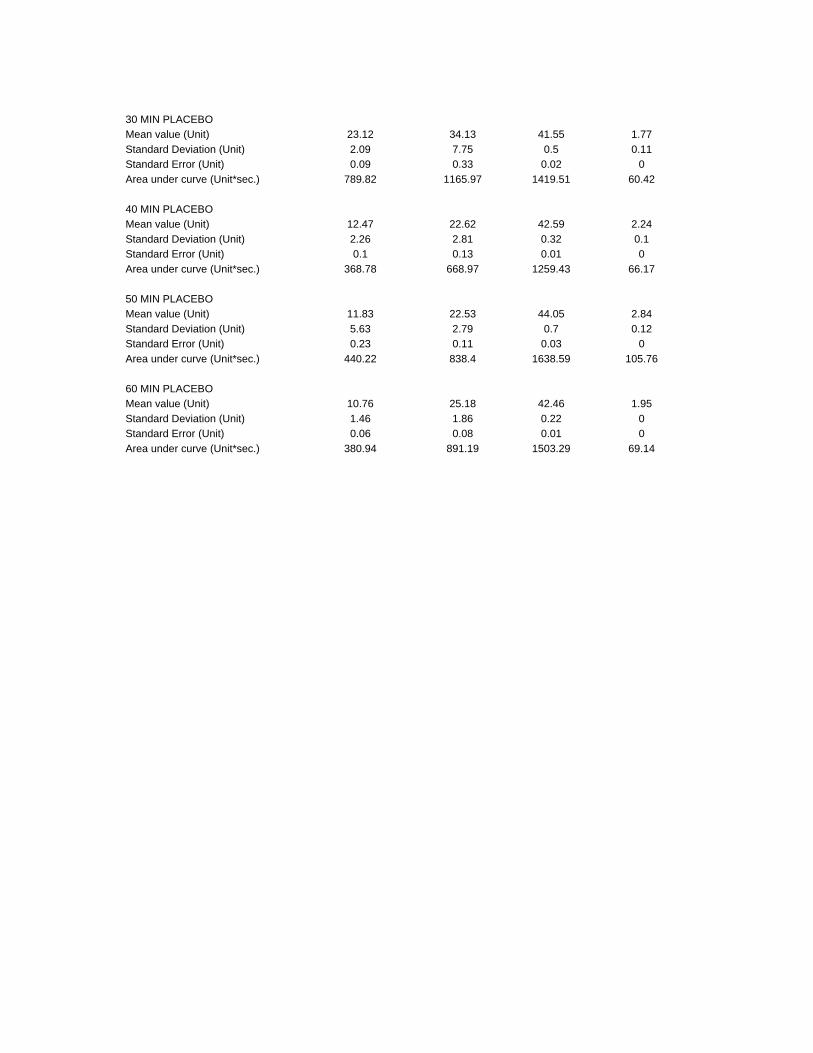
30 MIN PLACEBO Mean value (Unit) 23.12 34.13 41.55 1.77 Standard Deviation (Unit) 2.09 7.75 0.5 0.11 Standard Error (Unit) 0.09 0.33 0.02 0 Area under curve (Unit*sec.) 789.82 1165.97 1419.51 60.42 40 MIN PLACEBO Mean value (Unit) 12.47 22.62 42.59 2.24 Standard Deviation (Unit) 2.26 2.81 0.32 0.1 Standard Error (Unit) 0.1 0.13 0.01 0 Area under curve (Unit*sec.) 368.78 668.97 1259.43 66.17 50 MIN PLACEBO Mean value (Unit) 11.83 22.53 44.05 2.84 Standard Deviation (Unit) 5.63 2.79 0.7 0.12 Standard Error (Unit) 0.23 0.11 0.03 0 Area under curve (Unit*sec.) 440.22 838.4 1638.59 105.76 60 MIN PLACEBO Mean value (Unit) 10.76 25.18 42.46 1.95 Standard Deviation (Unit) 1.46 1.86 0.22 0 Standard Error (Unit) 0.06 0.08 0.01 0 Area under curve (Unit*sec.) 380.94 891.19 1503.29 69.14

Patient ID:118 placebo - Holofiber
RECORDING INFORMATION BASELINE TCOM HAND LASER HAND TCOM FOOT LASER FOOT Mean value (Unit) 15.59 41.17 31.08 49.12 Standard Deviation (Unit) 1.53 6.23 1.44 1.37 Standard Error (Unit) 0.03 0.14 0.03 0.03 Area under curve (Unit*sec.) 1918.73 5067.54 3825.09 6045.28 10 MIN PLACEBO Mean value (Unit) 17.21 52.38 14.69 45.45 Standard Deviation (Unit) 1.45 4.66 0.96 0.47 Standard Error (Unit) 0.03 0.09 0.02 0.01 Area under curve (Unit*sec.) 2596.41 7900.42 2216.16 6855.66 20 MIN PLACEBO Mean value (Unit) 16.38 48.01 11.81 47.41 Standard Deviation (Unit) 1.49 10.4 0.77 0.74 Standard Error (Unit) 0.03 0.19 0.01 0.01 Area under curve (Unit*sec.) 2991.91 8767.94 2155.54 8657.17 30 MIN PLACEBO Mean value (Unit) 24.19 49.18 13.06 48.14 Standard Deviation (Unit) 29.59 9.07 0.79 0.3 Standard Error (Unit) 0.55 0.17 0.01 0.01 Area under curve (Unit*sec.) 4418.24 8979.26 2384.3 8789.47 40 MIN PLACEBO Mean value (Unit) 21.59 50.58 14.66 50.69 Standard Deviation (Unit) 17.23 8.07 1.27 0.38 Standard Error (Unit) 0.32 0.15 0.02 0.01 Area under curve (Unit*sec.) 3941.82 9234.92 2677.09 9255.53 50 MIN PLACEBO Mean value (Unit) 22.26 48.09 14.69 51.32 Standard Deviation (Unit) 9.22 11.02 1.23 0.77 Standard Error (Unit) 0.17 0.21 0.02 0.01 Area under curve (Unit*sec.) 3887.79 8400.42 2564.92 8963.13 60 MIN PLACEBO Mean value (Unit) 32.42 45.58 20.07 53.5 Standard Deviation (Unit) 41.87 11.34 0.85 0.67 Standard Error (Unit) 0.73 0.2 0.01 0.01 Area under curve (Unit*sec.) 6693.43 9409.93 4142.42 11043.63 10 MIN HOLOFIBER Mean value (Unit) 64.13 32.45 33.81 56.45 Standard Deviation (Unit) 64.22 19.46 1.25 1.88 Standard Error (Unit) 1.18 0.36 0.02 0.03 Area under curve (Unit*sec.) 11726.08 5933.78 6182.08 10322.27 20 MIN HOLOFIBER Mean value (Unit) 40.82 37.76 29.93 54.97 Standard Deviation (Unit) 3.67 9.1 1.88 0.75 Standard Error (Unit) 0.07 0.17 0.03 0.01
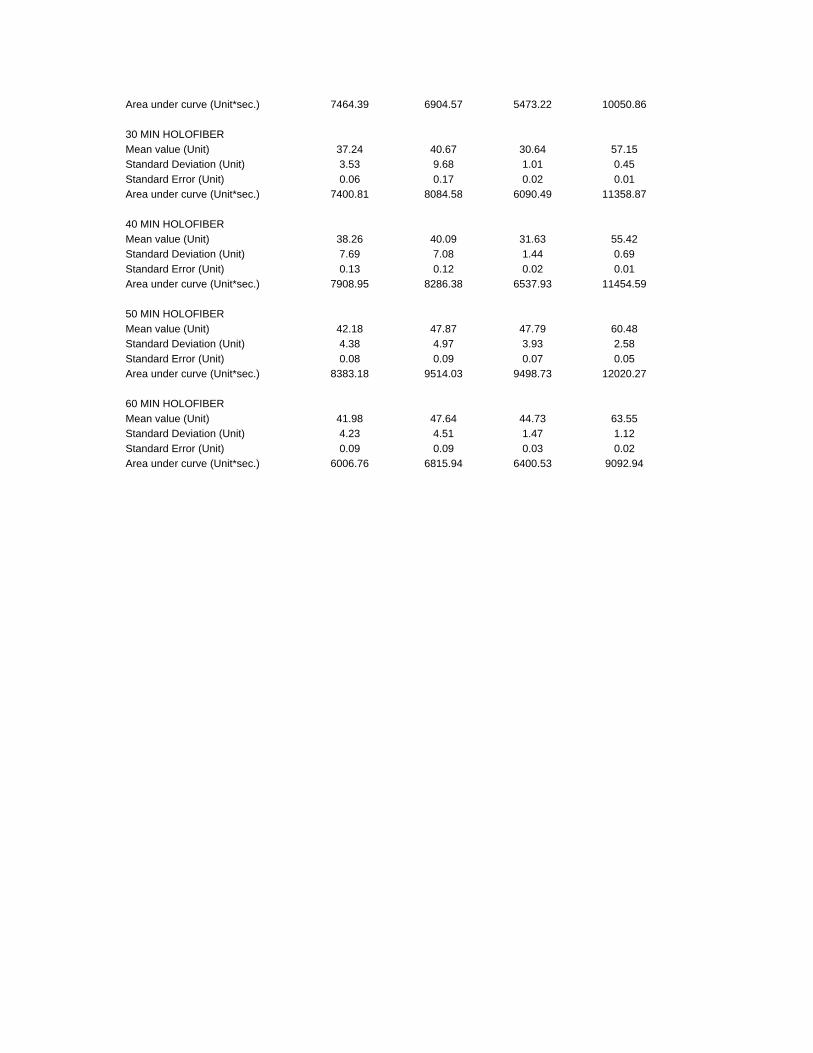
Area under curve (Unit*sec.) 7464.39 6904.57 5473.22 10050.86 30 MIN HOLOFIBER Mean value (Unit) 37.24 40.67 30.64 57.15 Standard Deviation (Unit) 3.53 9.68 1.01 0.45 Standard Error (Unit) 0.06 0.17 0.02 0.01 Area under curve (Unit*sec.) 7400.81 8084.58 6090.49 11358.87 40 MIN HOLOFIBER Mean value (Unit) 38.26 40.09 31.63 55.42 Standard Deviation (Unit) 7.69 7.08 1.44 0.69 Standard Error (Unit) 0.13 0.12 0.02 0.01 Area under curve (Unit*sec.) 7908.95 8286.38 6537.93 11454.59 50 MIN HOLOFIBER Mean value (Unit) 42.18 47.87 47.79 60.48 Standard Deviation (Unit) 4.38 4.97 3.93 2.58 Standard Error (Unit) 0.08 0.09 0.07 0.05 Area under curve (Unit*sec.) 8383.18 9514.03 9498.73 12020.27 60 MIN HOLOFIBER Mean value (Unit) 41.98 47.64 44.73 63.55 Standard Deviation (Unit) 4.23 4.51 1.47 1.12 Standard Error (Unit) 0.09 0.09 0.03 0.02 Area under curve (Unit*sec.) 6006.76 6815.94 6400.53 9092.94

Patient ID:119 placebo - Holofiber BASELINE TCOM HAND LASER HAND TCOM FOOT LASER FOOT Mean value (Unit) 23.52 50.95 54.36 50.72 Standard Deviation (Unit) 2.67 21.02 1.12 0.64 Standard Error (Unit) 0.21 1.62 0.09 0.05 Area under curve (Unit*sec.) 243.36 528.2 562.72 525.14 10 MIN PLACEBO Mean value (Unit) 35.19 76.8 57.98 67.63 Standard Deviation (Unit) 12.13 29.13 0.29 0.29 Standard Error (Unit) 0.39 0.92 0.01 0.01 Area under curve (Unit*sec.) 2162.32 4714.42 3562.3 4155.21 20 MIN PLACEBO Mean value (Unit) 33.85 126.84 62.51 71.14 Standard Deviation (Unit) 15.21 114.56 1.14 1.61 Standard Error (Unit) 0.47 3.55 0.04 0.05 Area under curve (Unit*sec.) 2180.64 8174.5 4026.65 4582.78 30 MIN PLACEBO Mean value (Unit) 28.81 108.01 64.33 71.53 Standard Deviation (Unit) 9.77 54.75 0.52 0.81 Standard Error (Unit) 0.31 1.75 0.02 0.03 Area under curve (Unit*sec.) 1740.39 6528.88 3889.06 4323.97 40 MIN PLACEBO Mean value (Unit) 23.71 81.12 66.85 72.59 Standard Deviation (Unit) 6.25 22.46 0.93 0.97 Standard Error (Unit) 0.2 0.71 0.03 0.03 Area under curve (Unit*sec.) 1457.23 4984.26 4107.54 4460.26 50 MIN PLACEBO Mean value (Unit) 24.28 95.78 69.06 74.7 Standard Deviation (Unit) 7.34 15.73 0.26 0.24 Standard Error (Unit) 0.23 0.5 0.01 0.01 Area under curve (Unit*sec.) 1467.4 5790.62 4174.97 4515.4 60 MIN PLACEBO Mean value (Unit) 22.5 94.75 71.84 77 Standard Deviation (Unit) 4.97 24.66 0.72 0.72 Standard Error (Unit) 0.14 0.69 0.02 0.02 Area under curve (Unit*sec.) 1784.94 7516.97 5699.41 6108.26 10 MIN HOLOFIBER Mean value (Unit) 33.48 61.25 67.14 71.64 Standard Deviation (Unit) 11.29 18.59 0.64 0.5 Standard Error (Unit) 0.29 0.47 0.02 0.01 Area under curve (Unit*sec.) 3185.63 5829.21 6389.25 6817.88 20 MIN HOLOFIBER Mean value (Unit) 30.18 62.35 67.26 70.47 Standard Deviation (Unit) 5.45 30.2 0.91 1.13 Standard Error (Unit) 0.14 0.77 0.02 0.03 Area under curve (Unit*sec.) 2872.32 5934.04 6400.84 6706.8

30 MIN HOLOFIBER Mean value (Unit) 29.91 57.79 68.55 69.18 Standard Deviation (Unit) 6.75 33.9 1.78 1.21 Standard Error (Unit) 0.17 0.85 0.04 0.03 Area under curve (Unit*sec.) 2965.03 5729.62 6796.24 6858.19 40 MIN HOLOFIBER Mean value (Unit) 28.85 53.47 68.73 71.72 Standard Deviation (Unit) 5.15 18.13 0.69 0.66 Standard Error (Unit) 0.13 0.46 0.02 0.02 Area under curve (Unit*sec.) 2746.16 5088.82 6541.54 6825.3 50 MIN HOLOFIBER Mean value (Unit) 31.32 53.98 71.36 75.16 Standard Deviation (Unit) 6.79 16.96 1.66 1.59 Standard Error (Unit) 0.15 0.37 0.04 0.04 Area under curve (Unit*sec.) 3974.71 6850.74 9056.87 9539.52 60 MIN HOLOFIBER Mean value (Unit) 31.51 68.69 70.75 75.65 Standard Deviation (Unit) 5.98 50.86 1.25 1.4 Standard Error (Unit) 0.16 1.36 0.03 0.04 Area under curve (Unit*sec.) 2748.83 5993.38 6171.57 6599.18
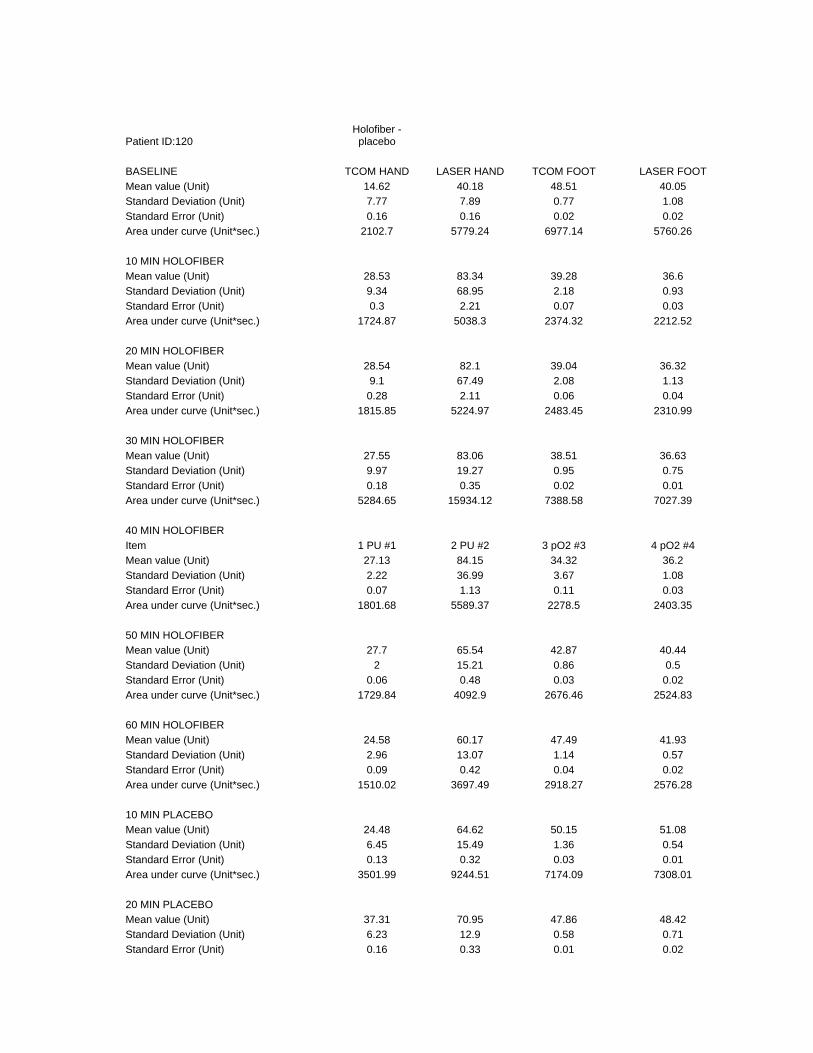
Patient ID:120 Holofiber -
placebo BASELINE TCOM HAND LASER HAND TCOM FOOT LASER FOOT Mean value (Unit) 14.62 40.18 48.51 40.05 Standard Deviation (Unit) 7.77 7.89 0.77 1.08 Standard Error (Unit) 0.16 0.16 0.02 0.02 Area under curve (Unit*sec.) 2102.7 5779.24 6977.14 5760.26 10 MIN HOLOFIBER Mean value (Unit) 28.53 83.34 39.28 36.6 Standard Deviation (Unit) 9.34 68.95 2.18 0.93 Standard Error (Unit) 0.3 2.21 0.07 0.03 Area under curve (Unit*sec.) 1724.87 5038.3 2374.32 2212.52 20 MIN HOLOFIBER Mean value (Unit) 28.54 82.1 39.04 36.32 Standard Deviation (Unit) 9.1 67.49 2.08 1.13 Standard Error (Unit) 0.28 2.11 0.06 0.04 Area under curve (Unit*sec.) 1815.85 5224.97 2483.45 2310.99 30 MIN HOLOFIBER Mean value (Unit) 27.55 83.06 38.51 36.63 Standard Deviation (Unit) 9.97 19.27 0.95 0.75 Standard Error (Unit) 0.18 0.35 0.02 0.01 Area under curve (Unit*sec.) 5284.65 15934.12 7388.58 7027.39 40 MIN HOLOFIBER Item 1 PU #1 2 PU #2 3 pO2 #3 4 pO2 #4 Mean value (Unit) 27.13 84.15 34.32 36.2 Standard Deviation (Unit) 2.22 36.99 3.67 1.08 Standard Error (Unit) 0.07 1.13 0.11 0.03 Area under curve (Unit*sec.) 1801.68 5589.37 2278.5 2403.35 50 MIN HOLOFIBER Mean value (Unit) 27.7 65.54 42.87 40.44 Standard Deviation (Unit) 2 15.21 0.86 0.5 Standard Error (Unit) 0.06 0.48 0.03 0.02 Area under curve (Unit*sec.) 1729.84 4092.9 2676.46 2524.83 60 MIN HOLOFIBER Mean value (Unit) 24.58 60.17 47.49 41.93 Standard Deviation (Unit) 2.96 13.07 1.14 0.57 Standard Error (Unit) 0.09 0.42 0.04 0.02 Area under curve (Unit*sec.) 1510.02 3697.49 2918.27 2576.28 10 MIN PLACEBO Mean value (Unit) 24.48 64.62 50.15 51.08 Standard Deviation (Unit) 6.45 15.49 1.36 0.54 Standard Error (Unit) 0.13 0.32 0.03 0.01 Area under curve (Unit*sec.) 3501.99 9244.51 7174.09 7308.01 20 MIN PLACEBO Mean value (Unit) 37.31 70.95 47.86 48.42 Standard Deviation (Unit) 6.23 12.9 0.58 0.71 Standard Error (Unit) 0.16 0.33 0.01 0.02

Area under curve (Unit*sec.) 3557.69 6764.93 4564.05 4617.4 30 MIN PLACEBO Mean value (Unit) 28.94 71.24 50.17 51.49 Standard Deviation (Unit) 3.82 13.74 0.96 0.6 Standard Error (Unit) 0.12 0.44 0.03 0.02 Area under curve (Unit*sec.) 1720.64 4236.42 2983.25 3061.49 40 MIN PLACEBO Mean value (Unit) 21.87 90.2 48.61 50.33 Standard Deviation (Unit) 3.35 38.99 1.45 0.69 Standard Error (Unit) 0.09 0.99 0.04 0.02 Area under curve (Unit*sec.) 2085.7 8600.74 4635.14 4799.81 50 MIN PLACEBO Mean value (Unit) 22.24 106.75 45.99 49.16 Standard Deviation (Unit) 16.45 56.96 1.19 0.87 Standard Error (Unit) 0.39 1.34 0.03 0.02 Area under curve (Unit*sec.) 2475.36 11878.13 5116.7 5469.06 60 MIN PLACEBO Mean value (Unit) 27.65 79.06 52.92 53.02 Standard Deviation (Unit) 3.82 26.67 1.56 1.19 Standard Error (Unit) 0.09 0.65 0.04 0.03 Area under curve (Unit*sec.) 2850.9 8150.63 5456.89 5466.49

Patient ID:121 placebo - Holofiber
BASELINE TCOM HAND LASER HAND TCOM FOOT LASER FOOT
Mean value (Unit) 11.2 23.97 25.16 45.37 Standard Deviation (Unit) 0.62 6.12 0.46 0.6 Standard Error (Unit) 0.02 0.21 0.02 0.02 Area under curve (Unit*sec.) 575.41 1231.86 1293.08 2331.88 10 MIN PLACEBO Mean value (Unit) 14.15 43.08 8.53 43.96 Standard Deviation (Unit) 1.06 10.11 0.52 0.19 Standard Error (Unit) 0.04 0.35 0.02 0.01 Area under curve (Unit*sec.) 729.86 2222.08 439.98 2267.62 20 MIN PLACEBO Mean value (Unit) 15.19 43.84 10.26 43.44 Standard Deviation (Unit) 0.88 11.52 0.37 0.2 Standard Error (Unit) 0.03 0.4 0.01 0.01 Area under curve (Unit*sec.) 776.75 2242.17 524.63 2221.79 30 MIN PLACEBO Mean value (Unit) 16.14 43.41 8.78 44.06 Standard Deviation (Unit) 1.5 12.34 0.32 0.48 Standard Error (Unit) 0.05 0.43 0.01 0.02 Area under curve (Unit*sec.) 828.42 2228.4 450.51 2261.66 40 MIN PLACEBO Mean value (Unit) 15.29 30.9 12.72 46.69 Standard Deviation (Unit) 1.08 8.39 0.45 0.27 Standard Error (Unit) 0.04 0.29 0.02 0.01 Area under curve (Unit*sec.) 782.91 1582.83 651.3 2390.91 50 MIN PLACEBO Mean value (Unit) 14.57 36.58 13.13 45.82 Standard Deviation (Unit) 0.97 8.63 0.41 0.25 Standard Error (Unit) 0.03 0.3 0.01 0.01 Area under curve (Unit*sec.) 746.08 1873.17 672.37 2346.38 60 MIN PLACEBO Mean value (Unit) 14.54 35.88 14.19 47.4 Standard Deviation (Unit) 0.89 7.21 0.44 0.24 Standard Error (Unit) 0.03 0.25 0.02 0.01 Area under curve (Unit*sec.) 745.38 1840.17 727.38 2430.56 10 MIN HOLOFIBER Mean value (Unit) 16.17 40.79 21.14 50.58 Standard Deviation (Unit) 5.23 9.34 0.19 0.38 Standard Error (Unit) 0.18 0.33 0.01 0.01 Area under curve (Unit*sec.) 825.03 2080.56 1078.75 2581.12 20 MIN HOLOFIBER Mean value (Unit) 13.3 39.1 25.39 56.38 Standard Deviation (Unit) 2.09 8.46 0.25 0.25 Standard Error (Unit) 0.07 0.29 0.01 0.01

Area under curve (Unit*sec.) 680.17 2001.13 1298.74 2884 30 MIN HOLOFIBER Mean value (Unit) 13.04 39.02 21.29 55.7 Standard Deviation (Unit) 1.34 9.15 0.46 0.37 Standard Error (Unit) 0.05 0.32 0.02 0.01 Area under curve (Unit*sec.) 663.75 1986.12 1083.94 2835.31 40 MIN HOLOFIBER Mean value (Unit) 11.87 43.98 24.71 56.22 Standard Deviation (Unit) 0.99 7.03 0.29 0.43 Standard Error (Unit) 0.03 0.24 0.01 0.01 Area under curve (Unit*sec.) 604.74 2241.77 1259.2 2865.29 50 MIN HOL Mean value (Unit) 11.76 47.1 26.25 58.05 Standard Deviation (Unit) 0.77 6.1 0.5 0.51 Standard Error (Unit) 0.03 0.21 0.02 0.02 Area under curve (Unit*sec.) 604.95 2423.57 1350.99 2987.11 60 MIN HOLOFIBER Mean value (Unit) 13.53 36.17 26.13 60.84 Standard Deviation (Unit) 2.45 10.83 0.24 0.94 Standard Error (Unit) 0.09 0.39 0.01 0.03 Area under curve (Unit*sec.) 631.06 1685.51 1218.38 2836.52


Lavery CV
Lawrence A. Lavery, DPM, MPH Dr. Lawrence A. Lavery, medical professor, noted researcher, international lecturer and inventor, is a world renowned expert in amputation prevention in high-risk diabetics, an epidemiologist of diabetic-related amputations and a leading specialist in the use of footwear and insoles to prevent re-ulceration in high-risk diabetics.
Educated on the undergraduate level at Indiana University in Bloomington where he received his B.S. in business, Dr. Lavery received his DPM (Doctor of Podiatric Medicine) from Dr. William Scholl College of Podiatric Medicine in Chicago, Illinois, in 1988. In 1992, he received his MPH (Master of Public Health) in Public Health Epidemiology from the University of Texas Health Science Center, School of Public Health, in Houston, Texas. Between 1988 and 1990, he was a resident in podiatric medicine and surgery at the University of Texas Health Science Center in San Antonio. Following that, he became the Chief Resident from 1992 to 1993.
Currently, Dr. Lavery is a Associate Professor at Loyola University Medical Center in Maywood, Illinois, in the department of Orthopaedic Surgery and Rehabilitation and is the Staff Podiatrist (WOC) at the Edward Hines Jr. Veterans Administration Hospital in Maywood, Illinois. Dr. Lavery is an Associate Professor with tenure at the University of Texas Health Science Center in San Antonio, Department of Orthopedic Surgery. Between 1997 and 1998, he was the Staff Podiatrist at the Audie L. Murphy Memorial Veterans Administration Hospital in San Antonio, Texas. And between 1991 and 1992, Dr. Lavery was a Research Fellow at the American College of Foot and Ankle Surgeons in San Antonio, Texas.
A distinguished medical researcher who is often called upon by industry to conduct independent clinical research of the highest level, Dr. Lavery has published over 100 peer reviewed papers, and is the author of the chapter on ìThe Diabeticís Footî in Clinics in Podiatric Medicine and Surgery, published by W.B. Saunders, January 1995.
Dr. Lavery continues to develop highly specialized educational courses ranging from integrating new approaches in the treatment of diabetic foot ulcers to research programs for podiatry students at the University of Texas. Since 1992, Dr. Lavery has been actively engaged in the instruction of postdoctoral fellows, Ph.D. candidates and medical students. He has received numerous honors and awards for medical research and writing. In addition to a prestigious medical resume, Dr. Lavery was recently granted a patent for an apparatus and method for monitoring temperatures on the plantar aspects of the human foot and other vital health information (U.S. Patent 6,398,740B1 June 4, 2002).
Lawrence Lavery is considered one of the world’s leading experts in diabetic foot complications (podiatric medicine and diabetic-related issues).