Embed Size (px)
Citation preview
Rev. Sci. Instrum. 92, 054101 (2021); https://doi.org/10.1063/5.0046281 92, 054101
© 2021 Author(s).
Cell-phone camera Raman spectrometer Cite as: Rev. Sci. Instrum. 92, 054101 (2021); https://doi.org/10.1063/5.0046281Submitted: 02 February 2021 . Accepted: 17 March 2021 . Published Online: 04 May 2021
Dinesh Dhankhar, Anushka Nagpal, and Peter M. Rentzepis
COLLECTIONS
This paper was selected as Featured
ARTICLES YOU MAY BE INTERESTED IN
Non-contact and direct electrocaloric effect measurement for high-throughput materialscreeningReview of Scientific Instruments 92, 044902 (2021); https://doi.org/10.1063/5.0044258
Broadband femtosecond spectroscopic ellipsometryReview of Scientific Instruments 92, 033104 (2021); https://doi.org/10.1063/5.0027219
Magnetic tweezers with magnetic flux density feedback controlReview of Scientific Instruments 92, 034101 (2021); https://doi.org/10.1063/5.0039696
Review ofScientific Instruments ARTICLE scitation.org/journal/rsi
Cell-phone camera Raman spectrometer
Cite as: Rev. Sci. Instrum. 92, 054101 (2021); doi: 10.1063/5.0046281Submitted: 2 February 2021 • Accepted: 17 March 2021 •Published Online: 4 May 2021
Dinesh Dhankhar, Anushka Nagpal, and Peter M. Rentzepisa)
AFFILIATIONSDepartment of Electrical and Computer Engineering, Texas A & M University, College Station, Texas 77843, USA
a)Author to whom correspondence should be addressed: [email protected]
ABSTRACTIn this report, we describe the design, construction, and operation of a cell-phone-based Raman and emission spectral detector, which whencoupled to a diffraction grating and cell-phone camera system provides means for the detection, recording, and identification of chemicals,drugs, and biological molecules, in situ by means of their Raman and fluorescence spectra. The newly constructed cell-phone spectrometersystem was used to record Raman spectra from various chemicals and biological molecules including the resonance enhanced Raman spectraof carrots and bacteria. In addition, we present the quantitative analysis of alcohol–water Raman spectra, performed using our cell-phonespectrometer. The designed and constructed system was also used for constructing Raman images of the samples by utilizing a positionscanning stage in conjunction with the system. This compact and portable system is well suited for in situ field applications of Raman andfluorescence spectroscopy and may also be an integrated feature of future cell-phones.
Published under license by AIP Publishing. https://doi.org/10.1063/5.0046281
I. INTRODUCTION
Cell-phone cameras allow one to record and store a picturewithin seconds. The compact cameras in modern day cell-phonesare also increasingly becoming at par, even surpassing the qualityand sensitivity of the traditional, stand-alone camera systems. Thisincredible advance in quality and low light sensitivity of cell-phonecameras is partly due to the use of back-illuminated CMOS sen-sors and advances in noise removal software pre-processing of thecaptured images. This outstanding quality and sensitivity of cam-eras in modern day cell-phones can also be utilized as sensitive lightdetectors for various types of sensing. There have already been sev-eral successful attempts to utilize cell-phone cameras as portabledigital light microscope systems.1–3 In addition, there are severalcell-phone applications that can detect heart beats by analyzing thescattered light-emitting diode (LED) light from a finger placed overthe camera lens. In previous communications,4,5 we described thedesign, construction, and operation of absorption and emission sys-tems, which could be performed at remote areas, in order to detectand identify bacteria, pathogens, and molecules. In another previouscommunication,6 we utilized the compact monochrome CCD cam-eras, such as the ones used in the closed-circuit television (CCTV)cameras, to record the Ultraviolet (UV) fluorescence emitted frombacteria after excitation with Ultraviolet-C (UVC) LED light. Wealso correlated the damage inflicted, by Ultraviolet (UV) light, tothe bacterial cells and the consequent decrease in the recorded
fluorescence intensity owing to bacterial death. UV fluorescence canalso be used to detect extremely low concentrations of other fluo-rescing bio-molecules such as proteins and amino acids, tryptophanand tyrosine.
In this paper, we investigated the use of cameras used in mod-ern day cell-phones in conjunction with advanced spectroscopicdetection devices. The motivation for such applications was to usethem as a means for utilizing the continuously improving camerasensitivity and picture quality of the modern day cell-phone camerafor scientific purposes such as handheld cell-phone sized spectrom-eters, for the detection of pathogens and harmful chemicals throughRaman and fluorescence spectroscopies, in remote areas and placeswhere laboratory spectrometers are unavailable or cannot be usedbecause of size and power requirements.
Raman and fluorescence spectroscopies are two powerfulmeans for the detection and study of the structure and reactionmechanism of a molecule and biological species, such as proteins,amino and nucleic acids, and bacteria or viruses. These fast andnon-invasive techniques based on scattering and emission of lightprovide a fingerprint of the molecule and its structure. Fluores-cence spectroscopy is a very sensitive method for detecting the smallconcentrations of biological molecules, while the recorded Ramanspectra provide a means for determining the vibrational modesof the molecule, under study, and, consequently, the structure ofits molecular bonds. A combination of these techniques providesmeans for determining the characteristic structure(s) of complex
Rev. Sci. Instrum. 92, 054101 (2021); doi: 10.1063/5.0046281 92, 054101-1
Published under license by AIP Publishing
Review ofScientific Instruments ARTICLE scitation.org/journal/rsi
chemical and biological species. Raman spectroscopy may also beutilized for bio-molecules such as DNA and RNA, which either donot fluoresce or emit very low intensity fluorescence. Raman spec-troscopy has also been utilized in numerous, diverse areas and appli-cations, such as concentration of pharmaceutical drugs and othermixtures,7–10 determining the content of alcoholic fermentation inyeast11 and solid fat content in milk;12 determination of crystallinityof cellulose,13 identification of chemical isomers,14–16 and speciesconcentration in cryogenic fuels for space industry17 are just a fewof the applications of Raman spectroscopy. To that effect, severalRaman instruments are utilized to identify drugs, harmful gases, andchemicals in the environment and industrial plants.18–21
Raman spectroscopy has been applied for the detection andidentification of biological molecules by excitation with ultravio-let and visible light in order to increase the signal intensity, thusgenerating enhanced resonance Raman spectra.22–27
Several notable attempts have been made to build cost-effectiveRaman spectrometers;28–30 however, they still cost several thousandsof USD, with the majority designed for laboratory-based experi-ments rather than for in-field testing. Our pocket sized designedand constructed Raman spectrometer system that utilizes rightangle geometry to record Raman and resonance Raman spectra ofmolecules and biological species that contain colored pigments canbe constructed for much lower cost (see Table I in the Appendix).The detector of our Raman device, described in this paper, was a cell-phone CCD/CMOS sensor camera, suggesting that this inexpensivepocket Raman system has the potential of being an integral part ofubiquitous cell-phones and thus makes possible the identification ofchemicals and pathogens in situ, within minutes.
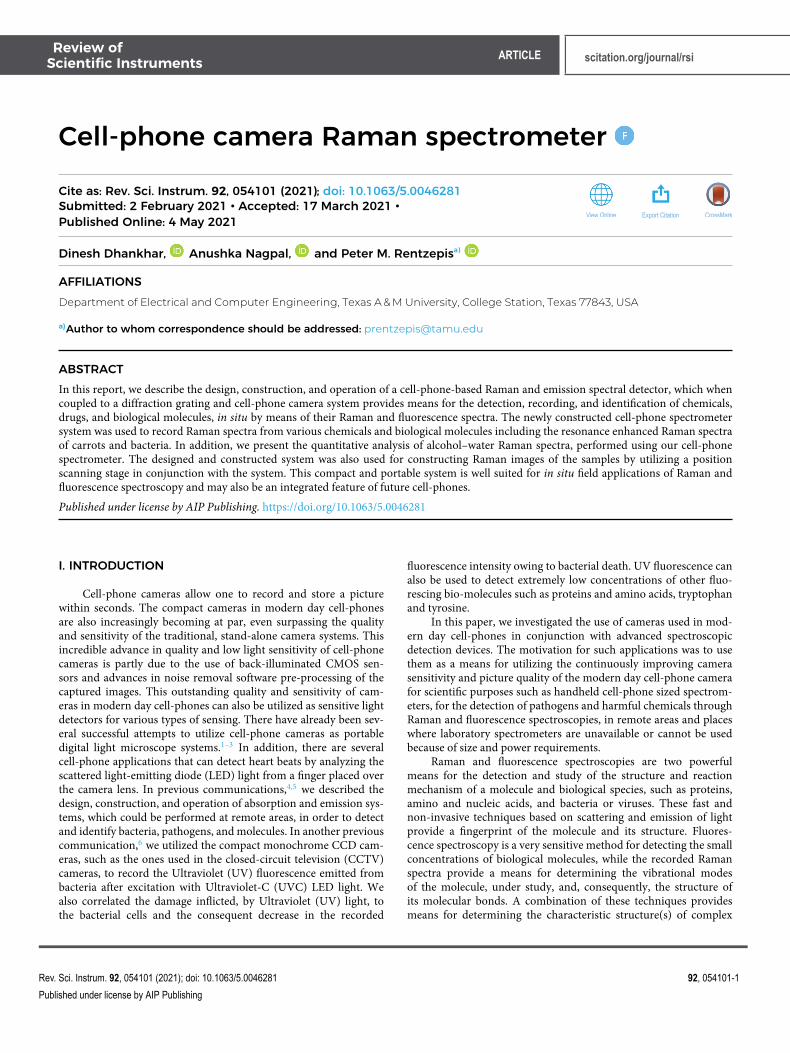
II. DESIGN AND CONSTRUCTIONMost commercial Raman spectrometers utilize backscattered
geometry [Fig. 1(a)]; this geometry results in intense Raman spec-tra; however, they have the disadvantage of being difficult toremove the noise imposed by Rayleigh scattering and back reflectedexcitation light. To eliminate back reflected light, in this geom-etry, dichroic mirrors and expensive Rayleigh cutoff filters arerequired. In contrast, using the transmission form [Fig. 1(b)], eventhough the dichroic mirrors may be eliminated, the signal recordedis masked by the intense excitation laser line. Consequently,transmission Raman systems require high quality laser line
FIG. 1. Raman spectroscopy geometries: (a) backscattered geometry, (b) trans-mission geometry, and (c) right angle geometry.
rejection filters and laser cleanup filters to eliminate excitation laserstray modes. One drawback of the Rayleigh rejection filters is thatthey may also limit the wavelength range in the low Raman shiftregions (<200 cm−1).
The design of our cell-phone-based Raman system presented inthis paper utilizes a 90○ excitation, and the geometry of the Ramansignal collection is shown in Fig. 1(c). This cell-phone sized instru-ment reduces the intensity of Rayleigh scattering falling on the detec-tor, resulting in an efficient removal of Rayleigh scattering. This rightangle (90○) excitation geometry also has the advantage of being eas-ier to use for the analysis of samples where a bulk property is to bemeasured, such as liquids or suspensions, vs microscopic level qual-ities. This is so since the scattering light collection optics can collectlight from a wider collection area when it is in the right angle geome-try. This would be especially effective when the excitation laser emitsan intense collimated beam or a focused beam with a longer depth offocus. In this manner, the macroscopic size of the sample is interro-gated by the laser beam, thereby providing an average Raman spec-trum of the sample in the presence of microscopic heterogeneities.Low cost diode laser and simple plastic lenses were utilized for theconstruction of our excitation system. The design and constructionare simple. The identification and detection of pathogens, such ascolored bacteria, solvents, and even impurities in food are easilydetected using our system.
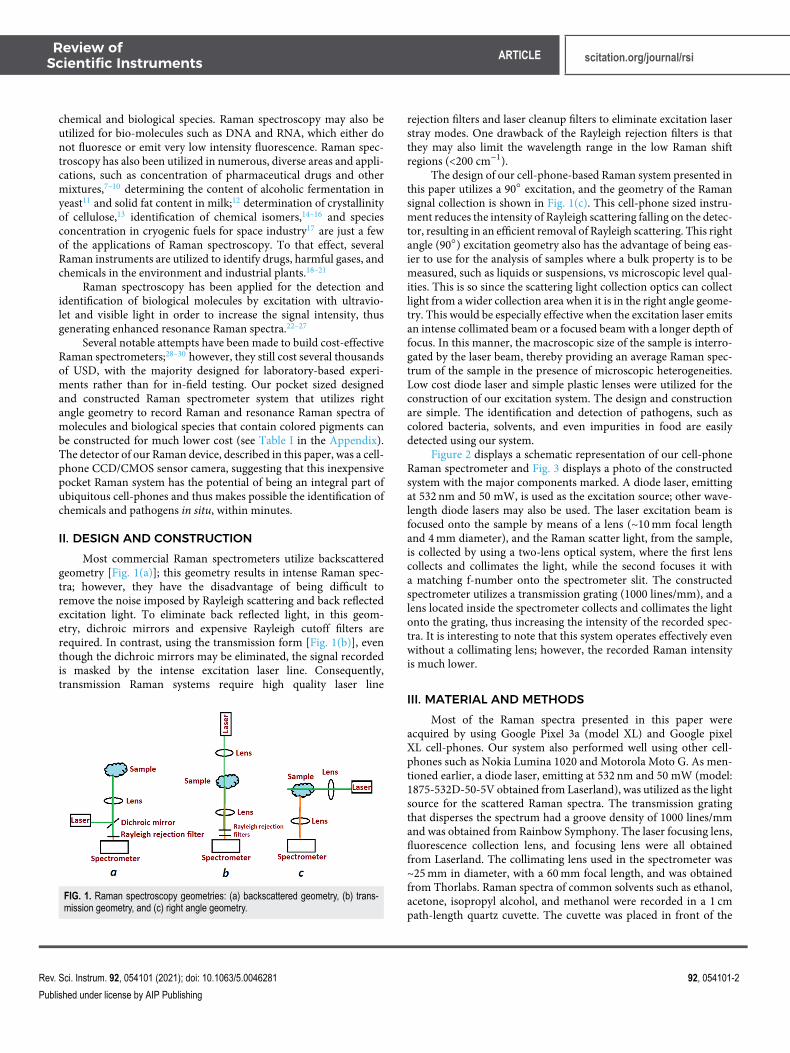
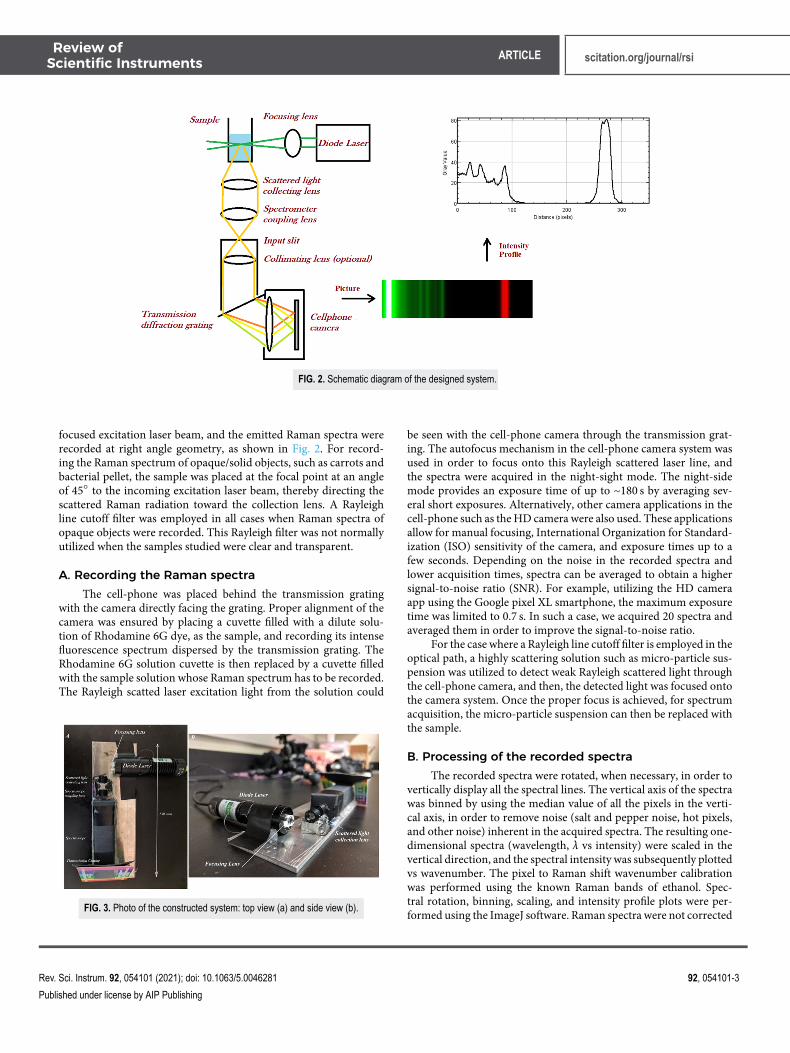
Figure 2 displays a schematic representation of our cell-phoneRaman spectrometer and Fig. 3 displays a photo of the constructedsystem with the major components marked. A diode laser, emittingat 532 nm and 50 mW, is used as the excitation source; other wave-length diode lasers may also be used. The laser excitation beam isfocused onto the sample by means of a lens (∼10 mm focal lengthand 4 mm diameter), and the Raman scatter light, from the sample,is collected by using a two-lens optical system, where the first lenscollects and collimates the light, while the second focuses it witha matching f-number onto the spectrometer slit. The constructedspectrometer utilizes a transmission grating (1000 lines/mm), and alens located inside the spectrometer collects and collimates the lightonto the grating, thus increasing the intensity of the recorded spec-tra. It is interesting to note that this system operates effectively evenwithout a collimating lens; however, the recorded Raman intensityis much lower.
III. MATERIAL AND METHODSMost of the Raman spectra presented in this paper were
acquired by using Google Pixel 3a (model XL) and Google pixelXL cell-phones. Our system also performed well using other cell-phones such as Nokia Lumina 1020 and Motorola Moto G. As men-tioned earlier, a diode laser, emitting at 532 nm and 50 mW (model:1875-532D-50-5V obtained from Laserland), was utilized as the lightsource for the scattered Raman spectra. The transmission gratingthat disperses the spectrum had a groove density of 1000 lines/mmand was obtained from Rainbow Symphony. The laser focusing lens,fluorescence collection lens, and focusing lens were all obtainedfrom Laserland. The collimating lens used in the spectrometer was∼25 mm in diameter, with a 60 mm focal length, and was obtainedfrom Thorlabs. Raman spectra of common solvents such as ethanol,acetone, isopropyl alcohol, and methanol were recorded in a 1 cmpath-length quartz cuvette. The cuvette was placed in front of the
Rev. Sci. Instrum. 92, 054101 (2021); doi: 10.1063/5.0046281 92, 054101-2
Published under license by AIP Publishing
Review ofScientific Instruments ARTICLE scitation.org/journal/rsi
FIG. 2. Schematic diagram of the designed system.
focused excitation laser beam, and the emitted Raman spectra wererecorded at right angle geometry, as shown in Fig. 2. For record-ing the Raman spectrum of opaque/solid objects, such as carrots andbacterial pellet, the sample was placed at the focal point at an angleof 45○ to the incoming excitation laser beam, thereby directing thescattered Raman radiation toward the collection lens. A Rayleighline cutoff filter was employed in all cases when Raman spectra ofopaque objects were recorded. This Rayleigh filter was not normallyutilized when the samples studied were clear and transparent.
A. Recording the Raman spectraThe cell-phone was placed behind the transmission grating
with the camera directly facing the grating. Proper alignment of thecamera was ensured by placing a cuvette filled with a dilute solu-tion of Rhodamine 6G dye, as the sample, and recording its intensefluorescence spectrum dispersed by the transmission grating. TheRhodamine 6G solution cuvette is then replaced by a cuvette filledwith the sample solution whose Raman spectrum has to be recorded.The Rayleigh scatted laser excitation light from the solution could
FIG. 3. Photo of the constructed system: top view (a) and side view (b).
be seen with the cell-phone camera through the transmission grat-ing. The autofocus mechanism in the cell-phone camera system wasused in order to focus onto this Rayleigh scattered laser line, andthe spectra were acquired in the night-sight mode. The night-sidemode provides an exposure time of up to ∼180 s by averaging sev-eral short exposures. Alternatively, other camera applications in thecell-phone such as the HD camera were also used. These applicationsallow for manual focusing, International Organization for Standard-ization (ISO) sensitivity of the camera, and exposure times up to afew seconds. Depending on the noise in the recorded spectra andlower acquisition times, spectra can be averaged to obtain a highersignal-to-noise ratio (SNR). For example, utilizing the HD cameraapp using the Google pixel XL smartphone, the maximum exposuretime was limited to 0.7 s. In such a case, we acquired 20 spectra andaveraged them in order to improve the signal-to-noise ratio.
For the case where a Rayleigh line cutoff filter is employed in theoptical path, a highly scattering solution such as micro-particle sus-pension was utilized to detect weak Rayleigh scattered light throughthe cell-phone camera, and then, the detected light was focused ontothe camera system. Once the proper focus is achieved, for spectrumacquisition, the micro-particle suspension can then be replaced withthe sample.
B. Processing of the recorded spectraThe recorded spectra were rotated, when necessary, in order to
vertically display all the spectral lines. The vertical axis of the spectrawas binned by using the median value of all the pixels in the verti-cal axis, in order to remove noise (salt and pepper noise, hot pixels,and other noise) inherent in the acquired spectra. The resulting one-dimensional spectra (wavelength, λ vs intensity) were scaled in thevertical direction, and the spectral intensity was subsequently plottedvs wavenumber. The pixel to Raman shift wavenumber calibrationwas performed using the known Raman bands of ethanol. Spec-tral rotation, binning, scaling, and intensity profile plots were per-formed using the ImageJ software. Raman spectra were not corrected
Rev. Sci. Instrum. 92, 054101 (2021); doi: 10.1063/5.0046281 92, 054101-3
Published under license by AIP Publishing
Review ofScientific Instruments ARTICLE scitation.org/journal/rsi
FIG. 4. Effect of spectral processing in removing the noise. The spectrum shownis the Raman spectrum of isopropanol in the fingerprint wavenumber region,acquired with our system.
for the variations of the quantum efficiency (intensity response)of the CMOS sensor as a function of the wavelength (instrumentresponse correction). Figure 4 shows the effect of spectral processingin removing the noise.
The absorption spectra of samples, when required, wererecorded by using a Shimadzu UV160 spectrophotometer. Thecarotenes were extracted from the raw carrots in the acetone solu-tion. The HD camera app was utilized for recording the Ramanspectra in order to determine the ethanol percentage in a water solu-tion. Spectral acquisition time was 3.9 s, the ISO value was 7100, andthe manual focusing function was employed to obtain proper focus.
IV. RESULTS AND DISCUSSIONA. Spectral resolution
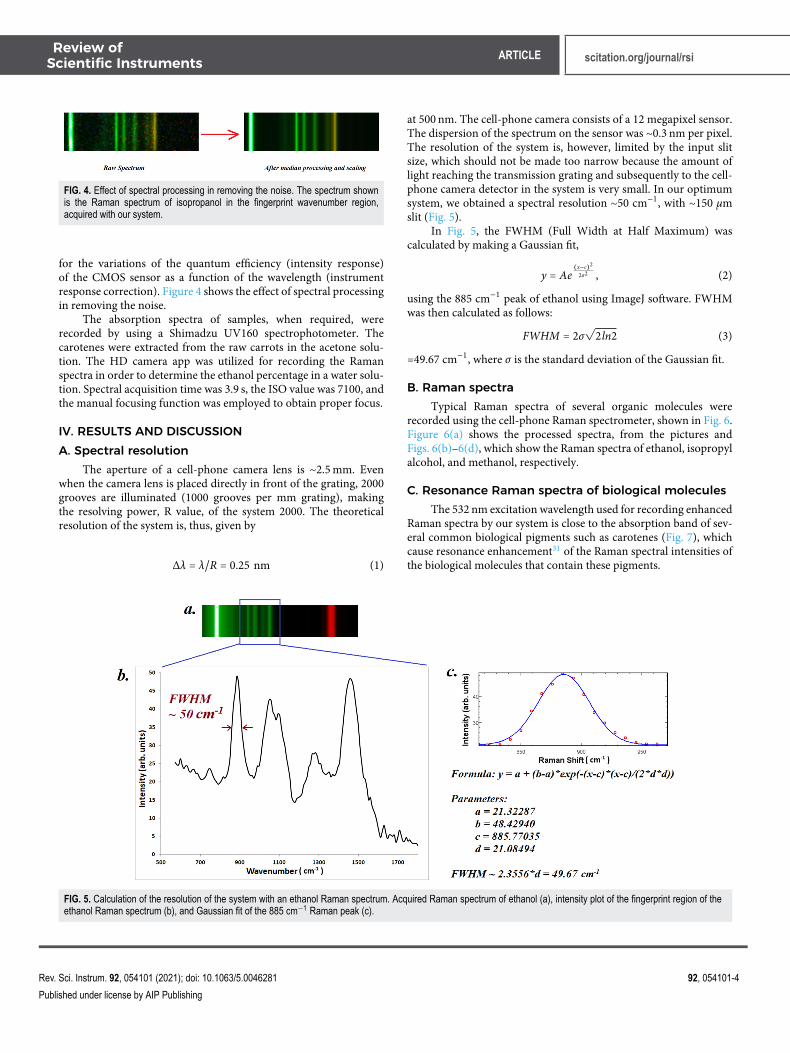
The aperture of a cell-phone camera lens is ∼2.5 mm. Evenwhen the camera lens is placed directly in front of the grating, 2000grooves are illuminated (1000 grooves per mm grating), makingthe resolving power, R value, of the system 2000. The theoreticalresolution of the system is, thus, given by
Δλ = λ/R = 0.25 nm (1)
at 500 nm. The cell-phone camera consists of a 12 megapixel sensor.The dispersion of the spectrum on the sensor was ∼0.3 nm per pixel.The resolution of the system is, however, limited by the input slitsize, which should not be made too narrow because the amount oflight reaching the transmission grating and subsequently to the cell-phone camera detector in the system is very small. In our optimumsystem, we obtained a spectral resolution ∼50 cm−1, with ∼150 μmslit (Fig. 5).
In Fig. 5, the FWHM (Full Width at Half Maximum) wascalculated by making a Gaussian fit,
y = Ae(x−c)2
2σ2 , (2)
using the 885 cm−1 peak of ethanol using ImageJ software. FWHMwas then calculated as follows:
FWHM = 2σ√
2ln2 (3)
=49.67 cm−1, where σ is the standard deviation of the Gaussian fit.
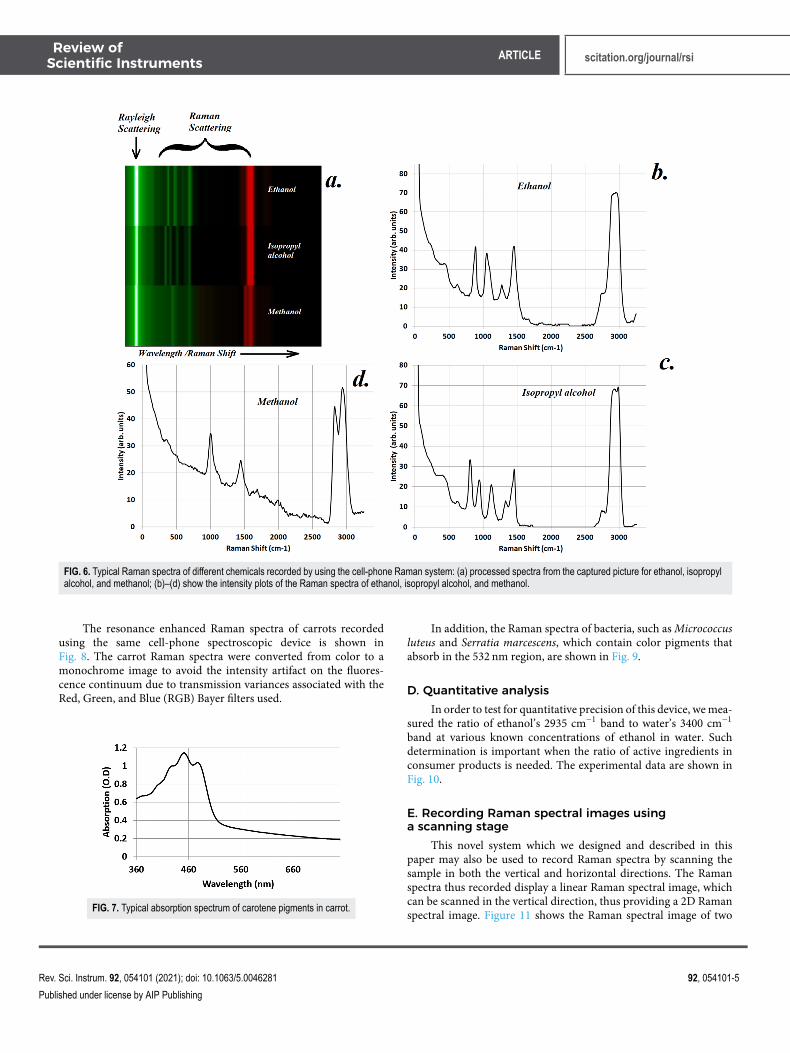
B. Raman spectraTypical Raman spectra of several organic molecules were
recorded using the cell-phone Raman spectrometer, shown in Fig. 6.Figure 6(a) shows the processed spectra, from the pictures andFigs. 6(b)–6(d), which show the Raman spectra of ethanol, isopropylalcohol, and methanol, respectively.
C. Resonance Raman spectra of biological moleculesThe 532 nm excitation wavelength used for recording enhanced
Raman spectra by our system is close to the absorption band of sev-eral common biological pigments such as carotenes (Fig. 7), whichcause resonance enhancement31 of the Raman spectral intensities ofthe biological molecules that contain these pigments.
FIG. 5. Calculation of the resolution of the system with an ethanol Raman spectrum. Acquired Raman spectrum of ethanol (a), intensity plot of the fingerprint region of theethanol Raman spectrum (b), and Gaussian fit of the 885 cm−1 Raman peak (c).
Rev. Sci. Instrum. 92, 054101 (2021); doi: 10.1063/5.0046281 92, 054101-4
Published under license by AIP Publishing
Review ofScientific Instruments ARTICLE scitation.org/journal/rsi
FIG. 6. Typical Raman spectra of different chemicals recorded by using the cell-phone Raman system: (a) processed spectra from the captured picture for ethanol, isopropylalcohol, and methanol; (b)–(d) show the intensity plots of the Raman spectra of ethanol, isopropyl alcohol, and methanol.
The resonance enhanced Raman spectra of carrots recordedusing the same cell-phone spectroscopic device is shown inFig. 8. The carrot Raman spectra were converted from color to amonochrome image to avoid the intensity artifact on the fluores-cence continuum due to transmission variances associated with theRed, Green, and Blue (RGB) Bayer filters used.
FIG. 7. Typical absorption spectrum of carotene pigments in carrot.
In addition, the Raman spectra of bacteria, such as Micrococcusluteus and Serratia marcescens, which contain color pigments thatabsorb in the 532 nm region, are shown in Fig. 9.
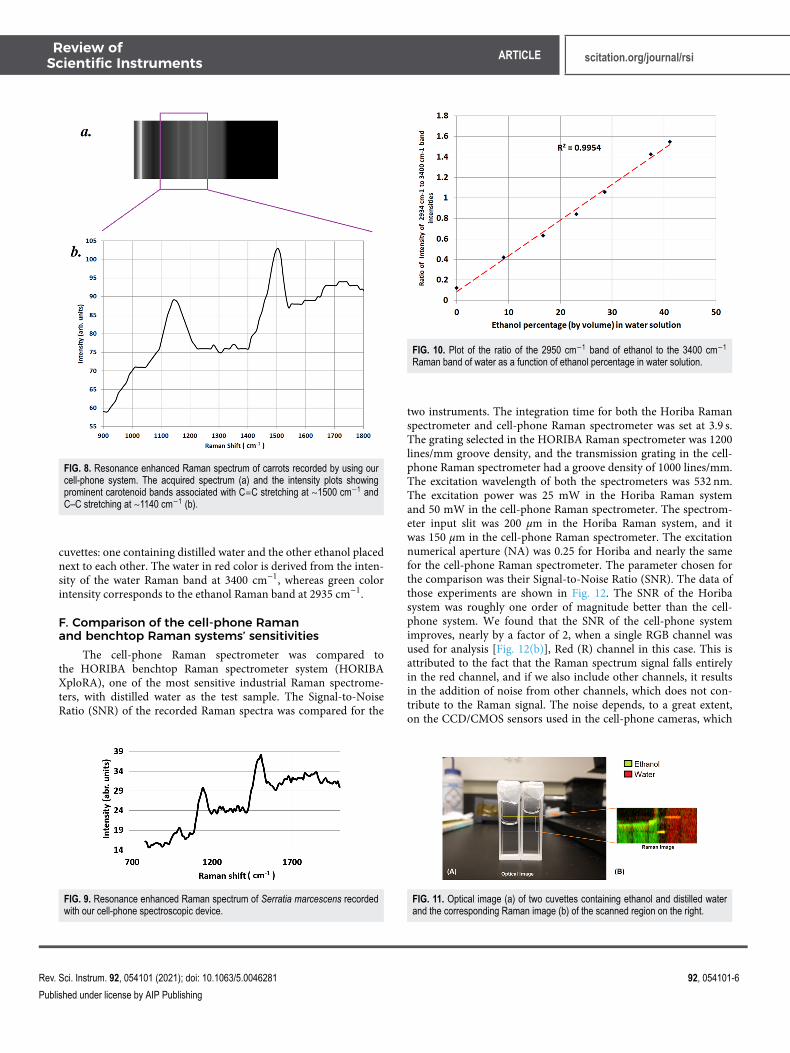
D. Quantitative analysisIn order to test for quantitative precision of this device, we mea-
sured the ratio of ethanol’s 2935 cm−1 band to water’s 3400 cm−1
band at various known concentrations of ethanol in water. Suchdetermination is important when the ratio of active ingredients inconsumer products is needed. The experimental data are shown inFig. 10.
E. Recording Raman spectral images usinga scanning stage
This novel system which we designed and described in thispaper may also be used to record Raman spectra by scanning thesample in both the vertical and horizontal directions. The Ramanspectra thus recorded display a linear Raman spectral image, whichcan be scanned in the vertical direction, thus providing a 2D Ramanspectral image. Figure 11 shows the Raman spectral image of two
Rev. Sci. Instrum. 92, 054101 (2021); doi: 10.1063/5.0046281 92, 054101-5
Published under license by AIP Publishing
Review ofScientific Instruments ARTICLE scitation.org/journal/rsi
FIG. 8. Resonance enhanced Raman spectrum of carrots recorded by using ourcell-phone system. The acquired spectrum (a) and the intensity plots showingprominent carotenoid bands associated with C=C stretching at ∼1500 cm−1 andC–C stretching at ∼1140 cm−1 (b).
cuvettes: one containing distilled water and the other ethanol placednext to each other. The water in red color is derived from the inten-sity of the water Raman band at 3400 cm−1, whereas green colorintensity corresponds to the ethanol Raman band at 2935 cm−1.
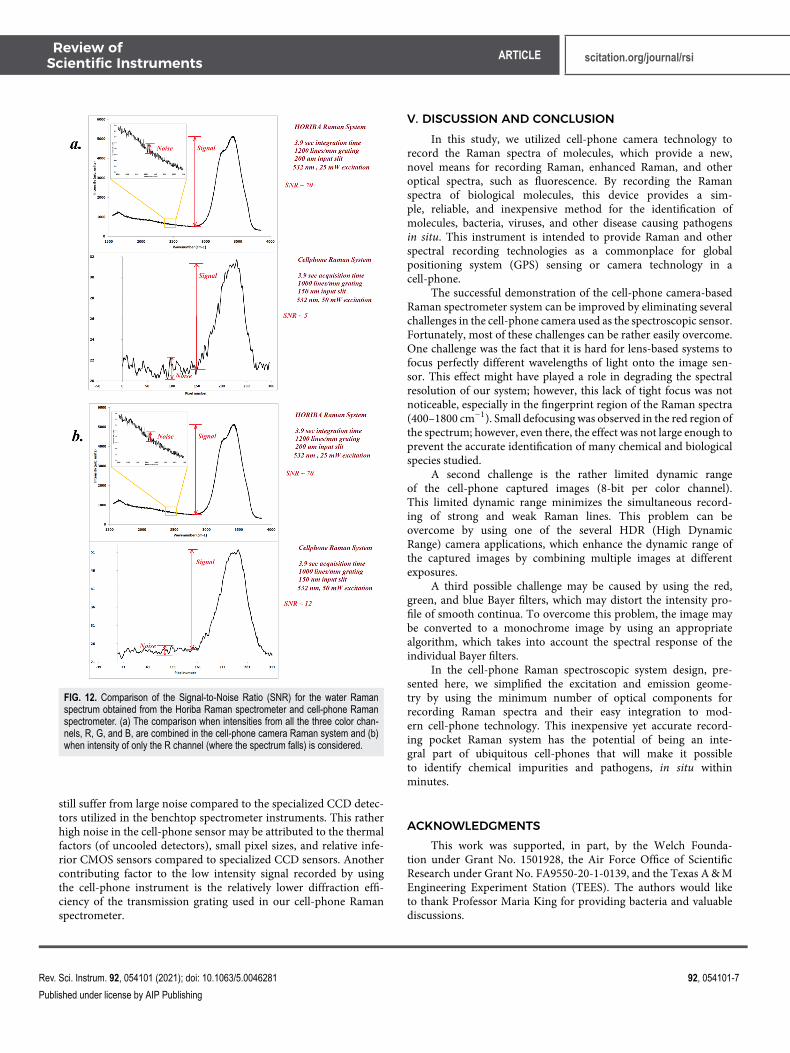
F. Comparison of the cell-phone Ramanand benchtop Raman systems’ sensitivities
The cell-phone Raman spectrometer was compared tothe HORIBA benchtop Raman spectrometer system (HORIBAXploRA), one of the most sensitive industrial Raman spectrome-ters, with distilled water as the test sample. The Signal-to-NoiseRatio (SNR) of the recorded Raman spectra was compared for the
FIG. 9. Resonance enhanced Raman spectrum of Serratia marcescens recordedwith our cell-phone spectroscopic device.
FIG. 10. Plot of the ratio of the 2950 cm−1 band of ethanol to the 3400 cm−1
Raman band of water as a function of ethanol percentage in water solution.
two instruments. The integration time for both the Horiba Ramanspectrometer and cell-phone Raman spectrometer was set at 3.9 s.The grating selected in the HORIBA Raman spectrometer was 1200lines/mm groove density, and the transmission grating in the cell-phone Raman spectrometer had a groove density of 1000 lines/mm.The excitation wavelength of both the spectrometers was 532 nm.The excitation power was 25 mW in the Horiba Raman systemand 50 mW in the cell-phone Raman spectrometer. The spectrom-eter input slit was 200 μm in the Horiba Raman system, and itwas 150 μm in the cell-phone Raman spectrometer. The excitationnumerical aperture (NA) was 0.25 for Horiba and nearly the samefor the cell-phone Raman spectrometer. The parameter chosen forthe comparison was their Signal-to-Noise Ratio (SNR). The data ofthose experiments are shown in Fig. 12. The SNR of the Horibasystem was roughly one order of magnitude better than the cell-phone system. We found that the SNR of the cell-phone systemimproves, nearly by a factor of 2, when a single RGB channel wasused for analysis [Fig. 12(b)], Red (R) channel in this case. This isattributed to the fact that the Raman spectrum signal falls entirelyin the red channel, and if we also include other channels, it resultsin the addition of noise from other channels, which does not con-tribute to the Raman signal. The noise depends, to a great extent,on the CCD/CMOS sensors used in the cell-phone cameras, which
FIG. 11. Optical image (a) of two cuvettes containing ethanol and distilled waterand the corresponding Raman image (b) of the scanned region on the right.
Rev. Sci. Instrum. 92, 054101 (2021); doi: 10.1063/5.0046281 92, 054101-6
Published under license by AIP Publishing
Review ofScientific Instruments ARTICLE scitation.org/journal/rsi
FIG. 12. Comparison of the Signal-to-Noise Ratio (SNR) for the water Ramanspectrum obtained from the Horiba Raman spectrometer and cell-phone Ramanspectrometer. (a) The comparison when intensities from all the three color chan-nels, R, G, and B, are combined in the cell-phone camera Raman system and (b)when intensity of only the R channel (where the spectrum falls) is considered.
still suffer from large noise compared to the specialized CCD detec-tors utilized in the benchtop spectrometer instruments. This ratherhigh noise in the cell-phone sensor may be attributed to the thermalfactors (of uncooled detectors), small pixel sizes, and relative infe-rior CMOS sensors compared to specialized CCD sensors. Anothercontributing factor to the low intensity signal recorded by usingthe cell-phone instrument is the relatively lower diffraction effi-ciency of the transmission grating used in our cell-phone Ramanspectrometer.
V. DISCUSSION AND CONCLUSIONIn this study, we utilized cell-phone camera technology to
record the Raman spectra of molecules, which provide a new,novel means for recording Raman, enhanced Raman, and otheroptical spectra, such as fluorescence. By recording the Ramanspectra of biological molecules, this device provides a sim-ple, reliable, and inexpensive method for the identification ofmolecules, bacteria, viruses, and other disease causing pathogensin situ. This instrument is intended to provide Raman and otherspectral recording technologies as a commonplace for globalpositioning system (GPS) sensing or camera technology in acell-phone.
The successful demonstration of the cell-phone camera-basedRaman spectrometer system can be improved by eliminating severalchallenges in the cell-phone camera used as the spectroscopic sensor.Fortunately, most of these challenges can be rather easily overcome.One challenge was the fact that it is hard for lens-based systems tofocus perfectly different wavelengths of light onto the image sen-sor. This effect might have played a role in degrading the spectralresolution of our system; however, this lack of tight focus was notnoticeable, especially in the fingerprint region of the Raman spectra(400–1800 cm−1). Small defocusing was observed in the red region ofthe spectrum; however, even there, the effect was not large enough toprevent the accurate identification of many chemical and biologicalspecies studied.
A second challenge is the rather limited dynamic rangeof the cell-phone captured images (8-bit per color channel).This limited dynamic range minimizes the simultaneous record-ing of strong and weak Raman lines. This problem can beovercome by using one of the several HDR (High DynamicRange) camera applications, which enhance the dynamic range ofthe captured images by combining multiple images at differentexposures.
A third possible challenge may be caused by using the red,green, and blue Bayer filters, which may distort the intensity pro-file of smooth continua. To overcome this problem, the image maybe converted to a monochrome image by using an appropriatealgorithm, which takes into account the spectral response of theindividual Bayer filters.
In the cell-phone Raman spectroscopic system design, pre-sented here, we simplified the excitation and emission geome-try by using the minimum number of optical components forrecording Raman spectra and their easy integration to mod-ern cell-phone technology. This inexpensive yet accurate record-ing pocket Raman system has the potential of being an inte-gral part of ubiquitous cell-phones that will make it possibleto identify chemical impurities and pathogens, in situ withinminutes.
ACKNOWLEDGMENTSThis work was supported, in part, by the Welch Founda-
tion under Grant No. 1501928, the Air Force Office of ScientificResearch under Grant No. FA9550-20-1-0139, and the Texas A & MEngineering Experiment Station (TEES). The authors would liketo thank Professor Maria King for providing bacteria and valuablediscussions.
Rev. Sci. Instrum. 92, 054101 (2021); doi: 10.1063/5.0046281 92, 054101-7
Published under license by AIP Publishing
Review ofScientific Instruments ARTICLE scitation.org/journal/rsi
APPENDIX: COST OF DIFFERENT COMPONENTSTABLE I. Cost breakdown of various components for the design of the open accessRaman spectroscopy system.
Component Cost (USD) Source
Diode laser, 532 nm, 35 amazon.com50 mWSmall focusing and 10 amazon.comcollimating lensesTransmission 0.4 rainbowsymphonystore.comgratingCardboard/glue/ 5boxes, etc.
Total 50.5 + cell-phone
DATA AVAILABILITY
The data that support the findings of this study are availablewithin the article.
REFERENCES1H. Zhu and A. Ozcan, “Wide-field fluorescent microscopy and fluorescentimaging flow cytometry on a cell-phone,” J. Visualized Exp. 174, e50451 (2013).2N. A. Switz, M. V. D’Ambrosio, and D. A. Fletcher, “Low-cost mobile phonemicroscopy with a reversed mobile phone camera lens,” PLoS One 9(5), e95330(2014).3C. W. Pirnstill and G. L. Coté, “Malaria diagnosis using a mobile phone polarizedmicroscope,” Sci. Rep. 5(1), 13368 (2015).4R. Li, U. Goswami, M. Walck, K. Khan, J. Chen, T. C. Cesario, and P. M.Rentzepis, “Hand-held synchronous scan spectrometer for in situ and immediatedetection of live/dead bacteria ratio,” Rev. Sci. Instrum. 88(11), 114301 (2017).5R. Li, U. Goswami, M. King, J. Chen, T. C. Cesario, and P. M. Rentzepis, “In situdetection of live-to-dead bacteria ratio after inactivation by means of synchronousfluorescence and PCA,” Proc. Natl. Acad. Sci. U. S. A. 115(4), 668–673 (2018).6D. Dhankhar, R. Li, A. Nagpal, J. Chen, A. Krishnamoorthi, and P. M. Rentzepis,“A novel approach for remote detection of bacteria using simple charge-coupleddevice cameras and telescope,” Rev. Sci. Instrum. 91(7), 074106 (2020).7C. J. Strachan, T. Rades, K. C. Gordon, and J. Rantanen, “Raman spectroscopyfor quantitative analysis of pharmaceutical solids,” J. Pharm. Pharmacol. 59(2),179–192 (2007).8A. Heinz, M. Savolainen, T. Rades, and C. J. Strachan, “Quantifying ternary mix-tures of different solid-state forms of indomethacin by Raman and near-infraredspectroscopy,” Eur. J. Pharm. Sci. 32(3), 182–192 (2007).9L. Saerens, L. Dierickx, B. Lenain, C. Vervaet, J. P. Remon, and T. D. Beer,“Raman spectroscopy for the in-line polymer–drug quantification and solid statecharacterization during a pharmaceutical hot-melt extrusion process,” Eur. J.Pharm. Biopharm. 77(1), 158–163 (2011).10W. Gong, R. Shi, M. Chen, J. Qin, and X. Liu, “Quantification and moni-toring the heat-induced formation of trans fatty acids in edible oils by Ramanspectroscopy,” J. Food Measurement and Characterization. 13, 2203–2210 (2019).11A. Picard, I. Daniel, G. Montagnac, and P. Oger, “In situ monitoring by quanti-tative Raman spectroscopy of alcoholic fermentation by Saccharomyces cerevisiaeunder high pressure,” Extremophiles 11(3), 445–452 (2007).
12C. M. McGoverin, A. S. S. Clark, S. E. Holroyd, and K. C. Gordon, “Ramanspectroscopic prediction of the solid fat content of New Zealand anhydrous milkfat,” Anal. Methods 1(1), 29–38 (2009).13U. P. Agarwal, R. S. Reiner, and S. A. Ralph, “Cellulose I crystallinity deter-mination using FT–Raman spectroscopy: Univariate and multivariate methods,”Cellulose 17(4), 721–733 (2010).14S. Mahapatra, Y. Ning, J. F. Schultz, L. Li, J.-L. Zhang, and N. Jiang, “Angstromscale chemical analysis of metal supported trans- and cis-regioisomers by ultrahighvacuum tip-enhanced Raman mapping,” Nano Lett. 19(5), 3267–3272 (2019).15G. F. Bailey and R. J. Horvat, “Raman spectroscopic analysis of the cis/transisomer composition of edible vegetable oils,” J. Am. Oil Chem. Soc. 49(8), 494–498(1972).16G. L. Johnson, R. M. Machado, K. G. Freidl, M. L. Achenbach, P. J. Clark, andS. K. Reidy, “Evaluation of Raman spectroscopy for determining cis and trans iso-mers in partially hydrogenated soybean oil,” Org. Process Res. Dev. 6(5), 637–644(2002).17V. S. Tiwari, R. R. Kalluru, F. Y. Yueh, J. P. Singh, W. S. Cyr, and S. K. Khijwania,“Fiber optic Raman sensor to monitor the concentration ratio of nitrogen andoxygen in a cryogenic mixture,” Appl. Opt. 46(16), 3345–3351 (2007).18L. Harper, J. Powell, and E. M. Pijl, “An overview of forensic drug testingmethods and their suitability for harm reduction point-of-care services,” HarmReduct. J. 14(1), 52 (2017).19K. Dégardin, A. Guillemain, and Y. Roggo, “Comprehensive study of a hand-held Raman spectrometer for the analysis of counterfeits of solid-dosage formmedicines,” J. Spectrosc. 2017, 3154035.20P. C. Kumar and J. A. Wehrmeyer, “Stack gas pollutant detection using laserRaman spectroscopy,” Appl. Spectrosc. 51(6), 849–855 (1997).21T. T. X. Ong, E. W. Blanch, and O. A. H. Jones, “Surface enhanced Ramanspectroscopy in environmental analysis, monitoring and assessment,” Sci. TotalEnviron. 720, 137601 (2020).22K. A. Britton, R. A. Dalterio, W. H. Nelson, D. Britt, and J. F. Sperry, “Ultravioletresonance Raman spectra of Escherichia Coli with 222.5–251.0 nm pulsed laserexcitation,” Appl. Spectrosc. 42(5), 782–788 (1988).23C. R. Johnson, M. Ludwig, S. O’Donnell, and S. A. Asher, “UV resonance Ramanspectroscopy of the aromatic amino acids and myoglobin,” J. Am. Chem. Soc.106(17), 5008–5010 (1984).24Y. C. Cao, R. Jin, and C. A. Mirkin, “Nanoparticles with Raman spectroscopicfingerprints for DNA and RNA detection,” Science 297(5586), 1536–1540 (2002).25J. M. Benevides, S. A. Overman, and G. J. Thomas, Jr., “Raman, polarizedRaman and ultraviolet resonance Raman spectroscopy of nucleic acids and theircomplexes,” J. Raman Spectrosc. 36(4), 279–299 (2005).26B. Lorenz, C. Wichmann, S. Stöckel, P. Rösch, and J. Popp, “Cultivation-free Raman spectroscopic investigations of bacteria,” Trends Microbiol. 25(5),413–424 (2017).27R. Li, D. Dhankhar, J. Chen, A. Krishnamoorthi, T. C. Cesario, and P. M.Rentzepis, “Identification of live and dead bacteria: A Raman spectroscopic study,”IEEE Access 7, 23549–23559 (2019).28A. Arbildo L., E. H. Montoya R., and O. R. Baltuano E., “A homemade costeffective Raman spectrometer with high performance,” J. Lab. Chem. Educ. 3(4),67–75 (2015).29W. R. C. Somerville, E. C. Le Ru, P. T. Northcote, and P. G. Etchegoin, “Highperformance Raman spectroscopy with simple optical components,” Am. J. Phys.78(7), 671–677 (2010).30C. Mohr, C. L. Spencer, and M. Hippler, “Inexpensive Raman spectrometer forundergraduate and graduate experiments and research,” J. Chem. Educ. 87(3),326–330 (2010).31D. P. Strommen and K. Nakamoto, “Resonance Raman spectroscopy,” J. Chem.Educ. 54(8), 474 (1977).
Rev. Sci. Instrum. 92, 054101 (2021); doi: 10.1063/5.0046281 92, 054101-8
Published under license by AIP Publishing