Embed Size (px)
Citation preview

INSTITUTE OF PHYSICS PUBLISHING PHYSICS IN MEDICINE AND BIOLOGY
Phys. Med. Biol. 51 (2006) 6141–6156 doi:10.1088/0031-9155/51/23/014
Cell model for efficient simulation of wavepropagation in human ventricular tissue undernormal and pathological conditions
K H W J Ten Tusscher and A V Panfilov
Department of Theoretical Biology, Utrecht University, Padualaan 8, 3584 CH Utrecht,The Netherlands
E-mail: [email protected]
Received 12 July 2006, in final form 22 October 2006Published 9 November 2006Online at stacks.iop.org/PMB/51/6141
AbstractIn this paper, we formulate a model for human ventricular cells that is efficientenough for whole organ arrhythmia simulations yet detailed enough to capturethe effects of cell level processes such as current blocks and channelopathies.The model is obtained from our detailed human ventricular cell model by usingmathematical techniques to reduce the number of variables from 19 to nine.We carefully compare our full and reduced model at the single cell, cable and2D tissue level and show that the reduced model has a very similar behaviour.Importantly, the new model correctly produces the effects of current blocksand channelopathies on AP and spiral wave behaviour, processes at the core ofcurrent day arrhythmia research. The new model is well over four times moreefficient than the full model. We conclude that the new model can be usedfor efficient simulations of the effects of current changes on arrhythmias in thehuman heart.
1. Introduction
Sudden cardiac death is a major cause of death in the industrialized western world. In amajority of the cases sudden cardiac death is caused by the occurrence of a cardiac arrhythmiacalled ventricular fibrillation. Despite the fact that cardiac arrhythmias have been studied forover half a century, the precise mechanisms causing and sustaining fibrillation are still poorlyunderstood.
Mathematical models and computer simulations play an increasingly important role incardiac arrhythmia research. Major advantages of computer simulations are the ability to studywave propagation in the 3D cardiac wall, which is currently still impossible in experiments,and the ability to bridge the gap between changes in ionic currents and ion channel mutationsat a sub-cellular and cellular level and arrhythmias that occur at the whole organ level. A
0031-9155/06/236141+16$30.00 © 2006 IOP Publishing Ltd Printed in the UK 6141

6142 K H W J Ten Tusscher and A V Panfilov
further important application of modelling is studying arrhythmias in the human heart, giventhe limited possibilities for experimental and clinical research on human hearts.
To be able to study human whole heart arrhythmia dynamics and how these are linkedto (sub)cellular processes such as ion channel mutations, a human cardiac cell model thatis both detailed and computationally efficient is needed. Second generation ionic models(Luo and Rudy 1994, Noble et al 1998, Winslow et al 1999, Rice et al 1999, Iyer et al2004) contain a lot of electrophysiological detail, but are computationally very expensive,whereas phenomenological models such as FitzHugh–Nagumo like models (FitzHugh 1960,1961, Nagumo et al 1962, Aliev and Panfilov 1996) and the Fenton–Karma model (Fentonand Karma 1998) are computationally very efficient, but lack electrophysiological detail. Wetherefore need a model of an intermediate type.
Bernus et al (2002) constructed a relatively simple ionic model for human ventricular cellsbased on the second generation Priebe–Beuckelmann ionic model (Priebe and Beuckelmann1998). The disadvantage of this intermediate-type model is that the Priebe–Beuckelmannmodel itself is based on only a limited amount of at that time available human cardiac celldata. Therefore, the main aim of this paper is to formulate a new intermediate-type modelfor human ventricular cells. In the first part of our paper we derive this new model from ourrecently published detailed human ventricular cell model (Ten Tusscher and Panfilov 2006,Ten Tusscher et al 2004), using a similar approach as followed in Bernus et al (2002).
The second part of our paper consists of a careful comparison of the behaviour of ourreduced and full model in single cell, cable and two-dimensional settings to validate that bothmodels behave in the same manner. We show that our reduced model has a similar actionpotential shape, duration and restitution, can reproduce different cell types, can reproduce theconsequences of IKs and IKr current block and can reproduce the effects of genetic mutationssuch as the LQT-3 and Brugada syndrome. We demonstrate that our reduced model has similarconduction velocity restitution and has similar spiral wave dynamics and stability as our fullmodel.
Finally, we demonstrate that our reduced model is well over four times more efficientthan our full human ventricular cell model. This speedup can be crucial for making ionicwhole organ simulations achievable without the use of supercomputers or very large clusters.Without the speedup, performing whole organ simulations within a reasonable run time wouldrequire the use of around 100 parallel processors. With the speedup, reasonable run times canbe achieved using affordable 10–20 processor parallel clusters.
2. Materials and methods
2.1. Model development
2.1.1. Intracellular sodium and potassium concentrations. Similar to the approach followedin Bernus et al (2002) we treat intracellular sodium and potassium concentrations as constant-valued model parameters rather than variables. The rationale behind this approach is thatintracellular sodium and potassium concentrations hardly change over the duration of a fewaction potentials. Significant changes in sodium and potassium concentrations, such as occurunder conditions of ischaemia or hyperkalaemia, occur over timescales of several minutes(Boyett and Fedida 1988). Such timescales are far beyond the timescales that are currentlycomputed in whole heart arrhythmia simulations.
2.1.2. Intracellular calcium concentrations and calcium release. Intracellular calciumconcentrations change significantly during each action potential. These dynamics are essential

Efficient human ventricular cell model 6143
for cardiac contraction and feed back on cardiac excitation by influencing ionic currents suchas the L-type calcium channel and the sodium calcium exchanger. The influence of calciumdynamics on cardiac excitation is of particular importance when studying conditions suchas calcium overload, spontaneous calcium release and calcium-induced alternans. However,when not studying these particular conditions, AP morphology, duration, restitution andpropagation can very well be reproduced using a model that does not incorporate calciumhandling (Bernus et al 2002). We therefore decided to remove intracellular calcium dynamicsfrom our model, and treat calcium as a constant-valued parameter.
Now we can also remove the subspace calcium inactivation gate (fcass) and the Cass
dependent driving force from our L-type calcium current description. This results in an L-type calcium current description with only voltage dependent gates, similar to ICaL in Bernuset al (2002), Luo and Rudy (1991), Zhang et al (2000). To compensate for the absence of fcass
and obtain similar inactivation dynamics for ICaL in the reduced and full model we adjustedthe time dynamics of the fast voltage inactivation gate (f2). The new equations for ICaL are:
ICaL = GCaLdff2(V − 60) (1)
f2∞ = 0.67
1 + e(V +35)/7+ 0.33 (2)
αf 2 = 600 e− (V +27)2
170 (3)
βf 2 = 7.75
1 + e(25−V )/10(4)
γf 2 = 16
1 + e(V +30)/10(5)
τf 2 = αf 2 + βf 2 + γf 2. (6)
Removing intracellular calcium dynamics significantly increases the computationalefficiency of our model, as it reduces the number of variables by five (Cass, Cai, CaSR, R,fcass) and the number of equations by 25 (intracellular calcium fluxes, buffering and reversalpotentials).
2.1.3. Simplifying ionic currents. To further reduce the number of variables, we use quasi-steady-state approximations for some of the fast changing current gating variables, similar tothe approach followed in Bernus et al (2002). Fast changing gates in our model are: the mgate of INa, the r gate of Ito, the xr2 gate of IKr and the d gate of ICaL.
For Ito, IKr and ICaL using a steady-state approximation for the r, xr1 and d gates can bedone without significant changes of the AP or conduction properties of the model. However,using a quasi-steady-state approximation for the INa m gate has significant consequences foraction potential upstroke velocity, conduction velocity and conduction velocity restitution.Therefore, we decided to keep the INa m gate as a model variable.
The new equations for Ito, IKr and ICaL become
Ito = Gtor∞(V )s(V − EK) (7)
IKr = GKrxr1xr2∞(V )(V − EK) (8)
ICaL = GCaLd∞(V )ff2(V − 60). (9)
This further reduces our model with three variables. In total we removed ten variables,leaving nine variables in our reduced model.
6144 K H W J Ten Tusscher and A V Panfilov
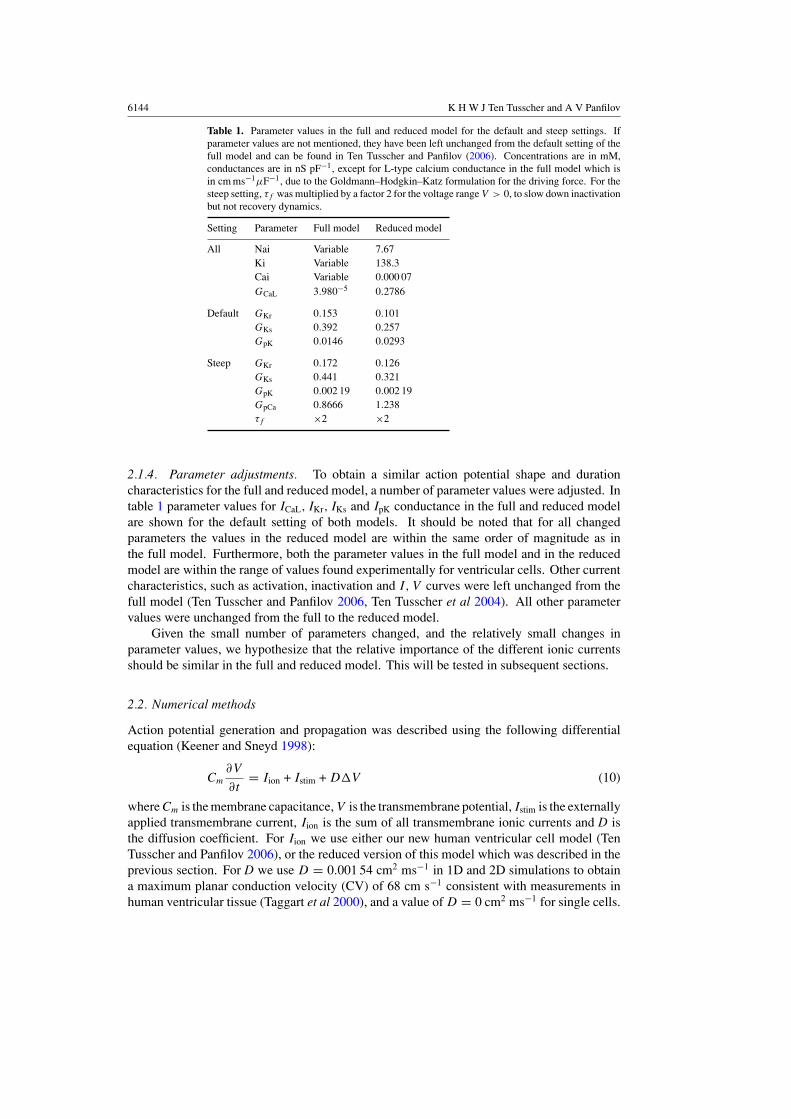
Table 1. Parameter values in the full and reduced model for the default and steep settings. Ifparameter values are not mentioned, they have been left unchanged from the default setting of thefull model and can be found in Ten Tusscher and Panfilov (2006). Concentrations are in mM,conductances are in nS pF−1, except for L-type calcium conductance in the full model which isin cm ms−1µF−1, due to the Goldmann–Hodgkin–Katz formulation for the driving force. For thesteep setting, τf was multiplied by a factor 2 for the voltage range V > 0, to slow down inactivationbut not recovery dynamics.
Setting Parameter Full model Reduced model
All Nai Variable 7.67Ki Variable 138.3Cai Variable 0.000 07GCaL 3.980−5 0.2786
Default GKr 0.153 0.101GKs 0.392 0.257GpK 0.0146 0.0293
Steep GKr 0.172 0.126GKs 0.441 0.321GpK 0.002 19 0.002 19GpCa 0.8666 1.238τf ×2 ×2
2.1.4. Parameter adjustments. To obtain a similar action potential shape and durationcharacteristics for the full and reduced model, a number of parameter values were adjusted. Intable 1 parameter values for ICaL, IKr, IKs and IpK conductance in the full and reduced modelare shown for the default setting of both models. It should be noted that for all changedparameters the values in the reduced model are within the same order of magnitude as inthe full model. Furthermore, both the parameter values in the full model and in the reducedmodel are within the range of values found experimentally for ventricular cells. Other currentcharacteristics, such as activation, inactivation and I, V curves were left unchanged from thefull model (Ten Tusscher and Panfilov 2006, Ten Tusscher et al 2004). All other parametervalues were unchanged from the full to the reduced model.
Given the small number of parameters changed, and the relatively small changes inparameter values, we hypothesize that the relative importance of the different ionic currentsshould be similar in the full and reduced model. This will be tested in subsequent sections.
2.2. Numerical methods
Action potential generation and propagation was described using the following differentialequation (Keener and Sneyd 1998):
Cm
∂V
∂t= Iion + Istim + D�V (10)
where Cm is the membrane capacitance, V is the transmembrane potential, Istim is the externallyapplied transmembrane current, Iion is the sum of all transmembrane ionic currents and D isthe diffusion coefficient. For Iion we use either our new human ventricular cell model (TenTusscher and Panfilov 2006), or the reduced version of this model which was described in theprevious section. For D we use D = 0.001 54 cm2 ms−1 in 1D and 2D simulations to obtaina maximum planar conduction velocity (CV) of 68 cm s−1 consistent with measurements inhuman ventricular tissue (Taggart et al 2000), and a value of D = 0 cm2 ms−1 for single cells.

Efficient human ventricular cell model 6145
Table 2. Dependence of conduction velocity (CV) and action potential duration (APD) on timestep (�t) of integration for a space step �x = 0.025 mm.
Model �t (ms) CV (cm s−1) APD (ms)
Full 0.04 66.2 3100.02 68.7 3100.01 70.0 3100.005 70.7 310
Reduced 0.04 63.0 3140.02 65.0 3120.01 66.1 3120.005 66.7 313
Table 3. Dependence of conduction velocity (CV) and action potential duration (APD) on spacestep (�x) of integration for a time step �t = 0.02 ms.
Model �x (mm) CV (cm s−1) APD (ms)
Full 0.040 63.0 3100.025 68.7 3100.015 72.6 310
Reduced 0.040 58.9 3120.025 65.0 3120.015 69.2 313
Physical units used in our model are as follows, time (t) in milliseconds, voltage (V )
in millivolts, current densities (IX) in picoamperes per picofarad and ionic concentrations(Xi,Xo) in millimoles per litre.
For single cell simulations, forward Euler integration with a time step of �t = 0.02 mswas used to integrate equation (10) . For 1D and 2D computations, the forward Euler methodwas used to integrate equation (10) with a space step of �x = 0.25 mm and a time step of�t = 0.02 ms. In all cases the Rush and Larsen integration scheme (Rush and Larsen 1978)was used to integrate the Hodgkin–Huxley-type equations for the gating variables.
We test the accuracy of our numerical simulations in a cable of cells by varying the timeand space step of integration (tables 2 and 3). We see similar results for the full and reducedmodel. From table 2 we can see that for a space step of �x = 0.25 mm decreasing �t from0.02 ms to 0.005 ms leads to a 2–3% increase in CV and a 0–0.3% increase in action potentialduration (APD). From table 3 we can see that for a time step of �t = 0.02 ms decreasing�x from 0.025 mm to 0.015 mm leads to a ∼6% increase in CV and a 0–0.3% increase inAPD. These changes are similar to those reported for other models (see, for example, Quet al (1999)). Throughout the rest of this paper we use a time step of �t = 0.02 ms and aspace step of �x = 0.2 mm, similar to values used in other studies (Qu et al 1999, Cao et al1999, Xie et al 2001, Bernus et al 2002).
In single cells, we use the dynamic protocol to determine action potential durationrestitution. We apply a series of 50 stimuli at a specified BCL, following which cyclelength is decreased. The APD restitution curve is obtained by plotting the final APD for eachBCL against the final DI. In cables, we apply the dynamic restitution protocol to determineconduction velocity (CV) restitution. We do so by pacing one end of the 800 cells long cableat a certain BCL until a steady state APD and CV are reached, after which the cycle length isdecreased.

6146 K H W J Ten Tusscher and A V Panfilov
0 200 400 600time (ms)
-90
-60
-30
0
30V
(m
V)
full modelreduced model
(A)200 200.5 201 201.5 202
time (ms)
-300
-200
-100
0
I (p
A/p
F)
(B)0 200 400 600
time (ms)
-12
-9
-6
-3
0
I (p
A/p
F)
(C)
90 100 110 120 130time (ms)
0
5
10
15
20
25
30
35
I (p
A/p
F)
(D)0 200 400 600
time (ms)
0
0.2
0.4
0.6
0.8I
(pA
/pF
)
(E)0 200 400 600
time (ms)
0
0.2
0.4
0.6
0.8
1
I (p
A/p
F)
(F)
Figure 1. Steady state 1 Hz action potential and major ionic currents of the full and reducedmodel. (A) Action potential. (B) Fast sodium current. Note the difference in time scale relative tothe other figures. (C) L-type calcium current. (D) Transient outward current. Note the differencein time scale relative to the other figures. (E) Rapid delayed rectifier potassium current. (F) Slowdelayed rectifier potassium current.
We use two-dimensional tissue sheets of 1000 × 1000 cells (space step �x = 0.25 mm).In 2D spiral waves are generated by first applying an S1 stimulus producing a planar wavefrontpropagating in one direction, then, when the refractory tail of this wave crosses the middleof the medium, an S2 stimulus is applied generating a second wavefront perpendicular to thefirst. This produces a wavefront with a free end around which it curls, forming a spiral wave.Stimulus currents lasted for 2 (S1) and 5 (S2) ms and were twice the diastolic threshold. Phasesingularities (PS), the points around which spiral waves rotate, are detected by intersecting anisopotential line (−60 mV) and the dV/dt = 0 line (Fenton and Karma 1998).
Simulations were coded in C++ and run on a single processor of a Dell 650 PrecisionWorkstation (dual Intel xeon 2.66 GHz).
3. Results
3.1. Normal electrophysiological properties
3.1.1. Action potential and ionic currents. In figure 1 we show a steady state (epicardial)AP and the major ionic currents contributing to this action potential at 1 Hz pacing for ourfull and reduced model. In figure 1(A) we can see that AP shape is almost identical in thefull and reduced model. The resting potential is −85.6 mV in the full and −86.0 mV in thereduced model, V̇max = 292 V s−1 in the full and V̇max = 297 V s−1 in the reduced model.Amplitude and shape of the fast sodium current are similar for the full and reduced model(figure 1(B)). In figure 1(C) we can see that the dynamics of ICaL in the full and reduced modelare qualitatively similar: both show a first phase of fast activation and fast partial inactivation

Efficient human ventricular cell model 6147
0 200 400 600time (ms)
-90
-60
-30
0
30V
(m
V)
full modelreduced model
Epi
(A)0 200 400 600
time (ms)
-90
-60
-30
0
30
V (
mV
)
Endo
(B)0 200 400 600
time (ms)
-90
-60
-30
0
30
V (
mV
)
M cell
(C)
Figure 2. Steady state 1 Hz action potential morphology for epicardial (A), endocardial (B) andM cells (C) in the full and reduced model. See the text for details on the differences in parametersettings between the cell types.
and a second phase of slower inactivation. However, there are some quantitative differences:in the full model the calcium current inactivates to a relatively constant plateau level until finalinactivation, whereas in the reduced model the calcium current gradually decreases during theAP plateau phase.
Ito shape and duration are also somewhat different in the full and reduced model(figure 1(D)). However, the integral of the Ito current in the two models is very similar,resulting in a similar effect of Ito current on AP shape. In figure 1(E) we see a qualitativelysimilar shape of IKr current, except for the initial peak. This peak is absent in the reducedmodel due to the instantaneous rather than time dependent inactivation of IKr (xr2∞), as is thecase in most models (Zeng et al 1995, Priebe and Beuckelmann 1998, Courtemanche et al1998, Iyer et al 2004). In addition the IKr current in the reduced model has a slightly smalleramplitude as in the full model. In figure 1(F) we can see that the IKs current has a similarshape and slightly smaller amplitude as in the full model. The smaller IKr and IKs currentamplitudes are due to a smaller conductance in the reduced model (see table 1), which werenecessary to obtain the same APD as in the full model.
3.1.2. Three different cell types. Using both the full and the reduced model we are able tosimulate the three different cell types found across the ventricular wall (Drouin et al 1995,Li et al 1998). Figure 2 shows steady state epicardial (A), endocardial (B) and M cell (C)action potentials for the full and reduced model for a BCL of 1000 ms. Epicardial cells aresimulated by using the standard parameter setting of our full (Ten Tusscher and Panfilov 2006)and reduced (table 1) model. Endocardial cells differ from epicardial cells in their 75% lowerIto density, and in their slower recovery from inactivation of the Ito current (Ten Tusscher et al2004), leading to a virtual absence of the AP notch. These differences are based on data from(Nabauer et al 1996, Wettwer et al 1994). In our model M cells differ from epicardial cellsonly in having a 75% lower IKs density (Pereon et al 2000), leading to a longer AP duration,similar to our approach in (Ten Tusscher et al 2004).
We can see that epicardial, endocardial and M cell action potentials are very similar bothin duration and morphology in the full compared to the reduced model.
3.1.3. APD and CV restitution. The APD and CV restitution curves describe how actionpotential duration and action potential propagation speed change as a function of the durationof the diastolic interval between the current and preceding action potential. It has been

6148 K H W J Ten Tusscher and A V Panfilov
0 100 200 300 400 500DI (ms)
150
200
250
300
APD
(m
s)
(A)0 100 200 300 400
DI (ms)
300
400
500
600
700
CV
(cm
s-1
)
(B)
Figure 3. Restitution properties of the full and reduced model. (A) Dynamic action potentialduration restitution. (B) Conduction velocity restitution.
extensively demonstrated (Panfilov and Holden 1990, Karma 1993, Karma 1994, Qu et al1999, Cao et al 1999, Cherry and Fenton 2004, Ten Tusscher and Panfilov 2006) that actionpotential duration and conduction velocity restitution properties are of critical importancefor determining what kind of reentrant arrhythmia will occur, i.e. whether stable spiral waverotation or spiral breakup will occur. Therefore, our reduced model should have realistic APDand CV restitution properties.
In figure 3(A) we can see that the full and reduced model have very similar dynamic APDrestitution properties. Note that the restitution properties of our full model have been fittedto reproduce recently measured human restitution curves (Nash et al 2006, Ten Tusscher andPanfilov 2006). In figure 3(B) we can see that the full and reduced model have a qualitativelysimilar, gradually declining CV restitution curve. Quantitatively, CV in the full model startsdecreasing for slightly longer DIs than in the reduced model, resulting in somewhat lowerconduction velocities for the shortest DIs. However, these small differences turn out not tohave a significant effect on spiral wave dynamics and stability (see figure 7).
3.2. Effect of current blocks and channelopathies
3.2.1. IKs, IKr, Ito and ICaL block. The main aim of this study was to develop a modelthat is computationally efficient yet maintains a lot of detailed characteristics for the majorionic currents. Here we check whether our reduced model produces the correct responses toIKr, IKs, Ito and ICaL current block.
Figure 4 shows a normal AP, and APs when IKr or IKs current is fully blocked. We cansee that both blocks result in an increase of APD. Normal APD is 315 ms, APD under IKr
block is 355 ms, an increase of 40 ms or 12.7%, similar to experiments reporting an increaseof 6% (88 ms) (Li et al 1996) and 11% (47 ms) (Iost et al 1998) upon full IKr block. APDunder IKs block is 467 ms, an increase of 152 ms or 48.3%, similar to experiments reportingan APD prolongation of approximately 40% (140 ms) upon full IKs block (Bosch et al 1998).These results are also very similar to results for the first version of our full human ventricularcell model (Ten Tusscher et al 2004, TenTusscher and Panfilov 2004).
Figure 5 shows a normal AP, an AP when Ito current is fully blocked, and an AP whenICaL current is fully blocked in both the full (figure 5(A)) and reduced (figure 5(B)) model. Asexpected we see that block of Ito results in the absence of the epicardial AP notch, and thatblock of ICaL results in a significant shortening of APD. Ito and ICaL block have very similareffects on APD and AP shape in the reduced and full model.

Efficient human ventricular cell model 6149
0 200 400 600time (ms)
-90
-60
-30
0
30
V (
mV
)
normalIKr blockIKs block
Figure 4. Steady state 1 Hz action potentials in the reduced model for the normal parametersetting, for 100% IKr current block and for 100% IKs current block.
0 200 400 600time (ms)
-90
-60
-30
0
30
V (
mV
)
normalIto blockICaL block
(A)0 200 400 600
time (ms)
-90
-60
-30
0
30V
(m
V)
(B)
Figure 5. Steady state 1 Hz action potentials in the full (A) and reduced (B) model for the normalparameter setting, for 100% Ito current block and for 100% ICaL current block.
3.2.2. LQT-3 and Brugada syndrome. Here we investigate whether our reduced model canbe used to study the LQT-3 syndrome and the Brugada syndrome.
LQT-3 syndrome. LQT-3 syndrome is caused by mutations in the SCN5A gene coding for thefast sodium channel (Grant 2001, Rivolta et al 2001) that lead to a partial loss or slowing ofinactivation of the fast sodium current. We simulated a case of LQT-3 syndrome in which INa
inactivation is incomplete, by adjusting the steady-state functions of the inactivation gates hand j of INa:
h∞ wild type = j∞ wild type = 1
(1 + e(V +71.55)/7.43)2(11)
h∞ LQT-3 = j∞ LQT-3 = (1 − l)
(1 + e(V +71.55)/7.43)2+ l (12)
where the fraction describes the inactivating part of INa (100% in the wildtype (100 − 100l)%in the LQT-3 mutant), and l represents the non-inactivating part of INa responsible for INa,late.In figures 6(A) and (B) we simulated LQT-3 syndrome in M cells in both our full and reducedmodel at a BCL = 1250 or 1750 ms. We used values of l = 0.0305 for the full model andl = 0.025 for the reduced model in figure 6(A), resulting in INa,late amplitudes of 3.05% and2.5% of peak INa amplitude, respectively. In figure 6(B) we used l = 0.0315 for the fullmodel and l = 0.026 for the reduced model, resulting in INa,late amplitudes of 3.15% and2.6% of peak INa amplitude, respectively. These LQT-3 INa,late amplitudes are in the range of
6150 K H W J Ten Tusscher and A V Panfilov
0 500 1000 1500 2000 2500time (ms)
-90
-60
-30
0
30
V (
mV
)
(A)0 1000 2000 3000
time (ms)
-90
-60
-30
0
30
V (
mV
)
(B)
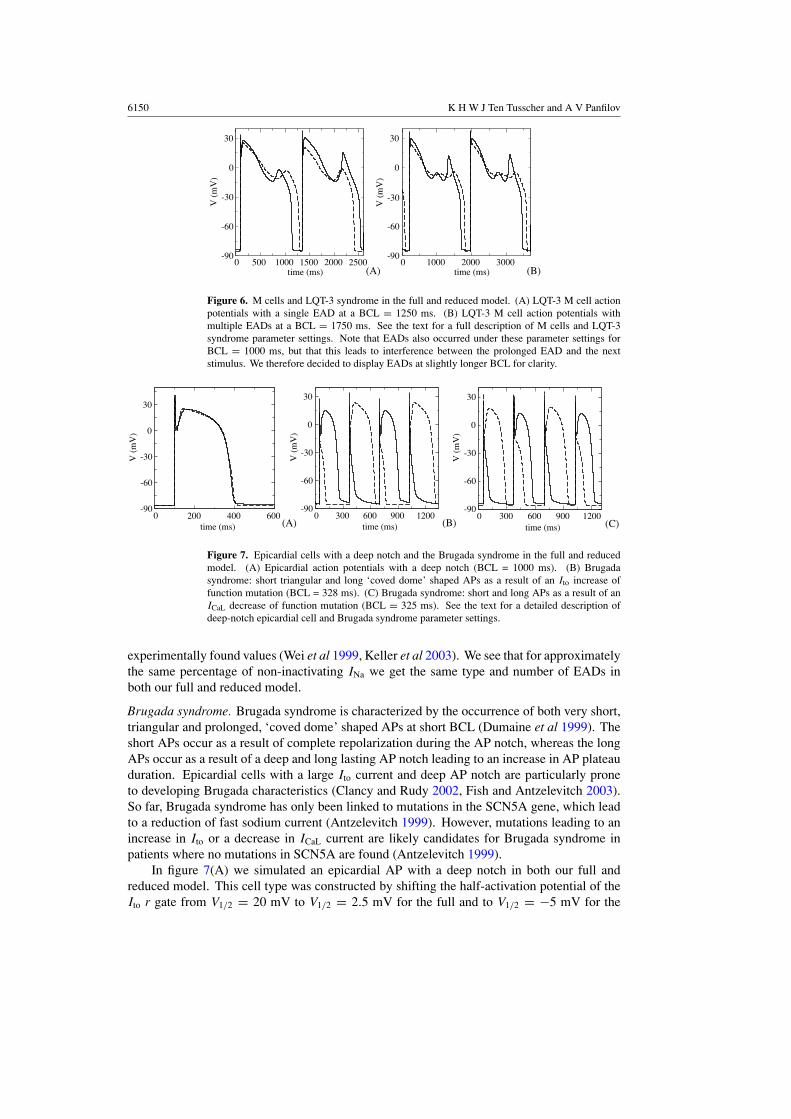
Figure 6. M cells and LQT-3 syndrome in the full and reduced model. (A) LQT-3 M cell actionpotentials with a single EAD at a BCL = 1250 ms. (B) LQT-3 M cell action potentials withmultiple EADs at a BCL = 1750 ms. See the text for a full description of M cells and LQT-3syndrome parameter settings. Note that EADs also occurred under these parameter settings forBCL = 1000 ms, but that this leads to interference between the prolonged EAD and the nextstimulus. We therefore decided to display EADs at slightly longer BCL for clarity.
0 200 400 600time (ms)
-90
-60
-30
0
30
V (
mV
)
(A)0 300 600 900 1200
time (ms)
-90
-60
-30
0
30
V (
mV
)
(B)0 300 600 900 1200
time (ms)
-90
-60
-30
0
30
V (
mV
)
(C)
Figure 7. Epicardial cells with a deep notch and the Brugada syndrome in the full and reducedmodel. (A) Epicardial action potentials with a deep notch (BCL = 1000 ms). (B) Brugadasyndrome: short triangular and long ‘coved dome’ shaped APs as a result of an Ito increase offunction mutation (BCL = 328 ms). (C) Brugada syndrome: short and long APs as a result of anICaL decrease of function mutation (BCL = 325 ms). See the text for a detailed description ofdeep-notch epicardial cell and Brugada syndrome parameter settings.
experimentally found values (Wei et al 1999, Keller et al 2003). We see that for approximatelythe same percentage of non-inactivating INa we get the same type and number of EADs inboth our full and reduced model.
Brugada syndrome. Brugada syndrome is characterized by the occurrence of both very short,triangular and prolonged, ‘coved dome’ shaped APs at short BCL (Dumaine et al 1999). Theshort APs occur as a result of complete repolarization during the AP notch, whereas the longAPs occur as a result of a deep and long lasting AP notch leading to an increase in AP plateauduration. Epicardial cells with a large Ito current and deep AP notch are particularly proneto developing Brugada characteristics (Clancy and Rudy 2002, Fish and Antzelevitch 2003).So far, Brugada syndrome has only been linked to mutations in the SCN5A gene, which leadto a reduction of fast sodium current (Antzelevitch 1999). However, mutations leading to anincrease in Ito or a decrease in ICaL current are likely candidates for Brugada syndrome inpatients where no mutations in SCN5A are found (Antzelevitch 1999).
In figure 7(A) we simulated an epicardial AP with a deep notch in both our full andreduced model. This cell type was constructed by shifting the half-activation potential of theIto r gate from V1/2 = 20 mV to V1/2 = 2.5 mV for the full and to V1/2 = −5 mV for the

Efficient human ventricular cell model 6151
(A) (B)
(C) (D)
Figure 8. Spiral wave dynamics. (A) Stable spiral wave dynamics in the full model for a settingwith an APD restitution slope slightly steeper than one. (B) Spiral breakup in the full model for asetting with an APD restitution slope considerably over one. (C) Stable spiral wave dynamics inthe reduced model for a setting with an APD restitution slope slightly over one. (D) Spiral breakupin the reduced model for a setting with a restitution slope considerably over one.
reduced model, leading to a larger amplitude and faster activation of Ito. In figure 7(B) wesimulated a hypothesized Brugada syndrome mutation leading to a gain of function in the Ito
current by increasing Gto with 27% in the full and 44% in the reduced model. In both modelswe see the interchange of short triangular APs and long ‘coved dome’ APs typical for Brugadasyndrome. In figure 6(C) we simulated a hypothesized Brugada syndrome mutation leadingto a loss of function in the ICaL current, by reducing GCaL with 35% in both the full and thereduced model. Again we see the interchange of long and short APs in both models.
3.3. 2D propagation and computational efficiency
3.3.1. Spiral wave dynamics. Figure 8 shows spiral wave dynamics for our full model (toprow) and reduced model (bottom row) for the default parameter settings of both models whichresults in an APD restitution slope slightly over one (1.1) (left column) and for an alternativesetting which results in a restitution slope considerably steeper than one (1.8) (right column).(For parameter settings see (Ten Tusscher and Panfilov 2006) and table 1.) We can see that forboth models, the default parameter setting results in stable spiral wave rotation and the steepparameter setting results in spiral breakup.
To further compare spiral wave dynamics in the full and reduced model, we determinedspiral wave meander pattern, rotation period and frequency spectrum for the stable spiralwaves shown in figures 8(A) and (B). Figures 9(A) and (B) show spiral tip meander patternsfor the full and reduced model. We see that both the shape (circular) and size of the meanderpatterns are very similar. For stable spiral wave rotation we find a period of 192 ms in the fullmodel and a period of 200 ms in the reduced model. In figure 9(C) and (D) we show frequencyspectra of electrical activity recorded in point (400, 400) during spiral wave rotation. We can

6152 K H W J Ten Tusscher and A V Panfilov
(A) (B)
0 10 20 30 40 50frequency (Hz) (C)
0 10 20 30 40 50frequency (Hz) (D)
Figure 9. Spiral wave dynamics, continued. (A) Stable spiral wave meander pattern in the fullmodel. (B) Stable spiral wave meander pattern in the reduced model. (C) Frequency spectrumof electrical activity in point (400, 400) during stable spiral wave rotation in the full model. (C)Frequency spectrum of electrical activity in point (400, 400) during stable spiral wave rotation inthe reduced model.
see that the frequency spectra in the full and reduced model look very similar. We concludethat spiral wave dynamics in the reduced model closely resemble spiral dynamics in the fullmodel.
An important question is whether our reduced model is able to reproduce the experimentalfinding that reducing ICaL flattens APD restitution and stops fibrillation (Riccio et al 1999,Koller et al 2000, Garfinkel et al 2000). To determine this we started with the steep parametersetting (figure 8(D)) and gradually decreased GCaL (figure 10(A)) and hence restitution slope(figure 10(B)). Figure 8(D) shows spiral wave dynamics 4 s after the start of the simulation,when GCaL and restitution slope are (still) at their maximal value, full blown spiral breakuphas developed and a total of 18 phase singularities (PS) are present. In figures 10(C) and (D)we show spiral wave dynamics 7 s and 9 s after the start of the simulation. At 7 s, when GCaL
has been decreased to approximately 30% of its original value, the number of spiral wavespresent is significantly reduced (4 PS). At 9 s, when GCaL has been decreased to ∼20% ofits original value, spiral breakup has stopped and a single stable spiral wave remains (1 PS).So despite the absence of intracellular calcium dynamics in our reduced model, the modelcorrectly reproduces the effect of reducing ICaL current.
3.3.2. Computational efficiency. We performed a comparison of the computer time neededto simulate 4 s of spiral wave dynamics in a 1000 × 1000 tissue sheet using either our full orreduced model (the above discussed simulations). For the full model we needed ∼7400 minand for the reduced model we needed ∼1680 min for a single 4 s simulation. Thus, using thereduced model we obtained a speedup of a factor 4.4 over the full model.
Note that the speedup is almost two times more than could be expected based on thereduction of the number of variables (19/9 = 2.1). This can be explained by the fact thatremoving all intracellular ion concentrations as variables significantly reduces the numberof equations that need to be solved for the remaining variables, since for example reversalpotentials and buffering fractions now have a constant value.

Efficient human ventricular cell model 6153
0 8 10time (ms)
0
20
40
60
80
100
120
perc
enta
ge G
CaL
(A)0 100 200 300 400 500
DI (ms)
100
150
200
250
300
AP
D (
ms)
100%60%40%30%20%
(B)
(C) (D)
2 4 6
Figure 10. Influence of GCaL on spiral breakup. (A) Percentage change in ICaL conductance overthe course of the simulation. The first 5 s GCaL is left unchanged from its original, maximal valueto allow full blown spiral breakup to develop. After that, GCaL is gradually decreased using thefunction GCaL = GCaL((1 − P) + P e(t−T0)/τ ), with P = 0.8, T0 = 5 s and τ = 1 s. (B) DynamicAPD restitution for the steep parameter setting of the reduced model (see table 1) for 100%, 60%,40%, 30% and 20% of its normal GCaL value. (C) Spiral wave dynamics 7 s after the start of thesimulation. (D) Spiral wave dynamics 9 s after the start of the simulation.
For further comparison, we determined the time needed to simulate 4 s of spiral wavedynamics using the Luo–Rudy phase one model, which was 923 min. Thus our reduced humanventricular cell model is only a factor 1.8 slower than the Luo–Rudy phase one model.
4. Discussion
In this paper, we developed a reduced, computationally efficient model for human ventricularmyocytes that retains the detailed characteristics of all major ionic currents. The model isintended for whole heart arrhythmia simulations in which the consequences of (sub)cellularprocesses such as channelopathies are investigated.
We performed a careful comparison of the behaviour of the reduced and full model insingle cell, cable and 2D tissue sheet settings. We show that our reduced model has similar AP,ionic current morphology and APD restitution as the full model. We also show that our reducedmodel is capable of correctly reproducing characteristics of different cell types, responses tocurrent blocks and behaviour in the presence of channelopathies. We demonstrate that ourreduced model has similar CV restitution, spiral wave dynamics and spiral wave stability asour full model. Furthermore, we show that our reduced model is capable of reproducing the
6154 K H W J Ten Tusscher and A V Panfilov
experimental finding that reducing ICaL current flattens restitution and reverts fibrillation totachycardia, despite the fact that the reduced model does not incorporate calcium dynamics.
The reduced model is well over four times faster than the full model and is less than afactor 2 slower than the widely used phase one Luo–Rudy model, which does not incorporatean Ito current (important for Brugada syndrome), does not have a separate description for theIKs and IKr currents (important for M cells, LQT and SQT syndrome), and is intended forsimulating guinea pig cardiac cells. A speedup of well over four makes ionic whole heartmodelling feasible with the use of small, affordable 10–20 processor parallel clusters.
4.1. Limitations
There are several limitations to the model we developed in this paper. First, because ofthe absence of sodium and potassium dynamics we cannot investigate the developmentof conditions such as ischaemia and hyperkalaemia. However, the development of theseconditions occurs over a timescale of minutes, which is too long for the whole heart arrhythmiasimulations our model is intended for. Note that using our model we can simulate the effectof a developed condition of ischaemia or hyperkalaemia by changing the parameter values ofintracellular sodium or extracellular potassium.
Second, because of the absence of intracellular calcium dynamics our model cannot beused for studying conditions such as calcium overload, spontaneous calcium release, calcium-induced alternans and the influence of calcium dynamics on wave break. Clearly, for thesetypes of research questions the full model should be used (Ten Tusscher and Panfilov 2006).
Third, using steady-state assumptions for the fast activating gates of Ito, IKr and ICaL
causes them to activate instantaneously rather than with some time-delay. This may influenceaction potential upstroke characteristics, especially under conditions of reduced fast sodiumcurrent amplitude, such as during ischaemia or acidosis, when Ito, IKr and ICaL dynamicsbecome more important.
5. Conclusion
We formulated a computationally efficient simplified version of our detailed human ventricularcell model. The reduced model retains the essential details of all major ionic currents andis therefore capable of simulating effects of (sub)cellular processes such as IKr or IKs block,LQT-3 syndrome or Brugada syndrome. Because of its computational effectiveness, the modelis very suited for studying the consequences of such conditions on whole heart arrhythmiadynamics.
Acknowledgments
This work was supported by the Netherlands Organisation for Scientific Research (NWO)through grant number 635100004 of the Research Council for Physical Sciences (EW) (K HW J ten Tusscher).
References
Aliev R R and Panfilov A V 1996 A simple two-variable model of cardiac excitation Chaos Solitons Fractals7 293–301
Antzelevitch C 1999 Ion channels and ventricular arrhythmias: cellular and ionic mechanisms underlying the Brugadasyndrome Curr. Opin. Cardiol. 14 274–9

Efficient human ventricular cell model 6155
Bernus O, Wilders R, Zemlin C W, Verschelde H and Panfilov A V 2002 A computationally efficientelectrophysiological model of human ventricular cells Am. J. Physiol. Heart Circ. Physiol. 282 H2296–308
Bosch R F, Gaspo R, Busch A E, Lang H J, Li G and Nattel S 1998 Effects of chromanol 293B, a selective blocker ofthe slow component of the delayed rectifier K+ current, on repolarization in human and guinea pig ventricularmyocytes Cardiovasc. Res. 38 441–50
Boyett M R and Fedida D 1988 A computer simulation of the effect of heart rate on ion concentrations in the heartJ. Theor. Biol. 132 15–27
Cao J, Qu Z, Kim Y, Wu T, Garfinkel A, Weiss J N, Karagueuzian H S and Chen P 1999 Spatiotemporal heterogeneityin the induction of ventricular fibrillation by rapid pacing, importance of cardiac restitution properties Circ. Res.84 1318–31
Cherry E M and Fenton F H 2004 Suppression of alternans and conduction blocks despite steep APD restitution:electrotonic, memory and conduction velocity effects Am. J. Physiol. Heart Circ. Physiol. 286 H2332–41
Clancy C E and Rudy Y 2002 Na+ channel mutation that causes both brugada and long-QT syndrome phenotypes, asimulation study of mechanism Circulation 105 1208–13
Courtemanche M, Ramirez R J and Nattel S 1998 Ionic mechanisms underlying human atrial action potentialproperties: insights from a mathematical model Am. J. Physiol. Heart Circ. Physiol. 275 H301–21
Drouin E, Charpentier F, Gauthier C, Laurent K and Le Marec H 1995 Electrophysiologic characteristics ofcells spanning the left ventricular wall of human heart: evidence for the presence of M cells J. Am. Coll.Cardiol. 26 185–92
Dumaine R, Towbin J A, Brugada P, Vatta M, Nesterenko D V, Nesterenko V V, Brugada J, Brugada R andAntzelevitch C 1999 Ionic mechanisms responsible for the electrocardiographic phenotype of the Brugadasyndrome are temperature dependent Circ. Res. 85 803–9
Fenton F and Karma A 1998 Vortex dynamics in three-dimensional continuous myocardium with fiber rotation:filament instability and fibrillation Chaos 8 20–47
Fish J M and Antzelevitch C 2003 Cellular and ionic basis for the sex-related difference in the manifestation of thebrugada syndrome and progressive conduction disease phenotypes J. Electrocardiol. 36 173–9
FitzHugh R 1960 Thresholds and plateaus in the Hodgkin–Huxley nerve equations J. Gen. Physiol. 43 867–96FitzHugh R 1961 Impulses and physiological states in theoretical models of nerve membrane Biophys. J. 1 445–66Garfinkel A, Kim Y H, Voroshilovsky O, Qu Z, Kil J R, Lee M H, Karagueuzian H S, Weiss J N and Chen P S 2000
Preventing ventricular fibrillation by flattening cardiac restitution Proc. Natl. Acad. Sci. USA 97 6061–6Grant A O 2001 Molecular biology of sodium channels and their role in cardiac arrhythmias Am. J. Med. 110 296–305Iost N, Virag L, Opincariu M, Szecsi J, Varro A and Papp J G 1998 Delayed rectifier potassium current in undiseased
human ventricular myocytes Cardiovasc. Res. 40 508–15Iyer V, Mazhari R and Winslow R L 2004 A computational model of the human left-ventricular epicardial myocyte
Biophys. J. 87 1507–25Karma A 1993 Spiral breakup in model equations of action potential propagation in cardiac tissue Phys. Rev.
Lett. 71 1103–6Karma A 1994 Electrical alternans and spiral wave breakup in cardiac tissue Chaos 4 461–72Keener J and Sneyd J 1998 Mathematical Physiology (Berlin: Springer)Keller D I, Acharfi S, Delacretaz E, Benammar N, Rotter M, Pfammatter J, Fressart V, Guicheney P and Chahine M
2003 A novel mutation in scn5a, delqko 1507-1509, causing long qt syndrome; role of q1507 residue in sodiumchannel inactivation J. Mol. Cellular Cardiol. 35 1513–21
Koller M L, Riccio M L and Gilmour R F Jr 2000 Effects of [K(+)](o) on electrical restitution and activation dynamicsduring ventricular fibrillation Am. J. Physiol. Heart Circ. Physiol. 279 H2665–72
Li G R, Feng J, Yue L and Carrier M 1998 Transmural heterogeneity of action potentials and Ito1 in myocytes isolatedfrom the human right ventricle Am. J. Physiol. Heart Circ. Physiol. 275 H369–77
Li G R, Feng J, Yue L, Carrier M and Nattel S 1996 Evidence for two components of delayed rectifier K+ current inhuman ventricular myocytes Circ. Res. 78 689–96
Luo C and Rudy Y 1991 A model of the ventricular cardiac action potential, depolarization, repolarization, and theirinteraction Circ. Res. 68 1501–26
Luo C and Rudy Y 1994 A dynamic model of the cardiac ventricular action potential I simulations of ionic currentsand concentration changes Circ. Res. 74 1071–96
Nabauer M, Beuckelmann D J, Uberfuhr P and Steinbeck G 1996 Regional differences in current density and rate-dependent properties of the transient outward current in subepicardial and subendocardial myocytes of humanleft ventricle Circulation 93 168–77
Nagumo J S, Arimoto S and Yoshizawa S 1962 An active pulse transmission line simulating nerve axon Proc. IRE 502061–71

6156 K H W J Ten Tusscher and A V Panfilov
Nash M P, Bradley C P, Sutton P M, Clayton R H, Kallis P, Hayward M, Paterson D J and Taggart P 2006 Wholeheart APD restitution properties in cardiac patients: a combined clinical and modeling study Exp. Physiol. 91339–54
Noble D, Varghese A, Kohl P and Noble P 1998 Improved guinea-pig ventricular cell model incorporating a diadicspace, IKr and IKs, and length- and tension-dependent processes Can. J. Cardiol. 14 123–34
Panfilov A V and Holden A V 1990 Self-generation of turbulent vortices in a two-dimensional model of cardiac tissuePhys. Lett. A 147 463–6
Pereon Y, Demolombe S, Baro I, Drouin E, Charpentier F and Escande D 2000 Differential expression of KvLQT1isoforms across the human ventricular wall Am. J. Physiol. Heart Circ. Physiol. 278 H1908–15
Priebe L and Beuckelmann D J 1998 Simulation study of cellular electric properties in heart failure Circ. Res. 821206–23
Qu Z, Weiss J N and Garfinkel A 1999 Cardiac electrical restitution properties and stability of reentrant spiral waves:a simulation study Am. J. Physiol. Heart Circ. Physiol 276 H269–83
Riccio M L, Koller M L and Gilmour R F Jr 1999 Electrical restitution and spatiotemporal organization duringventricular fibrillation Circ. Res. 84 955–63
Rice J J, Jafri M S and Winslow R L 1999 Modeling gain and gradedness of Ca2+ release in the functional unit of thecardiac diadic space Biophys. J. 77 1871–84
Rivolta I, Abriel H, Tateyama M, Liu H, Memmi M, Vardas P, Napolitano C, Priori S G and Kass R S 2001 Inheritedbrugada and long QT-3 syndrome. Mutations of a single residue of the cardiac sodium channel confer distinctchannel and clinical phenotypes J. Biol. Chem. 276 30623–30
Rush S and Larsen H 1978 A practical algorithm for solving dynamic membrane equations IEEE Trans. Biomed.Eng. 25 389–92
Taggart P, Sutton P M I, Opthof T, Coronel R, Trimlett R, Pugsley W and Kallis P 2000 Inhomogeneous transmuralconduction during early ischemia in patients with coronary artery disease J. Mol. Cell. Cardiol. 32 621–39
Ten Tusscher K H W J, Noble D, Noble P J and Panfilov A V 2004 A model for human ventricular tissue Am. J.Physiol. Heart Circ. Physiol. 286 H1573–89
TenTusscher K H W J and Panfilov A V 2004 Eikonal formulation of the minimal principle for scroll wave filamentsPhys. Rev. Lett. 93 108106-1–108106-4
Ten Tusscher K H W J and Panfilov A V 2006 Alternans and spiral breakup in a human ventricular tissue model Am.J. Physiol. Heart Circ. Physiol. 291 H1088–100
Wei J, Wang D W, Alings M, Fish F, Wathen M, Roden D M and George A L 1999 Congenital long-qt syndromecaused by a novel mutation in a conserved acidic domain of the cardiac na+ channel Circulation 99 3165–71
Wettwer E, Amos G J, Posival H and Ravens U 1994 Transient outward current in human ventricular myocytes ofsubepicardial and subendocardial origin Circ. Res. 75 473–82
Winslow R L, Rice J, Jafri S, Marban E and O’Rourke B 1999 Mechanisms of altered excitation-contraction couplingin canine tachycardia-induced heart failure, II Model studies Circ. Res. 84 571–86
Xie F, Qu Z, Garfinkel A and Weiss J N 2001 Effects of simulated ischemia on spiral wave stability Am. J. Physiol.Heart Circ. Physiol. 280 H1667–73
Zeng J, Laurita K R, Rosenbaum D S and Rudy Y 1995 Two components of the delayed rectifier K+ current inventricular myocytes of the guinea pig type. Theoretical formulation and their role in repolarization Circ. Res.77 140–52
Zhang H, Holden A V, Kodama I, Honjo H, Lei M, Varghese T and Boyett M R 2000 Mathematical models of actionpotentials in the periphery and center of the rabbit sinoatrial node Am. J. Physiol. Heart Circ. Physiol. 279H397–421