Embed Size (px)
Citation preview
Cell Compliance
______
Cytoskeletal Origin and Importance for
Cellular Function.
Franziska Lautenschläger
Clare College
University of Cambridge
A DISSERTATION SUBMITTED FOR THE DEGREE OF DOCTOR OF PHILOSOPHY AT THE UNIVERSITY OF CAMBRIDGE 2011.

________________________________________________________________________
ii

________________________________________________________________________
Declaration
I hereby declare that my thesis entitled ‘Cell Compliance - Cytoskeletal Origin and
Importance for Cellular Function.’ is the result of my own work and includes nothing
which is the outcome of work done in collaboration or which has been submitted for a
previous degree except when specifically indicated in the text.
This thesis does not exceed the word limit of 60 000 words.
------------------------ ---------------------------
Date Signature
iii

________________________________________________________________________
iv
________________________________________________________________________
Abstract PhD – Thesis of Franziska Lautenschläger
Title: Cell Compliance – Cytoskeletal Origin and Importance for
Cellular Function. Mechanical properties of cells, mainly defined by their cytoskeleton, are closely related
to cell function and can be measured with a dual-beam laser trap (optical stretcher).
Functional changes, which go hand in hand with changes of the cytoskeleton, also occur
during differentiation of stem cells. This suggests monitoring differentiation by the
changing compliance of the cells. During the course of my PhD I measured the
compliance of three different types of stem cells before and after differentiation and was
able to detect differences in some of the cell types. In order to relate rheological
experiments to cell migration as a further example of functional change I investigated the
migration behavior of cells that showed different compliance and found differences in
migration. I was additionally able to show an altered migration behavior after I actively
changed the mechanical behavior of one cell type using cytoskeletal drugs. These
migration experiments have been carried out in 2D and 3D migration assays.
Furthermore, the influence of the stiffness of the surrounding material on the migration
behavior has been investigated. After relating functional changes to changes in
compliance, I studied which mechanisms can be used to actually influence cell
compliance and investigated the effect of cytoskeletal stabilizers or destabilizers as well
as drugs acting on molecular motors. The effect of the surrounding temperature has been
considered as well. Finally, I developed a new version of the optical stretcher
measurement tool, which enables cell sorting and drug screening using a monolithic glass
chip. With the results presented in this thesis I relate mechanical compliance to the
cytoskeleton and specific cellular functions. I deliver insights how mechanical changes in
cells can be used to identify and follow functional changes and how this knowledge can
help to interfere with such functions, specifically in pathologies correlated to these
functions. My modified optical stretcher would be developed to screen the effects of
drugs on cell compliance and to sort cells with different mechanical properties. Such drug
screening and cell sorting will offer diagnostic treatment options for various pathologies.
v

________________________________________________________________________
vi
Acknowledgements
Acknowledgements
There are many people out there I really want to thank deeply for their support during my
PhD. The most important one is beyond doubt my supervisor Jochen Guck. As we say in
German, he was my ‘doctoral father’; he pushed me to trust myself and my science and to
bring experiments that little bit further where I would have already given up. He gave me
the freedom to try out own ideas and had always an open door when I needed to talk. I
cannot think of any better supervisor during this time.
I also want to thank Michael Beil, who was always interested in any projects I was
working on and who supported me mentally or by providing experiments in his lab in
Ulm. I also want to thank Stephan Paschke and Elke-Wolf-Hieber who mostly carried out
those experiments in Ulm.
A huge thanks goes to Kevin Chalut, who showed me how nice it is to really work as a
team and to Kristian Franze, who was the man to ask thousands questions concerning
biology and biophysics. Graeme Whyte deserves a big thank you for taking over many of
my started but unfinished projects, including good and rather difficult bits. He also
supported me in many ways in the difficult moments of writing up this thesis. Over the
past three years, all three of them became friends I can totally trust scientifically and
personally.
I want to thank my collaborators: Krystyn Van Vliet and John Maloney for the work we
did together on MSCs and the different approaches they had to OS experiments. Further
thanks go to Phil Jones and Esther Choolun for their help with the keratinocytes, and
Anna Melidoni, who thaught me ES-cell culture and differentiation during hours we
spend together in various labs around Cambridge on many Sunday afternoons.
Lars Boyde and Ulysse Delabre spend precious time explaining me theoretical issues
without complaining which I am most grateful for. Moritz Kreysing was a constant
companion during my PhD and we shared time and knowledge during many scientific
events, conferences, talks and summer schools. Pouria Moshayedi shared not only his
knowledge about hydrogels with me but also insights in another culture and many
discussions about controversial movies.

Acknowledgements ________________________________________________________________________
viii
My thanks go further to Joakim DaSilva with whom I worked on three dimensional
migration scaffolds and Jakob Mauritz, who used the OS in order to measure malaria
infected RBCs. Ian Russell helped me with temperature and blebbistatin experiments
during his part III project and Estella Martin-Badosa assisted in the optimisation of the
monolithic glass chip.
I further want to thank the other members and visitors of the optical stretcher group
namely Andrew Ekpenyong, Markus Hoepfler, Danielle Kaminski, Thorsten Kolb and
Kasper Feld as well as not yet mentioned members of the Guck lab to make it such a
friendly place to work. Naturally, my thanks goes also to the sector of BSS and its staff,
namely Suresh Mistry, Pete Bone, Owen Dunn, Tracy Inman and Stefani Gerber for their
endless support in administrative questions. My thanks for funding goes to the
Cambridge Gates Trust.
Franziska Wetzel, Markus Hoepfler, and Graeme Whyte excelled in speed proof reading
of my thesis and I also have to thank Diana Vaida and Dino Ott to take care of me in
form of delicious food during my writing-up time.
I want to thank my parents, sister and grandparents for their constant support during my
whole life and their deep believe in my capabilities, as well as helping me be to the
person I am today.
Finally, I thank you, Andi, for this faith you have in my person and my abilities and to
make me believe in them, too. Thanks for tolerating me, making me laugh, loving me.
Table of contents Acknowledgements ......................................................................................................... vii List of Figures .................................................................................................................. 11 List of Tables ................................................................................................................... 14 List of Publications ......................................................................................................... 15 1. Introduction ............................................................................................................. 17 2. Background ............................................................................................................. 23 2.1 Cytoskeleton and Cell Mechanics ...................................................................... 23
2.1.1 Components of the Cytoskeleton ...................................................................... 26 2.1.2 Controlling the Components of the Cytoskeleton ............................................. 30 2.1.3 Mechanical Properties of the Cytoskeletal Network ........................................ 32 2.1.4 Further Characterization of the Cytoskeleton ................................................... 33 2.1.5 Measuring Mechanical Properties of Cells ....................................................... 37
2.2 The Optical Stretcher ......................................................................................... 43 2.2.1 Models to Understand Cellular Deformation in a Dual-Beam Laser Trap ....... 47 2.2.2 Ray Optics Calculation of Optical Stress .......................................................... 48 2.2.3 Solutions to Maxwell’s Equations .................................................................... 54 2.2.4 Extraction of Mechanical Properties ................................................................. 57 2.2.5 Summary: Theoretical Models to Describe Dual-Beam Laser Traps ............... 61 2.2.6 The Optical Stretcher – Set-Up ......................................................................... 62
2.3 AFM ..................................................................................................................... 70 3. The Influence of Cell Differentiation on Cell Compliance .................................. 73 3.1 Differentiation of Neutrophil Precursor Cells. ................................................. 76
3.1.1 Experimental details.......................................................................................... 77 3.1.2 Results ............................................................................................................... 78 3.1.3 Discussion ......................................................................................................... 81
3.2 Differentiation of Mesenchymal Stem Cells. .................................................... 83 3.2.1 Experimental details.......................................................................................... 84 3.2.2 Results ............................................................................................................... 85 3.2.3 Discussion ......................................................................................................... 87
3.3 Differentiation of Embryonic Stem Cells .......................................................... 89 3.3.1 Experimental details.......................................................................................... 92 3.3.2 Results ............................................................................................................... 96 3.3.3 Discussion ....................................................................................................... 101
3.4 Summary Influence of Cell Differentiation on Cell Compliance .................. 103 4. Cell Mechanics and Migration ............................................................................. 105 4.1 Influence of Cellular Compliance on Migration ............................................ 105
4.1.1 Experimental details........................................................................................ 108 4.1.2 Results ............................................................................................................. 113 4.1.3 Discussion ....................................................................................................... 122
4.2 Influence of Mechanical Properties of the Surroundings on Migration ...... 126 4.2.1 Experimental details........................................................................................ 127 4.2.2 Results ............................................................................................................. 129 4.2.3 Discussion ....................................................................................................... 131
4.3 Summary Cell Mechanics and Migration ....................................................... 132
________________________________________________________________________ 5. Influencing the Compliance of Suspended Cells ................................................ 135 5.1 Effect of Cytoskeletal Drugs on Cell Compliance .......................................... 136
5.1.1 Experimental details........................................................................................ 138 5.1.2 Results ............................................................................................................. 140 5.1.3 Discussion ....................................................................................................... 143
5.2 Influence of Molecular Motor Drugs on Cell Compliance ............................ 150 5.2.1 Experimental details........................................................................................ 152 5.2.2 Results ............................................................................................................. 156 5.2.3 Discussion ....................................................................................................... 159
5.3 Summary Influencing the Compliance of Suspended Cells .......................... 164 6. Technical Upgrade of the Optical Stretcher: Cell Sorting ................................ 167 6.1 T-Junction Chip ................................................................................................ 168 6.2 PDMS- Chip ...................................................................................................... 170 6.3 Monolithic Glass Chip (MGC) ......................................................................... 172 7. Summary and Conclusion .................................................................................... 183 8. Bibliography .......................................................................................................... 189 Appendix ........................................................................................................................ 207
10
List of Figures ________________________________________________________________________
List of Figures Figure 2-1: Schematic of a cell and its components. ........................................................ 25 Figure 2-2: Components of the cytoskeleton in-vitro. ...................................................... 26 Figure 2-3: Schematic of the different kinds of crosslinking of actin filaments. ............. 28 Figure 2-4: Examples of actin stress fibres. ...................................................................... 28 Figure 2-5: Illustration of deformations of material resulting from different external forces and their corresponding physical description. ........................................................ 34 Figure 2-6: Schematics of models to describe behavior of material to an applied step stress .................................................................................................................................. 36 Figure 2-7: Deformation to a step stress described analytically by a three-element model........................................................................................................................................... 37 Figure 2-8: Schematic of measurement techniques that assess meachnical properties of adherent cells. ................................................................................................................... 39 Figure 2-9: Schematic of measurement techniques that assess mechanical properties of suspended cells.................................................................................................................. 41 Figure 2-10: Schematic of scattering and gradient force. ................................................. 43 Figure 2-11: Principle of an optical stretcher set-up. ........................................................ 45 Figure 2-12: Schematic of an optical stretcher. ................................................................ 46 Figure 2-13: Schematic of momentum transfer to the interface of a cubic object. ........... 49 Figure 2-14: Propagation of a light ray through a spherical object. ................................. 50 Figure 2-15: Illustration of the stress profile arising from a laser beam with Gaussian profile incident on a spherical object. ............................................................................... 50 Figure 2-16: Propagation of counter-propagating light rays through a spherical object. . 51 Figure 2-17: Radial stress profile on the surface of a spherical cell trapped in a dual-beam laser trap. ........................................................................................................................... 52 Figure 2-18: Passage of light rays with arbitrary incident angles through a spherical object. ................................................................................................................................ 53 Figure 2-19: Stress profile for a spherical object with arbitrary incident angles. ............. 54 Figure 2-20: Optically induced stress profile on spherical objects. ................................. 57 Figure 2-21: Analysis of a cell’s shape during deformation in an optical stretcher. ........ 61 Figure 2-22: Set-up of the optical stretcher.. ................................................................... 62 Figure 2-23. Schematic of synchronisation of laser and camera. ..................................... 64 Figure 2-24. Microfluidic chamber of the optical stretcher. ............................................. 65 Figure 2-25: Schematic of photolithography. ................................................................... 66 Figure 2-26: Stress profiles acting on cells inside the capillary of a microfluidic optical stretcher, depending on fibre distances.. ........................................................................... 69 Figure 2-27: Examples of fluorescence images of suspended cells inside an optical stretcher microfluidic chamber. ........................................................................................ 69 Figure 2-28: Working principle of an AFM. .................................................................... 71 Figure 2-29: Illustration of the indentation mode of an AFM. ......................................... 71 Figure 3-1: Compliance of APL cells before and after ATRA differentiation. ................ 80 Figure 3-2: Representative compliance curve of APL cells before and after ATRA treatment compared to primary neutrophils. ..................................................................... 80
11
List of Figures ________________________________________________________________________ Figure 3-3: Preliminary creep compliance measurements on hMSCs using optical stretching. .......................................................................................................................... 86 Figure 4-1: Illustration of a migration assay using a Boyden chamber. ......................... 110 Figure 4-2: Illustration of a migration assay using micro-channels in PDMS. .............. 111 Figure 4-3: Confocal images and 3D reconstruction of an inverted colloid crystal scaffold used as 3D migration assay with tuneable gel stiffness. ................................................. 113 Figure 4-4: Relating cellular compliance of undifferentiated and differentiated NB4 cells to their migration behaviour............................................................................................ 114 Figure 4-5: Creep Compliance experiment on ATRA differentiated NB4 control cells compared with paclitaxel treated cells ............................................................................ 115 Figure 4-6: Repeated compliance experiments with ATRA differentiated NB4 cells treated with paclitaxel ..................................................................................................... 116 Figure 4-7: Migration assay using Boyden chambers on ATRA differentiated NB4 cells treated with and without paclitaxel ................................................................................ 117 Figure 4-8: Migration assay using a Boyden chamber on human neutrophils with and without paclitaxel treatment ............................................................................................ 118 Figure 4-9: Migration assay using a Boyden chamber on ATRA differentiated NB4 cells treated with blebbistatin and with paclitaxel .................................................................. 118 Figure 4-10: Chemotactic migration velocity of differentiated NB4 cells with and without paclitaxel treatment ......................................................................................................... 119 Figure 4-11: The entry of cells into a pore as the rate-limiting step of migration.. ........ 120 Figure 4-12: Migration assay of ATRA differentiated NB4 cells treated with and without paclitaxel inside a straight channel. ............................................................................... 120 Figure 4-13: Histogram showing migration results of ATRA differentiated NB4 cells treated with or without paclitaxel ................................................................................... 121 Figure 4-14: Stiffness of tissue.. ..................................................................................... 127 Figure 4-15: 2D Chemokinesis migration experiments on PAA gels of 3.3kPa and 10kPa stiffness. .......................................................................................................................... 129 Figure 4-16: Migration experiments in 2D and 3D using hydrogels at two different stiffnesses (10 and 3.3 kPa). ........................................................................................... 130 Figure 4-17: Confocal images of typical cell migration in 10 kPa scaffold. .................. 130 Figure 5-1: Influence of drugs interfering with actin on the compliance of undifferentiated neutrophils and fibroblasts. .................................................................. 141 Figure 5-2: Influence of drugs interfering with MTs on the compliance of undifferentiated neutrophils and fibroblasts. ............................................................................................. 142 Figure 5-3: Schematic pathway illustrating the regulation of actomyosin contractile forces and the according steps in the pathway inhibited by the drugs used. ............................. 154 Figure 5-4: Influence of drugs interfering with molecular motor activity on the compliance of undifferentiated neutrophils. ................................................................... 157 Figure 5-5: Influence of drugs interfering with molecular motor activity on the compliance of 3T3 fibroblasts. ....................................................................................... 158 Figure 5-6: Influence of drugs influencing molecular motor activity on the compliance of embryonic stem cells. ...................................................................................................... 159 Figure 6-1: Schematic of cell sorting. ............................................................................ 168 Figure 6-2: T-junction Chip. ........................................................................................... 169 Figure 6-3: Fluid separation in the T-junction set-up. .................................................... 170
12
List of Figures ________________________________________________________________________ Figure 6-4: PDMS-Chip for sorting. ............................................................................... 171 Figure 6-5: Flow separation in PDMS chip .................................................................... 172 Figure 6-6: Test-monolithic glass chip (MGC).. ............................................................ 174 Figure 6-7: Fibre insertion difficulties with first test chips. ........................................... 175 Figure 6-8: Misalignment of the two glass halves of the test MGC. .............................. 176 Figure 6-9: Schematic of glass chip design.. .................................................................. 179 Figure 6-10: Monolithic glass chip (MGC). ................................................................... 180 Figure 6-11: FDTD simulation of the laser beam passing trhough the MGC. ............... 180 Figure 6-12: Proof of principle experiments to trap and stretch in a MGC. ................... 181
13
List of Tables ________________________________________________________________________
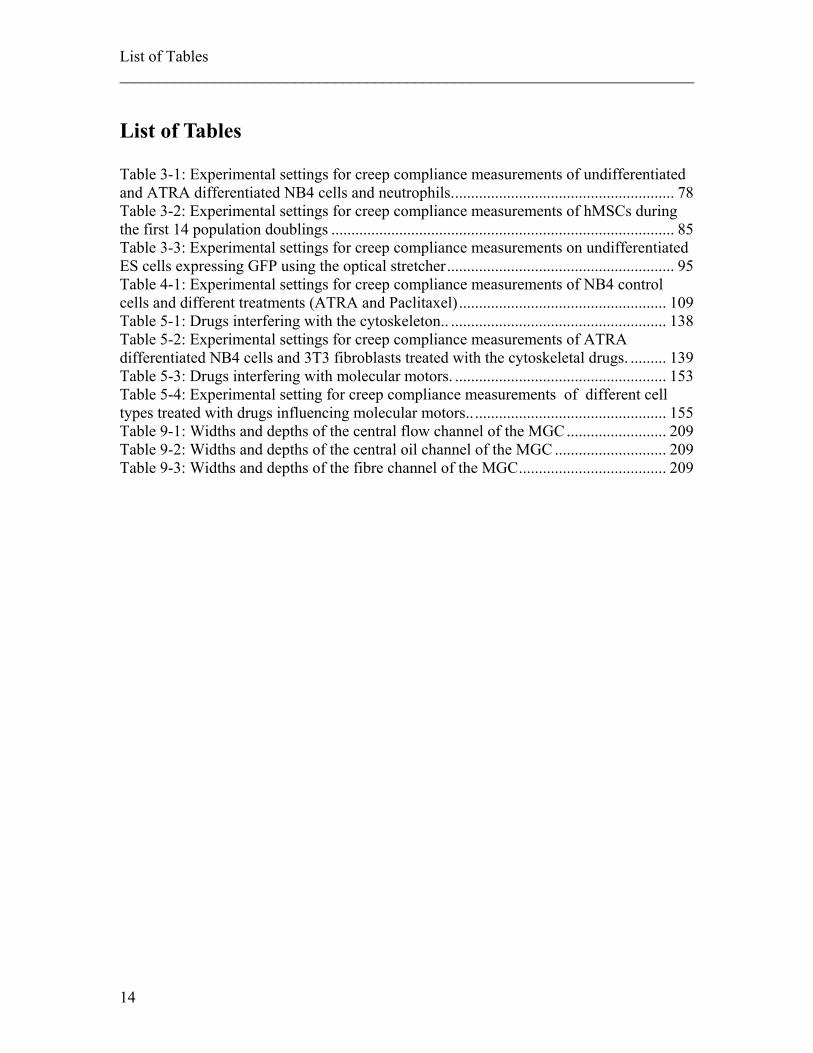
List of Tables Table 3-1: Experimental settings for creep compliance measurements of undifferentiated and ATRA differentiated NB4 cells and neutrophils. ....................................................... 78 Table 3-2: Experimental settings for creep compliance measurements of hMSCs during the first 14 population doublings ...................................................................................... 85 Table 3-3: Experimental settings for creep compliance measurements on undifferentiated ES cells expressing GFP using the optical stretcher ......................................................... 95 Table 4-1: Experimental settings for creep compliance measurements of NB4 control cells and different treatments (ATRA and Paclitaxel) .................................................... 109 Table 5-1: Drugs interfering with the cytoskeleton.. ...................................................... 138 Table 5-2: Experimental settings for creep compliance measurements of ATRA differentiated NB4 cells and 3T3 fibroblasts treated with the cytoskeletal drugs. ......... 139 Table 5-3: Drugs interfering with molecular motors. ..................................................... 153 Table 5-4: Experimental setting for creep compliance measurements of different cell types treated with drugs influencing molecular motors.. ................................................ 155 Table 9-1: Widths and depths of the central flow channel of the MGC ......................... 209 Table 9-2: Widths and depths of the central oil channel of the MGC ............................ 209 Table 9-3: Widths and depths of the fibre channel of the MGC ..................................... 209
14
List of Publications ________________________________________________________________________
15
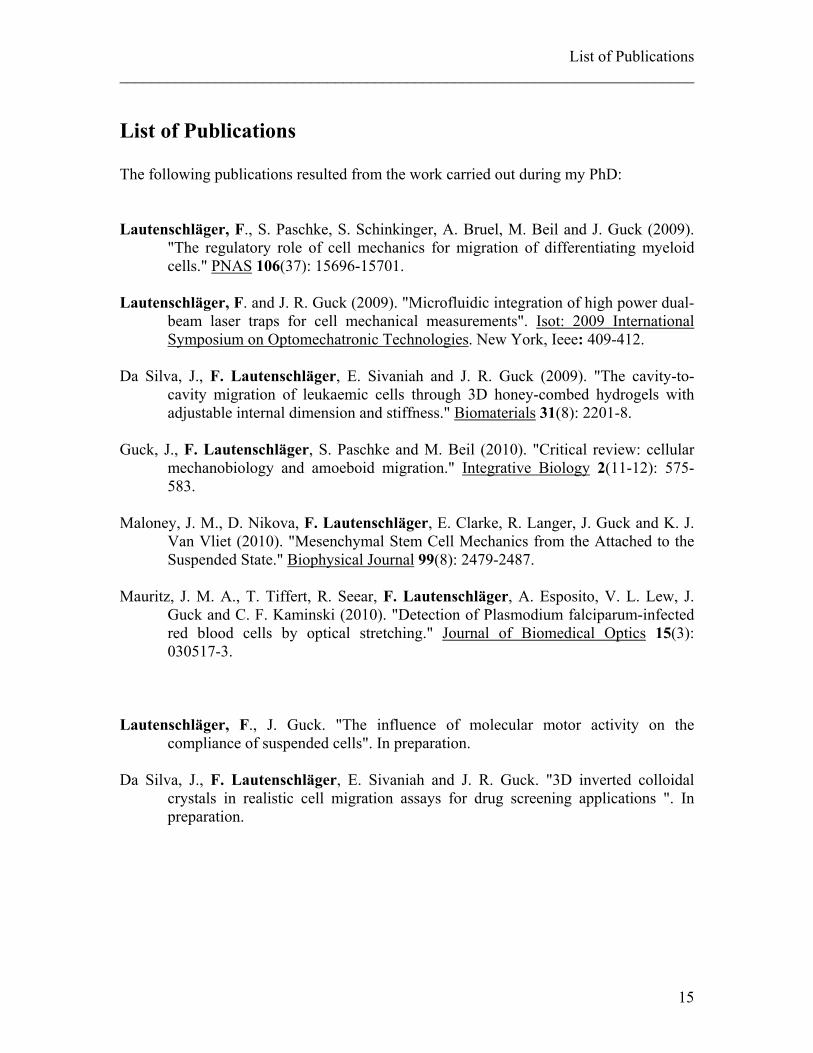
List of Publications The following publications resulted from the work carried out during my PhD: Lautenschläger, F., S. Paschke, S. Schinkinger, A. Bruel, M. Beil and J. Guck (2009).
"The regulatory role of cell mechanics for migration of differentiating myeloid cells." PNAS 106(37): 15696-15701.
Lautenschläger, F. and J. R. Guck (2009). "Microfluidic integration of high power dual-
beam laser traps for cell mechanical measurements". Isot: 2009 International Symposium on Optomechatronic Technologies. New York, Ieee: 409-412.
Da Silva, J., F. Lautenschläger, E. Sivaniah and J. R. Guck (2009). "The cavity-to-
cavity migration of leukaemic cells through 3D honey-combed hydrogels with adjustable internal dimension and stiffness." Biomaterials 31(8): 2201-8.
Guck, J., F. Lautenschläger, S. Paschke and M. Beil (2010). "Critical review: cellular
mechanobiology and amoeboid migration." Integrative Biology 2(11-12): 575-583.
Maloney, J. M., D. Nikova, F. Lautenschläger, E. Clarke, R. Langer, J. Guck and K. J.
Van Vliet (2010). "Mesenchymal Stem Cell Mechanics from the Attached to the Suspended State." Biophysical Journal 99(8): 2479-2487.
Mauritz, J. M. A., T. Tiffert, R. Seear, F. Lautenschläger, A. Esposito, V. L. Lew, J.
Guck and C. F. Kaminski (2010). "Detection of Plasmodium falciparum-infected red blood cells by optical stretching." Journal of Biomedical Optics 15(3): 030517-3.
Lautenschläger, F., J. Guck. "The influence of molecular motor activity on the
compliance of suspended cells". In preparation. Da Silva, J., F. Lautenschläger, E. Sivaniah and J. R. Guck. "3D inverted colloidal
crystals in realistic cell migration assays for drug screening applications ". In preparation.

List of Publications ________________________________________________________________________
Introduction ________________________________________________________________________
1. Introduction In 1653, an English naturalist called Robert Hook discovered small entities within a slice
of cork which he looked at under a 50 x magnification of a microscope (Hook 1665;
Inwood 2005). He described them as little boxes and gave them the name ‘cells’ after the
Latin word for ‘little rooms’ (Hook 1665). Today, about 350 years later, we still use the
word cell to describe the smallest living entity in an organism. During the centuries past,
many fascinating facts have been discovered about cells and scientists have been trying
since to understand how they work. For example, Flemming discovered how cells divide
during mitosis in 1882 (Flemming 1882), and at the beginning of the twentieth century
research on a certain ‘inheritance molecule’ was started by Frederic Griffith and
continued by Oswald Avery and Erwin Chargaff. This ‘inheritance molecule’ is now
known as DNA, carrying the genetic information of a living being. The structure of DNA
was found by Watson, Crick, Franklin and Wilkins (Franklin and Gosling 1953; Watson
and Crick 1953). Sections of DNA carrying encoding information are called genes. The
total amount of genes within a human cell were indentified in a 13 year long project (the
human genome project) completed in 2003 (Science 2001; Schmutz et al. 2004). One
would think that after so much work and time invested in one particular aspect of life we
should know how it works, how processes are driven and why. However, cells are not
just ‘one’ aspect of life but ‘the essential’ aspect of life and connected to basically every
facet of life. And even though we have gathered large amounts of important and
meaningful information about cells throughout all these years, there are still many things
left unknown, e.g. how to successfully treat and prevent diseases such as cancer or
genetic diseases
Today, a commonly used approach to study such questions is the ‘bottom up’
investigation of the role of single proteins or interactions of proteins for cellular function.
It is rather rare to investigate cellular subsystems as autonomous functioning entities but
nevertheless, it can be a justified method to add to the pool of information helping to
understand cells (Hartwell et al. 1999; Aggarwal and Lee 2003). One such cellular
subsystem is the cytoskeleton, a polymer network consisting of several networks, which
acts as a supporting scaffold inside the cell but has also many functional tasks, for
17
Introduction ________________________________________________________________________ example in force generation, migration, mitosis or the transport of organelles within the
cell (Birchmeier 1984). Much work has been done on the protein components of the
cytoskeleton in purified isolation (Janmey 1991; Bausch et al. 1998; Hinner et al. 1998;
Pollard et al. 2000; de Pablo et al. 2003). Nevertheless, such an approach neglects any
interactions between the different components of the cytoskeleton with each other and
with different components of the cell. Therefore, researchers started to investigate
cellular mechanics of whole cells, which has been shown to be an useful indicator for
cytoskeletal structure and cellular function (Elson 1988). Rheology probes cellular
mechanics with different techniques. For example AFM or bead rheology can be used to
assess local mechanical properties of adherent cells (Radmacher et al. 1992; Bausch et al.
1998; Rotsch et al. 1999; Mahaffy et al. 2004) or micropipette aspiration and microplate
manipulation assess global mechanical properties of cells (Discher et al. 1994; Thoumine
et al. 1999; Hochmuth 2000). Another technique to measure global mechanical properties
of single, suspended cells is optical stretching, a technique which does not require any
physical contact with the measured cells (Guck et al. 2001; Wottawah et al. 2005b;
Lincoln et al. 2007b; Remmerbach et al. 2009). This was the main technique used to
measure mechanical properties in this thesis. In optical stretcher experiments cells are
trapped and deformed by two counter-propagating laser beams. The laser beams exert
forces on the surface of the cell due to the momentum transfer as the light enters the cell
(Guck et al. 2001). Measuring cells in suspension without physical contact can be
advantageous compared to measurements of cells adhering to stiff substrates, such as
glass and plastic, which can add artefacts to the cell (Yeung et al. 2005). Additionally,
high throughput measurements are possible due to the implementation of a microfluidic
set-up of the optical stretcher (Maloney et al. 2010).
During the last decade, mechanical changes of cells have been used to study functional
changes. For example, stretching of cells could be used to show cancerous cells are more
compliant than normal cells (Guck et al. 2005; Remmerbach et al. 2009), that
Falsiparum-infected erythrocytes decrease in compliance (Mauritz et al. 2010), or that
chondrocytes are stiffening in osteoarthritis (Haudenschild et al. 2010). AFM
measurements were used to show the effect of aldosterone, a hormone which increases
the reabsorption of sodium ions, on the stiffness of endothelium cells (Oberleithner 2005)
18
Introduction ________________________________________________________________________
and magnetic twisting rheology to follow the stiffening of airway smooth muscle cells
after mechanical stress application (Deng et al. 2005). Another functional change which
might be reflected in mechanical properties is the differentiation of stem cells. Stem cells
are cells able to self-renew through mitosis and to differentiate into distinct cell types.
Following the differentiation of stem cells in terms of their mechanical properties is a
very young research topic. So far, there have been first studies on adherent stem cells
during differentiation using AFM (Titushkin and Cho 2007) but to my knowledge no
research has been published on the mechanics of differentiating stem cells in suspension.
Therefore, I investigated three different stem cell systems with lower and higher
differentiation potential and tried to measure their compliance before and after
differentiation using an optical stretcher.
Many functional changes which are connected to differentiation of stem cells are
associated with a change in their migration behaviour. For example, undifferentiated
blood cells are not capable of migrating towards a chemical attractant, but can do so once
differentiated (Sham et al. 1995). Another example are mouse embryonic stem cells
which start migrating during mesoderm differentiation in a process called epithelial-
mesenchymal transition (Yang and Weinberg 2008; Arnold and Robertson 2009). Hence,
I also followed the migration behaviour of cells which I found had altered mechanical
properties to see how migration and compliance of cells is linked. However, performing
migration studies in-vitro on flat hard substrates can be quite different from the real,
physiological situation in-vivo (Augello et al. 2010; Michailidou et al. 2010). Obviously,
there exists in-vivo far more factors which can play a role than we consider when
observing cells migrating on in-vitro (Tayalia et al 2010.; Da Silva et al. 2009).
Nevertheless, we can try to adapt the surrounding environment in-vitro to be as close as
possible to the physiological situation. To simulate different physiological conditions, I
also investigated the influence of the mechanical properties of the surrounding
environment on the migration behaviour of cells. I specifically studied the dimension and
the stiffness of the surroundings, e.g. flat two-dimensional surfaces versus micro-
channels or three-dimensional scaffolds.
During the first two parts of my PhD I studied the link between cellular compliance with
two different cellular functions: differentiation and migration. However, even if we gain
19
Introduction ________________________________________________________________________ the understanding that a cell changes mechanical properties in order to fulfil a specific
function, we do not yet know how cells achieve such mechanical changes. To investigate
which components of the cytoskeleton play a role in compliance, I treated cells with
cytoskeletal stabilizing and destabilizing drugs and compared their compliance with an
optical stretcher. It is not only the amount and the stability of individual filament
networks which determines the mechanics of a cell but also the connections between
them, such as crosslinkers and molecular motors. Therefore, I also studied the role of one
important type of molecular motor on the compliance of cells. In addition to having a
deeper understanding of the origin of the compliance of cells, the knowledge of the
components and their contribution to cell mechanics can enable us to control it. Linking
cellular compliance to cellular function might give the possibility to directly modify
cellular function by altering the cytoskeleton, for example one might be able to interfere
with the migration of metastatic cancer cells by stiffening their cytoskeleton using
filament stabilising drugs.
To investigate cells with a specific function, they generally need to be separated from
surrounding cells which might not have this functional characteristic but are otherwise
phenomenological similar. So far, this is mainly done by different expression levels of
surface proteins, which can be fluorescently labelled and FACS sorted. Such cell
identification is an established method which is widely used (Boeck 2001; Kornblum and
Geschwind 2001; Alison et al. 2010). However, the specific surface markers need to be
identified and the variance in expression of different markers is extremely large.
Additionally, the interference with the cell due to labelling might affect the cellular
function one wants to investigate. If it is possible to identify cells due to their mechanical
compliance, then it should also be possible to use this compliance as an inherent marker
to sort cells. Using an optical stretcher to sort cells would further add the advantage that
one can ‘scan’ the effect of different drugs on their influence on cellular mechanics. The
sorting option would enable re-culturing cells after mechanical investigation for further
evaluation, such as long-term effects of cytoskeletal drugs, proliferation rates or
differentiation potentials of stem cells. Therefore I spent the last part of my PhD in
developing a new microfluidic upgrade of the optical stretcher which allows cell sorting.
20
Introduction ________________________________________________________________________
In the course of this development I needed to optimize materials, flow designs and
microfluidic connections.
The following chapters give an overview over the background information related to the
cytoskeleton and cellular mechanics as well as details of the tool I used for most of my
measurements, the optical stretcher. After this, I present the results of compliance
measurements of stem cells during differentiation and a study where I investigated the
migration behaviour of cells that show different compliances upon differentiation. The
origin of compliance is explored in more depth in the chapter where I present data
regarding the effect of drugs against components of the cytoskeleton and of molecular
motors on the compliance of cells. In this chapter, temperature effects on the cytoskeleton
and the consequences for compliance are discussed as well. This is followed by a
technical overview about different approaches of cell sorting and the final chip design to
achieve this goal. Finally, I summarize my work and integrate my findings into the
current field of research.
21

Introduction ________________________________________________________________________
22
Background ________________________________________________________________________
2. Background 2.1 Cytoskeleton and Cell Mechanics .......................................................................... 23
2.1.1 Components of the Cytoskeleton .................................................................. 26 2.1.2 Controlling the Components of the Cytoskeleton ......................................... 30 2.1.3 Mechanical Properties of the Cytoskeletal Network .................................... 32 2.1.4 Further Characterization of the Cytoskeleton ............................................... 33 2.1.5 Measuring Mechanical Properties of Cells ................................................... 37
2.2 The Optical Stretcher ......................................................................................... 43 2.2.1 Models to Understand Cellular Deformation in a Dual-Beam Laser Trap ... 47 2.2.2 Ray Optics Calculation of Optical Stress ...................................................... 48 2.2.3 Solutions to Maxwell’s Equations ................................................................ 54 2.2.4 Extraction of Mechanical Properties ............................................................. 57 2.2.5 Summary: Theoretical Models to Describe Dual-Beam Laser Traps ........... 61 2.2.6 The Optical Stretcher – Set-Up ..................................................................... 62
2.3 AFM ..................................................................................................................... 70
In the following chapter I will give an overview about background information
concerning the cytoskeleton and cellular mechanics, which will be helpful to understand
my experiments and set the results into a scientific context. I will further explain in detail
the working principle and set-up of the main measurement tools used in my research.
2.1 Cytoskeleton and Cell Mechanics Cells are considered the smallest living entity in any organism. Although all mammalian
cells have a similar basic structure as shown in Figure 2-1, different cells can fulfil a wide
range of tasks, such as phagocytosing (e.g. macrophages), contracting (myocytes),
migrating (neutrophils) or transport, as dentritic cells which transport pathogens from the
site of infection to the lymph nodes. It is difficult to understand these differences due to
the huge complexity of cells but important when investigating normal and abnormal cell
behaviour. Since it is still not possible to understand such a highly dynamic and complex
system as a whole, one can start by investigating cell structure, cell dynamics and cellular
components on their own, exploring limited but specific interactions between them.
For experiments, the use of cell lines is common. Cell-lines consist of immortalized cells,
which facilitates cell handling and assures a good amount of cells available for
experiments. However, continuous replicating of cells is one main characteristic of
23
Background ________________________________________________________________________ cancer cells. It should be noted that cell lines do not necessarily have exactly the same
phenotype as primary cells. This should be kept in mind when considering data obtained
by studying the behaviour of cell-lines. Each time cell-lines were used in this thesis, it
was clearly marked in the appropriate section.
One structural component of the cell, called cytoskeleton (Figure 2-1 and Figure 2-2),
seems to be specifically important for cellular mechanics (Elson 1988), a topic which
gains more and more importance at the interface of biology and physics. Understanding
cellular mechanics might help to solve long standing problems in biology. Therefore, I
am focussing in this chapter on the cytoskeleton, the individual parts of the cytoskeleton,
their interplay and the possible role they have inside a cell. I will specifically focus on the
impact of the cytoskeleton on the mechanical properties of cells, which might help to
understand how forces generated inside the cell or applied from the outside of a cell are
transmitted within that cell. Force generation frequently occurs during processes such as
migration and cell division. Understanding the cytoskeleton and understanding where
cells are acting locally might help to understand the cell reaction to these forces. Such
reactions can be passive when a cell is deformed, but also active, e.g. an active shape
change or the up- or down-regulation of the production of certain proteins when signal
cascades are triggered.
24
Background ________________________________________________________________________
The cytoskeleton is a dynamic structure of polymers interlinked by a variety of cross
linkers. In almost every cell type the cytoskeleton is constantly changing which results in
a very adaptive arrangement. This ability to adapt allows the cytoskeleton to fulfil three
main tasks: the spatial distribution of the contents of the cell, the resistance and
transmission of stress by connecting to the environment, and the generation of forces
within the cell which results in cellular shape changes and migration.
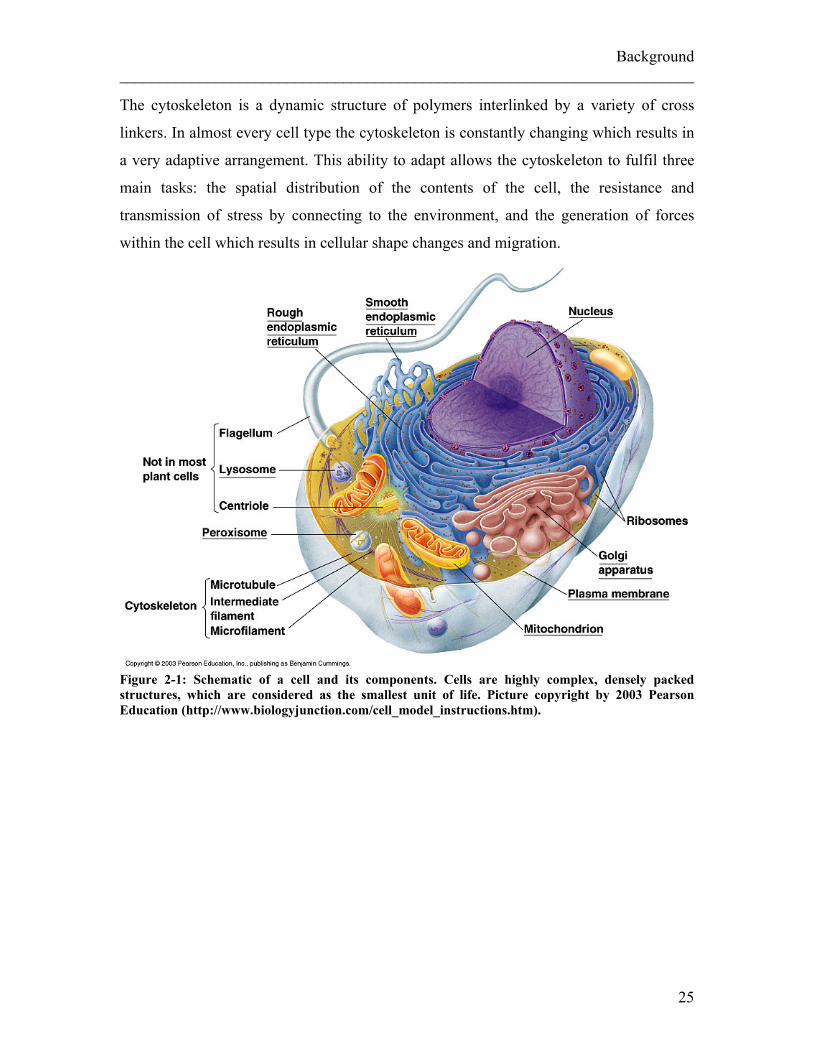
Figure 2-1: Schematic of a cell and its components. Cells are highly complex, densely packed structures, which are considered as the smallest unit of life. Picture copyright by 2003 Pearson Education (http://www.biologyjunction.com/cell_model_instructions.htm).
25
Background ________________________________________________________________________
2.1.1 Components of the Cytoskeleton The cytoskeleton consists of three main filamentous polymers, microtubules, actin, and
intermediate filaments as shown in Figure 2-2. Each of them can assemble, disassemble
and interlink between themselves and each other, and form different types of networks
with the help of regulatory and crosslinking proteins. These networks can interact with
each other and provide an even greater range of properties. The three components of the
cytoskeleton differ in their mechanical properties, their polarity, in the dynamics of
assembly and disassembly of their monomers, as well as in the type of cross linking
polymers and molecular motors binding to them.
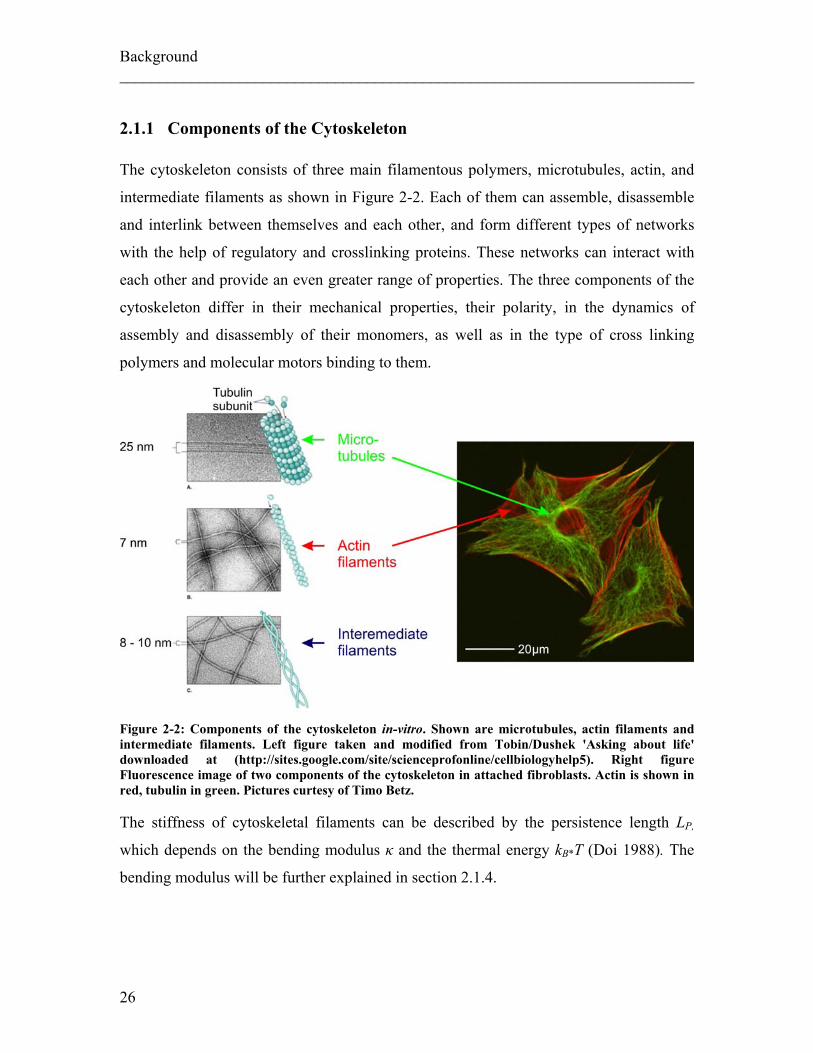
Figure 2-2: Components of the cytoskeleton in-vitro. Shown are microtubules, actin filaments and intermediate filaments. Left figure taken and modified from Tobin/Dushek 'Asking about life' downloaded at (http://sites.google.com/site/scienceprofonline/cellbiologyhelp5). Right figure Fluorescence image of two components of the cytoskeleton in attached fibroblasts. Actin is shown in red, tubulin in green. Pictures curtesy of Timo Betz. The stiffness of cytoskeletal filaments can be described by the persistence length LP,
which depends on the bending modulus κ and the thermal energy kB*T (Doi 1988). The
bending modulus will be further explained in section 2.1.4.
26
Background ________________________________________________________________________
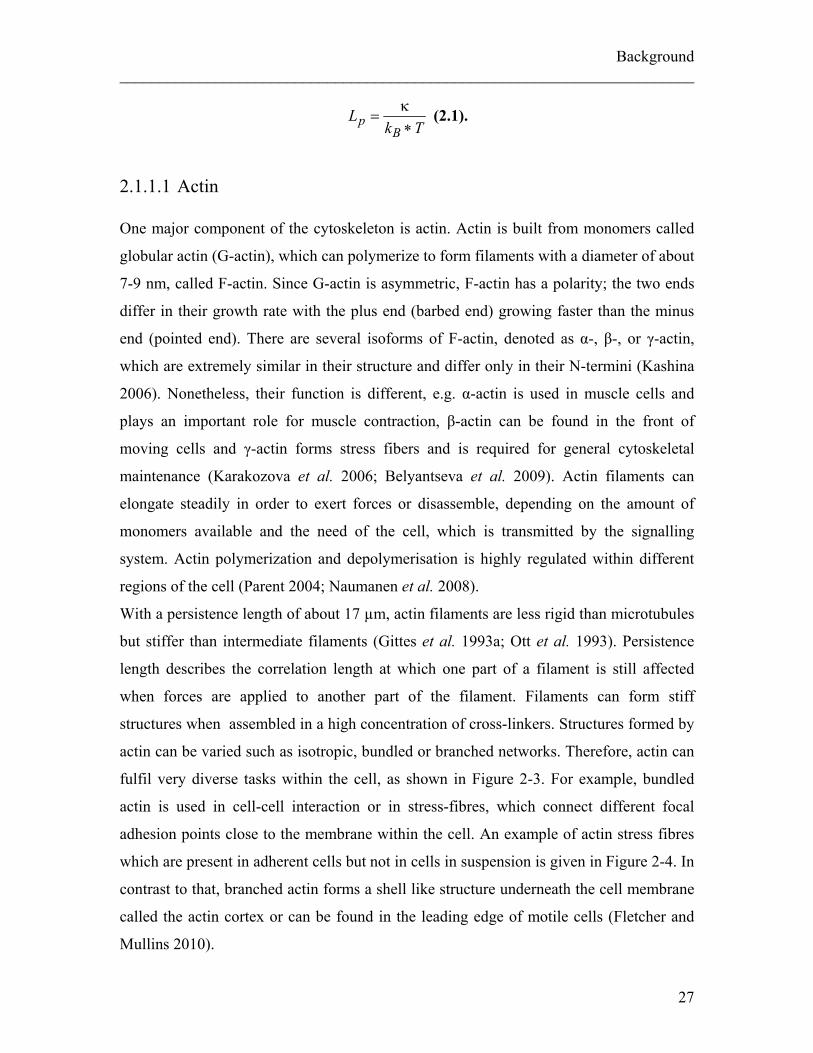
TkL
Bp ∗
κ= (2.1).
2.1.1.1 Actin One major component of the cytoskeleton is actin. Actin is built from monomers called
globular actin (G-actin), which can polymerize to form filaments with a diameter of about
7-9 nm, called F-actin. Since G-actin is asymmetric, F-actin has a polarity; the two ends
differ in their growth rate with the plus end (barbed end) growing faster than the minus
end (pointed end). There are several isoforms of F-actin, denoted as α-, β-, or γ-actin,
which are extremely similar in their structure and differ only in their N-termini (Kashina
2006). Nonetheless, their function is different, e.g. α-actin is used in muscle cells and
plays an important role for muscle contraction, β-actin can be found in the front of
moving cells and γ-actin forms stress fibers and is required for general cytoskeletal
maintenance (Karakozova et al. 2006; Belyantseva et al. 2009). Actin filaments can
elongate steadily in order to exert forces or disassemble, depending on the amount of
monomers available and the need of the cell, which is transmitted by the signalling
system. Actin polymerization and depolymerisation is highly regulated within different
regions of the cell (Parent 2004; Naumanen et al. 2008).
With a persistence length of about 17 µm, actin filaments are less rigid than microtubules
but stiffer than intermediate filaments (Gittes et al. 1993a; Ott et al. 1993). Persistence
length describes the correlation length at which one part of a filament is still affected
when forces are applied to another part of the filament. Filaments can form stiff
structures when assembled in a high concentration of cross-linkers. Structures formed by
actin can be varied such as isotropic, bundled or branched networks. Therefore, actin can
fulfil very diverse tasks within the cell, as shown in Figure 2-3. For example, bundled
actin is used in cell-cell interaction or in stress-fibres, which connect different focal
adhesion points close to the membrane within the cell. An example of actin stress fibres
which are present in adherent cells but not in cells in suspension is given in Figure 2-4. In
contrast to that, branched actin forms a shell like structure underneath the cell membrane
called the actin cortex or can be found in the leading edge of motile cells (Fletcher and
Mullins 2010).
27
Background ________________________________________________________________________
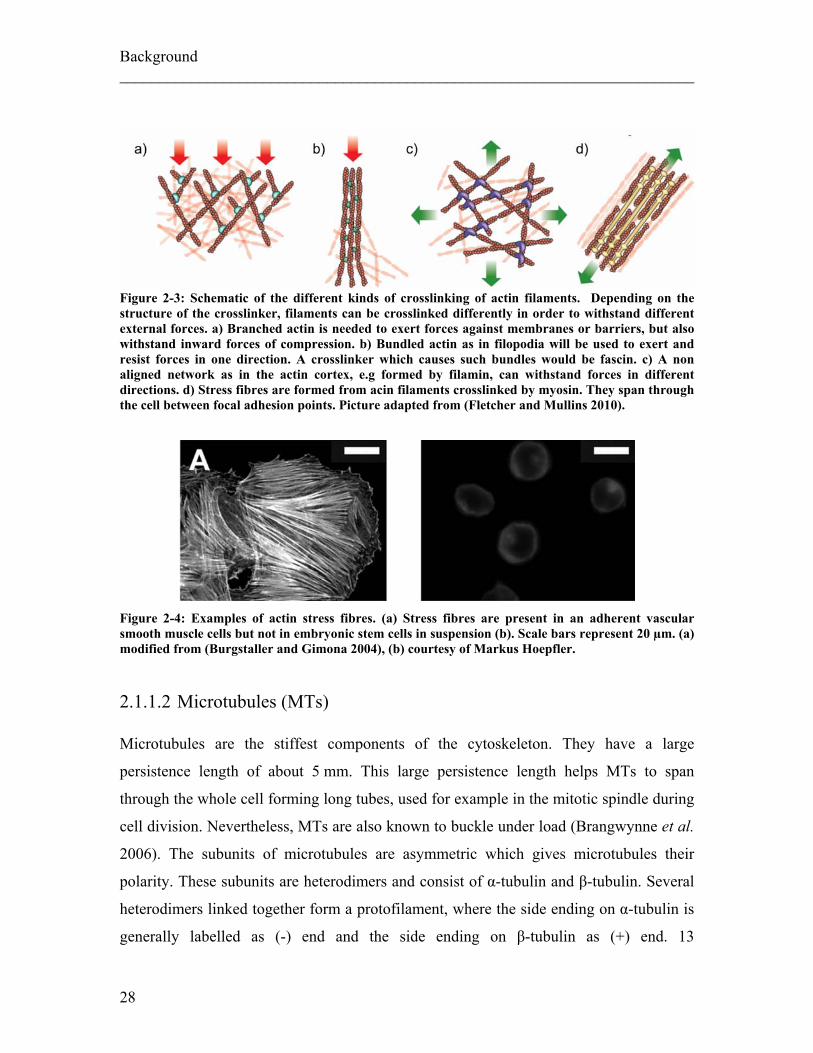
Figure 2-3: Schematic of the different kinds of crosslinking of actin filaments. Depending on the structure of the crosslinker, filaments can be crosslinked differently in order to withstand different external forces. a) Branched actin is needed to exert forces against membranes or barriers, but also withstand inward forces of compression. b) Bundled actin as in filopodia will be used to exert and resist forces in one direction. A crosslinker which causes such bundles would be fascin. c) A non aligned network as in the actin cortex, e.g formed by filamin, can withstand forces in different directions. d) Stress fibres are formed from acin filaments crosslinked by myosin. They span through the cell between focal adhesion points. Picture adapted from (Fletcher and Mullins 2010).
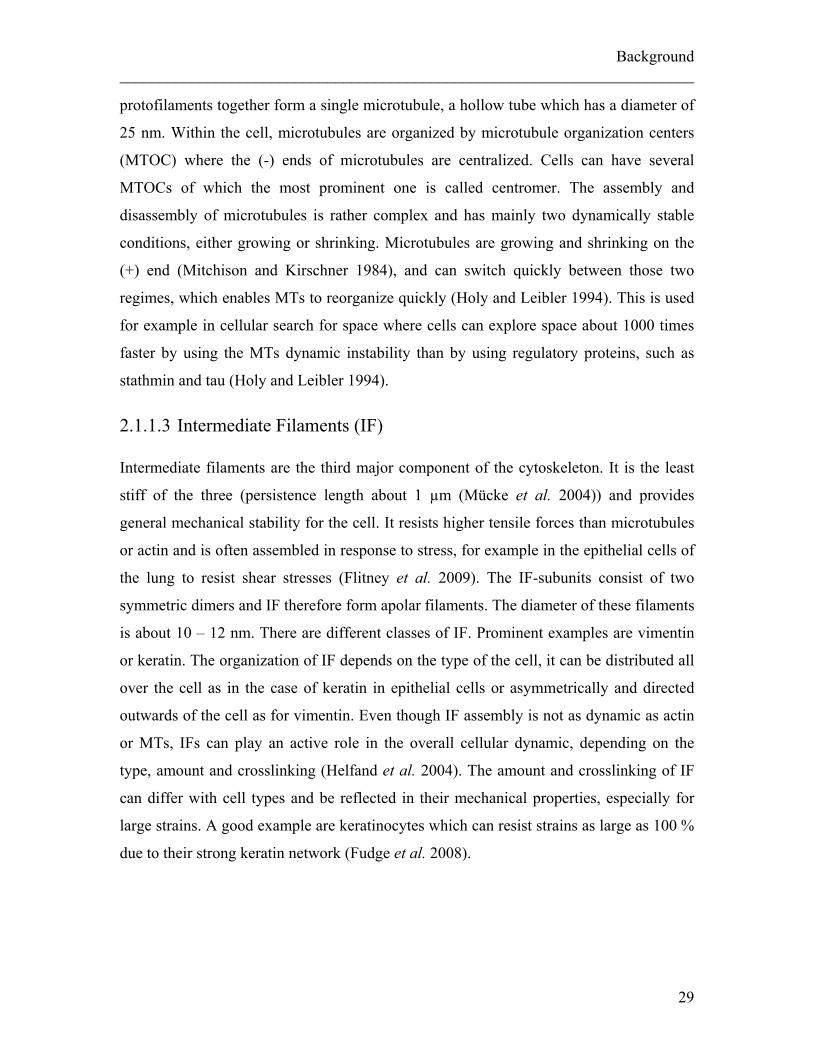
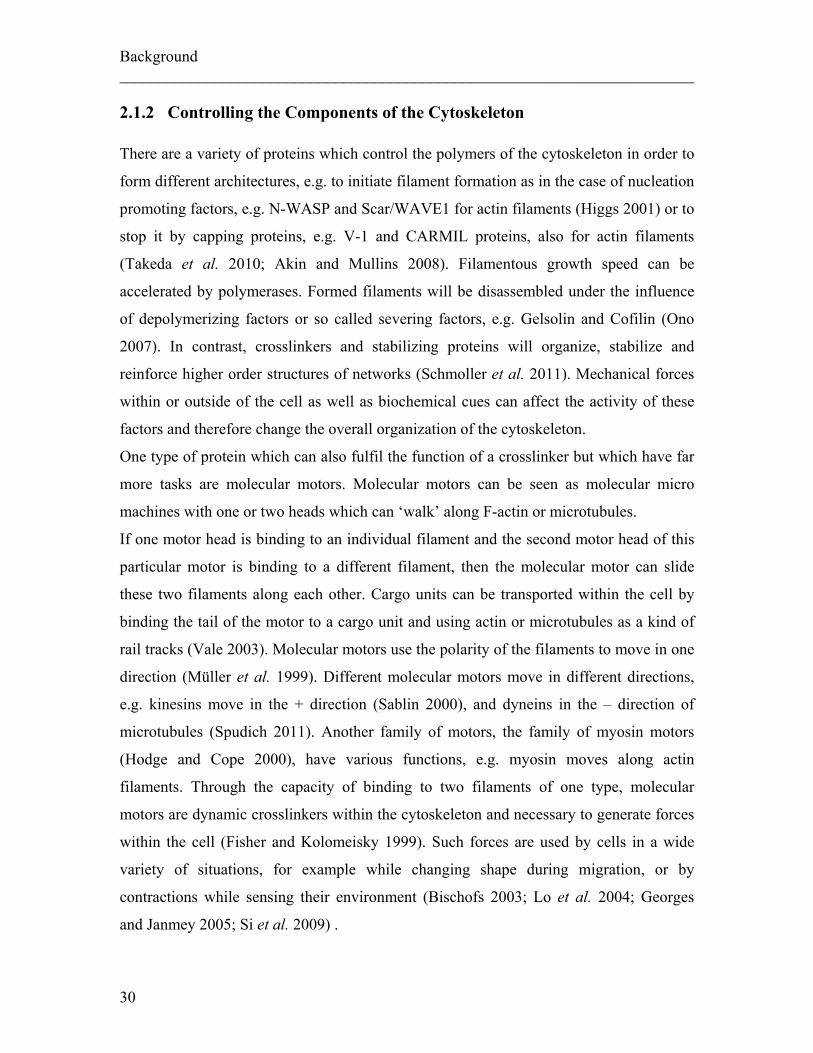
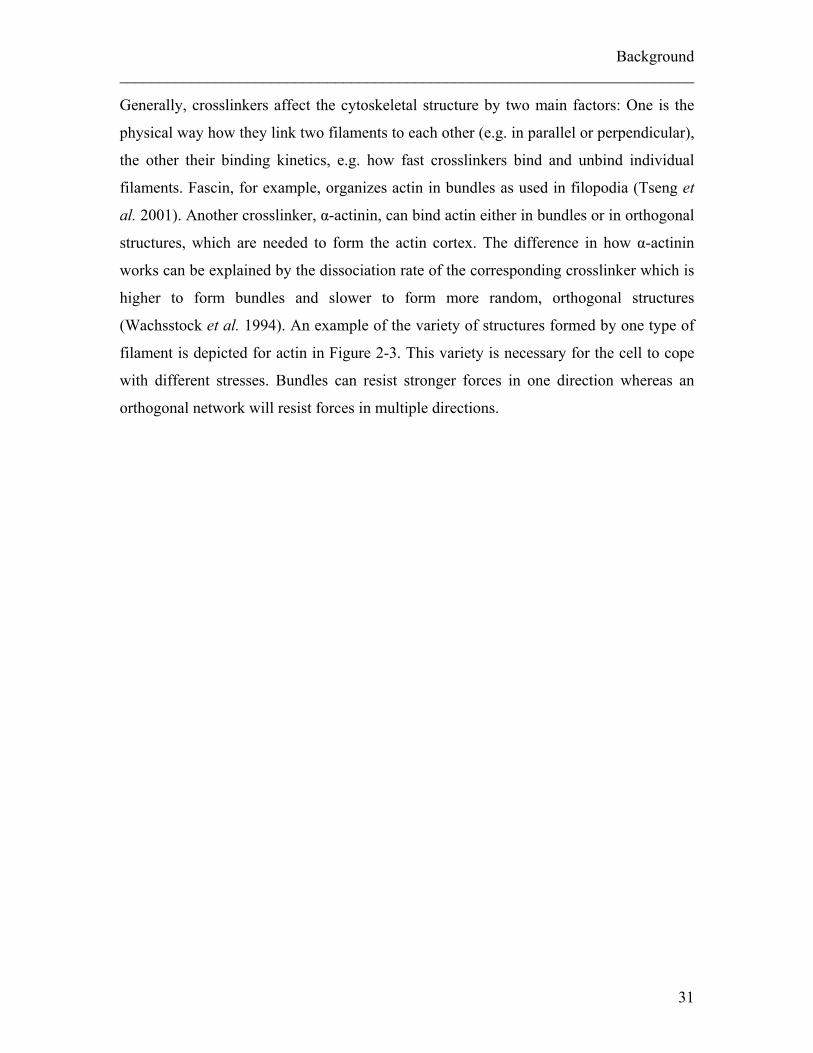
Figure 2-4: Examples of actin stress fibres. (a) Stress fibres are present in an adherent vascular smooth muscle cells but not in embryonic stem cells in suspension (b). Scale bars represent 20 µm. (a) modified from (Burgstaller and Gimona 2004), (b) courtesy of Markus Hoepfler.
2.1.1.2 Microtubules (MTs) Microtubules are the stiffest components of the cytoskeleton. They have a large
persistence length of about 5 mm. This large persistence length helps MTs to span
through the whole cell forming long tubes, used for example in the mitotic spindle during
cell division. Nevertheless, MTs are also known to buckle under load (Brangwynne et al.
2006). The subunits of microtubules are asymmetric which gives microtubules their
polarity. These subunits are heterodimers and consist of α-tubulin and β-tubulin. Several
heterodimers linked together form a protofilament, where the side ending on α-tubulin is
generally labelled as (-) end and the side ending on β-tubulin as (+) end. 13
28
Background ________________________________________________________________________
protofilaments together form a single microtubule, a hollow tube which has a diameter of
25 nm. Within the cell, microtubules are organized by microtubule organization centers
(MTOC) where the (-) ends of microtubules are centralized. Cells can have several
MTOCs of which the most prominent one is called centromer. The assembly and
disassembly of microtubules is rather complex and has mainly two dynamically stable
conditions, either growing or shrinking. Microtubules are growing and shrinking on the
(+) end (Mitchison and Kirschner 1984), and can switch quickly between those two
regimes, which enables MTs to reorganize quickly (Holy and Leibler 1994). This is used
for example in cellular search for space where cells can explore space about 1000 times
faster by using the MTs dynamic instability than by using regulatory proteins, such as
stathmin and tau (Holy and Leibler 1994).
2.1.1.3 Intermediate Filaments (IF) Intermediate filaments are the third major component of the cytoskeleton. It is the least
stiff of the three (persistence length about 1 µm (Mücke et al. 2004)) and provides
general mechanical stability for the cell. It resists higher tensile forces than microtubules
or actin and is often assembled in response to stress, for example in the epithelial cells of
the lung to resist shear stresses (Flitney et al. 2009). The IF-subunits consist of two
symmetric dimers and IF therefore form apolar filaments. The diameter of these filaments
is about 10 – 12 nm. There are different classes of IF. Prominent examples are vimentin
or keratin. The organization of IF depends on the type of the cell, it can be distributed all
over the cell as in the case of keratin in epithelial cells or asymmetrically and directed
outwards of the cell as for vimentin. Even though IF assembly is not as dynamic as actin
or MTs, IFs can play an active role in the overall cellular dynamic, depending on the
type, amount and crosslinking (Helfand et al. 2004). The amount and crosslinking of IF
can differ with cell types and be reflected in their mechanical properties, especially for
large strains. A good example are keratinocytes which can resist strains as large as 100 %
due to their strong keratin network (Fudge et al. 2008).
29
Background ________________________________________________________________________ 2.1.2 Controlling the Components of the Cytoskeleton There are a variety of proteins which control the polymers of the cytoskeleton in order to
form different architectures, e.g. to initiate filament formation as in the case of nucleation
promoting factors, e.g. N-WASP and Scar/WAVE1 for actin filaments (Higgs 2001) or to
stop it by capping proteins, e.g. V-1 and CARMIL proteins, also for actin filaments
(Takeda et al. 2010; Akin and Mullins 2008). Filamentous growth speed can be
accelerated by polymerases. Formed filaments will be disassembled under the influence
of depolymerizing factors or so called severing factors, e.g. Gelsolin and Cofilin (Ono
2007). In contrast, crosslinkers and stabilizing proteins will organize, stabilize and
reinforce higher order structures of networks (Schmoller et al. 2011). Mechanical forces
within or outside of the cell as well as biochemical cues can affect the activity of these
factors and therefore change the overall organization of the cytoskeleton.
One type of protein which can also fulfil the function of a crosslinker but which have far
more tasks are molecular motors. Molecular motors can be seen as molecular micro
machines with one or two heads which can ‘walk’ along F-actin or microtubules.
If one motor head is binding to an individual filament and the second motor head of this
particular motor is binding to a different filament, then the molecular motor can slide
these two filaments along each other. Cargo units can be transported within the cell by
binding the tail of the motor to a cargo unit and using actin or microtubules as a kind of
rail tracks (Vale 2003). Molecular motors use the polarity of the filaments to move in one
direction (Müller et al. 1999). Different molecular motors move in different directions,
e.g. kinesins move in the + direction (Sablin 2000), and dyneins in the – direction of
microtubules (Spudich 2011). Another family of motors, the family of myosin motors
(Hodge and Cope 2000), have various functions, e.g. myosin moves along actin
filaments. Through the capacity of binding to two filaments of one type, molecular
motors are dynamic crosslinkers within the cytoskeleton and necessary to generate forces
within the cell (Fisher and Kolomeisky 1999). Such forces are used by cells in a wide
variety of situations, for example while changing shape during migration, or by
contractions while sensing their environment (Bischofs 2003; Lo et al. 2004; Georges
and Janmey 2005; Si et al. 2009) .
30
Background ________________________________________________________________________
Generally, crosslinkers affect the cytoskeletal structure by two main factors: One is the
physical way how they link two filaments to each other (e.g. in parallel or perpendicular),
the other their binding kinetics, e.g. how fast crosslinkers bind and unbind individual
filaments. Fascin, for example, organizes actin in bundles as used in filopodia (Tseng et
al. 2001). Another crosslinker, α-actinin, can bind actin either in bundles or in orthogonal
structures, which are needed to form the actin cortex. The difference in how α-actinin
works can be explained by the dissociation rate of the corresponding crosslinker which is
higher to form bundles and slower to form more random, orthogonal structures
(Wachsstock et al. 1994). An example of the variety of structures formed by one type of
filament is depicted for actin in Figure 2-3. This variety is necessary for the cell to cope
with different stresses. Bundles can resist stronger forces in one direction whereas an
orthogonal network will resist forces in multiple directions.
31
Background ________________________________________________________________________
2.1.3 Mechanical Properties of the Cytoskeletal Network To understand the mechanical properties of the cytoskeleton it is not only necessary to
investigate the mechanical properties of the filaments themselves but also their
interactions. Interactions can happen between filaments of the same type, but also
between filaments of different types.
2.1.3.1 Interactions of Filaments of the Same Type with Each Other Cytoskeletal networks deform differently under the influence of stress. Numerous studies
report a stiffening response of networks under stress which can mostly be explained by
high entanglement and a reduction of the possible available configurations of thermally
fluctuating filaments within a network when stretched, which is called entropic elasticity
(Coughlin et al. 2008; Fernandez and Ott 2008; Icard-Arcizet et al. 2008). Nevertheless,
recently there have been findings of networks and filaments quickly fluidizing and re-
solidifying afterwards under stress (Trepat et al. 2007). The explanation of this effect
might be an unbinding of crosslinkers under a load and a rebinding to a new position
afterwards. The effect of fluidization will be discussed in further detail in chapter 5.
2.1.3.2 Interactions of Filaments of Different Type with Each Other
Other than crosslinking filaments of the same type, different filament types can also
interconnect with each other. This can happen either in a non-specific way through
entanglements and steric effects or in a specific way by particular proteins, which either
crosslink different components of the cytoskeleton with each other or are influencing
more than one cytoskeletal component. Two examples are WHAMM, an actin nucleation
promoting factor which also binds to membranes and MTs (Campellone et al. 2008) and
the GTPase Rac1, a signaling molecule which is activated by MTs but also stimulates
actin polymerization (Waterman-Storer et al. 1999). These interconnections give the cell
an even broader range of resistance to stress or of exerting forces, but they are difficult to
investigate due to the complexity of the interlinked networks. Very often, single type
networks are investigated in-vitro but it is difficult to relate these in-vitro results to the
32
Background ________________________________________________________________________
contribution of this network to the overall mechanical properties inside the living cell.
One way of probing the contribution of a particular component of the cytoskeleton is the
use of cytoskeletal drugs, which mainly enhance or inhibit polymerizations of one
filament type or change the crosslinking between properties of the network. Such an
approach has been carried out in the line of this work as described in chapter 5. This is a
valid method but one needs to keep in mind that cells have built-in redundancy systems
which can compensate for the loss of one particular cytoskeletal component (Goldstein
1993; Semmrich et al. 2007).
2.1.4 Further Characterization of the Cytoskeleton Theoretical models to describe the cytoskeleton as a whole do not exist yet. It is
extremely difficult to take every single component into account as well as the connection
of the components to the cell membrane and other boundary conditions. An ideal model
will have to consider that single filaments might not stay chemically identical during
mechanical deformation, that crosslinkers are not rigid elements, the active contribution
of molecular motors to cell movement and cell-cell as well as cell-matrix interactions.
Nevertheless, theories including parts of it are available. Examples are the theory of
active gels (Joanny and Prost 2009), which includes molecular motors and the
hydrodynamics of the filaments, or the glassy material theory, where relaxation
timescales are considered (Bursac et al. 2005).
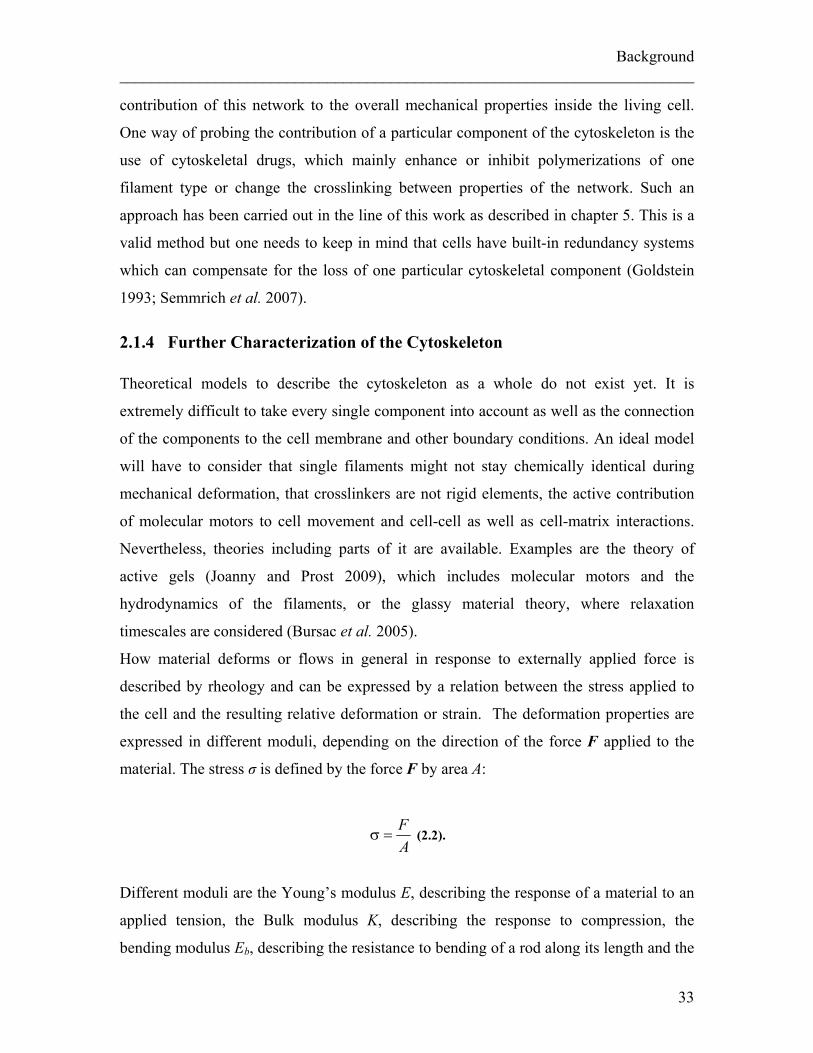
How material deforms or flows in general in response to externally applied force is
described by rheology and can be expressed by a relation between the stress applied to
the cell and the resulting relative deformation or strain. The deformation properties are
expressed in different moduli, depending on the direction of the force F applied to the
material. The stress σ is defined by the force F by area A:
AF
=σ (2.2).
Different moduli are the Young’s modulus E, describing the response of a material to an
applied tension, the Bulk modulus K, describing the response to compression, the
bending modulus Eb, describing the resistance to bending of a rod along its length and the
33
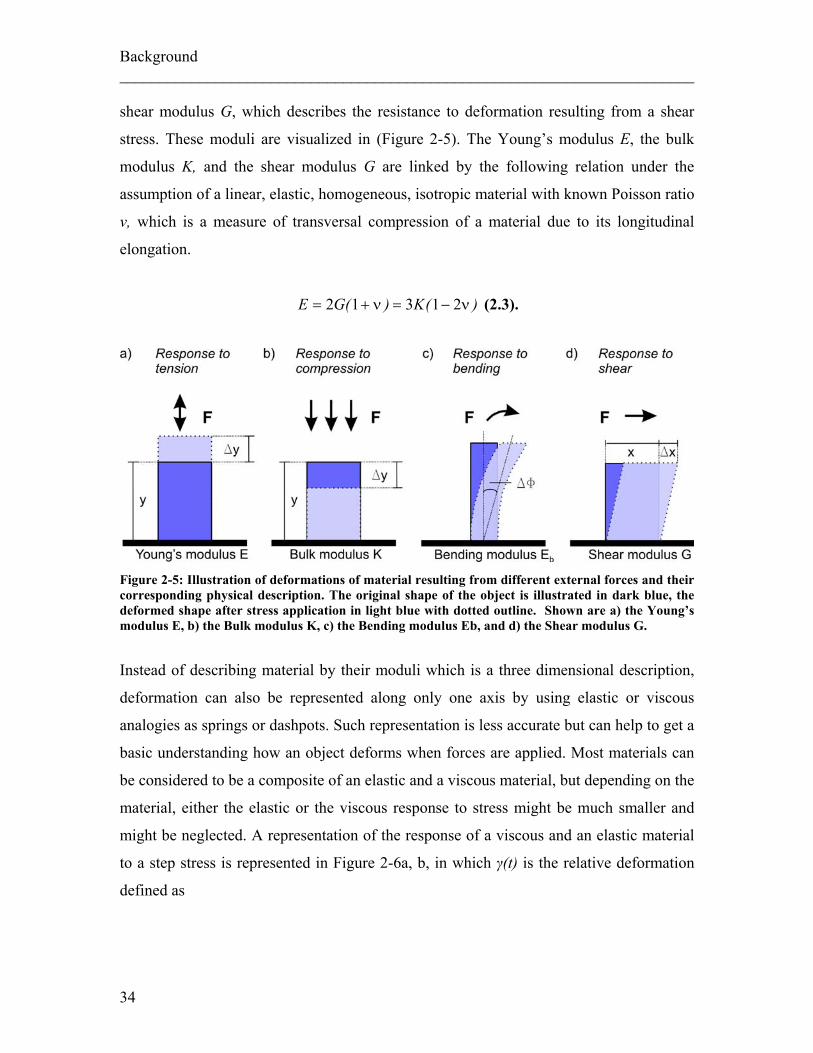
Background ________________________________________________________________________ shear modulus G, which describes the resistance to deformation resulting from a shear
stress. These moduli are visualized in (Figure 2-5). The Young’s modulus E, the bulk
modulus K, and the shear modulus G are linked by the following relation under the
assumption of a linear, elastic, homogeneous, isotropic material with known Poisson ratio
ν, which is a measure of transversal compression of a material due to its longitudinal
elongation.
)(K)(GE ν−=ν+= 21312 (2.3).
Figure 2-5: Illustration of deformations of material resulting from different external forces and their corresponding physical description. The original shape of the object is illustrated in dark blue, the deformed shape after stress application in light blue with dotted outline. Shown are a) the Young’s modulus E, b) the Bulk modulus K, c) the Bending modulus Eb, and d) the Shear modulus G.
Instead of describing material by their moduli which is a three dimensional description,
deformation can also be represented along only one axis by using elastic or viscous
analogies as springs or dashpots. Such representation is less accurate but can help to get a
basic understanding how an object deforms when forces are applied. Most materials can
be considered to be a composite of an elastic and a viscous material, but depending on the
material, either the elastic or the viscous response to stress might be much smaller and
might be neglected. A representation of the response of a viscous and an elastic material
to a step stress is represented in Figure 2-6a, b, in which γ(t) is the relative deformation
defined as
34
Background ________________________________________________________________________
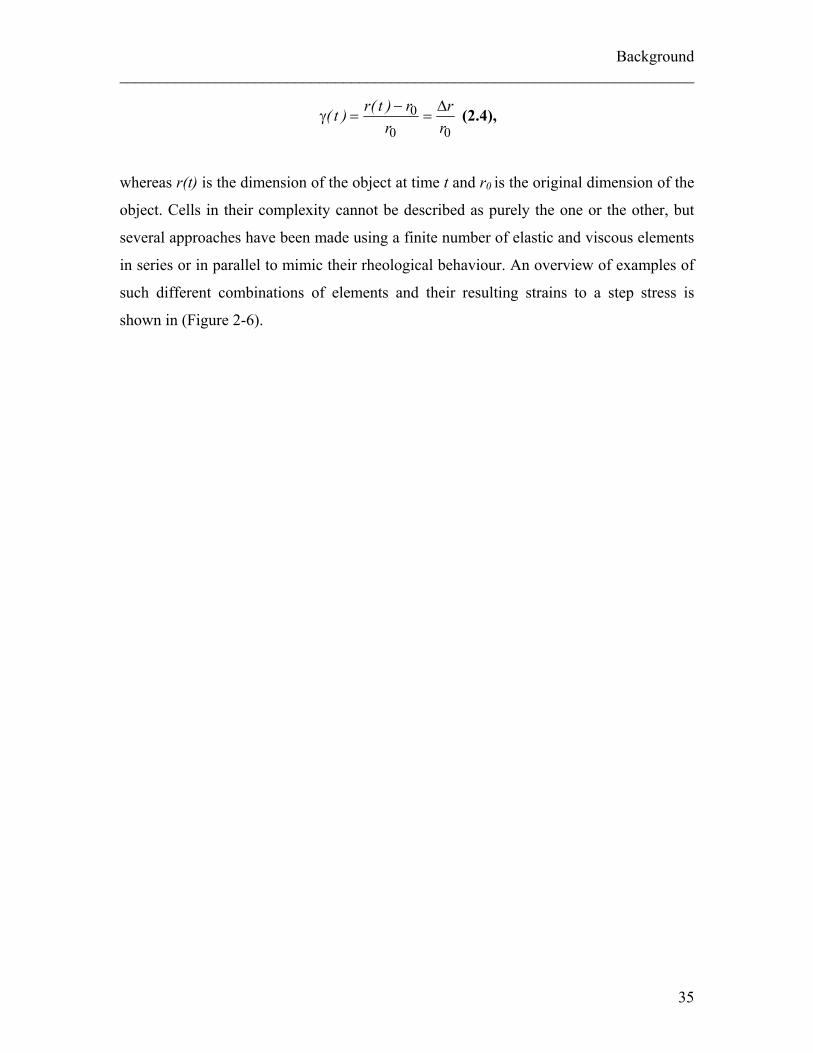
00
0rr
rr)t(r)t( Δ
=−
=γ (2.4),
whereas r(t) is the dimension of the object at time t and r0 is the original dimension of the
object. Cells in their complexity cannot be described as purely the one or the other, but
several approaches have been made using a finite number of elastic and viscous elements
in series or in parallel to mimic their rheological behaviour. An overview of examples of
such different combinations of elements and their resulting strains to a step stress is
shown in (Figure 2-6).
35
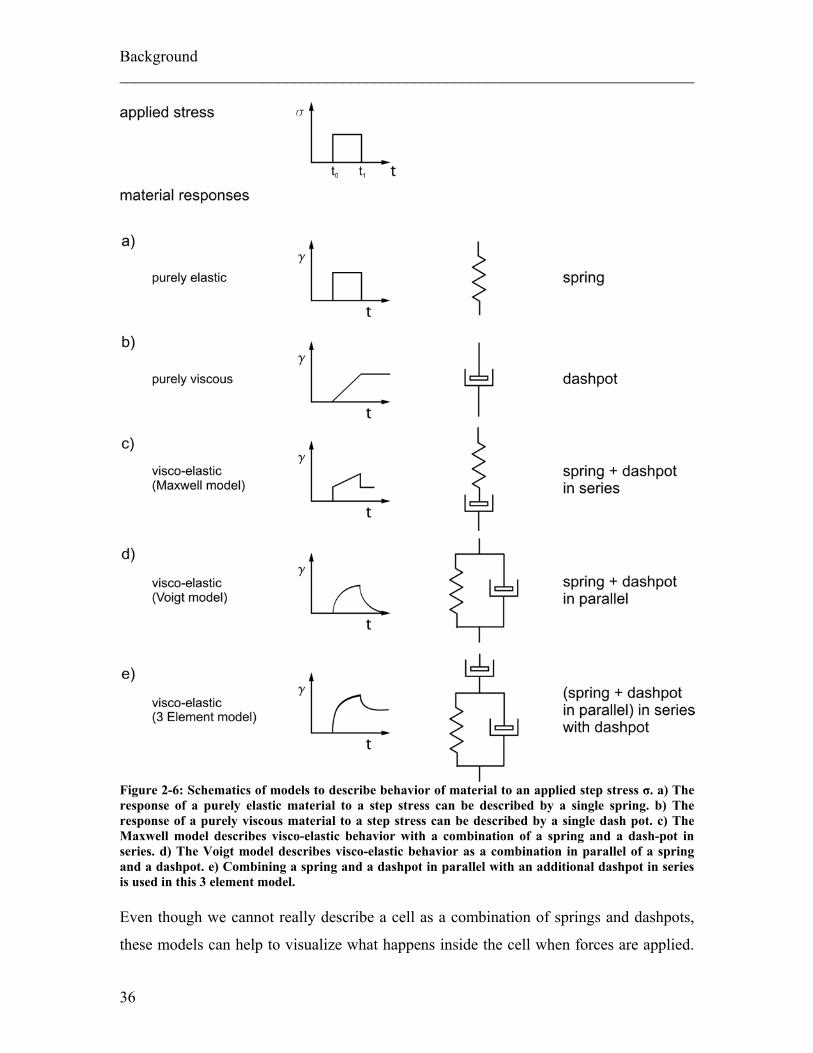
Background ________________________________________________________________________
Figure 2-6: Schematics of models to describe behavior of material to an applied step stress σ. a) The response of a purely elastic material to a step stress can be described by a single spring. b) The response of a purely viscous material to a step stress can be described by a single dash pot. c) The Maxwell model describes visco-elastic behavior with a combination of a spring and a dash-pot in series. d) The Voigt model describes visco-elastic behavior as a combination in parallel of a spring and a dashpot. e) Combining a spring and a dashpot in parallel with an additional dashpot in series is used in this 3 element model.
Even though we cannot really describe a cell as a combination of springs and dashpots,
these models can help to visualize what happens inside the cell when forces are applied.
36
Background ________________________________________________________________________
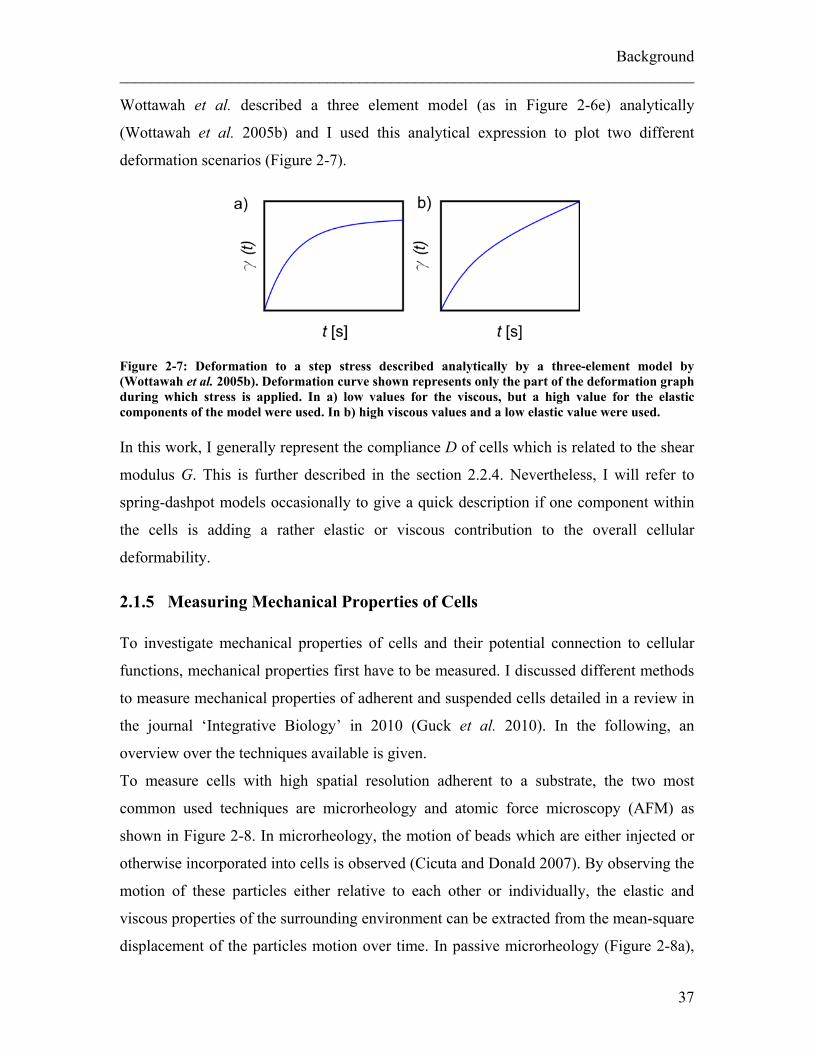
Wottawah et al. described a three element model (as in Figure 2-6e) analytically
(Wottawah et al. 2005b) and I used this analytical expression to plot two different
deformation scenarios (Figure 2-7).
Figure 2-7: Deformation to a step stress described analytically by a three-element model by (Wottawah et al. 2005b). Deformation curve shown represents only the part of the deformation graph during which stress is applied. In a) low values for the viscous, but a high value for the elastic components of the model were used. In b) high viscous values and a low elastic value were used. In this work, I generally represent the compliance D of cells which is related to the shear
modulus G. This is further described in the section 2.2.4. Nevertheless, I will refer to
spring-dashpot models occasionally to give a quick description if one component within
the cells is adding a rather elastic or viscous contribution to the overall cellular
deformability.
2.1.5 Measuring Mechanical Properties of Cells To investigate mechanical properties of cells and their potential connection to cellular
functions, mechanical properties first have to be measured. I discussed different methods
to measure mechanical properties of adherent and suspended cells detailed in a review in
the journal ‘Integrative Biology’ in 2010 (Guck et al. 2010). In the following, an
overview over the techniques available is given.
To measure cells with high spatial resolution adherent to a substrate, the two most
common used techniques are microrheology and atomic force microscopy (AFM) as
shown in Figure 2-8. In microrheology, the motion of beads which are either injected or
otherwise incorporated into cells is observed (Cicuta and Donald 2007). By observing the
motion of these particles either relative to each other or individually, the elastic and
viscous properties of the surrounding environment can be extracted from the mean-square
displacement of the particles motion over time. In passive microrheology (Figure 2-8a),
37
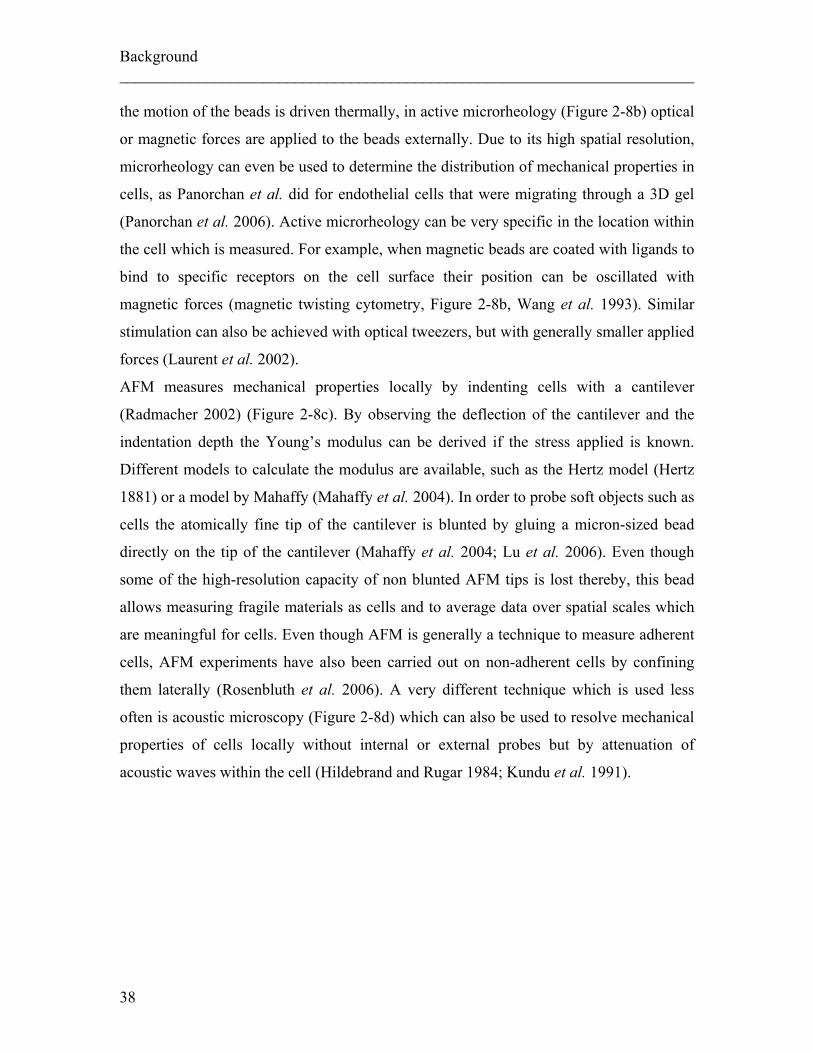
Background ________________________________________________________________________ the motion of the beads is driven thermally, in active microrheology (Figure 2-8b) optical
or magnetic forces are applied to the beads externally. Due to its high spatial resolution,
microrheology can even be used to determine the distribution of mechanical properties in
cells, as Panorchan et al. did for endothelial cells that were migrating through a 3D gel
(Panorchan et al. 2006). Active microrheology can be very specific in the location within
the cell which is measured. For example, when magnetic beads are coated with ligands to
bind to specific receptors on the cell surface their position can be oscillated with
magnetic forces (magnetic twisting cytometry, Figure 2-8b, Wang et al. 1993). Similar
stimulation can also be achieved with optical tweezers, but with generally smaller applied
forces (Laurent et al. 2002).
AFM measures mechanical properties locally by indenting cells with a cantilever
(Radmacher 2002) (Figure 2-8c). By observing the deflection of the cantilever and the
indentation depth the Young’s modulus can be derived if the stress applied is known.
Different models to calculate the modulus are available, such as the Hertz model (Hertz
1881) or a model by Mahaffy (Mahaffy et al. 2004). In order to probe soft objects such as
cells the atomically fine tip of the cantilever is blunted by gluing a micron-sized bead
directly on the tip of the cantilever (Mahaffy et al. 2004; Lu et al. 2006). Even though
some of the high-resolution capacity of non blunted AFM tips is lost thereby, this bead
allows measuring fragile materials as cells and to average data over spatial scales which
are meaningful for cells. Even though AFM is generally a technique to measure adherent
cells, AFM experiments have also been carried out on non-adherent cells by confining
them laterally (Rosenbluth et al. 2006). A very different technique which is used less
often is acoustic microscopy (Figure 2-8d) which can also be used to resolve mechanical
properties of cells locally without internal or external probes but by attenuation of
acoustic waves within the cell (Hildebrand and Rugar 1984; Kundu et al. 1991).
38
Background ________________________________________________________________________
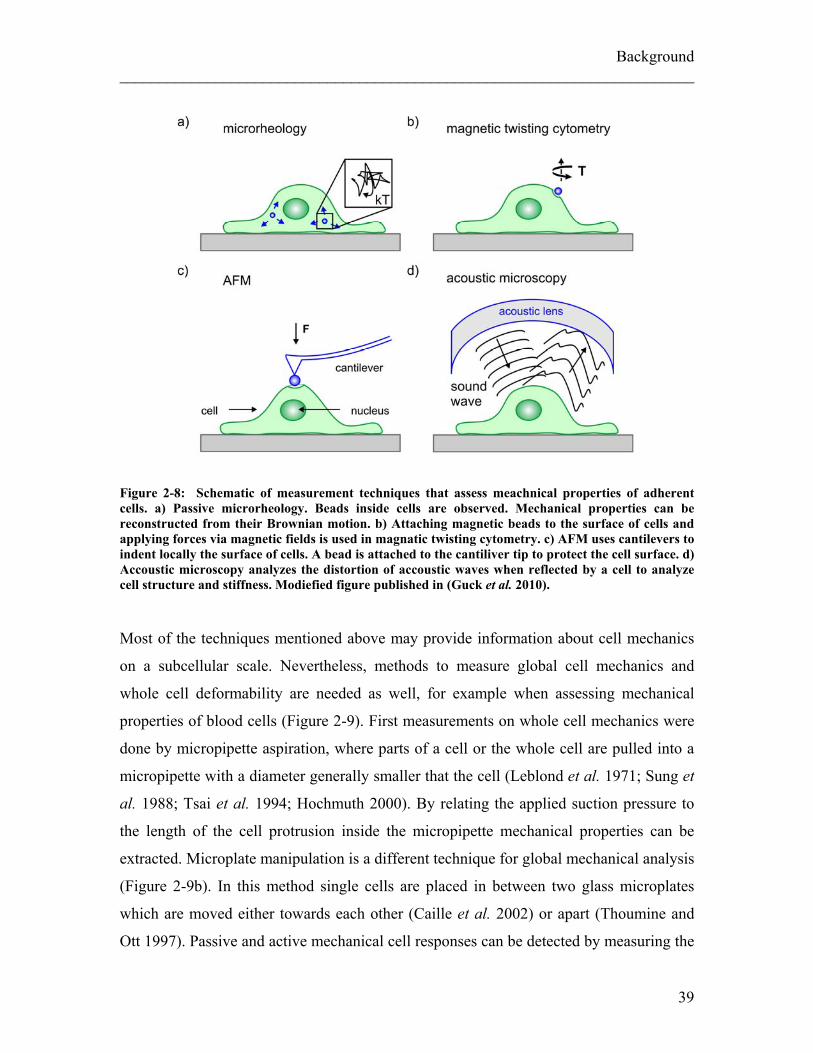
Figure 2-8: Schematic of measurement techniques that assess meachnical properties of adherent cells. a) Passive microrheology. Beads inside cells are observed. Mechanical properties can be reconstructed from their Brownian motion. b) Attaching magnetic beads to the surface of cells and applying forces via magnetic fields is used in magnatic twisting cytometry. c) AFM uses cantilevers to indent locally the surface of cells. A bead is attached to the cantiliver tip to protect the cell surface. d) Accoustic microscopy analyzes the distortion of accoustic waves when reflected by a cell to analyze cell structure and stiffness. Modiefied figure published in (Guck et al. 2010). Most of the techniques mentioned above may provide information about cell mechanics
on a subcellular scale. Nevertheless, methods to measure global cell mechanics and
whole cell deformability are needed as well, for example when assessing mechanical
properties of blood cells (Figure 2-9). First measurements on whole cell mechanics were
done by micropipette aspiration, where parts of a cell or the whole cell are pulled into a
micropipette with a diameter generally smaller that the cell (Leblond et al. 1971; Sung et
al. 1988; Tsai et al. 1994; Hochmuth 2000). By relating the applied suction pressure to
the length of the cell protrusion inside the micropipette mechanical properties can be
extracted. Microplate manipulation is a different technique for global mechanical analysis
(Figure 2-9b). In this method single cells are placed in between two glass microplates
which are moved either towards each other (Caille et al. 2002) or apart (Thoumine and
Ott 1997). Passive and active mechanical cell responses can be detected by measuring the
39
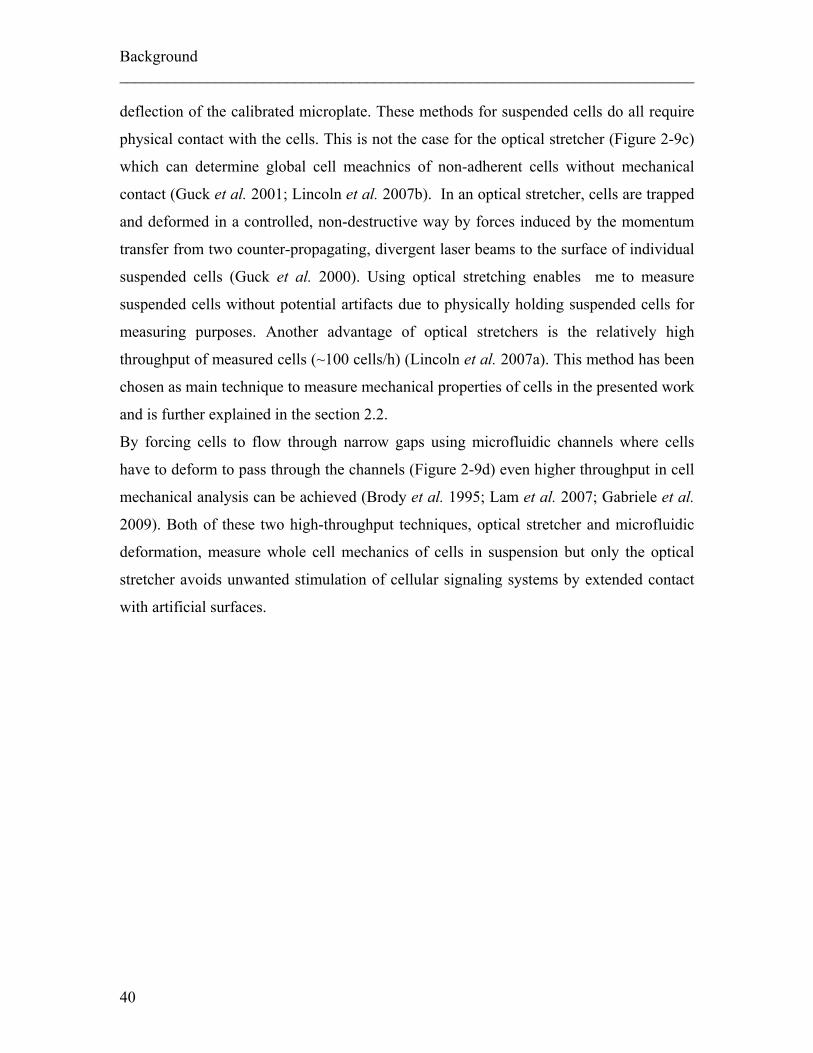
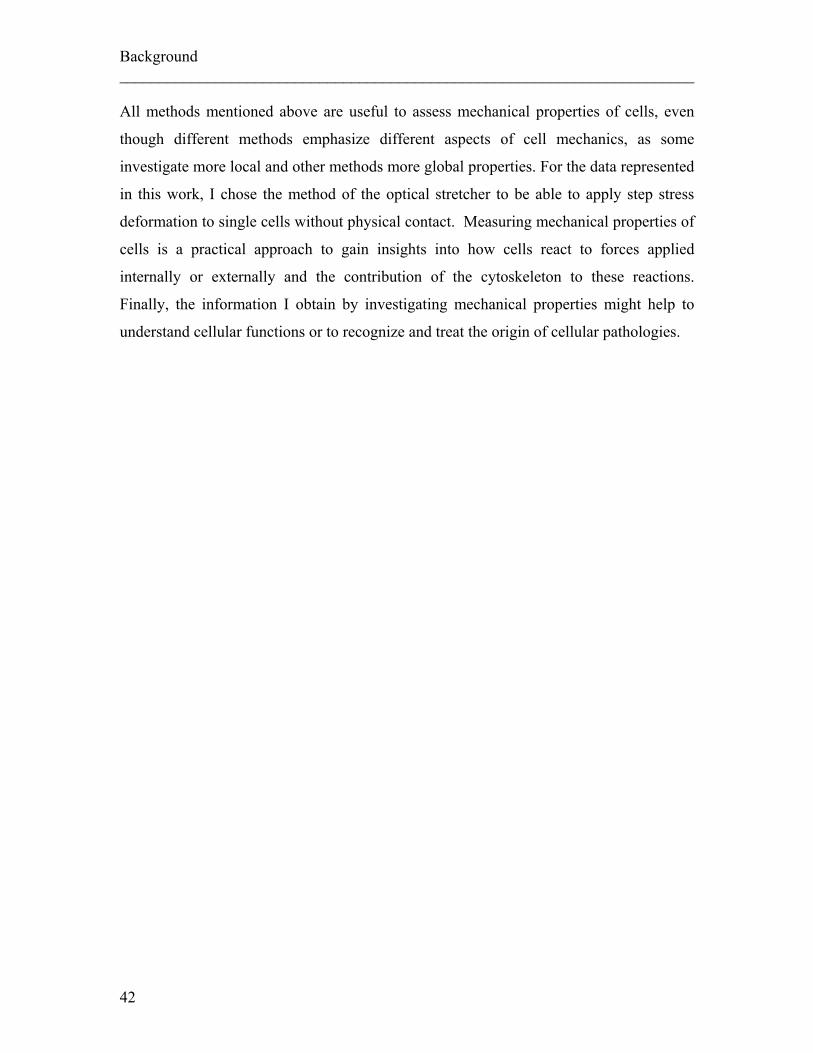
Background ________________________________________________________________________ deflection of the calibrated microplate. These methods for suspended cells do all require
physical contact with the cells. This is not the case for the optical stretcher (Figure 2-9c)
which can determine global cell meachnics of non-adherent cells without mechanical
contact (Guck et al. 2001; Lincoln et al. 2007b). In an optical stretcher, cells are trapped
and deformed in a controlled, non-destructive way by forces induced by the momentum
transfer from two counter-propagating, divergent laser beams to the surface of individual
suspended cells (Guck et al. 2000). Using optical stretching enables me to measure
suspended cells without potential artifacts due to physically holding suspended cells for
measuring purposes. Another advantage of optical stretchers is the relatively high
throughput of measured cells (~100 cells/h) (Lincoln et al. 2007a). This method has been
chosen as main technique to measure mechanical properties of cells in the presented work
and is further explained in the section 2.2.
By forcing cells to flow through narrow gaps using microfluidic channels where cells
have to deform to pass through the channels (Figure 2-9d) even higher throughput in cell
mechanical analysis can be achieved (Brody et al. 1995; Lam et al. 2007; Gabriele et al.
2009). Both of these two high-throughput techniques, optical stretcher and microfluidic
deformation, measure whole cell mechanics of cells in suspension but only the optical
stretcher avoids unwanted stimulation of cellular signaling systems by extended contact
with artificial surfaces.
40
Background ________________________________________________________________________
Figure 2-9: Schematic of measurement techniques that assess mechanical properties of suspended cells. a) During micropipette aspiration a cell is deformed totally or partially by pulling it into a hollow glass capillary. Mechanical properties can be extracted when pulling force is known. b) Cells can be deformed in between two movable plates as done in microplate manipulation. c) Optical stretchers deform cells contact-free using optical forces. d) High throughput measurements can be done by microfluidic deformation, where cells are pushed through microfluidic channels. Modified figure published in (Guck et al. 2010).
41
Background ________________________________________________________________________ All methods mentioned above are useful to assess mechanical properties of cells, even
though different methods emphasize different aspects of cell mechanics, as some
investigate more local and other methods more global properties. For the data represented
in this work, I chose the method of the optical stretcher to be able to apply step stress
deformation to single cells without physical contact. Measuring mechanical properties of
cells is a practical approach to gain insights into how cells react to forces applied
internally or externally and the contribution of the cytoskeleton to these reactions.
Finally, the information I obtain by investigating mechanical properties might help to
understand cellular functions or to recognize and treat the origin of cellular pathologies.
42
Background ________________________________________________________________________
2.2 The Optical Stretcher
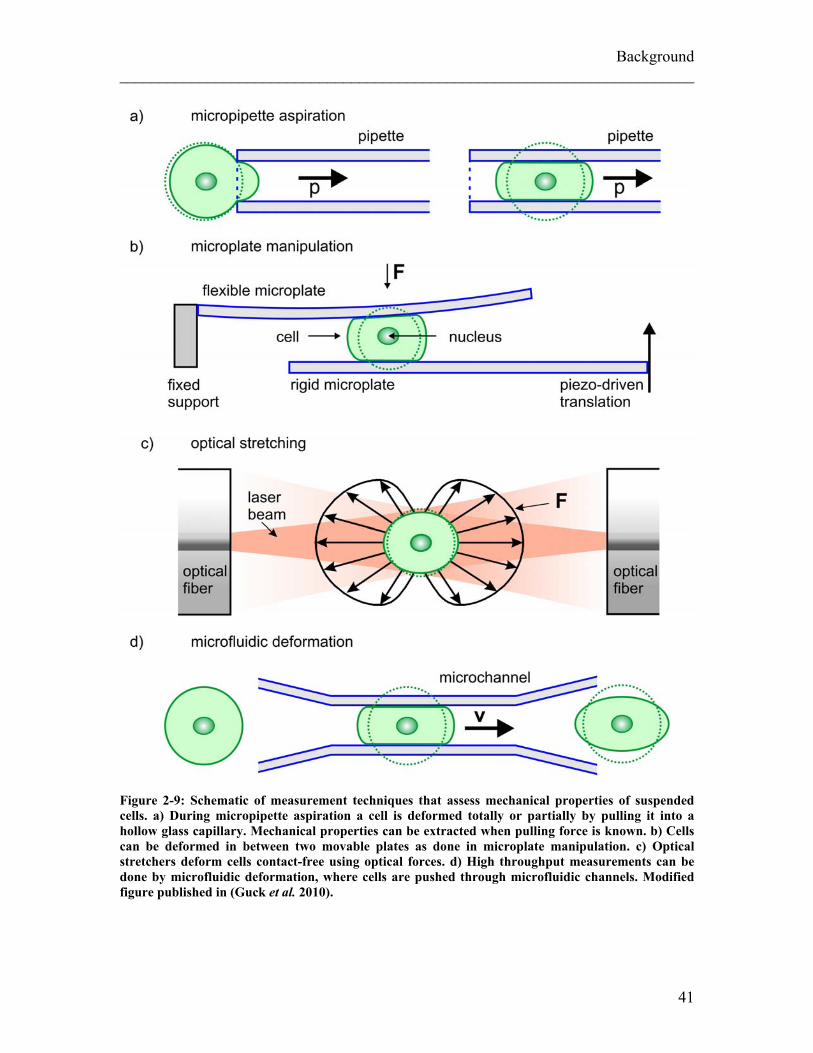
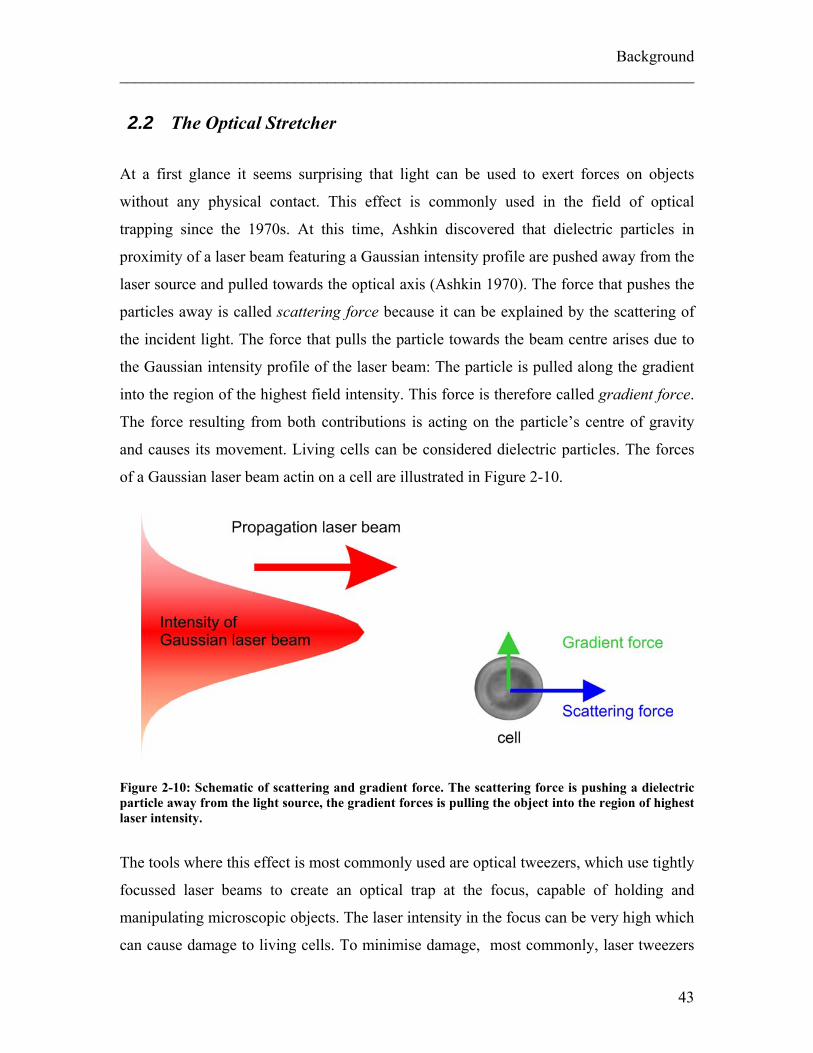
At a first glance it seems surprising that light can be used to exert forces on objects
without any physical contact. This effect is commonly used in the field of optical
trapping since the 1970s. At this time, Ashkin discovered that dielectric particles in
proximity of a laser beam featuring a Gaussian intensity profile are pushed away from the
laser source and pulled towards the optical axis (Ashkin 1970). The force that pushes the
particles away is called scattering force because it can be explained by the scattering of
the incident light. The force that pulls the particle towards the beam centre arises due to
the Gaussian intensity profile of the laser beam: The particle is pulled along the gradient
into the region of the highest field intensity. This force is therefore called gradient force.
The force resulting from both contributions is acting on the particle’s centre of gravity
and causes its movement. Living cells can be considered dielectric particles. The forces
of a Gaussian laser beam actin on a cell are illustrated in Figure 2-10.
Figure 2-10: Schematic of scattering and gradient force. The scattering force is pushing a dielectric particle away from the light source, the gradient forces is pulling the object into the region of highest laser intensity.
The tools where this effect is most commonly used are optical tweezers, which use tightly
focussed laser beams to create an optical trap at the focus, capable of holding and
manipulating microscopic objects. The laser intensity in the focus can be very high which
can cause damage to living cells. To minimise damage, most commonly, laser tweezers
43
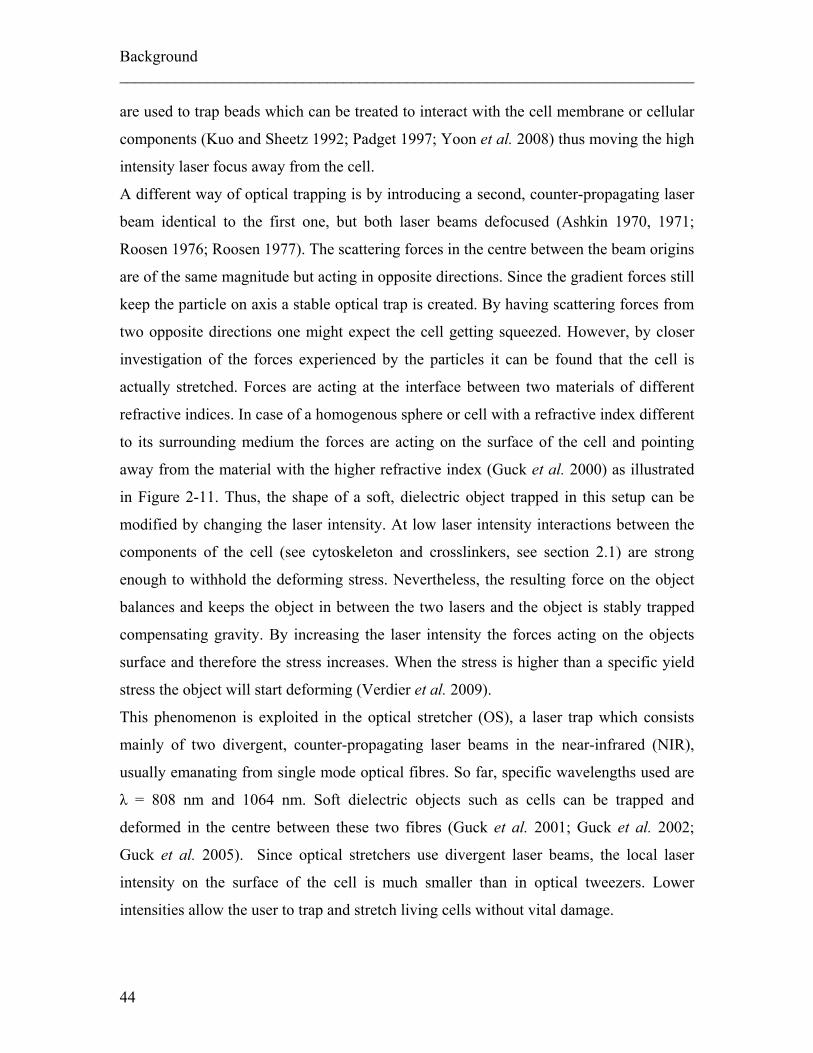
Background ________________________________________________________________________ are used to trap beads which can be treated to interact with the cell membrane or cellular
components (Kuo and Sheetz 1992; Padget 1997; Yoon et al. 2008) thus moving the high
intensity laser focus away from the cell.
A different way of optical trapping is by introducing a second, counter-propagating laser
beam identical to the first one, but both laser beams defocused (Ashkin 1970, 1971;
Roosen 1976; Roosen 1977). The scattering forces in the centre between the beam origins
are of the same magnitude but acting in opposite directions. Since the gradient forces still
keep the particle on axis a stable optical trap is created. By having scattering forces from
two opposite directions one might expect the cell getting squeezed. However, by closer
investigation of the forces experienced by the particles it can be found that the cell is
actually stretched. Forces are acting at the interface between two materials of different
refractive indices. In case of a homogenous sphere or cell with a refractive index different
to its surrounding medium the forces are acting on the surface of the cell and pointing
away from the material with the higher refractive index (Guck et al. 2000) as illustrated
in Figure 2-11. Thus, the shape of a soft, dielectric object trapped in this setup can be
modified by changing the laser intensity. At low laser intensity interactions between the
components of the cell (see cytoskeleton and crosslinkers, see section 2.1) are strong
enough to withhold the deforming stress. Nevertheless, the resulting force on the object
balances and keeps the object in between the two lasers and the object is stably trapped
compensating gravity. By increasing the laser intensity the forces acting on the objects
surface and therefore the stress increases. When the stress is higher than a specific yield
stress the object will start deforming (Verdier et al. 2009).
This phenomenon is exploited in the optical stretcher (OS), a laser trap which consists
mainly of two divergent, counter-propagating laser beams in the near-infrared (NIR),
usually emanating from single mode optical fibres. So far, specific wavelengths used are
λ = 808 nm and 1064 nm. Soft dielectric objects such as cells can be trapped and
deformed in the centre between these two fibres (Guck et al. 2001; Guck et al. 2002;
Guck et al. 2005). Since optical stretchers use divergent laser beams, the local laser
intensity on the surface of the cell is much smaller than in optical tweezers. Lower
intensities allow the user to trap and stretch living cells without vital damage.
44
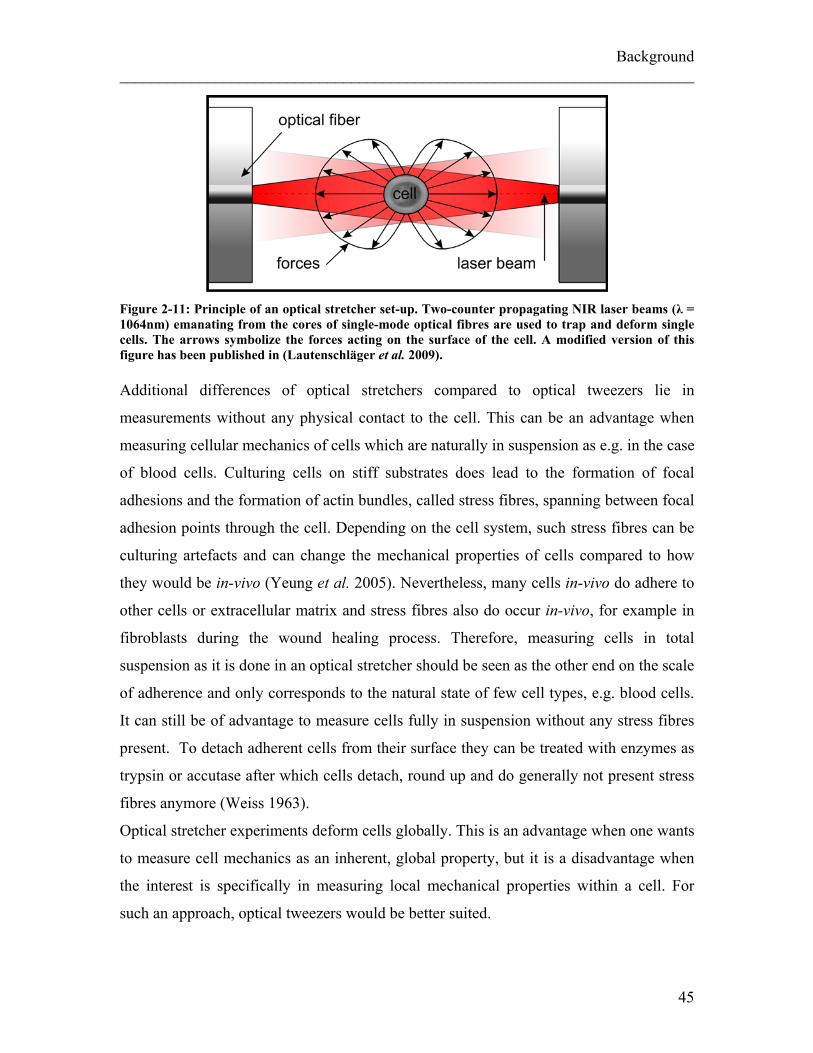
Background ________________________________________________________________________
Figure 2-11: Principle of an optical stretcher set-up. Two-counter propagating NIR laser beams (λ = 1064nm) emanating from the cores of single-mode optical fibres are used to trap and deform single cells. The arrows symbolize the forces acting on the surface of the cell. A modified version of this figure has been published in (Lautenschläger et al. 2009). Additional differences of optical stretchers compared to optical tweezers lie in
measurements without any physical contact to the cell. This can be an advantage when
measuring cellular mechanics of cells which are naturally in suspension as e.g. in the case
of blood cells. Culturing cells on stiff substrates does lead to the formation of focal
adhesions and the formation of actin bundles, called stress fibres, spanning between focal
adhesion points through the cell. Depending on the cell system, such stress fibres can be
culturing artefacts and can change the mechanical properties of cells compared to how
they would be in-vivo (Yeung et al. 2005). Nevertheless, many cells in-vivo do adhere to
other cells or extracellular matrix and stress fibres also do occur in-vivo, for example in
fibroblasts during the wound healing process. Therefore, measuring cells in total
suspension as it is done in an optical stretcher should be seen as the other end on the scale
of adherence and only corresponds to the natural state of few cell types, e.g. blood cells.
It can still be of advantage to measure cells fully in suspension without any stress fibres
present. To detach adherent cells from their surface they can be treated with enzymes as
trypsin or accutase after which cells detach, round up and do generally not present stress
fibres anymore (Weiss 1963).
Optical stretcher experiments deform cells globally. This is an advantage when one wants
to measure cell mechanics as an inherent, global property, but it is a disadvantage when
the interest is specifically in measuring local mechanical properties within a cell. For
such an approach, optical tweezers would be better suited.
45
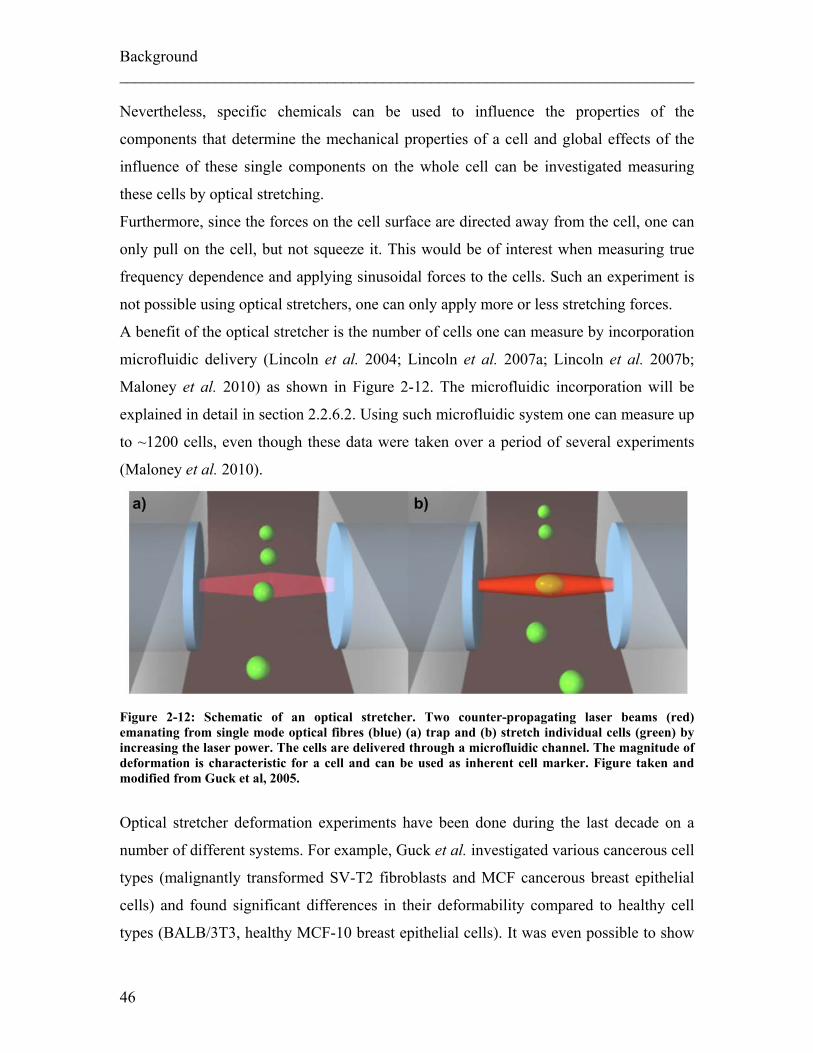
Background ________________________________________________________________________ Nevertheless, specific chemicals can be used to influence the properties of the
components that determine the mechanical properties of a cell and global effects of the
influence of these single components on the whole cell can be investigated measuring
these cells by optical stretching.
Furthermore, since the forces on the cell surface are directed away from the cell, one can
only pull on the cell, but not squeeze it. This would be of interest when measuring true
frequency dependence and applying sinusoidal forces to the cells. Such an experiment is
not possible using optical stretchers, one can only apply more or less stretching forces.
A benefit of the optical stretcher is the number of cells one can measure by incorporation
microfluidic delivery (Lincoln et al. 2004; Lincoln et al. 2007a; Lincoln et al. 2007b;
Maloney et al. 2010) as shown in Figure 2-12. The microfluidic incorporation will be
explained in detail in section 2.2.6.2. Using such microfluidic system one can measure up
to ~1200 cells, even though these data were taken over a period of several experiments
(Maloney et al. 2010).
Figure 2-12: Schematic of an optical stretcher. Two counter-propagating laser beams (red) emanating from single mode optical fibres (blue) (a) trap and (b) stretch individual cells (green) by increasing the laser power. The cells are delivered through a microfluidic channel. The magnitude of deformation is characteristic for a cell and can be used as inherent cell marker. Figure taken and modified from Guck et al, 2005.
Optical stretcher deformation experiments have been done during the last decade on a
number of different systems. For example, Guck et al. investigated various cancerous cell
types (malignantly transformed SV-T2 fibroblasts and MCF cancerous breast epithelial
cells) and found significant differences in their deformability compared to healthy cell
types (BALB/3T3, healthy MCF-10 breast epithelial cells). It was even possible to show
46
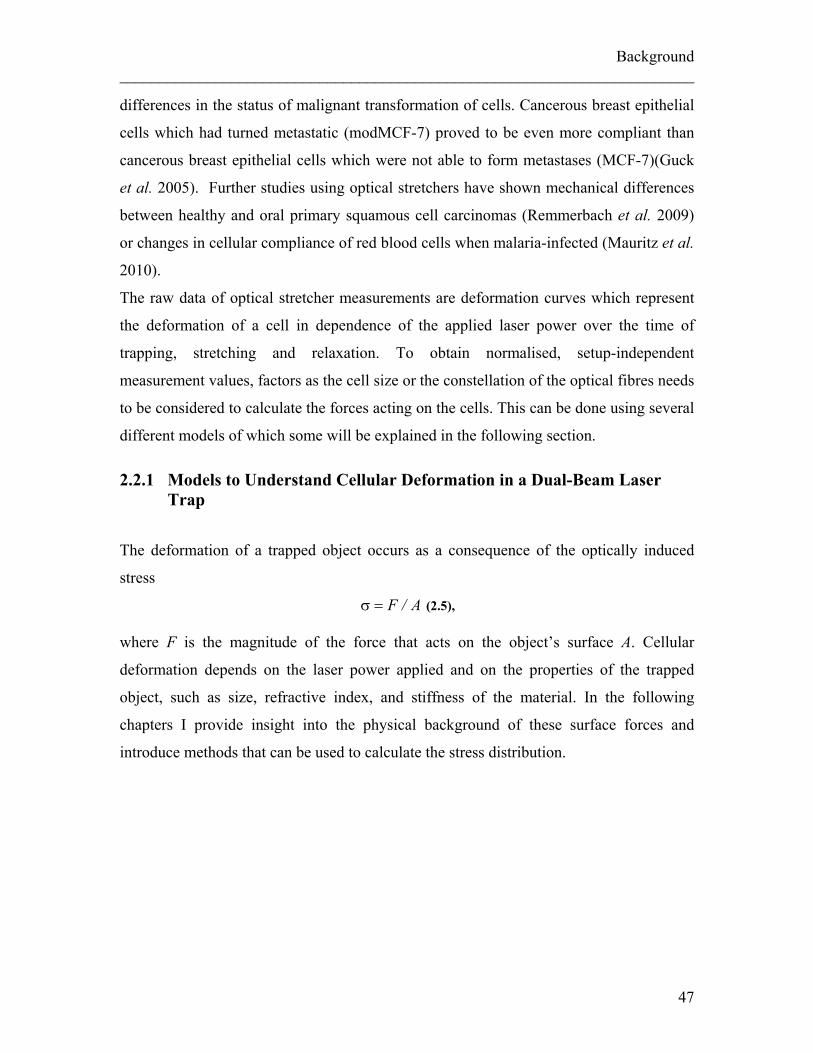
Background ________________________________________________________________________
differences in the status of malignant transformation of cells. Cancerous breast epithelial
cells which had turned metastatic (modMCF-7) proved to be even more compliant than
cancerous breast epithelial cells which were not able to form metastases (MCF-7)(Guck
et al. 2005). Further studies using optical stretchers have shown mechanical differences
between healthy and oral primary squamous cell carcinomas (Remmerbach et al. 2009)
or changes in cellular compliance of red blood cells when malaria-infected (Mauritz et al.
2010).
The raw data of optical stretcher measurements are deformation curves which represent
the deformation of a cell in dependence of the applied laser power over the time of
trapping, stretching and relaxation. To obtain normalised, setup-independent
measurement values, factors as the cell size or the constellation of the optical fibres needs
to be considered to calculate the forces acting on the cells. This can be done using several
different models of which some will be explained in the following section.
2.2.1 Models to Understand Cellular Deformation in a Dual-Beam Laser Trap
The deformation of a trapped object occurs as a consequence of the optically induced
stress
A/F=σ (2.5), where F is the magnitude of the force that acts on the object’s surface A. Cellular
deformation depends on the laser power applied and on the properties of the trapped
object, such as size, refractive index, and stiffness of the material. In the following
chapters I provide insight into the physical background of these surface forces and
introduce methods that can be used to calculate the stress distribution.
47
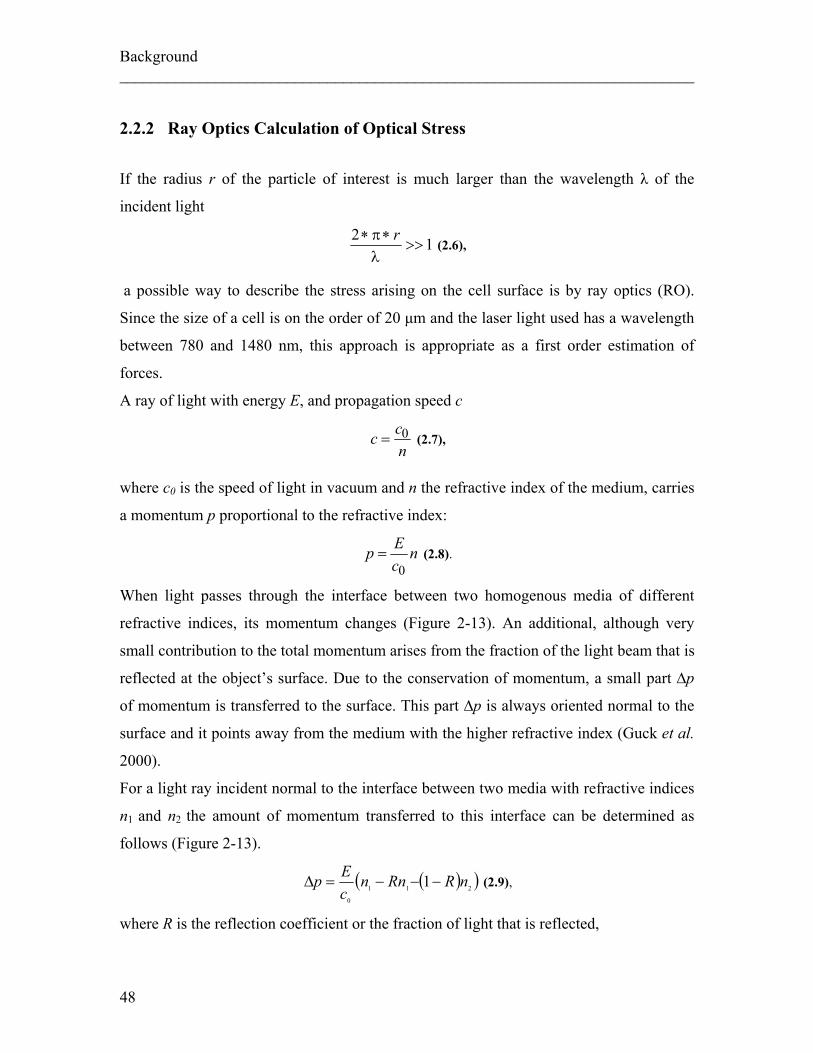
Background ________________________________________________________________________
2.2.2 Ray Optics Calculation of Optical Stress
If the radius r of the particle of interest is much larger than the wavelength λ of the
incident light
12>>
λ∗π∗ r
(2.6),
a possible way to describe the stress arising on the cell surface is by ray optics (RO).
Since the size of a cell is on the order of 20 μm and the laser light used has a wavelength
between 780 and 1480 nm, this approach is appropriate as a first order estimation of
forces.
A ray of light with energy E, and propagation speed c
ncc 0= (2.7),
where c0 is the speed of light in vacuum and n the refractive index of the medium, carries
a momentum p proportional to the refractive index:
ncEp0
= (2.8).
When light passes through the interface between two homogenous media of different
refractive indices, its momentum changes (Figure 2-13). An additional, although very
small contribution to the total momentum arises from the fraction of the light beam that is
reflected at the object’s surface. Due to the conservation of momentum, a small part ∆p
of momentum is transferred to the surface. This part ∆p is always oriented normal to the
surface and it points away from the medium with the higher refractive index (Guck et al.
2000).
For a light ray incident normal to the interface between two media with refractive indices
n1 and n2 the amount of momentum transferred to this interface can be determined as
follows (Figure 2-13).
( )( )211
0
1 nRRnncEp −−−=Δ (2.9),
where R is the reflection coefficient or the fraction of light that is reflected,
48
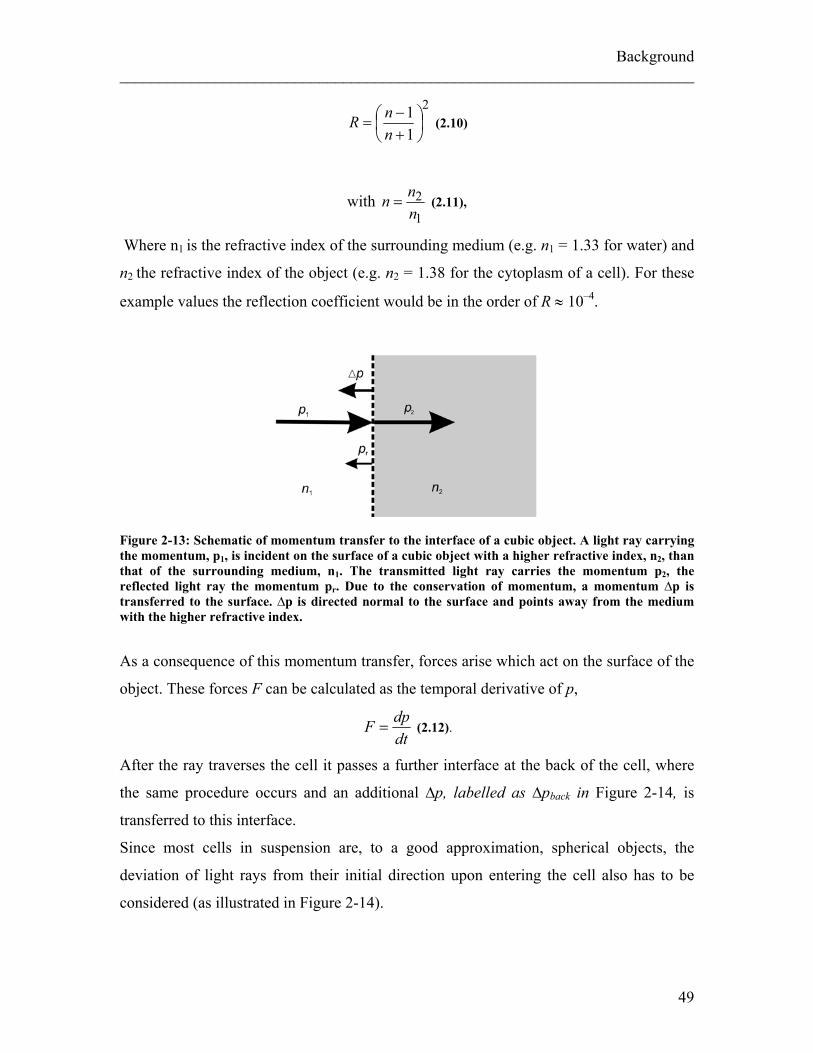
Background ________________________________________________________________________
2
11⎟⎠⎞
⎜⎝⎛
+−
=nnR (2.10)
with 1
2nnn = (2.11),
Where n1 is the refractive index of the surrounding medium (e.g. n1 = 1.33 for water) and
n2 the refractive index of the object (e.g. n2 = 1.38 for the cytoplasm of a cell). For these
example values the reflection coefficient would be in the order of R ≈ 10–4.
Figure 2-13: Schematic of momentum transfer to the interface of a cubic object. A light ray carrying the momentum, p1, is incident on the surface of a cubic object with a higher refractive index, n2, than that of the surrounding medium, n1. The transmitted light ray carries the momentum p2, the reflected light ray the momentum pr. Due to the conservation of momentum, a momentum ∆p is transferred to the surface. ∆p is directed normal to the surface and points away from the medium with the higher refractive index.
As a consequence of this momentum transfer, forces arise which act on the surface of the
object. These forces F can be calculated as the temporal derivative of p,
dtdpF = (2.12).
After the ray traverses the cell it passes a further interface at the back of the cell, where
the same procedure occurs and an additional ∆p, labelled as ∆pback in Figure 2-14, is
transferred to this interface.
Since most cells in suspension are, to a good approximation, spherical objects, the
deviation of light rays from their initial direction upon entering the cell also has to be
considered (as illustrated in Figure 2-14).
49
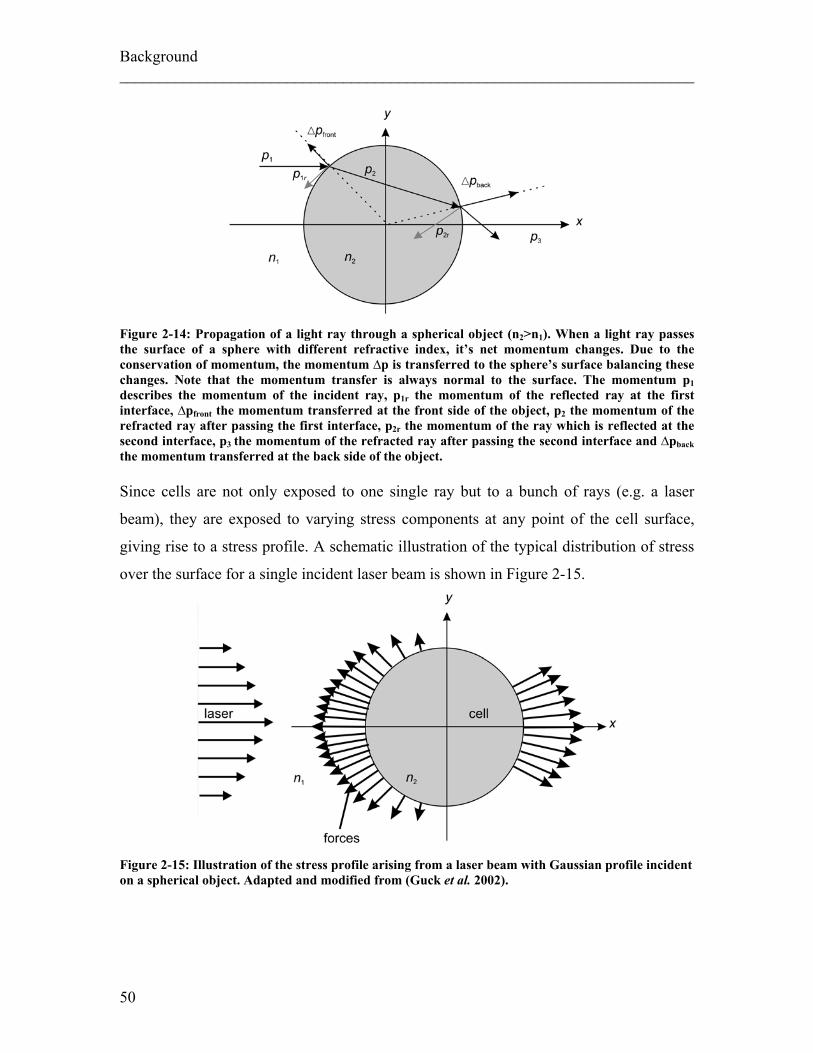
Background ________________________________________________________________________
Figure 2-14: Propagation of a light ray through a spherical object (n2>n1). When a light ray passes the surface of a sphere with different refractive index, it’s net momentum changes. Due to the conservation of momentum, the momentum ∆p is transferred to the sphere’s surface balancing these changes. Note that the momentum transfer is always normal to the surface. The momentum p1 describes the momentum of the incident ray, p1r the momentum of the reflected ray at the first interface, ∆pfront the momentum transferred at the front side of the object, p2 the momentum of the refracted ray after passing the first interface, p2r the momentum of the ray which is reflected at the second interface, p3 the momentum of the refracted ray after passing the second interface and ∆pback the momentum transferred at the back side of the object. Since cells are not only exposed to one single ray but to a bunch of rays (e.g. a laser
beam), they are exposed to varying stress components at any point of the cell surface,
giving rise to a stress profile. A schematic illustration of the typical distribution of stress
over the surface for a single incident laser beam is shown in Figure 2-15.
Figure 2-15: Illustration of the stress profile arising from a laser beam with Gaussian profile incident on a spherical object. Adapted and modified from (Guck et al. 2002).
50
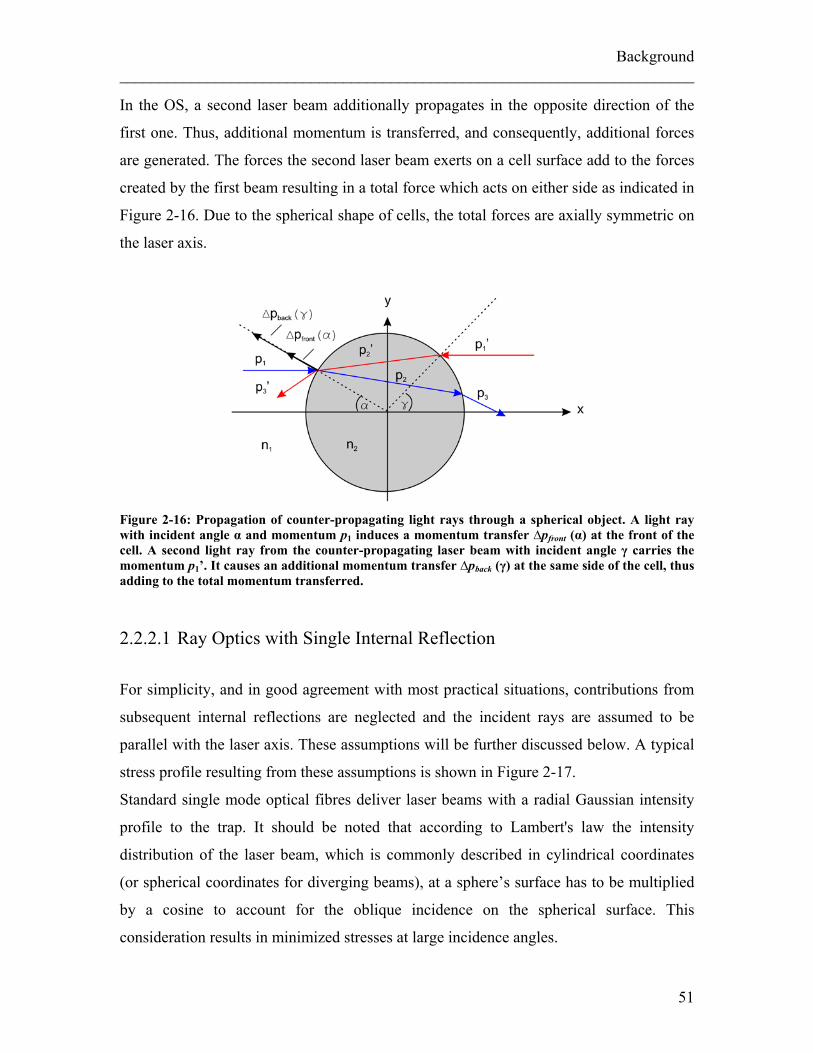
Background ________________________________________________________________________
In the OS, a second laser beam additionally propagates in the opposite direction of the
first one. Thus, additional momentum is transferred, and consequently, additional forces
are generated. The forces the second laser beam exerts on a cell surface add to the forces
created by the first beam resulting in a total force which acts on either side as indicated in
Figure 2-16. Due to the spherical shape of cells, the total forces are axially symmetric on
the laser axis.
Figure 2-16: Propagation of counter-propagating light rays through a spherical object. A light ray with incident angle α and momentum p1 induces a momentum transfer ∆pfront (α) at the front of the cell. A second light ray from the counter-propagating laser beam with incident angle γ carries the momentum p1’. It causes an additional momentum transfer ∆pback (γ) at the same side of the cell, thus adding to the total momentum transferred.
2.2.2.1 Ray Optics with Single Internal Reflection
For simplicity, and in good agreement with most practical situations, contributions from
subsequent internal reflections are neglected and the incident rays are assumed to be
parallel with the laser axis. These assumptions will be further discussed below. A typical
stress profile resulting from these assumptions is shown in Figure 2-17.
Standard single mode optical fibres deliver laser beams with a radial Gaussian intensity
profile to the trap. It should be noted that according to Lambert's law the intensity
distribution of the laser beam, which is commonly described in cylindrical coordinates
(or spherical coordinates for diverging beams), at a sphere’s surface has to be multiplied
by a cosine to account for the oblique incidence on the spherical surface. This
consideration results in minimized stresses at large incidence angles.
51
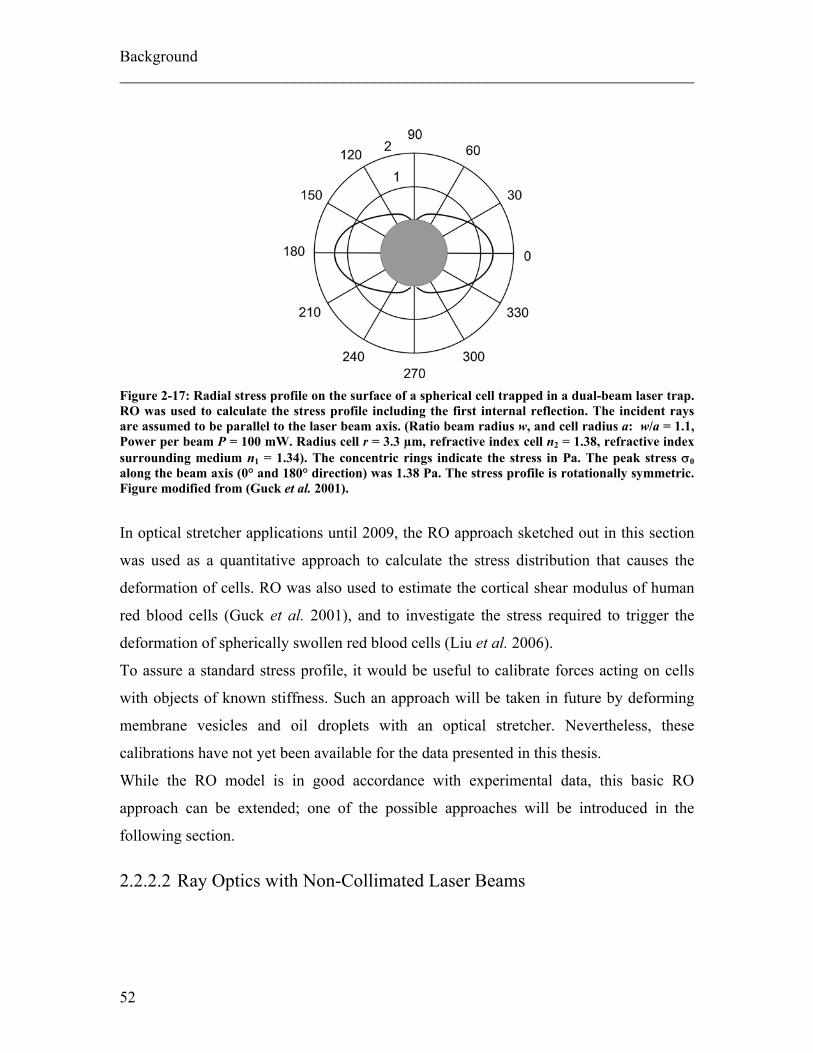
Background ________________________________________________________________________
Figure 2-17: Radial stress profile on the surface of a spherical cell trapped in a dual-beam laser trap. RO was used to calculate the stress profile including the first internal reflection. The incident rays are assumed to be parallel to the laser beam axis. (Ratio beam radius w, and cell radius a: w/a = 1.1, Power per beam P = 100 mW. Radius cell r = 3.3 µm, refractive index cell n2 = 1.38, refractive index surrounding medium n1 = 1.34). The concentric rings indicate the stress in Pa. The peak stress σ0 along the beam axis (0° and 180° direction) was 1.38 Pa. The stress profile is rotationally symmetric. Figure modified from (Guck et al. 2001).
In optical stretcher applications until 2009, the RO approach sketched out in this section
was used as a quantitative approach to calculate the stress distribution that causes the
deformation of cells. RO was also used to estimate the cortical shear modulus of human
red blood cells (Guck et al. 2001), and to investigate the stress required to trigger the
deformation of spherically swollen red blood cells (Liu et al. 2006).
To assure a standard stress profile, it would be useful to calibrate forces acting on cells
with objects of known stiffness. Such an approach will be taken in future by deforming
membrane vesicles and oil droplets with an optical stretcher. Nevertheless, these
calibrations have not yet been available for the data presented in this thesis.
While the RO model is in good accordance with experimental data, this basic RO
approach can be extended; one of the possible approaches will be introduced in the
following section.
2.2.2.2 Ray Optics with Non-Collimated Laser Beams
52
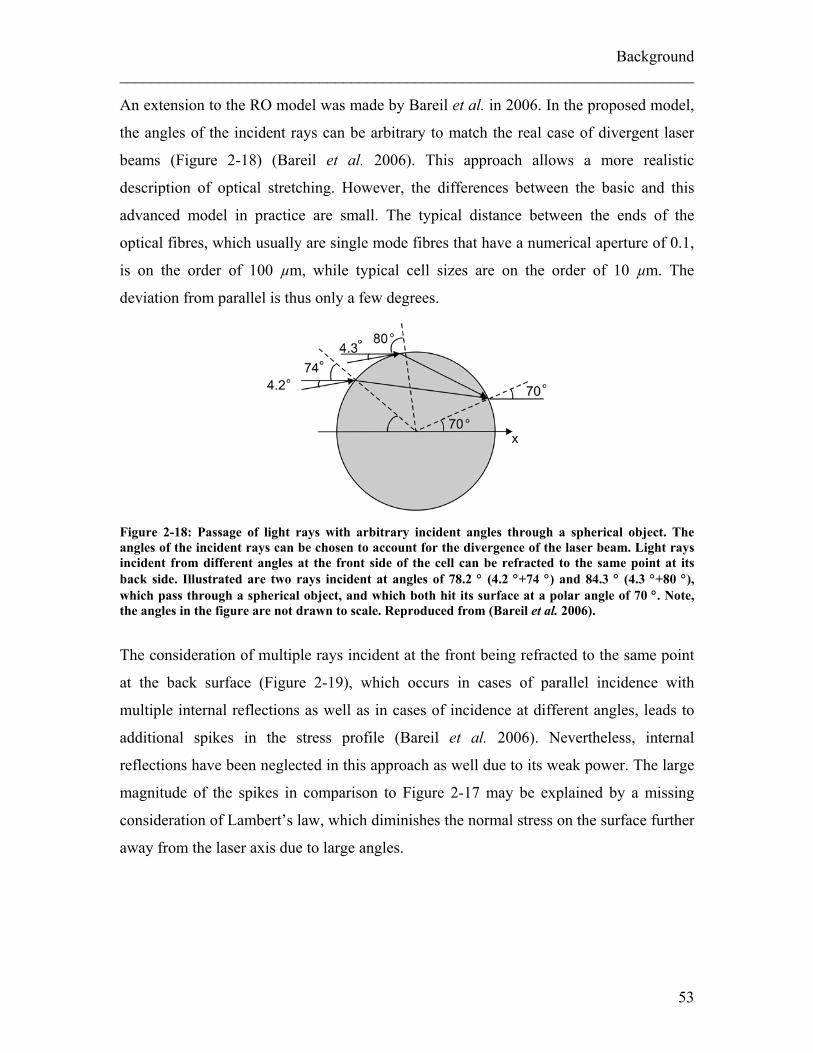
Background ________________________________________________________________________
An extension to the RO model was made by Bareil et al. in 2006. In the proposed model,
the angles of the incident rays can be arbitrary to match the real case of divergent laser
beams (Figure 2-18) (Bareil et al. 2006). This approach allows a more realistic
description of optical stretching. However, the differences between the basic and this
advanced model in practice are small. The typical distance between the ends of the
optical fibres, which usually are single mode fibres that have a numerical aperture of 0.1,
is on the order of 100 µm, while typical cell sizes are on the order of 10 µm. The
deviation from parallel is thus only a few degrees.
Figure 2-18: Passage of light rays with arbitrary incident angles through a spherical object. The angles of the incident rays can be chosen to account for the divergence of the laser beam. Light rays incident from different angles at the front side of the cell can be refracted to the same point at its back side. Illustrated are two rays incident at angles of 78.2 ° (4.2 °+74 °) and 84.3 ° (4.3 °+80 °), which pass through a spherical object, and which both hit its surface at a polar angle of 70 °. Note, the angles in the figure are not drawn to scale. Reproduced from (Bareil et al. 2006).
The consideration of multiple rays incident at the front being refracted to the same point
at the back surface (Figure 2-19), which occurs in cases of parallel incidence with
multiple internal reflections as well as in cases of incidence at different angles, leads to
additional spikes in the stress profile (Bareil et al. 2006). Nevertheless, internal
reflections have been neglected in this approach as well due to its weak power. The large
magnitude of the spikes in comparison to Figure 2-17 may be explained by a missing
consideration of Lambert’s law, which diminishes the normal stress on the surface further
away from the laser axis due to large angles.
53
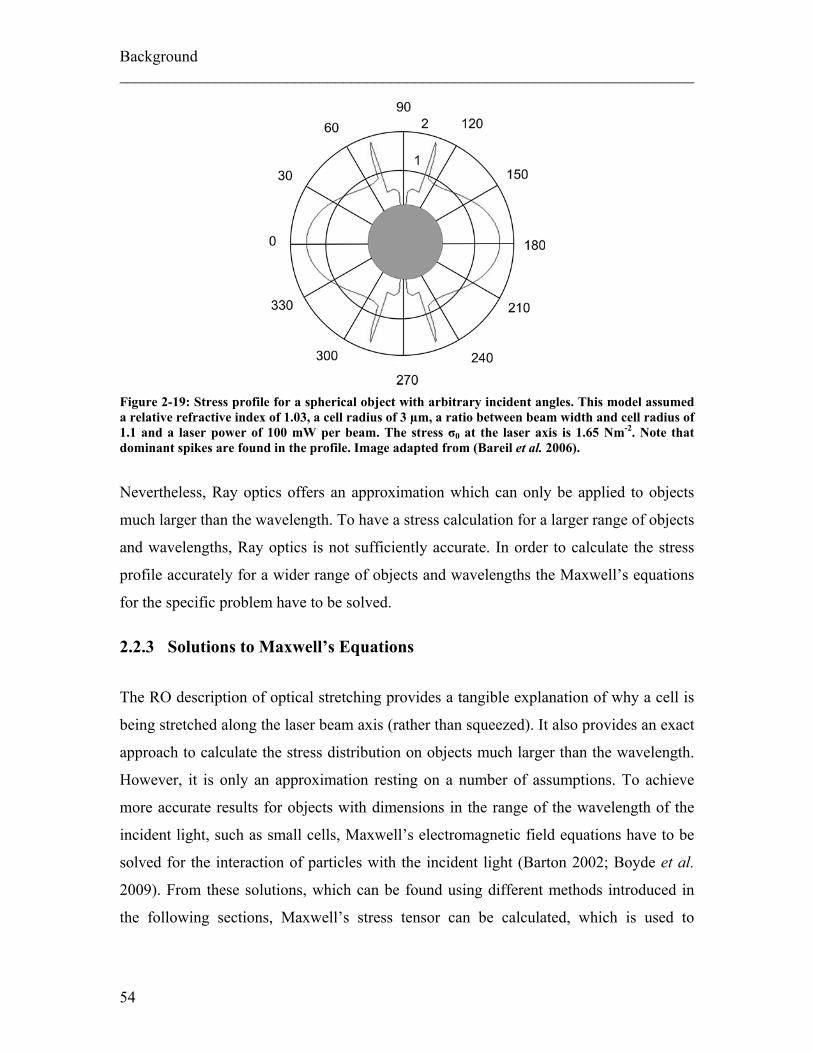
Background ________________________________________________________________________
Figure 2-19: Stress profile for a spherical object with arbitrary incident angles. This model assumed a relative refractive index of 1.03, a cell radius of 3 µm, a ratio between beam width and cell radius of 1.1 and a laser power of 100 mW per beam. The stress σ0 at the laser axis is 1.65 Nm-2. Note that dominant spikes are found in the profile. Image adapted from (Bareil et al. 2006).
Nevertheless, Ray optics offers an approximation which can only be applied to objects
much larger than the wavelength. To have a stress calculation for a larger range of objects
and wavelengths, Ray optics is not sufficiently accurate. In order to calculate the stress
profile accurately for a wider range of objects and wavelengths the Maxwell’s equations
for the specific problem have to be solved.
2.2.3 Solutions to Maxwell’s Equations
The RO description of optical stretching provides a tangible explanation of why a cell is
being stretched along the laser beam axis (rather than squeezed). It also provides an exact
approach to calculate the stress distribution on objects much larger than the wavelength.
However, it is only an approximation resting on a number of assumptions. To achieve
more accurate results for objects with dimensions in the range of the wavelength of the
incident light, such as small cells, Maxwell’s electromagnetic field equations have to be
solved for the interaction of particles with the incident light (Barton 2002; Boyde et al.
2009). From these solutions, which can be found using different methods introduced in
the following sections, Maxwell’s stress tensor can be calculated, which is used to
54
Background ________________________________________________________________________
represent the interaction between electromagnetic forces and mechanical momentum
(Karmaker 1978; Wang et al. 1997), e.g. to calculate the stress acting on a cell.
2.2.3.1 Finite Difference Time Domain (FDTD) The finite difference time domain (FDTD) method (Chu and Chaudhuri 1989; Rasmussen
et al. 1993) allows the accurate computation of stress profiles for arbitrary refractive
index distributions of the scattering particle. FDTD provides a solution to Maxwell’s
equations by discretising them into space and time intervals. Given the initial and
boundary conditions of the problem, the evolution of the electromagnetic fields in space
and time can be computed iteratively. Once this is achieved, it is possible to calculate the
magnetic field at the next instant in time. Repeating this process until converging onto a
stable result yields an exact solution to Maxwell’s equations. In this way the passage of
light through any distribution of electromagnetic properties can be found. Diffraction and
interference effects of light can be taken into account as well as the presence of a cell
nucleus and other organelles (Bohley et al. 2005). A general advantage of the FDTD
approach, which is of minor importance here, is the possibility of solving problems
involving a whole spectrum of wavelengths at once. A disadvantage of this approach,
however, is that every change in the incident beam or changes in the distribution of the
refractive index inside the object, as it might occur during shape changes, requires a new
analysis.
Once the fields are known, Maxwell’s stress tensor T can be determined (Jackson 1999)
and the surface stress σ calculated (Okamoto and Kawata 1999; Yu et al. 2005).
The FDTD method is generally useful for objects with uncommon shapes or refractive
index distributions since this method does not require regular shapes. FTDT has, for
instance, been used to calculate the surface stress acting on biconcave, disk-like red blood
cells in an optical stretcher (Yu et al. 2005).
55
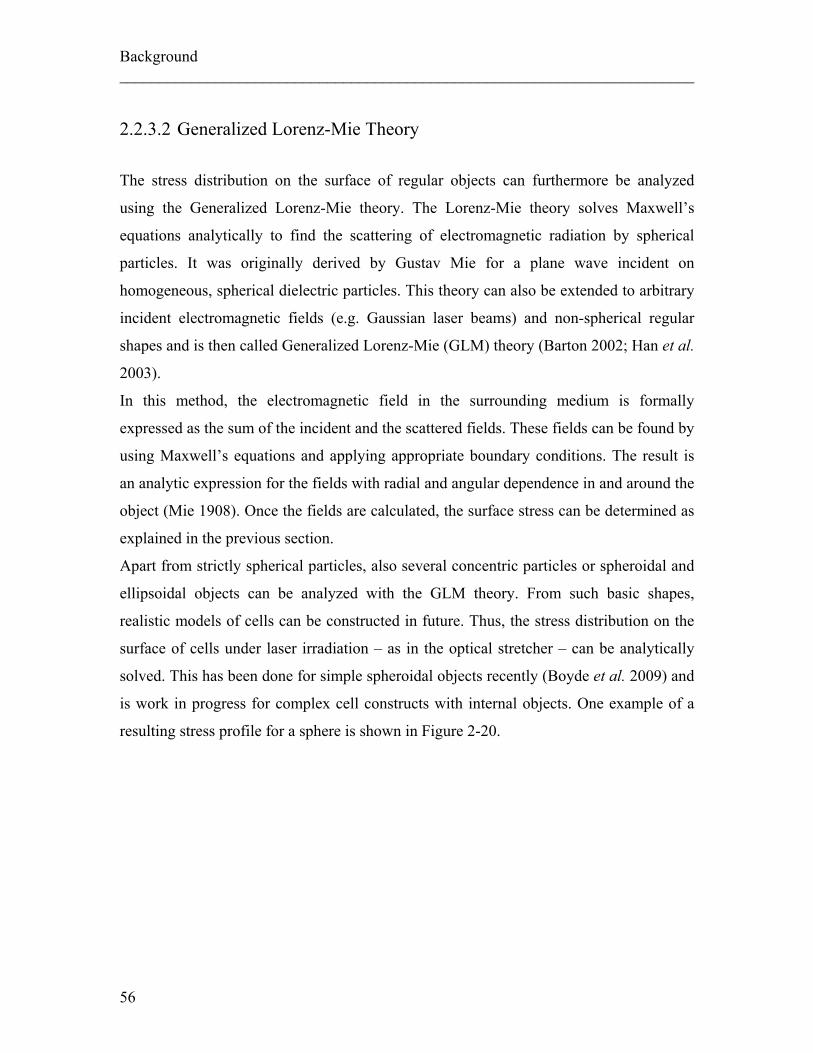
Background ________________________________________________________________________
2.2.3.2 Generalized Lorenz-Mie Theory
The stress distribution on the surface of regular objects can furthermore be analyzed
using the Generalized Lorenz-Mie theory. The Lorenz-Mie theory solves Maxwell’s
equations analytically to find the scattering of electromagnetic radiation by spherical
particles. It was originally derived by Gustav Mie for a plane wave incident on
homogeneous, spherical dielectric particles. This theory can also be extended to arbitrary
incident electromagnetic fields (e.g. Gaussian laser beams) and non-spherical regular
shapes and is then called Generalized Lorenz-Mie (GLM) theory (Barton 2002; Han et al.
2003).
In this method, the electromagnetic field in the surrounding medium is formally
expressed as the sum of the incident and the scattered fields. These fields can be found by
using Maxwell’s equations and applying appropriate boundary conditions. The result is
an analytic expression for the fields with radial and angular dependence in and around the
object (Mie 1908). Once the fields are calculated, the surface stress can be determined as
explained in the previous section.
Apart from strictly spherical particles, also several concentric particles or spheroidal and
ellipsoidal objects can be analyzed with the GLM theory. From such basic shapes,
realistic models of cells can be constructed in future. Thus, the stress distribution on the
surface of cells under laser irradiation – as in the optical stretcher – can be analytically
solved. This has been done for simple spheroidal objects recently (Boyde et al. 2009) and
is work in progress for complex cell constructs with internal objects. One example of a
resulting stress profile for a sphere is shown in Figure 2-20.
56
Background ________________________________________________________________________
Figure 2-20: Optically induced stress profile on spherical objects (object itself not shown in figure) inside a capillary set-up of a microfluidic chamber of an optical stretcher, calculated by Mie theory. For these calculations, the refractive index of the object has been assumed to be n = 1.365, the cell size radius 11 µm, and the distance of the optical fibres from the cell 85 µm. Laser wavelength was λ=1064 nm and applied stretch power was 0.8 W per fibre.
It appears that RO provides a simple and practical description of the magnitude and
distribution of stress on the surface of a cell trapped in an optical stretcher. In situations
where the object cannot be reasonably described by a homogeneous sphere, or it is not
much bigger than the wavelength of the light, the FTDT or GLMT approach offer useful
alternatives. Any of these previously described theories allows the calculation of more or
less accurate stress profiles, which is the prerequisite for the quantitative characterization
of the mechanical properties of cells.
Stresses presented in this work are calculated using the latter of the presented methods,
namely by solving Maxwell’s equations analytically based on Mie theory (Boyde et al.
2009).
2.2.4 Extraction of Mechanical Properties
While the magnitude of the deformation – the ‘deformability’ – of cells in an optical
stretcher at a certain laser power can be directly used to compare different cell
populations with each other (Guck et al. 2000; Lincoln et al. 2004), it is also possible to
quantify cellular mechanical properties. Mechanical material properties can be
characterised by the shear modulus G, which determines a material’s elastic resistance to
shear deformation. In creep experiments, in which a constant stress is applied to a
57
Background ________________________________________________________________________
)
sample, the deformation or relative deformation (strain) is monitored over time and can
be used to extract a cell’s shear modulus.
Lure calculated a general solution to Hooke’s law for an elastic, spherical object and
established a model to describe the radial deformation w(r,θ) following an axi-symmetric
stress (Lure 1964). For a solid, elastic sphere, w is given by
(2.13), ( ) ( )( ) (∑ ⎥⎦⎤
⎢⎣⎡ −++−++=
ncosθnPn1nrnB4v2n1n1nrnAθr,w
where θ is the polar angle, ν Poisson’s ratio, which is a measure of transversal
compression of a material due to its longitudinal elongation, and which is 0.5 for living
cells if volume conservation is assumed during deformation (Mahaffy et al. 2000;
Ananthakrishnan et al. 2005; Lu et al. 2006), and Pn are the Legendre polynomials of
order n, and r the radial coordinate. However, one condition to use this equation is that
the system is in equilibrium, which means if a stress is applied this equation can be used
to calculate the deformation after the equilibrium is reached.
The constants An and Bn in (2.13) can be determined by relating the applied stress σ to
strain of the cell and the shear modulus G using Hooke’s elastic equations in spherical
polar coordinates. Since the applied stress acting on the cell surface can be divided into a
radial component σr and a tangential component σt, this results in the following equations
(Lure 1964):
( )( ) ( )[ ] ( θ∑ −−+−−−+=σ cosnP
nnnnrnBvnnnnrnA
Gr 122221
2) (2.14),
( ) ( )[ ] ( θ∑θ
−−++−+=σ cosnP
n ddnnrnBvnnnrnA
Gt 122122
2) (2.15),
The stress acting on the cell, which is expressed in Legendre polynomials Pn(cos θ) can
now be expressed employing the different methods described in section 2.2.1. For
example, in a simplified version arising from Ray optics, it can be approximated as σ =
σ0* cos2(θ), as it has been done in (Ananthakrishnan et al. 2006). An analytical, far more
complex solution of the stress has been found by Lars Boyde by GLMT (Boyde et al.
2009). In optical stretcher experiments, the stress is exerted on the surface of a cell under
the assumption that a cell is a homogenous sphere and that the stress in the tangential
58
Background ________________________________________________________________________
direction, σt, is zero at the surface, e.g. the induced stress is always normal to the surface
and has thus no tangential component (Ananthakrishnan et al. 2006).
Using (2.14) and (2.15) results in a solvable system of 2n equations with 2n constants (An
and Bn). Once determined, these constants can be inserted in equation (2.13) and yield a
relation between the radial deformation w and the magnitude of the peak stress σ0 at the
surface of the cell (Ananthakrishnan et al. 2006):
( )γ=
θσ=
G
v,,rGF
rw 0
0 (2.16),
where FG is a geometric factor that takes the shape of the cell into account. In the
following, the relative deformation w/r0 will be denoted as γ for conciseness. Since
images taken during an experiment reveal the cross section of a cell, the radial
deformation w can be directly determined by subtracting the radius of the cell before and
during stretching (Figure 2-21) and γ can be calculated as
0
000
0 222
rr)rr(
rr −Δ+=
Δ=γ (2.17).
Thus, the elastic shear modulus G can be extracted under the assumption that a cell is a
homogenous, elastic sphere in equilibrium. Since living cells are not exactly homogenous
spheres, this should be called the apparent elastic shear modulus. The validation of (2.16)
which was calculated for a purely elastic system, in a viscoelastic system is given through
the elastic-viscoelastic correspondence principle (Lakes 1998).
However, these equations do only apply to a system in equilibrium which is not the case
during actual stretching of a cell. It is therefore not simply possible to link a time
dependant deformation γ(t) as one obtains during stretcher experiments to the shear
modulus G itself. Nevertheless, the factor FG * σ0 is a factor linking the relative
deformation γ to the shear modulus G and can be used to calibrate the time dependent
deformation γ(t) in order to take cell shape and stress distribution into account. This
factor FG * σ0 is further renamed global geometrical factor GGF.
59
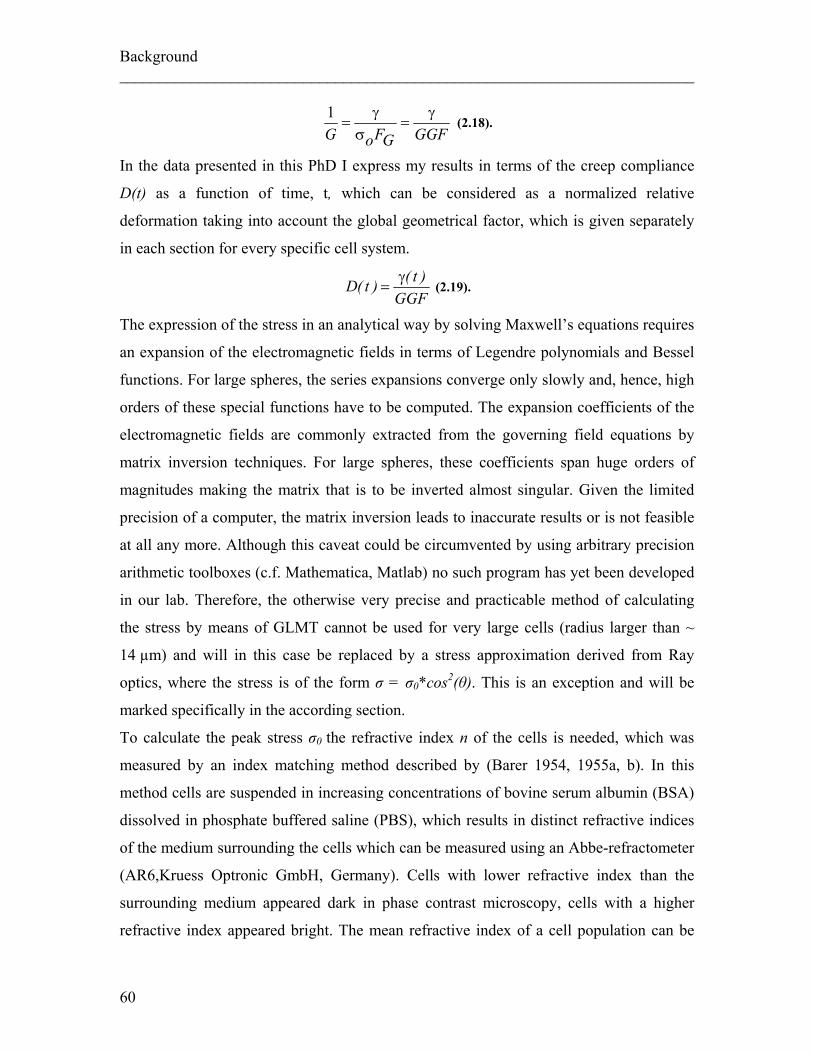
Background ________________________________________________________________________
GGFGFoGγ
=σγ
=1 (2.18).
In the data presented in this PhD I express my results in terms of the creep compliance
D(t) as a function of time, t, which can be considered as a normalized relative
deformation taking into account the global geometrical factor, which is given separately
in each section for every specific cell system.
GGF)t()t(D γ
= (2.19).
The expression of the stress in an analytical way by solving Maxwell’s equations requires
an expansion of the electromagnetic fields in terms of Legendre polynomials and Bessel
functions. For large spheres, the series expansions converge only slowly and, hence, high
orders of these special functions have to be computed. The expansion coefficients of the
electromagnetic fields are commonly extracted from the governing field equations by
matrix inversion techniques. For large spheres, these coefficients span huge orders of
magnitudes making the matrix that is to be inverted almost singular. Given the limited
precision of a computer, the matrix inversion leads to inaccurate results or is not feasible
at all any more. Although this caveat could be circumvented by using arbitrary precision
arithmetic toolboxes (c.f. Mathematica, Matlab) no such program has yet been developed
in our lab. Therefore, the otherwise very precise and practicable method of calculating
the stress by means of GLMT cannot be used for very large cells (radius larger than ~
14 µm) and will in this case be replaced by a stress approximation derived from Ray
optics, where the stress is of the form σ = σ0*cos2(θ). This is an exception and will be
marked specifically in the according section.
To calculate the peak stress σ0 the refractive index n of the cells is needed, which was
measured by an index matching method described by (Barer 1954, 1955a, b). In this
method cells are suspended in increasing concentrations of bovine serum albumin (BSA)
dissolved in phosphate buffered saline (PBS), which results in distinct refractive indices
of the medium surrounding the cells which can be measured using an Abbe-refractometer
(AR6,Kruess Optronic GmbH, Germany). Cells with lower refractive index than the
surrounding medium appeared dark in phase contrast microscopy, cells with a higher
refractive index appeared bright. The mean refractive index of a cell population can be
60
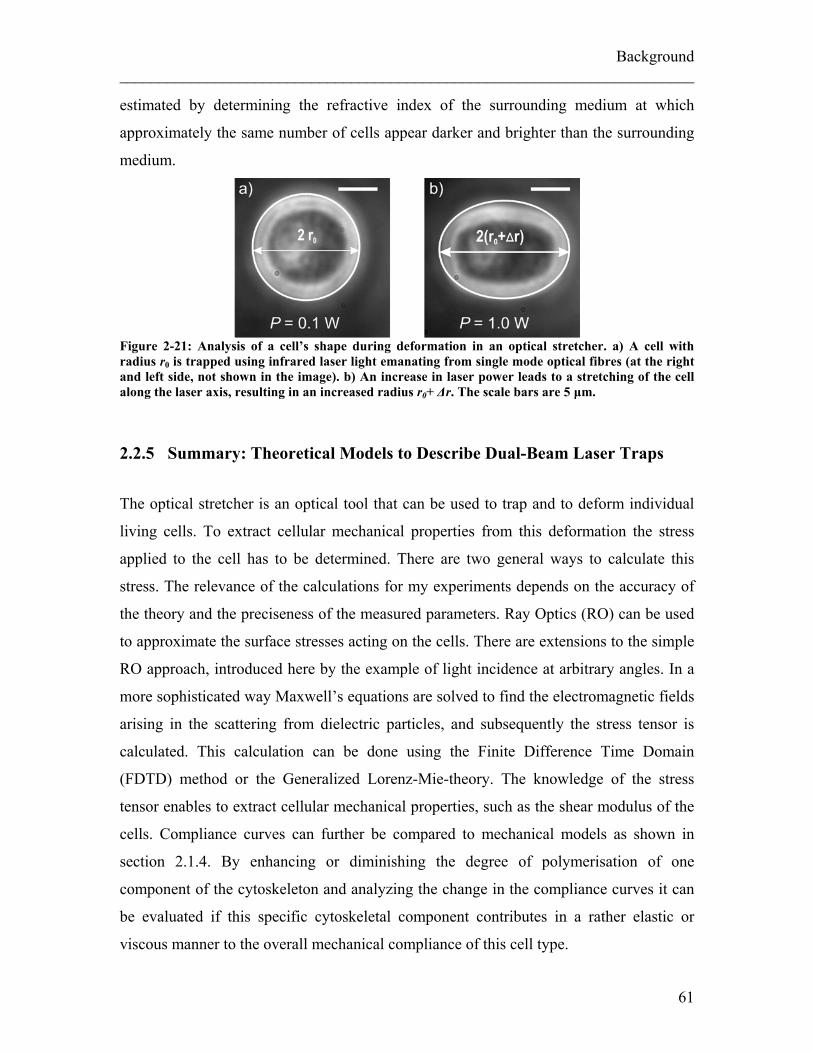
Background ________________________________________________________________________
estimated by determining the refractive index of the surrounding medium at which
approximately the same number of cells appear darker and brighter than the surrounding
medium.
Figure 2-21: Analysis of a cell’s shape during deformation in an optical stretcher. a) A cell with radius r0 is trapped using infrared laser light emanating from single mode optical fibres (at the right and left side, not shown in the image). b) An increase in laser power leads to a stretching of the cell along the laser axis, resulting in an increased radius r0+ Δr. The scale bars are 5 μm.
2.2.5 Summary: Theoretical Models to Describe Dual-Beam Laser Traps
The optical stretcher is an optical tool that can be used to trap and to deform individual
living cells. To extract cellular mechanical properties from this deformation the stress
applied to the cell has to be determined. There are two general ways to calculate this
stress. The relevance of the calculations for my experiments depends on the accuracy of
the theory and the preciseness of the measured parameters. Ray Optics (RO) can be used
to approximate the surface stresses acting on the cells. There are extensions to the simple
RO approach, introduced here by the example of light incidence at arbitrary angles. In a
more sophisticated way Maxwell’s equations are solved to find the electromagnetic fields
arising in the scattering from dielectric particles, and subsequently the stress tensor is
calculated. This calculation can be done using the Finite Difference Time Domain
(FDTD) method or the Generalized Lorenz-Mie-theory. The knowledge of the stress
tensor enables to extract cellular mechanical properties, such as the shear modulus of the
cells. Compliance curves can further be compared to mechanical models as shown in
section 2.1.4. By enhancing or diminishing the degree of polymerisation of one
component of the cytoskeleton and analyzing the change in the compliance curves it can
be evaluated if this specific cytoskeletal component contributes in a rather elastic or
viscous manner to the overall mechanical compliance of this cell type.
61
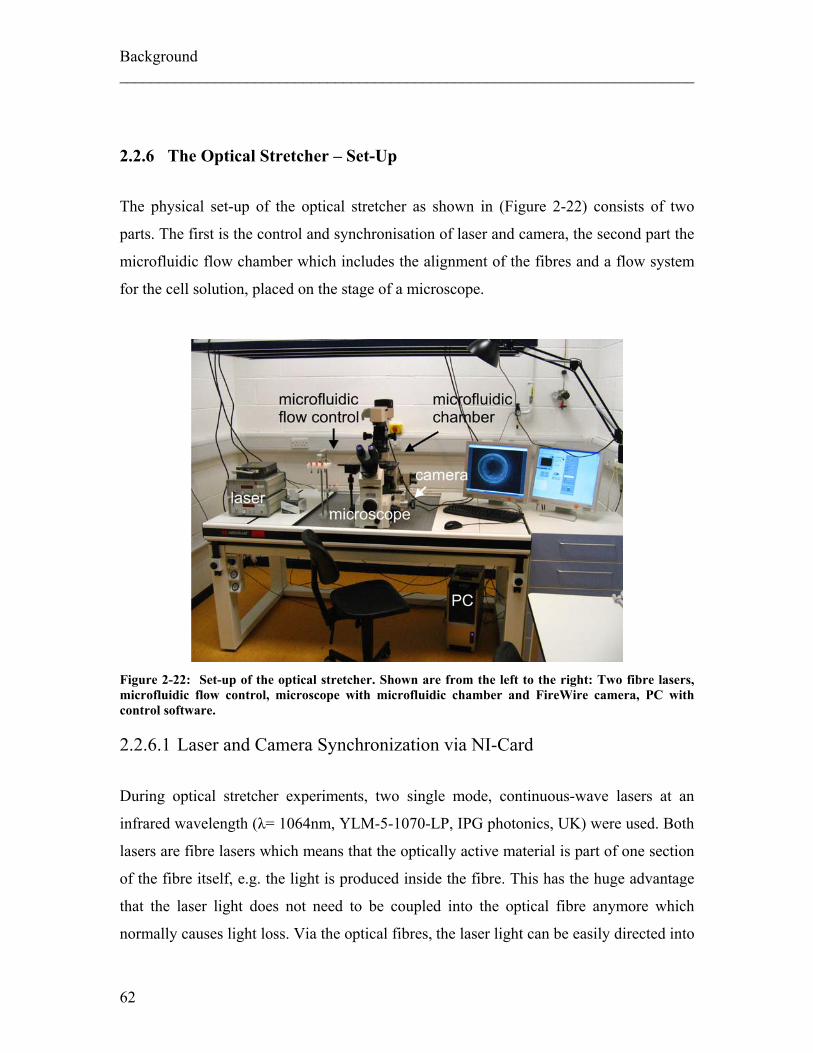
Background ________________________________________________________________________
2.2.6 The Optical Stretcher – Set-Up
The physical set-up of the optical stretcher as shown in (Figure 2-22) consists of two
parts. The first is the control and synchronisation of laser and camera, the second part the
microfluidic flow chamber which includes the alignment of the fibres and a flow system
for the cell solution, placed on the stage of a microscope.
Figure 2-22: Set-up of the optical stretcher. Shown are from the left to the right: Two fibre lasers, microfluidic flow control, microscope with microfluidic chamber and FireWire camera, PC with control software.
2.2.6.1 Laser and Camera Synchronization via NI-Card
During optical stretcher experiments, two single mode, continuous-wave lasers at an
infrared wavelength (λ= 1064nm, YLM-5-1070-LP, IPG photonics, UK) were used. Both
lasers are fibre lasers which means that the optically active material is part of one section
of the fibre itself, e.g. the light is produced inside the fibre. This has the huge advantage
that the laser light does not need to be coupled into the optical fibre anymore which
normally causes light loss. Via the optical fibres, the laser light can be easily directed into
62
Background ________________________________________________________________________
the microfluidic chamber of an optical stretcher. Both lasers are controlled digitally by a
National Instruments data acquisition controller. Cells are inserted into a capillary
perpendicular to the optical trap by microfluidic tubing. The assembly and exact
alignment of the optical fibres to the microfluidic capillary is crucial for a successful
stretching and will be explained in detail later in this chapter. Mechanical creep
compliance measurements are carried out by applying a step stress to the cells, which
means cells are trapped at low stress for a defined trapping time, stretched at high stress
for a specific stretching time and are observed for another time period on trapping stress
again. To determine the response of the cells to this stress, it is crucial to know exactly
when the high stretching stress starts and stops. Therefore, laser and camera need to be
synchronized and the storage of pictures taken during the exact period of trapping and
stretching need to assured. In the work presented in this thesis, a digitally controlled laser
and a FireWire camera have been used to carry out synchronization.
The laser driver can be controlled by a serial RS-232 control or by a direct, digital TTL
modulation of the output power. Practical differences are mainly the information speed.
Serial connections do actually send bits of text characters along a physical channel, which
is much slower than operating only with a binary code, as done in digital transfer. That is
the reason why it takes about 0.5 s to switch the laser from 0 W to 1 W when controlling
the laser by RS-232. Since I want to measure the creep compliance of cells, the step stress
applied should be as close to an instantaneous increase of stress as possible. In addition,
the starting signal has to be controlled by a computer program and can be delayed by
other actions taken by the computer’s processor. A better alternative is a Transistor-
Transistor-Logic (TTL) - control of the amplitude of the power of the laser via an
optional DB-15 connector, which controls the current of the laser diode directly. This
connection is quicker and much better suited for OS experiments. The control and
reference signal of the DB-15 connector were connected to a national instrument box
(NI-USB-6229, National Instruments, UK) through a custom made cable.
The camera used for the set-up was a FireWire camera (AVT MARLIN F-146B,
Firstsight Vision, UK). The frames are taken and transferred to a PC via FireWire
connection. In addition, the image capturing sequence can be used as external clock to
trigger the laser as pictured in Figure 2-23.
63
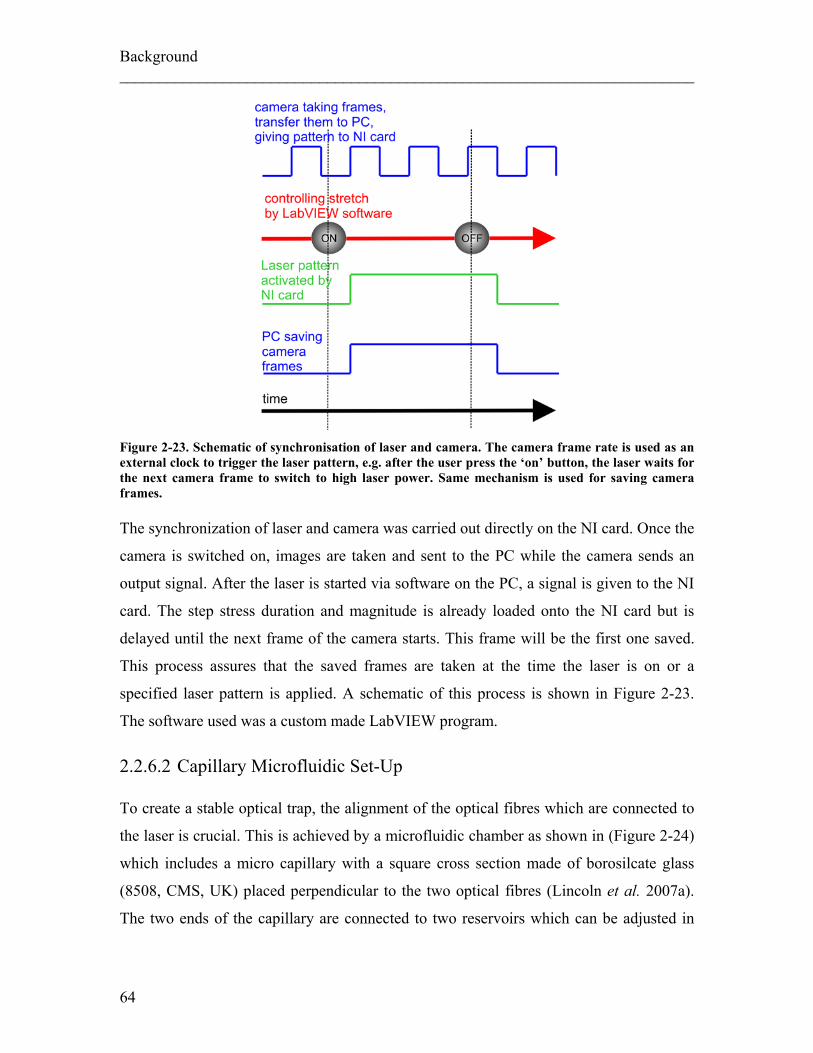
Background ________________________________________________________________________
Figure 2-23. Schematic of synchronisation of laser and camera. The camera frame rate is used as an external clock to trigger the laser pattern, e.g. after the user press the ‘on’ button, the laser waits for the next camera frame to switch to high laser power. Same mechanism is used for saving camera frames. The synchronization of laser and camera was carried out directly on the NI card. Once the
camera is switched on, images are taken and sent to the PC while the camera sends an
output signal. After the laser is started via software on the PC, a signal is given to the NI
card. The step stress duration and magnitude is already loaded onto the NI card but is
delayed until the next frame of the camera starts. This frame will be the first one saved.
This process assures that the saved frames are taken at the time the laser is on or a
specified laser pattern is applied. A schematic of this process is shown in Figure 2-23.
The software used was a custom made LabVIEW program.
2.2.6.2 Capillary Microfluidic Set-Up To create a stable optical trap, the alignment of the optical fibres which are connected to
the laser is crucial. This is achieved by a microfluidic chamber as shown in (Figure 2-24)
which includes a micro capillary with a square cross section made of borosilcate glass
(8508, CMS, UK) placed perpendicular to the two optical fibres (Lincoln et al. 2007a).
The two ends of the capillary are connected to two reservoirs which can be adjusted in
64
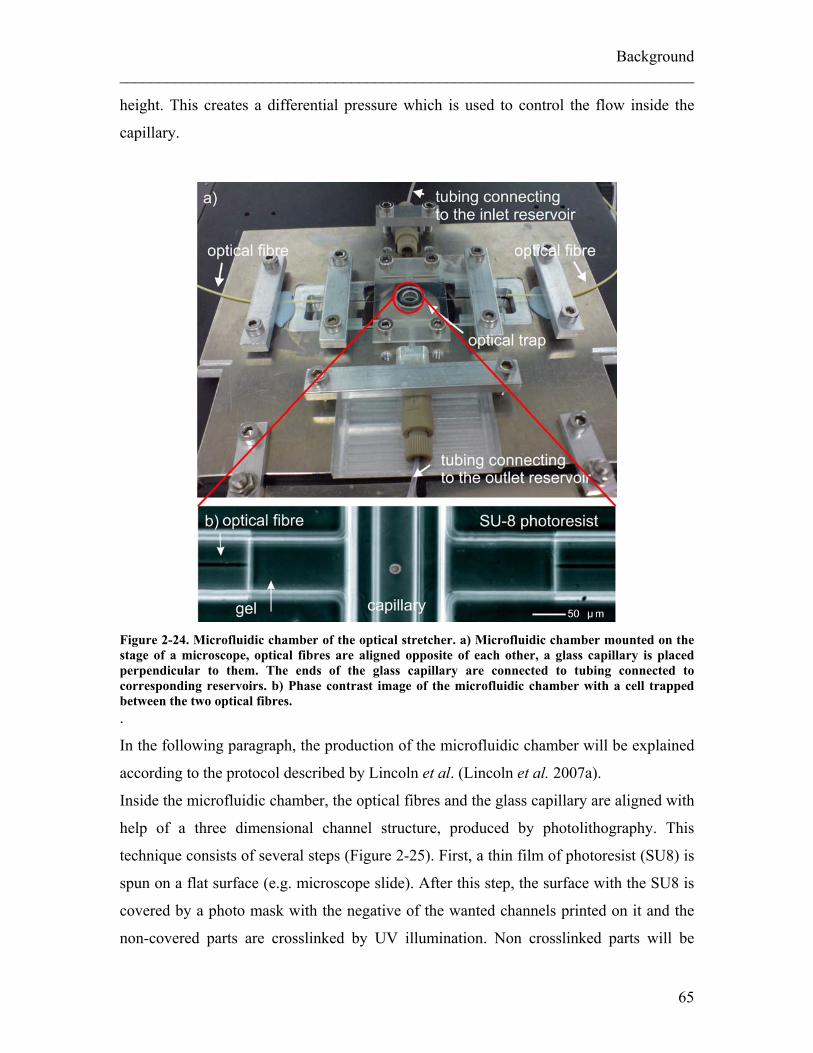
Background ________________________________________________________________________
height. This creates a differential pressure which is used to control the flow inside the
capillary.
Figure 2-24. Microfluidic chamber of the optical stretcher. a) Microfluidic chamber mounted on the stage of a microscope, optical fibres are aligned opposite of each other, a glass capillary is placed perpendicular to them. The ends of the glass capillary are connected to tubing connected to corresponding reservoirs. b) Phase contrast image of the microfluidic chamber with a cell trapped between the two optical fibres. .
In the following paragraph, the production of the microfluidic chamber will be explained
according to the protocol described by Lincoln et al. (Lincoln et al. 2007a).
Inside the microfluidic chamber, the optical fibres and the glass capillary are aligned with
help of a three dimensional channel structure, produced by photolithography. This
technique consists of several steps (Figure 2-25). First, a thin film of photoresist (SU8) is
spun on a flat surface (e.g. microscope slide). After this step, the surface with the SU8 is
covered by a photo mask with the negative of the wanted channels printed on it and the
non-covered parts are crosslinked by UV illumination. Non crosslinked parts will be
65
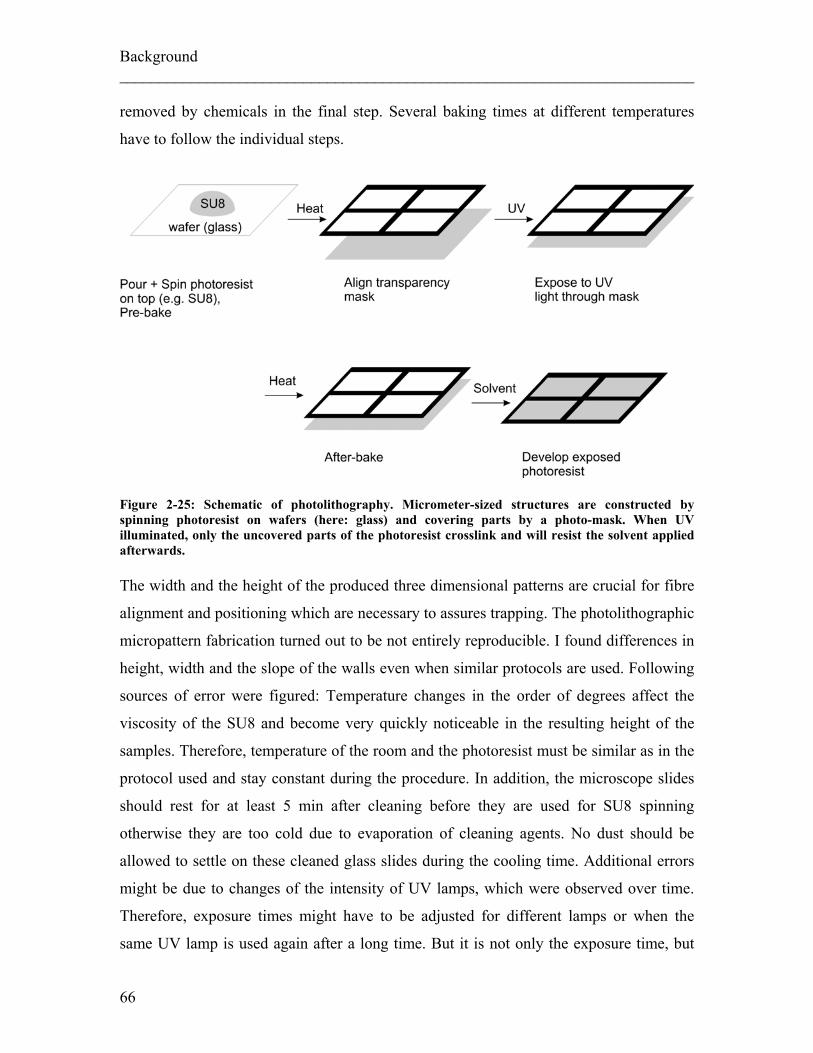
Background ________________________________________________________________________ removed by chemicals in the final step. Several baking times at different temperatures
have to follow the individual steps.
Figure 2-25: Schematic of photolithography. Micrometer-sized structures are constructed by spinning photoresist on wafers (here: glass) and covering parts by a photo-mask. When UV illuminated, only the uncovered parts of the photoresist crosslink and will resist the solvent applied afterwards. The width and the height of the produced three dimensional patterns are crucial for fibre
alignment and positioning which are necessary to assures trapping. The photolithographic
micropattern fabrication turned out to be not entirely reproducible. I found differences in
height, width and the slope of the walls even when similar protocols are used. Following
sources of error were figured: Temperature changes in the order of degrees affect the
viscosity of the SU8 and become very quickly noticeable in the resulting height of the
samples. Therefore, temperature of the room and the photoresist must be similar as in the
protocol used and stay constant during the procedure. In addition, the microscope slides
should rest for at least 5 min after cleaning before they are used for SU8 spinning
otherwise they are too cold due to evaporation of cleaning agents. No dust should be
allowed to settle on these cleaned glass slides during the cooling time. Additional errors
might be due to changes of the intensity of UV lamps, which were observed over time.
Therefore, exposure times might have to be adjusted for different lamps or when the
same UV lamp is used again after a long time. But it is not only the exposure time, but
66
Background ________________________________________________________________________
also the way how the UV light is applied which can be crucial for good dimension
results. High UV intensity can change the optical properties of the undeveloped SU8
which can block UV light and causes inclined channel walls. Results can improve by
breaking the exposure time into several shorter times with intervals in between. In order
to get exact channel widths, the sample should also be baked directly after the exposure.
Too much time (in the order of tens of minutes) between exposure and baking results in a
slight flow of exposed SU8 which results in uncontrolled channel widths. Finally,
channel size should be checked after final development. This can be done by a
profilometer, a device which measures the profile of a surface by pulling a fine needle
across it. The protocol which worked best for me is given in the Appendix, but might
need to be adjusted according to the issues mentioned in the text above.
The SU8 pattern is used to align the optical fibres, which are connected to the lasers,
perpendicularly to a glass capillary with squared cross-section. Index matching gel is
used to bridge the space between the end of the optical fibres and the glass capillary.
Once the two fibres and the glass capillary are in the right position, they are clamped
down using a combination of home-made pieces of soft rubber-like material such as
Polydimethylsiloxane (PDMS) and a harder, thermo plastic called Poly(methyl
methacrylate) (PMMA) to keep them in place during experiments (Lincoln et al. 2007a).
The ends of the glass capillary were connected to microfluidic tubing (FEP tubing,
Postnova Analytics GmbH) via graphite ferrules to seal this connection (Supeltex™ M-4
Capillary Ferrule, Sigma). The ends of the microfluidic tubing were inserted in respective
reservoirs and flow inside the capillary was controlled by hydrosdtatic pressure. Cells
were inserted into the system using a 4-Port-switching valve purchased from Postnova
Analytics GmbH.
In early measurements presented in this work the optical fibres have been relatively far
away from the glass capillary walls, typically about 150 µm, to guarantee that the beam
in the trapping region of the cell has a diameter large enough to cover even larger cells
totally. This is necessary because it is known theoretically and experimentally that a
stable trap condition in a two beam laser trap for spheres larger than the beam diameters
is only stable outside of the plane where the cross-section of both beam diameters are
equal (Roosen 1977). Nevertheless, such an arrangement is not symmetrical and is not
67
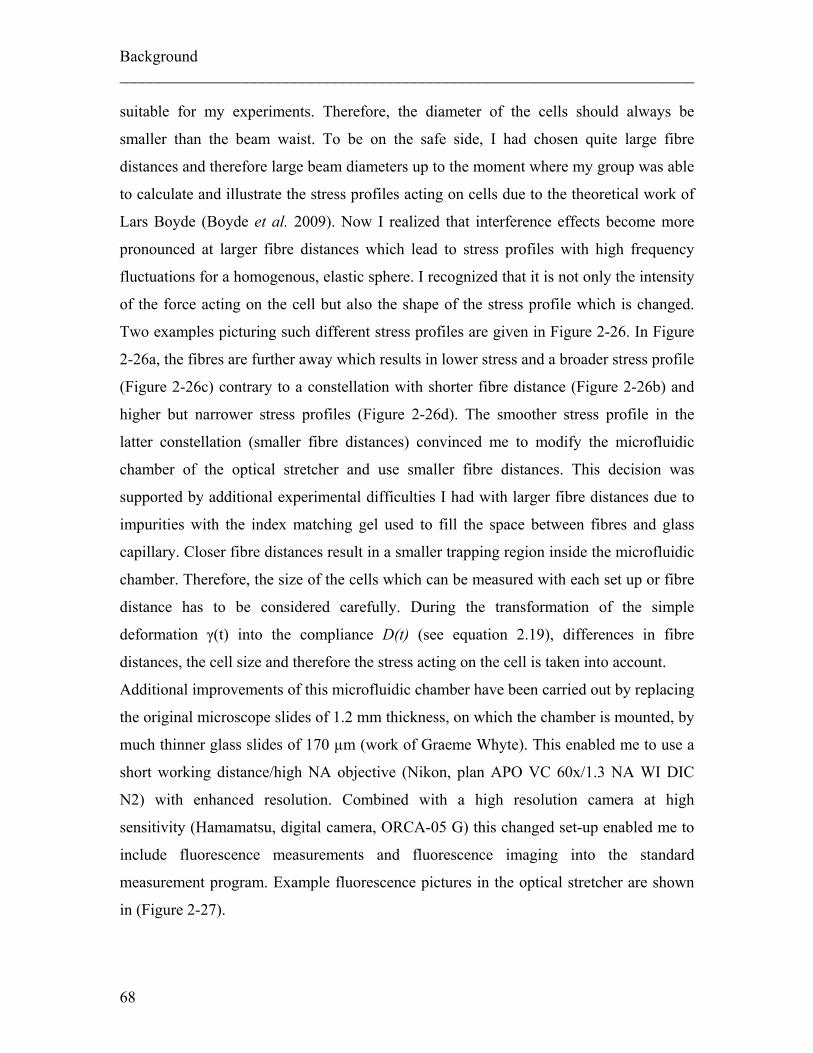
Background ________________________________________________________________________ suitable for my experiments. Therefore, the diameter of the cells should always be
smaller than the beam waist. To be on the safe side, I had chosen quite large fibre
distances and therefore large beam diameters up to the moment where my group was able
to calculate and illustrate the stress profiles acting on cells due to the theoretical work of
Lars Boyde (Boyde et al. 2009). Now I realized that interference effects become more
pronounced at larger fibre distances which lead to stress profiles with high frequency
fluctuations for a homogenous, elastic sphere. I recognized that it is not only the intensity
of the force acting on the cell but also the shape of the stress profile which is changed.
Two examples picturing such different stress profiles are given in Figure 2-26. In Figure
2-26a, the fibres are further away which results in lower stress and a broader stress profile
(Figure 2-26c) contrary to a constellation with shorter fibre distance (Figure 2-26b) and
higher but narrower stress profiles (Figure 2-26d). The smoother stress profile in the
latter constellation (smaller fibre distances) convinced me to modify the microfluidic
chamber of the optical stretcher and use smaller fibre distances. This decision was
supported by additional experimental difficulties I had with larger fibre distances due to
impurities with the index matching gel used to fill the space between fibres and glass
capillary. Closer fibre distances result in a smaller trapping region inside the microfluidic
chamber. Therefore, the size of the cells which can be measured with each set up or fibre
distance has to be considered carefully. During the transformation of the simple
deformation γ(t) into the compliance D(t) (see equation 2.19), differences in fibre
distances, the cell size and therefore the stress acting on the cell is taken into account.
Additional improvements of this microfluidic chamber have been carried out by replacing
the original microscope slides of 1.2 mm thickness, on which the chamber is mounted, by
much thinner glass slides of 170 µm (work of Graeme Whyte). This enabled me to use a
short working distance/high NA objective (Nikon, plan APO VC 60x/1.3 NA WI DIC
N2) with enhanced resolution. Combined with a high resolution camera at high
sensitivity (Hamamatsu, digital camera, ORCA-05 G) this changed set-up enabled me to
include fluorescence measurements and fluorescence imaging into the standard
measurement program. Example fluorescence pictures in the optical stretcher are shown
in (Figure 2-27).
68
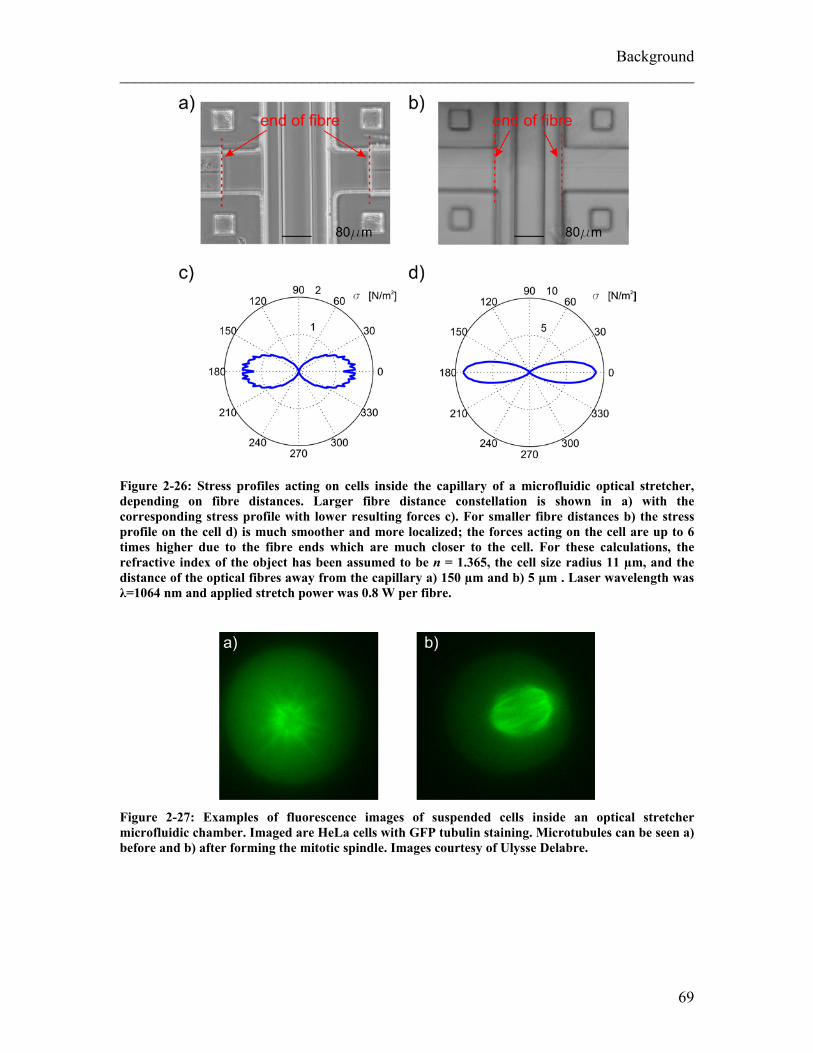
Background ________________________________________________________________________
Figure 2-26: Stress profiles acting on cells inside the capillary of a microfluidic optical stretcher, depending on fibre distances. Larger fibre distance constellation is shown in a) with the corresponding stress profile with lower resulting forces c). For smaller fibre distances b) the stress profile on the cell d) is much smoother and more localized; the forces acting on the cell are up to 6 times higher due to the fibre ends which are much closer to the cell. For these calculations, the refractive index of the object has been assumed to be n = 1.365, the cell size radius 11 µm, and the distance of the optical fibres away from the capillary a) 150 µm and b) 5 µm . Laser wavelength was λ=1064 nm and applied stretch power was 0.8 W per fibre.
Figure 2-27: Examples of fluorescence images of suspended cells inside an optical stretcher microfluidic chamber. Imaged are HeLa cells with GFP tubulin staining. Microtubules can be seen a) before and b) after forming the mitotic spindle. Images courtesy of Ulysse Delabre.
69
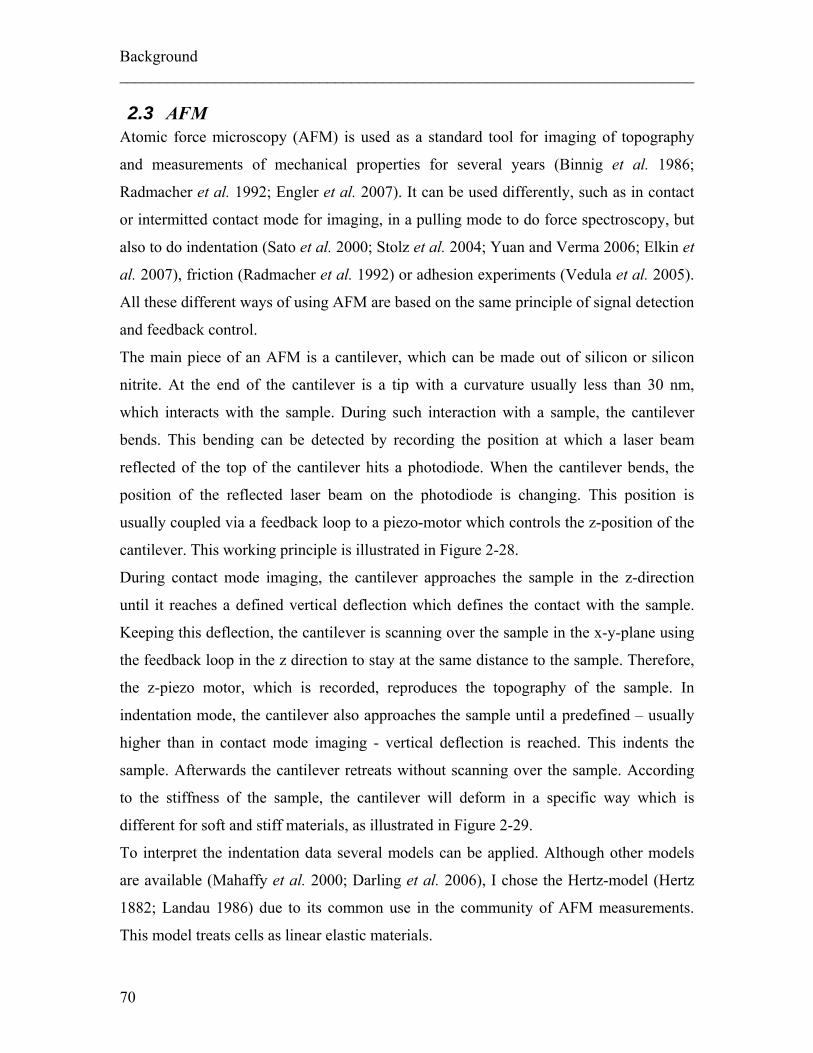
Background ________________________________________________________________________ 2.3 AFM
Atomic force microscopy (AFM) is used as a standard tool for imaging of topography
and measurements of mechanical properties for several years (Binnig et al. 1986;
Radmacher et al. 1992; Engler et al. 2007). It can be used differently, such as in contact
or intermitted contact mode for imaging, in a pulling mode to do force spectroscopy, but
also to do indentation (Sato et al. 2000; Stolz et al. 2004; Yuan and Verma 2006; Elkin et
al. 2007), friction (Radmacher et al. 1992) or adhesion experiments (Vedula et al. 2005).
All these different ways of using AFM are based on the same principle of signal detection
and feedback control.
The main piece of an AFM is a cantilever, which can be made out of silicon or silicon
nitrite. At the end of the cantilever is a tip with a curvature usually less than 30 nm,
which interacts with the sample. During such interaction with a sample, the cantilever
bends. This bending can be detected by recording the position at which a laser beam
reflected of the top of the cantilever hits a photodiode. When the cantilever bends, the
position of the reflected laser beam on the photodiode is changing. This position is
usually coupled via a feedback loop to a piezo-motor which controls the z-position of the
cantilever. This working principle is illustrated in Figure 2-28.
During contact mode imaging, the cantilever approaches the sample in the z-direction
until it reaches a defined vertical deflection which defines the contact with the sample.
Keeping this deflection, the cantilever is scanning over the sample in the x-y-plane using
the feedback loop in the z direction to stay at the same distance to the sample. Therefore,
the z-piezo motor, which is recorded, reproduces the topography of the sample. In
indentation mode, the cantilever also approaches the sample until a predefined – usually
higher than in contact mode imaging - vertical deflection is reached. This indents the
sample. Afterwards the cantilever retreats without scanning over the sample. According
to the stiffness of the sample, the cantilever will deform in a specific way which is
different for soft and stiff materials, as illustrated in Figure 2-29.
To interpret the indentation data several models can be applied. Although other models
are available (Mahaffy et al. 2000; Darling et al. 2006), I chose the Hertz-model (Hertz
1882; Landau 1986) due to its common use in the community of AFM measurements.
This model treats cells as linear elastic materials.
70
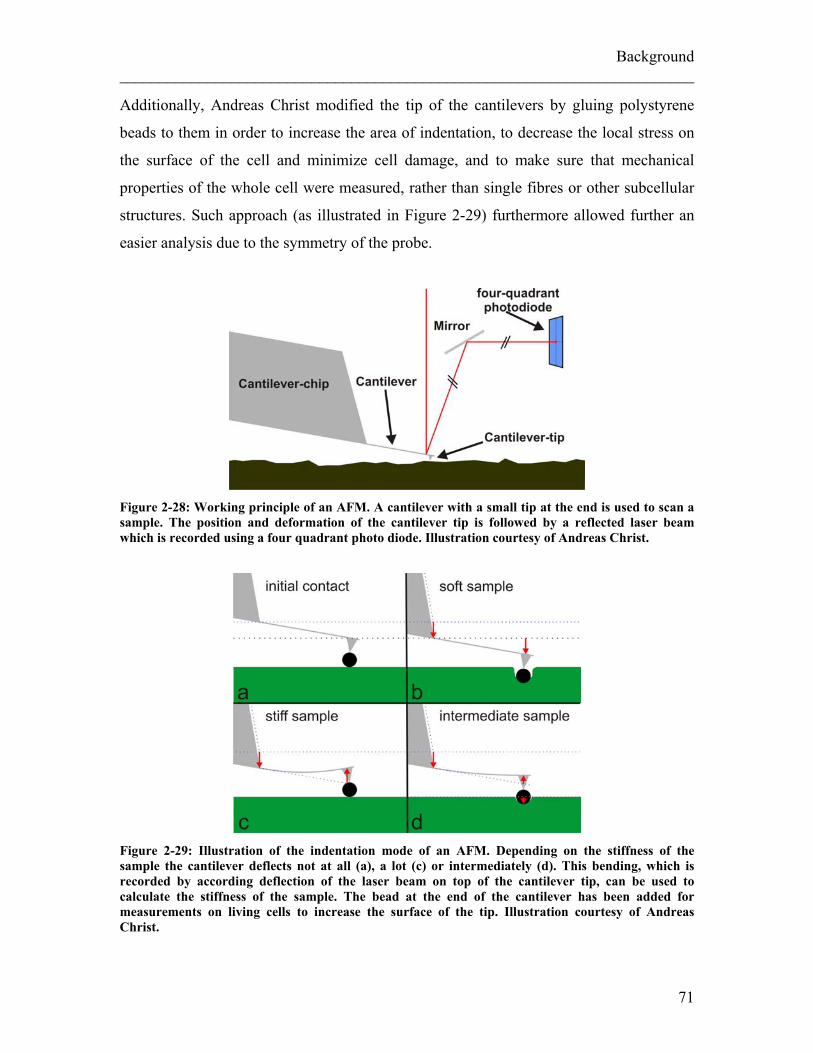
Background ________________________________________________________________________
Additionally, Andreas Christ modified the tip of the cantilevers by gluing polystyrene
beads to them in order to increase the area of indentation, to decrease the local stress on
the surface of the cell and minimize cell damage, and to make sure that mechanical
properties of the whole cell were measured, rather than single fibres or other subcellular
structures. Such approach (as illustrated in Figure 2-29) furthermore allowed further an
easier analysis due to the symmetry of the probe.
Figure 2-28: Working principle of an AFM. A cantilever with a small tip at the end is used to scan a sample. The position and deformation of the cantilever tip is followed by a reflected laser beam which is recorded using a four quadrant photo diode. Illustration courtesy of Andreas Christ.
Figure 2-29: Illustration of the indentation mode of an AFM. Depending on the stiffness of the sample the cantilever deflects not at all (a), a lot (c) or intermediately (d). This bending, which is recorded by according deflection of the laser beam on top of the cantilever tip, can be used to calculate the stiffness of the sample. The bead at the end of the cantilever has been added for measurements on living cells to increase the surface of the tip. Illustration courtesy of Andreas Christ.
71

Background ________________________________________________________________________
72
The Influence of Cell Differentiation on Cell Compliance ________________________________________________________________________
3. The Influence of Cell Differentiation on Cell Compliance 3.1 Differentiation of Neutrophil Precursor Cells. ................................................. 76
3.1.1 Experimental details.......................................................................................... 77 3.1.2 Results ............................................................................................................... 78 3.1.3 Discussion ......................................................................................................... 81
3.2 Differentiation of Mesenchymal Stem Cells. .................................................... 83 3.2.1 Experimental details.......................................................................................... 84 3.2.2 Results ............................................................................................................... 85 3.2.3 Discussion ......................................................................................................... 87
3.3 Differentiation of Embryonic Stem Cells .......................................................... 89 3.3.1 Experimental details.......................................................................................... 92 3.3.2 Results ............................................................................................................... 96 3.3.3 Discussion ....................................................................................................... 101
3.4 .................. 103 Summary Influence of Cell Differentiation on Cell Compliance During the course of this thesis one aim was to link cellular function to mechanical
properties of cells. It has been shown before that cancerous cells have different
mechanical properties than normal cells, e.g. cancerous cells have been shown to be more
compliant than normal cells (Guck et al. 2005; Cross et al. 2007; Remmerbach et al.
2009). During the process of a healthy cell with a specific function becoming cancerous,
it changes from a mortal to an immortal status where it continuously replicates (e.g.
(Carnero and Lleonart 2010; Zhao et al. 2010). Such softening of cells during malignant
transformation is an example of cells changing their mechanics while changing their
function. While the cancerous transformation of cells is often accompanied by the loss of
their specific function (dedifferentiation), a very similar, but inverse process is happening
in healthy organisms, too. This process is commonly known as the differentiation of stem
cells (Arnold and Robertson 2009). Stem cells have two main characteristics – they keep
dividing and producing identical copies of themselves but they also have the potential to
change into cells with altered properties and less developmental capability, a process
called differentiation (Morrison and Spradling 2008). These more committed cells may
differentiate further until they reach a mature status, in which they fulfil specific tasks but
also become mortal and lose the capability of dividing endlessly. Since this process
seems similar to the inverse of malignant transformation of cells, I became interested in
following such functional changes in cells in terms of their mechanical response while
they differentiated. ‘Changes in Optical Deformability during Differentiation’ was the
73
The Influence of Cell Differentiation on Cell Compliance ________________________________________________________________________ topic of my diploma thesis where I first measured the compliance of blood precursor cells
(NB4 cells) in suspension with an optical stretcher (OS) (3rd chapter of (Lautenschläger
2006)). I started to compare the deformability of these NB4 cells before they
differentiated and after I induced differentiation via retinoic acid treatment. In addition, I
evaluated the response of mature neutrophils derived from healthy human donors.
Although I did find premature neutrophils becoming more compliant during
differentiation, this data was not sufficient for publication at that time and I continued to
work on this project within my PhD. Here, I focussed on different cell types and how
they changed during differentiation .
Stem cells can be classified by their differentiation potential, meaning that some stem
cells can differentiate into a large variety of different cells; less potent, precommitted
stem cells have fewer choices, differentiating into only two or even one cell type they can
differentiated into (Alberts et al. 1994). This classifies stem cells into different groups
according to their potential. The fertilized egg is a totipotent cell, as is also the
blastomere which is formed by up to 64 cells (Arnold and Robertson 2009). Any single
totipotent cell can develop into a fully mature organism. Pluripotent cells on the other
hand can differentiate into any cell type from the three germ layers during a process
called gastrulation, namely endoderm, mesoderm, and ectoderm, but not into the
trophectoderm anymore, which is an extra-embryonic layer of tissue which will connect
the embryo to the uterus and also forms the placenta (Alberts et al. 1994; Arnold and
Robertson 2009). Therefore, single pluripotent cells are not able to develop into a fully
mature specimen. However, since such pluripotent cells are able to form any cell type of
the embryo, they are generally called embryonic stem (ES) cells. The endodermal layer
will differentiate into several parts of the alimentary canal, but also the liver, the
pancreas, or the lung tissue. Cells of the second germ layer, the mesoderm cells, can
differentiate into cells like blood cells, cardiac muscle cells, or cells forming skeletal
muscle tissue. The ectodermal germ layer mainly forms the central nervous system and
the skin (Keller 2005). Pluripotent ES cells can also be implanted into embryos, for
example after they have been genetically modified. Organisms arising from cells of two
different embryos are called chimerae (Solter 2010). ES cells are of enormous interest for
general understanding in development but also for regenerative medicine. The idea of
74
The Influence of Cell Differentiation on Cell Compliance ________________________________________________________________________
having one pluripotent cell, which can, if the right mechanisms are activated, develop
into any tissue or organ to replace malfunctioning parts holds an enormous potential
(Darabi et al. 2008; Passier et al. 2008).
One step down on the ladder of potency are multipotent stem cells. These cells can
differentiate into a number of different cell types, but generally only into the cell types of
one specific tissue. Prominent examples are hematopoietic stem cells, keratinocyte stem
cells or mesenchymal stem cells (MSCs) (Fuchs 2007; Orkin and Zon 2008; Uccelli et al.
2008). All of these cell types are still found in mature tissue as in bone marrow or skin.
Whereas pluripotent cells have to be extracted from a developing embryo in an elaborate
procedure, these multipotent stem cells can be obtained more easily. Also, it is possible to
obtain such stem cells from the specific person who might need them because other parts
of their body are malfunctioning. Nevertheless, for such a ‘replacement’ of failing tissue
the stem cells would have to undergo a process called transdifferentiation (Wright and
Masri et al. 2010; Barzilay et al. 2009), where multipotent stem cells can be induced to
differentiate into tissues other than their own tissue type or by increasing their
differentiation potential artificially, e.g by directing them into the state of so-called
induced pluripotency (Hanna et al. 2010; Hipp and Atala 2008; Maherali and
Hochedlinger 2008).
Cells which can only differentiate into one or two cell types can be referred to as uni- or
bi-potent.
To study mechanical properties during differentiation in a larger context, I investigated
cell types with distinct differentiation potential. I continued to work on NB4 cells, which
have a bilinear potential and can differentiate into neutrophils and monocytes only
(Khanna-Gupta et al. 1994), but chose to also investigate a multipotent cell types
(MSCs). Finally, I also studied one pluripotent cell type, namely mouse embryonic stem
cells.
75
The Influence of Cell Differentiation on Cell Compliance ________________________________________________________________________
3.1 Differentiation of Neutrophil Precursor Cells. The volume of human blood consists of about 54 % plasma and a variety of cells, mainly
erythrocytes, leukocytes and thrombocytes. In human blood, erythrocytes constitute 45 %
of whole blood volume while leukocytes and thrombocytes are only represented by less
than one percent. Leukocytes’ main function is to maintain the body’s immune response.
There are two different types of leukocytes, called granulocytes and agranulocytes. While
agranulocytes consist of lymphocytes and monocytes, granulocytes are composed of
basophils, eosinophils and neutrophils. The role of neutrophils is to target bacteria and
fungi (Starkebaum et al. 1982; Gregory and Wing 2002), but they also act during
inflammation (Wright and Moots et al. 2010). In healthy adult humans about 50-60 % of
all leukocytes are neutrophils.
Neutrophils are highly motile cells circulating through the bloodstream and migrating
through tissue. It is known that undifferentiated neutrophil precursor cells do lack this
ability to migrate (Lichtman 1970, 1973). I wanted to pursue the question if it is possible
to follow this functional change by measuring mechanical properties. Since neutrophils
are naturally growing in suspension, it has been difficult to measure their mechanics so
far because most measuring methods require cellular contact and are therefore more
suitable for adherent cells. Methods such as AFM or intracellular microrheology require
the immobilisation of cells to a two dimensional surface to probe locally their mechanical
properties (Kole et al. 2005; Cross et al. 2007; Lam et al. 2007). However, to understand
the behaviour of neutrophils as migration through gaps and tissue it is the cell as an entity
which I need to understand. Methods like micropipette aspiration (Tsai et al. 1998;
Hochmuth 2000) or microplates (Thoumine and Ott 1997) do probe such whole cell
mechanics but also alter structures within the cell, mainly the cytoskeleton (Dubin-Thaler
et al. 2004) due to cell-probe contact. An optical stretcher is a more favourable tool to
measure deformability of cells, which are already in suspension since it does not require
any physical contact and will not cause any artefacts due to artificial adherence.
To follow the differentiation process, it was necessary to examine neutrophils before they
reach maturity. I therefore chose an acute promyelocytic cell line (NB4 cells) where a
t(15,17) gene translocation causes a stop in differentiation (Lanotte et al. 1991). This cell
76
The Influence of Cell Differentiation on Cell Compliance ________________________________________________________________________
line was obtained from an acute promyelocytic leukemia patient (Lanotte et al. 1991).
However, differentiation can be induced by treatment with all-trans retinoic acid (ATRA)
(Lanotte et al. 1991; Avvisati and Tallman 2003). In order to compare the compliance of
differentiated NB4 cells with mature neutrophils I additionally measured mature
neutrophils from human donors. It has been shown that ATRA differentiated cells stop
proliferating after 3 days but have been reported to stay alive for at least five days after
the beginning of differentiation (Lanotte et al. 1991). To my knowledge, no data about
the time of initiation of apoptosis after this time span has been published.
To investigate the reason for any changes in the compliance during differentiation I
collaborated with the group of Prof. Michael Beil of the University of Ulm, which
enabled me to visualize the sub-cortical actin in undifferentiated NB4 cells before and
after ATRA treatment by electron microscopy. In order to not only visualize the altered
actin cytoskeleton but to explore it further I treated ATRA differentiated NB4 cells
additionally with the drug latrunculin A which disrupts filamentous actin and measured
cell compliance. These data were published in PNAS in 2009 (Lautenschläger et al.
2009).
3.1.1 Experimental details The cell line used was an acute promyelocytic leukemia cell line called NB4. NB4 cells
were cultured in RPMI 1640 (PAA) complemented by 10 % FCS, 2 mM L-glutamin, and
100 U/ml penicillin/streptomycin. Differentiation was achieved by incubating cells with
5 µM all-trans retinoic acid for up to four days (Wang et al. 2006). All-trans retinoic acid
was dissolved in 100 % ethanol. This ethanol concentration was diluted to 0.0013 % in
the cell culture flask, a concentration which was also added into any control cells.
Neutrophils were separated from whole blood samples from healthy human donors with
the density gradient Polymorphprep (AxisShield) according to the instructions of the
manufacturer. A subgroup of cells were incubated with 1 µM latrunculin A (L5163) for
30 min prior to experiments. All chemicals were obtained from Sigma Aldrich, unless
stated otherwise.
Cells were measured in the optical stretcher applying a step stress (creep stress), e.g. cells
were held at low applied stress (laser power 0.1 W per fibre) for 1 s, deformed at high
77
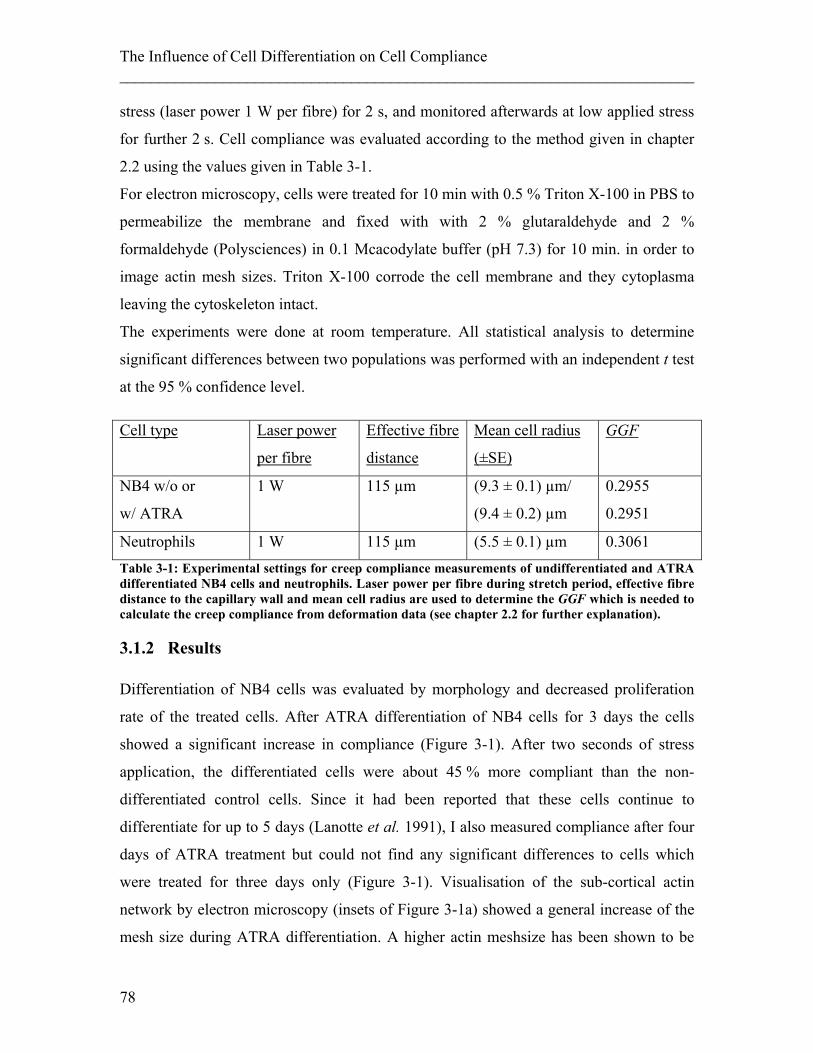
The Influence of Cell Differentiation on Cell Compliance ________________________________________________________________________ stress (laser power 1 W per fibre) for 2 s, and monitored afterwards at low applied stress
for further 2 s. Cell compliance was evaluated according to the method given in chapter
2.2 using the values given in Table 3-1.
For electron microscopy, cells were treated for 10 min with 0.5 % Triton X-100 in PBS to
permeabilize the membrane and fixed with with 2 % glutaraldehyde and 2 %
formaldehyde (Polysciences) in 0.1 Mcacodylate buffer (pH 7.3) for 10 min. in order to
image actin mesh sizes. Triton X-100 corrode the cell membrane and they cytoplasma
leaving the cytoskeleton intact.
The experiments were done at room temperature. All statistical analysis to determine
significant differences between two populations was performed with an independent t test
at the 95 % confidence level.
GGFCell type Laser power
per fibre
Effective fibre
distance
Mean cell radius
(±SE)
NB4 w/o or
w/ ATRA
1 W
115 µm (9.3 ± 0.1) µm/
(9.4 ± 0.2) µm
0.2955
0.2951
Neutrophils 1 W 115 µm (5.5 ± 0.1) µm 0.3061 Table 3-1: Experimental settings for creep compliance measurements of undifferentiated and ATRA differentiated NB4 cells and neutrophils. Laser power per fibre during stretch period, effective fibre distance to the capillary wall and mean cell radius are used to determine the GGF which is needed to calculate the creep compliance from deformation data (see chapter 2.2 for further explanation).
3.1.2 Results Differentiation of NB4 cells was evaluated by morphology and decreased proliferation
rate of the treated cells. After ATRA differentiation of NB4 cells for 3 days the cells
showed a significant increase in compliance (Figure 3-1). After two seconds of stress
application, the differentiated cells were about 45 % more compliant than the non-
differentiated control cells. Since it had been reported that these cells continue to
differentiate for up to 5 days (Lanotte et al. 1991), I also measured compliance after four
days of ATRA treatment but could not find any significant differences to cells which
were treated for three days only (Figure 3-1). Visualisation of the sub-cortical actin
network by electron microscopy (insets of Figure 3-1a) showed a general increase of the
mesh size during ATRA differentiation. A higher actin meshsize has been shown to be
78
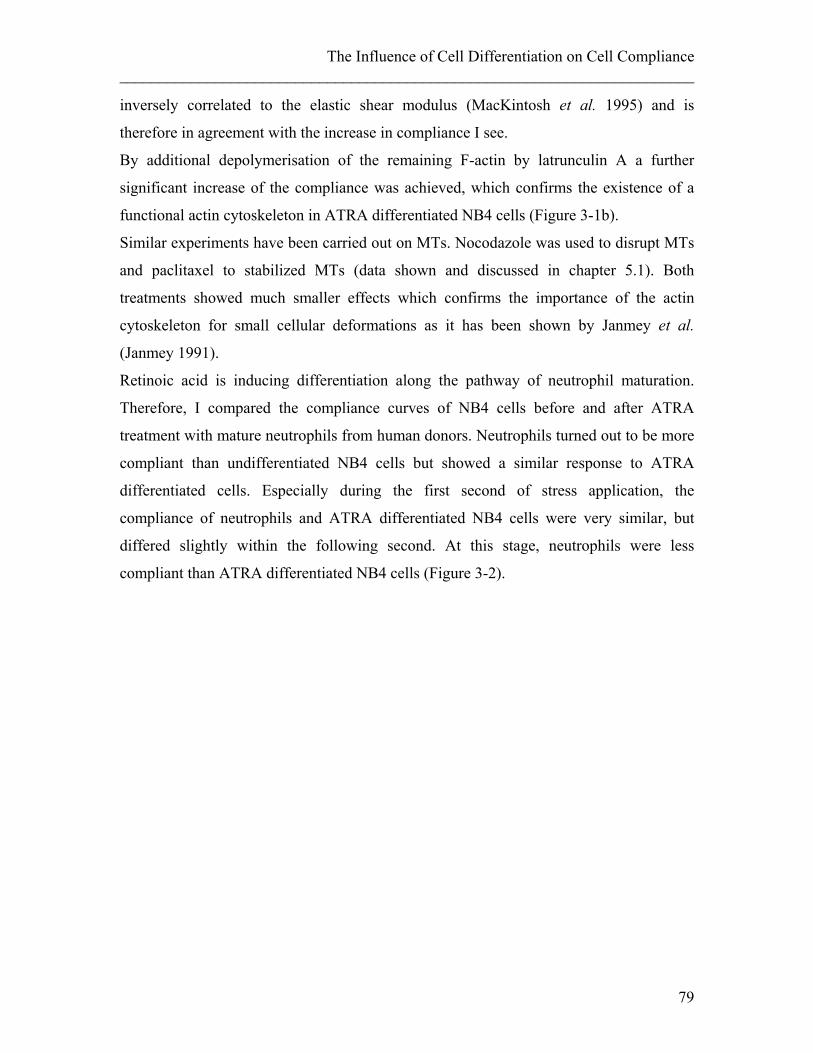
The Influence of Cell Differentiation on Cell Compliance ________________________________________________________________________
inversely correlated to the elastic shear modulus (MacKintosh et al. 1995) and is
therefore in agreement with the increase in compliance I see.
By additional depolymerisation of the remaining F-actin by latrunculin A a further
significant increase of the compliance was achieved, which confirms the existence of a
functional actin cytoskeleton in ATRA differentiated NB4 cells (Figure 3-1b).
Similar experiments have been carried out on MTs. Nocodazole was used to disrupt MTs
and paclitaxel to stabilized MTs (data shown and discussed in chapter 5.1). Both
treatments showed much smaller effects which confirms the importance of the actin
cytoskeleton for small cellular deformations as it has been shown by Janmey et al.
(Janmey 1991).
Retinoic acid is inducing differentiation along the pathway of neutrophil maturation.
Therefore, I compared the compliance curves of NB4 cells before and after ATRA
treatment with mature neutrophils from human donors. Neutrophils turned out to be more
compliant than undifferentiated NB4 cells but showed a similar response to ATRA
differentiated cells. Especially during the first second of stress application, the
compliance of neutrophils and ATRA differentiated NB4 cells were very similar, but
differed slightly within the following second. At this stage, neutrophils were less
compliant than ATRA differentiated NB4 cells (Figure 3-2).
79
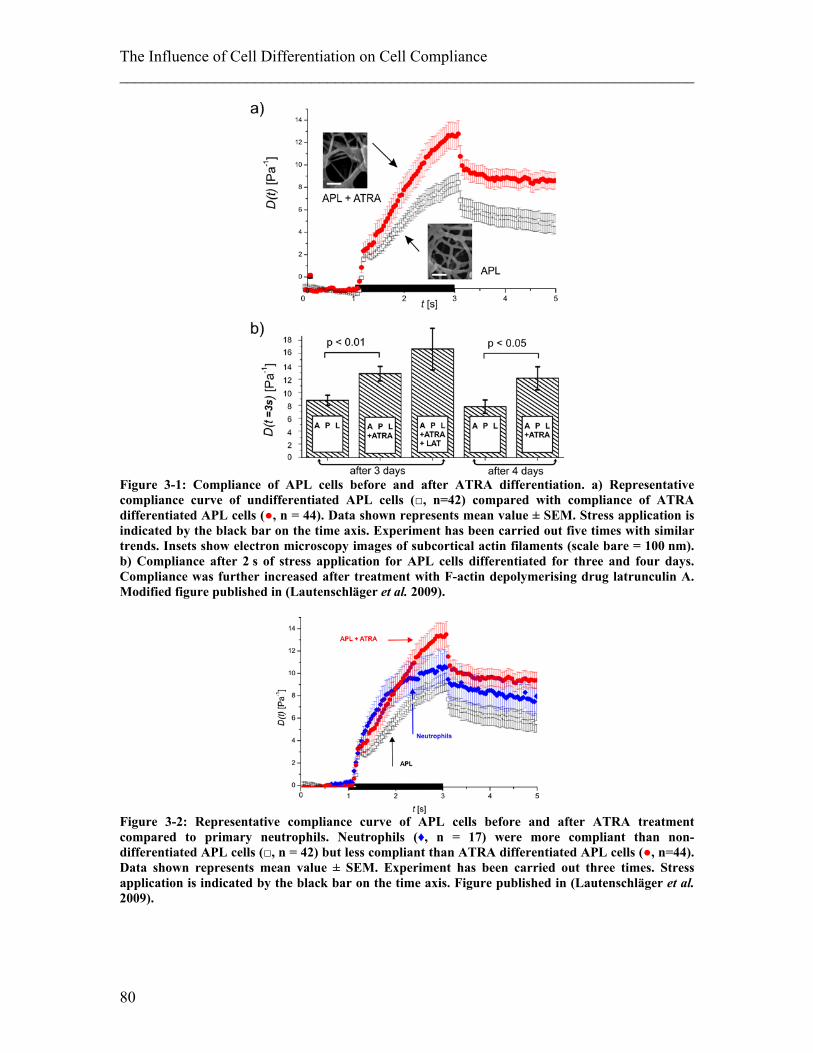
The Influence of Cell Differentiation on Cell Compliance ________________________________________________________________________
Figure 3-1: Compliance of APL cells before and after ATRA differentiation. a) Representative compliance curve of undifferentiated APL cells (□, n=42) compared with compliance of ATRA differentiated APL cells (●, n = 44). Data shown represents mean value ± SEM. Stress application is indicated by the black bar on the time axis. Experiment has been carried out five times with similar trends. Insets show electron microscopy images of subcortical actin filaments (scale bare = 100 nm). b) Compliance after 2 s of stress application for APL cells differentiated for three and four days. Compliance was further increased after treatment with F-actin depolymerising drug latrunculin A. Modified figure published in (Lautenschläger et al. 2009).
Figure 3-2: Representative compliance curve of APL cells before and after ATRA treatment compared to primary neutrophils. Neutrophils (♦, n = 17) were more compliant than non-differentiated APL cells (□, n = 42) but less compliant than ATRA differentiated APL cells (●, n=44). Data shown represents mean value ± SEM. Experiment has been carried out three times. Stress application is indicated by the black bar on the time axis. Figure published in (Lautenschläger et al. 2009).
80
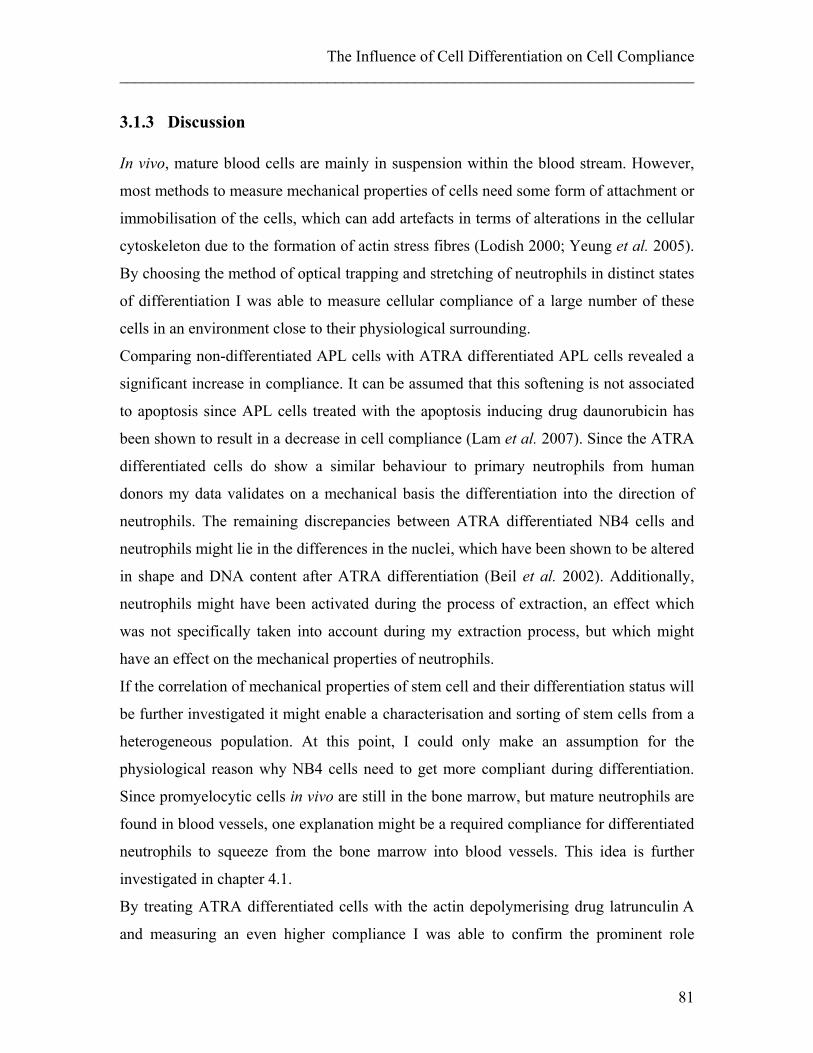
The Influence of Cell Differentiation on Cell Compliance ________________________________________________________________________
3.1.3 Discussion In vivo, mature blood cells are mainly in suspension within the blood stream. However,
most methods to measure mechanical properties of cells need some form of attachment or
immobilisation of the cells, which can add artefacts in terms of alterations in the cellular
cytoskeleton due to the formation of actin stress fibres (Lodish 2000; Yeung et al. 2005).
By choosing the method of optical trapping and stretching of neutrophils in distinct states
of differentiation I was able to measure cellular compliance of a large number of these
cells in an environment close to their physiological surrounding.
Comparing non-differentiated APL cells with ATRA differentiated APL cells revealed a
significant increase in compliance. It can be assumed that this softening is not associated
to apoptosis since APL cells treated with the apoptosis inducing drug daunorubicin has
been shown to result in a decrease in cell compliance (Lam et al. 2007). Since the ATRA
differentiated cells do show a similar behaviour to primary neutrophils from human
donors my data validates on a mechanical basis the differentiation into the direction of
neutrophils. The remaining discrepancies between ATRA differentiated NB4 cells and
neutrophils might lie in the differences in the nuclei, which have been shown to be altered
in shape and DNA content after ATRA differentiation (Beil et al. 2002). Additionally,
neutrophils might have been activated during the process of extraction, an effect which
was not specifically taken into account during my extraction process, but which might
have an effect on the mechanical properties of neutrophils.
If the correlation of mechanical properties of stem cell and their differentiation status will
be further investigated it might enable a characterisation and sorting of stem cells from a
heterogeneous population. At this point, I could only make an assumption for the
physiological reason why NB4 cells need to get more compliant during differentiation.
Since promyelocytic cells in vivo are still in the bone marrow, but mature neutrophils are
found in blood vessels, one explanation might be a required compliance for differentiated
neutrophils to squeeze from the bone marrow into blood vessels. This idea is further
investigated in chapter 4.1.
By treating ATRA differentiated cells with the actin depolymerising drug latrunculin A
and measuring an even higher compliance I was able to confirm the prominent role
81
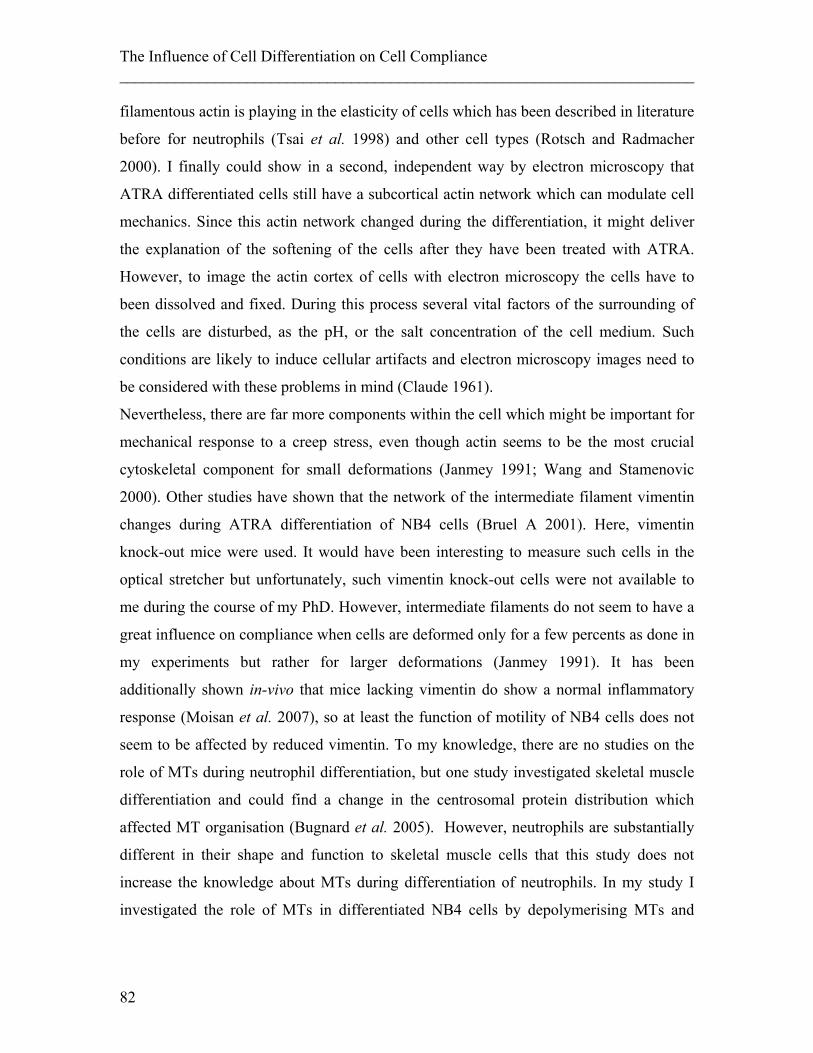
The Influence of Cell Differentiation on Cell Compliance ________________________________________________________________________ filamentous actin is playing in the elasticity of cells which has been described in literature
before for neutrophils (Tsai et al. 1998) and other cell types (Rotsch and Radmacher
2000). I finally could show in a second, independent way by electron microscopy that
ATRA differentiated cells still have a subcortical actin network which can modulate cell
mechanics. Since this actin network changed during the differentiation, it might deliver
the explanation of the softening of the cells after they have been treated with ATRA.
However, to image the actin cortex of cells with electron microscopy the cells have to
been dissolved and fixed. During this process several vital factors of the surrounding of
the cells are disturbed, as the pH, or the salt concentration of the cell medium. Such
conditions are likely to induce cellular artifacts and electron microscopy images need to
be considered with these problems in mind (Claude 1961).
Nevertheless, there are far more components within the cell which might be important for
mechanical response to a creep stress, even though actin seems to be the most crucial
cytoskeletal component for small deformations (Janmey 1991; Wang and Stamenovic
2000). Other studies have shown that the network of the intermediate filament vimentin
changes during ATRA differentiation of NB4 cells (Bruel A 2001). Here, vimentin
knock-out mice were used. It would have been interesting to measure such cells in the
optical stretcher but unfortunately, such vimentin knock-out cells were not available to
me during the course of my PhD. However, intermediate filaments do not seem to have a
great influence on compliance when cells are deformed only for a few percents as done in
my experiments but rather for larger deformations (Janmey 1991). It has been
additionally shown in-vivo that mice lacking vimentin do show a normal inflammatory
response (Moisan et al. 2007), so at least the function of motility of NB4 cells does not
seem to be affected by reduced vimentin. To my knowledge, there are no studies on the
role of MTs during neutrophil differentiation, but one study investigated skeletal muscle
differentiation and could find a change in the centrosomal protein distribution which
affected MT organisation (Bugnard et al. 2005). However, neutrophils are substantially
different in their shape and function to skeletal muscle cells that this study does not
increase the knowledge about MTs during differentiation of neutrophils. In my study I
investigated the role of MTs in differentiated NB4 cells by depolymerising MTs and
82
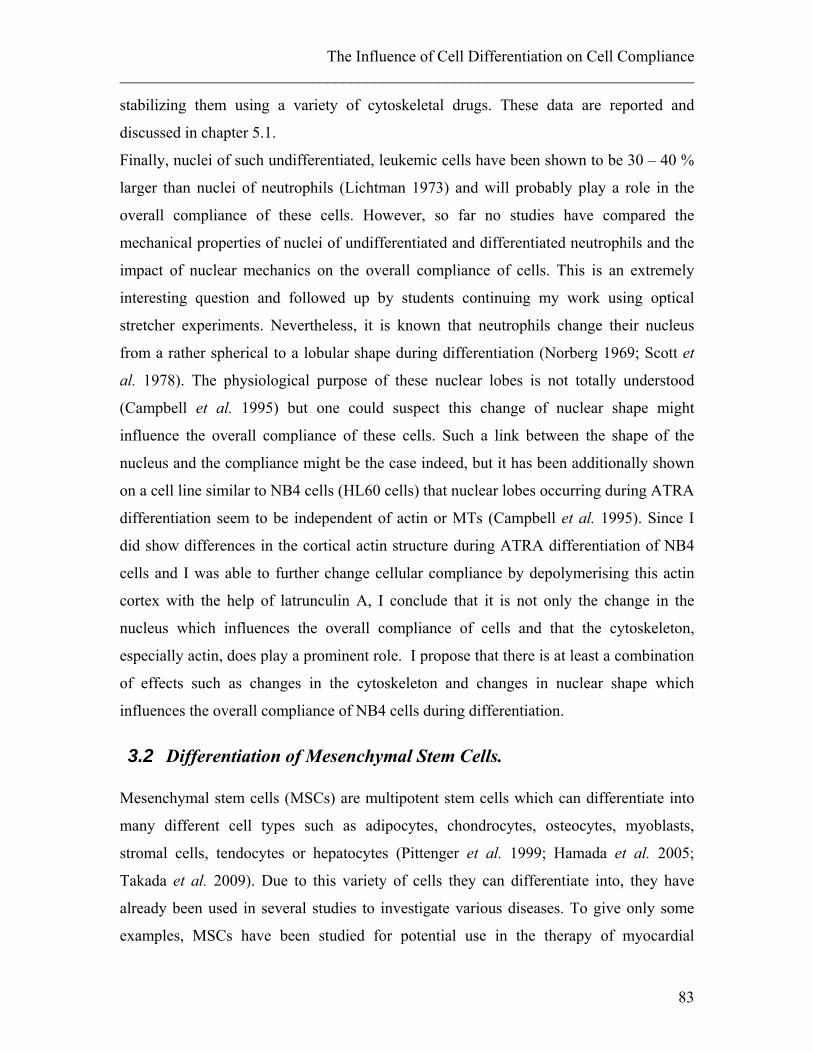
The Influence of Cell Differentiation on Cell Compliance ________________________________________________________________________
stabilizing them using a variety of cytoskeletal drugs. These data are reported and
discussed in chapter 5.1.
Finally, nuclei of such undifferentiated, leukemic cells have been shown to be 30 – 40 %
larger than nuclei of neutrophils (Lichtman 1973) and will probably play a role in the
overall compliance of these cells. However, so far no studies have compared the
mechanical properties of nuclei of undifferentiated and differentiated neutrophils and the
impact of nuclear mechanics on the overall compliance of cells. This is an extremely
interesting question and followed up by students continuing my work using optical
stretcher experiments. Nevertheless, it is known that neutrophils change their nucleus
from a rather spherical to a lobular shape during differentiation (Norberg 1969; Scott et
al. 1978). The physiological purpose of these nuclear lobes is not totally understood
(Campbell et al. 1995) but one could suspect this change of nuclear shape might
influence the overall compliance of these cells. Such a link between the shape of the
nucleus and the compliance might be the case indeed, but it has been additionally shown
on a cell line similar to NB4 cells (HL60 cells) that nuclear lobes occurring during ATRA
differentiation seem to be independent of actin or MTs (Campbell et al. 1995). Since I
did show differences in the cortical actin structure during ATRA differentiation of NB4
cells and I was able to further change cellular compliance by depolymerising this actin
cortex with the help of latrunculin A, I conclude that it is not only the change in the
nucleus which influences the overall compliance of cells and that the cytoskeleton,
especially actin, does play a prominent role. I propose that there is at least a combination
of effects such as changes in the cytoskeleton and changes in nuclear shape which
influences the overall compliance of NB4 cells during differentiation.
3.2 Differentiation of Mesenchymal Stem Cells. Mesenchymal stem cells (MSCs) are multipotent stem cells which can differentiate into
many different cell types such as adipocytes, chondrocytes, osteocytes, myoblasts,
stromal cells, tendocytes or hepatocytes (Pittenger et al. 1999; Hamada et al. 2005;
Takada et al. 2009). Due to this variety of cells they can differentiate into, they have
already been used in several studies to investigate various diseases. To give only some
examples, MSCs have been studied for potential use in the therapy of myocardial
83
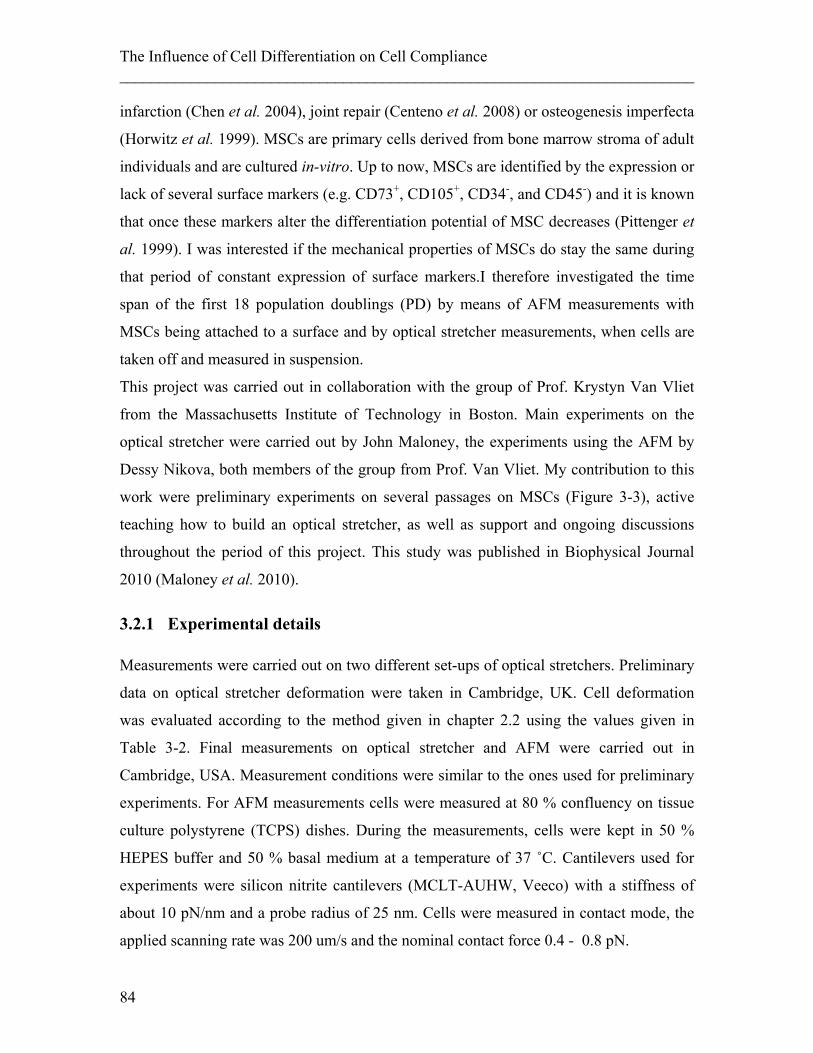
The Influence of Cell Differentiation on Cell Compliance ________________________________________________________________________ infarction (Chen et al. 2004), joint repair (Centeno et al. 2008) or osteogenesis imperfecta
(Horwitz et al. 1999). MSCs are primary cells derived from bone marrow stroma of adult
individuals and are cultured in-vitro. Up to now, MSCs are identified by the expression or
lack of several surface markers (e.g. CD73+, CD105+, CD34-, and CD45-) and it is known
that once these markers alter the differentiation potential of MSC decreases (Pittenger et
al. 1999). I was interested if the mechanical properties of MSCs do stay the same during
that period of constant expression of surface markers.I therefore investigated the time
span of the first 18 population doublings (PD) by means of AFM measurements with
MSCs being attached to a surface and by optical stretcher measurements, when cells are
taken off and measured in suspension.
This project was carried out in collaboration with the group of Prof. Krystyn Van Vliet
from the Massachusetts Institute of Technology in Boston. Main experiments on the
optical stretcher were carried out by John Maloney, the experiments using the AFM by
Dessy Nikova, both members of the group from Prof. Van Vliet. My contribution to this
work were preliminary experiments on several passages on MSCs (Figure 3-3), active
teaching how to build an optical stretcher, as well as support and ongoing discussions
throughout the period of this project. This study was published in Biophysical Journal
2010 (Maloney et al. 2010).
3.2.1 Experimental details Measurements were carried out on two different set-ups of optical stretchers. Preliminary
data on optical stretcher deformation were taken in Cambridge, UK. Cell deformation
was evaluated according to the method given in chapter 2.2 using the values given in
Table 3-2. Final measurements on optical stretcher and AFM were carried out in
Cambridge, USA. Measurement conditions were similar to the ones used for preliminary
experiments. For AFM measurements cells were measured at 80 % confluency on tissue
culture polystyrene (TCPS) dishes. During the measurements, cells were kept in 50 %
HEPES buffer and 50 % basal medium at a temperature of 37 ˚C. Cantilevers used for
experiments were silicon nitrite cantilevers (MCLT-AUHW, Veeco) with a stiffness of
about 10 pN/nm and a probe radius of 25 nm. Cells were measured in contact mode, the
applied scanning rate was 200 um/s and the nominal contact force 0.4 - 0.8 pN.
84
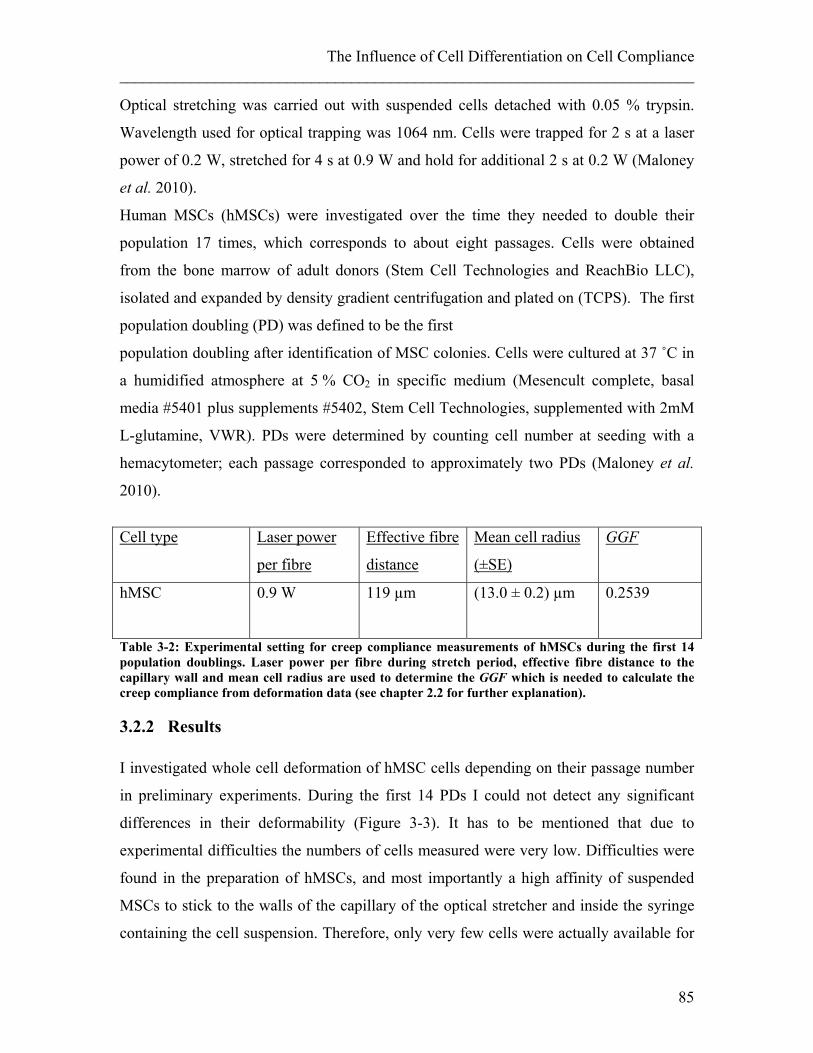
The Influence of Cell Differentiation on Cell Compliance ________________________________________________________________________
Optical stretching was carried out with suspended cells detached with 0.05 % trypsin.
Wavelength used for optical trapping was 1064 nm. Cells were trapped for 2 s at a laser
power of 0.2 W, stretched for 4 s at 0.9 W and hold for additional 2 s at 0.2 W (Maloney
et al. 2010).
Human MSCs (hMSCs) were investigated over the time they needed to double their
population 17 times, which corresponds to about eight passages. Cells were obtained
from the bone marrow of adult donors (Stem Cell Technologies and ReachBio LLC),
isolated and expanded by density gradient centrifugation and plated on (TCPS). The first
population doubling (PD) was defined to be the first
population doubling after identification of MSC colonies. Cells were cultured at 37 ˚C in
a humidified atmosphere at 5 % CO2 in specific medium (Mesencult complete, basal
media #5401 plus supplements #5402, Stem Cell Technologies, supplemented with 2mM
L-glutamine, VWR). PDs were determined by counting cell number at seeding with a
hemacytometer; each passage corresponded to approximately two PDs (Maloney et al.
2010).
GGFCell type Laser power
per fibre
Effective fibre
distance
Mean cell radius
(±SE)
hMSC 0.9 W 119 µm (13.0 ± 0.2) µm
0.2539
Table 3-2: Experimental setting for creep compliance measurements of hMSCs during the first 14 population doublings. Laser power per fibre during stretch period, effective fibre distance to the capillary wall and mean cell radius are used to determine the GGF which is needed to calculate the creep compliance from deformation data (see chapter 2.2 for further explanation).
3.2.2 Results I investigated whole cell deformation of hMSC cells depending on their passage number
in preliminary experiments. During the first 14 PDs I could not detect any significant
differences in their deformability (Figure 3-3). It has to be mentioned that due to
experimental difficulties the numbers of cells measured were very low. Difficulties were
found in the preparation of hMSCs, and most importantly a high affinity of suspended
MSCs to stick to the walls of the capillary of the optical stretcher and inside the syringe
containing the cell suspension. Therefore, only very few cells were actually available for
85
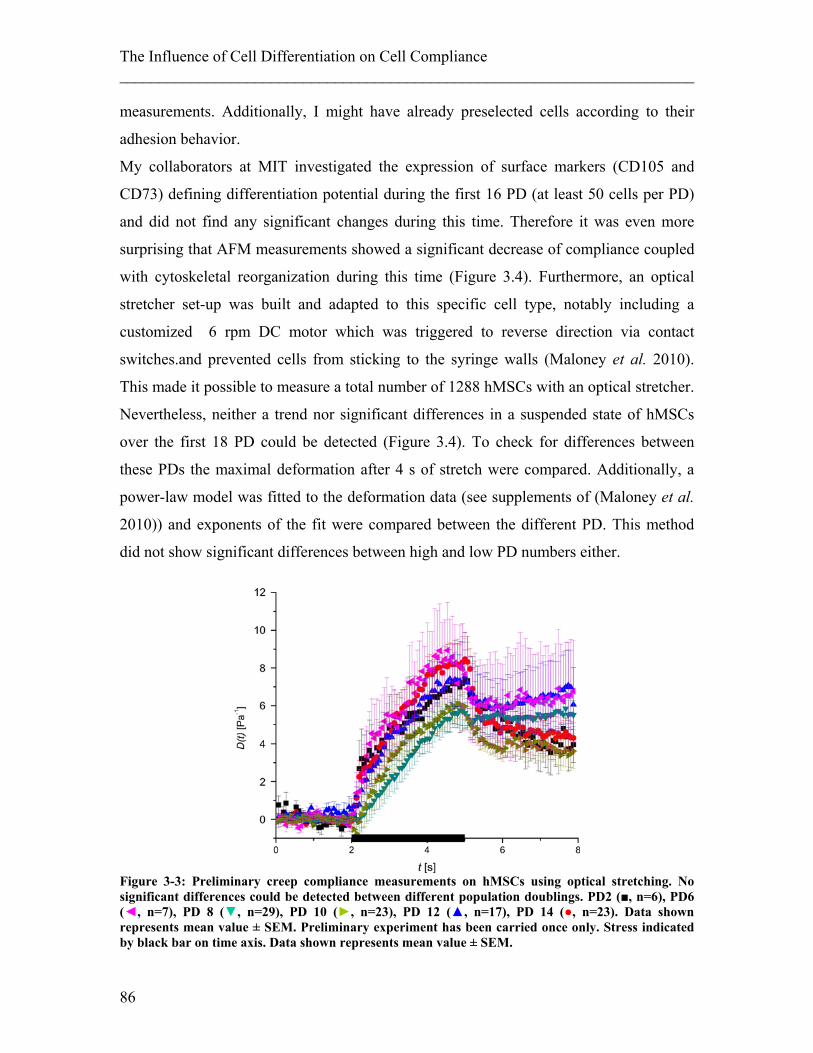
The Influence of Cell Differentiation on Cell Compliance ________________________________________________________________________ measurements. Additionally, I might have already preselected cells according to their
adhesion behavior.
My collaborators at MIT investigated the expression of surface markers (CD105 and
CD73) defining differentiation potential during the first 16 PD (at least 50 cells per PD)
and did not find any significant changes during this time. Therefore it was even more
surprising that AFM measurements showed a significant decrease of compliance coupled
with cytoskeletal reorganization during this time (Figure 3.4). Furthermore, an optical
stretcher set-up was built and adapted to this specific cell type, notably including a
customized 6 rpm DC motor which was triggered to reverse direction via contact
switches.and prevented cells from sticking to the syringe walls (Maloney et al. 2010).
This made it possible to measure a total number of 1288 hMSCs with an optical stretcher.
Nevertheless, neither a trend nor significant differences in a suspended state of hMSCs
over the first 18 PD could be detected (Figure 3.4). To check for differences between
these PDs the maximal deformation after 4 s of stretch were compared. Additionally, a
power-law model was fitted to the deformation data (see supplements of (Maloney et al.
2010)) and exponents of the fit were compared between the different PD. This method
did not show significant differences between high and low PD numbers either.
Figure 3-3: Preliminary creep compliance measurements on hMSCs using optical stretching. No significant differences could be detected between different population doublings. PD2 (■, n=6), PD6 (◄, n=7), PD 8 (▼, n=29), PD 10 (►, n=23), PD 12 (▲, n=17), PD 14 (●, n=23). Data shown represents mean value ± SEM. Preliminary experiment has been carried once only. Stress indicated by black bar on time axis. Data shown represents mean value ± SEM.
86
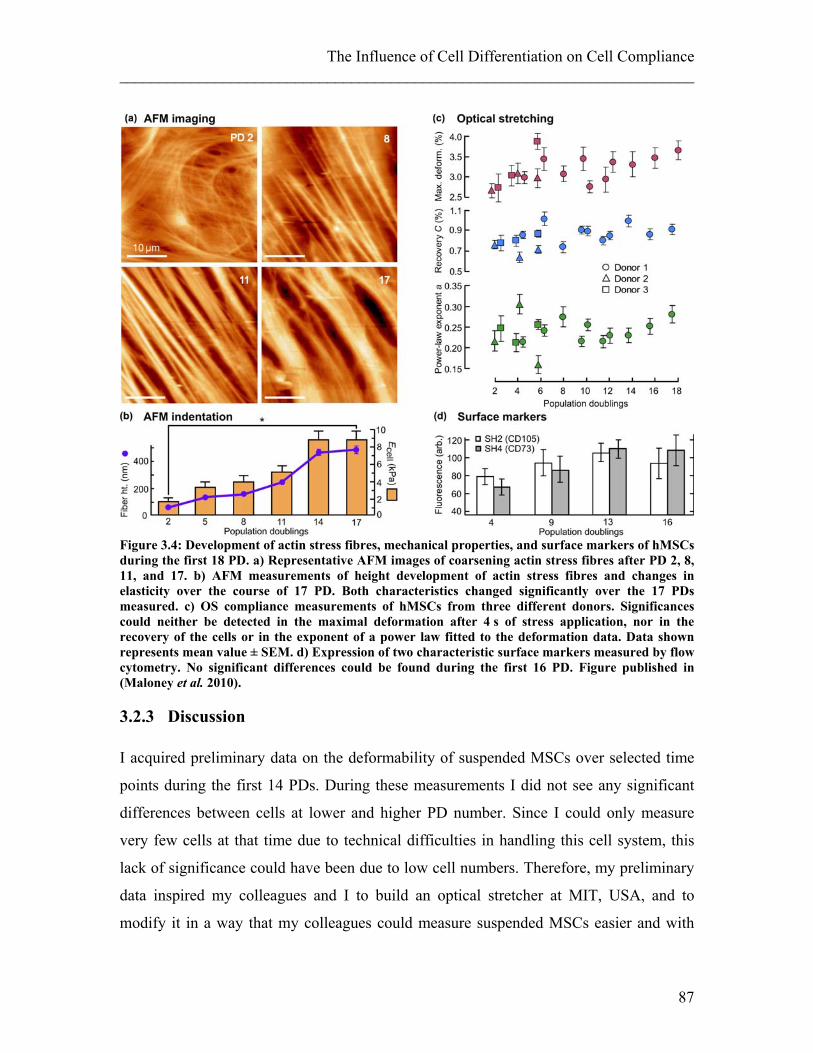
The Influence of Cell Differentiation on Cell Compliance ________________________________________________________________________
Figure 3.4: Development of actin stress fibres, mechanical properties, and surface markers of hMSCs during the first 18 PD. a) Representative AFM images of coarsening actin stress fibres after PD 2, 8, 11, and 17. b) AFM measurements of height development of actin stress fibres and changes in elasticity over the course of 17 PD. Both characteristics changed significantly over the 17 PDs measured. c) OS compliance measurements of hMSCs from three different donors. Significances could neither be detected in the maximal deformation after 4 s of stress application, nor in the recovery of the cells or in the exponent of a power law fitted to the deformation data. Data shown represents mean value ± SEM. d) Expression of two characteristic surface markers measured by flow cytometry. No significant differences could be found during the first 16 PD. Figure published in (Maloney et al. 2010).
3.2.3 Discussion I acquired preliminary data on the deformability of suspended MSCs over selected time
points during the first 14 PDs. During these measurements I did not see any significant
differences between cells at lower and higher PD number. Since I could only measure
very few cells at that time due to technical difficulties in handling this cell system, this
lack of significance could have been due to low cell numbers. Therefore, my preliminary
data inspired my colleagues and I to build an optical stretcher at MIT, USA, and to
modify it in a way that my colleagues could measure suspended MSCs easier and with
87
The Influence of Cell Differentiation on Cell Compliance ________________________________________________________________________ less loss due to cells sticking to the set-up. This last part was achieved by a syringe
rotator invented by John Maloney at MIT. He was able to repeat the measurement with
much higher cell numbers and achieved a total of 1288 measured MSCs. Nevertheless,
significant differences could still not be found between different population doublings.
Since the surface markers of undifferentiated MSCs (CD105 and CD73) did not change
over this time either, such a result did not seem very surprising and would have simply
been an indication of MSCs keeping their same differentiation potential during this time
span. However, when MSC cells were measured in their attached state using AFM,
significant differences were found, a result which confirms data published before
(Titushkin and Cho 2007). Differences in the cytoskeletal structure could be detected,
especially a thickening and coarsening of actin stress fibres. This surprising result can be
explained by the existence of MSC subpopulations (Mets and Verdonk 1981; Scott P.
Bruder 1997; Colter et al. 2001). One subpopulation consists of rapidly proliferating
spindle shaped cells which do have a lower proliferative capacity than the second
subpopulation of cuboidal cells (Sekiya et al. 2002; Docheva et al. 2008). Therefore, the
proportion of the cuboidal cell type does increase in the overall cell population over time
(Mets and Verdonk 1981). Former studies of those two subpopulations of MSCs using
AFM technique measuring mechanical properties of the perinuclear region did not show
any differences. However, dramatic changes in the cytoskeleton away from the nucleus,
in the expression of stress fibres could be seen. In addition to measuring an increased
bundle height, also increased stiffness was measured with higher population doublings
when MSCs were measured in their attached state. I think it is highly probable that the
measured effect is due to the transition from a state with a high percentage of spindle
shaped cells to a population with mainly cuboidal cells. Since both subpopulations do
express comparable surface markers, such a change cannot be detected by flow
cytometry, which only measures expression levels of surface markers. Nevertheless, such
a change does has a high impact on the differentiation potential of the cell population
since cuboidal cells mainly differentiate along the osteoblast lineage (DiGirolamo et al.
1999). Therefore, the chondrogenic and adipogenic capacity of the population will
decrease with further passaging. This loss in differentiation potential seems to be
correlated with the stiffness of attached MSCs and their stress fibres. On the other hand,
88
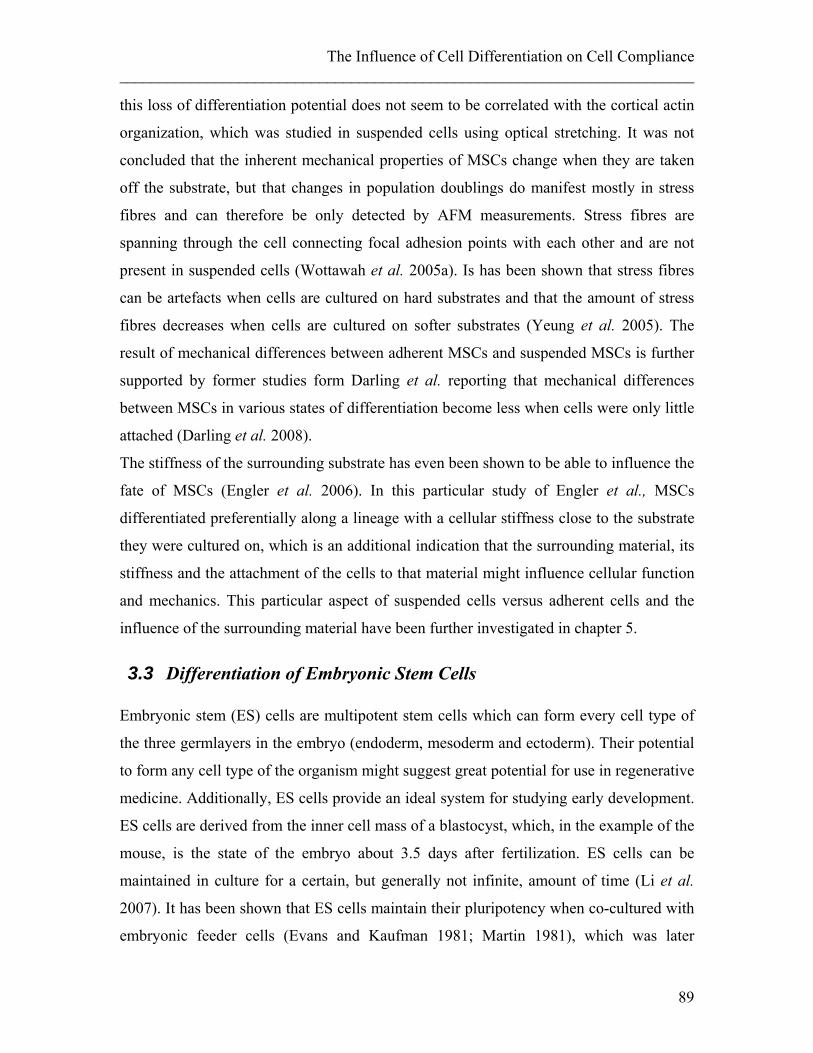
The Influence of Cell Differentiation on Cell Compliance ________________________________________________________________________
this loss of differentiation potential does not seem to be correlated with the cortical actin
organization, which was studied in suspended cells using optical stretching. It was not
concluded that the inherent mechanical properties of MSCs change when they are taken
off the substrate, but that changes in population doublings do manifest mostly in stress
fibres and can therefore be only detected by AFM measurements. Stress fibres are
spanning through the cell connecting focal adhesion points with each other and are not
present in suspended cells (Wottawah et al. 2005a). Is has been shown that stress fibres
can be artefacts when cells are cultured on hard substrates and that the amount of stress
fibres decreases when cells are cultured on softer substrates (Yeung et al. 2005). The
result of mechanical differences between adherent MSCs and suspended MSCs is further
supported by former studies form Darling et al. reporting that mechanical differences
between MSCs in various states of differentiation become less when cells were only little
attached (Darling et al. 2008).
The stiffness of the surrounding substrate has even been shown to be able to influence the
fate of MSCs (Engler et al. 2006). In this particular study of Engler et al., MSCs
differentiated preferentially along a lineage with a cellular stiffness close to the substrate
they were cultured on, which is an additional indication that the surrounding material, its
stiffness and the attachment of the cells to that material might influence cellular function
and mechanics. This particular aspect of suspended cells versus adherent cells and the
influence of the surrounding material have been further investigated in chapter 5.
3.3 Differentiation of Embryonic Stem Cells Embryonic stem (ES) cells are multipotent stem cells which can form every cell type of
the three germlayers in the embryo (endoderm, mesoderm and ectoderm). Their potential
to form any cell type of the organism might suggest great potential for use in regenerative
medicine. Additionally, ES cells provide an ideal system for studying early development.
ES cells are derived from the inner cell mass of a blastocyst, which, in the example of the
mouse, is the state of the embryo about 3.5 days after fertilization. ES cells can be
maintained in culture for a certain, but generally not infinite, amount of time (Li et al.
2007). It has been shown that ES cells maintain their pluripotency when co-cultured with
embryonic feeder cells (Evans and Kaufman 1981; Martin 1981), which was later
89
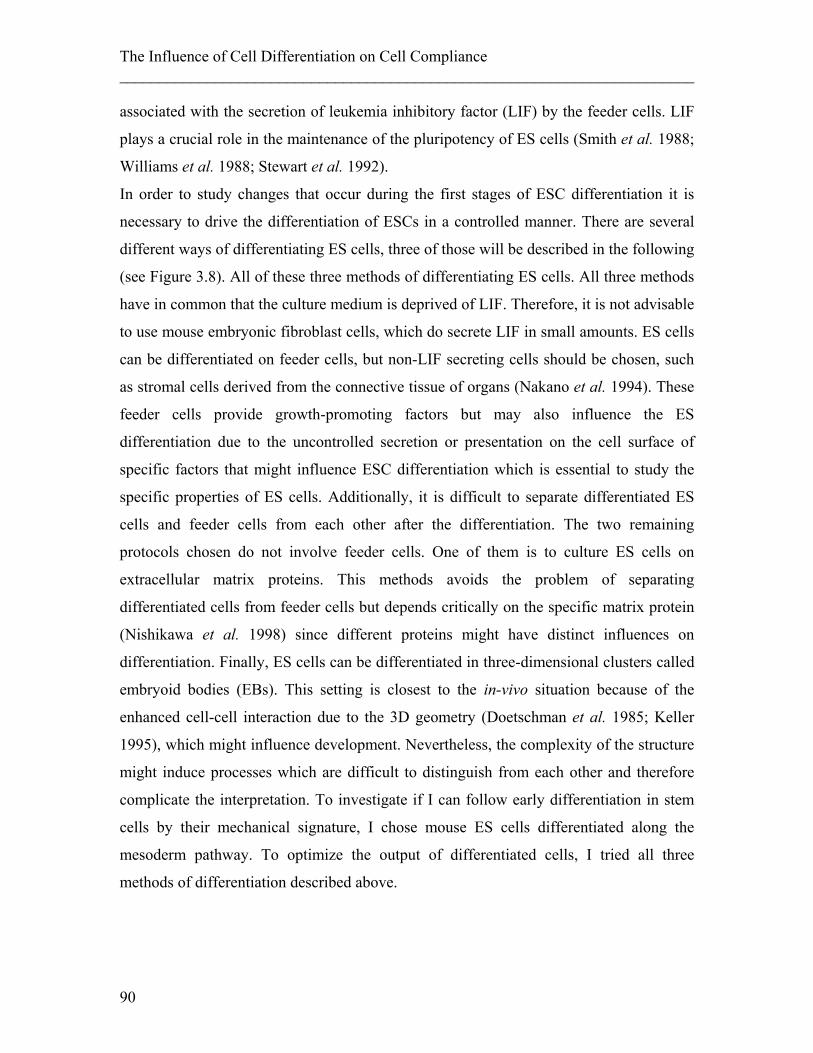
The Influence of Cell Differentiation on Cell Compliance ________________________________________________________________________ associated with the secretion of leukemia inhibitory factor (LIF) by the feeder cells. LIF
plays a crucial role in the maintenance of the pluripotency of ES cells (Smith et al. 1988;
Williams et al. 1988; Stewart et al. 1992).
In order to study changes that occur during the first stages of ESC differentiation it is
necessary to drive the differentiation of ESCs in a controlled manner. There are several
different ways of differentiating ES cells, three of those will be described in the following
(see Figure 3.8). All of these three methods of differentiating ES cells. All three methods
have in common that the culture medium is deprived of LIF. Therefore, it is not advisable
to use mouse embryonic fibroblast cells, which do secrete LIF in small amounts. ES cells
can be differentiated on feeder cells, but non-LIF secreting cells should be chosen, such
as stromal cells derived from the connective tissue of organs (Nakano et al. 1994). These
feeder cells provide growth-promoting factors but may also influence the ES
differentiation due to the uncontrolled secretion or presentation on the cell surface of
specific factors that might influence ESC differentiation which is essential to study the
specific properties of ES cells. Additionally, it is difficult to separate differentiated ES
cells and feeder cells from each other after the differentiation. The two remaining
protocols chosen do not involve feeder cells. One of them is to culture ES cells on
extracellular matrix proteins. This methods avoids the problem of separating
differentiated cells from feeder cells but depends critically on the specific matrix protein
(Nishikawa et al. 1998) since different proteins might have distinct influences on
differentiation. Finally, ES cells can be differentiated in three-dimensional clusters called
embryoid bodies (EBs). This setting is closest to the in-vivo situation because of the
enhanced cell-cell interaction due to the 3D geometry (Doetschman et al. 1985; Keller
1995), which might influence development. Nevertheless, the complexity of the structure
might induce processes which are difficult to distinguish from each other and therefore
complicate the interpretation. To investigate if I can follow early differentiation in stem
cells by their mechanical signature, I chose mouse ES cells differentiated along the
mesoderm pathway. To optimize the output of differentiated cells, I tried all three
methods of differentiation described above.
90
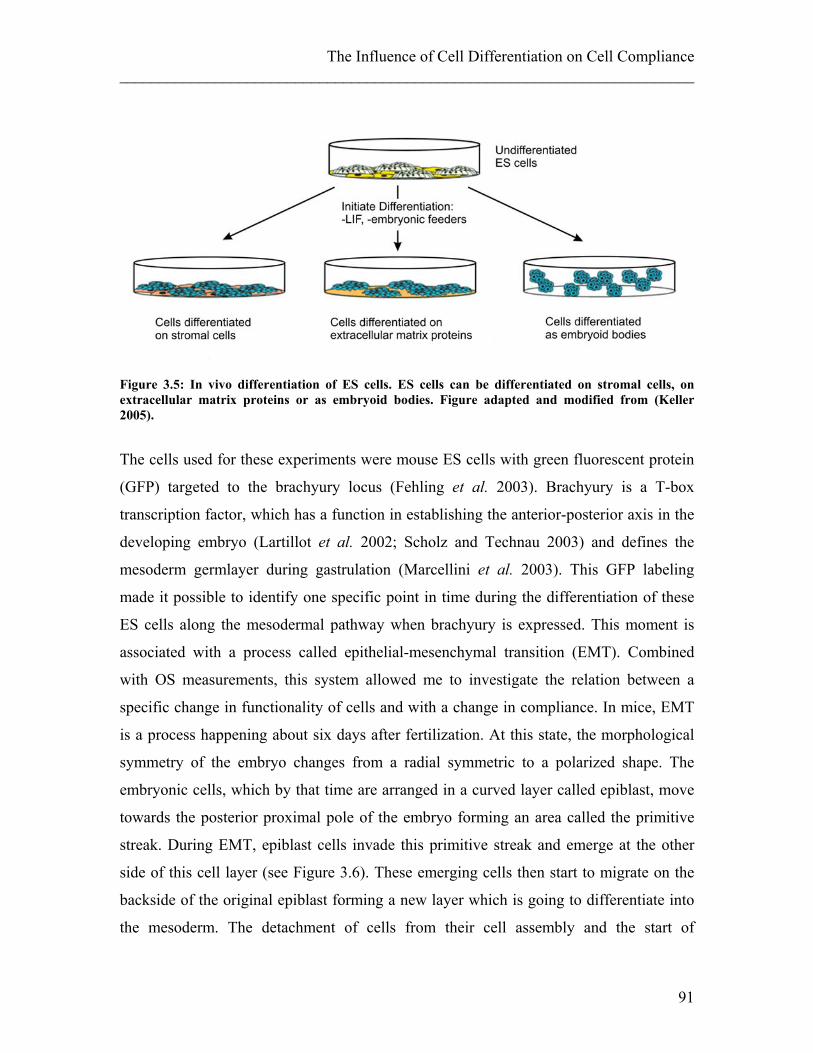
The Influence of Cell Differentiation on Cell Compliance ________________________________________________________________________
Figure 3.5: In vivo differentiation of ES cells. ES cells can be differentiated on stromal cells, on extracellular matrix proteins or as embryoid bodies. Figure adapted and modified from (Keller 2005).
The cells used for these experiments were mouse ES cells with green fluorescent protein
(GFP) targeted to the brachyury locus (Fehling et al. 2003). Brachyury is a T-box
transcription factor, which has a function in establishing the anterior-posterior axis in the
developing embryo (Lartillot et al. 2002; Scholz and Technau 2003) and defines the
mesoderm germlayer during gastrulation (Marcellini et al. 2003). This GFP labeling
made it possible to identify one specific point in time during the differentiation of these
ES cells along the mesodermal pathway when brachyury is expressed. This moment is
associated with a process called epithelial-mesenchymal transition (EMT). Combined
with OS measurements, this system allowed me to investigate the relation between a
specific change in functionality of cells and with a change in compliance. In mice, EMT
is a process happening about six days after fertilization. At this state, the morphological
symmetry of the embryo changes from a radial symmetric to a polarized shape. The
embryonic cells, which by that time are arranged in a curved layer called epiblast, move
towards the posterior proximal pole of the embryo forming an area called the primitive
streak. During EMT, epiblast cells invade this primitive streak and emerge at the other
side of this cell layer (see Figure 3.6). These emerging cells then start to migrate on the
backside of the original epiblast forming a new layer which is going to differentiate into
the mesoderm. The detachment of cells from their cell assembly and the start of
91
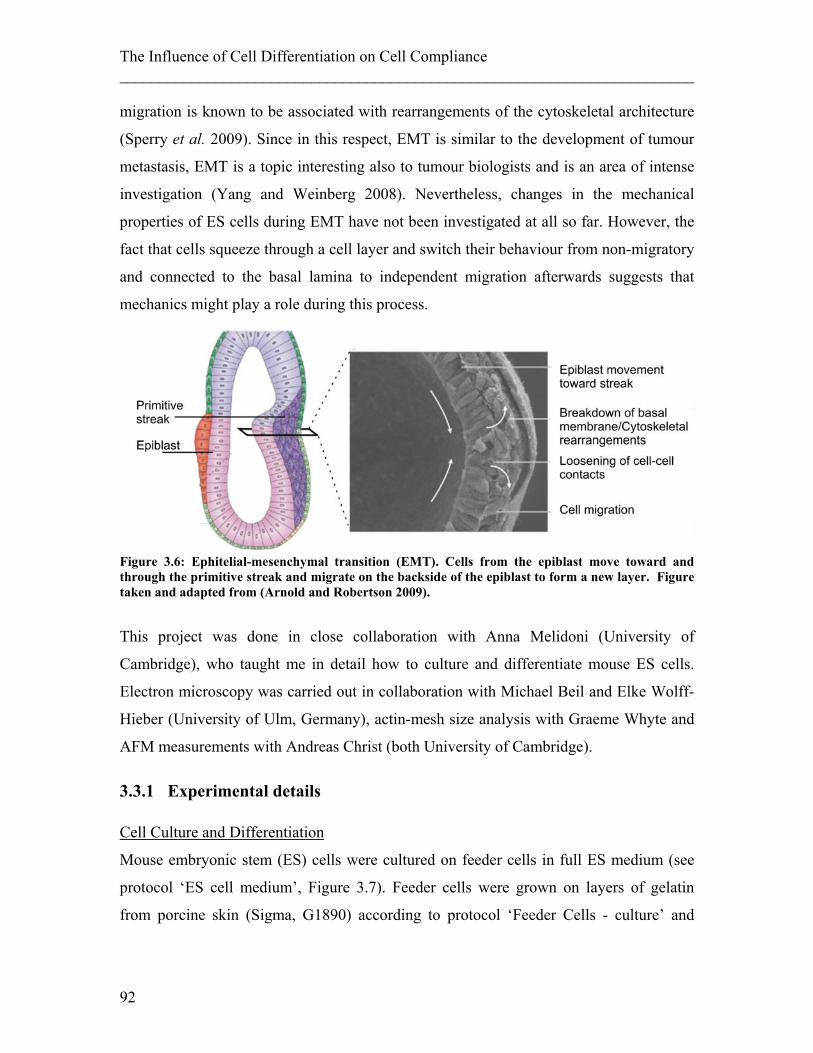
The Influence of Cell Differentiation on Cell Compliance ________________________________________________________________________ migration is known to be associated with rearrangements of the cytoskeletal architecture
(Sperry et al. 2009). Since in this respect, EMT is similar to the development of tumour
metastasis, EMT is a topic interesting also to tumour biologists and is an area of intense
investigation (Yang and Weinberg 2008). Nevertheless, changes in the mechanical
properties of ES cells during EMT have not been investigated at all so far. However, the
fact that cells squeeze through a cell layer and switch their behaviour from non-migratory
and connected to the basal lamina to independent migration afterwards suggests that
mechanics might play a role during this process.
Figure 3.6: Ephitelial-mesenchymal transition (EMT). Cells from the epiblast move toward and through the primitive streak and migrate on the backside of the epiblast to form a new layer. Figure taken and adapted from (Arnold and Robertson 2009).
This project was done in close collaboration with Anna Melidoni (University of
Cambridge), who taught me in detail how to culture and differentiate mouse ES cells.
Electron microscopy was carried out in collaboration with Michael Beil and Elke Wolff-
Hieber (University of Ulm, Germany), actin-mesh size analysis with Graeme Whyte and
AFM measurements with Andreas Christ (both University of Cambridge).
3.3.1 Experimental details Cell Culture and Differentiation
Mouse embryonic stem (ES) cells were cultured on feeder cells in full ES medium (see
protocol ‘ES cell medium’, Figure 3.7). Feeder cells were grown on layers of gelatin
from porcine skin (Sigma, G1890) according to protocol ‘Feeder Cells - culture’ and
92
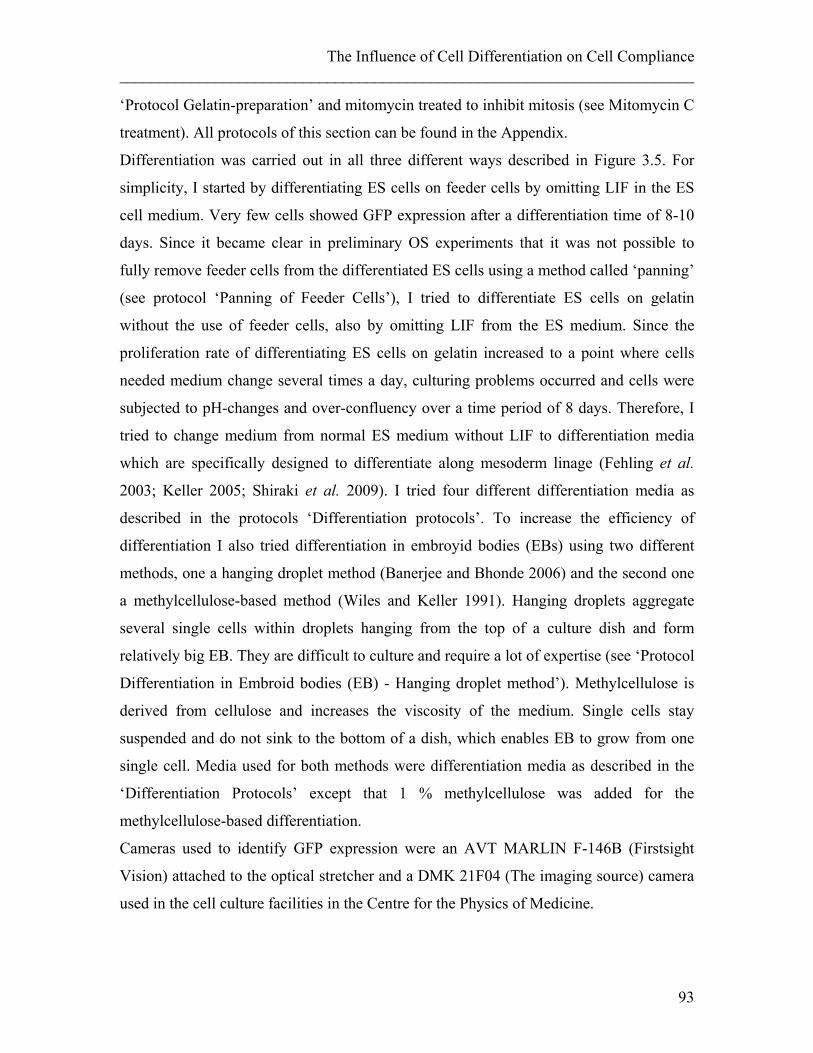
The Influence of Cell Differentiation on Cell Compliance ________________________________________________________________________
‘Protocol Gelatin-preparation’ and mitomycin treated to inhibit mitosis (see Mitomycin C
treatment). All protocols of this section can be found in the Appendix.
Differentiation was carried out in all three different ways described in Figure 3.5. For
simplicity, I started by differentiating ES cells on feeder cells by omitting LIF in the ES
cell medium. Very few cells showed GFP expression after a differentiation time of 8-10
days. Since it became clear in preliminary OS experiments that it was not possible to
fully remove feeder cells from the differentiated ES cells using a method called ‘panning’
(see protocol ‘Panning of Feeder Cells’), I tried to differentiate ES cells on gelatin
without the use of feeder cells, also by omitting LIF from the ES medium. Since the
proliferation rate of differentiating ES cells on gelatin increased to a point where cells
needed medium change several times a day, culturing problems occurred and cells were
subjected to pH-changes and over-confluency over a time period of 8 days. Therefore, I
tried to change medium from normal ES medium without LIF to differentiation media
which are specifically designed to differentiate along mesoderm linage (Fehling et al.
2003; Keller 2005; Shiraki et al. 2009). I tried four different differentiation media as
described in the protocols ‘Differentiation protocols’. To increase the efficiency of
differentiation I also tried differentiation in embroyid bodies (EBs) using two different
methods, one a hanging droplet method (Banerjee and Bhonde 2006) and the second one
a methylcellulose-based method (Wiles and Keller 1991). Hanging droplets aggregate
several single cells within droplets hanging from the top of a culture dish and form
relatively big EB. They are difficult to culture and require a lot of expertise (see ‘Protocol
Differentiation in Embroid bodies (EB) - Hanging droplet method’). Methylcellulose is
derived from cellulose and increases the viscosity of the medium. Single cells stay
suspended and do not sink to the bottom of a dish, which enables EB to grow from one
single cell. Media used for both methods were differentiation media as described in the
‘Differentiation Protocols’ except that 1 % methylcellulose was added for the
methylcellulose-based differentiation.
Cameras used to identify GFP expression were an AVT MARLIN F-146B (Firstsight
Vision) attached to the optical stretcher and a DMK 21F04 (The imaging source) camera
used in the cell culture facilities in the Centre for the Physics of Medicine.
93
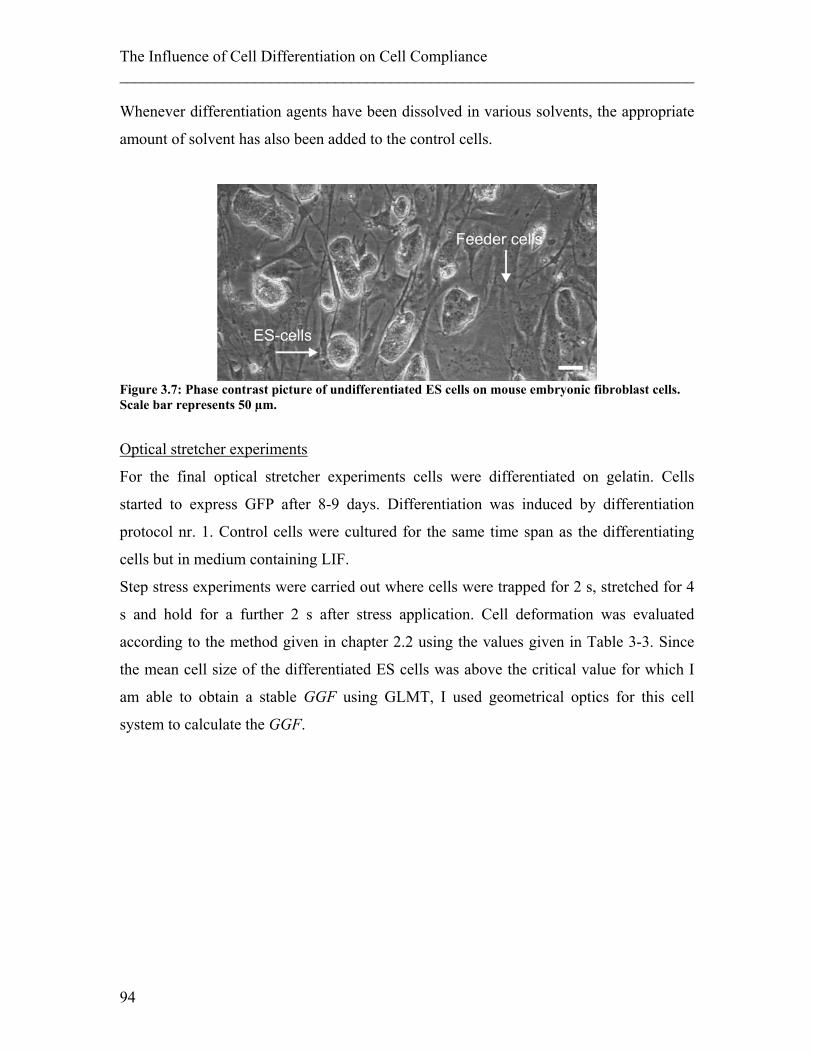
The Influence of Cell Differentiation on Cell Compliance ________________________________________________________________________ Whenever differentiation agents have been dissolved in various solvents, the appropriate
amount of solvent has also been added to the control cells.
Figure 3.7: Phase contrast picture of undifferentiated ES cells on mouse embryonic fibroblast cells. Scale bar represents 50 µm.
Optical stretcher experiments
For the final optical stretcher experiments cells were differentiated on gelatin. Cells
started to express GFP after 8-9 days. Differentiation was induced by differentiation
protocol nr. 1. Control cells were cultured for the same time span as the differentiating
cells but in medium containing LIF.
Step stress experiments were carried out where cells were trapped for 2 s, stretched for 4
s and hold for a further 2 s after stress application. Cell deformation was evaluated
according to the method given in chapter 2.2 using the values given in Table 3-3. Since
the mean cell size of the differentiated ES cells was above the critical value for which I
am able to obtain a stable GGF using GLMT, I used geometrical optics for this cell
system to calculate the GGF.
94
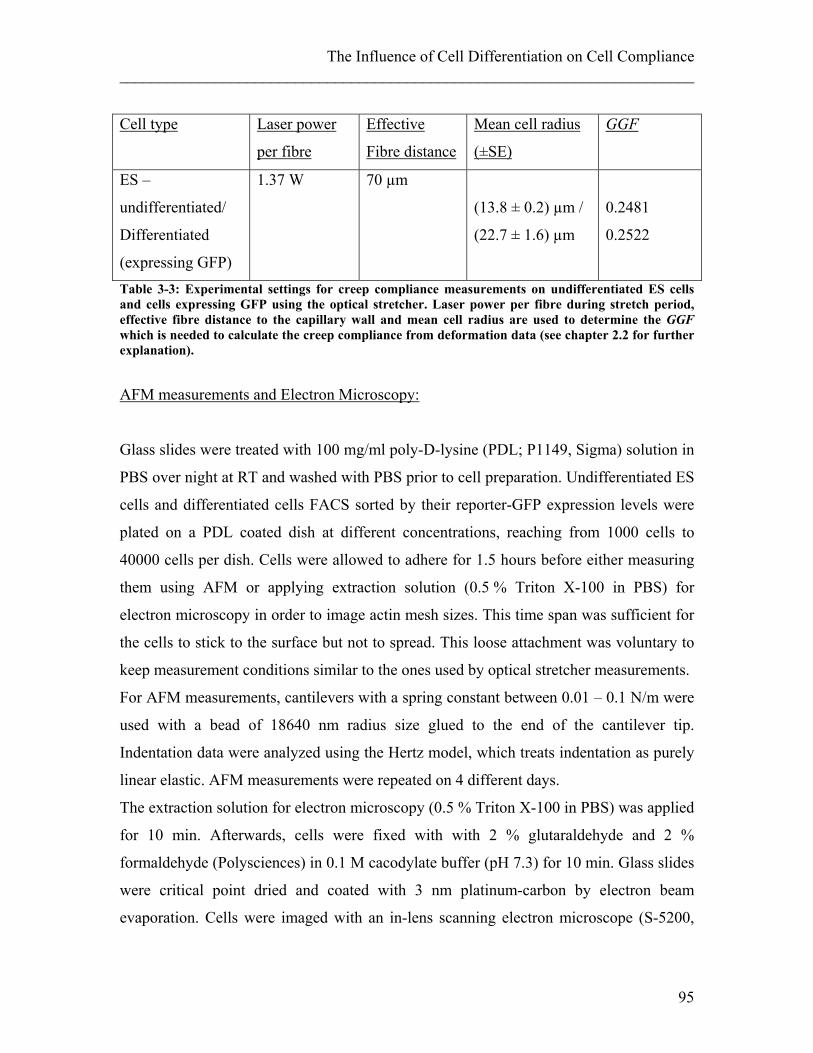
The Influence of Cell Differentiation on Cell Compliance ________________________________________________________________________
GGFCell type Laser power
per fibre
Effective
Fibre distance
Mean cell radius
(±SE)
ES –
undifferentiated/
Differentiated
(expressing GFP)
1.37 W 70 µm
(13.8 ± 0.2) µm /
(22.7 ± 1.6) µm
0.2481
0.2522
Table 3-3: Experimental settings for creep compliance measurements on undifferentiated ES cells and cells expressing GFP using the optical stretcher. Laser power per fibre during stretch period, effective fibre distance to the capillary wall and mean cell radius are used to determine the GGF which is needed to calculate the creep compliance from deformation data (see chapter 2.2 for further explanation).
AFM measurements and Electron Microscopy:
Glass slides were treated with 100 mg/ml poly-D-lysine (PDL; P1149, Sigma) solution in
PBS over night at RT and washed with PBS prior to cell preparation. Undifferentiated ES
cells and differentiated cells FACS sorted by their reporter-GFP expression levels were
plated on a PDL coated dish at different concentrations, reaching from 1000 cells to
40000 cells per dish. Cells were allowed to adhere for 1.5 hours before either measuring
them using AFM or applying extraction solution (0.5 % Triton X-100 in PBS) for
electron microscopy in order to image actin mesh sizes. This time span was sufficient for
the cells to stick to the surface but not to spread. This loose attachment was voluntary to
keep measurement conditions similar to the ones used by optical stretcher measurements.
For AFM measurements, cantilevers with a spring constant between 0.01 – 0.1 N/m were
used with a bead of 18640 nm radius size glued to the end of the cantilever tip.
Indentation data were analyzed using the Hertz model, which treats indentation as purely
linear elastic. AFM measurements were repeated on 4 different days.
The extraction solution for electron microscopy (0.5 % Triton X-100 in PBS) was applied
for 10 min. Afterwards, cells were fixed with with 2 % glutaraldehyde and 2 %
formaldehyde (Polysciences) in 0.1 M cacodylate buffer (pH 7.3) for 10 min. Glass slides
were critical point dried and coated with 3 nm platinum-carbon by electron beam
evaporation. Cells were imaged with an in-lens scanning electron microscope (S-5200,
95
The Influence of Cell Differentiation on Cell Compliance ________________________________________________________________________ Hitachi). For mesh size analysis, individual actin loops have been outlined by hand. Their
area and perimeter was analyzed using a custom written LabView program.
3.3.2 Results I differentiated mouse ES cells in three different ways, namely on feeder cells, on gelatin
(Figure 3.8) and as embryoid bodies (EB) (Figure 3.9 and Figure 3.10). The cell line used
expresses GFP when brachyury is expressed, a sign for mesoderm differentiation.
Differentiation on feeder cells was not useful for my experiments since I was unable to
separate feeder cells and ES cells successfully. This problem was solved by culturing ES
cells on gelatin for one passage before measuring the control population. Differentiation
on gelatin was first carried out by omitting LIF from the ES culture medium for a general
differentiation. I was able to detect GFP expressing cells after a period of 8-9 days. Cells
were proliferating extremely fast and cell medium needed to be exchanged within
extremely short times. Differentiating cells also needed to be passaged and transferred to
new flasks in lower concentration during this time due to the over-confluency. This
mouse ES cell type is not adapted to proliferate on gelatin without feeder cells for a
longer period of time, which caused problems during the eight days needed to
differentiate. Nevertheless, I was able to obtain a high enough number of cells of which
10-20 % were differentiated and express GFP. I was able to carry out preliminary
experiments in the optical stretcher. As shown in Figure 3.11, cells which did express
GFP were morphologically different, especially larger in size, deformed at least four
times more than undifferentiated cells and relaxed after stress application, contrary to the
undifferentiated cells. Nevertheless, I was not able to measure enough cells to make
confident statistical analysis (n = 7 GFP expressing cells) because GFP fluorescence was
extremely difficult to detect. Since differentiation took about 8 days until I could detect
GFP expression I encountered many culturing difficulties such as over-confluency and
pH-change of the culture medium. Therefore, I was not convinced if the differences
measured in my preliminary data were really due to mechanical and functional changes
or due to culturing artifacts. This was the reason why I worked on different
differentiation protocols to increase speed of differentiation as well as efficiency. I tried
four different differentiation media to induce specific mesoderm differentiation. To
96
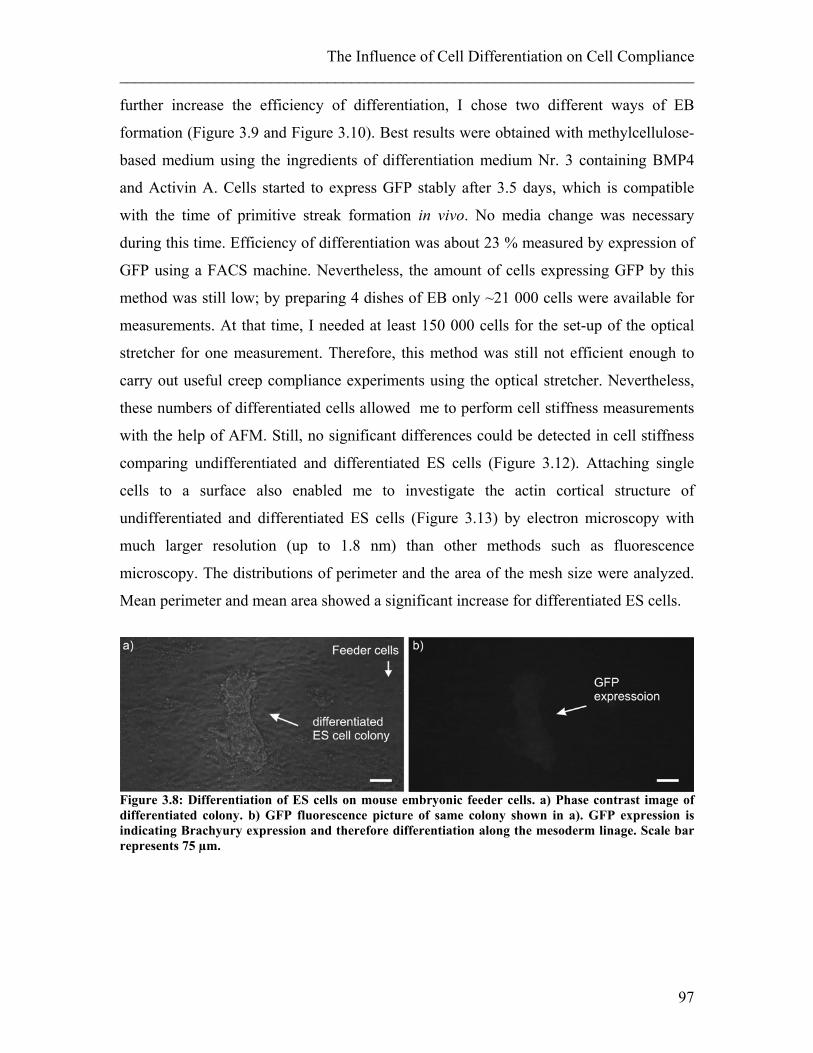
The Influence of Cell Differentiation on Cell Compliance ________________________________________________________________________
further increase the efficiency of differentiation, I chose two different ways of EB
formation (Figure 3.9 and Figure 3.10). Best results were obtained with methylcellulose-
based medium using the ingredients of differentiation medium Nr. 3 containing BMP4
and Activin A. Cells started to express GFP stably after 3.5 days, which is compatible
with the time of primitive streak formation in vivo. No media change was necessary
during this time. Efficiency of differentiation was about 23 % measured by expression of
GFP using a FACS machine. Nevertheless, the amount of cells expressing GFP by this
method was still low; by preparing 4 dishes of EB only ~21 000 cells were available for
measurements. At that time, I needed at least 150 000 cells for the set-up of the optical
stretcher for one measurement. Therefore, this method was still not efficient enough to
carry out useful creep compliance experiments using the optical stretcher. Nevertheless,
these numbers of differentiated cells allowed me to perform cell stiffness measurements
with the help of AFM. Still, no significant differences could be detected in cell stiffness
comparing undifferentiated and differentiated ES cells (Figure 3.12). Attaching single
cells to a surface also enabled me to investigate the actin cortical structure of
undifferentiated and differentiated ES cells (Figure 3.13) by electron microscopy with
much larger resolution (up to 1.8 nm) than other methods such as fluorescence
microscopy. The distributions of perimeter and the area of the mesh size were analyzed.
Mean perimeter and mean area showed a significant increase for differentiated ES cells.
Figure 3.8: Differentiation of ES cells on mouse embryonic feeder cells. a) Phase contrast image of differentiated colony. b) GFP fluorescence picture of same colony shown in a). GFP expression is indicating Brachyury expression and therefore differentiation along the mesoderm linage. Scale bar represents 75 µm.
97
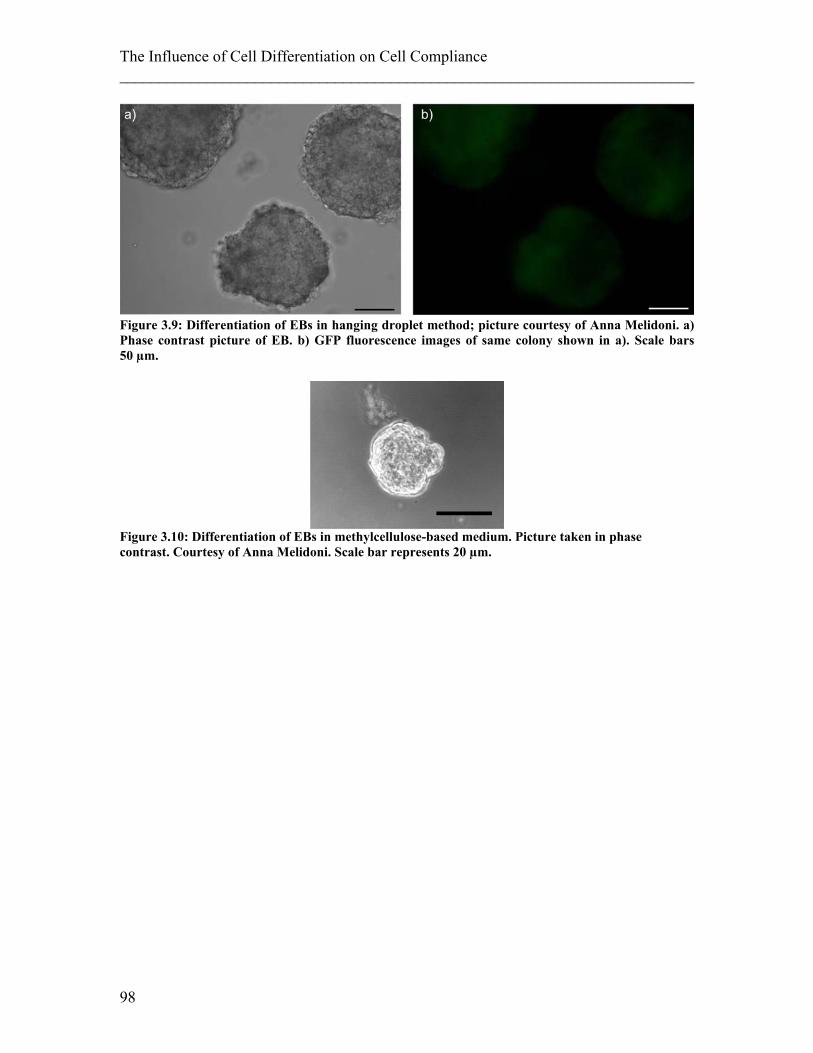
The Influence of Cell Differentiation on Cell Compliance ________________________________________________________________________
Figure 3.9: Differentiation of EBs in hanging droplet method; picture courtesy of Anna Melidoni. a) Phase contrast picture of EB. b) GFP fluorescence images of same colony shown in a). Scale bars 50 µm.
Figure 3.10: Differentiation of EBs in methylcellulose-based medium. Picture taken in phase contrast. Courtesy of Anna Melidoni. Scale bar represents 20 µm.
98
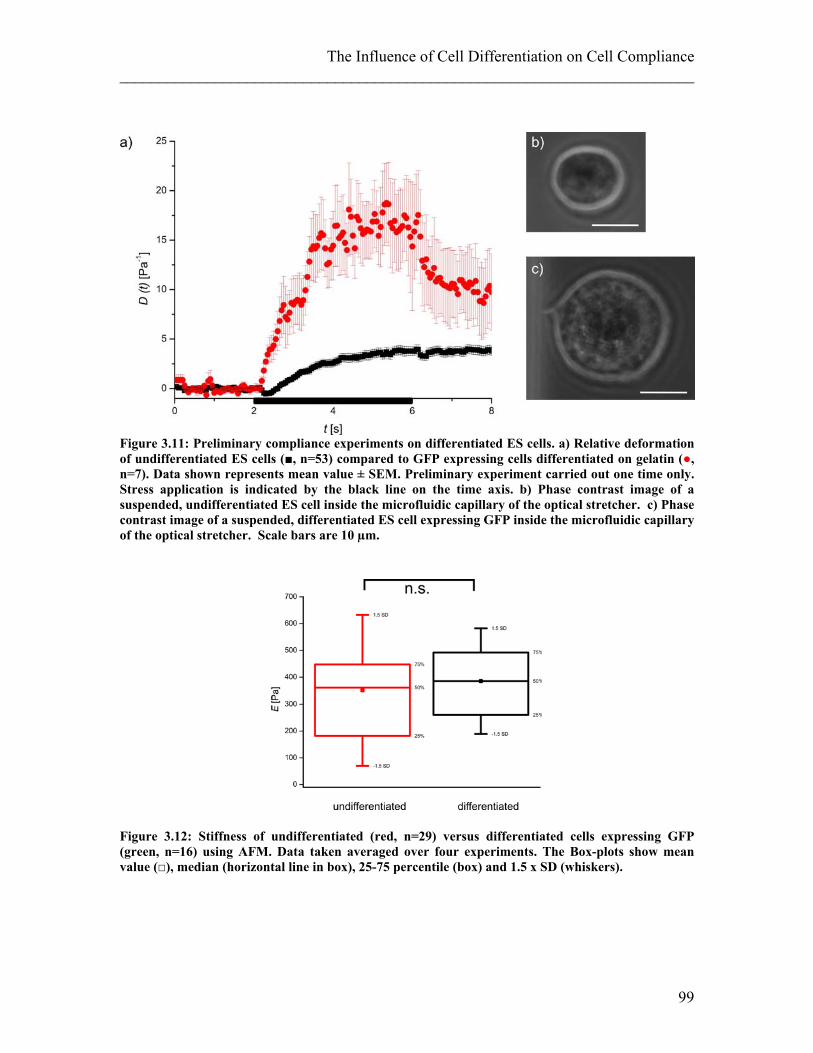
The Influence of Cell Differentiation on Cell Compliance ________________________________________________________________________
Figure 3.11: Preliminary compliance experiments on differentiated ES cells. a) Relative deformation of undifferentiated ES cells (■, n=53) compared to GFP expressing cells differentiated on gelatin (●, n=7). Data shown represents mean value ± SEM. Preliminary experiment carried out one time only. Stress application is indicated by the black line on the time axis. b) Phase contrast image of a suspended, undifferentiated ES cell inside the microfluidic capillary of the optical stretcher. c) Phase contrast image of a suspended, differentiated ES cell expressing GFP inside the microfluidic capillary of the optical stretcher. Scale bars are 10 µm.
Figure 3.12: Stiffness of undifferentiated (red, n=29) versus differentiated cells expressing GFP (green, n=16) using AFM. Data taken averaged over four experiments. The Box-plots show mean value (□), median (horizontal line in box), 25-75 percentile (box) and 1.5 x SD (whiskers).
99
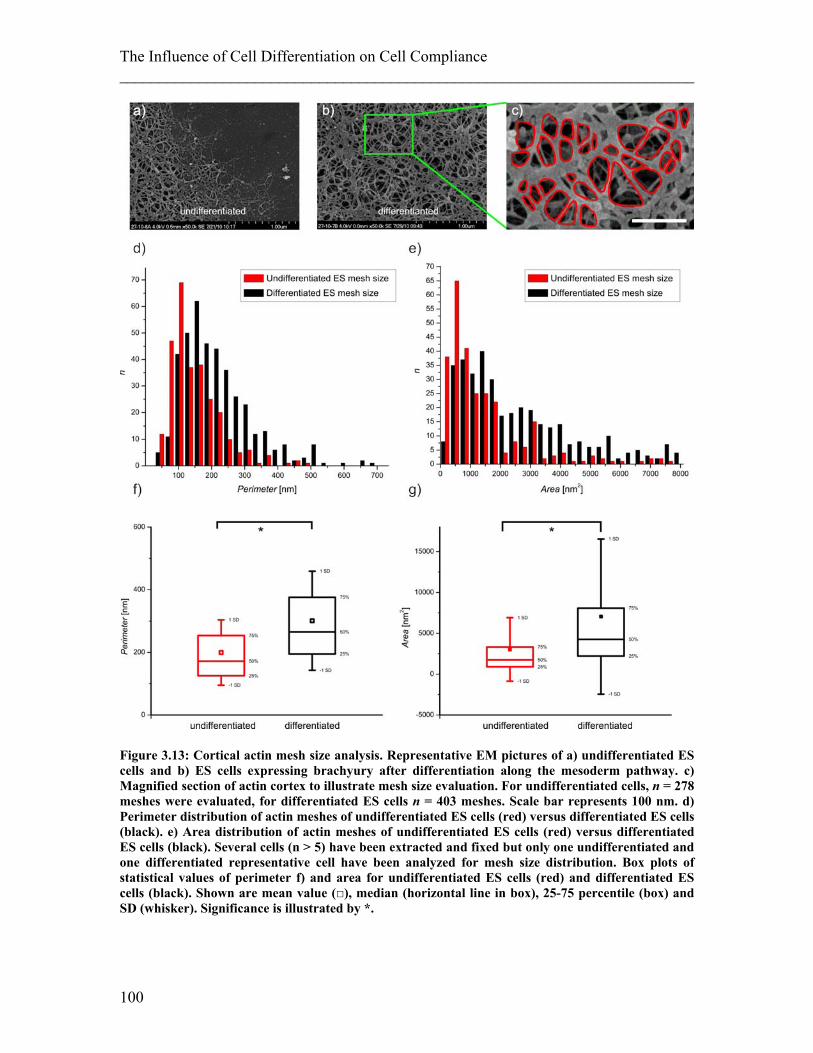
The Influence of Cell Differentiation on Cell Compliance ________________________________________________________________________
Figure 3.13: Cortical actin mesh size analysis. Representative EM pictures of a) undifferentiated ES cells and b) ES cells expressing brachyury after differentiation along the mesoderm pathway. c) Magnified section of actin cortex to illustrate mesh size evaluation. For undifferentiated cells, n = 278 meshes were evaluated, for differentiated ES cells n = 403 meshes. Scale bar represents 100 nm. d) Perimeter distribution of actin meshes of undifferentiated ES cells (red) versus differentiated ES cells (black). e) Area distribution of actin meshes of undifferentiated ES cells (red) versus differentiated ES cells (black). Several cells (n > 5) have been extracted and fixed but only one undifferentiated and one differentiated representative cell have been analyzed for mesh size distribution. Box plots of statistical values of perimeter f) and area for undifferentiated ES cells (red) and differentiated ES cells (black). Shown are mean value (□), median (horizontal line in box), 25-75 percentile (box) and SD (whisker). Significance is illustrated by *.
100
The Influence of Cell Differentiation on Cell Compliance ________________________________________________________________________
3.3.3 Discussion My aim was to investigate if I could detect mechanical differences of undifferentiated,
pluripotent mouse ES cells compared to cells which are further differentiated. The cells
used in these experiments have GFP targeted to the brachyury locus. Brachyury is a
protein expressed during a specific time point (endothelial mesodermal transition - EMT)
during mesoderm differentiation. The expression of brachyury is associated with
functional changes during EMT. During this period cells lose contact to their
neighbouring cells, squeeze through the physical constriction of the primitive streak and
start migrating on the back of the epiblast to form a new cell layer. It was my aim to
investigate if not only the gene expression changes during this time but also mechanical
properties. Since differentiation did not work as easily as I had expected, I actually spent
the largest part of my time on this project optimising the differentiation protocol by
varying the differentiation techniques and differentiation media. Preliminary experiments
differentiating ES cells on gelatin using an unspecific differentiation protocol did show a
trend of higher compliance with further differentiation but these differences were not
significant, mainly due to very low numbers of cells measured. This increased
compliance is likely due to the increased actin mesh size of differentiated ES cells. Such
an increase of polymer network mesh size has been shown before theoretically to be
linked to a decrease in stiffness (MacKintosh et al. 1995). The trend of increased
compliance and increased relaxation behaviour in the differentiated cells is interesting
regarding the functional change ES cells undergo during EMT. Before differentiation, ES
cells do not migrate actively. During EMT, the differentiating cells have to deform their
whole cell body to migrate through the primitive streak and form a new layer on the back
of the epiblast. The idea that a cell’s relaxation behaviour after stress application can be
related to its migration behaviour through pores has been further explored on the NB4
cell system and is explained in detail in chapter 4.1. Throughout the experiments with the
ES cells, I became aware of several problems such as long differentiation time leading to
cell over growth and submission to uncontrolled pH-conditions. Therefore, I changed my
differentiation protocol to enhance specific mesoderm differentiation and tried to use two
3D-methods of embryoid body formation. As a result, I was able to steadily increase the
efficiency of stable differentiation on time scales similar to in-vivo differentiation. Best
101
The Influence of Cell Differentiation on Cell Compliance ________________________________________________________________________ results were obtained using a methylcellulose-based differentiation medium containing
BMP4 and Activin A forming EBs from single cells. Nevertheless, I was not able to
increase available number of differentiated cells to a level which would have allowed
sufficient experiments including necessary repetitions on the optical stretcher using the
set-up at that time. This led to two consequences: First, I used the few cells available to
perform AFM measurements and to image the actin cortex by electron microscopy and
secondly, I worked on a different version of the optical stretcher set-up which will be able
to handle much lower cell numbers (see chapter 6, monolithic glass chip). AFM
measurements did not reveal any mechanical differences. At this stage, this does not
answer the question if there are any differences in cell mechanics at all or if I simply was
not able to detect them. It proved to be of importance how long the cells adhered to the
substrate before measurement. Even though cells were generally given 1.5 hours in the
incubator to adhere, adherence continued during the measurement which did take up to
several hours. This time for attachment is reasonable concerning the changes of the
cytoskeleton during attachment when cells adhere. Once cells have formed focal
adhesions, they might also form actin stress fibres, which seem to have a influence on the
mechanical stiffness of cells as shown by Maloney et al. (Maloney et al. 2010). The
influence of stress fibres is also further discussed in chapter 5. During in-vivo
differentiation cells do not adhere to any hard substrates similar to the glass slides used in
AFM experiments, but only to neighbouring cells, which are orders of magnitude more
compliant.I therefore tried to measure pure cellular mechanical properties by letting the
cells barely attach to the surface. Nevertheless, differences in attachment were present
and might have influenced the experiments to an extent larger than possible differences
due to state of differentiation. Measuring cells at the other extreme of adherence, in total
suspension, can at least ensure a defined environment. This was the reason why I had
chosen optical stretcher measurements originally. Since the optical stretcher set-up
available to me during the time of my PhD was not able to handle such low cell numbers
I was not able to pursue this project any further.
Electron microscopy micrographs of the cortical actin of differentiated and
undifferentiated ES cells did show significant differences and are likely to be the
explanation for cells becoming more compliant during differentiation.
102
The Influence of Cell Differentiation on Cell Compliance ________________________________________________________________________
3.4 Summary Influence of Cell Differentiation on Cell Compliance To follow functional changes of cells in correlation with their mechanical compliance is a
relatively new approach. Previously, it had been shown successfully that it is possible to
distinguish between malignant cells and healthy cells and even to distinguish cancerous
from metastatic cells only by measuring mechanical properties (Guck et al. 2005). I was
interested if it is possible to follow even less dramatic functional changes as they occur
during the differentiation of stem cells. ‘Stem cell differentiation’ is a very general term
and can mean the development from one single cell into a complete embryo but also the
change from a promyelocytic blood cell into a fully mature neutrophil. I tried to
investigate various cell systems which are at different stages of differentiation with
higher or lower differentiation potential. In total, I investigated three cell systems. I
started with the differentiation of promyelocytic cells into the direction of neutrophils.
The cells used for this part were NB4 cells, a bipotent cell line. I measured cell
compliance using an optical stretcher investigating cells in suspension, which is the
natural way of growing for NB4 cells but also for non-activated neutrophils. I was able to
show a significant increase in compliance when these cells differentiated. When
investigating the third cell system, the differentiation of mouse embryonic stem cells
along the mesoderm pathway, I achieved best differentiation results when cells were
cultured in a semi-attached state, namely in embryoid bodies, where cells do connect to
surrounding neighbour cells but not to any substrates. Nevertheless, I had to separate
cells out of these EB to investigate them. I was able to see a trend of cells becoming more
compliant during this differentiation which might be due to the significantly increased
actin mesh size but the amount of such cells I could culture using EB methods were not
sufficient to assure significance in these results. Since I already optimised the
differentiation protocol, the next step to increase statistics would be to increase the
number of measurements. Therefore, I designed and tested a different version of the
optical stretcher which will be much more suitable to measure low numbers of cells. This
version of a microfluidic chamber of the optical stretcher called monolithic glass chip is
further explained in chapter 6. Measuring the same cells by AFM letting them adhere for
1.5 h to a glass substrate did not show any significant differences.
103
The Influence of Cell Differentiation on Cell Compliance ________________________________________________________________________ My different results in the three stem cell systems opens interesting questions about the
way one should investigate cellular systems: Might it be possible that one can detect
differences in mechanical properties during functional changes such as differentiation
only when one investigates the cells in their natural surrounding? How well can the
natural surrounding of cells be mimicked when cells are cultured in-vitro? The surface of
hard plastic culture dishes does not match the natural environment for many cell types,
but measuring them in the other extreme, in total suspension, is only adequate for some
cells types, such as blood cells.
Besides investigating cell systems which do grow in different conditions of adherence I
also specifically looked at stem cells with lower and higher differentiation potential. The
fact that I could only detect significant differences in the compliance of the cell system
with the lowest differentiation potential might be due to surrounding factors. Such factors
could be cell culture and differentiation protocols which get far more complicated with
higher differentiation potential. Differentiation protocols for highly potent cells made
measurements partially unsuitable to investigate with the methods I had available during
my PhD. Nevertheless, this technical insufficiency inspired me to further develop the
tools to measure the compliance of suspended cells. I could show clearly on the example
of NB4 cells that it is possible to follow the differentiation of cells by investigating their
compliance and it would be of great benefit if this result could be reproduced on other
cell systems. Besides a deeper understanding of differentiation this knowledge would be
useful to distinguish stem cells from differentiated cells, which could then be used to
recognize stem cells easily without labelling them with artificial markers and without
mechanical contact. ‘Filtering’ stem cells by a simple, mechanical way out of embryonic
or mature tissue would facilitate basic research but also be relevant for the goals of
regenerative medicine.
104
Cell Mechanics and Migration ________________________________________________________________________
4. Cell Mechanics and Migration 4.1 Influence of Cellular Compliance on Migration 105
4.1.1 Experimental details 108 4.1.2 Results 113 4.1.3 Discussion 122
4.2 Influence of Mechanical Properties of the Surroundings on Migration 126 4.2.1 Experimental details 127 4.2.2 Results 129 4.2.3 Discussion 131
4.3 Summary Cell Mechanics and Migration 132 Cellular migration is the movement of cells from one place within the organism to
another. This can happen in an orchestrated, predefined way but also randomly (Blow
2007). Migration is needed for the development of an organisms but also for
housekeeping functions and the maintenance of homeostasis (Dormann and Weijer
2006). Uncontrolled migration can lead to several known but also unknown pathologies,
one very commonly known is the migration of malignant tumour cells during metastasis
(Duffy et al. 2008). In this chapter, I am investigating the influence which the compliance
of the cells itself has on their migration behaviour and potential ways to interfere with
this migration behaviour by changing cellular mechanics. Additionally, I am also looking
into the influence the mechanics of the surrounding material has on migration, especially
the dimension and the stiffness of the substrate on which cells are migrating.
4.1 Influence of Cellular Compliance on Migration Although the connection between cell migration and cell adhesion on flat surfaces has
been studied in detail (Even-Ram and Yamada 2005), the actual three dimensional
movement of cells through pores is not yet very well known. What has been observed so
far is that some cells need to secrete enzymes but also to change their shape in order to
penetrate pores, for example fibrosarcoma cells (Wolf et al. 2003). Weak adhesion or
non-adhesion migration processes are less studied but specifically important for
amoeboid cell migration as in the case of leukocyte migration. Amoeboid migration is a
intergrin-independent form of migration which can vary from a blebbing-like motility to
a cell gliding, both based on actin-polymerization (Lämmermann and Sixt 2009). The cell
105
Cell Mechanics and Migration ________________________________________________________________________ body needs to change its shape for this type of amoeboid motility and would be inhibited
by a rigid cell body (Suresh 2007). The stiffness and rigidity of cells is largely
determined by the cytoskeleton (see section 2.1). Within the cytoskeleton, actin fibres are
mainly resisting deformation while microtubules (MT) are involved in the polarization of
the cell shape and migration (Olins et al. 2000; Kole et al. 2005). Therefore, both
components have to be considered when trying to link cellular compliance to migration.
White blood cells (WBC) constitute a good system to study this relation between
compliance and amoeboid cell migration. Immature neutrophils, a subset of WBCs
situated in the bone marrow, do not migrate at all. This behaviour changes dramatically
once the cells differentiate; mature neutrophils are highly motile cells with an active part
in the immune response (Lichtman 1970, 1973). In my work, I used a promyelocytic cell
line (NB4) which can be differentiated into mature neutrophils by all-trans retinoic acid
(ATRA) (Lanotte et al. 1991). This cell line has originally been developed from samples
of a patient suffering from acute promyelocytic leukaemia, a disease which is treated also
using ATRA differentiation (Fenaux et al. 1999; de la Serna et al. 2008). On NB4 cells it
has been shown that such ATRA differentiation increases cell motility during
differentiation (Bruel et al. 2001). In the chapter 3.1 I could show these specific cells
increasing their compliance but did not yet relate this to migration effects, which I will do
in this chapter.
During ATRA differentiation treatment, acute promyelocytic leukaemia patients suffer in
about 26 % of all cases from a severe complication. Since this potentially lethal
complication is directly connected to the application of retinoic acid, it is known as
Retinoic-acid-syndrome (RAS) (Frankel et al. 1992; Tallman et al. 2000). Differentiated
cells in patients suffering from the RAS are highly increased in motility which leads to
pulmonary infiltrates, pleural and epicardial effusion, and generally infiltration of organs
with differentiating myeloid cells (Tallman et al. 2000). Understanding and remodelling
the cytoskeleton might help to interfere with this increased migration behaviour of
differentiated leukocytes and might be helpful to treat patients suffering from RA-
syndrome in future. Therefore, I investigated the global mechanical compliance of
differentiated NB4 cells relevant for migration. Also, I tried to evaluate the effect of
interfering with the cytoskeleton by specific drug treatments on this specific migration
106
Cell Mechanics and Migration ________________________________________________________________________
behaviour. To interfere with the cytoskeleton I chose paclitaxel to stabilize MTs and
evaluated its effect on the compliance of differentiated NB4 cells as well as possible
changes in migration behaviour. Since neutrophils are cells growing in suspension, the
optical stretcher was the best tool to measure compliance without causing unspecific
artefacts due to attachment. To investigate migration behaviour I chose several different
methods: a two dimensional (2D) migration assay using Boyden Chambers and two
different three dimensional (3D) assays. In one of the 3D assays single cells are observed
entering micro-channels which represent pores. In a second method, an inverted colloid
crystal (ICC) hydrogel is used where the migration of more cells can be followed
compared to the single channel assay. ICC experiments helped to increase statistics and
confirm data from the two previous methods. Since it has been reported that stabilizing of
MTs can have an effect on the actin-myosin interaction (Rodriguez et al. 2003) my
collaborators also treated ATRA differentiated cells with a myosin II inhibiting drug
(blebbistatin) additionally to paclitaxel and measured their migration behaviour using
Boyden chambers.
Most of the content of this work was published in (Lautenschläger et al. 2009) and (Da
Silva et al. 2009). I collaborated with several people during this project, mainly Prof. Beil
(University of Ulm, providing cells and general biological assistance on the project),
Arlette Bruel (University Paris 7, Boyden Chamber Assays), Joakim Da Silva (University
of Cambridge, 3D inverted colloid hydogels) and Pouria Moshayedi (University of
Cambridge, 2D hydrogels). Initial help in analyzing 2D migration was provided by Pietro
Cicuta (University of Cambridge).
107
Cell Mechanics and Migration ________________________________________________________________________
4.1.1 Experimental details Cell culture and drug treatment: NB4 cells were cultured in RPMI 1640 medium containing 10 % FBS, 2 mM L-
glutamine, and 100 U/ml penicillin/streptomycin (Invitrogen). For differentiation 5 µM
all-trans retinoic acid (ATRA) concentration was added to the cell medium for three days.
Mature neutrophils were obtained from whole blood using the density gradient
Polymorphprep (Axisshield). Cell staining in migration assays using ICC occurred 1 h
prior to the experiment using 250 nM Syto9 fluorescent nucleic acid stain (Invitrogen)
added to the cell medium. Paclitaxel was applied at a concentration of 5 µM and
blebbistatin at 100 µM for 1 h prior to experiments. As chemoattractant I chose 100 nM
fMLP solution, which has been shown to attract NB4 cells but also differentiated
neutrophils (Feng et al. 1998; Csomos et al. 2010). Whenever differentiation agents or
cytoskeletal drugs have been dissolved in solvents, the appropriate amount of solvent has
also been added to the control cells. All chemicals were obtained from Sigma Aldrich
unless stated otherwise.
Optical stretcher experiments:
Optical stretcher compliance experiments were performed using creep stress experiments
where cells were trapped for 1 s, stretched for 2 s at higher stress and observed for
another 2 s at low stress application. Cell compliance was evaluated from deformation
data using the GGF according to the method given in chapter ‘Optical stretcher’. The
GGF was calculated with the help of data given in Table 4-1. All experiments were done
at room temperature. Statistical analysis to determine significant differences between two
populations was performed with an independent t test at the 95 % confidence level.
108
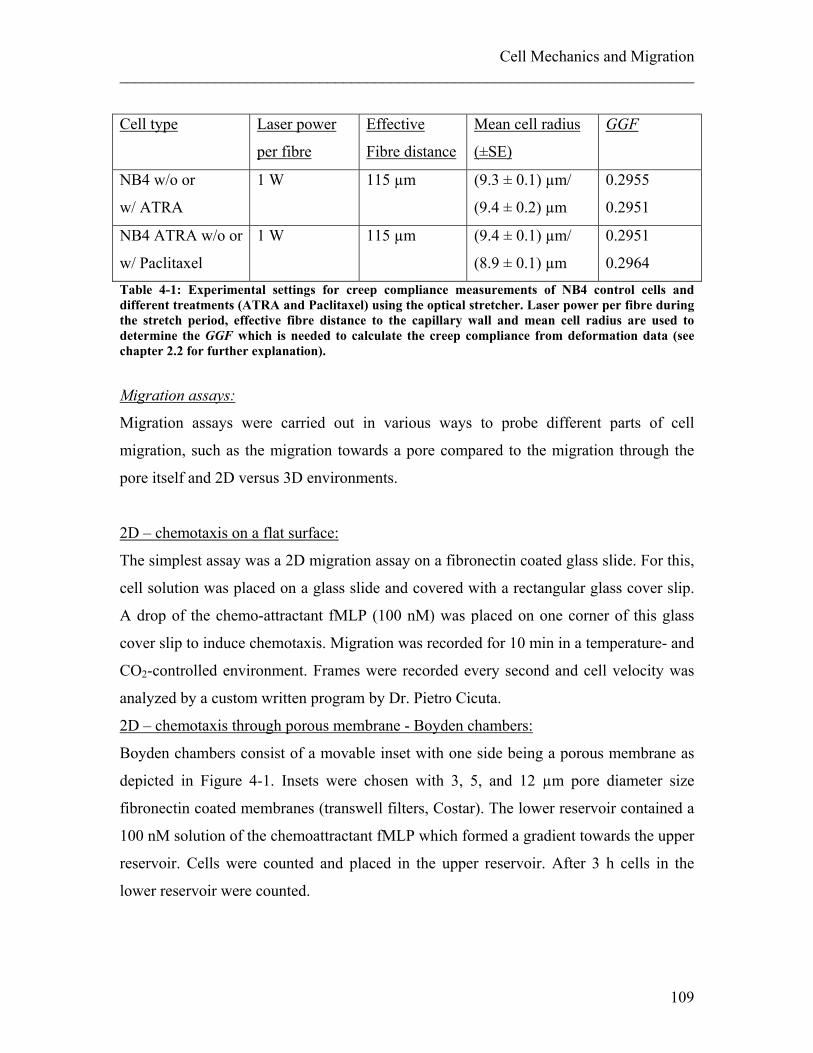
Cell Mechanics and Migration ________________________________________________________________________
GGFCell type Laser power
per fibre
Effective
Fibre distance
Mean cell radius
(±SE)
NB4 w/o or
w/ ATRA
1 W
115 µm (9.3 ± 0.1) µm/
(9.4 ± 0.2) µm
0.2955
0.2951
NB4 ATRA w/o or
w/ Paclitaxel
1 W
115 µm (9.4 ± 0.1) µm/
(8.9 ± 0.1) µm
0.2951
0.2964 Table 4-1: Experimental settings for creep compliance measurements of NB4 control cells and different treatments (ATRA and Paclitaxel) using the optical stretcher. Laser power per fibre during the stretch period, effective fibre distance to the capillary wall and mean cell radius are used to determine the GGF which is needed to calculate the creep compliance from deformation data (see chapter 2.2 for further explanation).
Migration assays:
Migration assays were carried out in various ways to probe different parts of cell
migration, such as the migration towards a pore compared to the migration through the
pore itself and 2D versus 3D environments.
2D – chemotaxis on a flat surface:
The simplest assay was a 2D migration assay on a fibronectin coated glass slide. For this,
cell solution was placed on a glass slide and covered with a rectangular glass cover slip.
A drop of the chemo-attractant fMLP (100 nM) was placed on one corner of this glass
cover slip to induce chemotaxis. Migration was recorded for 10 min in a temperature- and
CO2-controlled environment. Frames were recorded every second and cell velocity was
analyzed by a custom written program by Dr. Pietro Cicuta.
2D – chemotaxis through porous membrane - Boyden chambers:
Boyden chambers consist of a movable inset with one side being a porous membrane as
depicted in Figure 4-1. Insets were chosen with 3, 5, and 12 µm pore diameter size
fibronectin coated membranes (transwell filters, Costar). The lower reservoir contained a
100 nM solution of the chemoattractant fMLP which formed a gradient towards the upper
reservoir. Cells were counted and placed in the upper reservoir. After 3 h cells in the
lower reservoir were counted.
109
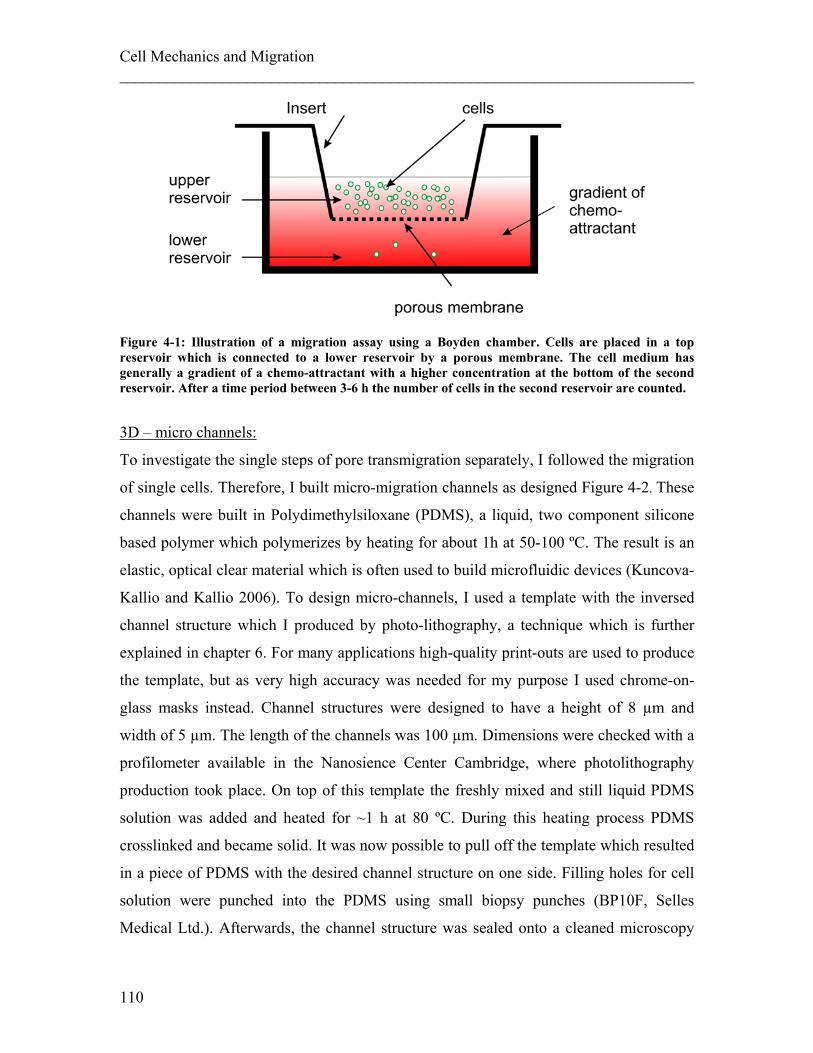
Cell Mechanics and Migration ________________________________________________________________________
Figure 4-1: Illustration of a migration assay using a Boyden chamber. Cells are placed in a top reservoir which is connected to a lower reservoir by a porous membrane. The cell medium has generally a gradient of a chemo-attractant with a higher concentration at the bottom of the second reservoir. After a time period between 3-6 h the number of cells in the second reservoir are counted.
3D – micro channels:
To investigate the single steps of pore transmigration separately, I followed the migration
of single cells. Therefore, I built micro-migration channels as designed Figure 4-2. These
channels were built in Polydimethylsiloxane (PDMS), a liquid, two component silicone
based polymer which polymerizes by heating for about 1h at 50-100 ºC. The result is an
elastic, optical clear material which is often used to build microfluidic devices (Kuncova-
Kallio and Kallio 2006). To design micro-channels, I used a template with the inversed
channel structure which I produced by photo-lithography, a technique which is further
explained in chapter 6. For many applications high-quality print-outs are used to produce
the template, but as very high accuracy was needed for my purpose I used chrome-on-
glass masks instead. Channel structures were designed to have a height of 8 µm and
width of 5 µm. The length of the channels was 100 µm. Dimensions were checked with a
profilometer available in the Nanosience Center Cambridge, where photolithography
production took place. On top of this template the freshly mixed and still liquid PDMS
solution was added and heated for ~1 h at 80 ºC. During this heating process PDMS
crosslinked and became solid. It was now possible to pull off the template which resulted
in a piece of PDMS with the desired channel structure on one side. Filling holes for cell
solution were punched into the PDMS using small biopsy punches (BP10F, Selles
Medical Ltd.). Afterwards, the channel structure was sealed onto a cleaned microscopy
110
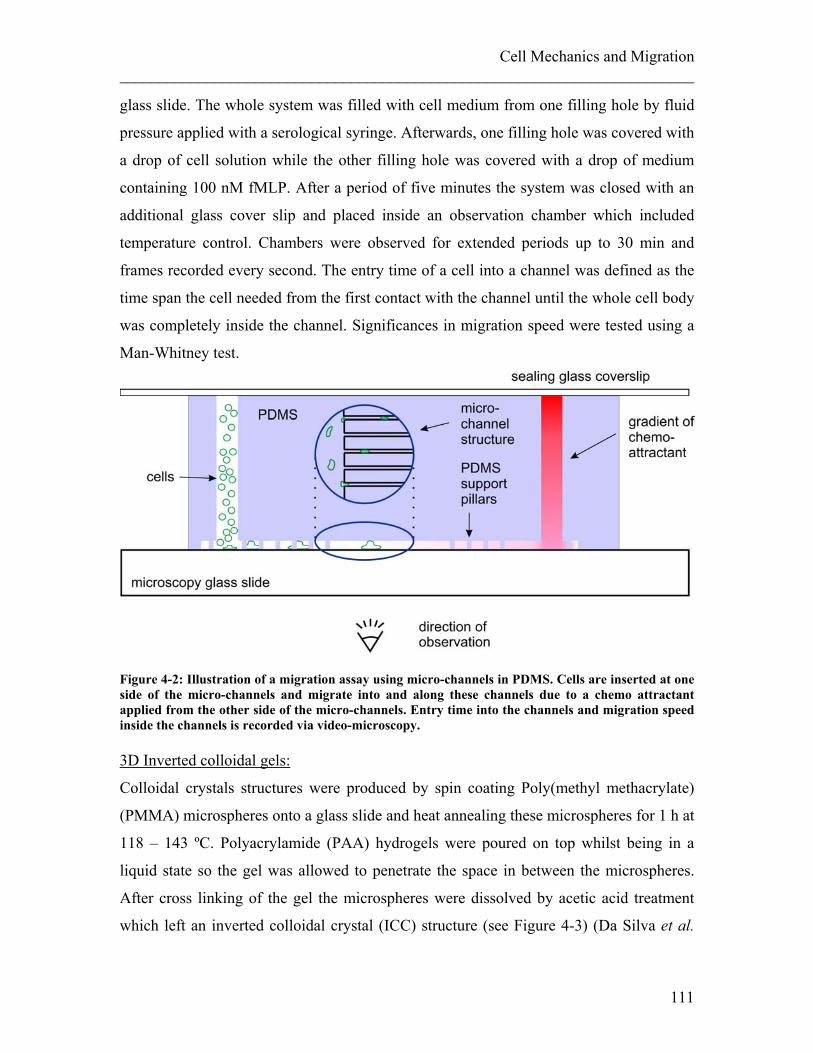
Cell Mechanics and Migration ________________________________________________________________________
glass slide. The whole system was filled with cell medium from one filling hole by fluid
pressure applied with a serological syringe. Afterwards, one filling hole was covered with
a drop of cell solution while the other filling hole was covered with a drop of medium
containing 100 nM fMLP. After a period of five minutes the system was closed with an
additional glass cover slip and placed inside an observation chamber which included
temperature control. Chambers were observed for extended periods up to 30 min and
frames recorded every second. The entry time of a cell into a channel was defined as the
time span the cell needed from the first contact with the channel until the whole cell body
was completely inside the channel. Significances in migration speed were tested using a
Man-Whitney test.
Figure 4-2: Illustration of a migration assay using micro-channels in PDMS. Cells are inserted at one side of the micro-channels and migrate into and along these channels due to a chemo attractant applied from the other side of the micro-channels. Entry time into the channels and migration speed inside the channels is recorded via video-microscopy. 3D Inverted colloidal gels:
Colloidal crystals structures were produced by spin coating Poly(methyl methacrylate)
(PMMA) microspheres onto a glass slide and heat annealing these microspheres for 1 h at
118 – 143 ºC. Polyacrylamide (PAA) hydrogels were poured on top whilst being in a
liquid state so the gel was allowed to penetrate the space in between the microspheres.
After cross linking of the gel the microspheres were dissolved by acetic acid treatment
which left an inverted colloidal crystal (ICC) structure (see Figure 4-3) (Da Silva et al.
111
Cell Mechanics and Migration ________________________________________________________________________ 2009). For migration experiments, gels with 6.5 µm cavity-cavity pore diameter and
10.7 µm surface pores were chosen with a bulk gel shear modulus of 10 kPa. Gels were
treated with 100 µg/ml poly-D-lysine PBS solution for 1 h and washed thoroughly before
cell migration experiments to facilitate cell adhesion. Cells were pipetted on top of the
scaffold and allowed to migrate into deeper layers for a fixed period between 3 – 5 h. The
migration depth in the scaffolds was defined as the mean depths at which cells were
found in the scaffold after the migration period. The position of individual cells within
the gel structure was obtained using public domain software ImageJ and plug-ins
available for download (Schmid; Bolte and Cordelieres 2006). Cells which did not
migrate into the scaffold at all were excluded from analysis to eliminate variations due to
cell concentrations at the surface. Statistical significance of mean migration depths was
evaluated using an independent two-sample t-test, two-tailed and without assuming equal
variance.
112
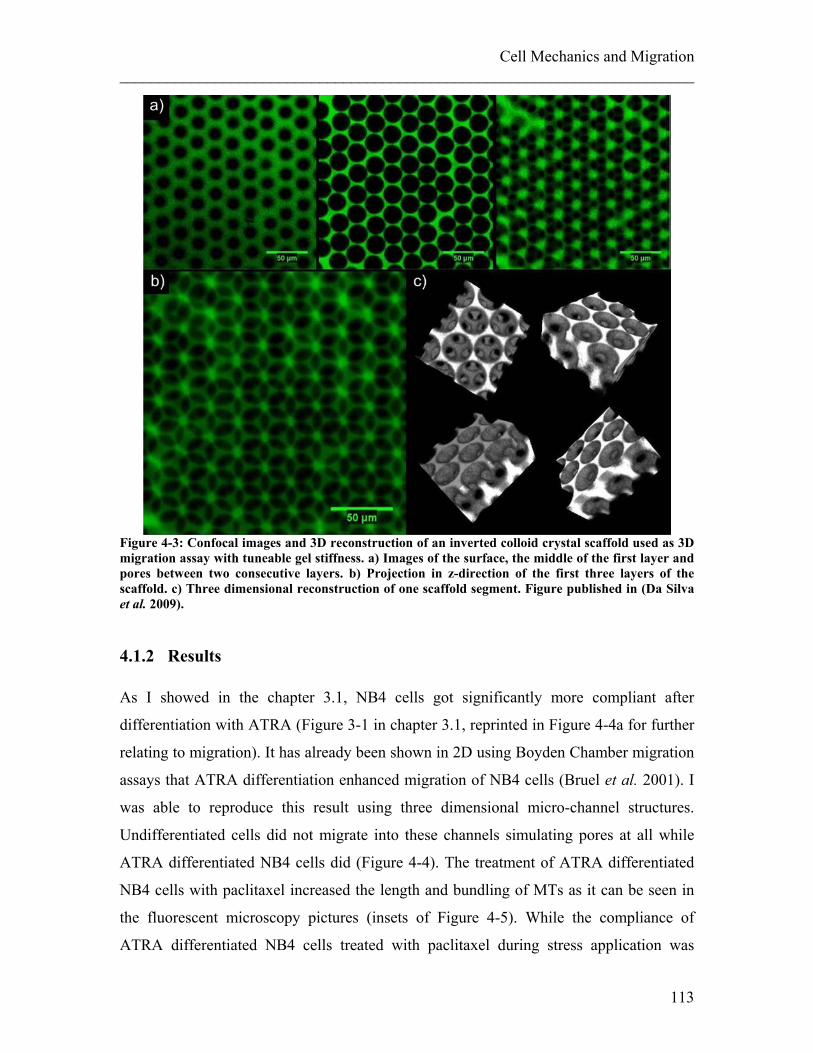
Cell Mechanics and Migration ________________________________________________________________________
Figure 4-3: Confocal images and 3D reconstruction of an inverted colloid crystal scaffold used as 3D migration assay with tuneable gel stiffness. a) Images of the surface, the middle of the first layer and pores between two consecutive layers. b) Projection in z-direction of the first three layers of the scaffold. c) Three dimensional reconstruction of one scaffold segment. Figure published in (Da Silva et al. 2009).
4.1.2 Results As I showed in the chapter 3.1, NB4 cells got significantly more compliant after
differentiation with ATRA (Figure 3-1 in chapter 3.1, reprinted in Figure 4-4a for further
relating to migration). It has already been shown in 2D using Boyden Chamber migration
assays that ATRA differentiation enhanced migration of NB4 cells (Bruel et al. 2001). I
was able to reproduce this result using three dimensional micro-channel structures.
Undifferentiated cells did not migrate into these channels simulating pores at all while
ATRA differentiated NB4 cells did (Figure 4-4). The treatment of ATRA differentiated
NB4 cells with paclitaxel increased the length and bundling of MTs as it can be seen in
the fluorescent microscopy pictures (insets of Figure 4-5). While the compliance of
ATRA differentiated NB4 cells treated with paclitaxel during stress application was
113
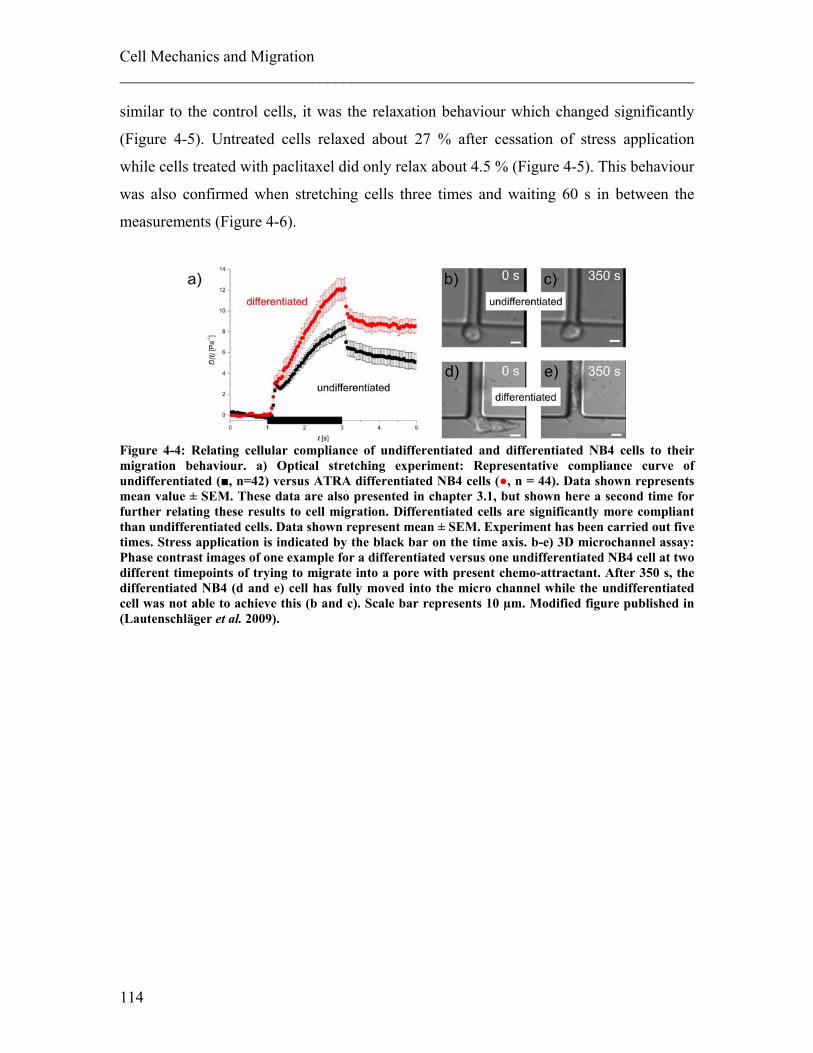
Cell Mechanics and Migration ________________________________________________________________________ similar to the control cells, it was the relaxation behaviour which changed significantly
(Figure 4-5). Untreated cells relaxed about 27 % after cessation of stress application
while cells treated with paclitaxel did only relax about 4.5 % (Figure 4-5). This behaviour
was also confirmed when stretching cells three times and waiting 60 s in between the
measurements (Figure 4-6).
Figure 4-4: Relating cellular compliance of undifferentiated and differentiated NB4 cells to their migration behaviour. a) Optical stretching experiment: Representative compliance curve of undifferentiated (■, n=42) versus ATRA differentiated NB4 cells (●, n = 44). Data shown represents mean value ± SEM. These data are also presented in chapter 3.1, but shown here a second time for further relating these results to cell migration. Differentiated cells are significantly more compliant than undifferentiated cells. Data shown represent mean ± SEM. Experiment has been carried out five times. Stress application is indicated by the black bar on the time axis. b-e) 3D microchannel assay: Phase contrast images of one example for a differentiated versus one undifferentiated NB4 cell at two different timepoints of trying to migrate into a pore with present chemo-attractant. After 350 s, the differentiated NB4 (d and e) cell has fully moved into the micro channel while the undifferentiated cell was not able to achieve this (b and c). Scale bar represents 10 µm. Modified figure published in (Lautenschläger et al. 2009).
114
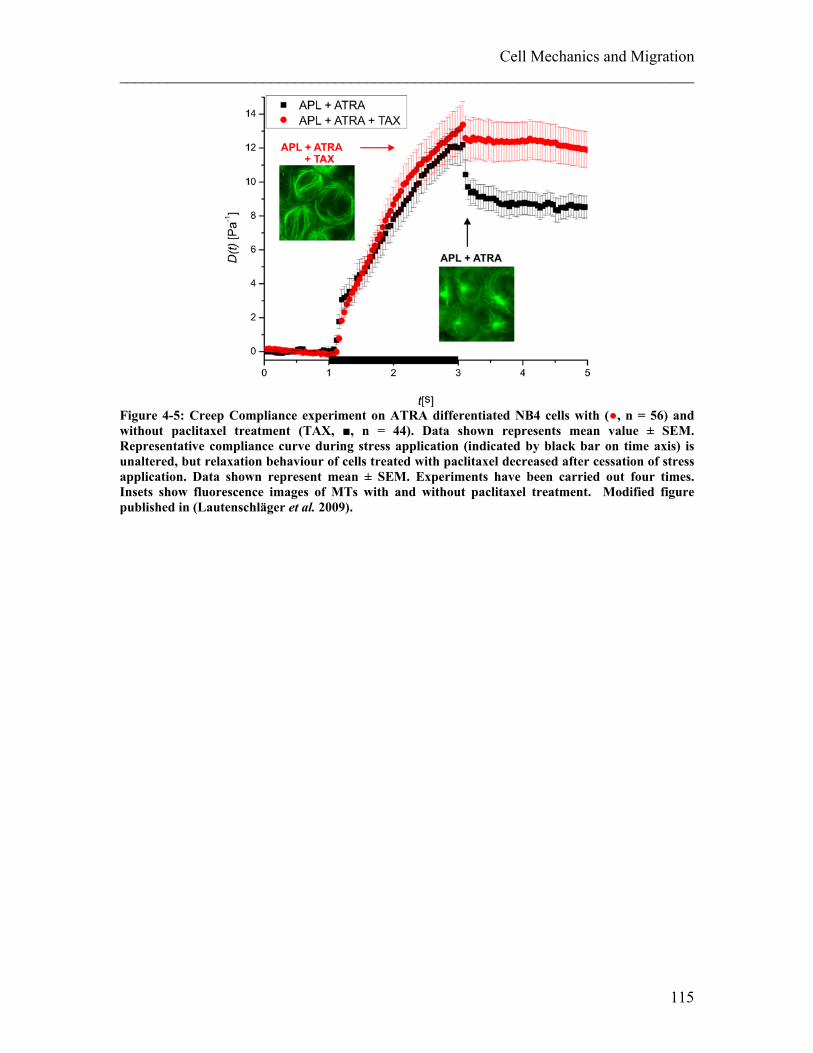
Cell Mechanics and Migration ________________________________________________________________________
Figure 4-5: Creep Compliance experiment on ATRA differentiated NB4 cells with (●, n = 56) and without paclitaxel treatment (TAX, ■, n = 44). Data shown represents mean value ± SEM. Representative compliance curve during stress application (indicated by black bar on time axis) is unaltered, but relaxation behaviour of cells treated with paclitaxel decreased after cessation of stress application. Data shown represent mean ± SEM. Experiments have been carried out four times. Insets show fluorescence images of MTs with and without paclitaxel treatment. Modified figure published in (Lautenschläger et al. 2009).
115
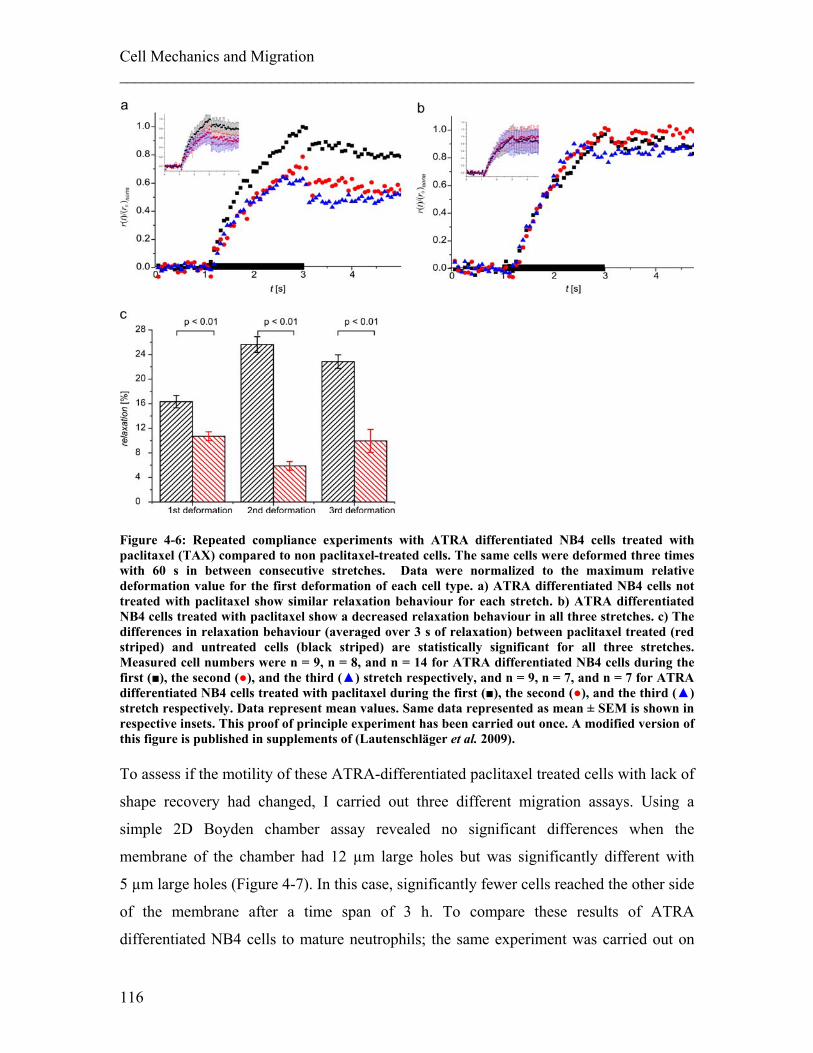
Cell Mechanics and Migration ________________________________________________________________________
Figure 4-6: Repeated compliance experiments with ATRA differentiated NB4 cells treated with paclitaxel (TAX) compared to non paclitaxel-treated cells. The same cells were deformed three times with 60 s in between consecutive stretches. Data were normalized to the maximum relative deformation value for the first deformation of each cell type. a) ATRA differentiated NB4 cells not treated with paclitaxel show similar relaxation behaviour for each stretch. b) ATRA differentiated NB4 cells treated with paclitaxel show a decreased relaxation behaviour in all three stretches. c) The differences in relaxation behaviour (averaged over 3 s of relaxation) between paclitaxel treated (red striped) and untreated cells (black striped) are statistically significant for all three stretches. Measured cell numbers were n = 9, n = 8, and n = 14 for ATRA differentiated NB4 cells during the first (■), the second (●), and the third (▲) stretch respectively, and n = 9, n = 7, and n = 7 for ATRA differentiated NB4 cells treated with paclitaxel during the first (■), the second (●), and the third (▲) stretch respectively. Data represent mean values. Same data represented as mean ± SEM is shown in respective insets. This proof of principle experiment has been carried out once. A modified version of this figure is published in supplements of (Lautenschläger et al. 2009). To assess if the motility of these ATRA-differentiated paclitaxel treated cells with lack of
shape recovery had changed, I carried out three different migration assays. Using a
simple 2D Boyden chamber assay revealed no significant differences when the
membrane of the chamber had 12 µm large holes but was significantly different with
5 µm large holes (Figure 4-7). In this case, significantly fewer cells reached the other side
of the membrane after a time span of 3 h. To compare these results of ATRA
differentiated NB4 cells to mature neutrophils; the same experiment was carried out on
116
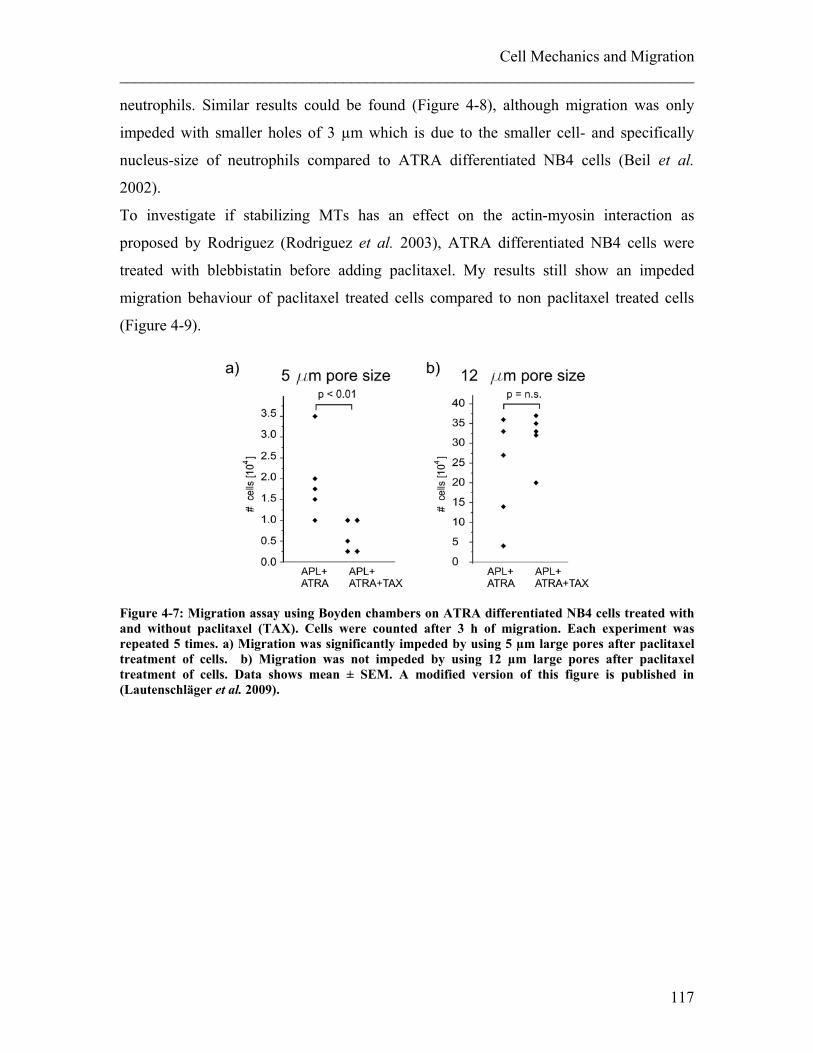
Cell Mechanics and Migration ________________________________________________________________________
neutrophils. Similar results could be found (Figure 4-8), although migration was only
impeded with smaller holes of 3 µm which is due to the smaller cell- and specifically
nucleus-size of neutrophils compared to ATRA differentiated NB4 cells (Beil et al.
2002).
To investigate if stabilizing MTs has an effect on the actin-myosin interaction as
proposed by Rodriguez (Rodriguez et al. 2003), ATRA differentiated NB4 cells were
treated with blebbistatin before adding paclitaxel. My results still show an impeded
migration behaviour of paclitaxel treated cells compared to non paclitaxel treated cells
(Figure 4-9).
Figure 4-7: Migration assay using Boyden chambers on ATRA differentiated NB4 cells treated with and without paclitaxel (TAX). Cells were counted after 3 h of migration. Each experiment was repeated 5 times. a) Migration was significantly impeded by using 5 µm large pores after paclitaxel treatment of cells. b) Migration was not impeded by using 12 µm large pores after paclitaxel treatment of cells. Data shows mean ± SEM. A modified version of this figure is published in (Lautenschläger et al. 2009).
117
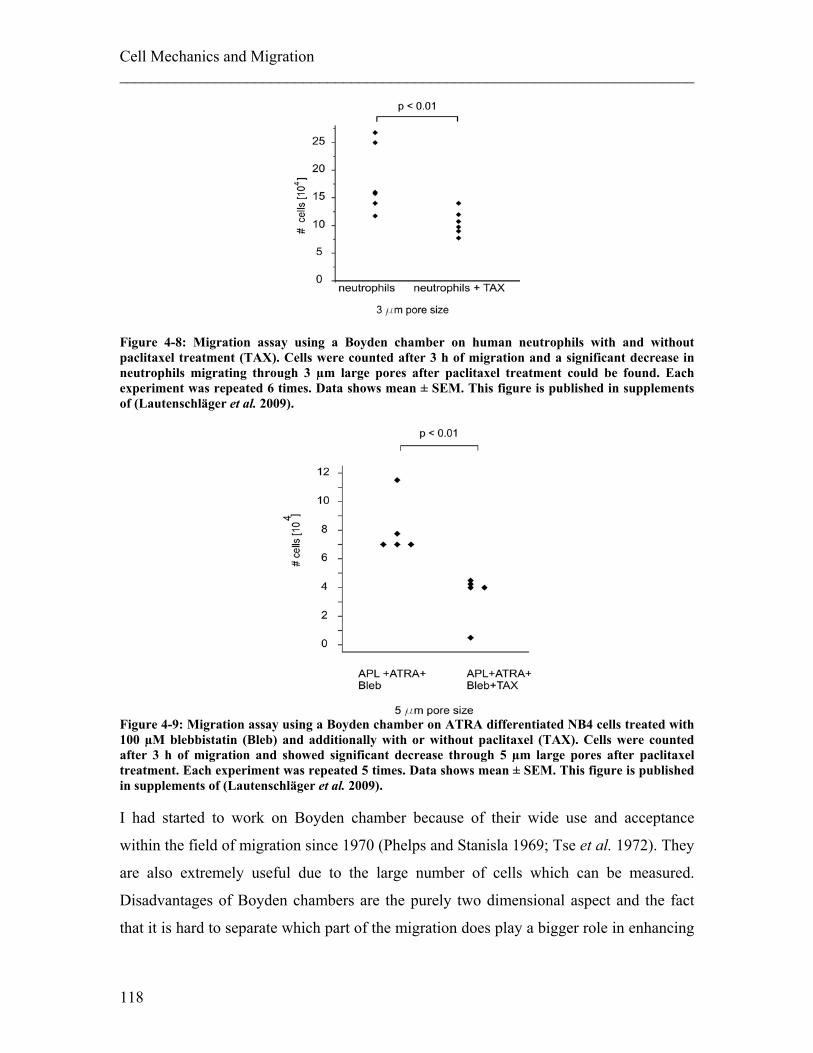
Cell Mechanics and Migration ________________________________________________________________________
Figure 4-8: Migration assay using a Boyden chamber on human neutrophils with and without paclitaxel treatment (TAX). Cells were counted after 3 h of migration and a significant decrease in neutrophils migrating through 3 µm large pores after paclitaxel treatment could be found. Each experiment was repeated 6 times. Data shows mean ± SEM. This figure is published in supplements of (Lautenschläger et al. 2009).
Figure 4-9: Migration assay using a Boyden chamber on ATRA differentiated NB4 cells treated with 100 µM blebbistatin (Bleb) and additionally with or without paclitaxel (TAX). Cells were counted after 3 h of migration and showed significant decrease through 5 µm large pores after paclitaxel treatment. Each experiment was repeated 5 times. Data shows mean ± SEM. This figure is published in supplements of (Lautenschläger et al. 2009). I had started to work on Boyden chamber because of their wide use and acceptance
within the field of migration since 1970 (Phelps and Stanisla 1969; Tse et al. 1972). They
are also extremely useful due to the large number of cells which can be measured.
Disadvantages of Boyden chambers are the purely two dimensional aspect and the fact
that it is hard to separate which part of the migration does play a bigger role in enhancing
118
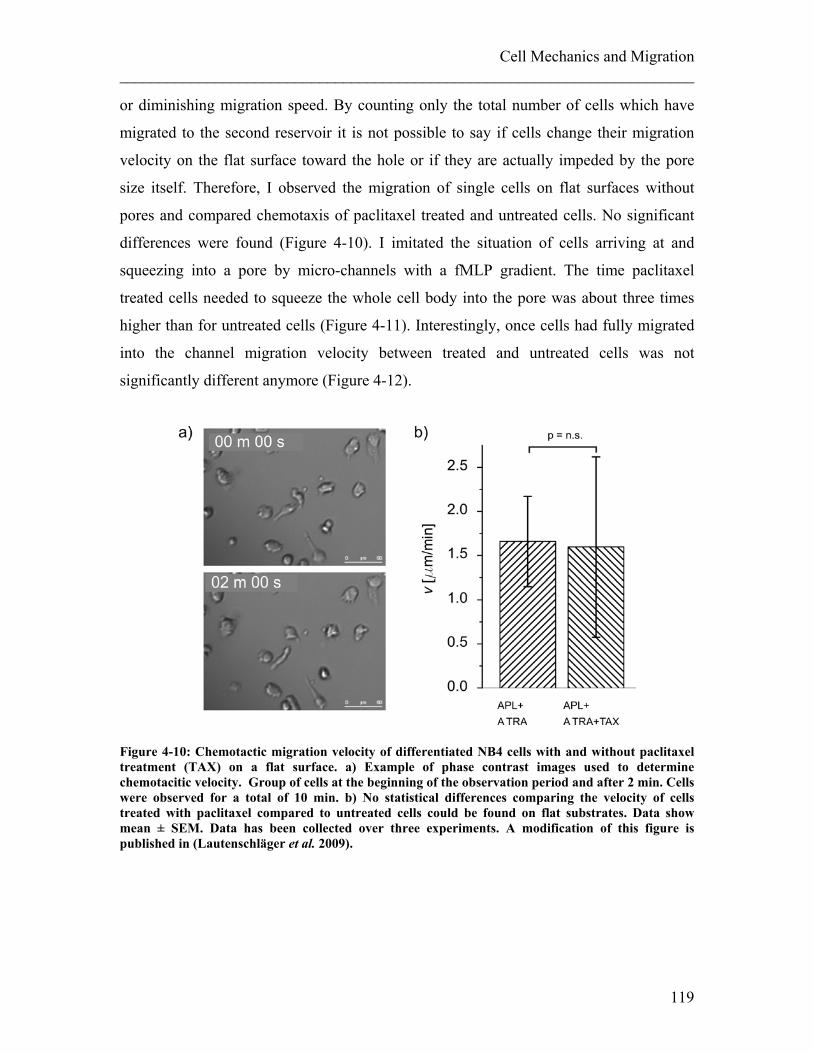
Cell Mechanics and Migration ________________________________________________________________________
or diminishing migration speed. By counting only the total number of cells which have
migrated to the second reservoir it is not possible to say if cells change their migration
velocity on the flat surface toward the hole or if they are actually impeded by the pore
size itself. Therefore, I observed the migration of single cells on flat surfaces without
pores and compared chemotaxis of paclitaxel treated and untreated cells. No significant
differences were found (Figure 4-10). I imitated the situation of cells arriving at and
squeezing into a pore by micro-channels with a fMLP gradient. The time paclitaxel
treated cells needed to squeeze the whole cell body into the pore was about three times
higher than for untreated cells (Figure 4-11). Interestingly, once cells had fully migrated
into the channel migration velocity between treated and untreated cells was not
significantly different anymore (Figure 4-12).
Figure 4-10: Chemotactic migration velocity of differentiated NB4 cells with and without paclitaxel treatment (TAX) on a flat surface. a) Example of phase contrast images used to determine chemotacitic velocity. Group of cells at the beginning of the observation period and after 2 min. Cells were observed for a total of 10 min. b) No statistical differences comparing the velocity of cells treated with paclitaxel compared to untreated cells could be found on flat substrates. Data show mean ± SEM. Data has been collected over three experiments. A modification of this figure is published in (Lautenschläger et al. 2009).
119
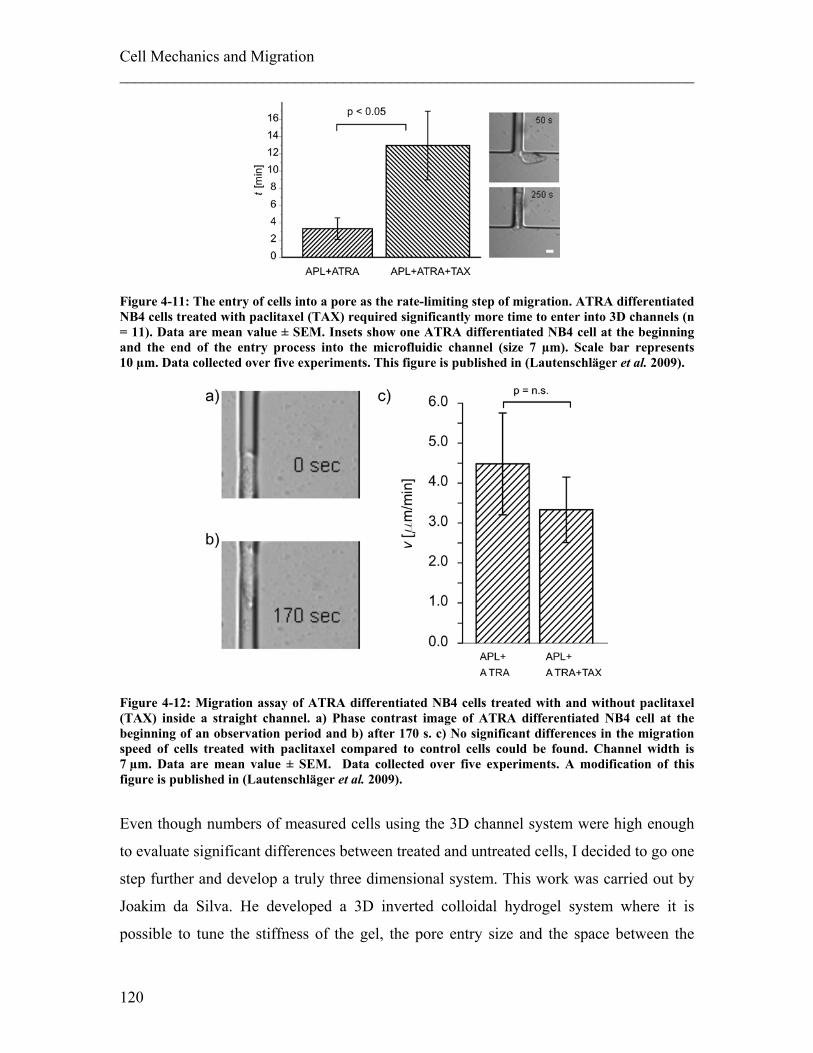
Cell Mechanics and Migration ________________________________________________________________________
Figure 4-11: The entry of cells into a pore as the rate-limiting step of migration. ATRA differentiated NB4 cells treated with paclitaxel (TAX) required significantly more time to enter into 3D channels (n = 11). Data are mean value ± SEM. Insets show one ATRA differentiated NB4 cell at the beginning and the end of the entry process into the microfluidic channel (size 7 µm). Scale bar represents 10 µm. Data collected over five experiments. This figure is published in (Lautenschläger et al. 2009).
Figure 4-12: Migration assay of ATRA differentiated NB4 cells treated with and without paclitaxel (TAX) inside a straight channel. a) Phase contrast image of ATRA differentiated NB4 cell at the beginning of an observation period and b) after 170 s. c) No significant differences in the migration speed of cells treated with paclitaxel compared to control cells could be found. Channel width is 7 µm. Data are mean value ± SEM. Data collected over five experiments. A modification of this figure is published in (Lautenschläger et al. 2009).
Even though numbers of measured cells using the 3D channel system were high enough
to evaluate significant differences between treated and untreated cells, I decided to go one
step further and develop a truly three dimensional system. This work was carried out by
Joakim da Silva. He developed a 3D inverted colloidal hydrogel system where it is
possible to tune the stiffness of the gel, the pore entry size and the space between the
120
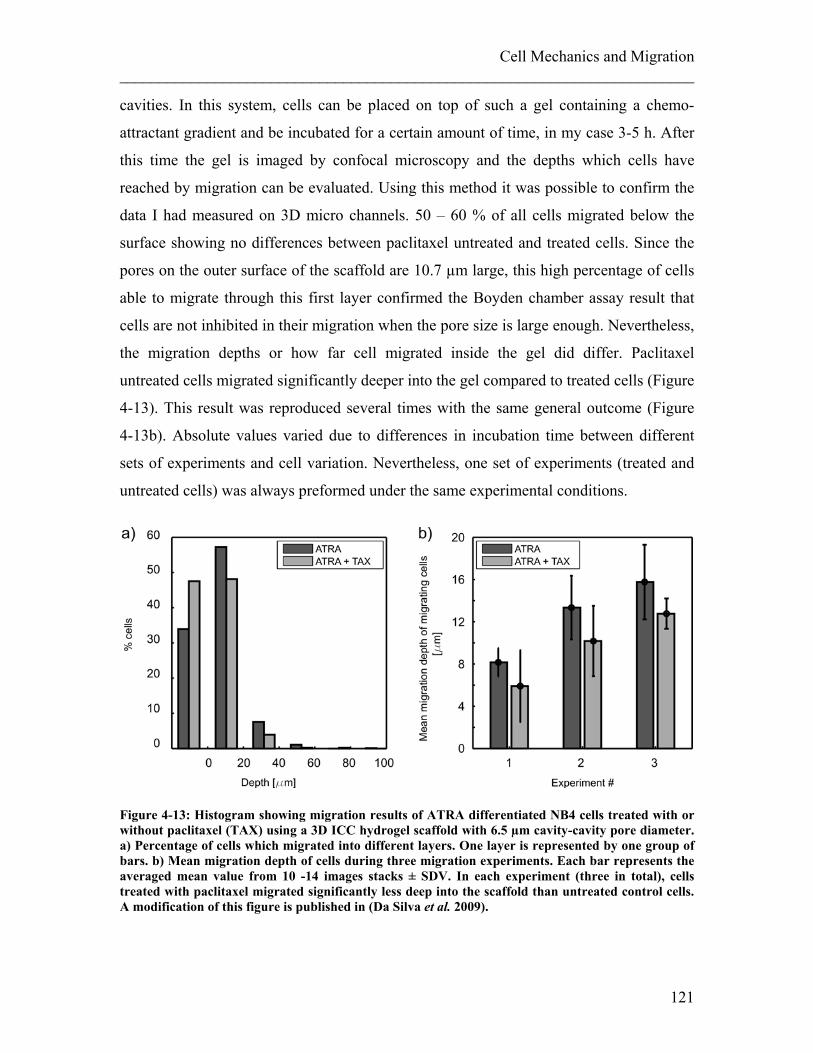
Cell Mechanics and Migration ________________________________________________________________________
cavities. In this system, cells can be placed on top of such a gel containing a chemo-
attractant gradient and be incubated for a certain amount of time, in my case 3-5 h. After
this time the gel is imaged by confocal microscopy and the depths which cells have
reached by migration can be evaluated. Using this method it was possible to confirm the
data I had measured on 3D micro channels. 50 – 60 % of all cells migrated below the
surface showing no differences between paclitaxel untreated and treated cells. Since the
pores on the outer surface of the scaffold are 10.7 µm large, this high percentage of cells
able to migrate through this first layer confirmed the Boyden chamber assay result that
cells are not inhibited in their migration when the pore size is large enough. Nevertheless,
the migration depths or how far cell migrated inside the gel did differ. Paclitaxel
untreated cells migrated significantly deeper into the gel compared to treated cells (Figure
4-13). This result was reproduced several times with the same general outcome (Figure
4-13b). Absolute values varied due to differences in incubation time between different
sets of experiments and cell variation. Nevertheless, one set of experiments (treated and
untreated cells) was always preformed under the same experimental conditions.
Figure 4-13: Histogram showing migration results of ATRA differentiated NB4 cells treated with or without paclitaxel (TAX) using a 3D ICC hydrogel scaffold with 6.5 µm cavity-cavity pore diameter. a) Percentage of cells which migrated into different layers. One layer is represented by one group of bars. b) Mean migration depth of cells during three migration experiments. Each bar represents the averaged mean value from 10 -14 images stacks ± SDV. In each experiment (three in total), cells treated with paclitaxel migrated significantly less deep into the scaffold than untreated control cells. A modification of this figure is published in (Da Silva et al. 2009).
121
Cell Mechanics and Migration ________________________________________________________________________ 4.1.3 Discussion The compliance of cells is highly linked to the cytoskeleton and changes with
cytoskeletal alterations (Elson 1988). Since migration requires shape changes which are
mainly carried out by the cytoskeleton, I had the idea to monitor the correlation between
cellular compliance and migration. Therefore, I investigated the migration behaviour of
cells with different compliances.
Migration of undifferentiated versus differentiated NB4 cells:
I have shown in chapter 3.1 that the compliance of NB4 cells changes significantly
during ATRA differentiation. In this chapter, I investigated the migration behaviour of
undifferentiated and differentiated NB4 cells using a migration assay of micro-channels
which imitates the entering process of a cell into a pore. Since neutrophil precursor cells
are still in the in the bone marrow, mature neutrophils on the other hand in the blood
stream, I expected to see the differentiated cells able to migrate into the pores but not the
undifferentiated cells. Such a result was indeed what I got.
It is described in the literature that ATRA differentiation alters the intermediate filament
network of vimentin (Bruel et al. 2001), but it is also known that the contribution of
intermediate filaments (IF) to the compliance does only matter at large strains (Wang and
Stamenovic 2000) which are not occurring in optical stretcher creep compliance
experiments. Additionally, vimentin knock-out mice have shown a normal inflammatory
response (Moisan et al. 2007) which suggests that vimentin does not play an important
role for neutrophil motility. Far more important seems the actin network. Actin has been
reported to contribute to the compliance in small scale deformations of cells (Tsai et al.
1998; Guck et al. 2005). During ATRA differentiation of NB4 cells the amount of actin
seems to stay constant (Bruel et al. 2001) but I could show that the mesh-size of the actin
did change, which most likely was the reason for increased compliance. The correlation
between cell compliance and the ability of cells to migrate has been much less studied
than biochemical aspects, even though there is some early data available on blood cells
using micropipette aspiration (Lichtman 1970, 1973). Cell migration of myeloid cells
seems to necessitate quick remodelling of cellular shape which is mainly achieved by
modifying the cytoskeleton (Suresh 2007). In the physiological context it is logical that
122
Cell Mechanics and Migration ________________________________________________________________________
undifferentiated cells which are still sitting in the bone marrow may be stiffer since they
do not need to migrate. But, once they differentiate and need to move into the blood
stream, they might have to adjust their compliance. Such ideas of correlating high
stiffness to the lack of migration have been proposed before (Lichtman 1973) and were
confirmed by my data.
Influence of reduced relaxation behaviour on migration:
Pathological changes in the migration behaviour of cells can lead to an uncontrolled
infiltration of tissue or whole organs with cells, as in RAS (Frankel et al. 1992; Tallman
et al. 2000). I wanted to investigate new possible ways of intervention by artificially
stiffening the cytoskeleton. Since MTs do have a large bending stiffness (Gittes et al.
1993b) and can tolerate a high compressive load (Brangwynne et al. 2006) the idea was
to increase cellular stiffness by stabilizing MTs. I expected to see a decrease in
compliance. Surprisingly, this is not what I measured (Figure 4-5), but an unaltered
compliance after MTs stabilization using paclitaxel. Similar results have been reported
using different methods before as by micropipette aspiration (Tsai et al. 1998) or by
AFM (Rotsch and Radmacher 2000). However, the effect I found after paclitaxel
application is a change in the relaxation behaviour after the stress application, when cells
seem temporally plastically deformed. It might well be that the stronger bundling and
enhanced length of MTs due to paclitaxel treatment prevents cells from relaxing back to
their original shape.
I investigated the migration behaviour of such paclitaxel treated cells using different
methods as purely 2D flat migration, 2D Boyden Chambers, 3D micro capillaries and 3D
inverted colloidal crystal gels and could show that the migration behaviour of paclitaxel
treated cells was significantly reduced. Such correlation between reduced relaxation after
stress application and migration has not been reported before but might offer an
alternative method to changing cellular elasticity with the goal of inhibiting neutrophil
migration though pores, as for example endothelial gaps. Furthermore, my method to
investigate cell migration before, during and after entering a micropore suggests that it is
the entry into the pore itself which is the rate limiting step when neutrophils leave the
blood vessel by squeezing through layers of endothelial cells, as it happens during
diapedesis.
123
Cell Mechanics and Migration ________________________________________________________________________ However, is has been suggested in literature before that changes in MTs could influence
the actin network within the system (Rodriguez et al. 2003). Nevertheless, this effect had
never been seen in neutrophils (Tsai et al. 1998). Interestingly, there was also a study
investigating which effect interferes with the relaxation of leukocytes after a deformation
and it was found that neither interfering with the actin network nor the inhibiting of acto-
myosin contractions had a significant influence on the relaxation behaviour (Gabriele et
al. 2009). These studies are well in accordance with my data showing that the MTs
influence relaxation behaviour. I could show that paclitaxel stabilizes MTs, changes the
relaxation behaviour of cells, and impairs the migration of ATRA differentiated NB4
cells and neutrophils. This result points to the fact that MTs actually do play a role in
cellular mechanics independently of the actin cytoskeleton.
Results in the context of RAS:
The NB4 cell line used for this study has been derived from an acute pro-myelocytic
leukaemia patient. Retinoic acid is regularly used to treat such acute promyelocytic
leukaemia which has the effect that the precursor cells differentiate along the neutrophil
lineage. It has been shown that a significant portion of treated patients suffer from the
Retinoic Acid Syndrome (RAS) (Frankel et al. 1992; Tallman et al. 2000), a syndrome of
tissue infiltration by differentiating myelocytic cells. This tissue infiltration can be
observed a few days after the start of the differentiation therapy, which would leave
enough time for the cells to change their cytoskeletal organization. My data show that
cellular compliance was already altered after three days post ATRA exposure which also
resulted in an enhanced motility. It cannot be neglected that adhesion molecules and the
secretion of proteolytic enzymes do play a role in the motility of neutrophils and ATRA
differentiated NB4 cells (Zang et al. 2000). However, blocking these adhesion molecules
cannot fully explain the impairment of motility either, which is the reason why cellular
mechanics has been proposed as an additional factor before (Zang et al. 2000). My study
provides experimental data for this proposition.
Today, RAS is mainly treated by dexamethasone, a synthetic chemical which has been
shown to alter the F-actin structure in cells and promotes actin crosslinking (Sanz et al.
2005). The effect of dexamethasone on the compliance of leukemic cells has been
124
Cell Mechanics and Migration ________________________________________________________________________
investigated by AFM and resulted in stiffening of these cells (Lam et al. 2007). Despite
the effectiveness of dexamethasone, the mortality rate of RAS patients is still not zero
which is why additional approaches to deal with this syndrome are desirable (de la Serna
et al. 2008). This can be done by further changing the mechanical properties of APL
cells, e.g. by further crosslinking or additional enhancing the polymerization of actin.
However, drugs interfering with actin seem to have a variety of adverse effects which
might be the reason why none of them is approved for clinical trials. Therefore, my
approach to stabilize MTs might be a better way to go and results in less sever side
effects. For example, paclitaxel is already an approved medication in cancer therapy
where it is used to inhibit cell division (Jordan et al. 1993; Singh and Dash 2009). By
reducing the ability of cells to relax to deformation one also reduce their ability to
migrate into small pores, a process similar to leukocyte extravasation. Such an
impairment of neutrophil motility by treatment with paclitaxel has already been tested
and approved in an animal model (Mirzapoiazova et al. 2007). Nevertheless, it is not
possible in an in-vivo study to separate multiple effects since paclitaxel also acts on other
surrounding cells, such as endothelial cells and targeted drug delivery is a challenge
(Singh and Dash 2009). In addition, paclitaxel can also block the secretion of proteolytic
enzymes (Schnaeker et al. 2004). In the in-vitro model I chose I was able to focus on the
neutrophil mechanics itself and on each step of extravasation, as the approach to the pore,
the actual entry into the pore and migration inside the pore. My results have shown that it
is the entry into the pores which is the rate limiting step as long as the diameter of these
pores is not significantly larger than endothelial gaps. Endothelial gaps have been shown
to be in the order of 5 µm (Shaw et al. 2001), which is a similar size to the limiting pore
size used in my experiments. I was able to link the longer relaxation time after a
deformation experiment to the delay of cells passing through small gaps. I suggest that
the shape change occurring during the relaxation of a cell after deformation is similar to
the initial deformation, which cells have to undergo when squeezing into restricting
pores. By recording cellular migration in such pores by video microscopy I could show
that the relaxation of the whole cell body matters when cells change direction e.g. migrate
into a defined space. For such migration in confinement, adhesion is not required (Ley et
al. 2007). Additionally, I could show that the missing shape relaxation due to stabilized
125
Cell Mechanics and Migration ________________________________________________________________________ MTs can be tolerated and motility is not influenced if the pores are big enough (in my
case 12 µm).
In future, there might be different drugs available which are maybe less toxic than
paclitaxel and still stabilise MTs. Research looking for such drugs has already started
(Mooberry 2007) but it will always consist in a balancing of the benefits and risks of
mechano-manipulation as a therapeutic approach. In future, it might be possible to screen
different drugs on their effect on shape stabilisation using optical stretchers and thereby
incorporate physical cell compliance measurements into modern medical research and
drug development.
4.2 Influence of Mechanical Properties of the Surroundings on Migration
During the course of this work, it became obvious that it is not only the compliance of the
cells themselves which influences their migration behaviour. Additionally, the interaction
between cells and their surrounding tissue plays an important role, specifically the
dimension, the morphology and the compliance of the surrounding material. It has been
shown before that cells can probe the stiffness of their surrounding (Discher et al. 2005)
and react to it, for example stem cells can differentiate into different cell types according
to the stiffness of the material they are cultured on (Engler et al. 2006). Physiological
tissue can vary in stiffness (Figure 4-14) but is generally magnitudes softer than glass or
cell culture plastic, the materials which are normally used for cell culture and migration
experiments. I therefore investigated the migration behaviour at two representatives for
physiological surrounding stiffnesses, 3.3 kPa and 10 kPa, in order to stay close to
physiological conditions.
126
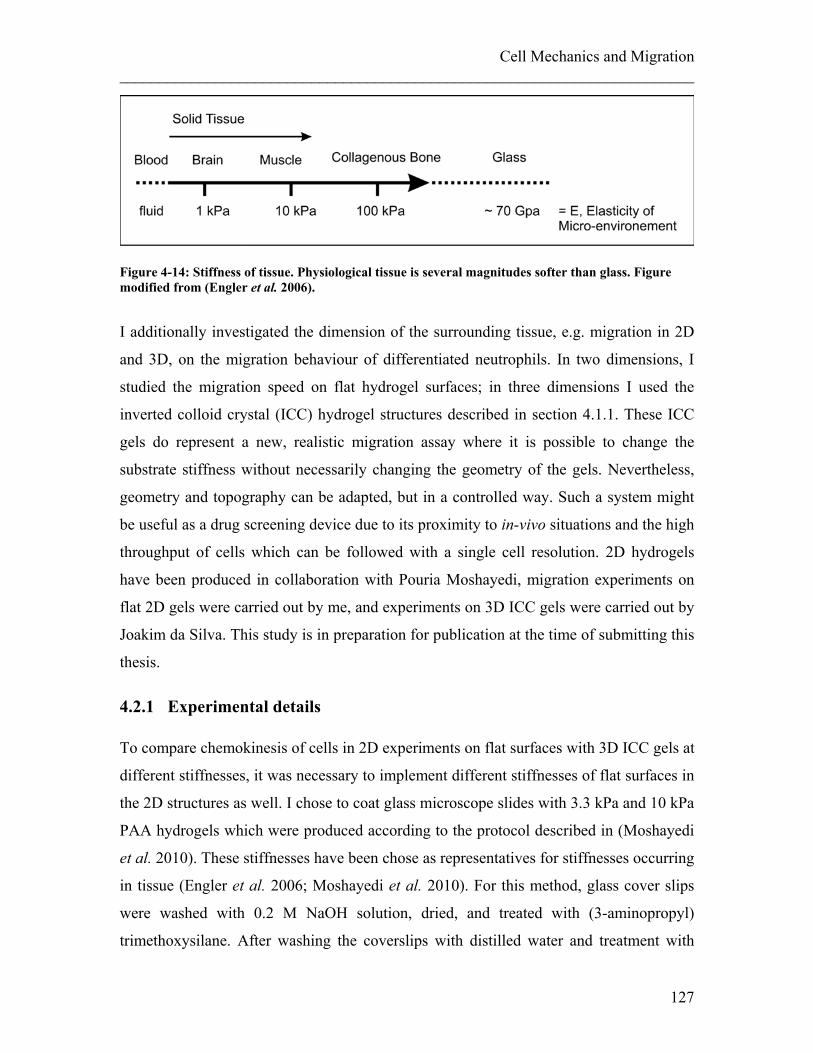
Cell Mechanics and Migration ________________________________________________________________________
Figure 4-14: Stiffness of tissue. Physiological tissue is several magnitudes softer than glass. Figure modified from (Engler et al. 2006).
I additionally investigated the dimension of the surrounding tissue, e.g. migration in 2D
and 3D, on the migration behaviour of differentiated neutrophils. In two dimensions, I
studied the migration speed on flat hydrogel surfaces; in three dimensions I used the
inverted colloid crystal (ICC) hydrogel structures described in section 4.1.1. These ICC
gels do represent a new, realistic migration assay where it is possible to change the
substrate stiffness without necessarily changing the geometry of the gels. Nevertheless,
geometry and topography can be adapted, but in a controlled way. Such a system might
be useful as a drug screening device due to its proximity to in-vivo situations and the high
throughput of cells which can be followed with a single cell resolution. 2D hydrogels
have been produced in collaboration with Pouria Moshayedi, migration experiments on
flat 2D gels were carried out by me, and experiments on 3D ICC gels were carried out by
Joakim da Silva. This study is in preparation for publication at the time of submitting this
thesis.
4.2.1 Experimental details To compare chemokinesis of cells in 2D experiments on flat surfaces with 3D ICC gels at
different stiffnesses, it was necessary to implement different stiffnesses of flat surfaces in
the 2D structures as well. I chose to coat glass microscope slides with 3.3 kPa and 10 kPa
PAA hydrogels which were produced according to the protocol described in (Moshayedi
et al. 2010). These stiffnesses have been chose as representatives for stiffnesses occurring
in tissue (Engler et al. 2006; Moshayedi et al. 2010). For this method, glass cover slips
were washed with 0.2 M NaOH solution, dried, and treated with (3-aminopropyl)
trimethoxysilane. After washing the coverslips with distilled water and treatment with
127
Cell Mechanics and Migration ________________________________________________________________________ 0.5 % glutaraldehyde solution plus a further air drying, the coverslips were submerged in
Rain-X solution (Shell Car Care International Ltd, UK) for 10 min and air-dried again.
PAA gels were prepared from phosphate buffered saline (PBS, Bioclear, UK), 40 % AA
solution (w/v; Electran BDH, UK) in PBS, and 2 % bis-acrylamide (Bis-A) solution
(Fisher Scientific, UK). After desiccating the gel solution gelation was ignited by mixing
1 % (v/v) ammonium persulfate and 0.3 % (v/v) tetramethylethylenediamine (TEMED;
Argos Organics, USA) into the gel solution. The required amount of gel solution was put
on a pre-treated cover slip. The gel was washed several times in PBS before treatment
with hydrazine hydrate, which modifies non reactive amide groups to reactive hydrazide
groups, that form bonds with aldegyde and ketone groups in proteins (Damljanovic et al.
2005). Afterwards, gels were treated with 5 % acetic acid solution (Fisher Scientific, UK)
and washed in PBS again. Finally, gels were treated with poly-D-lysine solution (PDL,
150–300 kDa). After washing the gels a last time with PBS cells were placed on top of
the hydrogels and incubated for 1 h at 37 ºC. Cells were incubated for additional 30 min
on the stage of a Leica microscope (LEICA TSC SP5 X) equipped with a 10 x/0.3 NA
objective, temperature and CO2 control and imaged afterwards for 15 min, recording one
frame every three seconds. Cell migration of single cells was tracked using freely
available software (Milne 2003-2009) as illustrated in Figure 4-15a and analyzed using
public domain software ImageJ with a specific MigrationTool plug-in available from
Ibidi GmbH, Germany (Trapp et al. 2007). Final analysis was performed using Origin
8.5. Migration speed was defined as the total distance the cells migrated from their
original location divided by the total migration time. Repeated experiments were
combined and analyzed using a 3 parametric ANOVA test modelling the different
experiments as random effect, the gel stiffness as fixed effect.
3D ICC gel production and migration analysis was carried out as described in section
4.1.1 but with two different stiffnesses (3.3 kPa and 10 kPa).
Cells used for this study were ATRA differentiated NB4 cells cultured and treated
according to the description in 4.1.1. The number of the cells in each layer at the end of
the migration period in the 3D scaffolds was identified by counting the nuclei (stained
with Hoechst stain) in each layer using a confocal microscope. This count was
perferformed by hand.
128
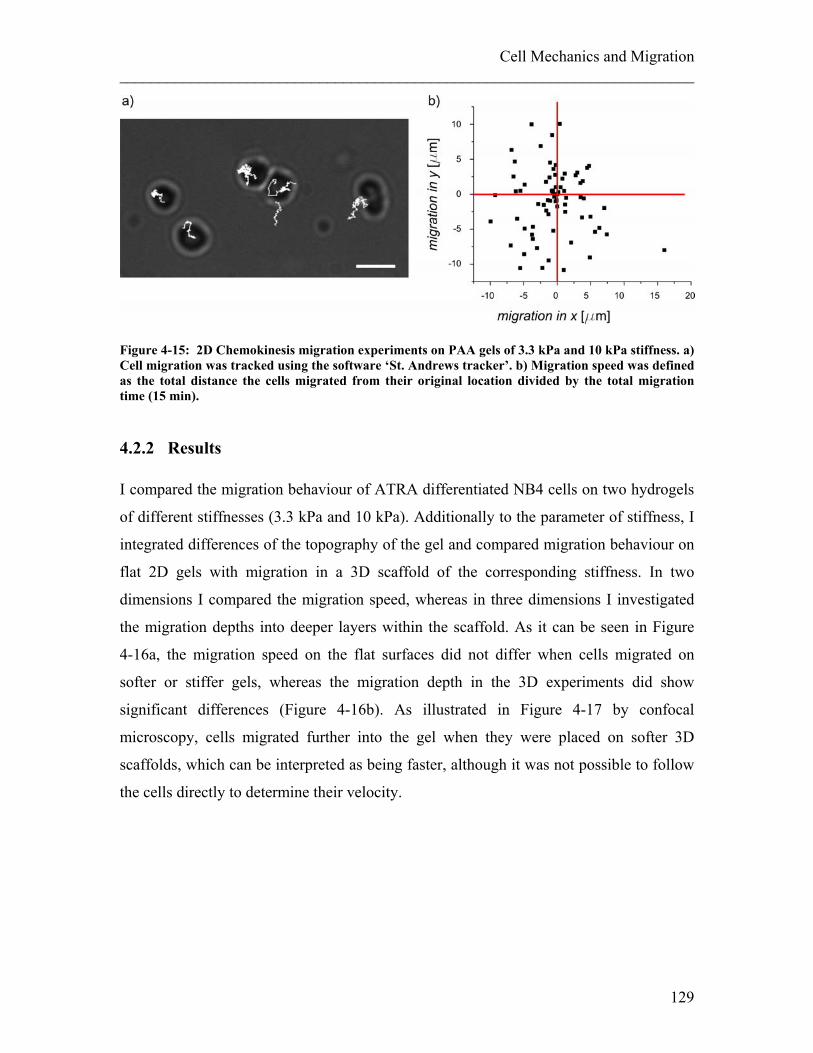
Cell Mechanics and Migration ________________________________________________________________________
Figure 4-15: 2D Chemokinesis migration experiments on PAA gels of 3.3 kPa and 10 kPa stiffness. a) Cell migration was tracked using the software ‘St. Andrews tracker’. b) Migration speed was defined as the total distance the cells migrated from their original location divided by the total migration time (15 min).
4.2.2 Results I compared the migration behaviour of ATRA differentiated NB4 cells on two hydrogels
of different stiffnesses (3.3 kPa and 10 kPa). Additionally to the parameter of stiffness, I
integrated differences of the topography of the gel and compared migration behaviour on
flat 2D gels with migration in a 3D scaffold of the corresponding stiffness. In two
dimensions I compared the migration speed, whereas in three dimensions I investigated
the migration depths into deeper layers within the scaffold. As it can be seen in Figure
4-16a, the migration speed on the flat surfaces did not differ when cells migrated on
softer or stiffer gels, whereas the migration depth in the 3D experiments did show
significant differences (Figure 4-16b). As illustrated in Figure 4-17 by confocal
microscopy, cells migrated further into the gel when they were placed on softer 3D
scaffolds, which can be interpreted as being faster, although it was not possible to follow
the cells directly to determine their velocity.
129
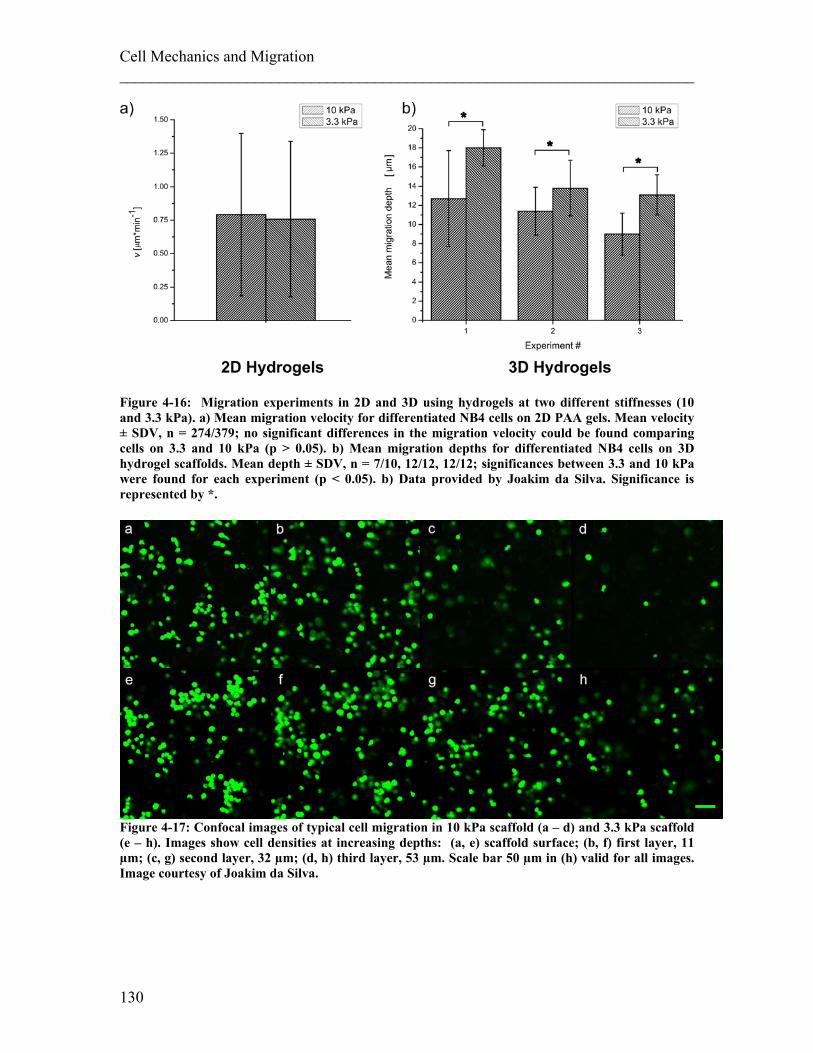
Cell Mechanics and Migration ________________________________________________________________________
Figure 4-16: Migration experiments in 2D and 3D using hydrogels at two different stiffnesses (10 and 3.3 kPa). a) Mean migration velocity for differentiated NB4 cells on 2D PAA gels. Mean velocity ± SDV, n = 274/379; no significant differences in the migration velocity could be found comparing cells on 3.3 and 10 kPa (p > 0.05). b) Mean migration depths for differentiated NB4 cells on 3D hydrogel scaffolds. Mean depth ± SDV, n = 7/10, 12/12, 12/12; significances between 3.3 and 10 kPa were found for each experiment (p < 0.05). b) Data provided by Joakim da Silva. Significance is represented by *.
Figure 4-17: Confocal images of typical cell migration in 10 kPa scaffold (a – d) and 3.3 kPa scaffold (e – h). Images show cell densities at increasing depths: (a, e) scaffold surface; (b, f) first layer, 11 µm; (c, g) second layer, 32 µm; (d, h) third layer, 53 µm. Scale bar 50 µm in (h) valid for all images. Image courtesy of Joakim da Silva.
130
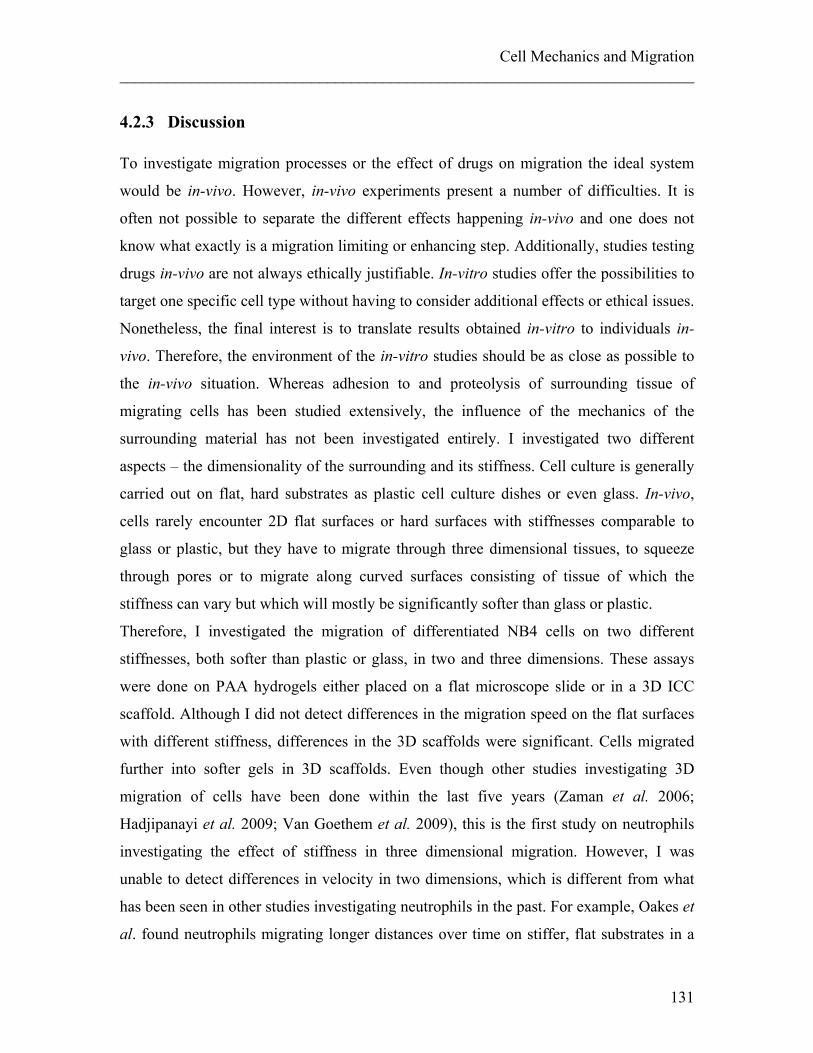
Cell Mechanics and Migration ________________________________________________________________________
4.2.3 Discussion To investigate migration processes or the effect of drugs on migration the ideal system
would be in-vivo. However, in-vivo experiments present a number of difficulties. It is
often not possible to separate the different effects happening in-vivo and one does not
know what exactly is a migration limiting or enhancing step. Additionally, studies testing
drugs in-vivo are not always ethically justifiable. In-vitro studies offer the possibilities to
target one specific cell type without having to consider additional effects or ethical issues.
Nonetheless, the final interest is to translate results obtained in-vitro to individuals in-
vivo. Therefore, the environment of the in-vitro studies should be as close as possible to
the in-vivo situation. Whereas adhesion to and proteolysis of surrounding tissue of
migrating cells has been studied extensively, the influence of the mechanics of the
surrounding material has not been investigated entirely. I investigated two different
aspects – the dimensionality of the surrounding and its stiffness. Cell culture is generally
carried out on flat, hard substrates as plastic cell culture dishes or even glass. In-vivo,
cells rarely encounter 2D flat surfaces or hard surfaces with stiffnesses comparable to
glass or plastic, but they have to migrate through three dimensional tissues, to squeeze
through pores or to migrate along curved surfaces consisting of tissue of which the
stiffness can vary but which will mostly be significantly softer than glass or plastic.
Therefore, I investigated the migration of differentiated NB4 cells on two different
stiffnesses, both softer than plastic or glass, in two and three dimensions. These assays
were done on PAA hydrogels either placed on a flat microscope slide or in a 3D ICC
scaffold. Although I did not detect differences in the migration speed on the flat surfaces
with different stiffness, differences in the 3D scaffolds were significant. Cells migrated
further into softer gels in 3D scaffolds. Even though other studies investigating 3D
migration of cells have been done within the last five years (Zaman et al. 2006;
Hadjipanayi et al. 2009; Van Goethem et al. 2009), this is the first study on neutrophils
investigating the effect of stiffness in three dimensional migration. However, I was
unable to detect differences in velocity in two dimensions, which is different from what
has been seen in other studies investigating neutrophils in the past. For example, Oakes et
al. found neutrophils migrating longer distances over time on stiffer, flat substrates in a
131
Cell Mechanics and Migration ________________________________________________________________________ similar set-up using gel stiffnesses between 5 – 100 kPa (Oakes et al. 2009). The
differences compared with my results might be due to my use of differentiated leukaemia
cells compared to Oakes use of mature neutrophils. Both cell types have slightly different
properties and a different DNA content (Beil et al. 2002), but it is still a surprising
difference.
From my results, I deducted two main ideas: First, that there exists a difference
measuring migration in 3D compared to 2D. This is understandable since even the type of
migration can be different between 2D and 3D, e.g. integrin independent in 3D but
mediated by integrin adhesion in 2D (Blow 2007; Lämmermann and Sixt 2009). The
second conclusion is connected to the contradictions which exist between my 2D
migration data and literature. It might be that 2D surfaces are simply not as well defined
and far off from the in-vivo situation and therefore it might be difficult to obtain
consistent measurements. However, data taken from 3D migration experiments cannot
simply be compared to 2D migration experiments, which intensifies the need to evaluate
exactly which migration assays to choose and to stay as close as possible to the in-vivo
situation.
4.3 Summary Cell Mechanics and Migration I have shown in chapter 3 that a functional change in cells as occurs during
differentiation can be monitored by measuring mechanical compliance. I showed that the
increase in compliance during ATRA differentiation of NB4 cells might be regulated by
actin. In this chapter I showed a direct functional change of the cells by observing their
ability to migrate during differentiation. The increase in compliance and mobility during
the differentiation of neutrophils correlates to their physiological function when
neutrophils need to migrate from the bone marrow into the blood stream or into tissue.
Stabilizing MTs by paclitaxel interferes with shape remodelling, which is crucial for
deforming and squeezing through pores. I could show in three different migration assays
that cells treated with paclitaxel have a reduced mobility through pores similar to those
seen in-vivo. These results suggest a link between cell mechanics and cell migration. The
possibility to impede cell migration by interfering with single components of the
cytoskeleton raises the potential to treat diseases which are due to increased migration,
132
Cell Mechanics and Migration ________________________________________________________________________
such as RAS, but also cancer or metastasis. In addition to investigating links between
compliance and relaxation behaviour of cells I studied how the mechanics of the
surrounding environment affected cellular migration. I studied 2D systems using Boyden
Chamber assays and flat surfaces and 3D systems using a micro-channel assay which
follows single cells during their migration. I further used scaffold made out of a tuneable
hydrogel as a method to measure higher numbers of cell migration in 3D. Differences in
migration in 2D and 3D became specifically obvious for ATRA differentiated NB4 cells
when testing different surface stiffnesses, which do influence cell migration in 3D but not
in 2D. These data should increase awareness of the choice of migration assays in-vitro,
which should have an environment as close as possible to the in-vivo situation. This is
important to be able to translate data obtained from in-vitro assays to human beings or
animals. 3D scaffolds or channel assays seem to be the way forward to achieve such goal.
133

Cell Mechanics and Migration ________________________________________________________________________
134
Influencing the Compliance of Suspended Cells ________________________________________________________________________
5. Influencing the Compliance of Suspended Cells 5.1 Effect of Cytoskeletal Drugs on Cell Compliance 136
5.1.1 Experimental details 138 5.1.2 Results 140 5.1.3 Discussion 143
5.2 Influence of Molecular Motor Drugs on Cell Compliance 150 5.2.1 Experimental details 152 5.2.2 Results 156 5.2.3 Discussion 159
5.3 Summary Influencing the Compliance of Suspended Cells 164
Establishing links between a specific cellular function and cell compliance can help to
understand how cells carry out this function and probably how to interfere with it.
Changing actively cell compliance and therefore indirectly cell function might help to
interfere with pathological cell behaviour as tumour migration. Therefore, it is important
to know how cells regulate their mechanical properties. It is known that structure,
density, and crosslinking within of the cytoskeleton are important for cellular mechanics
(Elson 1988). Even though whole cell measurements are of interest for investigating cells
as a natural entity, it is difficult to interpret the response of a whole, complex cell to
applied stress. Thus, I decided to start by investigating the influence of single
components of the cytoskeleton on overall mechanical properties of cells by enhancing or
diminishing the influence of one of the components at a time. However, it is likely that it
is not only the structure of one filament network which influences the compliance, but
also the crosslinker and molecular motors acting on these filaments. Therefore, I chose
actin as the component which has the strongest influence on the compliance in small
deformations (Janmey 1991) as probed with optical stretching and investigated the
influence of its molecular motor myosin II. Interfering with the activity of molecular
motors might be a different, subtle way to infer with functions of cells, as for example
decreasing migration behaviour as it might be desirable in cases like tumour metastasis.
135
Influencing the Compliance of Suspended Cells ________________________________________________________________________
5.1 Effect of Cytoskeletal Drugs on Cell Compliance
To break down the complexity of the cytoskeleton I investigated the influence of each
cytoskeletal component on the compliance of suspended cells. This is relatively easy to
achieve for actin and microtubules (MTs) since various drugs are available which
stabilize or destabilize the filaments. However, it is far more difficult for intermediate
filaments (IF). One of the reasons is the large variety of existing IF. One would need to
be very specific or to affect all of them in the same manner to be able to make a general
statement. Measurements are even more complicated by the lack of appropriate drugs as
they are available for actin and MTs. One way of achieving over-expression or reduction
of IF in cells are genetically modified animals which were not available to me during the
time course of my PhD. in-vivo studies exist where mice lacking intermediate filaments
as vimentin do show an unaltered inflammatory response (Moisan et al. 2007) which
leads to the assumption that redundancy systems within the cell can re-compensate for
missing intermediate filaments (Coulombe and Omary 2002).
To investigate mechanical properties of cells without artefacts due to attachment, I
choose an optical stretcher as measurement tool (see chapter 2.2). Deformations in an
optical stretcher are generally small, in the order of 1 – 10 %, and it has been shown that
the influence of intermediate filaments in such a deformation range is rather small
(Janmey et al. 1991; Wang and Stamenovic 2000). Considering the facts about
influencing intermediate filaments, I decided to focus mainly on the influence of actin
and MTs on mechanical properties of suspended cells. Therefore, I chose appropriate
drugs to either stabilize or destabilize actin filaments and MTs.
To interfere with the actin cytoskeleton, I chose jasplakinolide, which stabilizes
filamentous actin, and latrunculin A which has an opposite, destabilizing effect on actin
(see overview in Table 5-1). Jasplakinolide enhances the rate of actin filament nucleation
by lowering the critical concentration of G-actin needed to form filaments (Bubb et al.
2000). In high concentrations, jasplakinolide can result in loss of stress fibres of attached
cells since the reservoir of G-actin needed to form stress fibres might already be depleted
by ‘random’ and disorganized actin fibres. Jasplakinolide acts very fast on the inhibition
136
Influencing the Compliance of Suspended Cells ________________________________________________________________________
of disassembly of preformed actin filaments (30 seconds) but takes on the order of ten
minutes to promote filament assembly (Cramer 1999). However, it should be noted that
controversial effects of jasplakinolide have been reported in literature, e.g. a disruption of
actin filaments in-vivo has been reported after treatment with jasplakinolide (Bubb et al.
2000).
Latrunculin on the other hand binds to actin monomers and therefore prevents actin
polymerisation (Coué et al. 1987), but can also disrupt already formed actin fibres
(Morton et al. 2000). There are two forms of latrunculin, latrunculin A and B, the
difference laying in a slightly different structure of the ring configuration of latrunculin,
but effects on actin are similar, although slightly more potent with latrunculin A. The
destabilizing effect of latrunculin is reversible (Gronewold et al. 1999), which is why the
chemical was left in the medium during experiments. Interfering with MTs was achieved
by using paclitaxel, which stabilizes MTs and nocodazole, which depolymerises MTs
(see overview in Table 5-1). Paclitaxel binds to tubulin, stopping the depolymerisation of
MTs, forming thick MTs bundles and also inhibiting cell division (Horwitz 1994;
Marupudi et al. 2007; Lautenschläger et al. 2009). Nocodazole blocks the self assembly
of tubulin, but also depolymerises formed MTs. This effect is reversible (Samson et al.
1979; Musa et al. 2003). To ascertain that the effect of these four drugs is not specific for
the cytoskeleton of one cell type or specific for cell types which grow in suspension
(differentiated NB4 cells), experiments were additionally carried out with cells which
grow adherent but were taken off the substrate for the experiment (3T3 fibroblasts).
These cytoskeletal drugs are summarized in Table 5-1. The appropriate amount of solvent
has been added to the medium of all control cells.
137
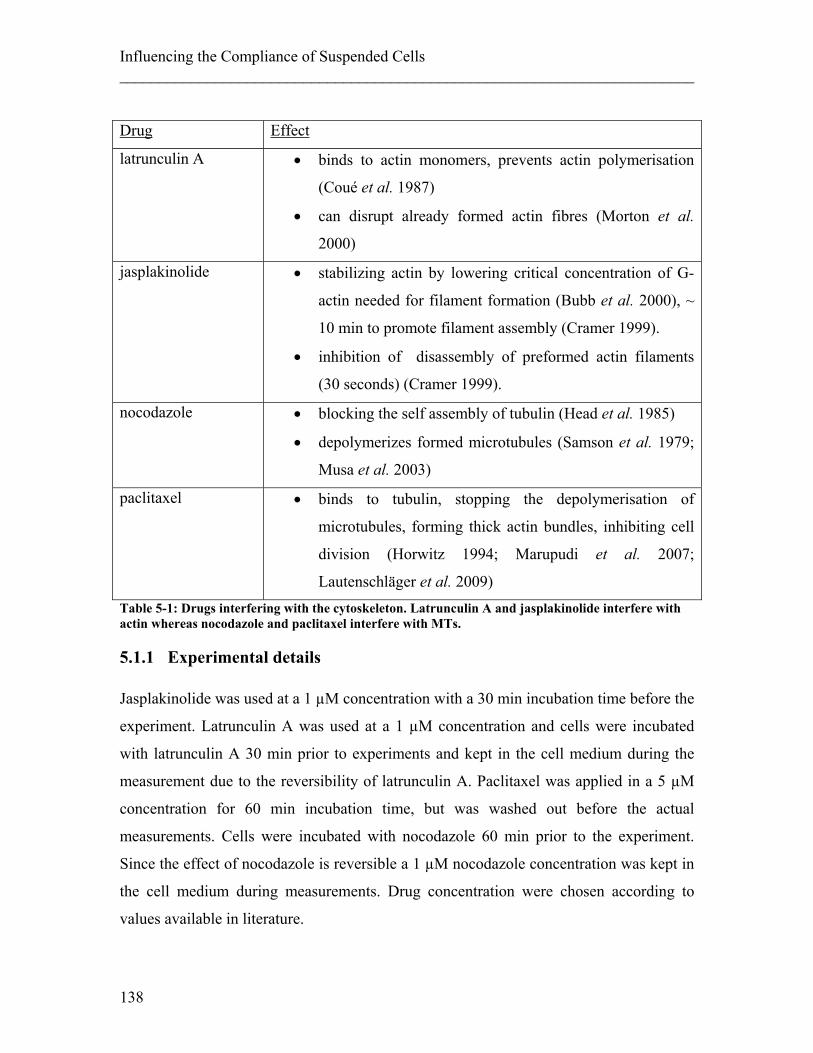
Influencing the Compliance of Suspended Cells ________________________________________________________________________ Drug Effect
latrunculin A • binds to actin monomers, prevents actin polymerisation
(Coué et al. 1987)
• can disrupt already formed actin fibres (Morton et al.
2000)
jasplakinolide • stabilizing actin by lowering critical concentration of G-
actin needed for filament formation (Bubb et al. 2000), ~
10 min to promote filament assembly (Cramer 1999).
• inhibition of disassembly of preformed actin filaments
(30 seconds) (Cramer 1999).
nocodazole • blocking the self assembly of tubulin (Head et al. 1985)
• depolymerizes formed microtubules (Samson et al. 1979;
Musa et al. 2003)
paclitaxel • binds to tubulin, stopping the depolymerisation of
microtubules, forming thick actin bundles, inhibiting cell
division (Horwitz 1994; Marupudi et al. 2007;
Lautenschläger et al. 2009) Table 5-1: Drugs interfering with the cytoskeleton. Latrunculin A and jasplakinolide interfere with actin whereas nocodazole and paclitaxel interfere with MTs.
5.1.1 Experimental details Jasplakinolide was used at a 1 µM concentration with a 30 min incubation time before the
experiment. Latrunculin A was used at a 1 µM concentration and cells were incubated
with latrunculin A 30 min prior to experiments and kept in the cell medium during the
measurement due to the reversibility of latrunculin A. Paclitaxel was applied in a 5 µM
concentration for 60 min incubation time, but was washed out before the actual
measurements. Cells were incubated with nocodazole 60 min prior to the experiment.
Since the effect of nocodazole is reversible a 1 µM nocodazole concentration was kept in
the cell medium during measurements. Drug concentration were chosen according to
values available in literature.
138
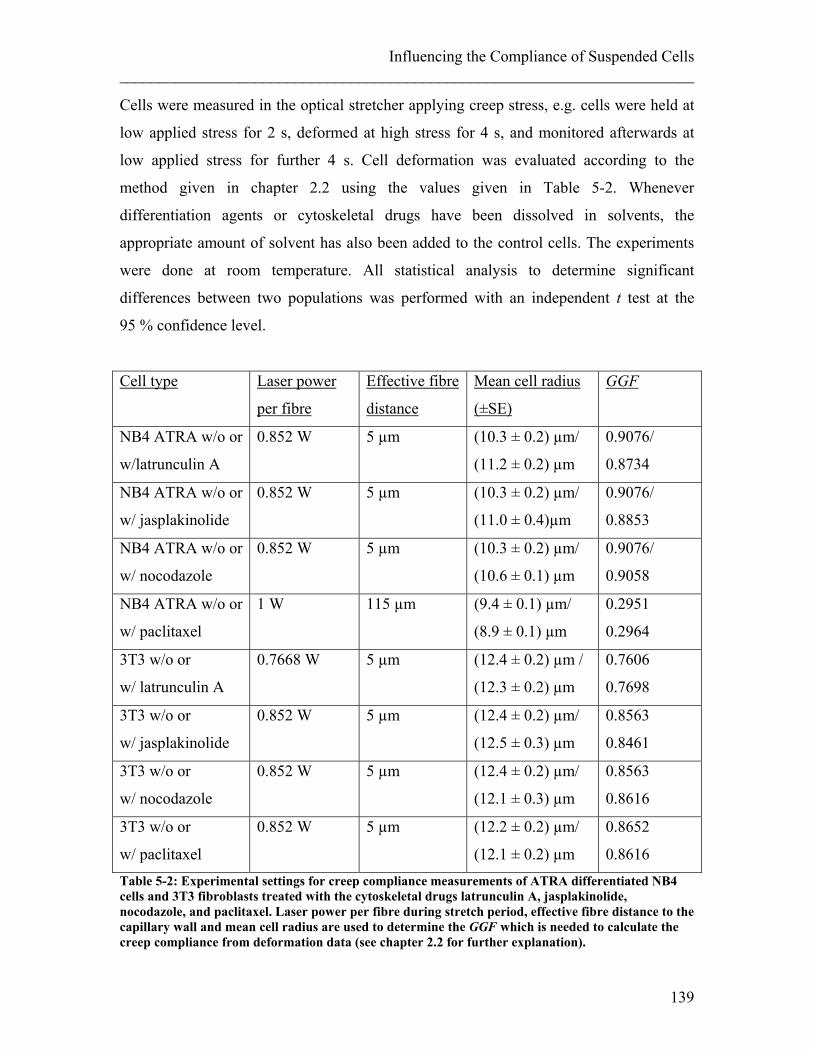
Influencing the Compliance of Suspended Cells ________________________________________________________________________
Cells were measured in the optical stretcher applying creep stress, e.g. cells were held at
low applied stress for 2 s, deformed at high stress for 4 s, and monitored afterwards at
low applied stress for further 4 s. Cell deformation was evaluated according to the
method given in chapter 2.2 using the values given in Table 5-2. Whenever
differentiation agents or cytoskeletal drugs have been dissolved in solvents, the
appropriate amount of solvent has also been added to the control cells. The experiments
were done at room temperature. All statistical analysis to determine significant
differences between two populations was performed with an independent t test at the
95 % confidence level.
GGFCell type Laser power
per fibre
Effective fibre
distance
Mean cell radius
(±SE)
NB4 ATRA w/o or
w/latrunculin A
0.852 W 5 µm (10.3 ± 0.2) µm/
(11.2 ± 0.2) µm
0.9076/
0.8734
NB4 ATRA w/o or
w/ jasplakinolide
0.852 W 5 µm (10.3 ± 0.2) µm/
(11.0 ± 0.4)µm
0.9076/
0.8853
NB4 ATRA w/o or
w/ nocodazole
0.852 W 5 µm (10.3 ± 0.2) µm/
(10.6 ± 0.1) µm
0.9076/
0.9058
NB4 ATRA w/o or
w/ paclitaxel
1 W
115 µm (9.4 ± 0.1) µm/
(8.9 ± 0.1) µm
0.2951
0.2964
3T3 w/o or
w/ latrunculin A
0.7668 W 5 µm (12.4 ± 0.2) µm /
(12.3 ± 0.2) µm
0.7606
0.7698
3T3 w/o or
w/ jasplakinolide
0.852 W 5 µm (12.4 ± 0.2) µm/
(12.5 ± 0.3) µm
0.8563
0.8461
3T3 w/o or
w/ nocodazole
0.852 W 5 µm (12.4 ± 0.2) µm/
(12.1 ± 0.3) µm
0.8563
0.8616
3T3 w/o or
w/ paclitaxel
0.852 W 5 µm (12.2 ± 0.2) µm/
(12.1 ± 0.2) µm
0.8652
0.8616 Table 5-2: Experimental settings for creep compliance measurements of ATRA differentiated NB4 cells and 3T3 fibroblasts treated with the cytoskeletal drugs latrunculin A, jasplakinolide, nocodazole, and paclitaxel. Laser power per fibre during stretch period, effective fibre distance to the capillary wall and mean cell radius are used to determine the GGF which is needed to calculate the creep compliance from deformation data (see chapter 2.2 for further explanation).
139
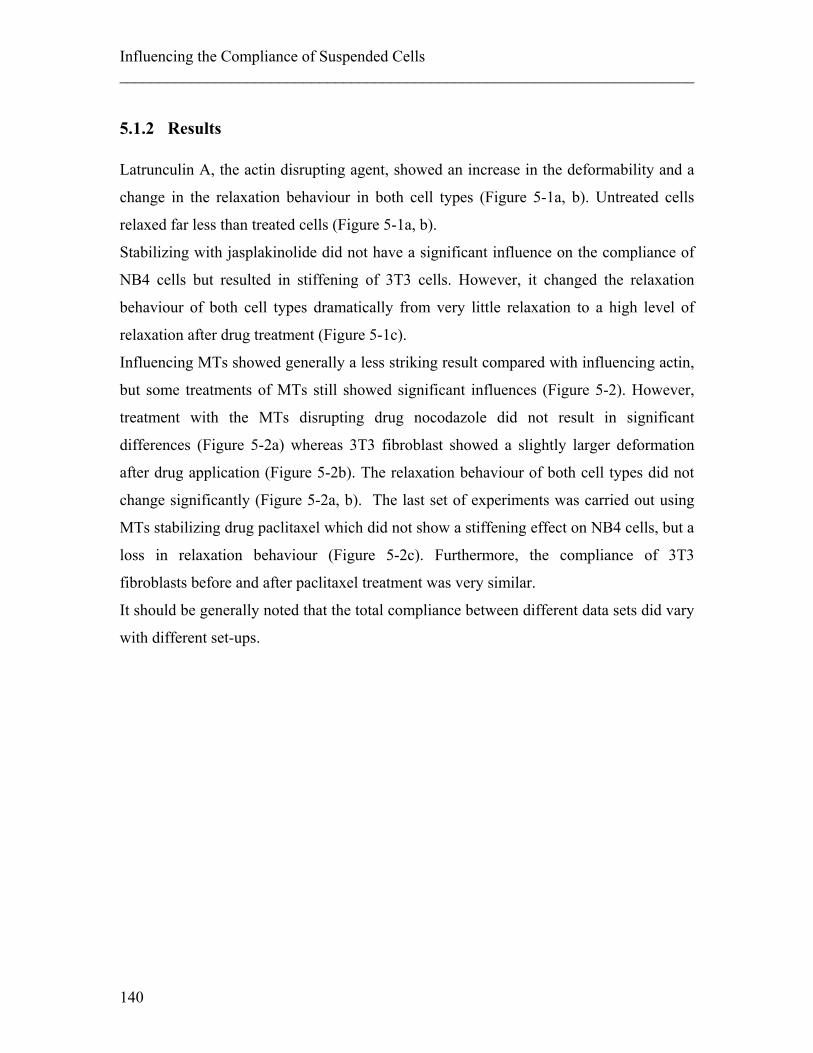
Influencing the Compliance of Suspended Cells ________________________________________________________________________
5.1.2 Results Latrunculin A, the actin disrupting agent, showed an increase in the deformability and a
change in the relaxation behaviour in both cell types (Figure 5-1a, b). Untreated cells
relaxed far less than treated cells (Figure 5-1a, b).
Stabilizing with jasplakinolide did not have a significant influence on the compliance of
NB4 cells but resulted in stiffening of 3T3 cells. However, it changed the relaxation
behaviour of both cell types dramatically from very little relaxation to a high level of
relaxation after drug treatment (Figure 5-1c).
Influencing MTs showed generally a less striking result compared with influencing actin,
but some treatments of MTs still showed significant influences (Figure 5-2). However,
treatment with the MTs disrupting drug nocodazole did not result in significant
differences (Figure 5-2a) whereas 3T3 fibroblast showed a slightly larger deformation
after drug application (Figure 5-2b). The relaxation behaviour of both cell types did not
change significantly (Figure 5-2a, b). The last set of experiments was carried out using
MTs stabilizing drug paclitaxel which did not show a stiffening effect on NB4 cells, but a
loss in relaxation behaviour (Figure 5-2c). Furthermore, the compliance of 3T3
fibroblasts before and after paclitaxel treatment was very similar.
It should be generally noted that the total compliance between different data sets did vary
with different set-ups.
140
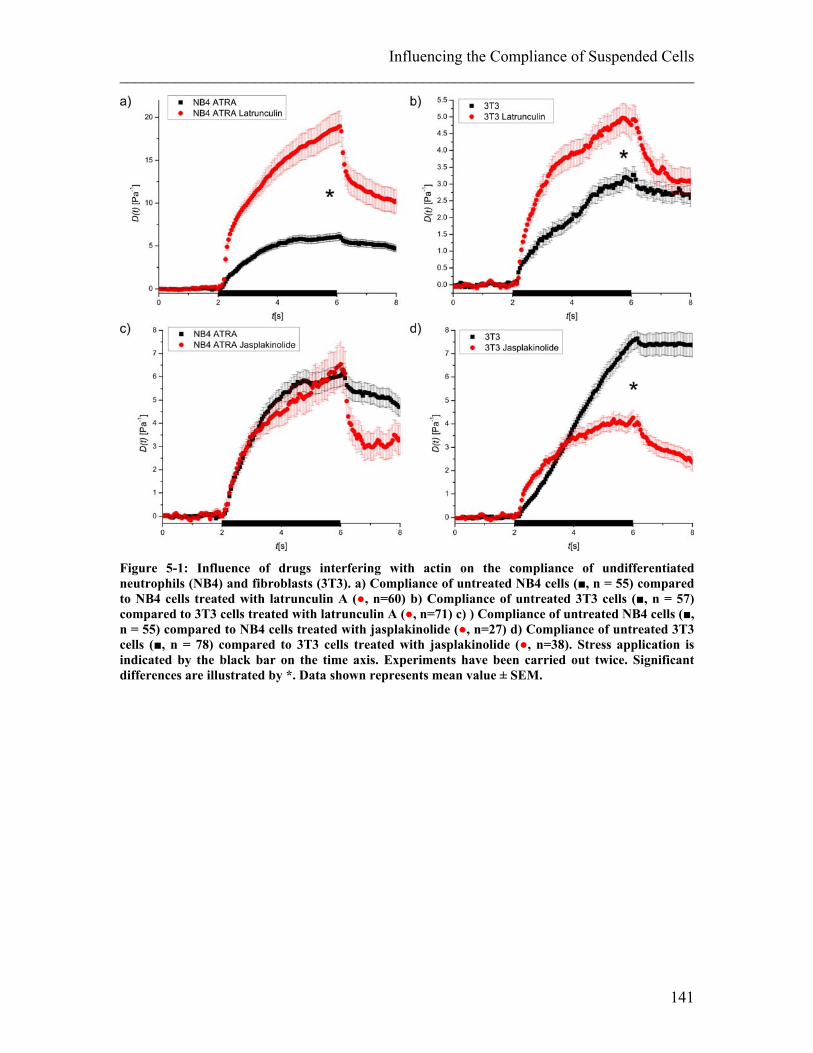
Influencing the Compliance of Suspended Cells ________________________________________________________________________
Figure 5-1: Influence of drugs interfering with actin on the compliance of undifferentiated neutrophils (NB4) and fibroblasts (3T3). a) Compliance of untreated NB4 cells (■, n = 55) compared to NB4 cells treated with latrunculin A (●, n=60) b) Compliance of untreated 3T3 cells (■, n = 57) compared to 3T3 cells treated with latrunculin A (●, n=71) c) ) Compliance of untreated NB4 cells (■, n = 55) compared to NB4 cells treated with jasplakinolide (●, n=27) d) Compliance of untreated 3T3 cells (■, n = 78) compared to 3T3 cells treated with jasplakinolide (●, n=38). Stress application is indicated by the black bar on the time axis. Experiments have been carried out twice. Significant differences are illustrated by *. Data shown represents mean value ± SEM.
141
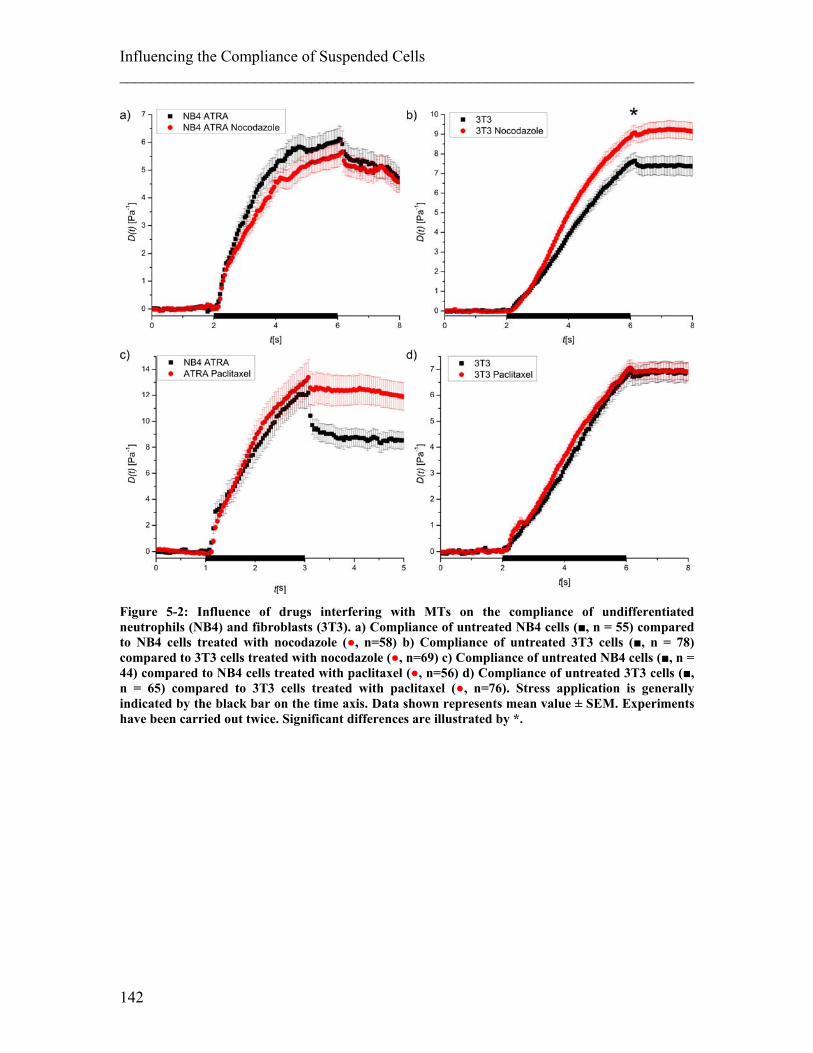
Influencing the Compliance of Suspended Cells ________________________________________________________________________
Figure 5-2: Influence of drugs interfering with MTs on the compliance of undifferentiated neutrophils (NB4) and fibroblasts (3T3). a) Compliance of untreated NB4 cells (■, n = 55) compared to NB4 cells treated with nocodazole (●, n=58) b) Compliance of untreated 3T3 cells (■, n = 78) compared to 3T3 cells treated with nocodazole (●, n=69) c) Compliance of untreated NB4 cells (■, n = 44) compared to NB4 cells treated with paclitaxel (●, n=56) d) Compliance of untreated 3T3 cells (■, n = 65) compared to 3T3 cells treated with paclitaxel (●, n=76). Stress application is generally indicated by the black bar on the time axis. Data shown represents mean value ± SEM. Experiments have been carried out twice. Significant differences are illustrated by *.
142
Influencing the Compliance of Suspended Cells ________________________________________________________________________
5.1.3 Discussion The cytoskeleton consists of a number of components which are working tightly together
to fulfil a variety of tasks such as transport of cargo material or generating forces. It
consists of interlinked polymers and has a high impact on the compliance of cells (Elson
1988). I started to investigate the influence which the components of the cytoskeleton
have on the compliance of suspended cells by stabilizing and destabilizing actin and MTs
using four different drugs on two different cell types. One cell type is growing naturally
in suspension (NB4); the other one is an adherent cell line (3T3 fibroblasts) but was taken
off the culturing substrate before measurement.
Before discussing the effect of different cytoskeletal drugs on the compliance a general
statement should be made concerning different absolute compliance values in similar
experiments. The fact of relative deformation of cells not being the same in different
experiments can be explained by different cell sizes and different stresses applied to the
cells, which are due to changes between different set-ups which have been used over the
period of my PhD, mainly due to reparations. Nevertheless, these factors are taken into
account when calculating the general geometric factor (GGF) which implements cell
geometry, fibre distance and laser power. However, differences in the compliance are still
present after this GGF has been considered, e.g. in the compliance of 3T3 controls cells
in Figure 5-1b compared with Figure 5-1d. One explanation to this discrepancy could be
a non-linearity in the compliance of cells, e.g. applying twice the amount of stress does
not result in twice the strain but more (or less). Such non-linearity has been suggested by
Karcher et al. working on 3T3 fibroblasts using magnetic bead rheology and theoretical
simulation (Karcher et al. 2003). They found the relation between the applied force and
the bead displacement, depending on the rate with which different forces were applied,
not to be linear but showing a convex curve. This is an interesting fact which is worth
investigating further but was not feasible within the time constraints of this thesis. Other
reasons might be found in differences in heating with different optical stretcher settings
which cannot yet be fully determined. Further on, it is difficult to discuss the relaxation
behaviour of my deformation graphs since there are too many unknowns which I cannot
determine at this stage. There are different processes which could happen while straining
143
Influencing the Compliance of Suspended Cells ________________________________________________________________________ a filament network, e.g. the crosslinker of the network could break but rebind later, either
still during force application or afterwards, which would result in few or no relaxation
behaviour (Lieleg and Bausch 2007; Reisinger and Rief 2009); or the crosslinker could
get stretched similar to small springs in between the fibres (Kollmannsberger and Fabry
2011). In the latter case, crosslinker would add to a relaxation of the cell so they can go
back into their original shape after stress cessation. Most likely the actual scenario will be
a combination of these processes and can be shifted towards the one or the other extreme
due to various factors, but with the tools available to me I was not able to determine such.
The temperature of the environment, the dynamics of the active cross linkers, and
redundancy mechanisms between different filament types are only three factors which
might influence this relaxation behaviour. Therefore, it is not possible in the scope of this
work to explain extensively the relaxation behaviours observed in different experiments.
Effect of latrunculin A:
I first destabilized actin filaments using latrunculin A, which resulted in higher
compliance in both cell types. Since latrunculin A reduces the amount of F-actin and
therefore destabilizes the actin network (Morton et al. 2000), such higher compliance was
expected. Nevertheless, a higher compliance might suggest a higher viscosity of the cells
which would result in less relaxation. However, my data show a higher relaxation after
latrunculin A treatment. The response of increased compliance is consistent with
literature, for example on fibroblast mechanical properties measured by uniaxial stress-
strain measurements (Wakatsuki et al. 2001). Another study probing the stiffness of
epithelial cells by optical tweezers measurements also saw cells becoming softer with
latrunculin A treatment but did additionally find an increase in the viscous properties
(Yalcin et al. 2009), whereas my data from suspended cells measured in the optical
stretcher shows larger deformation but also larger relaxation, so therefore less viscous
response. My data generally seem to confirm literature in terms of increasing the
compliance of cells during stretch by addition of latrunculin A. Nevertheless, I see
differences in the relaxation behaviour compared to studies done so far. Such differences
might well be due to the different cell types used or the different measurement method.
144
Influencing the Compliance of Suspended Cells ________________________________________________________________________
The heterogeneity of the latrunculin A effects is highly likely due to a different actin-
filament turnover in the different experiments. Latrunculin A binds to actin monomers
and prevents additional actin polymerization (Coué et al. 1987). Knowles and McCulloch
have shown a decrease of available G-actin after trypsinization of adherent cells
(Knowles and McCulloch 1992). If less G-actin is available for latrunculin A to bind,
latrunculin A will have a weaker effect on adherent cells which have been trypsinized.
Such a weaker effect seems confirmed by my measurements since the effect of
latrunculin A is less strong on the trypsinized 3T3 cells than on the naturally suspended
NB4s.
It is also possible to compare the measured compliance curves with deformation curves
as they would be generated by the different models of visco-elasticity (see chapter 2.1).
Even though the focus of my work was not such evaluation in detail, which is the reason
why I did not fit such curves to my data, I still wanted to compare these curves generally
in order to see if I can learn something about the analogue role actin is playing in the
cytoskeleton. As it can be seen in Figure 5-1a, the total deformation of both NB4 and 3T3
cells became larger after treating the cells with latrunculin A. Nevertheless, the temporal
development of the resulting deformation differs a lot between both cell types. For NB4
cells this temporal development of the resulting deformation could probably be described
by a visco-elastic behaviour before and after treatment with latrunculin A, similar to what
I would expect from a three-element model. Nevertheless, the slope of the deformation
increases when actin is broken down after drug application and is shifted to a curve
which would arise from a viscous model, as explained in chapter 2.1 (see Figure 2-7)
Contrary to that, the relaxation of the cells got much larger after drug application which
points away from a viscous towards an elastic material. In the case of 3T3 fibroblasts
treated with latrunculin A (as shown in Figure 5-1b), the deformation curve does not
resemble a deformation which would be generated using a three-element model as it has
been done before by Wottawah et al. (Wottawah et al. 2005b), it rather resembles two
different regimes of viscous behaviour. Interesting enough, the second regime seems to
be very similar for treated and untreated cells; the differences seem to lay only in the first
viscous deformation part, which is steeper after treatment with latrunculin A.
145
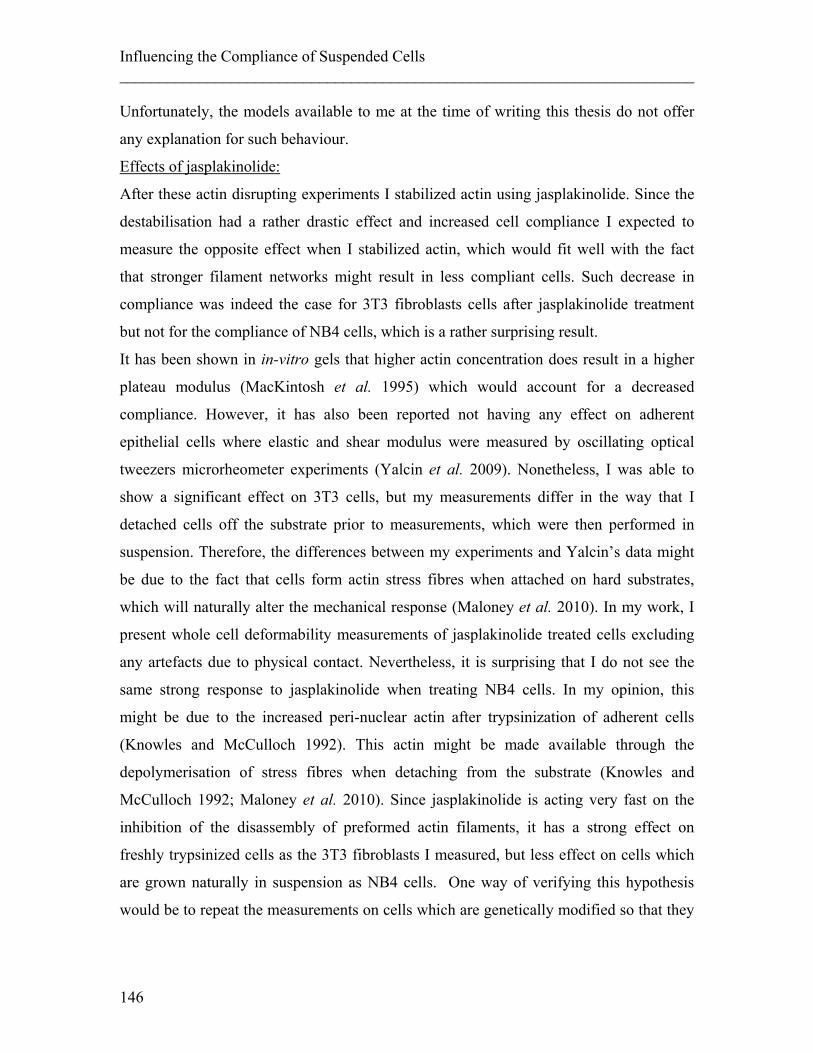
Influencing the Compliance of Suspended Cells ________________________________________________________________________ Unfortunately, the models available to me at the time of writing this thesis do not offer
any explanation for such behaviour.
Effects of jasplakinolide:
After these actin disrupting experiments I stabilized actin using jasplakinolide. Since the
destabilisation had a rather drastic effect and increased cell compliance I expected to
measure the opposite effect when I stabilized actin, which would fit well with the fact
that stronger filament networks might result in less compliant cells. Such decrease in
compliance was indeed the case for 3T3 fibroblasts cells after jasplakinolide treatment
but not for the compliance of NB4 cells, which is a rather surprising result.
It has been shown in in-vitro gels that higher actin concentration does result in a higher
plateau modulus (MacKintosh et al. 1995) which would account for a decreased
compliance. However, it has also been reported not having any effect on adherent
epithelial cells where elastic and shear modulus were measured by oscillating optical
tweezers microrheometer experiments (Yalcin et al. 2009). Nonetheless, I was able to
show a significant effect on 3T3 cells, but my measurements differ in the way that I
detached cells off the substrate prior to measurements, which were then performed in
suspension. Therefore, the differences between my experiments and Yalcin’s data might
be due to the fact that cells form actin stress fibres when attached on hard substrates,
which will naturally alter the mechanical response (Maloney et al. 2010). In my work, I
present whole cell deformability measurements of jasplakinolide treated cells excluding
any artefacts due to physical contact. Nevertheless, it is surprising that I do not see the
same strong response to jasplakinolide when treating NB4 cells. In my opinion, this
might be due to the increased peri-nuclear actin after trypsinization of adherent cells
(Knowles and McCulloch 1992). This actin might be made available through the
depolymerisation of stress fibres when detaching from the substrate (Knowles and
McCulloch 1992; Maloney et al. 2010). Since jasplakinolide is acting very fast on the
inhibition of the disassembly of preformed actin filaments, it has a strong effect on
freshly trypsinized cells as the 3T3 fibroblasts I measured, but less effect on cells which
are grown naturally in suspension as NB4 cells. One way of verifying this hypothesis
would be to repeat the measurements on cells which are genetically modified so that they
146
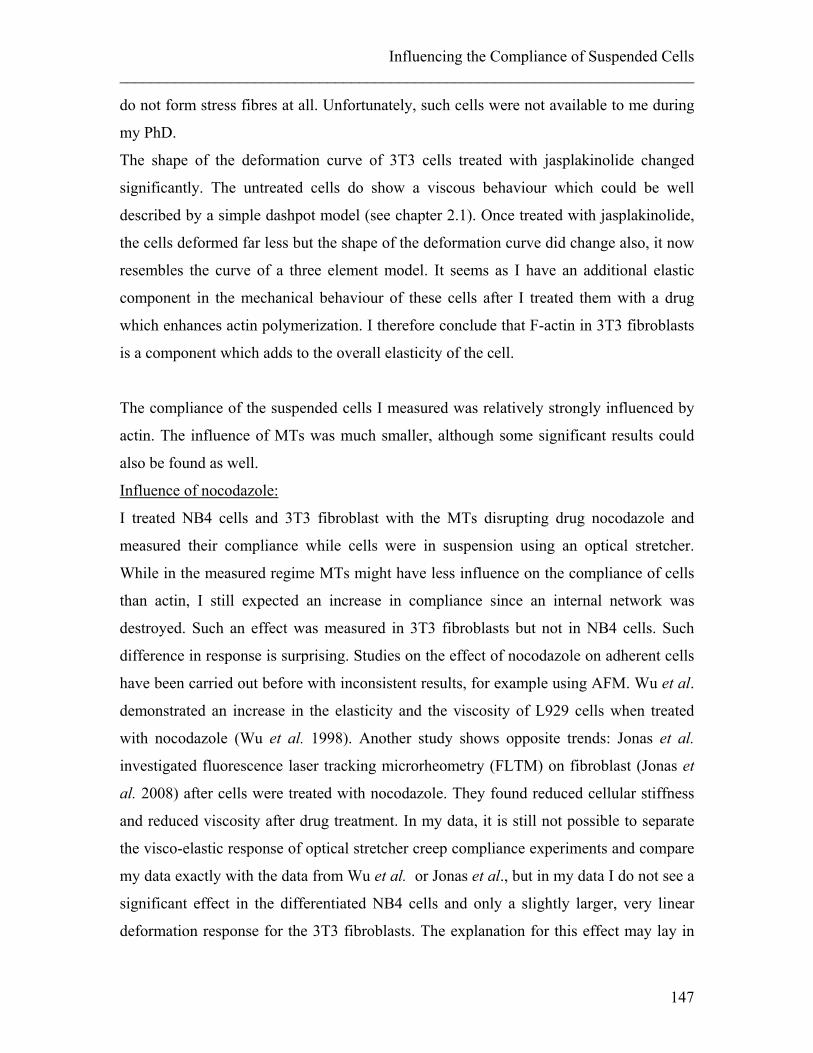
Influencing the Compliance of Suspended Cells ________________________________________________________________________
do not form stress fibres at all. Unfortunately, such cells were not available to me during
my PhD.
The shape of the deformation curve of 3T3 cells treated with jasplakinolide changed
significantly. The untreated cells do show a viscous behaviour which could be well
described by a simple dashpot model (see chapter 2.1). Once treated with jasplakinolide,
the cells deformed far less but the shape of the deformation curve did change also, it now
resembles the curve of a three element model. It seems as I have an additional elastic
component in the mechanical behaviour of these cells after I treated them with a drug
which enhances actin polymerization. I therefore conclude that F-actin in 3T3 fibroblasts
is a component which adds to the overall elasticity of the cell.
The compliance of the suspended cells I measured was relatively strongly influenced by
actin. The influence of MTs was much smaller, although some significant results could
also be found as well.
Influence of nocodazole:
I treated NB4 cells and 3T3 fibroblast with the MTs disrupting drug nocodazole and
measured their compliance while cells were in suspension using an optical stretcher.
While in the measured regime MTs might have less influence on the compliance of cells
than actin, I still expected an increase in compliance since an internal network was
destroyed. Such an effect was measured in 3T3 fibroblasts but not in NB4 cells. Such
difference in response is surprising. Studies on the effect of nocodazole on adherent cells
have been carried out before with inconsistent results, for example using AFM. Wu et al.
demonstrated an increase in the elasticity and the viscosity of L929 cells when treated
with nocodazole (Wu et al. 1998). Another study shows opposite trends: Jonas et al.
investigated fluorescence laser tracking microrheometry (FLTM) on fibroblast (Jonas et
al. 2008) after cells were treated with nocodazole. They found reduced cellular stiffness
and reduced viscosity after drug treatment. In my data, it is still not possible to separate
the visco-elastic response of optical stretcher creep compliance experiments and compare
my data exactly with the data from Wu et al. or Jonas et al., but in my data I do not see a
significant effect in the differentiated NB4 cells and only a slightly larger, very linear
deformation response for the 3T3 fibroblasts. The explanation for this effect may lay in
147
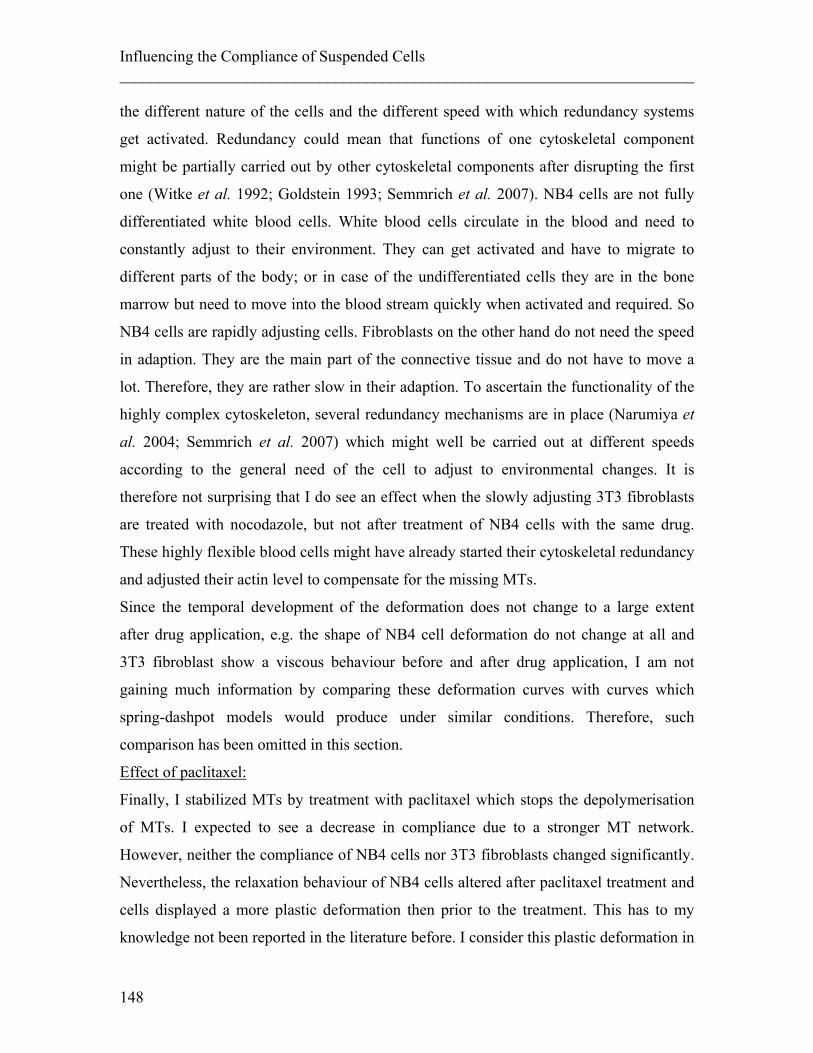
Influencing the Compliance of Suspended Cells ________________________________________________________________________ the different nature of the cells and the different speed with which redundancy systems
get activated. Redundancy could mean that functions of one cytoskeletal component
might be partially carried out by other cytoskeletal components after disrupting the first
one (Witke et al. 1992; Goldstein 1993; Semmrich et al. 2007). NB4 cells are not fully
differentiated white blood cells. White blood cells circulate in the blood and need to
constantly adjust to their environment. They can get activated and have to migrate to
different parts of the body; or in case of the undifferentiated cells they are in the bone
marrow but need to move into the blood stream quickly when activated and required. So
NB4 cells are rapidly adjusting cells. Fibroblasts on the other hand do not need the speed
in adaption. They are the main part of the connective tissue and do not have to move a
lot. Therefore, they are rather slow in their adaption. To ascertain the functionality of the
highly complex cytoskeleton, several redundancy mechanisms are in place (Narumiya et
al. 2004; Semmrich et al. 2007) which might well be carried out at different speeds
according to the general need of the cell to adjust to environmental changes. It is
therefore not surprising that I do see an effect when the slowly adjusting 3T3 fibroblasts
are treated with nocodazole, but not after treatment of NB4 cells with the same drug.
These highly flexible blood cells might have already started their cytoskeletal redundancy
and adjusted their actin level to compensate for the missing MTs.
Since the temporal development of the deformation does not change to a large extent
after drug application, e.g. the shape of NB4 cell deformation do not change at all and
3T3 fibroblast show a viscous behaviour before and after drug application, I am not
gaining much information by comparing these deformation curves with curves which
spring-dashpot models would produce under similar conditions. Therefore, such
comparison has been omitted in this section.
Effect of paclitaxel:
Finally, I stabilized MTs by treatment with paclitaxel which stops the depolymerisation
of MTs. I expected to see a decrease in compliance due to a stronger MT network.
However, neither the compliance of NB4 cells nor 3T3 fibroblasts changed significantly.
Nevertheless, the relaxation behaviour of NB4 cells altered after paclitaxel treatment and
cells displayed a more plastic deformation then prior to the treatment. This has to my
knowledge not been reported in the literature before. I consider this plastic deformation in
148
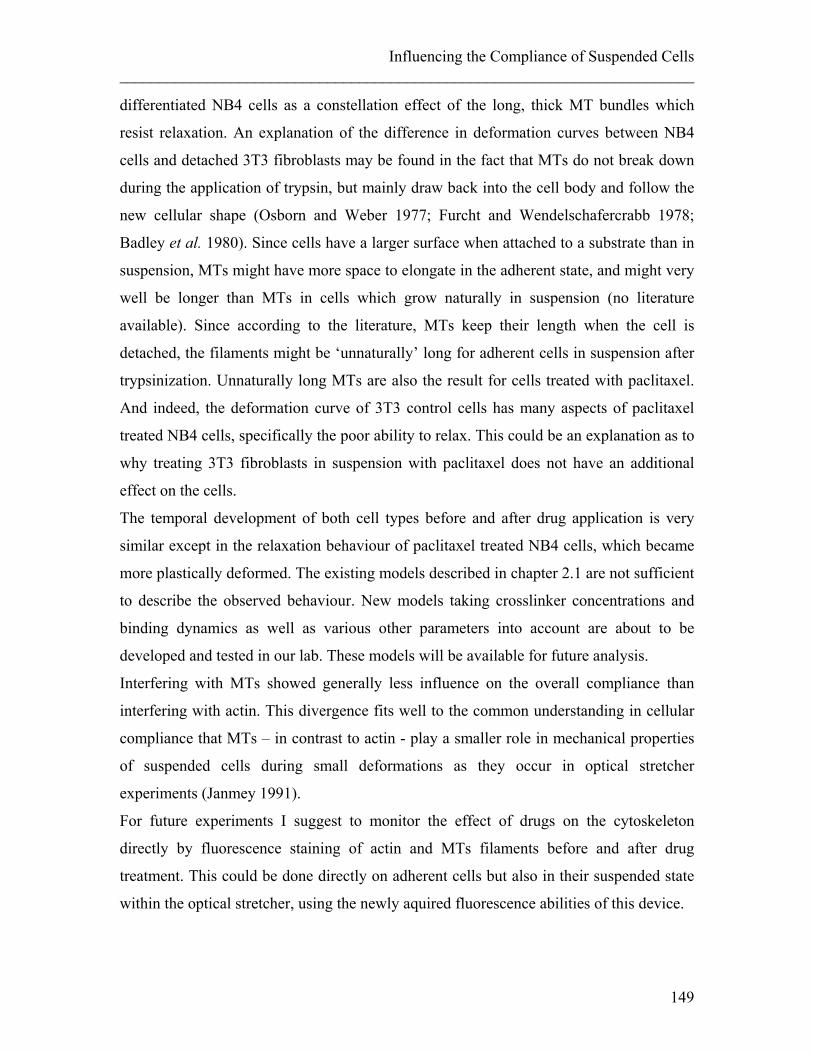
Influencing the Compliance of Suspended Cells ________________________________________________________________________
differentiated NB4 cells as a constellation effect of the long, thick MT bundles which
resist relaxation. An explanation of the difference in deformation curves between NB4
cells and detached 3T3 fibroblasts may be found in the fact that MTs do not break down
during the application of trypsin, but mainly draw back into the cell body and follow the
new cellular shape (Osborn and Weber 1977; Furcht and Wendelschafercrabb 1978;
Badley et al. 1980). Since cells have a larger surface when attached to a substrate than in
suspension, MTs might have more space to elongate in the adherent state, and might very
well be longer than MTs in cells which grow naturally in suspension (no literature
available). Since according to the literature, MTs keep their length when the cell is
detached, the filaments might be ‘unnaturally’ long for adherent cells in suspension after
trypsinization. Unnaturally long MTs are also the result for cells treated with paclitaxel.
And indeed, the deformation curve of 3T3 control cells has many aspects of paclitaxel
treated NB4 cells, specifically the poor ability to relax. This could be an explanation as to
why treating 3T3 fibroblasts in suspension with paclitaxel does not have an additional
effect on the cells.
The temporal development of both cell types before and after drug application is very
similar except in the relaxation behaviour of paclitaxel treated NB4 cells, which became
more plastically deformed. The existing models described in chapter 2.1 are not sufficient
to describe the observed behaviour. New models taking crosslinker concentrations and
binding dynamics as well as various other parameters into account are about to be
developed and tested in our lab. These models will be available for future analysis.
Interfering with MTs showed generally less influence on the overall compliance than
interfering with actin. This divergence fits well to the common understanding in cellular
compliance that MTs – in contrast to actin - play a smaller role in mechanical properties
of suspended cells during small deformations as they occur in optical stretcher
experiments (Janmey 1991).
For future experiments I suggest to monitor the effect of drugs on the cytoskeleton
directly by fluorescence staining of actin and MTs filaments before and after drug
treatment. This could be done directly on adherent cells but also in their suspended state
within the optical stretcher, using the newly aquired fluorescence abilities of this device.
149
Influencing the Compliance of Suspended Cells ________________________________________________________________________
5.2 Influence of Molecular Motor Drugs on Cell Compliance In the previous section, I showed that the influence of actin on the overall compliance of
cells is larger than the influence of MTs. The actin polymer network in cells is
responsible for many cellular functions; it is involved in the shape of cells, in generating
forces and the migration of cells. Actin is forming different types of networks and
provides general support and stability for the cells (Fletcher and Mullins 2010). The
amount of filamentous actin and the cross linking between these filaments is crucial for
the compliance of cells (MacKintosh et al. 1995), which will differ when actin structure
is changed as I was able to show in the previous section. Since the actin cytoskeleton is
fundamentally different in adherent cells compared with cells naturally in suspension, it
is not surprising that differences in mechanical properties can be found. It was even show
that adherent cells change mechanical properties once they are trypsinized and in
suspension (Maloney et al. 2010). Apart from the filaments themselves and cross-linkers,
there are other components adding to the mechanical response of cells to a step stress,
e.g. molecular motors, which can modify and interact with the actin cytoskeleton.
Molecular motors are micro-machineries which can either transport cargo within the cell
using actin filaments as guide rail or slide single filaments along each other. This is
important whenever the cell needs to apply forces or changes its shape, as during cell
migration, but also when cells need to contract as in muscles, wound closure processes or
mechano-sensing of its environment. One molecular motor, myosin, has been already
shown to influence the mechanical properties of adherent cells. As an example, it
influences the pre-tension of an adherent cell by pulling on actin fibres spanning though
adherent cells (Vale 2003). These actin fibres are called stress fibres and constitute the
main differences in cells when they are adherent compared to their suspended state.
Adherent cells have anchoring points to the substrate, called focal adhesions, and actin
stress fibres are spanning through cells from one focal adhesion point to another. Cells
only have stress fibres when in contact with a substrate. These stress fibres are far more
prominent when cells are cultured on hard substrates, as glass or plastic culture dishes
and could, to some extent, be seen as culturing artefact, especially for cells which are not
in a hard environment in-vivo. Therefore, it is quite crucial to use the right tool measuring
150
Influencing the Compliance of Suspended Cells ________________________________________________________________________
mechanical properties of cells. There are several ways of measuring mechanical
properties of adherent cells (see chapter 2.1). A popular method is atomic force
microscopy (AFM), which can probe elastic properties of cells with a high special
resolution by poking the surface of the cell with a cantilever (Radmacher et al. 1992). A
different approach is magnetic bead rheology, where magnetic beads are bound to the
surface of cells and forces are applied by external magnetic fields (Bausch et al. 1998).
To measure mechanical properties of cells in suspension is far more difficult. This can be
done by micropipette aspiration (Hochmuth 2000) or optical tweezers which can trap and
move beads sticking to the surface of cells (Padget 1997), but most of these methods still
require physical contact to the cell surface and will therefore enhance focal adhesion
points and stress fibres. One way of measuring pure mechanical properties of cells
without any physical contact and therefore no chance of stress fibre artefacts is by means
of optical trapping of the cell itself. Optical stretchers are exploiting this concept since
they trap and stretch single cells in two counter propagating laser beams where no
physical contact is required (Guck et al. 2000; Guck et al. 2001; Guck et al. 2002; Guck
et al. 2005). Measuring adherent cells on hard substrates or measuring cells completely in
suspension represent the two extremes of cellular attachment. Most cells will be in a state
in between those two, but I can still gain insights from investigating those two extremes.
The goal of the experiments described in this chapter was to understand the role which
myosin plays on the remaining actin cytoskeleton when cells are brought into total
suspension. Myosin refers not only to one type of molecular motor but to a whole family
of motors binding to actin. I investigated the non-muscle myosin II, which is specifically
cross-linking two actin filaments and exert tension (Lauffenburger and Horwitz 1996).
There are several drugs to interfere with myosin II activity, as blebbistatin, Y-27632,
phorbol 12,13-dibutyrate or ML7. Blebbistatin is a small molecule inhibitor which
selectively inhibits non-muscle myosin II (Kovacs et al. 2004). However, recent findings
suggest that blebbistatin does not necessarly weaken the acitin-myosin complex but that it
induces the priming of the lever during the myosin power-stroke and stabilizes mysosin
in the pre-powerstroke state (Takácsa et al. 2010). Y-27632 also inhibits myosin activity
but by inhibiting the Rho-associate kinase ROCK (Maekawa et al. 1999). Phorbol 12,13-
dibutyrate on the other hand activates the protein kinese C (PKC) which results in an
151
Influencing the Compliance of Suspended Cells ________________________________________________________________________ activation of myosin (Blumberg et al. 1983; Yanagita et al. 1999). The last drug, called
ML7, is an inhibitor of smooth muscle myosin light chain kinase (MLCK) with relatively
weak response (Bain et al. 2003). It is mentioned here because of the use of it in older
references, but was not used in my experiments anymore since drugs with stronger effects
as Y-27632 were available to me.
So far, it exists a range of data measuring mechanical properties of cells treated with
these drugs (Moy et al. 2004; Martens and Radmacher 2008), but all of these studies
measure cells while adhered to a substrate. In adherent cells it was shown that if myosin
activity was inhibited, the pre-tension in adherent cells was lost which resulted in a lower
elastic modulus. This effect could be directly related to the presence of stress fibres.
During my PhD, I measured the effect of three myosin II modulators (blebbistatin, Y-
27632 and phorbol 12,13-dibutyrate, see Table 5-3) on the mechanical compliance of
cells in suspension. To assure that the effect I am measuring is not due to inherent
differences in the cytoskeleton of cells which grow naturally in suspension compared to
cells which are naturally adherent, I evaluated the influence of these drugs on the
compliance of undifferentiated neutrophil cell line (NB4) with the response of detached
3T3 fibroblasts. Since these two cell lines are immortal bearing the risk of altered
properties compared to cells in-vivo due to long term culturing effects, I also planned to
do first proof of principle experiments on undifferentiated mouse embryonic stem cells
named TNGAs, which are only stable for few passages and therefore much closer to cells
in-vivo with less chances of alterations due to long term culturing. The experiments on
the TNGA cells have been carried out in collaboration with Kevin Chalut.
An additional experiment was carried out to evaluate if active stimulation of non
differentiated neutrophils has an influence on the effect of blebbistatin. Therefore, NB4
cells treated with 5nM fMLP were measured with and without the myosin inhibiting drug
blebbistatin.
This study is in preparation for publication at the time of submitting this thesis.
5.2.1 Experimental details For drug measurements, cells were treated either with 50 µM blebbistatin and measured
right away, with Y-27632 and incubated for 30 min prior to measurement, or with
152
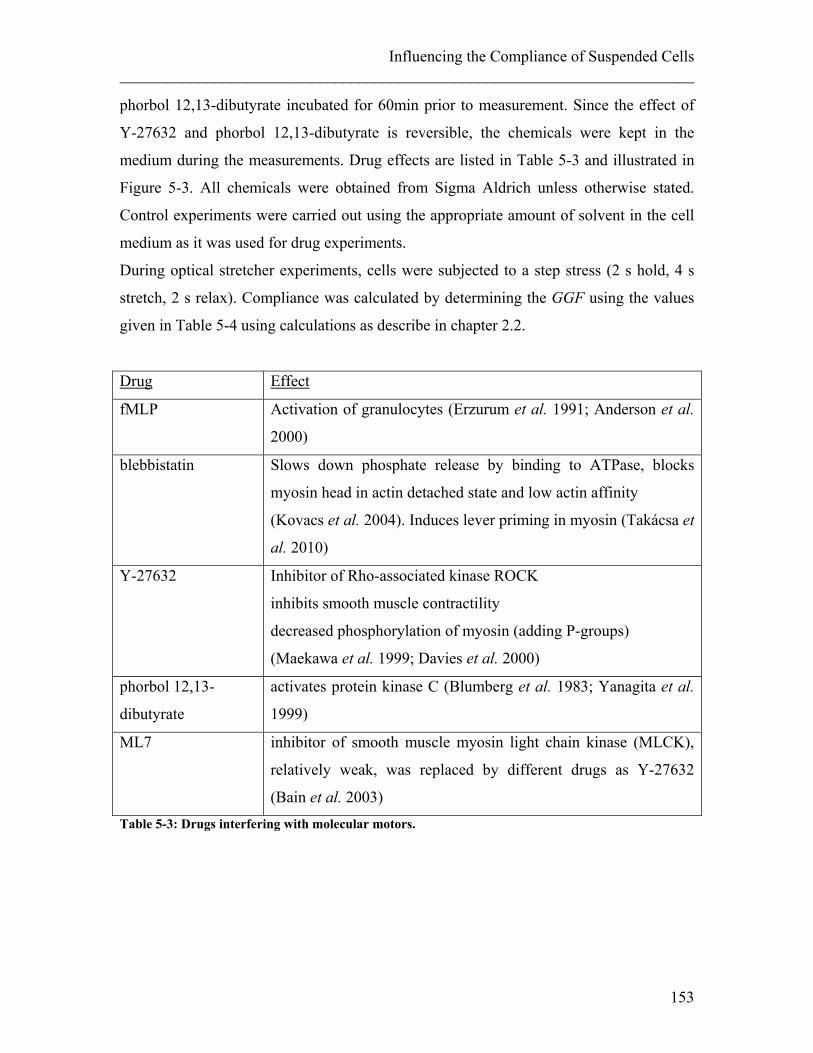
Influencing the Compliance of Suspended Cells ________________________________________________________________________
phorbol 12,13-dibutyrate incubated for 60min prior to measurement. Since the effect of
Y-27632 and phorbol 12,13-dibutyrate is reversible, the chemicals were kept in the
medium during the measurements. Drug effects are listed in Table 5-3 and illustrated in
Figure 5-3. All chemicals were obtained from Sigma Aldrich unless otherwise stated.
Control experiments were carried out using the appropriate amount of solvent in the cell
medium as it was used for drug experiments.
During optical stretcher experiments, cells were subjected to a step stress (2 s hold, 4 s
stretch, 2 s relax). Compliance was calculated by determining the GGF using the values
given in Table 5-4 using calculations as describe in chapter 2.2.
Drug Effect
fMLP Activation of granulocytes (Erzurum et al. 1991; Anderson et al.
2000)
blebbistatin Slows down phosphate release by binding to ATPase, blocks
myosin head in actin detached state and low actin affinity
(Kovacs et al. 2004). Induces lever priming in myosin (Takácsa et
al. 2010)
Y-27632 Inhibitor of Rho-associated kinase ROCK
inhibits smooth muscle contractility
decreased phosphorylation of myosin (adding P-groups)
(Maekawa et al. 1999; Davies et al. 2000)
phorbol 12,13-
dibutyrate
activates protein kinase C (Blumberg et al. 1983; Yanagita et al.
1999)
ML7 inhibitor of smooth muscle myosin light chain kinase (MLCK),
relatively weak, was replaced by different drugs as Y-27632
(Bain et al. 2003) Table 5-3: Drugs interfering with molecular motors.
153
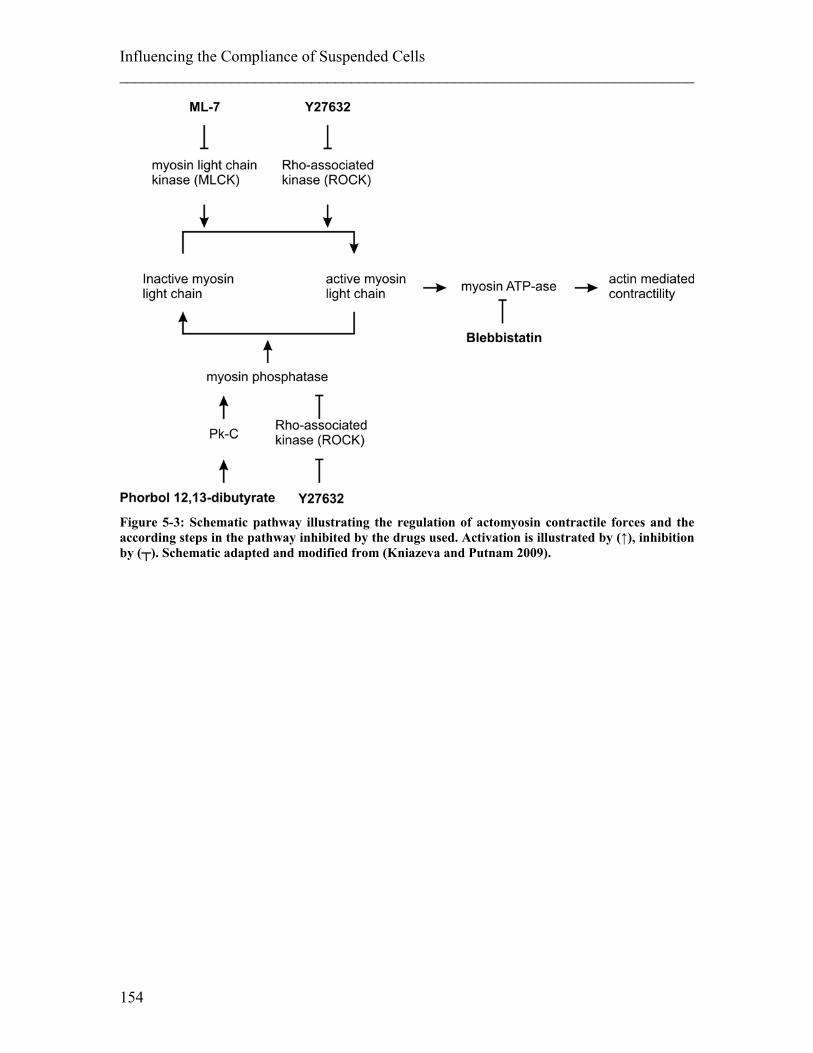
Influencing the Compliance of Suspended Cells ________________________________________________________________________
Figure 5-3: Schematic pathway illustrating the regulation of actomyosin contractile forces and the according steps in the pathway inhibited by the drugs used. Activation is illustrated by (↑), inhibition by (┬). Schematic adapted and modified from (Kniazeva and Putnam 2009).
154
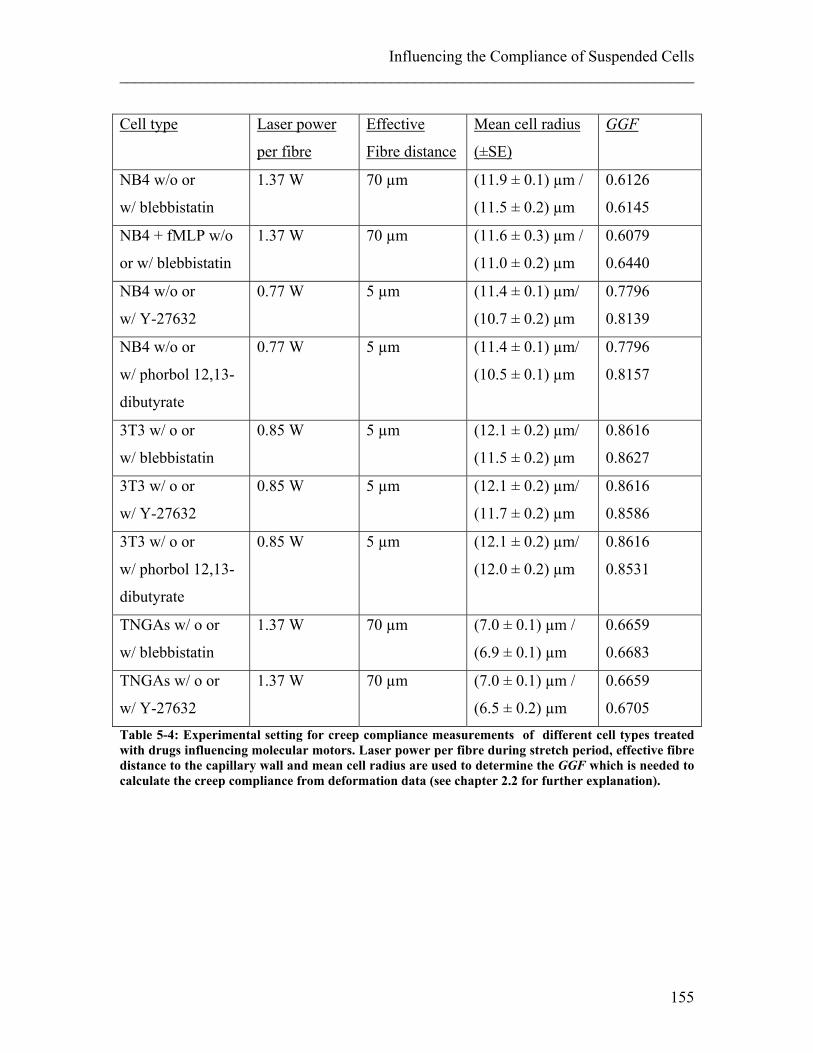
Influencing the Compliance of Suspended Cells ________________________________________________________________________
GGFCell type Laser power
per fibre
Effective
Fibre distance
Mean cell radius
(±SE)
NB4 w/o or
w/ blebbistatin
1.37 W 70 µm (11.9 ± 0.1) µm /
(11.5 ± 0.2) µm
0.6126
0.6145
NB4 + fMLP w/o
or w/ blebbistatin
1.37 W 70 µm (11.6 ± 0.3) µm /
(11.0 ± 0.2) µm
0.6079
0.6440
NB4 w/o or
w/ Y-27632
0.77 W 5 µm (11.4 ± 0.1) µm/
(10.7 ± 0.2) µm
0.7796
0.8139
NB4 w/o or
w/ phorbol 12,13-
dibutyrate
0.77 W 5 µm (11.4 ± 0.1) µm/
(10.5 ± 0.1) µm
0.7796
0.8157
3T3 w/ o or
w/ blebbistatin
0.85 W 5 µm (12.1 ± 0.2) µm/
(11.5 ± 0.2) µm
0.8616
0.8627
3T3 w/ o or
w/ Y-27632
0.85 W 5 µm (12.1 ± 0.2) µm/
(11.7 ± 0.2) µm
0.8616
0.8586
3T3 w/ o or
w/ phorbol 12,13-
dibutyrate
0.85 W 5 µm (12.1 ± 0.2) µm/
(12.0 ± 0.2) µm
0.8616
0.8531
TNGAs w/ o or
w/ blebbistatin
1.37 W 70 µm (7.0 ± 0.1) µm /
(6.9 ± 0.1) µm
0.6659
0.6683
TNGAs w/ o or
w/ Y-27632
1.37 W 70 µm (7.0 ± 0.1) µm /
(6.5 ± 0.2) µm
0.6659
0.6705 Table 5-4: Experimental setting for creep compliance measurements of different cell types treated with drugs influencing molecular motors. Laser power per fibre during stretch period, effective fibre distance to the capillary wall and mean cell radius are used to determine the GGF which is needed to calculate the creep compliance from deformation data (see chapter 2.2 for further explanation).
155
Influencing the Compliance of Suspended Cells ________________________________________________________________________
5.2.2 Results The most drastic result is the response of all three measured cell types to the influence of
blebbistatin. Undifferentiated neutrophils (NB4 cells) became significantly less compliant
(Figure 5-4a) as did adherent fibroblasts (3T3 cells, Figure 5-5a) and embryonic stem
cells (TNGA cells, Figure 5-6a). This trend could also be observed once NB4 cells were
activated with fMLP, but this was not statistically significant (Figure 5-4b). The influence
of Y-27632 on the other hand had only a significant influence on 3T3 fibroblasts (Figure
5-5b) and embryonic stem cells, but not on undifferentiated neutrophils. In both
significant cases it reduced the compliance of the cells and resulted in deformation curves
very similar to results obtained under the influence of blebbistatin. Phorbol 12,13-
dibutyrate only affected significantly 3T3 fibroblast and increased their compliance
(Figure 5-5c). It has to be additionally mentioned that the total amount of the compliance
scale does differ with different experimental set-ups. Otherwise, the shape of the
compliance curves did not change drastically except in the case of 3T3 fibroblasts after
treatment with blebbistatin and Y-27632. These treatments resulted in more visco-elastic
deformation curves compared to the nearly purely viscous behaviour in the control group.
156
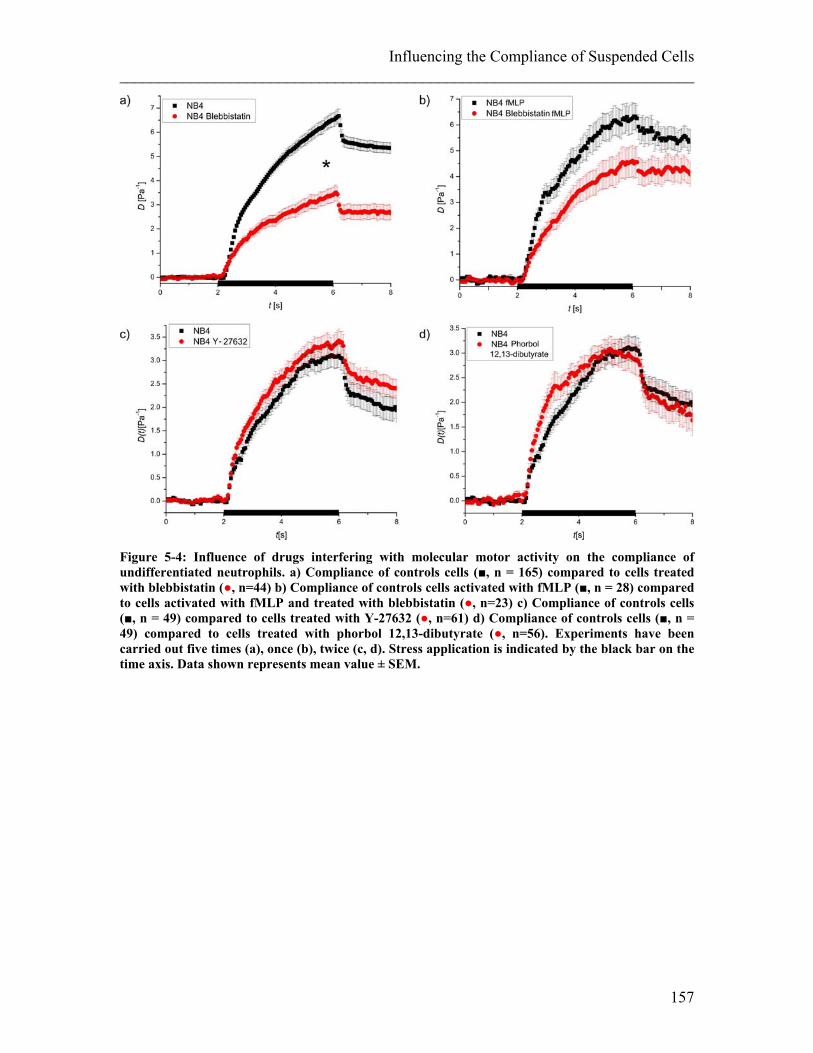
Influencing the Compliance of Suspended Cells ________________________________________________________________________
Figure 5-4: Influence of drugs interfering with molecular motor activity on the compliance of undifferentiated neutrophils. a) Compliance of controls cells (■, n = 165) compared to cells treated with blebbistatin (●, n=44) b) Compliance of controls cells activated with fMLP (■, n = 28) compared to cells activated with fMLP and treated with blebbistatin (●, n=23) c) Compliance of controls cells (■, n = 49) compared to cells treated with Y-27632 (●, n=61) d) Compliance of controls cells (■, n = 49) compared to cells treated with phorbol 12,13-dibutyrate (●, n=56). Experiments have been carried out five times (a), once (b), twice (c, d). Stress application is indicated by the black bar on the time axis. Data shown represents mean value ± SEM.
157
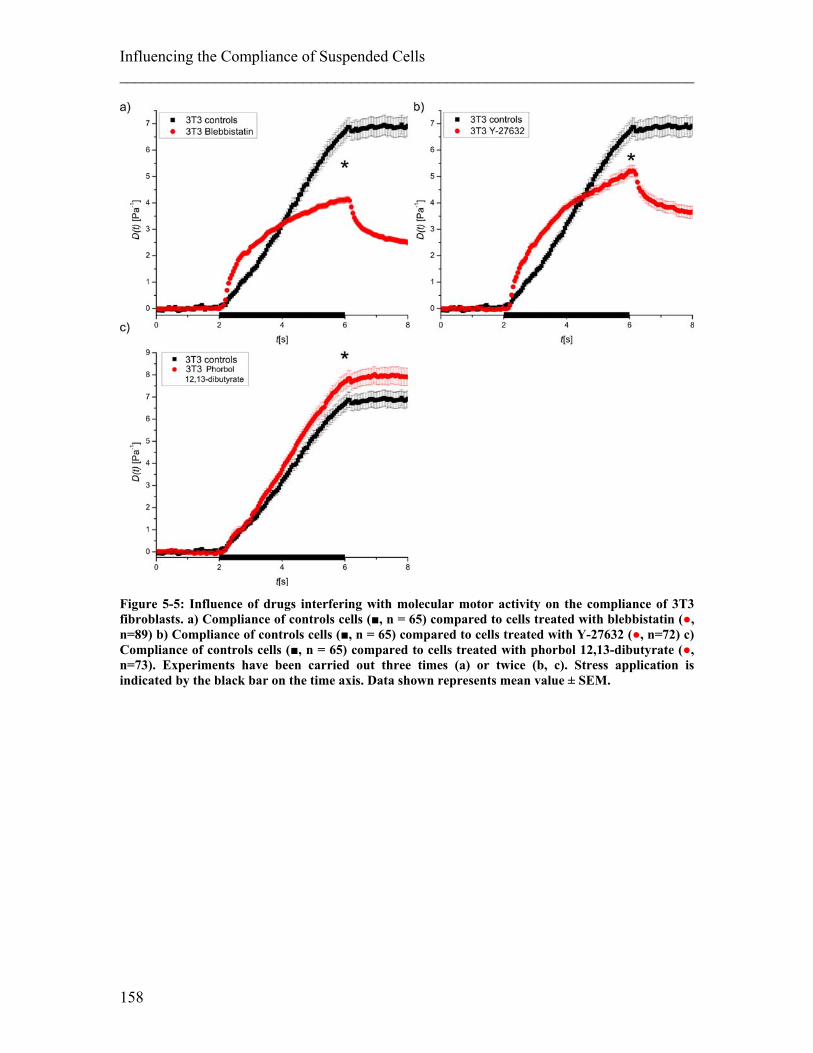
Influencing the Compliance of Suspended Cells ________________________________________________________________________
Figure 5-5: Influence of drugs interfering with molecular motor activity on the compliance of 3T3 fibroblasts. a) Compliance of controls cells (■, n = 65) compared to cells treated with blebbistatin (●, n=89) b) Compliance of controls cells (■, n = 65) compared to cells treated with Y-27632 (●, n=72) c) Compliance of controls cells (■, n = 65) compared to cells treated with phorbol 12,13-dibutyrate (●, n=73). Experiments have been carried out three times (a) or twice (b, c). Stress application is indicated by the black bar on the time axis. Data shown represents mean value ± SEM.
158
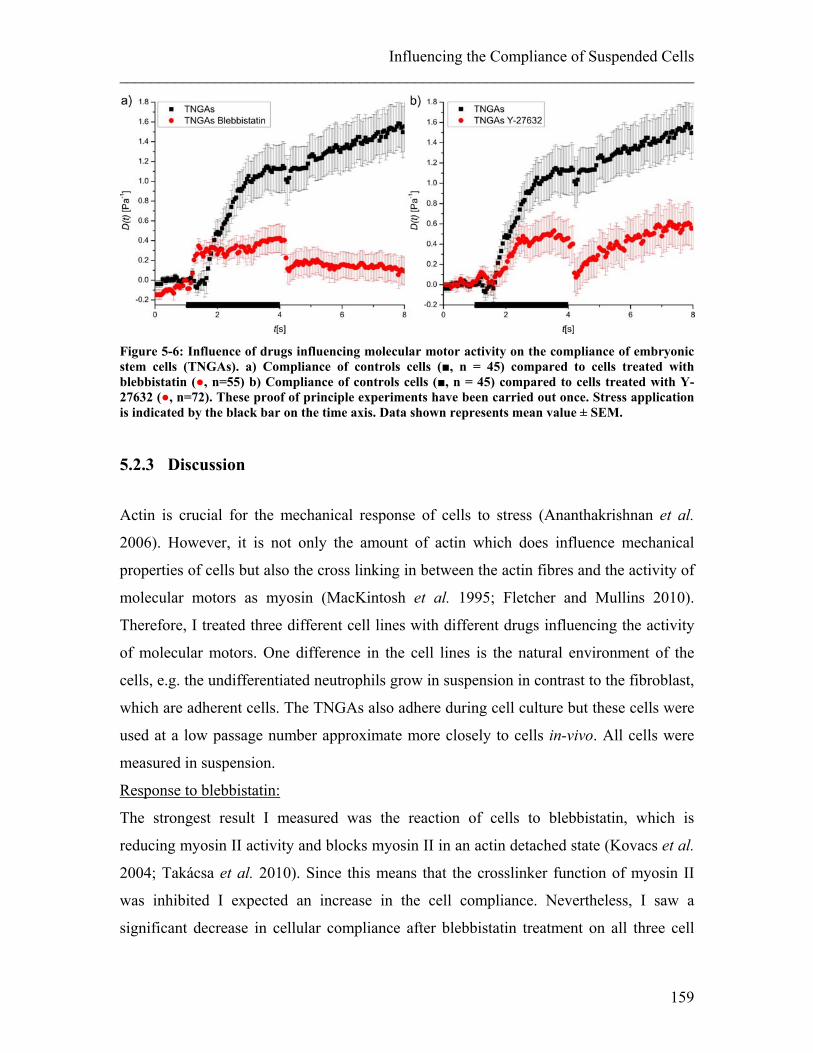
Influencing the Compliance of Suspended Cells ________________________________________________________________________
Figure 5-6: Influence of drugs influencing molecular motor activity on the compliance of embryonic stem cells (TNGAs). a) Compliance of controls cells (■, n = 45) compared to cells treated with blebbistatin (●, n=55) b) Compliance of controls cells (■, n = 45) compared to cells treated with Y-27632 (●, n=72). These proof of principle experiments have been carried out once. Stress application is indicated by the black bar on the time axis. Data shown represents mean value ± SEM.
5.2.3 Discussion
Actin is crucial for the mechanical response of cells to stress (Ananthakrishnan et al.
2006). However, it is not only the amount of actin which does influence mechanical
properties of cells but also the cross linking in between the actin fibres and the activity of
molecular motors as myosin (MacKintosh et al. 1995; Fletcher and Mullins 2010).
Therefore, I treated three different cell lines with different drugs influencing the activity
of molecular motors. One difference in the cell lines is the natural environment of the
cells, e.g. the undifferentiated neutrophils grow in suspension in contrast to the fibroblast,
which are adherent cells. The TNGAs also adhere during cell culture but these cells were
used at a low passage number approximate more closely to cells in-vivo. All cells were
measured in suspension.
Response to blebbistatin:
The strongest result I measured was the reaction of cells to blebbistatin, which is
reducing myosin II activity and blocks myosin II in an actin detached state (Kovacs et al.
2004; Takácsa et al. 2010). Since this means that the crosslinker function of myosin II
was inhibited I expected an increase in the cell compliance. Nevertheless, I saw a
significant decrease in cellular compliance after blebbistatin treatment on all three cell
159
Influencing the Compliance of Suspended Cells ________________________________________________________________________ types. This stands in clear contrast to my expectations and results in literature, where
adherent cells treated with blebbistatin and measured by AFM got significantly softer
(Martens and Radmacher 2008). Nevertheless, Martens and Radmacher attribute this
result to the pre-tension of cells which occurs when myosin II is pulling on actin stress
fibres. Reducing the activity of myosin therefore decreases this pre-tension and the cells
become softer. However, in the group of Guillaume Charras, no effect has been seen on
the stiffness of adherent cells after blebbistatin treatment when measured by AFM
(Charras 2011).
In the results presented in this work, all cell types are less compliant after blebbistatin
treatment. Since optical stretcher measurements are carried out while cells are in
suspension, no focal adhesions and therefore no stress fibres are present during
measurements. It is therefore understandable that, as these cells cannot loose pre-tension
when treated with blebbistatin they do not get softer. Nevertheless, it does not yet explain
why the cells were less compliant after blebbistatin treatment. One possible explanation
might be to consider myosin II as a gliding gel which helps to move filaments along each
other. The more working active myosin is, the more filaments can move, and therefore
the more compliant and fluid a cell becomes. Such a mechanism has been shown in
purified actin gels mixed with inactive myosin (Humphrey et al. 2002). As long as the
myosin was inactive, the actin gel did not flow out of an angled cuvette, but as soon as
the myosin got activated by ATP addition, the actin gel got fluidized and could flow out.
This result is similar to actin gliding assays where the speed of single actin filaments
in-vitro is monitored. This speed decreased significantly after the addition of blebbistatin
(Medeiros et al. 2006). These experiments offer an explanation as to why all cell types
got less compliant and less viscous once treated with blebbistatin.
In the work of Medeiros et al. an additional observation was made on actin filaments
associated with filipodia in neuronal growth cones. These actin bundles became longer
and thicker after the addition of blebbistatin which could be shown to be due to a
decreased rate in actin bundle severing (Medeiros et al. 2006). If similar processes would
be happening in cells in suspension, this would also explain stiffening and an increase in
the elasticity of the whole cell.
160
Influencing the Compliance of Suspended Cells ________________________________________________________________________
Finally a study on the reaction of cell nuclei to blebbistatin should be mentioned.
Mazumder et al. measured the nuclear size of mouse embryonic fibroblasts and saw a
size decrease after blebbistatin treatment, which is attributed to myosin pulling on the
surface of the nucleus and setting it under a pretension that enlarges the nucleus size
(Mazumder and Shivashankar 2010). I do not yet know the exact role that nuclei play in
OS deformation experiments, but I would generally link a smaller cell nucleus to a lower
compliance. However, since in Mazumder’s experiments with mouse embryonic
fibroblasts there is a decrease in nuclear size, one might expect the content of the nucleus
to increase in density and related to this also to increase in stiffness. A stiffer nucleus
could then be the reason for increased overall compliance of cells after blebbistatin
addition as I have seen it in my OS experiments. However, this is just a speculation, but
further experiments on the influence of the nucleus could give deeper insights concerning
this hypothesis.
The most important aspect of my measurements is the opposing result to what was
observed in cells treated with blebbistatin before (Martens and Radmacher 2008). These
measurements were done using AFM on cells adhering to plastic tissue culture dishes. In
living tissue, there is generally not such stiff material as plastic or glass which cells
adhere to. Nonetheless, the other extreme – cells being truly in suspension, as they were
in my experiments – is neither the normal case, only special cell types as non activated
blood cells do not have any adhesion points. For most cell types, the environment lays in
the middle of these two extremes. They grow in soft, three dimensional environments,
which results in less focal adhesion points and therefore in fewer and thinner stress fibres
than on hard substrates. This needs to be considered when extrapolating cell mechanical
measurements from measurements on rigid 2D surfaces to the situation in-vivo. It would
be interesting to see what effect myosin II has on cells in their natural, 3D environment,
which is hard to approach experimentally. Measurements of entirely suspended cells were
relevant in this context because they allow the study of exactly the other extreme, with no
contacts at all, but at least in an isotropic environment.
To investigate if neutrophil activation influences their response to blebbistatin I activated
NB4 cells with fMLP and repeated the experiment. Activated NB4 cells still showed the
same trend than non-activated NB4 cells which illustrates that an increase in compliance
161
Influencing the Compliance of Suspended Cells ________________________________________________________________________ due to blebbistatin treatment in suspended cells seems to be a general effect and does not
depend on a specific activation state of neutrophils. I expect the non significance of the
data to be due to the low cell numbers as I only did this experiment as a proof of principle
investigation.
Response to Y-27632 and phorbol 12,13-dibutyrate:
Interestingly, Y-27632, which has a similar effect of blocking myosin as blebbistatin,
does show similar effect on the 3T3 fibroblasts but not on the NB4 cells. This is not
really understandable, however, one possible explanation could be that the effect is just
stronger on 3T3 fibroblasts since they have random actin fibres forming after
trypsinization (Knowles and McCulloch 1992) and therefore more material to add to the
effect. Not finding a significant effect on the NB4 at all might not necessarily mean that
there is no effect but it might be too weak to be significant on the cell numbers I have
measured. This accounts in the same manner for the treatment with phorbol 12,13-
dibutyrate. This drug does enhance the activity of myosin II. According to my hypothesis
that the increase in myosin activity results in a higher sliding of actin filaments along
each other and therefore causes a higher compliance and a more fluid deformation curve I
would expect an opposite result of cells after phorbol 12,13-dibutyrate treatment
compared to blebbistatin treatment. And indeed, such an increase in compliance was seen
explicitly on the 3T3 fibroblast measurements, however, not on the NB4 cells. Similar
experiments have been carried out in a different group measuring the compliance of
endothelial cells after the application of phorbol 12,13-dibutyrate using magnetic twisting
cytometry (Moy et al. 2004). However, Moy et al. showed a stiffening after drug
application. The explanation for this opposite result compared to my data is the same than
my controversial result concerning blebbistatin: Moy et al. measured cells while they
were adherent on a stiff culturing substrate which favours stress fibres. By increasing the
activity of myosin II the pretension within the cell by myosin II pulling on these stress
fibres will also increase which than results in a stiffening of the whole cell body.
Differences on the total deformation within different experiments have been discussed
extensively in the previous section 5.1.3 and apply to this section in the same manner.
162
Influencing the Compliance of Suspended Cells ________________________________________________________________________
After I confirmed that actin does play a large role in the compliance of suspended cells in
the previous section 5.1, I was now able to go further and think about actin not only as
one sort of polymer but to consider additional factors, specifically molecular motors as
myosin II. It turned out that differences in compliance when enhancing or increasing
myosin II are not the same on cells when they are attached or in suspension, which I
mainly attribute to the presence of actin stress fibres in attached cells compared to cells in
suspension. Even though adherence to hard substrates is as unnatural as being in total
suspension for most cell types, one need to know these extremes and consider
measurements according to the cell type to make sure one minimize and at least
recognize measurement artefacts.
163
Influencing the Compliance of Suspended Cells ________________________________________________________________________
5.3 Summary Influencing the Compliance of Suspended Cells
I previously investigated links between the function of cells and their compliance. Even
though the diversity of function is large and I was only able to look at some of them, it
became obvious that such links exist. Understanding them can help to intervene when
cells are not able to carry out their function anymore due to pathological changes or to
influence actively cellular functions for a specific goal. Nonetheless, it is not enough to
just establish links, but one needs to understand also how the compliance is modified in
order to be able to interfere. Therefore, I wanted to investigate the influence of the
cytoskeleton for cell compliance. The cytoskeleton is a complex structure which is – so
far, not yet understood as a whole. Therefore, I started by investigating the components
of the cytoskeleton, mainly actin and MTs. I generally chose two different cell types for
this work to study the differences of the cytoskeleton on cells. One cell type is generally
adherent cells (fibroblasts), and a second cells type are cells which grow in suspension
(blood cells). Even though fibroblasts do adhere on substrate I lifted them off for the
creep compliance measurements I carried out using optical stretching. I found a generally
higher change when I either increased or decreased the influence of actin than of MTs.
Therefore, I investigated actin further. Instead of just looking at actin as one component
of the cytoskeleton, I also studied surrounding factors as molecular motors. I increased or
decreased the activity of myosin II and found strikingly different results than those
previously reported in literature. During my measurements in suspension, cells became
less compliant and more solid when the activity of myosin was reduced, which is the
opposite of what has been seen on adherent cells. The differences between my
experiments and experiments done by other groups might be due to differences in
attachment and the presence of stress fibres in adherent cells, which are missing in cells
in suspension. Since stress fibres are stronger when cells are cultured on unnatural hard
substrates, this has to be taken into account during compliance measurements. My data
are at the other extreme of adherence to the data available on the influence of molecular
motors to the compliance of cells – namely no adherence at all since I measured cells in
suspension. Careful consideration has to be given for each experiment and each cell type
164
Influencing the Compliance of Suspended Cells ________________________________________________________________________
as to which kind of measurement is useful and where artefacts may occur due to
culturing. Showing which components of the cytoskeleton do play a role in the
compliance and how one is able to influence it might be useful in further studies to
understand how cells achieve changes in mechanical properties in order to fulfil a
specific cellular function. This information might also be used to actively change cellular
mechanics in order to interfere with healthy or pathological cellular behaviour.
165

Influencing the Compliance of Suspended Cells ________________________________________________________________________
166
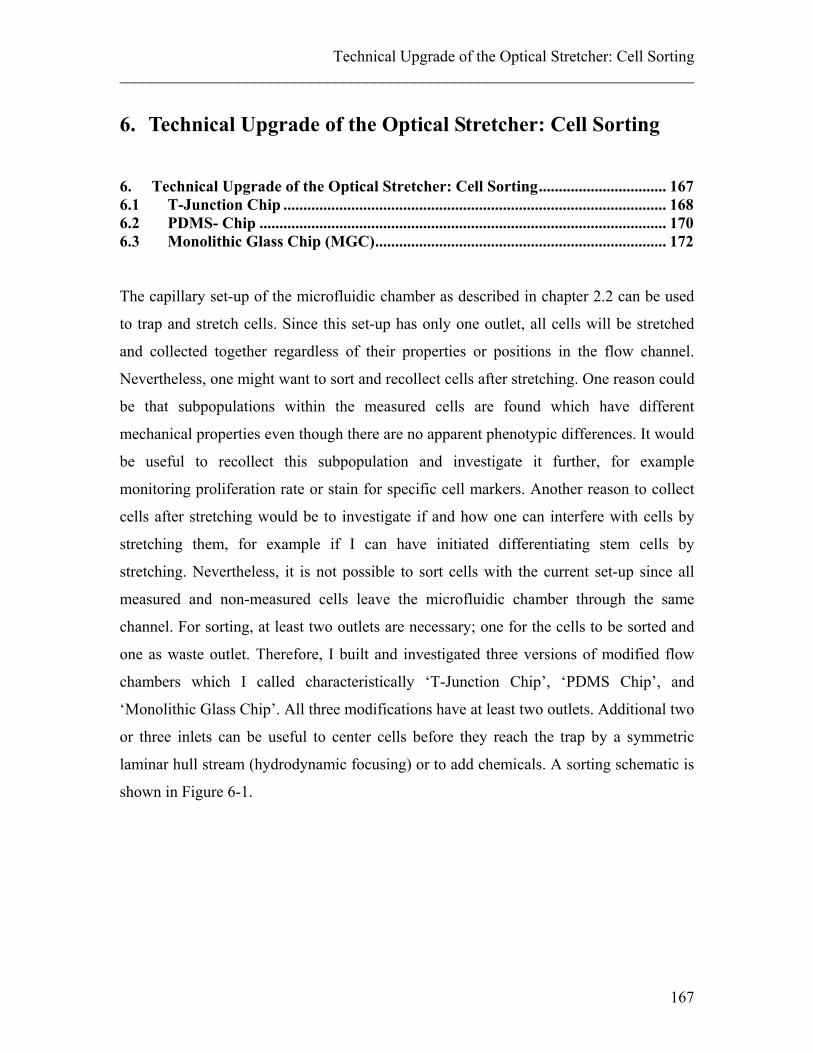
Technical Upgrade of the Optical Stretcher: Cell Sorting ________________________________________________________________________
6. Technical Upgrade of the Optical Stretcher: Cell Sorting 6. Technical Upgrade of the Optical Stretcher: Cell Sorting ................................ 167 6.1 T-Junction Chip ................................................................................................ 168 6.2 PDMS- Chip ...................................................................................................... 170 6.3 Monolithic Glass Chip (MGC) ......................................................................... 172 The capillary set-up of the microfluidic chamber as described in chapter 2.2 can be used
to trap and stretch cells. Since this set-up has only one outlet, all cells will be stretched
and collected together regardless of their properties or positions in the flow channel.
Nevertheless, one might want to sort and recollect cells after stretching. One reason could
be that subpopulations within the measured cells are found which have different
mechanical properties even though there are no apparent phenotypic differences. It would
be useful to recollect this subpopulation and investigate it further, for example
monitoring proliferation rate or stain for specific cell markers. Another reason to collect
cells after stretching would be to investigate if and how one can interfere with cells by
stretching them, for example if I can have initiated differentiating stem cells by
stretching. Nevertheless, it is not possible to sort cells with the current set-up since all
measured and non-measured cells leave the microfluidic chamber through the same
channel. For sorting, at least two outlets are necessary; one for the cells to be sorted and
one as waste outlet. Therefore, I built and investigated three versions of modified flow
chambers which I called characteristically ‘T-Junction Chip’, ‘PDMS Chip’, and
‘Monolithic Glass Chip’. All three modifications have at least two outlets. Additional two
or three inlets can be useful to center cells before they reach the trap by a symmetric
laminar hull stream (hydrodynamic focusing) or to add chemicals. A sorting schematic is
shown in Figure 6-1.
167
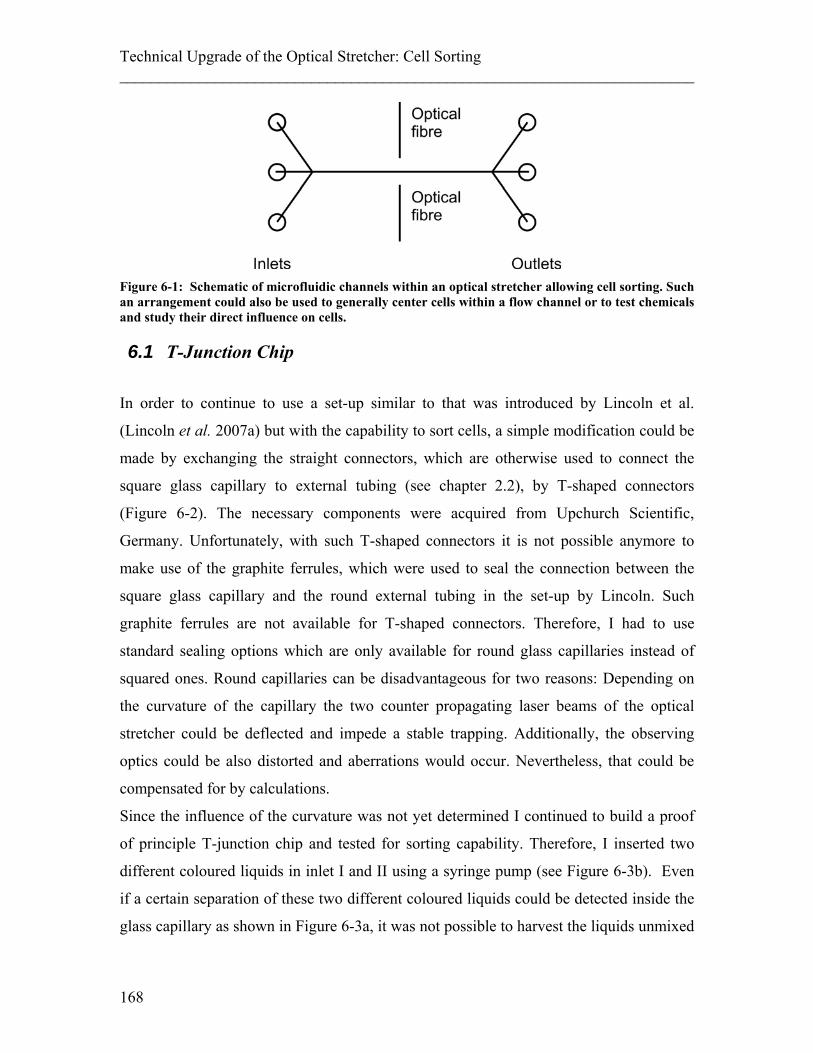
Technical Upgrade of the Optical Stretcher: Cell Sorting ________________________________________________________________________
Figure 6-1: Schematic of microfluidic channels within an optical stretcher allowing cell sorting. Such an arrangement could also be used to generally center cells within a flow channel or to test chemicals and study their direct influence on cells.
6.1 T-Junction Chip
In order to continue to use a set-up similar to that was introduced by Lincoln et al.
(Lincoln et al. 2007a) but with the capability to sort cells, a simple modification could be
made by exchanging the straight connectors, which are otherwise used to connect the
square glass capillary to external tubing (see chapter 2.2), by T-shaped connectors
(Figure 6-2). The necessary components were acquired from Upchurch Scientific,
Germany. Unfortunately, with such T-shaped connectors it is not possible anymore to
make use of the graphite ferrules, which were used to seal the connection between the
square glass capillary and the round external tubing in the set-up by Lincoln. Such
graphite ferrules are not available for T-shaped connectors. Therefore, I had to use
standard sealing options which are only available for round glass capillaries instead of
squared ones. Round capillaries can be disadvantageous for two reasons: Depending on
the curvature of the capillary the two counter propagating laser beams of the optical
stretcher could be deflected and impede a stable trapping. Additionally, the observing
optics could be also distorted and aberrations would occur. Nevertheless, that could be
compensated for by calculations.
Since the influence of the curvature was not yet determined I continued to build a proof
of principle T-junction chip and tested for sorting capability. Therefore, I inserted two
different coloured liquids in inlet I and II using a syringe pump (see Figure 6-3b). Even
if a certain separation of these two different coloured liquids could be detected inside the
glass capillary as shown in Figure 6-3a, it was not possible to harvest the liquids unmixed
168
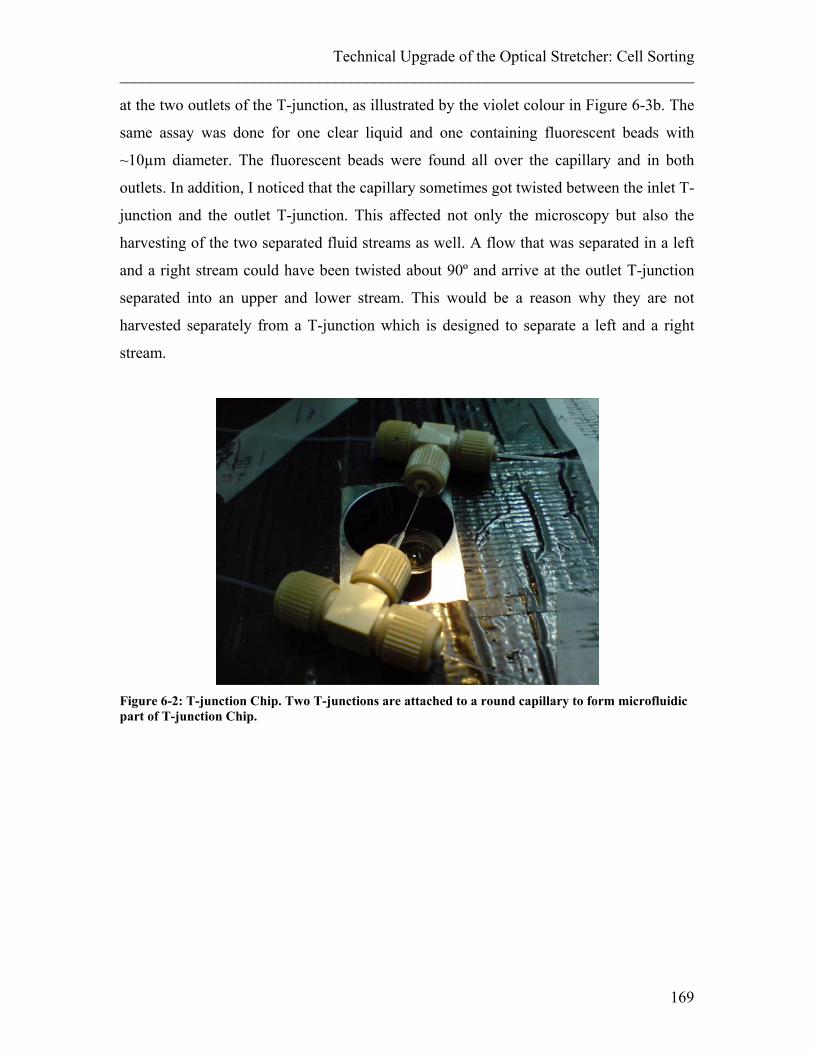
Technical Upgrade of the Optical Stretcher: Cell Sorting ________________________________________________________________________
at the two outlets of the T-junction, as illustrated by the violet colour in Figure 6-3b. The
same assay was done for one clear liquid and one containing fluorescent beads with
~10µm diameter. The fluorescent beads were found all over the capillary and in both
outlets. In addition, I noticed that the capillary sometimes got twisted between the inlet T-
junction and the outlet T-junction. This affected not only the microscopy but also the
harvesting of the two separated fluid streams as well. A flow that was separated in a left
and a right stream could have been twisted about 90º and arrive at the outlet T-junction
separated into an upper and lower stream. This would be a reason why they are not
harvested separately from a T-junction which is designed to separate a left and a right
stream.
Figure 6-2: T-junction Chip. Two T-junctions are attached to a round capillary to form microfluidic part of T-junction Chip.
169
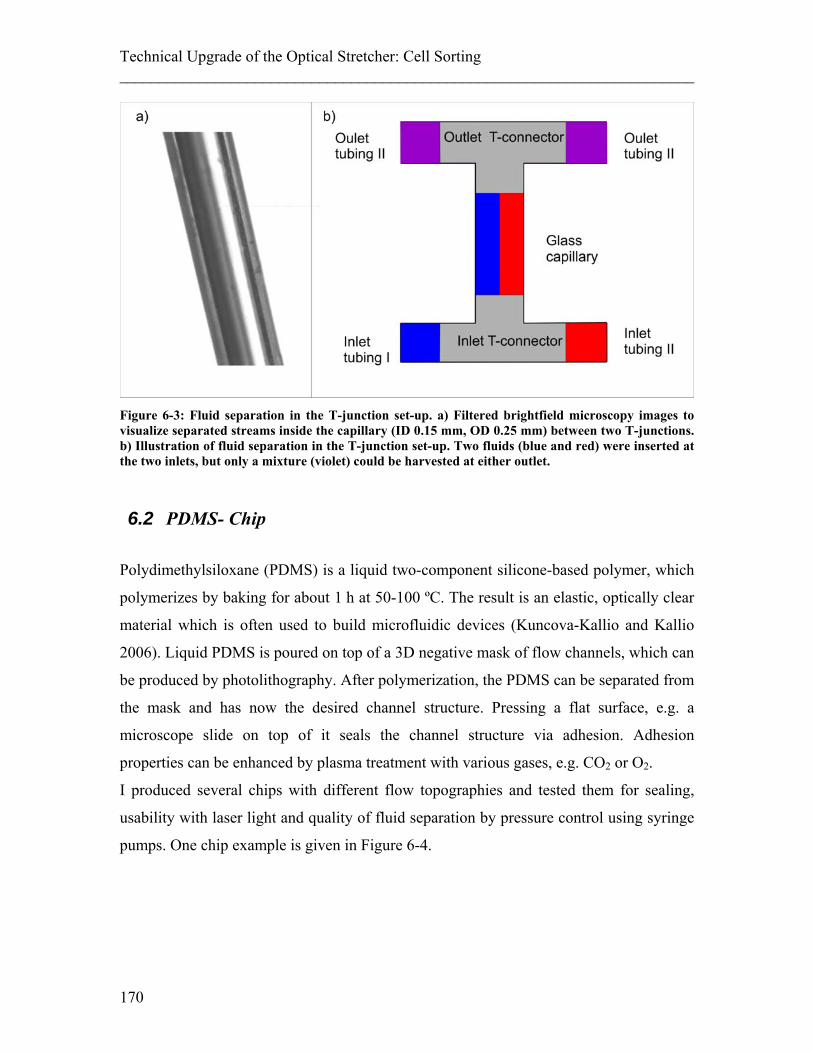
Technical Upgrade of the Optical Stretcher: Cell Sorting ________________________________________________________________________
Figure 6-3: Fluid separation in the T-junction set-up. a) Filtered brightfield microscopy images to visualize separated streams inside the capillary (ID 0.15 mm, OD 0.25 mm) between two T-junctions. b) Illustration of fluid separation in the T-junction set-up. Two fluids (blue and red) were inserted at the two inlets, but only a mixture (violet) could be harvested at either outlet.
6.2 PDMS- Chip
Polydimethylsiloxane (PDMS) is a liquid two-component silicone-based polymer, which
polymerizes by baking for about 1 h at 50-100 ºC. The result is an elastic, optically clear
material which is often used to build microfluidic devices (Kuncova-Kallio and Kallio
2006). Liquid PDMS is poured on top of a 3D negative mask of flow channels, which can
be produced by photolithography. After polymerization, the PDMS can be separated from
the mask and has now the desired channel structure. Pressing a flat surface, e.g. a
microscope slide on top of it seals the channel structure via adhesion. Adhesion
properties can be enhanced by plasma treatment with various gases, e.g. CO2 or O2.
I produced several chips with different flow topographies and tested them for sealing,
usability with laser light and quality of fluid separation by pressure control using syringe
pumps. One chip example is given in Figure 6-4.
170
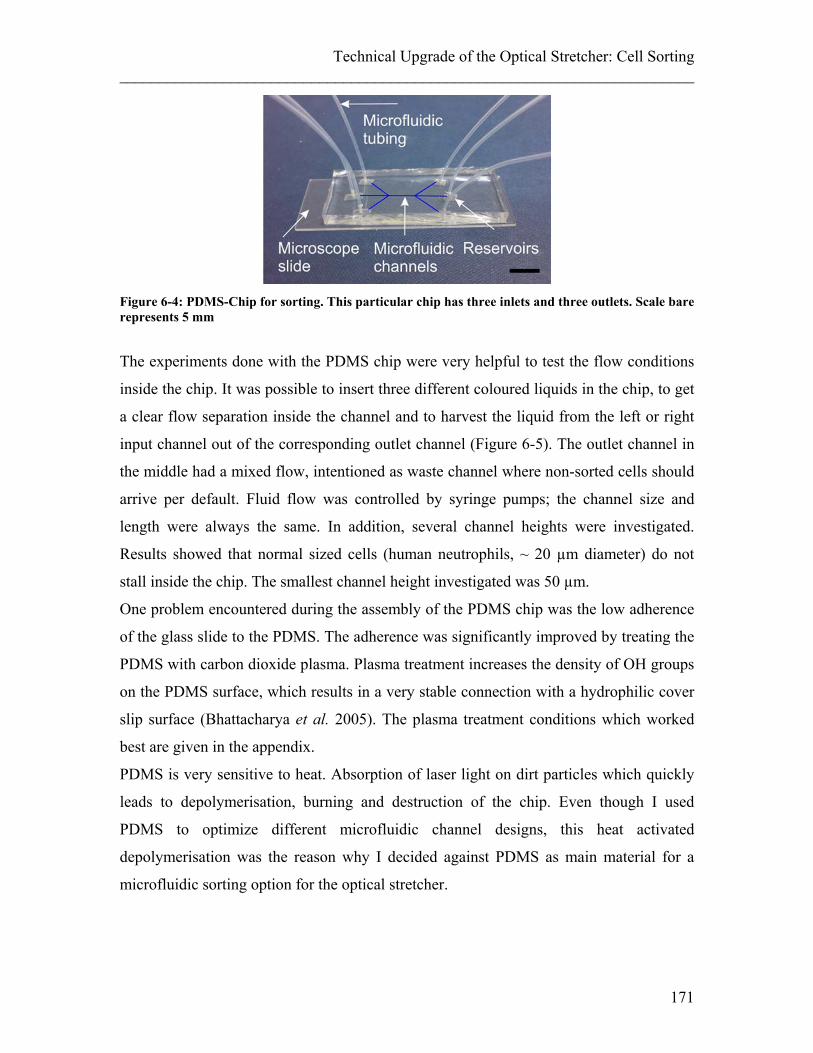
Technical Upgrade of the Optical Stretcher: Cell Sorting ________________________________________________________________________
Figure 6-4: PDMS-Chip for sorting. This particular chip has three inlets and three outlets. Scale bare represents 5 mm
The experiments done with the PDMS chip were very helpful to test the flow conditions
inside the chip. It was possible to insert three different coloured liquids in the chip, to get
a clear flow separation inside the channel and to harvest the liquid from the left or right
input channel out of the corresponding outlet channel (Figure 6-5). The outlet channel in
the middle had a mixed flow, intentioned as waste channel where non-sorted cells should
arrive per default. Fluid flow was controlled by syringe pumps; the channel size and
length were always the same. In addition, several channel heights were investigated.
Results showed that normal sized cells (human neutrophils, ~ 20 µm diameter) do not
stall inside the chip. The smallest channel height investigated was 50 µm.
One problem encountered during the assembly of the PDMS chip was the low adherence
of the glass slide to the PDMS. The adherence was significantly improved by treating the
PDMS with carbon dioxide plasma. Plasma treatment increases the density of OH groups
on the PDMS surface, which results in a very stable connection with a hydrophilic cover
slip surface (Bhattacharya et al. 2005). The plasma treatment conditions which worked
best are given in the appendix.
PDMS is very sensitive to heat. Absorption of laser light on dirt particles which quickly
leads to depolymerisation, burning and destruction of the chip. Even though I used
PDMS to optimize different microfluidic channel designs, this heat activated
depolymerisation was the reason why I decided against PDMS as main material for a
microfluidic sorting option for the optical stretcher.
171
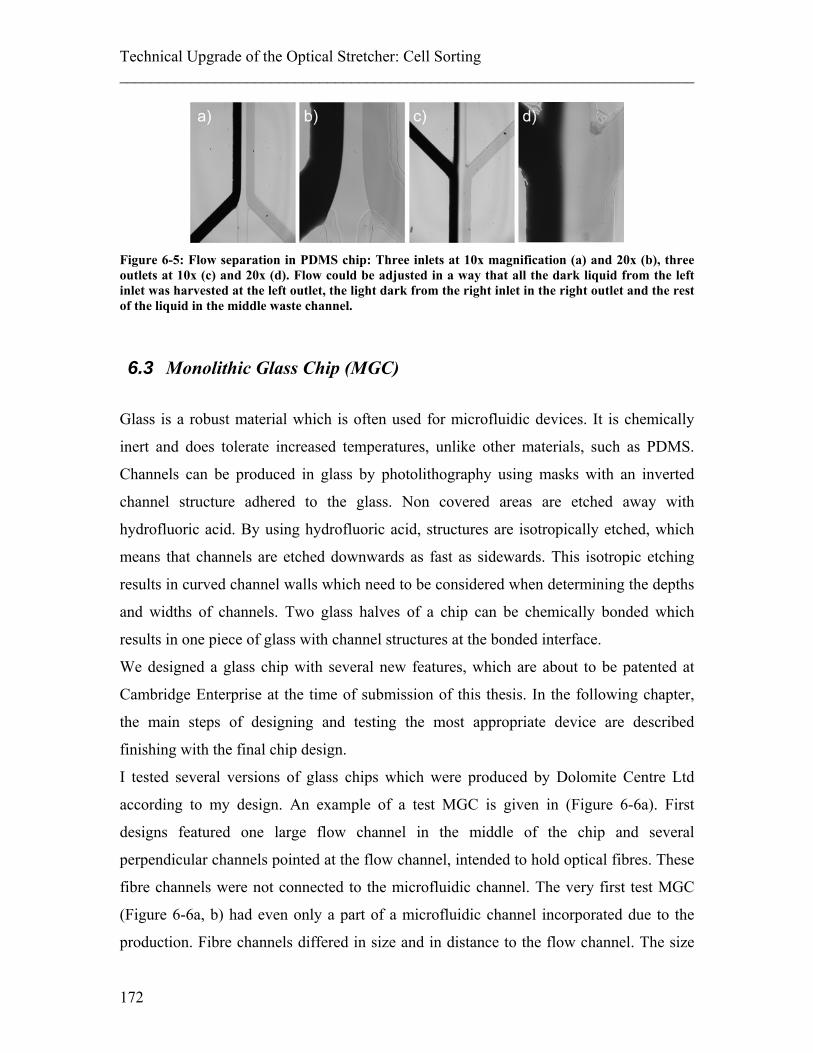
Technical Upgrade of the Optical Stretcher: Cell Sorting ________________________________________________________________________
Figure 6-5: Flow separation in PDMS chip: Three inlets at 10x magnification (a) and 20x (b), three outlets at 10x (c) and 20x (d). Flow could be adjusted in a way that all the dark liquid from the left inlet was harvested at the left outlet, the light dark from the right inlet in the right outlet and the rest of the liquid in the middle waste channel.
6.3 Monolithic Glass Chip (MGC)
Glass is a robust material which is often used for microfluidic devices. It is chemically
inert and does tolerate increased temperatures, unlike other materials, such as PDMS.
Channels can be produced in glass by photolithography using masks with an inverted
channel structure adhered to the glass. Non covered areas are etched away with
hydrofluoric acid. By using hydrofluoric acid, structures are isotropically etched, which
means that channels are etched downwards as fast as sidewards. This isotropic etching
results in curved channel walls which need to be considered when determining the depths
and widths of channels. Two glass halves of a chip can be chemically bonded which
results in one piece of glass with channel structures at the bonded interface.
We designed a glass chip with several new features, which are about to be patented at
Cambridge Enterprise at the time of submission of this thesis. In the following chapter,
the main steps of designing and testing the most appropriate device are described
finishing with the final chip design.
I tested several versions of glass chips which were produced by Dolomite Centre Ltd
according to my design. An example of a test MGC is given in (Figure 6-6a). First
designs featured one large flow channel in the middle of the chip and several
perpendicular channels pointed at the flow channel, intended to hold optical fibres. These
fibre channels were not connected to the microfluidic channel. The very first test MGC
(Figure 6-6a, b) had even only a part of a microfluidic channel incorporated due to the
production. Fibre channels differed in size and in distance to the flow channel. The size
172
Technical Upgrade of the Optical Stretcher: Cell Sorting ________________________________________________________________________
of the fibre channels mattered to find an optimum between the difficulty to insert fibers
into tight channels and the need of having the optical fibres aligned well enough to secure
stable trapping conditions. The distance between the end of the fibre channel and the
microfluidic flow channel determines the waist and the shape of the laser beam within the
trapping region and need to be optimizes as well. Using this first MGC I was able to test
fiber insertion. To insert an optical fibre with a diameter of 125 µm into a hole only
slightly (between 1 – 6 µm) larger than this dimension proofed to be nearly impossible
without fibre damage. As shown in Figure 6-7 several problems occurred, e.g. fibres
breaking when pushed in or pulled out of the channel, damaging the end of the optical
fibre during the insertion process or collecting substantial amounts of dirt inside the fibre
channel when pushing the fibre forwards. Some fibres also broke at the location of the
insertion hole which left no possibility to pull out the fibre piece which remained inside
the fibre channel.
173
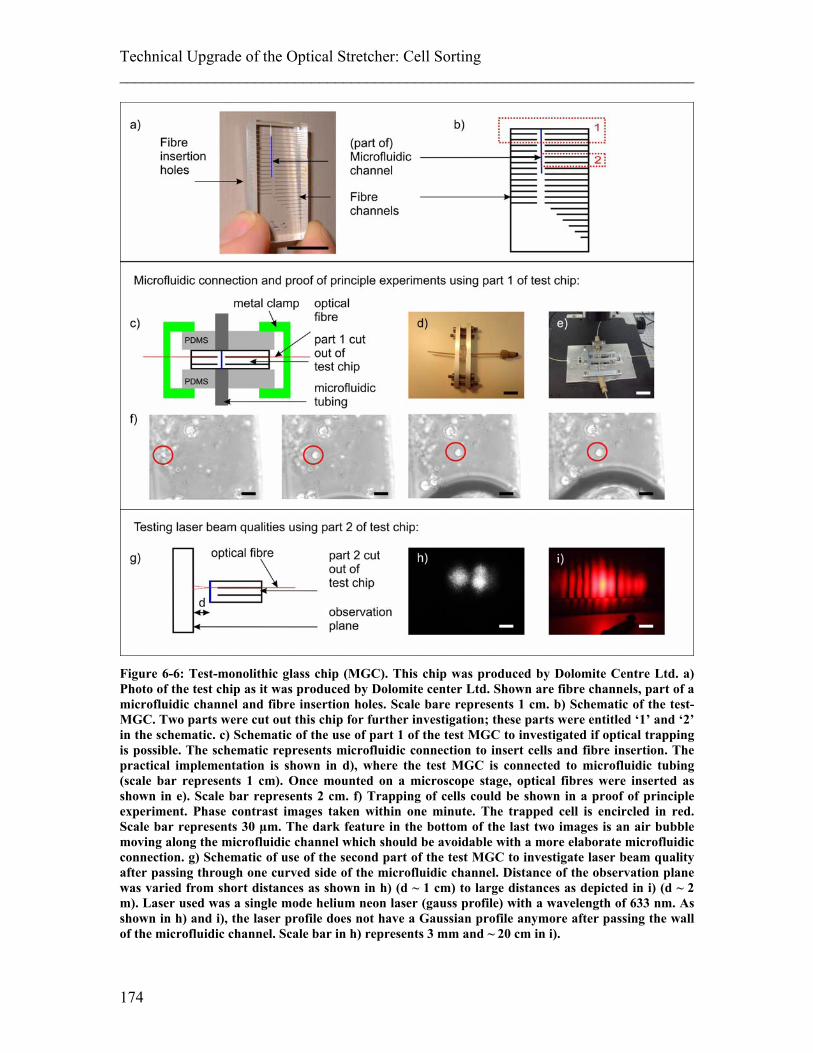
Technical Upgrade of the Optical Stretcher: Cell Sorting ________________________________________________________________________
Figure 6-6: Test-monolithic glass chip (MGC). This chip was produced by Dolomite Centre Ltd. a) Photo of the test chip as it was produced by Dolomite center Ltd. Shown are fibre channels, part of a microfluidic channel and fibre insertion holes. Scale bare represents 1 cm. b) Schematic of the test-MGC. Two parts were cut out this chip for further investigation; these parts were entitled ‘1’ and ‘2’ in the schematic. c) Schematic of the use of part 1 of the test MGC to investigated if optical trapping is possible. The schematic represents microfluidic connection to insert cells and fibre insertion. The practical implementation is shown in d), where the test MGC is connected to microfluidic tubing (scale bar represents 1 cm). Once mounted on a microscope stage, optical fibres were inserted as shown in e). Scale bar represents 2 cm. f) Trapping of cells could be shown in a proof of principle experiment. Phase contrast images taken within one minute. The trapped cell is encircled in red. Scale bar represents 30 µm. The dark feature in the bottom of the last two images is an air bubble moving along the microfluidic channel which should be avoidable with a more elaborate microfluidic connection. g) Schematic of use of the second part of the test MGC to investigate laser beam quality after passing through one curved side of the microfluidic channel. Distance of the observation plane was varied from short distances as shown in h) (d ~ 1 cm) to large distances as depicted in i) (d ~ 2 m). Laser used was a single mode helium neon laser (gauss profile) with a wavelength of 633 nm. As shown in h) and i), the laser profile does not have a Gaussian profile anymore after passing the wall of the microfluidic channel. Scale bar in h) represents 3 mm and ~ 20 cm in i).
174
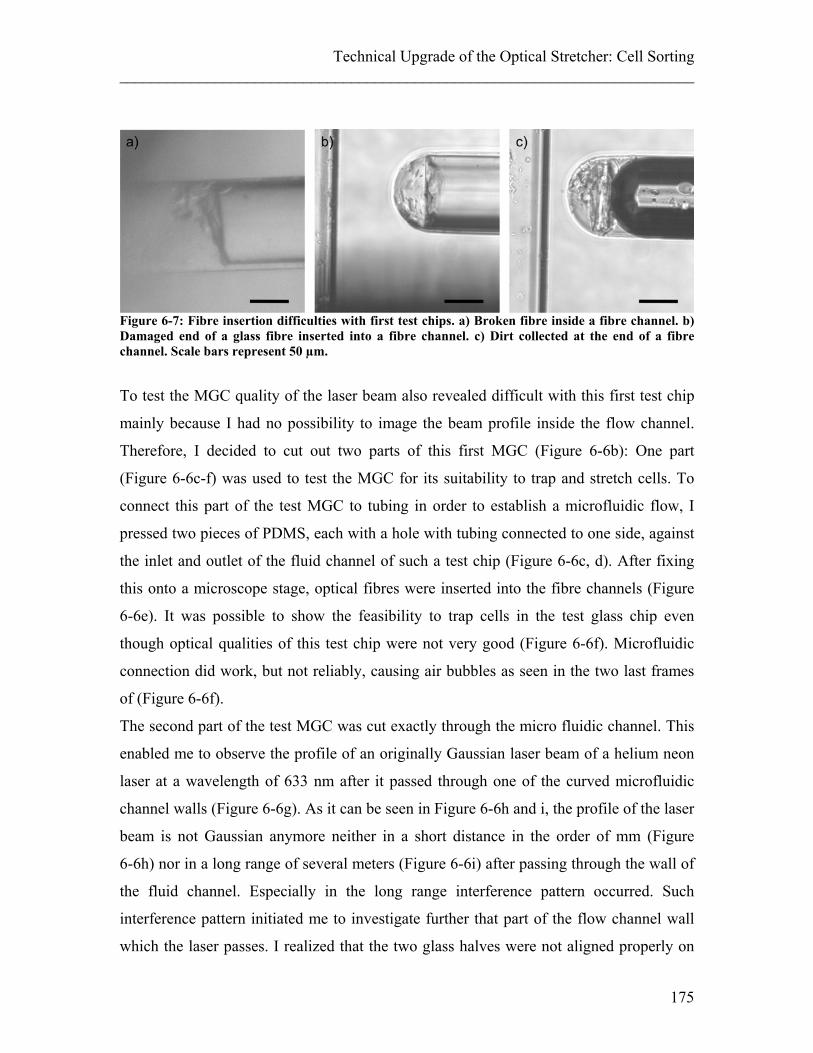
Technical Upgrade of the Optical Stretcher: Cell Sorting ________________________________________________________________________
Figure 6-7: Fibre insertion difficulties with first test chips. a) Broken fibre inside a fibre channel. b) Damaged end of a glass fibre inserted into a fibre channel. c) Dirt collected at the end of a fibre channel. Scale bars represent 50 µm.
To test the MGC quality of the laser beam also revealed difficult with this first test chip
mainly because I had no possibility to image the beam profile inside the flow channel.
Therefore, I decided to cut out two parts of this first MGC (Figure 6-6b): One part
(Figure 6-6c-f) was used to test the MGC for its suitability to trap and stretch cells. To
connect this part of the test MGC to tubing in order to establish a microfluidic flow, I
pressed two pieces of PDMS, each with a hole with tubing connected to one side, against
the inlet and outlet of the fluid channel of such a test chip (Figure 6-6c, d). After fixing
this onto a microscope stage, optical fibres were inserted into the fibre channels (Figure
6-6e). It was possible to show the feasibility to trap cells in the test glass chip even
though optical qualities of this test chip were not very good (Figure 6-6f). Microfluidic
connection did work, but not reliably, causing air bubbles as seen in the two last frames
of (Figure 6-6f).
The second part of the test MGC was cut exactly through the micro fluidic channel. This
enabled me to observe the profile of an originally Gaussian laser beam of a helium neon
laser at a wavelength of 633 nm after it passed through one of the curved microfluidic
channel walls (Figure 6-6g). As it can be seen in Figure 6-6h and i, the profile of the laser
beam is not Gaussian anymore neither in a short distance in the order of mm (Figure
6-6h) nor in a long range of several meters (Figure 6-6i) after passing through the wall of
the fluid channel. Especially in the long range interference pattern occurred. Such
interference pattern initiated me to investigate further that part of the flow channel wall
which the laser passes. I realized that the two glass halves were not aligned properly on
175
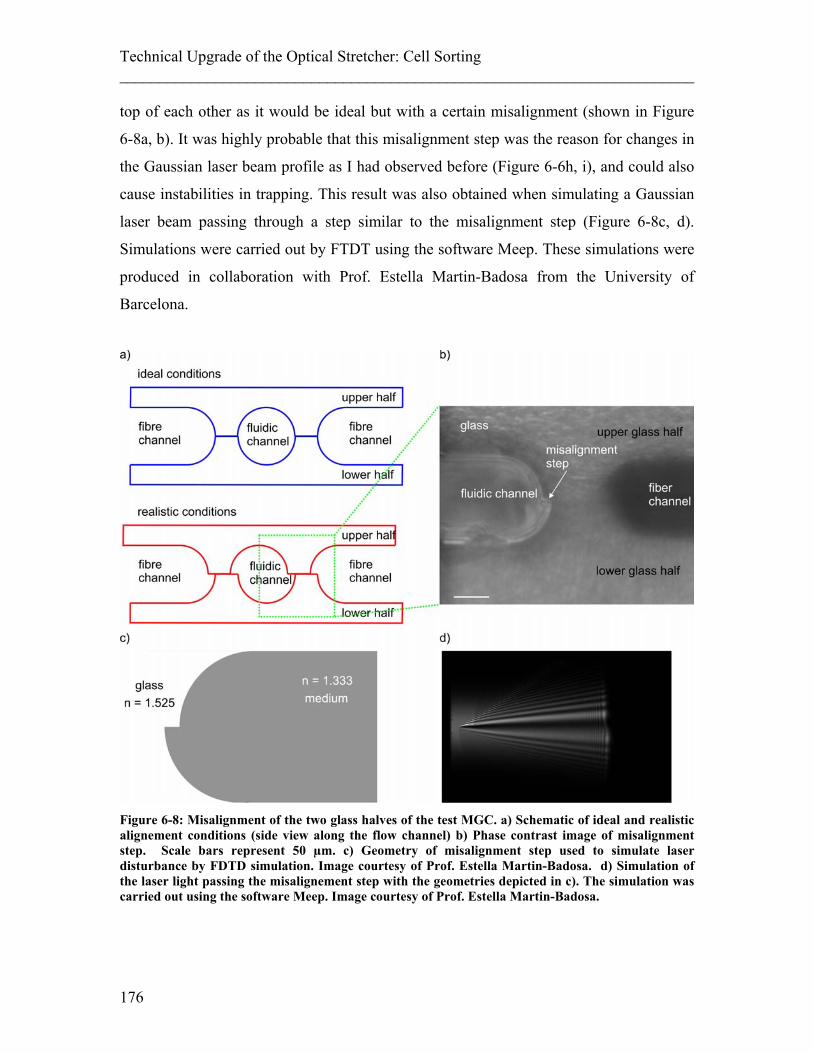
Technical Upgrade of the Optical Stretcher: Cell Sorting ________________________________________________________________________ top of each other as it would be ideal but with a certain misalignment (shown in Figure
6-8a, b). It was highly probable that this misalignment step was the reason for changes in
the Gaussian laser beam profile as I had observed before (Figure 6-6h, i), and could also
cause instabilities in trapping. This result was also obtained when simulating a Gaussian
laser beam passing through a step similar to the misalignment step (Figure 6-8c, d).
Simulations were carried out by FTDT using the software Meep. These simulations were
produced in collaboration with Prof. Estella Martin-Badosa from the University of
Barcelona.
Figure 6-8: Misalignment of the two glass halves of the test MGC. a) Schematic of ideal and realistic alignement conditions (side view along the flow channel) b) Phase contrast image of misalignment step. Scale bars represent 50 µm. c) Geometry of misalignment step used to simulate laser disturbance by FDTD simulation. Image courtesy of Prof. Estella Martin-Badosa. d) Simulation of the laser light passing the misalignement step with the geometries depicted in c). The simulation was carried out using the software Meep. Image courtesy of Prof. Estella Martin-Badosa.
176
Technical Upgrade of the Optical Stretcher: Cell Sorting ________________________________________________________________________
After the investigation of this first test MGC, several problems became obvious at this
stage:
1. Extreme difficulties to insert the fibres into the glass chip, resulting in parts of
broken fibre stuck in fibre channels and damaged fibre ends (Figure 6-7a, b).
2. Dirt at the end of the fibres, no possibility to clean (Figure 6-7c).
3. Misalignment of the two glass halves (Figure 6-8a), which is not avoidable due to
the production technique. This causes the fibre channels to be inaccurate in size
resulting in non-consistent trapping and distortion of the laser beam profile
(Figure 6-8c, d)
4. Difficulties to adjust microfluidic connectors.
To be able to use this MGC as microfluidic chamber for the optical stretcher, several
points had to be changed compared to the design of the test chips. The following points
were specifically considered for the design of the next MGC:
Special consideration went into:
1. Designing one glass half wider than the second one providing an uncomplicated
way to insert the optical fibres in the chip (Figure 6-9 and Figure 6-10).
2. The bonding step due to misalignment of the two glass halves cannot be avoided
due to the alignment uncertainty during the production. To assure that the laser
beam does not pass this step and therefore distort the Gaussian beam profile,
different channel heights for the upper and lower glass half were designed (see
Figure 6-9b, Tables with the exact values for each channel are given in the
appendix).
3. Diffraction patterns of the new design were simulated and confirmed (Figure
6-11). The slight deflection of the laser beam due to the curved surfaces of the
channel walls additionally prevents re-coupling of laser light into the opposite
fibre. This is of advantage since it re-coupled laser light can disturb the laser
stability.
177
Technical Upgrade of the Optical Stretcher: Cell Sorting ________________________________________________________________________
4. The fibre channels terminating in two additional channels running parallel to the
flow channel on either side, filled with index matching oil, was intended to
reduce light scattering from the fibre end or the fibre channel end surface.(Figure
6-9, exact channel values are given in Appendix).
5. All channel heights and fibre diameters were considered carefully to guarantee a
trap region that is actually inside the flow channel to assure stable trap and
stretch conditions. Channel sizes were adjusted appropriately to use standard
125 µm diameter fibres (see Figure 6-9, Appendix).
6. Etching only one part of the flow channel resulted in a flat glass interface at the
observing side of the flow channel. Grinding this glass side down to 250 µm
assured high quality microscopy (see Figure 6-9, Appendix).
7. Alignment of fibres inside the fibre channel was achieved by a three point-
alignment with one flat top to accommodate lateral misalignment of the two
halves (see Figure 6-9, Appendix).
8. 8-way microfluidic adaptors were designed similar to already existing 4-way
adaptors for easy connection with tubing material (Figure 6-10).
178
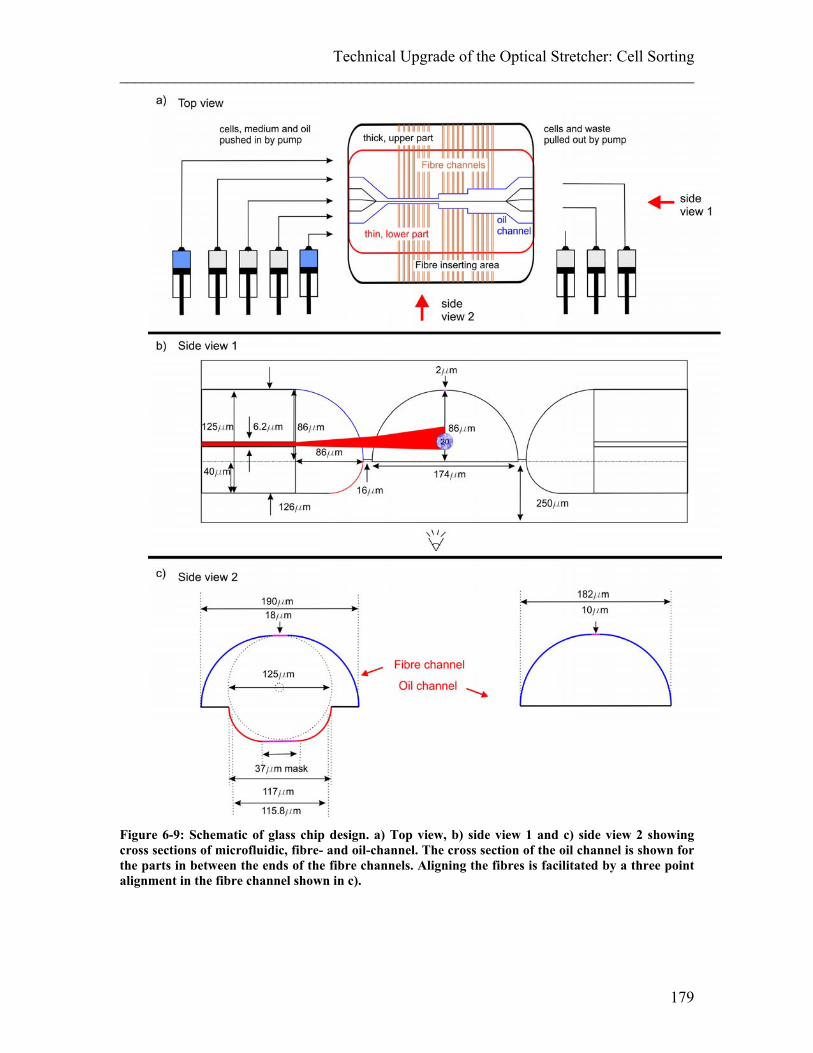
Technical Upgrade of the Optical Stretcher: Cell Sorting ________________________________________________________________________
Figure 6-9: Schematic of glass chip design. a) Top view, b) side view 1 and c) side view 2 showing cross sections of microfluidic, fibre- and oil-channel. The cross section of the oil channel is shown for the parts in between the ends of the fibre channels. Aligning the fibres is facilitated by a three point alignment in the fibre channel shown in c).
179
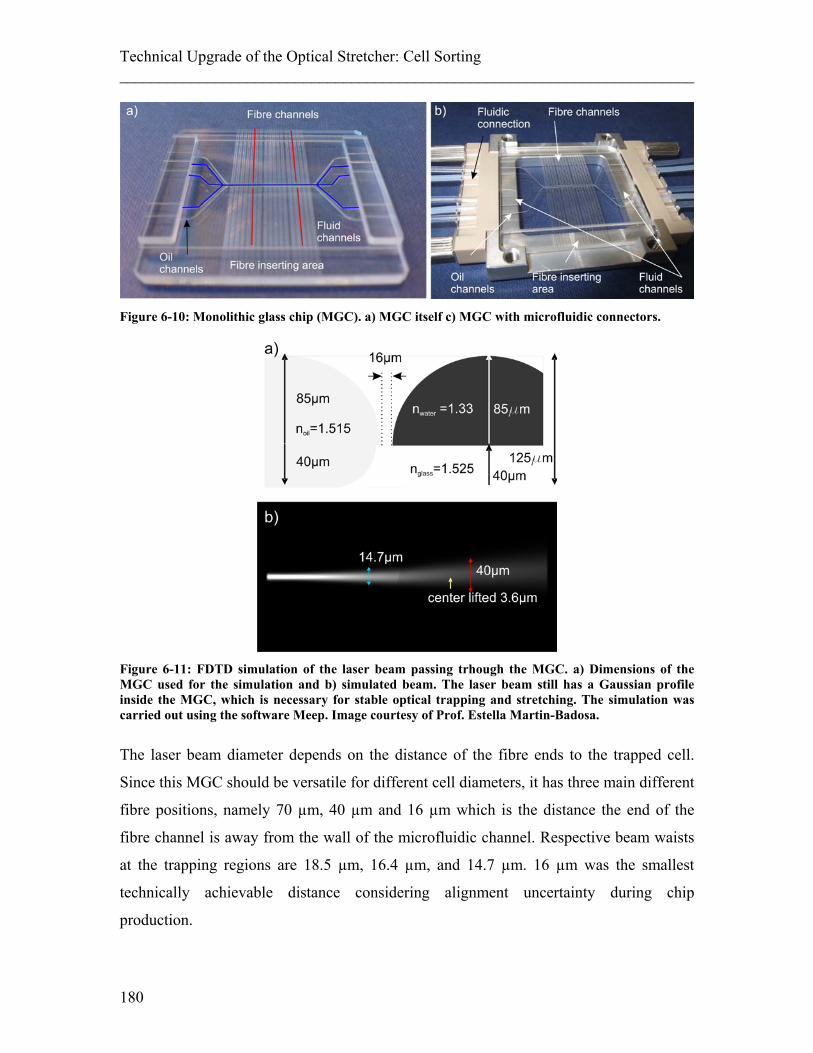
Technical Upgrade of the Optical Stretcher: Cell Sorting ________________________________________________________________________
Figure 6-10: Monolithic glass chip (MGC). a) MGC itself c) MGC with microfluidic connectors.
Figure 6-11: FDTD simulation of the laser beam passing trhough the MGC. a) Dimensions of the MGC used for the simulation and b) simulated beam. The laser beam still has a Gaussian profile inside the MGC, which is necessary for stable optical trapping and stretching. The simulation was carried out using the software Meep. Image courtesy of Prof. Estella Martin-Badosa.
The laser beam diameter depends on the distance of the fibre ends to the trapped cell.
Since this MGC should be versatile for different cell diameters, it has three main different
fibre positions, namely 70 µm, 40 µm and 16 µm which is the distance the end of the
fibre channel is away from the wall of the microfluidic channel. Respective beam waists
at the trapping regions are 18.5 µm, 16.4 µm, and 14.7 µm. 16 µm was the smallest
technically achievable distance considering alignment uncertainty during chip
production.
180
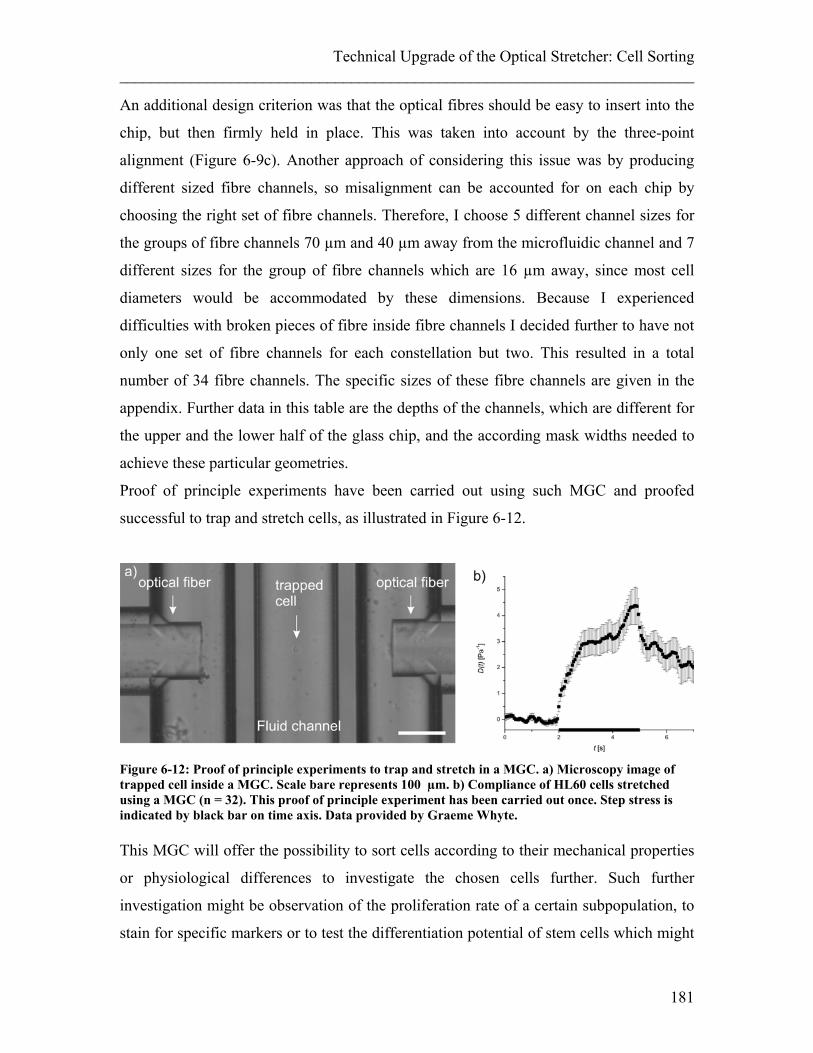
Technical Upgrade of the Optical Stretcher: Cell Sorting ________________________________________________________________________
An additional design criterion was that the optical fibres should be easy to insert into the
chip, but then firmly held in place. This was taken into account by the three-point
alignment (Figure 6-9c). Another approach of considering this issue was by producing
different sized fibre channels, so misalignment can be accounted for on each chip by
choosing the right set of fibre channels. Therefore, I choose 5 different channel sizes for
the groups of fibre channels 70 µm and 40 µm away from the microfluidic channel and 7
different sizes for the group of fibre channels which are 16 µm away, since most cell
diameters would be accommodated by these dimensions. Because I experienced
difficulties with broken pieces of fibre inside fibre channels I decided further to have not
only one set of fibre channels for each constellation but two. This resulted in a total
number of 34 fibre channels. The specific sizes of these fibre channels are given in the
appendix. Further data in this table are the depths of the channels, which are different for
the upper and the lower half of the glass chip, and the according mask widths needed to
achieve these particular geometries.
Proof of principle experiments have been carried out using such MGC and proofed
successful to trap and stretch cells, as illustrated in Figure 6-12.
Figure 6-12: Proof of principle experiments to trap and stretch in a MGC. a) Microscopy image of trapped cell inside a MGC. Scale bare represents 100 µm. b) Compliance of HL60 cells stretched using a MGC (n = 32). This proof of principle experiment has been carried out once. Step stress is indicated by black bar on time axis. Data provided by Graeme Whyte. This MGC will offer the possibility to sort cells according to their mechanical properties
or physiological differences to investigate the chosen cells further. Such further
investigation might be observation of the proliferation rate of a certain subpopulation, to
stain for specific markers or to test the differentiation potential of stem cells which might
181
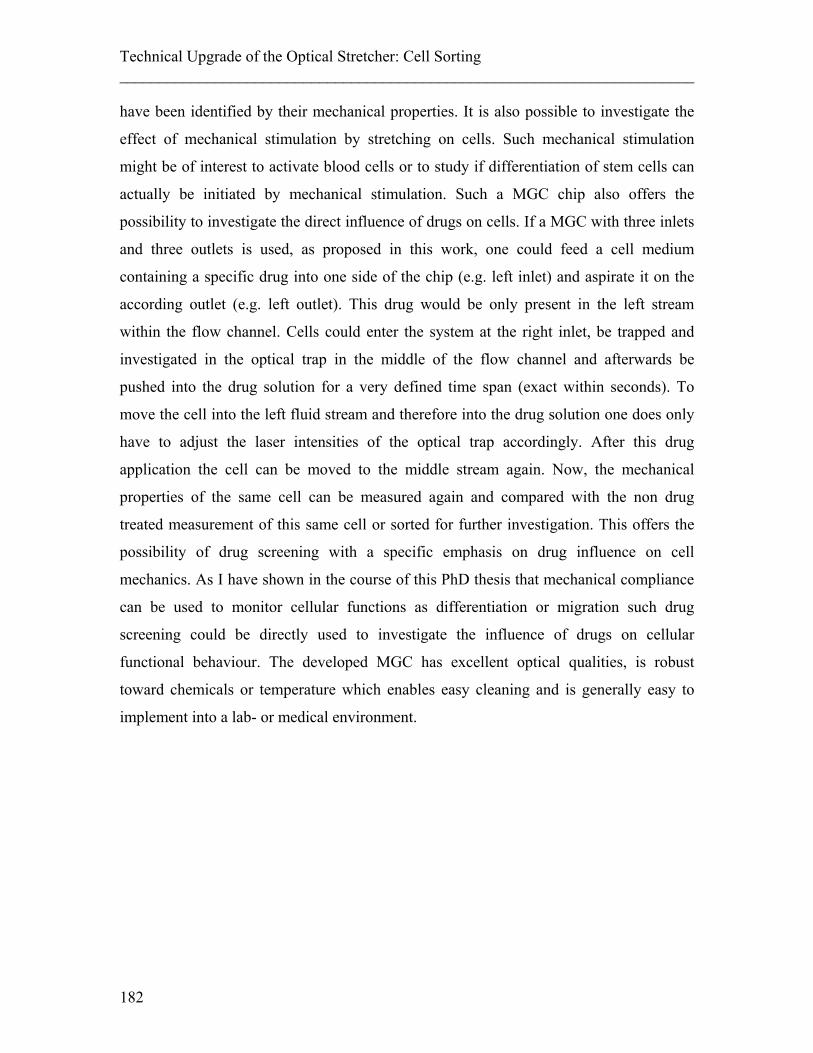
Technical Upgrade of the Optical Stretcher: Cell Sorting ________________________________________________________________________ have been identified by their mechanical properties. It is also possible to investigate the
effect of mechanical stimulation by stretching on cells. Such mechanical stimulation
might be of interest to activate blood cells or to study if differentiation of stem cells can
actually be initiated by mechanical stimulation. Such a MGC chip also offers the
possibility to investigate the direct influence of drugs on cells. If a MGC with three inlets
and three outlets is used, as proposed in this work, one could feed a cell medium
containing a specific drug into one side of the chip (e.g. left inlet) and aspirate it on the
according outlet (e.g. left outlet). This drug would be only present in the left stream
within the flow channel. Cells could enter the system at the right inlet, be trapped and
investigated in the optical trap in the middle of the flow channel and afterwards be
pushed into the drug solution for a very defined time span (exact within seconds). To
move the cell into the left fluid stream and therefore into the drug solution one does only
have to adjust the laser intensities of the optical trap accordingly. After this drug
application the cell can be moved to the middle stream again. Now, the mechanical
properties of the same cell can be measured again and compared with the non drug
treated measurement of this same cell or sorted for further investigation. This offers the
possibility of drug screening with a specific emphasis on drug influence on cell
mechanics. As I have shown in the course of this PhD thesis that mechanical compliance
can be used to monitor cellular functions as differentiation or migration such drug
screening could be directly used to investigate the influence of drugs on cellular
functional behaviour. The developed MGC has excellent optical qualities, is robust
toward chemicals or temperature which enables easy cleaning and is generally easy to
implement into a lab- or medical environment.
182
Summary and Conclusion ________________________________________________________________________
7. Summary and Conclusion
During my PhD I investigated the origin of cell compliance and its importance for
cellular function. I used an optical stretcher to measure the compliance of cells in
suspension without any physical attachment. I also used AFM measurements to compare
some of my data of suspended cells to data from adherent cells. In order to investigate
cellular migration behaviour I used standard tools such as porous membranes but also
developed new migration assays such as 3D micro-pores and 3D inverted colloid crystal
scaffolds.
Functional changes of cells have been shown to influence some aspects of mechanical
properties before, for example cancer cells being more compliant than normal cells. I was
interested in following the differentiation process of stem cells in terms of compliance.
Therefore, I monitored mechanical compliance of cells before and after they
differentiated using cells with distinct differentiation potential (chapter 3). The first
system was neutrophil progenitor cells with a low differentiation potential, which can
only differentiate into two different cell types. These cells showed an increased
compliance after ATRA differentiation (chapter 3.1). My finding is consistent with the
idea that this increased compliance is necessary for cells to migrate from the location of
the precursor cells (bone marrow) into the blood vessels, where mature neutrophils are
found (see also discussion further below).
I moved on to investigate multipotent cells with a higher differentiation potential and
chose mesenchymal stem cells (MSCs, chapter 3.2). In order to ensure consistent
measurements with the MSCs, they were measured over a period of constant surface
marker expression which is an established assay in stem cell research to define their stem
cell status. Nevertheless, my collaborators could show a decrease in differentiation
potential which correlated with decreased compliance measured with AFM over this
period measured on adherent MSCs. It is a surprising result that one can find differences
in mechanical properties in cells correlated with a changing differentiation potential
which cannot be detected with conventional surface markers.
However, measuring high numbers of MSCs over the same time period but in suspension
using an optical stretcher, no differences in compliance could be found (chapter 3.2). The
183
Summary and Conclusion ________________________________________________________________________ main distinction between both experiments is the adherence of MSCs to a substrate in the
case of AFM measurements compared to the cells being in suspension during optical
stretcher measurements. Adhering cells form focal adhesion points and stress fibres, two
effects which seem to cause the difference in compliance shown in AFM experiments. I
can conclude from my study that stress fibres clearly do not have an effect on the
compliance of mesenchymal stem cells. Cells are generally cultured on stiff substrates
and compliance measurements with several conventional methods are carried out on stiff
substrates, too. However, such stiff environment can affect cells; change their function,
form stress fibres and change their compliance. Measuring cells in suspension without
any physical attachment offers one extreme where no induced effects, which might be
due to attachment, are present. The compliance measured in suspension can only be
attributed to the inherent compliance of the cell.
The last cell system investigated in relation to differentiation was pluripotent mouse
embryonic stem (ES) cells (chapter 3.3). As well as having the highest differentiation
potential, ES cells are also the most difficult to culture and to controllably differentiate.
The method of embryoid body formation was chosen to differentiate the ES cells due to
most stable differentiation results compared with other differentiation methods.
Additionally, cells in embryoid bodies do not adhere to culturing substrates nor do they
grow individually in suspension, but they adhere to each other. Therefore, they form an
interesting intermediate state of attachment between the totally suspended neutrophil
progenitor cells and the attached MSCs. At a certain point in embryogenesis, ES cells
start migrating after an endothelial-mesodermal-transition during which they express
brachyury, a gene which was GFP labelled in the cell type I used. I planned to compare
the compliance of undifferentiated and differentiated ES cells expressing GFP and was
able to show a trend of increased compliance but could not show significance due to low
cell numbers. Such increased compliance would support my general hypothesis that
cellular compliance of suspended cells is connected to functional changes, in this case to
their migration behaviour. However, the differentiation of ES cells in embryoid bodies
does not yield large cell numbers. The change required in the optical stretcher set-up,
which would allow handling of only a small number of cells, was not available before the
end of my PhD so I could not decisively complete this project.
184
Summary and Conclusion ________________________________________________________________________
To summarize, I could show that it is possible to follow the differentiation of some cell
types purely in terms of their mechanical compliance. I further revealed differences in the
compliance of cells when measured in suspension or adherent to substrates. I found
significant differences during the differentiation of cells with low differentiation potential
but was not able to detect such significances during the differentiation of stem cells with
higher differentiation potential. This difference in significance could be due to an
increased complexity of cell culture, lower cell numbers, and difficulties with the
experimental design for cells with higher differentiation potential.
So far I was investigating mechanical compliance of stem cells during differentiation.
Since functional changes during differentiation can be varied and also very different
depending on cell types, I chose to investigate one cellular function in particular, which is
the migration behaviour of cells. Therefore, I tested if cells that change their compliance
during differentiation also alter their migration behaviour (chapter 4.1). As expected with
the change in compliance, differentiated neutrophils cells were able to migrate into pores
smaller than their diameter, which the undifferentiated precursor cells could not,
suggesting a link between compliance and migration. Since this migration behaviour
seems to be pathologically increased in differentiated leukaemia cells which also show an
increased compliance compared to normal neutrophils, I tried to interfere with the
migration behaviour by changing the compliance of these cells through application of the
MTs stabilizing drug paclitaxel. I was indeed able to alter the cellular mechanical
behaviour with drug application, which changed from significant relaxation behaviour
after stress application, to a complete lack of it. To further investigate the links between
compliance and function, I tested the influence of this mechanical change on the
migration behaviour of drug treated cells in several systems: Micro-porous chambers,
flat surfaces, micro-channels and three dimensional scaffolds. In addition to showing that
paclitaxel treated cells decreased their migration behaviour in all migration assays, I was
also able to discover the rate limiting step within this decreased migration, which proved
to be the process of the cells entering into the pores. Such insights might be useful in the
treatment of diseases connected to pathological migration behaviour, as respiratory
syndromes or cancer metathesis.
185
Summary and Conclusion ________________________________________________________________________ During the course of the migration studies it became apparent that it is not only the
mechanical properties of the cells which influence their migration behaviour but also the
properties of the surrounding environment. Therefore, I studied the effect of
dimensionality and stiffness of the substrate on the migration behaviour of cells (chapter
4.2). Although no differences in migration speed could be observed on various stiffnesses
in two dimensions, cells were migrating further on softer gels when placed in a three
dimensional environment. This raises interesting questions when relating two-
dimensional in-vitro migration data to the three-dimensional, physiological in-vivo
environments. Considering my data, I suggest choosing in-vitro migration assays which
are close to the physiological environment of cells in-vivo.
To investigate the origin of cellular mechanical compliance I stabilized and destabilized
components of the cytoskeleton or increased or decreased the activity of molecular
motors and measured the resulting change in the cell compliance (chapter 5). I found that
the effect of drugs on the compliance is generally stronger on actin compared to MTs,
suggesting actin playing a stronger role in defining the mechanical properties of the cells.
Surprisingly, the effects of these drugs were different between cells growing in
suspension compared to cells normally adhered to substrates, but measured also in
suspension (chapter 5.1). This difference became specifically noticeable when measuring
the influence of the activity of molecular motors (chapter 5.2). Whereas in the literature,
experiments have found an increase of compliance of adherent cells when myosin II
activity was inhibited, I saw consistently the opposite effect for suspended cells, which
was a decrease in cell compliance. While the cell softening in adherent cells after
inhibition of myosin II motors can be attributed to the reduction in tension on stress
fibres, I explained the decrease in compliance of suspended cells, which do not present
stress fibres, by a gel-sol transition of the actin network after the decrease in myosin II
activity. This assumption was supported by increasing myosin II activity, which resulted
in increased cellular compliance. These results are once more indicating how stress fibres
due to attachment might conceal mechanisms which are not related to cellular
attachment.
Since it is possible to identify certain cellular functions by the inherent, mechanical
properties of the cells, it is an advantage to sort these cells according to their compliance
186
Summary and Conclusion ________________________________________________________________________
to investigate them further. Cell sorting by compliance could complement sorting by
molecular surface markers but also has the potential to be used as an independent
functional marker. Advantages of choosing compliance over surface markers are the
inherence of mechanical compliance to the cell and the non-invasiveness of the method.
Such sorting also allows a screening of the effect of different drugs on cellular
compliance. Therefore, I investigated three different options for cell sorting, a glass
capillary with T-junction connectors (chapter 6.1), a microfluidic chip designed in a
polymeric elastomer (PDMS, chapter 6.2) and an etched monolithic glass chip (MGC,
chapter 6.3). The monolithic glass design generally proved to comply best with my
requirements. Therefore, I designed, tested and optimised this design and fluidic
connections of the MGC and performed a first proof-of-principle trapping, stretching and
sorting experiments with such an MGC. This improvement of optical stretcher design
will be useful for several future experiments where only low cell numbers are available,
for sorting and re-culturing of cells, as well as drug screening assays with respect to
cellular compliance.
Considering the data of my PhD I can confirm a link between cellular compliance and
cellular function, especially differentiation and migration. I was able to show that
migration can be altered by changing cellular compliance through modifications of the
cytoskeleton. Such modifications might lead to new treatment options in several diseases
connected to pathological migration behaviour. Building on my work, cellular
compliance should be tested for other cellular functions and might be used as a functional
marker. Such mechanical marker for cellular functions could find applications in stem
cell sorting and regenerative medicine, as well as testing for pathologies, for example in
respiratory diseases or cancer. The possibility of cell sorting according to cell compliance
combined with potential drug application at a high throughput level opens the door to
drug screening or viability studies. Investigating the origin of cellular compliance and the
influence of the components inside the cell, especially the cytoskeleton and the nucleus
will be the subject of further studies and help to understand how the cell uses cellular
mechanics to adapt to the requirements of living tissue.
187

Summary and Conclusion ________________________________________________________________________
188
Bibliography ________________________________________________________________________
8. Bibliography Aggarwal, K. and K. H. Lee (2003). "Functional genomics and proteomics as a
foundation for systems biology." Brief Funct Genomic Proteomic 2(3): 175-84. Akin, O. and R. D. Mullins (2008). "Capping Protein Increases the Rate of Actin-Based
Motility by Promoting Filament Nucleation by the Arp2/3 Complex." Cell 133(5): 841-851.
Alberts, B., A. Johnson, et al. (1994). Molecular Biology of the Cell. New York, Garland Publishing.
Alison, M. R., N. J. Guppy, et al. (2010). "Finding cancer stem cells: are aldehyde dehydrogenases fit for purpose?" J. Pathol. 222(4): 335-344.
Ananthakrishnan, R., J. Guck, et al. (2005). "Modelling the structural response of an eukaryotic cell in the optical stretcher." J Current Science 88(9): 1434-40.
Ananthakrishnan, R., J. Guck, et al. (2006). "Quantifying the contribution of actin networks to the elastic strength of fibroblasts." J Theor Biol 242(2): 502-516.
Anderson, S. I., N. A. Hotchin, et al. (2000). "Role of the cytoskeleton in rapid activation of CD11b/CD18 function and its subsequent downregulation in neutrophils." J. Cell Sci. 113(15): 2737-2745.
Arnold, S. J. and E. J. Robertson (2009). "Making a commitment: cell lineage allocation and axis patterning in the early mouse embryo." Nat Rev Mol Cell Biol 10(2): 91-103.
Ashkin, A. (1970). "Acceleration and trapping of particles by radiation pressure." Phys Rev Lett 24(4): 156-59.
Ashkin, A. (1971). "Optical levitation by radiation pressure." Appl Phys Lett 19: 283–85. Augello, A., T. B. Kurth, et al. (2010). "Mesenchymal Stem Cells: a Perspective from in
Vitro Cultures to in Vivo Migration and Niches." Eur. Cells Mater. 20: 121-133. Avvisati, G. and M. S. Tallman (2003). "All-trans retinoic acid in acute promyelocytic
leukaemia." Best Pract Res Clin Haematol 16(3): 419-432. Badley, R. A., A. Woods, et al. (1980). Cytoskeleton changes in fibroblast adhesion and
detachment. 43: 379-390. Bain, J., H. McLauchlan, et al. (2003). "The specificities of protein kinase inhibitors: an
update." Biochem. J. 371: 199-204. Banerjee, M. and R. Bhonde (2006). "Application of hanging drop technique for stem cell
differentiation and cytotoxicity studies." Cytotechnology 51(1): 1-5. Bareil, P. B., Y. L. Sheng, et al. (2006). "Local stress distribution on the surface of a
spherical cell in an optical stretcher." Optics Express 14(25): 12503-12509. Barer, R. J., S. (1954). "Refractometry of living cells, part I. Basic principles." Q. J.
Microsc. Sci. 95: 399-423. Barer, R. J., S. (1955a). "Refractometry of living cells, part II. The immersion medium."
Q. J. Microsc. Sci. 96: 1-26. Barer, R. J., S. (1955b). "Refractometry of living cells, part III. Technical and optical
methods." Q. J. Microsc. Sci. 96: 423–447. Barton, J. P. (2002). "Electromagnetic field calculations for an irregularly shaped, near-
spheroidal particle with arbitrary illumination." J. Opt. Soc. Am. A 19(12): 2429-2435.
189
Bibliography ________________________________________________________________________ Barzilay, R., E. Melamed, et al. (2009). "Introducing Transcription Factors to
Multipotent Mesenchymal Stem Cells: Making Transdifferentiation Possible." Stem Cells 27(10): 2509-2515.
Bausch, A. R., F. Ziemann, et al. (1998). "Local measurements of viscoelastic parameters of adherent cell surfaces by magnetic bead microrheometry." Biophys J 75(4): 2038-49.
Beil, M., D. Durschmied, et al. (2002). "Spatial distribution patterns of interphase centromeres during retinoic acid-induced differentiation of promyelocytic leukemia cells." Cytometry 47(4): 217-225.
Belyantseva, I. A., B. J. Perrin, et al. (2009). Beta-Actin is required for cytoskeletal maintenance but not development. 106: 9703-9708.
Birchmeier, W. (1984). "Cytoskeleton Structure and Function." Trends Biochem.Sci. 9(4): 192-195.
Bischofs, I. B. a. S. U. S. (2003). "Cell organization in soft media due to active mechanosensing." PNAS USA 100(16): 9274.
Blow, N. (2007). "Cell migration: our protruding knowledge." Nat Meth 4(7): 589-594. Blumberg, P. M., K. B. Delclos, et al. (1983). "Phorbol Ester receptors and the in vitro
effects of tumor promotors." Annals of the New York Academy of Sciences 407(1): 303-315.
Boeck, G. (2001). Current status of flow cytometry in cell and molecular biology. International Review of Cytology - a Survey of Cell Biology, Vol 204. San Diego, Academic Press Inc. 204: 239-298.
Bohley, C., J. Heuer, et al. (2005). "Optical properties of electrohydrodynamic convection patterns: rigorous and approximate methods." Journal of the Optical Society of America a-Optics Image Science and Vision 22(12): 2818-2826.
Bolte, S. and F. P. Cordelieres (2006). "A guided tour into subcellular colocalization analysis in light microscopy." Journal of Microscopy 224(3): 213-232.
Boyde, L., K. J. Chalut, et al. (2009). "Interaction of Gaussian beam with near-spherical particle: an analytic-numerical approach for assessing scattering and stresses." J. Opt. Soc. Am. A 26(8): 1814-1826.
Brangwynne, C. P., F. C. MacKintosh, et al. (2006). "Microtubules can bear enhanced compressive loads in living cells because of lateral reinforcement." Journal of Cell Biology 173(5): 733-741.
Brody, J. P., Y. Han, et al. (1995). "Deformation and flow of red blood cells in a synthetic lattice: evidence for an active cytoskeleton." Biophys J 68(6): 2224-32.
Bruel, A., S. Paschke, et al. (2001). "Remodeling of vimentin cytoskeleton correlates with enhanced motility of promyelocytic leukemia cells during differentiation induced by retinoic acid." Anticancer Res. 21(6A): 3973-80.
Bruel A, P. S., Jainta S, Zhang Y, Vassy J, Rigaut JP, Beil M (2001). "Remodeling of vimentin cytoskeleton correlates with enhanced motility of promyelocytic leukemia cells during differentiation induced by retinoic acid." Anticancer Res. 21(6A): 3973-80.
Bubb, M. R., I. Spector, et al. (2000). Effects of Jasplakinolide on the Kinetics of Actin Polymerization. 275: 5163-5170.
Bugnard, E., K. J. M. Zaal, et al. (2005). "Reorganization of microtubule nucleation during muscle differentiation." Cell Motility and the Cytoskeleton 60(1): 1-13.
190
Bibliography ________________________________________________________________________
Burgstaller, G. and M. Gimona (2004). "Actin cytoskeleton remodelling via local inhibition of contractility at discrete microdomains." J. Cell Sci. 117(2): 223-231.
Bursac, P., G. Lenormand, et al. (2005). "Cytoskeletal remodelling and slow dynamics in the living cell." Nat Mater 4(7): 557-561.
Caille, N., O. Thoumine, et al. (2002). "Contribution of the nucleus to the mechanical properties of endothelial cells." J Biomech 35(2): 177-87.
Campbell, M. S., M. A. Lovell, et al. (1995). Stability of nuclear segments in human neutrophils and evidence against a role for microfilaments or microtubules in their genesis during differentiation of HL60 myelocytes. 58: 659-666.
Campellone, K. G., N. J. Webb, et al. (2008). "WHAMM Is an Arp2/3 Complex Activator That Binds Microtubules and Functions in ER to Golgi Transport." Cell 134(1): 148-161.
Carnero, A. and M. E. Lleonart (2010). "Epigenetic mechanisms in senescence, immortalisation and cancer." Biological Reviews.
Centeno, C. J., D. Busse, et al. (2008). "Increased Knee Cartilage Volume in Degenerative Joint Disease using Percutaneously Implanted, Autologous Mesenchymal Stem Cells." Pain Physician 11(3): 343-353.
Charras, G. (2011). UCL London. Chen, S. L., W. Fang, et al. (2004). "Effect on left ventricular function of intracoronary
transplantation of autologous bone marrow mesenchymal stem cell in patients with acute myocardial infarction." Am. J. Cardiol. 94(1): 92-95.
Chu, S. T. and S. K. Chaudhuri (1989). "A Finite-Difference Time-Domain Method for the Design and Analysis of Guided-Wave Optical Structures." J. Lightwave Technol. 7(12): 2033-2038.
Cicuta, P. and A. M. Donald (2007). "Microrheology: a review of the method and applications." Soft Matter 3(12): 1449-1455.
Claude, A. (1961). "Problems of fixation for electron microscopy. Results of fixation with osmium tetroxide in acid and alkaline media." Pathol Biol (Paris). 9: 933-47.
Colter, D. C., I. Sekiya, et al. (2001). "Identification of a subpopulation of rapidly self-renewing and multipotential adult stem cells in colonies of human marrow stromal cells." PNAS 98(14): 7841-7845.
Coué, M., S. L. Brenner, et al. (1987). "Inhibition of actin polymerization by latrunculin A." FEBS Letters 213(2): 316-318.
Coughlin, M. F., D. D. Sohn, et al. (2008). "Recoil and Stiffening by Adherent Leukocytes in Response to Fluid Shear." Biophysical Journal 94(3): 1046-1051.
Coulombe, P. A. and M. B. Omary (2002). "'Hard' and 'soft' principles defining the structure, function and regulation of keratin intermediate filaments." Curr Opin Cell Biol 14(1): 110-22.
Cramer, L. P. (1999). "Role of actin-filament disassembly in lamellipodium protrusion in motile cells revealed using the drug jasplakinolide." Current Biology 9(19): 1095-1105.
Cross, S. E., Y. S. Jin, et al. (2007). "Nanomechanical analysis of cells from cancer patients." Nat Nanotechnol 2(12): 780-783.
Csomos, K., I. Nemet, et al. (2010). "Tissue transglutaminase contributes to the all-trans-retinoic acid-induced differentiation syndrome phenotype in the NB4 model of acute promyelocytic leukemia." 116(19): 3933-3943.
191
Bibliography ________________________________________________________________________ Da Silva, J., F. Lautenschlager, et al. (2009). "The cavity-to-cavity migration of
leukaemic cells through 3D honey-combed hydrogels with adjustable internal dimension and stiffness." Biomaterials 31(8): 2201-8.
Damljanovic, V., B. C. Lagerholm, et al. (2005). "Bulk and micropatterned conjugation of extracellular matrix proteins to characterized polyacrylamide substrates for cell mechanotransduction assays." Biotechniques 39(6): 847-851.
Darabi, R., F. N. C. Santos, et al. (2008). "The therapeutic potential of embryonic and adult stem cells for skeletal muscle regeneration." Stem Cell Rev. 4(3): 217-225.
Darling, E. M., M. Topel, et al. (2008). "Viscoelastic properties of human mesenchymally-derived stem cells and primary osteoblasts, chondrocytes, and adipocytes." Journal of Biomechanics 41(2): 454-464.
Davies, S. P., H. Reddy, et al. (2000). Specificity and mechanism of action of some commonly used protein kinase inhibitors. 351: 95-105.
de la Serna, J., P. Montesinos, et al. (2008). "Causes and prognostic factors of remission induction failure in patients with acute promyelocytic leukemia treated with all-trans retinoic acid and idarubicin." Blood 111(7): 3395-3402.
de Pablo, P. J., I. A. Schaap, et al. (2003). "Deformation and collapse of microtubules on the nanometer scale." Phys Rev Lett 91(9): 098101.
Deng, L., N. J. Fairbank, et al. (2005). Airway smooth muscle tone modulates mechanically induced cytoskeletal stiffening and remodeling. 99: 634-641.
DiGirolamo, C. M., D. Stokes, et al. (1999). "Propagation and senescence of human marrow stromal cells in culture: a simple colony-forming assay identifies samples with the greatest potential to propagate and differentiate
doi:10.1046/j.1365-2141.1999.01715.x." British Journal of Haematology 107(2): 275-281.
Discher, D. E., P. Janmey, et al. (2005). "Tissue cells feel and respond to the stiffness of their substrate." Science 310(5751): 1139-43.
Discher, D. E., N. Mohandas, et al. (1994). "Molecular maps of red cell deformation: hidden elasticity and in situ connectivity." Science 266(5187): 1032-5.
Docheva, D., D. Padula, et al. (2008). "Researching into the cellular shape, volume and elasticity of mesenchymal stem cells, osteoblasts and osteosarcoma cells by atomic force microscopy." J. Cell. Mol. Med. 12(2): 537-552.
Doetschman, T. C., H. Eistetter, et al. (1985). The in vitro development of blastocyst-derived embryonic stem cell lines: formation of visceral yolk sac, blood islands and myocardium. 87: 27-45.
Doi, M. E., S. F. (1988). The Theory of Polymer Dynamics, Oxford University Press. Dormann, D. and C. J. Weijer (2006). "Imaging of cell migration." Embo J 25(15): 3480-
3493. Dubin-Thaler, B. J., G. Giannone, et al. (2004). "Nanometer analysis of cell spreading on
matrix-coated surfaces reveals two distinct cell states and STEPs." Biophys J 86(3): 1794-1806.
Duffy, M. J., P. M. McGowan, et al. (2008). "Cancer invasion and metastasis: changing views." J. Pathol. 214(3): 283-293.
Elkin, B. S., E. U. Azeloglu, et al. (2007). "Mechanical heterogeneity of the rat hippocampus measured by atomic force microscope indentation." J. Neurotrauma 24(5): 812-822.
192
Bibliography ________________________________________________________________________
Elson, E. L. (1988). "Cellular mechanics as an indicator of cytoskeletal structure and function." Annu Rev Biophys Biophys Chem 17: 397-430.
Engler, A. J., S. Sen, et al. (2006). "Matrix elasticity directs stem cell lineage specification." Cell 126(4): 677.
Erzurum, S. C., M. L. Kus, et al. (1991). "Mechanical properties of HL60 cells: role of stimulation and differentiation in retention in capillary-sized pores." Am J Respir Cell Mol Biol 5(3): 230-41.
Evans, M. J. and M. H. Kaufman (1981). "Establishment in Culture of Pluripotential Cells from Mouse Embryos." Nature 292(5819): 154-156.
Even-Ram, S. and K. M. Yamada (2005). "Cell migration in 3D matrix." Curr Opin Cell Biol 17(5): 524-532.
Fehling, H. J., G. Lacaud, et al. (2003). "Tracking mesoderm induction and its specification to the hemangioblast during embryonic stem cell differentiation." Development 130(17): 4217-4227.
Fenaux, P., C. Chastang, et al. (1999). A Randomized Comparison of All Transretinoic Acid (ATRA) Followed by Chemotherapy and ATRA Plus Chemotherapy and the Role of Maintenance Therapy in Newly Diagnosed Acute Promyelocytic Leukemia. 94: 1192-1200.
Feng, D., J. A. Nagy, et al. (1998). Neutrophils Emigrate from Venules by a Transendothelial Cell Pathway in Response to FMLP. 187: 903-915.
Fernandez, P. and A. Ott (2008). "Single cell mechanics: Stress stiffening and kinematic hardening." Physical Review Letters 100(23): 4.
Fisher, M. E. and A. B. Kolomeisky (1999). The force exerted by a molecular motor. 96: 6597-6602.
Flemming, W. (1882). Cell Substance, Nucleus and Cell Division. Fletcher, D. A. and R. D. Mullins (2010). "Cell mechanics and the cytoskeleton." Nature
463(7280): 485-492. Flitney, E. W., E. R. Kuczmarski, et al. (2009). "Insights into the mechanical properties
of epithelial cells: the effects of shear stress on the assembly and remodeling of keratin intermediate filaments." 23(7): 2110-2119.
Frankel, S. R., A. Eardley, et al. (1992). "The Retinoic Acid Syndrome in Acute Promyelocytic Leukemia." Annals of Internal Medicine 117(4): 292-296.
Franklin, R. E. and R. G. Gosling (1953). "Molecular Configuration in Sodium Thymonucleate." Nature 171(4356): 740-741.
Fuchs, E. (2007). "Scratching the surface of skin development." Nature 445(7130): 834-842.
Fudge, D., D. Russell, et al. (2008). "The Intermediate Filament Network in Cultured Human Keratinocytes Is Remarkably Extensible and Resilient." PLoS ONE 3(6): e2327.
Furcht, L. T. and G. Wendelschafercrabb (1978). "Trypsin-Induced Coordinate Alterations in Cell-Shape, Cytoskeleton, and Intrinsic Membrane Structure of Contact-Inhibited Cells." Experimental Cell Research 114(1): 1-14.
Gabriele, S., A. M. Benoliel, et al. (2009). "Microfluidic Investigation Reveals Distinct Roles for Actin Cytoskeleton and Myosin II Activity in Capillary Leukocyte Trafficking." Biophysical Journal 96(10): 4308-4318.
193
Bibliography ________________________________________________________________________ Georges, P. C. and P. A. Janmey (2005). "Cell type-specific response to growth on soft
materials." J Appl Physiol 98(4): 1547-53. Gittes, F., B. Mickey, et al. (1993a). "Flexural Rigidity of Microtubules and Actin-
Filaments Measured from Thermal Fluctuations in Shape." Journal of Cell Biology 120(4): 923-934.
Gittes, F., B. Mickey, et al. (1993b). "Flexural rigidity of microtubules and actin filaments measured from thermal fluctuations in shape." J Cell Biol 120(4): 923-34.
Goldstein, L. S. B. (1993). "Functional Redundancy in Mitotic Force Generation." Journal of Cell Biology 120(1): 1-3.
Gregory, S. H. and E. J. Wing (2002). "Neutrophil-Kupffer cell interaction: a critical component of host defenses to systemic bacterial infections." J. Leukoc. Biol. 72(2): 239-248.
Gronewold, T. M. A., F. Sasse, et al. (1999). "Effects of rhizopodin and latrunculin B on the morphology and on the actin cytoskeleton of mammalian cells." Cell and Tissue Research 295(1): 121-129.
Guck, J., R. Ananthakrishnan, et al. (2002). "Stretching biological cells with light." J Phys: Condens Matt 14: 4843-56.
Guck, J., R. Ananthakrishnan, et al. (2001). "The optical stretcher: a novel laser tool to micromanipulate cells." Biophys J 81(2): 767-84.
Guck, J., R. Ananthakrishnan, et al. (2000). "Optical deformability of soft biological dielectrics." Phys Rev Lett 84(23): 5451-4.
Guck, J., F. Lautenschlager, et al. (2010). "Critical review: cellular mechanobiology and amoeboid migration." Integrative Biology 2(11-12): 575-583.
Guck, J., S. Schinkinger, et al. (2005). "Optical deformability as an inherent cell marker for testing malignant transformation and metastatic competence." Biophys J 88(5): 3689-98.
Hadjipanayi, E., V. Mudera, et al. (2009). "Guiding cell migration in 3D: A collagen matrix with graded directional stiffness." Cell Motility and the Cytoskeleton 66(3): 121-128.
Hamada, H., M. Kobune, et al. (2005). "Mesenchymal stem cells (MSC) as therapeutic cytoreagents for gene therapy." Cancer Sci. 96(3): 149-156.
Han, Y., G. Gréhan, et al. (2003). "Generalized Lorenz-Mie Theory for a Spheroidal Particle with Off-Axis Gaussian-Beam Illumination." Appl. Opt. 42(33): 6621-6629.
Hanna, J. H., K. Saha, et al. (2010). "Pluripotency and Cellular Reprogramming: Facts, Hypotheses, Unresolved Issues." Cell 143(4): 508-525.
Hartwell, L. H., J. J. Hopfield, et al. (1999). "From molecular to modular cell biology." Nature 402(6761 Suppl): C47-52.
Haudenschild, D. R., J. Chen, et al. (2010). "Vimentin contributes to changes in chondrocyte stiffness in osteoarthritis." Journal of Orthopaedic Research 29(1): 20-25.
Head, J., L. L. Lee, et al. (1985). Equilibrium and rapid kinetic studies on nocodazole-tubulin interaction. 260: 11060-11066.
Helfand, B. T., L. Chang, et al. (2004). Intermediate filaments are dynamic and motile elements of cellular architecture. 117: 133-141.
194
Bibliography ________________________________________________________________________
Hertz, H. (1881). "Über die Berührung fester elastischer Körper." Journal für die reine und angewandte Mathematik 92: 156-171.
Higgs, H. N. (2001). "Actin nucleation: Nucleation-promoting factors are not all equal." Current biology : CB 11(24): R1009-R1012.
Hildebrand, J. A. and D. Rugar (1984). "Measurement of Cellular Elastic Properties by Acoustic Microscopy." J. Microsc.-Oxf. 134(JUN): 245-260.
Hinner, B., M. Tempel, et al. (1998). "Entanglement, Elasticity, and Viscous Relaxation of Actin Solutions." Phys Rev Lett 81(12): 2614-17.
Hipp, J. and A. Atala (2008). "Sources of stem cells for regenerative medicine." Stem Cell Rev. 4(1): 3-11.
Hochmuth, R. M. (2000). "Micropipette aspiration of living cells." J Biomech 33(1): 15-22.
Hodge, T. and M. J. T. V. Cope (2000). A myosin family tree. 113: 3353-3354. Holy, T. E. and S. Leibler (1994). "Dynamic instability of microtubules as an efficient
way to search in space." 91(12): 5682-5685. Hook, R. (1665). Micrographia: or Some Physiological Descriptions of Miniature Bodies
Made by Magnifying Glasses. London, England. Horwitz, E. M., D. J. Prockop, et al. (1999). "Transplantability and therapeutic effects of
bone marrow-derived mesenchymal cells in children with osteogenesis imperfecta." Nat. Med. 5(3): 309-313.
Horwitz, S. B. (1994). "Taxol (paclitaxel): mechanisms of action." Ann Oncol 5 Suppl 6: S3-6.
Humphrey, D., C. Duggan, et al. (2002). "Active fluidization of polymer networks through molecular motors." Nature 416(6879): 413-6.
Icard-Arcizet, D., O. Cardoso, et al. (2008). "Cell Stiffening in Response to External Stress is Correlated to Actin Recruitment." Biophysical journal 94(7): 2906-2913.
Inwood, S. (2005). The Forgotten Genius: The Biography Of Robert Hooke 1635-1703, MacAdam/Cage (May 3, 2005).
Jackson, J. D. (1999). Classical Electrodynamics. New York, John Wiley & Sons Ltd. Janmey, P. A. (1991). "Mechanical properties of cytoskeletal polymers." Curr Opin Cell
Biol 3(1): 4-11. Janmey, P. A., U. Euteneuer, et al. (1991). "Viscoelastic properties of vimentin compared
with other filamentous biopolymer networks." J Cell Biol 113(1): 155-60. Joanny, J. F. and J. Prost (2009). "Active gels as a description of the actin-myosin
cytoskeleton." Hfsp J. 3(2): 94-104. Jonas, M., H. D. Huang, et al. (2008). "Fast fluorescence laser tracking microrheometry,
II: Quantitative studies of cytoskeletal mechanotransduction." Biophysical Journal 95(2): 895-909.
Jordan, M. A., R. J. Toso, et al. (1993). "Mechanism of Mitotic Block and Inhibition of Cell-Proliferation by Taxol at Low Concentrations." PNAS 90(20): 9552-9556.
Karakozova, M., M. Kozak, et al. (2006). Arginylation of Alpha-Actin Regulates Actin Cytoskeleton and Cell Motility. 313: 192-196.
Karcher, H., J. Lammerding, et al. (2003). "A three-dimensional viscoelastic model for cell deformation with experimental verification." Biophysical Journal 85(5): 3336-3349.
195
Bibliography ________________________________________________________________________ Karmaker, H. C. (1978). Electromagnetic force calculation by Maxwell stress tensor and
integral equation formulation. Proceedings of the International Conference on Electrical Machines, Brussels, Belgium, Katholieke Univ. Leuven.
Kashina, A. S. (2006). "Differential arginylation of actin isoforms: the mystery of the actin N-terminus." Trends in cell biology 16(12): 610-615.
Keller, G. (2005). "Embryonic stem cell differentiation: emergence of a new era in biology and medicine." Genes Dev. 19(10): 1129-1155.
Keller, G. M. (1995). "In-Vitro Differentiation of Embryonic Stem-Cells." Current Opinion in Cell Biology 7(6): 862-869.
Khanna-Gupta, A., K. Kolibaba, et al. (1994). "NB4 cells show bilineage potential and an aberrant pattern of neutrophil secondary granule protein gene expression." 84(1): 294-302.
Kniazeva, E. and A. J. Putnam (2009). "Endothelial cell traction and ECM density influence both capillary morphogenesis and maintenance in 3-D." Am. J. Physiol.-Cell Physiol. 297(1): C179-C187.
Knowles, G. C. and C. A. McCulloch (1992). Simultaneous localization and quantification of relative G and F actin content: optimization of fluorescence labeling methods. 40: 1605-12.
Kole, T. P., Y. Tseng, et al. (2005). "Intracellular mechanics of migrating fibroblasts." Mol Biol Cell 16(1): 328-338.
Kollmannsberger, P. and B. Fabry (2011). "Linear and Nonlinear Rheology of Living Cells." 41(1): null.
Kornblum, H. I. and D. H. Geschwind (2001). "Molecular markers in CNS stem cell research: hitting a moving target." Nat. Rev. Neurosci. 2(11): 843-846.
Kovacs, M., J. Toth, et al. (2004). Mechanism of Blebbistatin Inhibition of Myosin II. 279: 35557-35563.
Kuncova-Kallio, J. and P. J. Kallio (2006). "PDMS and its suitability for analytical microfluidic devices." Conf Proc IEEE Eng Med Biol Soc 1: 2486-9.
Kundu, T., J. Bereiterhahn, et al. (1991). "Measuring Elastic Properties of Cells by Evaluation of Scanning Acoustic Microscopy V(Z) Values Using Simplex Algorithm." Biophysical Journal 59(6): 1194-1207.
Kuo, S. C. and M. P. Sheetz (1992). "Optical tweezers in cell biology." Trends in Cell Biology 2: 116-118.
Lakes, R. S. (1998). Viscoelastic Solids. Boca Raton, CRC Press. Lam, W. A., M. J. Rosenbluth, et al. (2007). "Chemotherapy exposure increases leukemia
cell stiffness." Blood 109(8): 3505-3508. Lämmermann, T. and M. Sixt (2009). "Mechanical modes of `amoeboid' cell migration."
Current Opinion in Cell Biology 21(5): 636-644. Lanotte, M., V. Martin-Thouvenin, et al. (1991). "NB4, a maturation inducible cell line
with t(15;17) marker isolated from a human acute promyelocytic leukemia (M3)." Blood 77(5): 1080-1086.
Lartillot, N., O. Lespinet, et al. (2002). Expression pattern of Brachyury in the mollusc Patella vulgata suggests a conserved role in the establishment of the AP axis in Bilateria. 129: 1411-1421.
Lauffenburger, D. A. and A. F. Horwitz (1996). "Cell migration: A physically integrated molecular process." Cell 84(3): 359-369.
196
Bibliography ________________________________________________________________________
Laurent, V. M., S. Henon, et al. (2002). "Assessment of mechanical properties of adherent living cells by bead micromanipulation: comparison of magnetic twisting cytometry vs optical tweezers." J Biomech Eng 124(4): 408-21.
Lautenschläger, F. (2006). Changes in Optical Deformability during Differentiation. Physics. Leipzig, University of Leipzig. Diploma
Lautenschläger, F., S. Paschke, et al. (2009). "The regulatory role of cell mechanics for migration of differentiating myeloid cells." PNAS 106(37): 15696-15701.
Leblond, P., P. Lacelle, et al. (1971). "Cellular Deformability: A Possible Determinant of the Normal Release of Maturing Erythrocytes From the Bone Marrow." Blood 37(1): 40-46.
Ley, K., C. Laudanna, et al. (2007). "Getting to the site of inflammation: the leukocyte adhesion cascade updated." Nature reviews 7(9): 678-89.
Li, X., Q. Jia, et al. (2007). "Passage number affects the pluripotency of mouse embryonic stem cells as judged by tetraploid embryo aggregation." Cell and Tissue Research 327(3): 607-614.
Lichtman, M. A. (1970). "Cellular Deformability During Maturation of Myeloblast - Possible Role in Marrow Egress." New England Journal of Medicine 283(18): 943-&.
Lichtman, M. A. (1973). "Rheology of Leukocytes, Leukocyte Suspensions, and Blood in Leukemia - Possible Relationship to Clinical Manifestations." J Clin Invest 52(2): 350-358.
Lieleg, O. and A. R. Bausch (2007). "Cross-Linker Unbinding and Self-Similarity in Bundled Cytoskeletal Networks." Physical Review Letters 99(15): 158105.
Lincoln, B., H. M. Erickson, et al. (2004). "Deformability-based flow cytometry." Cytometry 59A(2): 203-9.
Lincoln, B., S. Schinkinger, et al. (2007a). "Reconfigurable microfluidic integration of a dual-beam laser trap with biomedical applications." Biomed Microdevices 9(5): 703-710.
Lincoln, B., F. Wottawah, et al. (2007b). "High-throughput rheological measurements with an optical stretcher." Methods Cell Biol 83: 397-423.
Liu, Y. P., C. Li, et al. (2006). "The Deformation of an Erythrocyte Under the Radiation Pressure by Optical Stretch." Journal of Biomechanical Engineering 128(6): 830–836.
Lo, C.-M., D. B. Buxton, et al. (2004). Nonmuscle Myosin IIB Is Involved in the Guidance of Fibroblast Migration. 15: 982-989.
Lodish, H. B., A.; Zipursky, S.L.; Matsudaira, P.; Baltimore, D.; Darnell, J.E. (2000). Molecular Cell Biology. New York, W.H. Freeman and Company.
Lu, Y. B., K. Franze, et al. (2006). "Viscoelastic properties of individual glial cells and neurons in the CNS." Proceedings of the National Academy of Sciences of the United States of America 103(47): 17759-17764.
Lure, A. I. (1964). Three-dimensional Problems of the Theory of Elasticity. New York, Interscience Publishers.
MacKintosh, F. C., J. Käs, et al. (1995). "Elasticity of semiflexible biopolymer networks." Phys Rev Lett 75(24): 4425-8.
Maekawa, M., T. Ishizaki, et al. (1999). Signaling from Rho to the Actin Cytoskeleton Through Protein Kinases ROCK and LIM-kinase. 285: 895-898.
197
Bibliography ________________________________________________________________________ Mahaffy, R. E., S. Park, et al. (2004). "Quantitative analysis of the viscoelastic properties
of thin regions of fibroblasts using atomic force microscopy." Biophysical Journal 86(3): 1777-1793.
Mahaffy, R. E., C. K. Shih, et al. (2000). "Scanning probe-based frequency-dependent microrheology of polymer gels and biological cells." Physical Review Letters 85(4): 880-883.
Maherali, N. and K. Hochedlinger (2008). "Guidelines and Techniques for the Generation of Induced Pluripotent Stem Cells." Cell Stem Cell 3(6): 595-605.
Maloney, J. M., D. Nikova, et al. (2010). "Mesenchymal Stem Cell Mechanics from the Attached to the Suspended State." Biophysical journal 99(8): 2479-2487.
Marcellini, S., U. Technau, et al. (2003). "Evolution of Brachyury proteins: identification of a novel regulatory domain conserved within Bilateria." Developmental Biology 260(2): 352-361.
Martens, J. and M. Radmacher (2008). "Softening of the actin cytoskeleton by inhibition of myosin II." Pflügers Archiv European Journal of Physiology 456(1): 95-100.
Martin, G. R. (1981). "Isolation of a Pluripotent Cell-Line from Early Mouse Embryos Cultured in Medium Conditioned by Teratocarcinoma Stem-Cells." Proceedings of the National Academy of Sciences of the United States of America-Biological Sciences 78(12): 7634-7638.
Marupudi, N. I., J. E. Han, et al. (2007). "Paclitaxel: a review of adverse toxicities and novel delivery strategies." Expert Opin. Drug Saf. 6(5): 609-621.
Mauritz, J. M. A., T. Tiffert, et al. (2010). "Detection of Plasmodium falciparum-infected red blood cells by optical stretching." Journal of Biomedical Optics 15(3): 030517-3.
Mazumder, A. and G. V. Shivashankar ( 2010). "Emergence of a prestressed eukaryotic nucleus during cellular differentiation and development." 7(Suppl 3): S321-S330.
Medeiros, N. A., D. T. Burnette, et al. (2006). "Myosin II functions in actin-bundle turnover in neuronal growth cones." Nat Cell Biol 8(3): 216-226.
Mets, T. and G. Verdonk (1981). "Invitro Aging of Human-Bone Marrow Derived Stromal Cells." Mech. Ageing. Dev. 16(1): 81-89.
Michailidou, M., H. K. Brown, et al. (2010). "Microvascular Endothelial Cell Responses in vitro and in vivo: Modulation by Zoledronic Acid and Paclitaxel?" J. Vasc. Res. 47(6): 481-493.
Mie, G. (1908). "Articles on the optical characteristics of turbid tubes, especially colloidal metal solutions." Ann. d. Phy. 25: 377.
Milne, G. (2003-2009). StAT (St. Andrews tracker). Mirzapoiazova, T., I. A. Kolosova, et al. (2007). Suppression of endotoxin-induced
inflammation by taxol. 30: 429-435. Mitchison, T. and M. Kirschner (1984). "Dynamic instability of microtubule growth."
Nature 312(5991): 237-242. Moisan, S. Chiasson, et al. (2007). "The intriguing normal acute inflammatory response
in mice lacking vimentin." Clin Exp Immunol. 150(1): 158-168. Mooberry, S. (2007). "Strategies for the development of novel Taxol-like agents."
Methods Mol Med 137: 289-302. Morrison, S. J. and A. C. Spradling (2008). "Stem cells and niches: Mechanisms that
promote stem cell maintenance throughout life." Cell 132(4): 598-611.
198
Bibliography ________________________________________________________________________
Morton, W. M., K. R. Ayscough, et al. (2000). "Latrunculin alters the actin-monomer subunit interface to prevent polymerization." Nat Cell Biol 2(6): 376-378.
Moshayedi, P., L. D. Costa, F, et al. (2010). "Mechanosensitivity of astrocytes on optimized polyacrylamide gels analyzed by quantitative morphometry." J. Phys.: Condens. Matter 22(19).
Moy, A. B., K. Blackwell, et al. (2004). Phorbol ester-mediated pulmonary artery endothelial barrier dysfunction through regulation of actin cytoskeletal mechanics. 287: L153-167.
Mücke, N., L. Kreplak, et al. (2004). "Assessing the Flexibility of Intermediate Filaments by Atomic Force Microscopy." Journal of Molecular Biology 335(5): 1241-1250.
Müller, S., J. Parisi, et al. (1999). Force and motion generation of molecular motors: A generic description. Transport and Structure, Springer Berlin / Heidelberg. 532-532: 46-74.
Musa, H., C. Orton, et al. (2003). "Microtubule assembly in cultured myoblasts and myotubes following nocodazole induced microtubule depolymerisation." J. Muscle Res. Cell Motil. 24(4-6): 301-308.
Nakano, T., H. Kodama, et al. (1994). "Generation of Lymphohematopoietic Cells from Embryonic Stem-Cells in Culture." Science 265(5175): 1098-1101.
Narumiya, S., F. Oceguera-Yanez, et al. (2004). "A new look at Rho GTPases in cell cycle - Role in kinetochore-microtubule attachment." Cell Cycle 3(7): 855-857.
Naumanen, P., P. Lappalainen, et al. (2008). "Mechanisms of actin stress fibre assembly." Journal of Microscopy 231(3): 446-454.
Nishikawa, S. I., S. Nishikawa, et al. (1998). "Progressive lineage analysis by cell sorting and culture identifies FLK1+VE-cadherin+ cells at a diverging point of endothelial and hemopoietic lineages." Development (Cambridge, England) 125(9): 1747-57.
Norberg, B. (1969). "Neutrophil Segmentation and Radial Segmentation." Scandinavian Journal of Haematology 6(4): 274-279.
Oakes, P. W., D. C. Patel, et al. (2009). Neutrophil morphology and migration are affected by substrate elasticity. 114: 1387-1395.
Oberleithner, H. (2005). "Aldosterone makes human endothelium stiff and vulnerable." Kidney Int 67(5): 1680-1682.
Okamoto, K. and S. Kawata (1999). "Radiation force exerted on subwavelength particles near a nanoaperture." Physical Review Letters 83(22): 4534-4537.
Olins, A. L., H. Herrmann, et al. (2000). "Retinoic acid differentiation of HL-60 cells promotes cytoskeletal polarization." Exp Cell Res 254(1): 130-42.
Ono, S. (2007). Mechanism of depolymerization and severing of actin filaments and its significance in cytoskeletal dynamics. International Review of Cytology - a Survey of Cell Biology, Vol 258. San Diego, Elsevier Academic Press Inc. 258: 1-82.
Orkin, S. H. and L. I. Zon (2008). "Hematopoiesis: An evolving paradigm for stem cell biology." Cell 132(4): 631-644.
Osborn, M. and K. Weber (1977). "Detergent-Resistant Cytoskeleton of Tissue-Culture Cells Includes Nucleus and Microfilament Bundles." Experimental Cell Research 106(2): 339-349.
199
Bibliography ________________________________________________________________________ Ott, A., M. Magnasco, et al. (1993). "Measurement of the persistence length of
polymerized actin using fluorescence microscopy." Physical Review E 48(3): R1642.
Padget, M. A., L. (1997). "Optical tweezers and spanners." Physics World(September 1997): 35-38.
Panorchan, P., J. S. Lee, et al. (2006). "Microrheology and ROCK signaling of human endothelial cells embedded in a 3D matrix." Biophys J 91(9): 3499-507.
Parent, C. A. (2004). "Making all the right moves: chemotaxis in neutrophils and Dictyostelium." Current Opinion in Cell Biology 16(1): 4-13.
Passier, R., L. W. van Laake, et al. (2008). "Stem-cell-based therapy and lessons from the heart." Nature 453(7193): 322-329.
Phelps, P. and D. Stanisla (1969). "Polymorphonuclear Leukocyte Motility in Vitro .I. Effect of Ph Temperature Ethyl Alcohol and Caffeine Using a Modified Boyden Chamber Technic." Arthritis Rheum. 12(3): 181-&.
Pittenger, M. F., A. M. Mackay, et al. (1999). "Multilineage potential of adult human mesenchymal stem cells." Science 284(5411): 143-147.
Pollard, T. D., L. Blanchoin, et al. (2000). "Molecular mechanisms controlling actin filament dynamics in nonmuscle cells." Annu Rev Biophys Biomol Struct 29: 545-76.
Radmacher, M. (2002). "Measuring the elastic properties of living cells by the atomic force microscope." Methods Cell Biol 68: 67-90.
Radmacher, M., R. W. Tillmann, et al. (1992). "From Molecules to Cells - Imaging Soft Samples with the Atomic Force Microscope." Science 257(5078): 1900-1905.
Rasmussen, T., J. H. Povlsen, et al. (1993). "Accurate Finite-Difference Beam Propagation Method for Complex Integrated Optical Structures." IEEE Photonics Technol. Lett. 5(3): 339-342.
Reisinger, M. D. and M. Rief (2009). "Force Dependent Unbinding Kinetics of Actin Crosslinking Proteins Using a Four-Bead Optical Tweezers Assay." Biophysical Journal 96(3, Supplement 1): 387a-387a.
Remmerbach, T. W., F. Wottawah, et al. (2009). "Oral Cancer Diagnosis by Mechanical Phenotyping." Cancer Res. 69(5): 1728-1732.
Rodriguez, O. C., A. W. Schaefer, et al. (2003). "Conserved microtubule-actin interactions in cell movement and morphogenesis." Nat Cell Biol 5(7): 599-609.
Roosen, G. (1977). "A theoretical and experimental study of the stable equilibrium positions of spheres levitated by two horizontal laser beams." Opt Commun 21: 189-95.
Roosen, G. I., C. (1976). "Optical levitation by means of two horizontal laser beams: a theoretical and experimental study." Phys Lett A 59: 6-9.
Rosenbluth, M. J., W. A. Lam, et al. (2006). "Force microscopy of nonadherent cells: a comparison of leukemia cell deformability." Biophys J 90(8): 2994-3003.
Rotsch, C., K. Jacobson, et al. (1999). "Dimensional and mechanical dynamics of active and stable edges in motile fibroblasts investigated by using atomic force microscopy." Proc Natl Acad Sci U S A 96(3): 921-6.
Rotsch, C. and M. Radmacher (2000). "Drug-induced changes of cytoskeletal structure and mechanics in fibroblasts: an atomic force microscopy study." Biophys J 78(1): 520-35.
200
Bibliography ________________________________________________________________________
Sablin, E. P. (2000). "Kinesins and microtubules: their structures and motor mechanisms." Curr Opin Cell Biol 12(1): 35-41.
Samson, F., J. A. Donoso, et al. (1979). Nocodazole action on tubulin assembly, axonal ultrastructure and fast axoplasmic transport. 208: 411-417.
Sanz, M. A., M. S. Tallman, et al. (2005). "Tricks of the trade for the appropriate management of newly diagnosed acute promyelocytic leukemia." Blood 105(8): 3019-3025.
Sato, M., K. Nagayama, et al. (2000). "Local mechanical properties measured by atomic force microscopy for cultured bovine endothelial cells exposed to shear stress." Journal of Biomechanics 33(1): 127-135.
Schmid, B. ImageJ 3D Viewer Image J plug-in. Schmoller, K. M., C. Semmrich, et al. (2011). "Slow down of actin depolymerization by
cross-linking molecules." J. Struct. Biol. 173(2): 350-357. Schmutz, J., J. Wheeler, et al. (2004). "Quality assessment of the human genome
sequence." Nature 429(6990): 365-368. Schnaeker, E. M., R. Ossig, et al. (2004). "Microtubule-dependent matrix
metalloproteinase-2/matrix metalloproteinase-9 exocytosis: prerequisite in human melanoma cell invasion." Cancer Res 64(24): 8924-31.
Scholz, C. and U. Technau (2003). "The ancestral role of Brachyury: expression of NemBra1 in the basal cnidarian Nematostella vectensis (Anthozoa) " Development Genes and Evolution 212(12): 563-570.
Science (2001). "Science Genome Map." Science 291(5507): 1218. Scott P. Bruder, N. J., Stephen E. Haynesworth, (1997). "Growth kinetics, self-renewal,
and the osteogenic potential of purified human mesenchymal stem cells during extensive subcultivation and following cryopreservation." Journal of Cellular Biochemistry 64(2): 278-294.
Scott, R. B., W. M. Grogan, et al. (1978). Separation of rabbit marrow precursor cells by combined isopycnic sedimentation and electronic cell sorting. 51: 1137-1148.
Sekiya, I., B. L. Larson, et al. (2002). "Expansion of human adult stem cells from bone marrow stroma: Conditions that maximize the yields of early progenitors and evaluate their quality." Stem Cells 20(6): 530-541.
Semmrich, C., T. Storz, et al. (2007). "Glass transition and rheological redundancy in F-actin solutions." 104(51): 20199-20203.
Sham, R. L., P. D. Phatak, et al. (1995). "Functional properties of HL60 cells matured with all-trans-retinoic acid and DMSO: differences in response to interleukin-8 and fMLP." Leuk Res 19(1): 1-6.
Shaw, S. K., P. S. Bamba, et al. (2001). "Real-time imaging of vascular endothelial-cadherin during leukocyte transmigration across endothelium." J Immunol 167(4): 2323-30.
Shiraki, N., Y. Higuchi, et al. (2009). "Differentiation and characterization of embryonic stem cells into three germ layers." Biochemical and Biophysical Research Communications 381(4): 694-699.
Si, J., Y. Ge, et al. (2009). "Inhibiting nonmuscle myosin II impedes inflammatory infiltration and ameliorates progressive renal disease." Laboratory investigation; a journal of technical methods and pathology 90(3): 448-58.
201
Bibliography ________________________________________________________________________ Singh, S. and A. K. Dash (2009). "Paclitaxel in Cancer Treatment: Perspectives and
Prospects of its Delivery Challenges." Crit. Rev. Ther. Drug Carr. Syst. 26(4): 333-372.
Smith, A. G., J. K. Heath, et al. (1988). "Inhibition of Pluripotential Embryonic Stem-Cell Differentiation by Purified Polypeptides." Nature 336(6200): 688-690.
Solter, D. (2010). "Viable Rat-Mouse Chimeras: Where Do We Go from Here?" Cell 142(5): 676-678.
Sperry, R. B., N. H. Bishop, et al. (2009). "Zyxin controls migration in epithelial–mesenchymal transition by mediating actin-membrane linkages at cell–cell junctions." Journal of Cellular Physiology 222(3): 612-624.
Spudich, J. A. (2011). "Molecular Motors, Beauty in Complexity." Science 331(6021): 1143-1144.
Starkebaum, G., R. A. H. Jimenez, et al. (1982). "Effect of Immune-Complexes on Human Neutrophil Phagocytic Function." J. Immunol. 128(1): 141-147.
Stewart, C. L., P. Kaspar, et al. (1992). "Blastocyst Implantation Depends on Maternal Expression of Leukemia Inhibitory Factor." Nature 359(6390): 76-79.
Stolz, M., R. Raiteri, et al. (2004). "Dynamic elastic modulus of porcine articular cartilage determined at two different levels of tissue organization by indentation-type atomic force microscopy." Biophysical Journal 86(5): 3269-3283.
Sung, K. L., C. Dong, et al. (1988). "Leukocyte relaxation properties." Biophys J 54(2): 331-6.
Suresh, S. (2007). "Biomechanics and biophysics of cancer cells." Acta Biomater 3(4): 413-438.
Takácsa, B., N. Billington, et al. (2010). "Myosin complexed with ADP and blebbistatin reversibly adopts a conformation resembling the start point of the working stroke." PNAS 107(15): 6799-6804.
Takada, I., A. P. Kouzmenko, et al. (2009). "Wnt and PPAR[gamma] signaling in osteoblastogenesis and adipogenesis." Nat Rev Rheumatol 5(8): 442-447.
Takeda, S., S. Minakata, et al.(2010). "Two Distinct Mechanisms for Actin Capping Protein Regulation—Steric and Allosteric Inhibition." PLoS Biol 8(7): e1000416.
Tallman, M. S., J. W. Andersen, et al. (2000). "Clinical description of 44 patients with acute promyelocytic leukemia who developed the retinoic acid syndrome." Blood 95(1): 90-95.
Tayalia, P., E. Mazur, et al. (2010). "Controlled architectural and chemotactic studies of 3D cell migration." Biomaterials 32(10): 2634-2641.
Thoumine, O. and A. Ott (1997). "Time scale dependent viscoelastic and contractile regimes in fibroblasts probed by microplate manipulation." J Cell Sci 110 ( Pt 17): 2109-16.
Thoumine, O., A. Ott, et al. (1999). "Microplates: a new tool for manipulation and mechanical perturbation of individual cells." J Biochem Biophys Methods 39(1-2): 47-62.
Titushkin, I. and M. Cho (2007). Modulation of cellular mechanics during osteogenic differentiation of human mesenchymal stem cells: biophysj.107.107797.
Trapp, G., E. Horn, et al. (2007). ChemotaxisAndMigrationTool: Image J plug-in.
202
Bibliography ________________________________________________________________________
Trepat, X., L. H. Deng, et al. (2007). "Universal physical responses to stretch in the living cell." Nature 447(7144): 592-+.
Tsai, M. A., R. S. Frank, et al. (1994). "Passive mechanical behavior of human neutrophils: effect of cytochalasin B." Biophys J 66(6): 2166-72.
Tsai, M. A., R. E. Waugh, et al. (1998). "Passive mechanical behavior of human neutrophils: effects of colchicine and paclitaxel." Biophys J 74(6): 3282-91.
Tse, R. L., D. Urban, et al. (1972). "Polymorphonuclear Leukocyte Motility in-Vitro .6. Effect of Purine and Pyrimidine Analogs - Possible Role of Cyclic Amp." J. Lab. Clin. Med. 80(2): 264-&.
Tseng, Y., E. Fedorov, et al. (2001). "Micromechanics and ultrastructure of actin filament networks crosslinked by human fascin: A comparison with [alpha]-actinin." Journal of Molecular Biology 310(2): 351-366.
Uccelli, A., L. Moretta, et al. (2008). "Mesenchymal stem cells in health and disease." Nat. Rev. Immunol. 8(9): 726-736.
Vale, R. D. (2003). "The molecular motor toolbox for intracellular transport." Cell 112(4): 467-480.
Van Goethem, E., R. Poincloux, et al. (2009). "Matrix Architecture Dictates Three-Dimensional Migration Modes of Human Macrophages: Differential Involvement of Proteases and Podosome-Like Structures." The Journal of Immunology 184(2): 1049-1061.
Vedula, S. R., T. S. Lim, et al. (2005). "Biophysical approaches for studying the integrity and function of tight junctions." Mol Cell Biomech 2(3): 105-23.
Verdier, C., J. Etienne, et al. (2009). "Review: Rheological properties of biological materials." Comptes Rendus Physique 10(8): 790-811.
Wachsstock, D. H., W. H. Schwarz, et al. (1994). "Cross-linker dynamics determine the mechanical properties of actin gels." Biophysical journal 66(3): 801-809.
Wakatsuki, T., B. Schwab, et al. (2001). Effects of cytochalasin D and latrunculin B on mechanical properties of cells. 114: 1025-1036.
Wang, J., L. W. Barsky, et al. (2006). "Retinoic acid induces leukemia cell G1 arrest and transition into differentiation by inhibiting cyclin-dependent kinase-activating kinase binding and phosphorylation of PML/RAR{alpha}." FASEB J 20(12): 2142-2144.
Wang, N. and D. Stamenovic (2000). "Contribution of intermediate filaments to cell stiffness, stiffening, and growth." Am J Physiol Cell Physiol 279(1): C188-94.
Wang, X. J., X. B. Wang, et al. (1997). "General expressions for dielectrophoretic force and electrorotational torque derived using the Maxwell stress tensor method." J. Electrost. 39(4): 277-295.
Waterman-Storer, C. M., R. A. Worthylake, et al. (1999). "Microtubule growth activates Rac1 to promote lamellipodial protrusion in fibroblasts." Nat Cell Biol 1(1): 45-50.
Watson, J. D. and F. H. C. Crick (1953). "Molecular Structure of Nucleic Acids - a Structure for Deoxyribose Nucleic Acid." Nature 171(4356): 737-738.
Weiss, L. (1963). "Studies on cellular adhesion in tissue-culture : V. Some effects of enzymes on cell-detachment." Experimental Cell Research 30(3): 509-520.
Wiles, M. V. and G. Keller (1991). "Multiple Hematopoietic Lineages Develop from Embryonic Stem (Es) Cells in Culture." Development 111(2): 259-&.
203
Bibliography ________________________________________________________________________ Williams, R. L., D. J. Hilton, et al. (1988). "Myeloid-Leukemia Inhibitory Factor
Maintains the Developmental Potential of Embryonic Stem-Cells." Nature 336(6200): 684-687.
Witke, W., M. Schleicher, et al. (1992). "Redundancy in the microfilament system: Abnormal development of dictyostelium cells lacking two F-actin cross-linking proteins." Cell 68(1): 53-62.
Wolf, K., I. Mazo, et al. (2003). "Compensation mechanism in tumor cell migration: mesenchymal-amoeboid transition after blocking of pericellular proteolysis." J Cell Bio 160(2): 267-277.
Wottawah, F., S. Schinkinger, et al. (2005a). "Optical Rheology of Biological Cells." Phys Rev Lett 94(9): 098103.
Wottawah, F., S. Schinkinger, et al. (2005b). "Characterizing single suspended cells by optorheology." Acta Biomater 1(1): 263–71.
Wright, H. L., R. J. Moots, et al. (2010). "Neutrophil function in inflammation and inflammatory diseases" Rheumatology.
Wright, K. T., W. El Masri, et al. (2010). "Concise Review: Bone Marrow for the Treatment of Spinal Cord Injury: Mechanisms and Clinical Applications." Stem Cells 29(2): 169-178.
Wu, H. W., T. Kuhn, et al. (1998). "Mechanical properties of L929 cells measured by atomic force microscopy: Effects of anticytoskeletal drugs and membrane crosslinking." Scanning 20(5): 389-397.
Yalcin, H. C., K. M. Hallow, et al. (2009). "Influence of cytoskeletal structure and mechanics on epithelial cell injury during cyclic airway reopening." 297(5): L881-891.
Yanagita, T., H. Kobayashi, et al. (1999). "Protein Kinase C and the Opposite Regulation of Sodium Channel α- and β1-Subunit mRNA Levels in Adrenal Chromaffin Cells." Journal of Neurochemistry 73(4): 1749-1757.
Yang, J. and R. A. Weinberg (2008). "Epithelial-Mesenchymal Transition: At the Crossroads of Development and Tumor Metastasis." Developmental cell 14(6): 818-829.
Yeung, T., P. C. Georges, et al. (2005). "Effects of substrate stiffness on cell morphology, cytoskeletal structure, and adhesion." Cell Motil Cytoskeleton 60(1): 24-34.
Yoon, Y.-Z., J. Kotar, et al. (2008). "The nonlinear mechanical response of the red blood cell." Physical Biology 5(3): 036007.
Yu, J. T., J. Y. Chen, et al. (2005). "Surface stress on the erythrocyte under laser irradiation with finite-difference time-domain calculation." Journal of Biomedical Optics 10(6).
Yuan, Y. H. and R. Verma (2006). "Measuring microelastic properties of stratum corneum." Colloids and Surfaces B-Biointerfaces 48(1): 6-12.
Zaman, M. H., L. M. Trapani, et al. (2006). Migration of tumor cells in 3D matrices is governed by matrix stiffness along with cell-matrix adhesion and proteolysis. 103: 10889-10894.
Zang, C. B., H. Y. Liu, et al. (2000). "Enhanced migration of the acute promyelocytic leukemia cell line NB4 under in vitro conditions during short-term all-trans-retinoic acid treatment." J Cancer Res Clin Oncol 126(1): 33-40.
204

Bibliography ________________________________________________________________________
Zhao, C., L. Meng, et al. (2010). "Spontaneously immortalised bovine mammary epithelial cells exhibit a distinct gene expression pattern from the breast cancer cells." BioMed Central Ltd. 11(1): 82.
205

Bibliography ________________________________________________________________________
206
Appendix ________________________________________________________________________
Appendix Appendix ........................................................................................................................ 207 Microfluidics .................................................................................................................. 208 9.1 SU8 Production ................................................................................................. 208 9.2 Plasma Treatment Protocol to Treat PDMS: ................................................. 208 9.3 Details of the Monolithic Glass Chip Design .................................................. 209 Protocols Cell Culture and Differentiation ................................................................. 210 9.4 Ingredients ES-Medium ................................................................................... 210 9.5 Protocol Feeder Cells ........................................................................................ 210
9.5.1 Feeder Cell Culture ......................................................................................... 210 9.5.2 Mitomycin-C Treatment ................................................................................. 210 9.5.3 Freezing and Thawing of Feeder Cells ........................................................... 210
9.6 Protocol Gelatin Preparation and Administration ........................................ 211 9.7 Protocol Panning of Feeder Cells .................................................................... 211 9.8 Differentiation Media Protocols ...................................................................... 211
9.8.1 Differentiation Medium 1 ............................................................................... 211 9.8.2 Differentiation Medium 2 ............................................................................... 211 9.8.3 Differentiation Medium 3 ............................................................................... 212 9.8.4 Differentiation Medium 4 ............................................................................... 212
9.9 Protocol Differentiation in Embryoid Bodies(EB): ....................................... 212 9.9.1 Hanging Droplet Method ................................................................................ 212 9.9.2 Protocol for Differentiation in Methylcellulose Based Medium .................... 213
The following section is giving protocols or additional information which have been
referred to in the main section of this thesis but which were not necessary for the
understanding of the concepts or experiments described.
207
Microfluidics ________________________________________________________________________
9. Microfluidics
9.1 SU8 Production
1. Clean microscope slide with Isopropanol, SU8 developer and acetone. Blow dry. Wait at least 5 min.
2. Cover the microscope slide uniformly with SU8 2015, use cocktail stick to disperse.
3. Spin at 820 rpm for 1 min. 4. Remove edges after spinning with razor blade. 5. Bake for 2 min at 65 ºC and for 5 min at 95 ºC. 6. Use a mask with 120/190 µm wide channels, expose 2x5 s with 10 s interval. 7. Quickly after-bake the slide for 1 min at 65 ºC and 3 min at 95 ºC. 8. Use disperser to cover slide with SU8 developer to reach small features. Only
develop one sample in one Petri dish filled with SU8 developer at the time. Leave sample in the developer for about 2 min under permanent shaking by hand. Check if it turns white if Isopropanol is sprayed on. If this is the case it is underdeveloped and channels are not proper. Put it back into the SU8 developer. On the other hand, overdeveloping can loosen the structures from the microscope slide or results in non straight channel walls, therefore the sample should be removed as soon as possible.
9. Spray Isopropanol on the sample to stop development. 10. Blow dry very carefully. 11. Post-bake about 30 s at 100 ºC. (Leave this step if there are long, thin structures.)
9.2 Plasma Treatment Protocol to Treat PDMS:
1. Clean both surfaces (glass and PDMS) appropriately. Good results were obtained by sticking adhesive tape against the PDMS and the microscopy slide several times.
2. Use air plasma instead of oxygen plasma. Oxygen plasma treatment can change the surface of the PDMS such that it looses its elasticity and forms cracks, which results in no adhesion at all.
3. Place PDMS and glass slide both in the plasma cleaner, the surfaces which are supposed to be treated upwards.
4. Use very low plasma intensities of about 30 W for 9 s. 5. Assemble glass and PDMS quickly together (< 1 min) and apply gentle pressure. 6. After-bake for at least 30 min at 100 ºC.
208
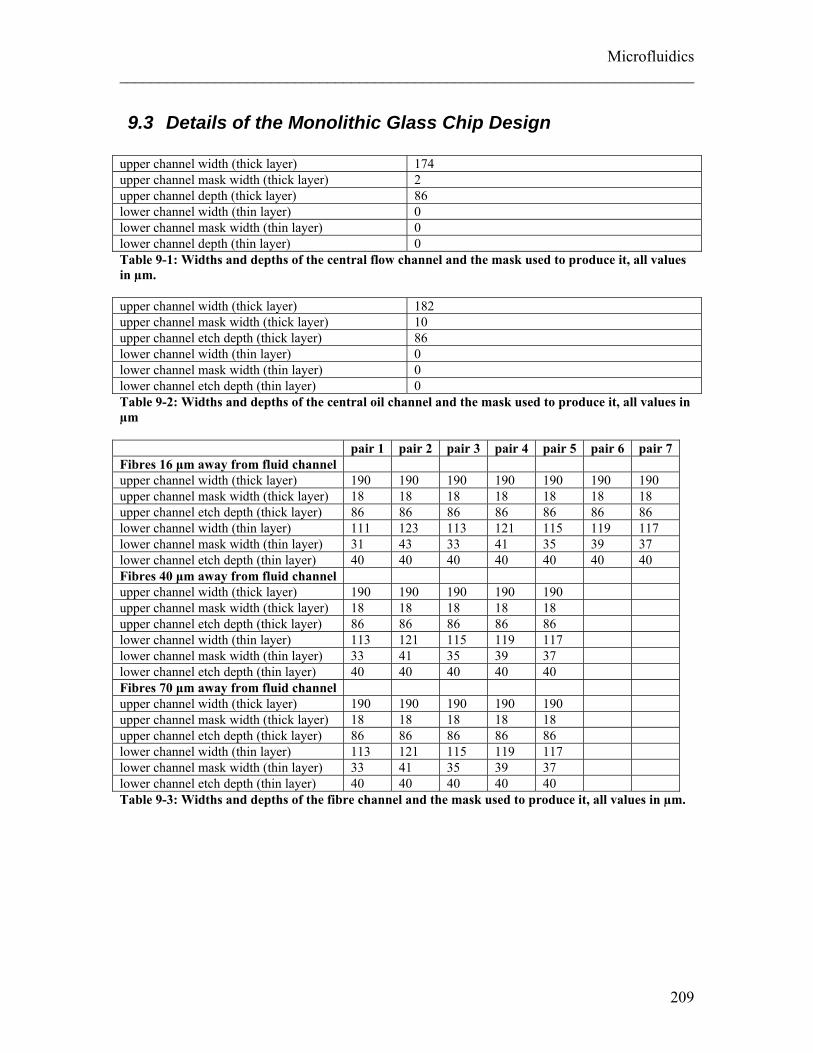
Microfluidics ________________________________________________________________________
9.3 Details of the Monolithic Glass Chip Design upper channel width (thick layer) 174 upper channel mask width (thick layer) 2 upper channel depth (thick layer) 86 lower channel width (thin layer) 0 lower channel mask width (thin layer) 0 lower channel depth (thin layer) 0 Table 9-1: Widths and depths of the central flow channel and the mask used to produce it, all values in µm. upper channel width (thick layer) 182 upper channel mask width (thick layer) 10 upper channel etch depth (thick layer) 86 lower channel width (thin layer) 0 lower channel mask width (thin layer) 0 lower channel etch depth (thin layer) 0 Table 9-2: Widths and depths of the central oil channel and the mask used to produce it, all values in µm pair 1 pair 2 pair 3 pair 4 pair 5 pair 6 pair 7 Fibres 16 μm away from fluid channel upper channel width (thick layer) 190 190 190 190 190 190 190 upper channel mask width (thick layer) 18 18 18 18 18 18 18 upper channel etch depth (thick layer) 86 86 86 86 86 86 86 lower channel width (thin layer) 111 123 113 121 115 119 117 lower channel mask width (thin layer) 31 43 33 41 35 39 37 lower channel etch depth (thin layer) 40 40 40 40 40 40 40 Fibres 40 μm away from fluid channel upper channel width (thick layer) 190 190 190 190 190 upper channel mask width (thick layer) 18 18 18 18 18 upper channel etch depth (thick layer) 86 86 86 86 86 lower channel width (thin layer) 113 121 115 119 117 lower channel mask width (thin layer) 33 41 35 39 37 lower channel etch depth (thin layer) 40 40 40 40 40 Fibres 70 μm away from fluid channel upper channel width (thick layer) 190 190 190 190 190 upper channel mask width (thick layer) 18 18 18 18 18 upper channel etch depth (thick layer) 86 86 86 86 86 lower channel width (thin layer) 113 121 115 119 117 lower channel mask width (thin layer) 33 41 35 39 37 lower channel etch depth (thin layer) 40 40 40 40 40 Table 9-3: Widths and depths of the fibre channel and the mask used to produce it, all values in µm.
209
Protocols Cell Culture and Differentiation ________________________________________________________________________
Protocols Cell Culture and Differentiation
9.4 Ingredients ES-Medium
1. 500 ml Glasgow MEM medium with NaHCO3 and without L-Glutamin (Sigma, G4154).
2. 57 ml FBS (Invitrogen, needs to be tested to be compatible with specific cells), final concentration 10 %.
3. 5 ml GlutaMAX, 100X, final concentration 2 mM (INVITROGEN, 35050). 4. 5 ml MEM Non Essential Amino Acids (100X), liquid (INVITROGEN, 11140-
035). 5. 5 ml Sodium pyrovate solution 100 mM, sterile-filtered, cell culture tested, X 100,
final concentration 1 nM (Sigma S8635-100ML). 6. 1 ml 2-Mercaptoethanol (1000X) 50mM, final concentration 100 µM
(INVITROGEN, 31350-010). 7. 1ml ESGRO diluted in Glasgow MEM (=LIF), final concentration 500,000 U/ml
(Millipore ESG1107).
9.5 Protocol Feeder Cells
9.5.1 Feeder Cell Culture 1. Defrost one vial of feeder cells (4-6 106 cells) into 2-3 T75 flasks. 2. Use gelatinized flasks. 3. Feed with ES medium without LIF every 4-5 days. 4. Split at confluency (after 2-3 days) at a 1:4 ratio.
9.5.2 Mitomycin-C Treatment 1. Mitomycin (carcinogen-teratogen!, Sigma, M4287), stock solution: 0.4 mg/ml. 2. Apply 125 µl stock solution to 10 ml of ES medium to treat a T75 flask for 2.5 h.
Waste need to be collected and discarded appropriately. 3. Wash cells twice with PBS. 4. Trypsinize cells, centrifuge and resuspend them in ES medium without LIF. Seed
cells in flasks which are planned to be used for ES culture. 5. Cells can now be kept in incubator for up to two weeks or frozen down.
9.5.3 Freezing and Thawing of Feeder Cells 1. Use 1 T75 to freeze down 1 vial. 2. Use 1 vial to thaw into 2-3 T75 flaks.
210
Protocols Cell Culture and Differentiation ________________________________________________________________________
9.6 Protocol Gelatin Preparation and Administration Gelatin-preparation
1. Gelatin from porcine skin, type A (Sigma, G1890-100G). 2. Stock solution: 1 %, autoclaved but kept in room temperature. 3. Working solution: 0.1 %, in PBS, kept at 4 ºC.
Gelatinizing flasks 1. Cover bottom of flask with working solution for at least 10-15 min, do not place
in incubator. 2. Remove gelatin solution and use flask immediately.
9.7 Protocol Panning of Feeder Cells
1. Trypsinize feeder/ES cell mixture. 2. Centrifuge and resuspend in cell medium. 3. Place re-suspended cell mixture in plastic culture dish for 45 min in incubator. 4. Take off remaining liquid with remaining cells. 5. Place this remaining liquid on fresh plastic culture dish for 45 min in incubator. 6. Remaining supernatant should only contain ES cells since feeders adhered to the
dish. Centrifuge and resuspend in full ES medium.
9.8 Differentiation Media Protocols (kindly provided by Valerie Kouskoff, Paterson institute, University of Manchester, UK, to Anna Melidoni for differentiation protocol 1 and from Gillian Morrison for protocol 2-4)
9.8.1 Differentiation Medium 1 1. IMDM medium (Sigma, I3390). 2. FBS, final concentration 15 % (provided by collaborator). 3. MTG, final concentration 450 µM (Sigma, M6145). 4. Ascorbic Acid, final concentration 0.5 mM (Sigma, A4403). 5. Transferrin, final concentration 200 µg/ml (Sigma, T0665). 6. L-glutamin 2 mM (Sigma, 63126).
9.8.2 Differentiation Medium 2 (to check if serum plays a role, now with serum free medium)
1. N2B27 medium (provided by collaborator). 2. MTG, final concentration 450 µM (Sigma, M6145). 3. Ascorbic Acid, final concentration 0.5 mM (Sigma, A4403). 4. Transferrin, final concentration 200 µg/ml (Sigma, T0665).
211
Protocols Cell Culture and Differentiation ________________________________________________________________________ 9.8.3 Differentiation Medium 3 (different ingredients)
1. IMDM medium (Sigma, I3390). 2. FBS, final concentration 15 % (provided by collaborator). 3. BMP4, final concentration10 ng/ml (provided by collaborator). 4. Activin A, final concentration 20 ng/ml (provided by collaborator). 5. L-glutamine, final concentration 2 mM (provided by collaborator).
9.8.4 Differentiation Medium 4 (serum free medium and different ingredients)
1. N2B27 medium (provided by collaborator). 2. BMP4, final concentration10 ng/ml (provided by collaborator). 3. Activin A, final concentration 20 ng/ml (provided by collaborator).
9.9 Protocol Differentiation in Embryoid Bodies(EB):
9.9.1 Hanging Droplet Method (taken and modified from http://www.atcc.org/Portals/1/Embryoid_Body_Formation.pdf)
1. In the days prior to EB formation, grow up 2 to 3 confluent T-75 flasks of the
ES. 2. Hydrate 10 x 10-cm ultra-low-attachment dishes (Corning #3262). 3. Remove the medium from the T-75 flasks and wash with 10 ml of 1X PBS
without Ca or Mg (ATCC® SCRR-2201). 4. Add 5 ml of 0.25 % Trypsin/0.53 mM EDTA (ATCC® 30-2101). 5. Incubate at 37 °C for ~2 minutes or until cells detach. Lightly tap the sides of
each flask to help detach cells. 6. Inactivate the trypsin with an equal volume of medium containing serum. 7. Pipette the cell suspension in order to form a single cell suspension. 8. Spin down the cells at 270 g for 5 minutes. 9. Remove the supernatant and resuspend the cells in ES medium. 10. Add the cell suspension back into the old flasks and incubate for 15-30
minutes. 11. Collect the cells from the flasks into one or more 50 ml tubes. 12. Rinse each flask lightly with 5 ml of ES medium without LIF and add the
additional volume to the tubes. Try to leave the MEFs behind. 13. Perform a cell count to determine the number of ES cells.
212
Protocols Cell Culture and Differentiation ________________________________________________________________________
14. Seed the cells (2 x 10⁶/dish) onto fibroblast-free, 10 cm Corning Ultra-Low-Attachment Dishes (Corning Catalog No. 3262) containing 10 ml of ES medium without LIF.
15. Add additional ES medium without LIF to each dish to bring the final volume to 15 ml.
16. After 24 hours, change the medium. a. Spin EBs down at 270 g for 5 minutes. Keep the dishes for later. b. Remove the supernatant and resuspend in 10 ml of ES medium
without LIF. c. Add 15 ml of ES medium without LIF to each of the 10 dishes. d. Evenly distribute the EBs among the dishes (1 ml per dish).
17. Continue to culture the EBs and change the medium every other day. Except for the first medium change, change the medium by tilting the dish so that the EBs settle and remove as much medium as possible without removing the EBs. Replace the volume removed with fresh medium without LIF.
18. EBs will spontaneously differentiate and can be collected at various time points for analysis by flow cytometry or immunostaining.
19. For long-term EB culture, it is recommended that you transfer the EBs to new dishes at day 14.
9.9.2 Protocol for Differentiation in Methylcellulose Based Medium (kindly provided by Anna Melidoni, adapted from Stem Cell Technologies)
1. Using panning method to separate ES cells from feeder cells. 2. Preparing differentiation medium, vortexing thoroughly, letting it sit for 5-10
min, repeat vortexing. 3. Preparing two small dishes for cell solution (1.5 ml each) with one open dish
of distilled H2O (3 ml) together in one big dish. 4. After panning, take off medium (containing ES cells), count directly, use only
the amount of cells you need, this might be very low. Spin down and resuspend in IMDM medium + FBS.
5. Final seeding concentration for differentiation: 1.5x10⁴ cells/ml. 6. Take 1ml of this and mix 10 ml of Methylcellolose-based differentiation
medium (or accordingly), vortex solution, let sit. 7. Use 1.2x40 mm syringe (best with blind ends) to distribute 1.5 ml in each
well. To take off differentiated cells grown in Methylcellulose-based medium (after 3.25-3.5 days)
8. Add 1 ml pure IMDM in each well and dilute methylcellulose based medium, collect content of all wells in 50 ml centrifuge tube.
9. Centrifuge at 200 g for 5 min.
213

Protocols Cell Culture and Differentiation ________________________________________________________________________
214
10. Take off only half of the supernatant diluted methylcellulose-based medium (cells might still stuck in the rest), fill up with medium, mix, spin down at 200 g for 3 min.
11. Take off all supernatant methylcellulose-based medium, resuspend in PBS, spin down again at 200 g for 3 min.
12. Re-suspend in 200 µl of trypsin, wait ca 2 min, check under hemacytometer if cells are all single cells, if yes, add medium containing FBS, spin down at 200 g for 3 min.
13. Re-suspend in ES medium without LIF.