Embed Size (px)
Citation preview
Pradhananga and Teizer Visualization in Engineering (2015) 3:12 DOI 10.1186/s40327-015-0025-3
RESEARCH Open Access
Cell-based construction site simulationmodel for earthmoving operations usingreal-time equipment location data
Nipesh Pradhananga1 and Jochen Teizer2*Abstract
Background: Simulation is a proven technique for effective construction site layout planning and heavy equipmentresource optimization. Traditional simulation uses historical data as input for task durations. Data is fed into activitycycle diagrams which many times do not consider any of the rapidly changing spatial constraints that are presenton a construction site. Very little research has been conducted towards more realistic, real-time simulation involvingdata gathering from live actors and documenting the effect of potential changes to such a spatial-temporal workenvironment.
Methods: Cell-based simulation, incorporating continuous spatial changes to the site layout during projectoperations and real-time Global Positioning System (GPS) location tracking data from equipment resources, isintroduced for more realistic and rapid modeling. The potential of analyzing and visualizing the effects of spatialconsideration of varying resource combinations in earthmoving cycles on productivity and site congestion areexplored. It provides insight and awareness in decision making for resource management, site layout and internaltraffic control planning.
Results: The proposed cell-based simulation system handles complex and more realistic scenarios. Various cellparameters were tested in a case study of common earthmoving operations. The advantages of the cell-based overa traditional simulation model include ease of visualization and simplicity in modeling spatial constraints (e.g., ramprestricting traffic to one-way flow). The system provides full control over the flow of resources by using predefinedrules or algorithms. It simplifies the design process since, except for some certain key cells, other ordinary cellsfollowed the same rules without being programmed individually. Future research may involve multiple,non-interacting crews competing for resources and study of time-space conflicts in more detail.
Conclusions: The presented cell-based simulation system is able to model and visualize the cyclic activities ofearthmoving equipment that occur on a construction site in greater detail than previous simulation methods havedone. Using near real-time location data from equipment as input value in the simulation helps construction siteproject engineers, planners, and managers to improve coordination and monitoring of such construction resources.
Keywords: Earthmoving operation; Global positioning system; Heavy equipment resources; Modeling; Real-timelocation tracking; Simulation; Data visualization
* Correspondence: [email protected] Construction Safety and Technology Laboratory, Ettlingen, GermanyFull list of author information is available at the end of the article
© 2015 Pradhananga and Teizer. This is an Open Access article distributed under the terms of the Creative CommonsAttribution License (http://creativecommons.org/licenses/by/4.0), which permits unrestricted use, distribution, and reproductionin any medium, provided the original work is properly credited.
Pradhananga and Teizer Visualization in Engineering (2015) 3:12 Page 2 of 16
IntroductionSimulating earthmoving operations is a classic exampleof simulation in construction engineering and manage-ment. Although it is done primarily to optimize theproductivity of cycling resources (e.g. dump trucks), itmainly assists decision making by estimating the rightnumbers of required resources that perform a task. Thetraditional way of developing a simulation model hasbeen using Activity Cycle Diagrams (ACDs). ACDs areprecedence diagrams with connected nodes representingthe resources and activities (Martinez 2001). A queue ofevents is generated in such simulation models. Thesimulation is event driven and conditions are checkedonly when an event occurs in the queue. Such diagramseasily get complicated when the number of events in-creases or the numbers of conditions grow. Besides,these diagrams do not consider spatial constraints onsite and large effort has to be put into the diagrams toincorporate space as a resource.Space on many of today’s construction sites is a rare
commodity. As resources and activities need to bescheduled based on existing spatial constraints, con-struction site layout plays an important role for the suc-cess of project operation execution. Planning throughsimulation often involves identifying problems and op-portunities of existing construction site environmentsahead of time (Ning et al. 2011). Common construction siteconditions, like congestion and proximity among compet-ing trades and resources, cannot be handled if spatial con-straints are not taken into account. Cell-based systems haveproven to be very effective for modeling complex systemsinvolving spatial considerations (Mitchell 2009).This article describes a framework for developing a
cell-based simulation model for cyclic earthmoving oper-ations. There are myriads of benefits of choosing cell-based system over traditional ACDs. Firstly, cell-basedsystems are known for the ease in modeling complexsystems. Unlike traditional simulation where the activ-ities or resources act as entities, each cell in a cell-basedsystem can update its state based on predefined condi-tions. Construction resources that occupy cells in thegrid and move to adjacent cells, follow a calculated path.The cells interact with the neighbor cells and affect theirstate based on the neighbors. Since spatial considerationare taken into account in the presented study, locationdata from resources can be directly related to the cellsfor the input analysis. This study also presents a novelapproach towards visualization of the entire simulationwithout any additional effort. Occupancy of cells alreadygive the location of the resources at any given time inthe simulation.This article is organized as follows: it first synthesizes
the relevant literature in the field of simulation. It then de-scribes the methods for developing a cell-based simulation
system for an earthmoving operation. The article intro-duces into technology for real-time location tracking,error measurements, and also outlines the parameters thatneed to be considered for modeling the cells and algo-rithms. Experiments to a field trial of the developed cell-based simulation model are presented. Results to programthe truck load cycles, analyze, and visualize the output forenhanced decision making are explained. The articleconcludes with a discussion and future research needs.
BackgroundTypical construction earthmoving operations are repeti-tive in nature and activities are generally performed incycles. Hence, Activity Cycle Diagram (ACD)-basedsimulation models are very common applications in theconstruction industry. Event generation mechanism inan ACD is based on activity scanning of each instance.The CYClic Operations NEtwork (CYCLONE) model,developed by Halpin (1977), focuses on the typical cyclicconstruction operation. State and Resource Based Simula-tion of Construction Processes (STROBOSCOPE), devel-oped by Martinez (1996), represents a newer generationsystem for construction simulation based on ACDs.Other tools, like Hajjar and AbouRizk (1999) introducedSIMPHONY, have been developed focusing on specialpurpose simulation. These systems provide services thatdevelopers can use to control different system behaviors.They also provide platforms for the graphical represen-tation of operations, animations, and statistical tools forinput and output data. Templates in these systems pro-vide a user-friendly environment, for example, thedifferent construction operations exist as blocks forbuilding new simulation systems. Even non-simulationexperts easily comprehend the functionality of thesesystems. However, these systems do not consider spatialconstraints or spatial interactions among resources,which can be a crucial factor in resource optimization.To resolve these shortcomings, Kamat and Martinez(2001) created a system that coupled ACD-based simula-tion results with 3D visualization for the purpose ofdetecting potential operational risks. Although some basicspatial reference was introduced into the simulation, thesystem cannot handle space-optimization problems.Another approach of simulating a model is to build
complex systems using Cellular Automata. The conceptwas developed by Mitchell in the 1940s (Mitchell 2009).A theory for Discrete-Event systems Specification (DEVS)was defined by Zeigler (1976) as a formal method forbuilding models in a hierarchical and modular approach.This method is based on a cell space model consisting ofan infinite set of geometrically defined cells. Each cell canhave many layers corresponding to the attributes that thecell might have. The behaviors of the cells depend uponthe state of neighbor cells in the system. The cell-based
Pradhananga and Teizer Visualization in Engineering (2015) 3:12 Page 3 of 16
approach was further explored by Wainer (2009) for thedevelopment of Cell-DEVS. This approach considered cellspaces as discrete event models and allowed easier ways tomodel a complex system. A toolkit called CD++ exploredthis approach further and has already been implementedin many different types of applications.Cellular Automata (CA) has been used to model and
solve problems in a wide variety of science fields (Wolfram2002). It has been applied in developing games (Nowak andMay 1993), parallel computing and nanometer-scale clas-sical computing (Benjamin and Johnson 1997), modelingphysical and biological systems in nature (Toffoli 1984),social sciences (Albin 1975), and music (Burraston et al.2004). In the context of civil engineering, CA has beensuccessfully implemented in structure analysis and de-sign (Missoum et al. 2005), traffic modeling and control(Gershenson and Rosenblueth 2011; Smith et al. 1995),water distribution systems (Keedwell and Khu 2006),and environmental and urban planning models (Li andYeh 2000). The use of cell-based simulation in constructionoperations is relatively new. Zhang et al. (2007) imple-mented a cell-based modeling approach for spatially distrib-uted resources in a construction site. They also describedsteps for creating a cell-based model and demonstrated acase study of a bridge re-decking process. The case studyinvolved removing old and installing new panel sections.The feasibility of the approach was tested for constructionenvironments by comparing the results to those obtainedfrom MicroCYCLONE. Hammad and Zhang (2011)conducted a feasibility study using small scaled, physicalequipment models for construction equipment collisiondetection. The study’s objective was to overcome drawbacksin traditional simulation modeling that use historical, statis-tical data instead of real data from the site. The researchalso concluded that spatio-temporal representation of re-sources has potential to enhance safety analysis. By feedingreal-time data into a simulation model, instant model ad-justments can represent the real work environment.
MethodsSystem descriptionFor this project, the System Under Investigation (SUI) isa construction operation involving earth moving activity.A typical earthmoving operation involves excavation,hauling dirt, and piling up the dirt at a different site.The excavation site was modeled and the activities oc-curring at an excavation pit were studied. The differententities involved in the SUI are described next.
Study siteThe size of the construction site for an academic officeand laboratory facility was approximately 120 m ×100 m. The total excavation volume had been estimatedat approximately 30,500 m3 of clay earth. The excavation
lasted over the winter for 5 months. The excavationprocess was interrupted several times because of badweather (e.g., rain) and for other reasons. The site con-tained general site infrastructure, e.g., the excavation pit,temporary driveways, an entry and exit ramp into the pitonce the excavation depth was deep enough, trailers forthe site office, several material lay down and storageareas, and restrooms.
ResourcesThe construction resources present at the site wereequipment, workers, materials and space. The equipmentinvolved in the earthmoving operation was assessed and anumber of “excavators” and “dump trucks” were selectedas the prime focus of this simulation model. Workers-on-foot were involved, but their prime duty was only tocoordinate the operation. Since they were not directlyinvolved in the operation they were not included intothe simulation. The operation involves clay dirt as amaterial. For the simulation, an unlimited availability ofdirt is assumed. Space is considered as a resource that isused by other resources and will be optimized. Thenumber of excavators varied between one and two on adaily basis. A tracked loader with a bucket was also usedto load the dump trucks. The number of available dumptrucks ranged from 10 to 20 on a given day. The capacityof each truck was 9 m3. The bucket of an excavator held1.5 m3 of dirt when the load was flush with the bucket’ssides. The same loading capacity was assumed for thetrack loader. However, their capacity under a heapedcapacity is more like 2 m3.
Construction operationAn earthmoving operation consists of four major activities,namely, “loading”, “hauling”, “unloading” and “returning”.In this particular case, loading involves the excavatormaking swings to fill the bucket and pour the dirt intothe truck bed to fill it. A swing involves filling thebucket with the dirt from the site and dumping it ontothe truck. Hauling involves the movement of the dumptruck from the point where it gets loaded by an excavatorto the point where it unloads the dirt. Unloading involvesthe truck unloading its dirt at the dump site and returningto the excavator for the next trip, which is called “return-ing”. Figure 1 shows three of these four activities (returning,loading and hauling) at the actual site under consideration.The unloading activity has not been considered for thisstudy because the unloading occurred outside the observedwork zone. The same excavators and trucks repeatedlyperformed the operations throughout the observation time.
DatasetGlobal Positioning System (GPS) data loggers were at-tached to the excavators throughout the day. For the
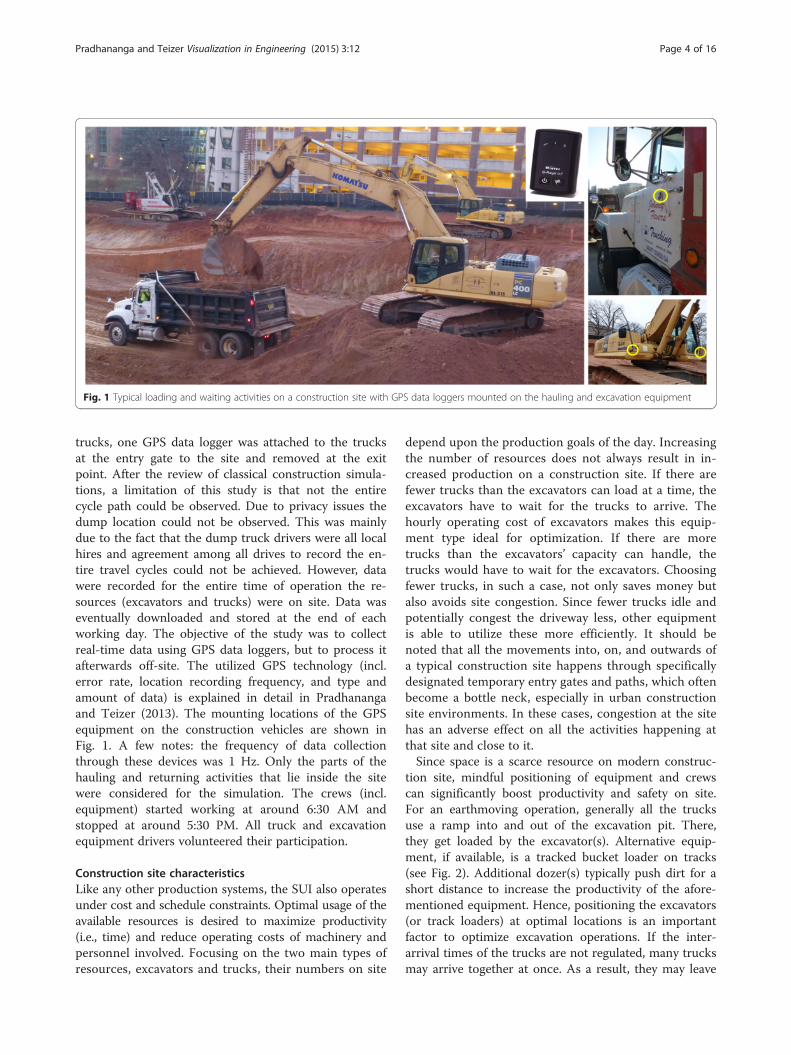
Fig. 1 Typical loading and waiting activities on a construction site with GPS data loggers mounted on the hauling and excavation equipment
Pradhananga and Teizer Visualization in Engineering (2015) 3:12 Page 4 of 16
trucks, one GPS data logger was attached to the trucksat the entry gate to the site and removed at the exitpoint. After the review of classical construction simula-tions, a limitation of this study is that not the entirecycle path could be observed. Due to privacy issues thedump location could not be observed. This was mainlydue to the fact that the dump truck drivers were all localhires and agreement among all drives to record the en-tire travel cycles could not be achieved. However, datawere recorded for the entire time of operation the re-sources (excavators and trucks) were on site. Data waseventually downloaded and stored at the end of eachworking day. The objective of the study was to collectreal-time data using GPS data loggers, but to process itafterwards off-site. The utilized GPS technology (incl.error rate, location recording frequency, and type andamount of data) is explained in detail in Pradhanangaand Teizer (2013). The mounting locations of the GPSequipment on the construction vehicles are shown inFig. 1. A few notes: the frequency of data collectionthrough these devices was 1 Hz. Only the parts of thehauling and returning activities that lie inside the sitewere considered for the simulation. The crews (incl.equipment) started working at around 6:30 AM andstopped at around 5:30 PM. All truck and excavationequipment drivers volunteered their participation.
Construction site characteristicsLike any other production systems, the SUI also operatesunder cost and schedule constraints. Optimal usage of theavailable resources is desired to maximize productivity(i.e., time) and reduce operating costs of machinery andpersonnel involved. Focusing on the two main types ofresources, excavators and trucks, their numbers on site
depend upon the production goals of the day. Increasingthe number of resources does not always result in in-creased production on a construction site. If there arefewer trucks than the excavators can load at a time, theexcavators have to wait for the trucks to arrive. Thehourly operating cost of excavators makes this equip-ment type ideal for optimization. If there are moretrucks than the excavators’ capacity can handle, thetrucks would have to wait for the excavators. Choosingfewer trucks, in such a case, not only saves money butalso avoids site congestion. Since fewer trucks idle andpotentially congest the driveway less, other equipmentis able to utilize these more efficiently. It should benoted that all the movements into, on, and outwards ofa typical construction site happens through specificallydesignated temporary entry gates and paths, which oftenbecome a bottle neck, especially in urban constructionsite environments. In these cases, congestion at the sitehas an adverse effect on all the activities happening atthat site and close to it.Since space is a scarce resource on modern construc-
tion site, mindful positioning of equipment and crewscan significantly boost productivity and safety on site.For an earthmoving operation, generally all the trucksuse a ramp into and out of the excavation pit. There,they get loaded by the excavator(s). Alternative equip-ment, if available, is a tracked bucket loader on tracks(see Fig. 2). Additional dozer(s) typically push dirt for ashort distance to increase the productivity of the afore-mentioned equipment. Hence, positioning the excavators(or track loaders) at optimal locations is an importantfactor to optimize excavation operations. If the inter-arrival times of the trucks are not regulated, many trucksmay arrive together at once. As a result, they may leave
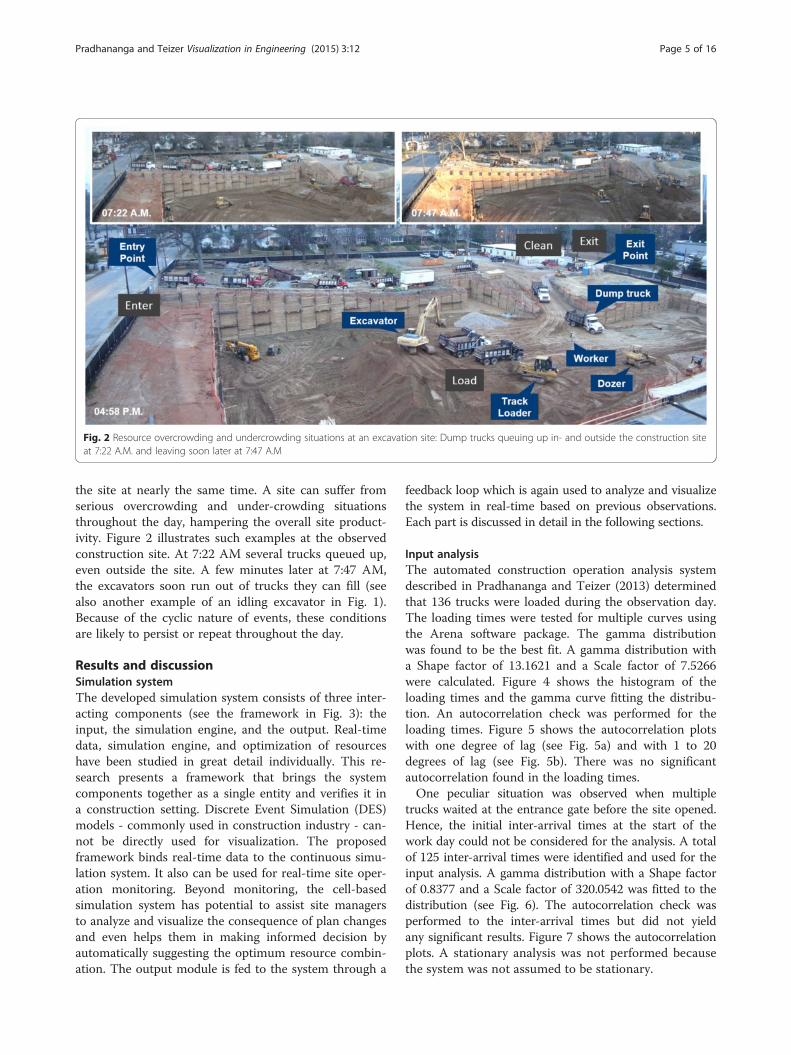
Fig. 2 Resource overcrowding and undercrowding situations at an excavation site: Dump trucks queuing up in- and outside the construction siteat 7:22 A.M. and leaving soon later at 7:47 A.M
Pradhananga and Teizer Visualization in Engineering (2015) 3:12 Page 5 of 16
the site at nearly the same time. A site can suffer fromserious overcrowding and under-crowding situationsthroughout the day, hampering the overall site product-ivity. Figure 2 illustrates such examples at the observedconstruction site. At 7:22 AM several trucks queued up,even outside the site. A few minutes later at 7:47 AM,the excavators soon run out of trucks they can fill (seealso another example of an idling excavator in Fig. 1).Because of the cyclic nature of events, these conditionsare likely to persist or repeat throughout the day.
Results and discussionSimulation systemThe developed simulation system consists of three inter-acting components (see the framework in Fig. 3): theinput, the simulation engine, and the output. Real-timedata, simulation engine, and optimization of resourceshave been studied in great detail individually. This re-search presents a framework that brings the systemcomponents together as a single entity and verifies it ina construction setting. Discrete Event Simulation (DES)models - commonly used in construction industry - can-not be directly used for visualization. The proposedframework binds real-time data to the continuous simu-lation system. It also can be used for real-time site oper-ation monitoring. Beyond monitoring, the cell-basedsimulation system has potential to assist site managersto analyze and visualize the consequence of plan changesand even helps them in making informed decision byautomatically suggesting the optimum resource combin-ation. The output module is fed to the system through a
feedback loop which is again used to analyze and visualizethe system in real-time based on previous observations.Each part is discussed in detail in the following sections.
Input analysisThe automated construction operation analysis systemdescribed in Pradhananga and Teizer (2013) determinedthat 136 trucks were loaded during the observation day.The loading times were tested for multiple curves usingthe Arena software package. The gamma distributionwas found to be the best fit. A gamma distribution witha Shape factor of 13.1621 and a Scale factor of 7.5266were calculated. Figure 4 shows the histogram of theloading times and the gamma curve fitting the distribu-tion. An autocorrelation check was performed for theloading times. Figure 5 shows the autocorrelation plotswith one degree of lag (see Fig. 5a) and with 1 to 20degrees of lag (see Fig. 5b). There was no significantautocorrelation found in the loading times.One peculiar situation was observed when multiple
trucks waited at the entrance gate before the site opened.Hence, the initial inter-arrival times at the start of thework day could not be considered for the analysis. A totalof 125 inter-arrival times were identified and used for theinput analysis. A gamma distribution with a Shape factorof 0.8377 and a Scale factor of 320.0542 was fitted to thedistribution (see Fig. 6). The autocorrelation check wasperformed to the inter-arrival times but did not yieldany significant results. Figure 7 shows the autocorrelationplots. A stationary analysis was not performed becausethe system was not assumed to be stationary.
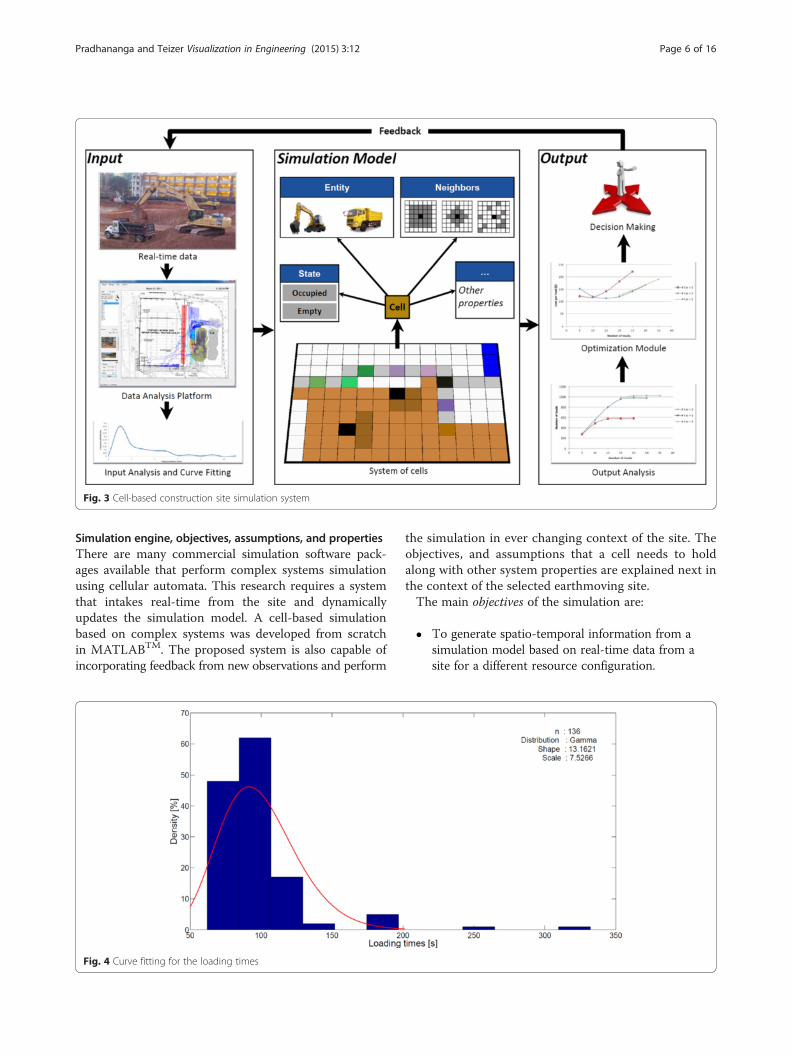
Fig. 3 Cell-based construction site simulation system
Pradhananga and Teizer Visualization in Engineering (2015) 3:12 Page 6 of 16
Simulation engine, objectives, assumptions, and propertiesThere are many commercial simulation software pack-ages available that perform complex systems simulationusing cellular automata. This research requires a systemthat intakes real-time from the site and dynamicallyupdates the simulation model. A cell-based simulationbased on complex systems was developed from scratchin MATLABTM. The proposed system is also capable ofincorporating feedback from new observations and perform
Fig. 4 Curve fitting for the loading times
the simulation in ever changing context of the site. Theobjectives, and assumptions that a cell needs to holdalong with other system properties are explained next inthe context of the selected earthmoving site.The main objectives of the simulation are:
� To generate spatio-temporal information from asimulation model based on real-time data from asite for a different resource configuration.
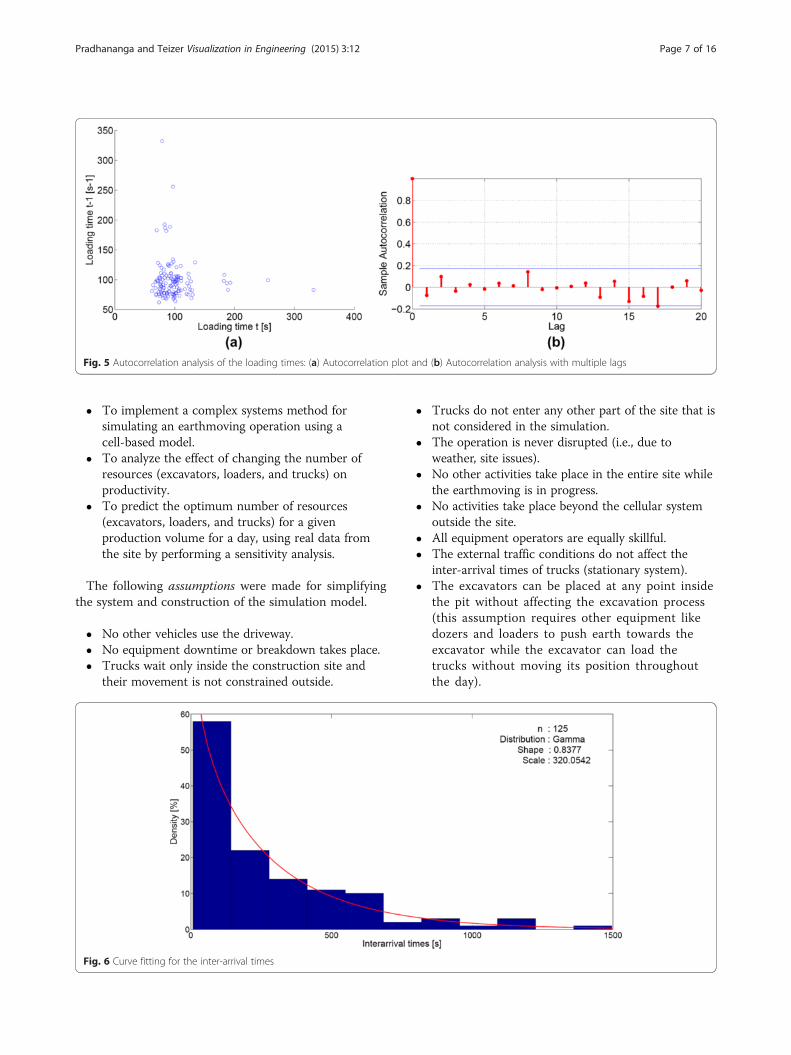
Fig. 5 Autocorrelation analysis of the loading times: (a) Autocorrelation plot and (b) Autocorrelation analysis with multiple lags
Pradhananga and Teizer Visualization in Engineering (2015) 3:12 Page 7 of 16
� To implement a complex systems method forsimulating an earthmoving operation using acell-based model.
� To analyze the effect of changing the number ofresources (excavators, loaders, and trucks) onproductivity.
� To predict the optimum number of resources(excavators, loaders, and trucks) for a givenproduction volume for a day, using real data fromthe site by performing a sensitivity analysis.
The following assumptions were made for simplifyingthe system and construction of the simulation model.
� No other vehicles use the driveway.� No equipment downtime or breakdown takes place.� Trucks wait only inside the construction site and
their movement is not constrained outside.
Fig. 6 Curve fitting for the inter-arrival times
� Trucks do not enter any other part of the site that isnot considered in the simulation.
� The operation is never disrupted (i.e., due toweather, site issues).
� No other activities take place in the entire site whilethe earthmoving is in progress.
� No activities take place beyond the cellular systemoutside the site.
� All equipment operators are equally skillful.� The external traffic conditions do not affect the
inter-arrival times of trucks (stationary system).� The excavators can be placed at any point inside
the pit without affecting the excavation process(this assumption requires other equipment likedozers and loaders to push earth towards theexcavator while the excavator can load thetrucks without moving its position throughoutthe day).
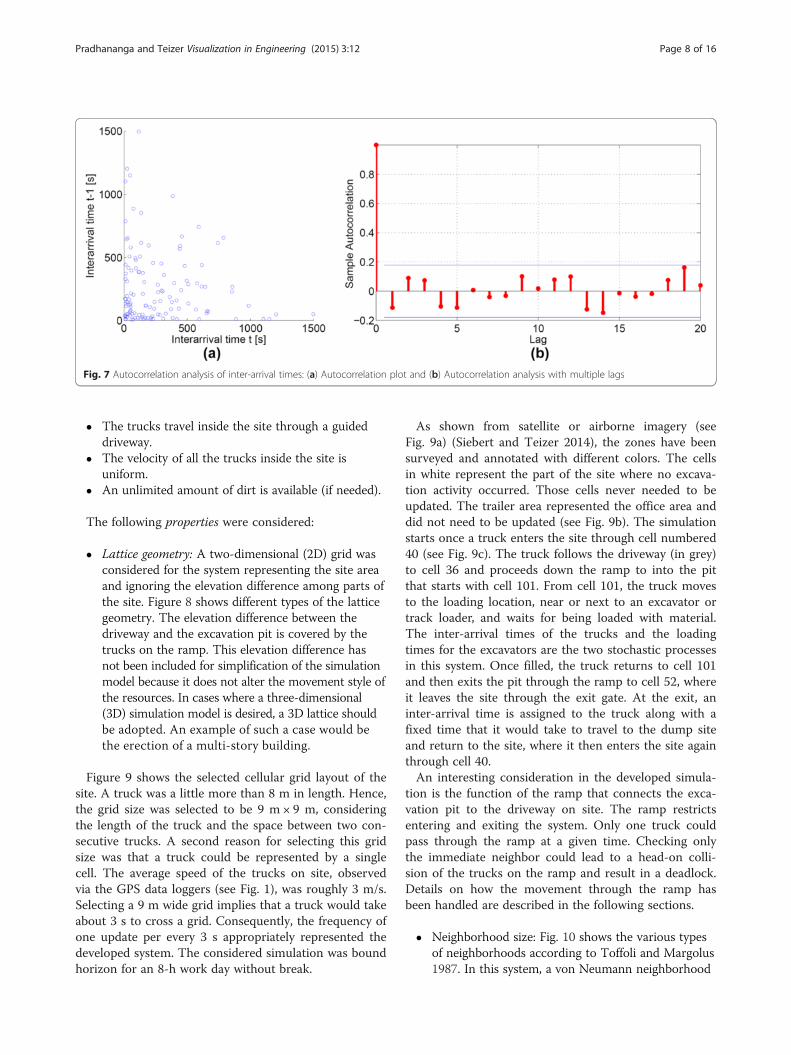
Fig. 7 Autocorrelation analysis of inter-arrival times: (a) Autocorrelation plot and (b) Autocorrelation analysis with multiple lags
Pradhananga and Teizer Visualization in Engineering (2015) 3:12 Page 8 of 16
� The trucks travel inside the site through a guideddriveway.
� The velocity of all the trucks inside the site isuniform.
� An unlimited amount of dirt is available (if needed).
The following properties were considered:
� Lattice geometry: A two-dimensional (2D) grid wasconsidered for the system representing the site areaand ignoring the elevation difference among parts ofthe site. Figure 8 shows different types of the latticegeometry. The elevation difference between thedriveway and the excavation pit is covered by thetrucks on the ramp. This elevation difference hasnot been included for simplification of the simulationmodel because it does not alter the movement style ofthe resources. In cases where a three-dimensional(3D) simulation model is desired, a 3D lattice shouldbe adopted. An example of such a case would bethe erection of a multi-story building.
Figure 9 shows the selected cellular grid layout of thesite. A truck was a little more than 8 m in length. Hence,the grid size was selected to be 9 m × 9 m, consideringthe length of the truck and the space between two con-secutive trucks. A second reason for selecting this gridsize was that a truck could be represented by a singlecell. The average speed of the trucks on site, observedvia the GPS data loggers (see Fig. 1), was roughly 3 m/s.Selecting a 9 m wide grid implies that a truck would takeabout 3 s to cross a grid. Consequently, the frequency ofone update per every 3 s appropriately represented thedeveloped system. The considered simulation was boundhorizon for an 8-h work day without break.
As shown from satellite or airborne imagery (seeFig. 9a) (Siebert and Teizer 2014), the zones have beensurveyed and annotated with different colors. The cellsin white represent the part of the site where no excava-tion activity occurred. Those cells never needed to beupdated. The trailer area represented the office area anddid not need to be updated (see Fig. 9b). The simulationstarts once a truck enters the site through cell numbered40 (see Fig. 9c). The truck follows the driveway (in grey)to cell 36 and proceeds down the ramp to into the pitthat starts with cell 101. From cell 101, the truck movesto the loading location, near or next to an excavator ortrack loader, and waits for being loaded with material.The inter-arrival times of the trucks and the loadingtimes for the excavators are the two stochastic processesin this system. Once filled, the truck returns to cell 101and then exits the pit through the ramp to cell 52, whereit leaves the site through the exit gate. At the exit, aninter-arrival time is assigned to the truck along with afixed time that it would take to travel to the dump siteand return to the site, where it then enters the site againthrough cell 40.An interesting consideration in the developed simula-
tion is the function of the ramp that connects the exca-vation pit to the driveway on site. The ramp restrictsentering and exiting the system. Only one truck couldpass through the ramp at a given time. Checking onlythe immediate neighbor could lead to a head-on colli-sion of the trucks on the ramp and result in a deadlock.Details on how the movement through the ramp hasbeen handled are described in the following sections.
� Neighborhood size: Fig. 10 shows the various typesof neighborhoods according to Toffoli and Margolus1987. In this system, a von Neumann neighborhood
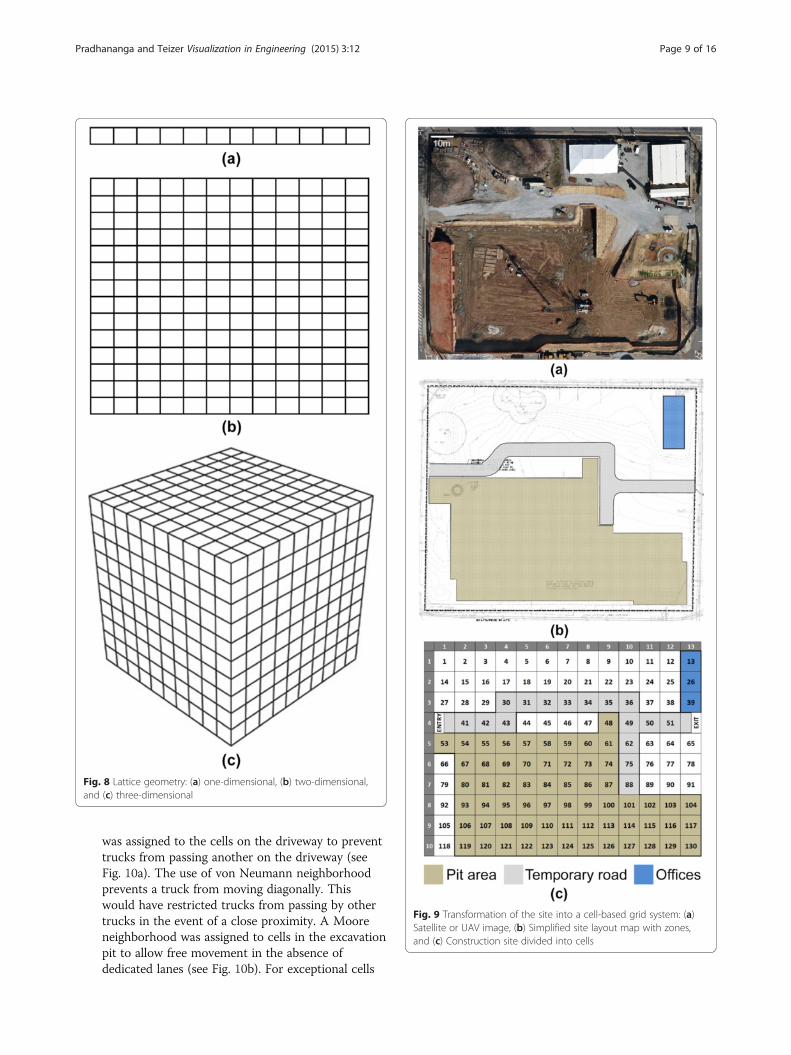
Fig. 8 Lattice geometry: (a) one-dimensional, (b) two-dimensional,and (c) three-dimensional
Fig. 9 Transformation of the site into a cell-based grid system: (a)Satellite or UAV image, (b) Simplified site layout map with zones,and (c) Construction site divided into cells
Pradhananga and Teizer Visualization in Engineering (2015) 3:12 Page 9 of 16
was assigned to the cells on the driveway to preventtrucks from passing another on the driveway (seeFig. 10a). The use of von Neumann neighborhoodprevents a truck from moving diagonally. Thiswould have restricted trucks from passing by othertrucks in the event of a close proximity. A Mooreneighborhood was assigned to cells in the excavationpit to allow free movement in the absence ofdedicated lanes (see Fig. 10b). For exceptional cells
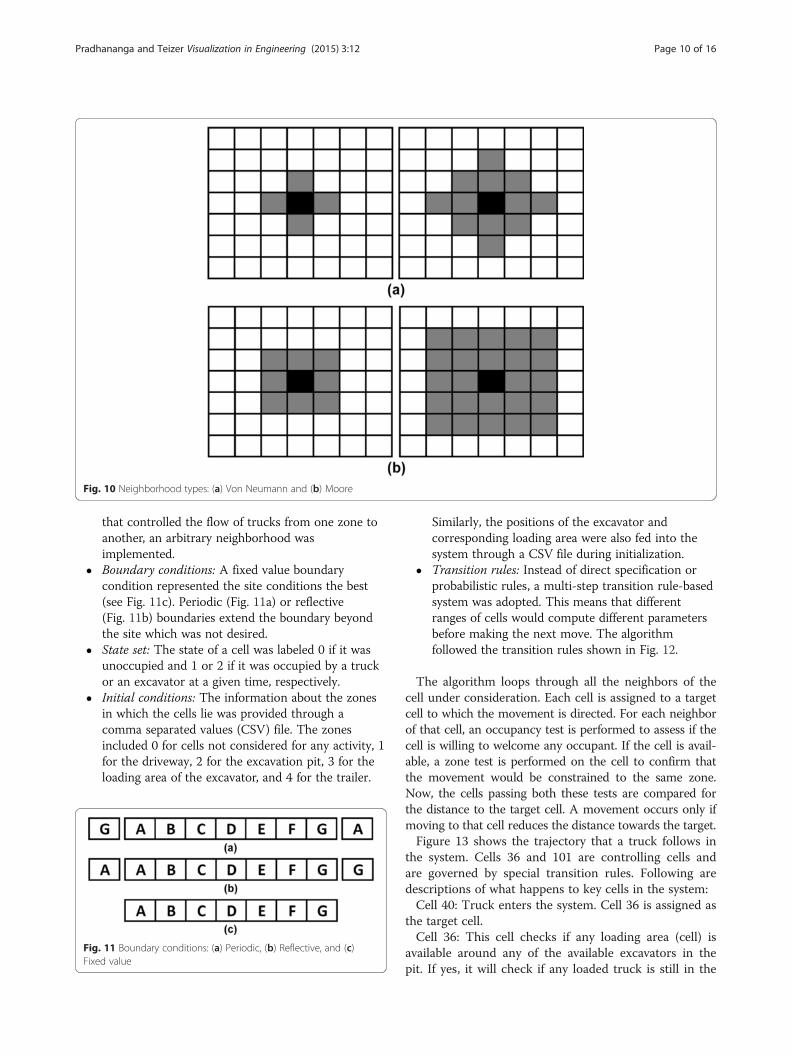
Fig. 10 Neighborhood types: (a) Von Neumann and (b) Moore
Pradhananga and Teizer Visualization in Engineering (2015) 3:12 Page 10 of 16
that controlled the flow of trucks from one zone toanother, an arbitrary neighborhood wasimplemented.
� Boundary conditions: A fixed value boundarycondition represented the site conditions the best(see Fig. 11c). Periodic (Fig. 11a) or reflective(Fig. 11b) boundaries extend the boundary beyondthe site which was not desired.
� State set: The state of a cell was labeled 0 if it wasunoccupied and 1 or 2 if it was occupied by a truckor an excavator at a given time, respectively.
� Initial conditions: The information about the zonesin which the cells lie was provided through acomma separated values (CSV) file. The zonesincluded 0 for cells not considered for any activity, 1for the driveway, 2 for the excavation pit, 3 for theloading area of the excavator, and 4 for the trailer.
Fig. 11 Boundary conditions: (a) Periodic, (b) Reflective, and (c)Fixed value
Similarly, the positions of the excavator andcorresponding loading area were also fed into thesystem through a CSV file during initialization.
� Transition rules: Instead of direct specification orprobabilistic rules, a multi-step transition rule-basedsystem was adopted. This means that differentranges of cells would compute different parametersbefore making the next move. The algorithmfollowed the transition rules shown in Fig. 12.
The algorithm loops through all the neighbors of thecell under consideration. Each cell is assigned to a targetcell to which the movement is directed. For each neighborof that cell, an occupancy test is performed to assess if thecell is willing to welcome any occupant. If the cell is avail-able, a zone test is performed on the cell to confirm thatthe movement would be constrained to the same zone.Now, the cells passing both these tests are compared forthe distance to the target cell. A movement occurs only ifmoving to that cell reduces the distance towards the target.Figure 13 shows the trajectory that a truck follows in
the system. Cells 36 and 101 are controlling cells andare governed by special transition rules. Following aredescriptions of what happens to key cells in the system:Cell 40: Truck enters the system. Cell 36 is assigned as
the target cell.Cell 36: This cell checks if any loading area (cell) is
available around any of the available excavators in thepit. If yes, it will check if any loaded truck is still in the
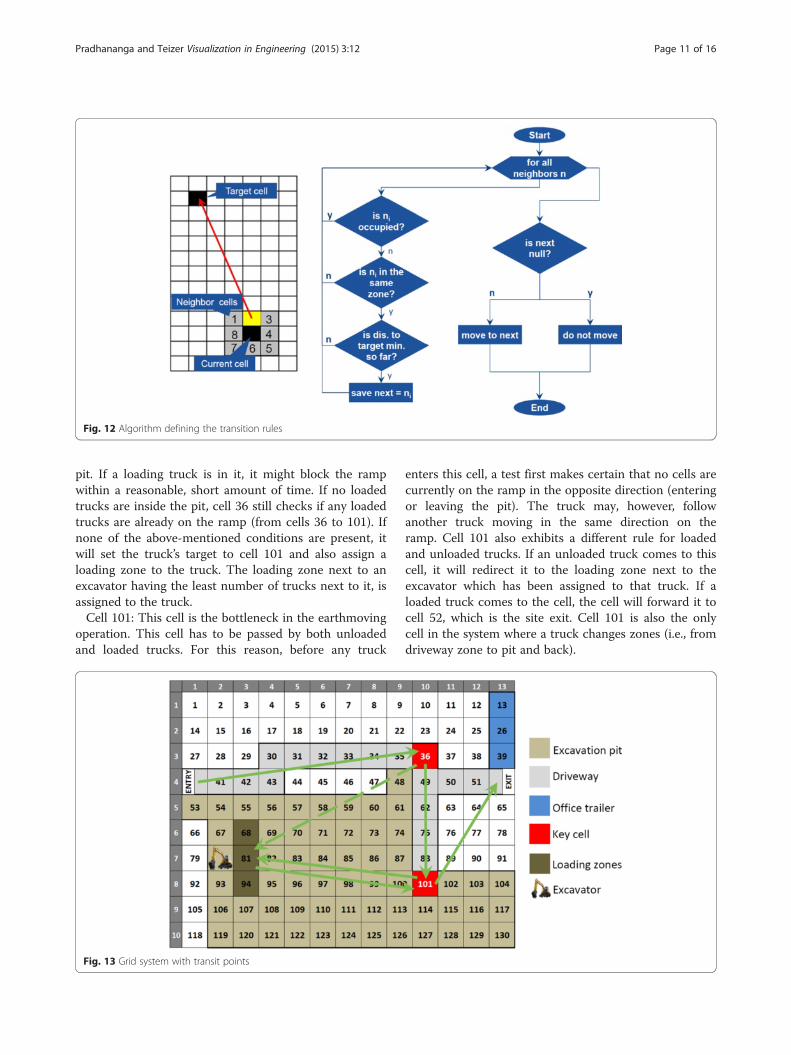
Fig. 12 Algorithm defining the transition rules
Pradhananga and Teizer Visualization in Engineering (2015) 3:12 Page 11 of 16
pit. If a loading truck is in it, it might block the rampwithin a reasonable, short amount of time. If no loadedtrucks are inside the pit, cell 36 still checks if any loadedtrucks are already on the ramp (from cells 36 to 101). Ifnone of the above-mentioned conditions are present, itwill set the truck’s target to cell 101 and also assign aloading zone to the truck. The loading zone next to anexcavator having the least number of trucks next to it, isassigned to the truck.Cell 101: This cell is the bottleneck in the earthmoving
operation. This cell has to be passed by both unloadedand loaded trucks. For this reason, before any truck
Fig. 13 Grid system with transit points
enters this cell, a test first makes certain that no cells arecurrently on the ramp in the opposite direction (enteringor leaving the pit). The truck may, however, followanother truck moving in the same direction on theramp. Cell 101 also exhibits a different rule for loadedand unloaded trucks. If an unloaded truck comes to thiscell, it will redirect it to the loading zone next to theexcavator which has been assigned to that truck. If aloaded truck comes to the cell, the cell will forward it tocell 52, which is the site exit. Cell 101 is also the onlycell in the system where a truck changes zones (i.e., fromdriveway zone to pit and back).
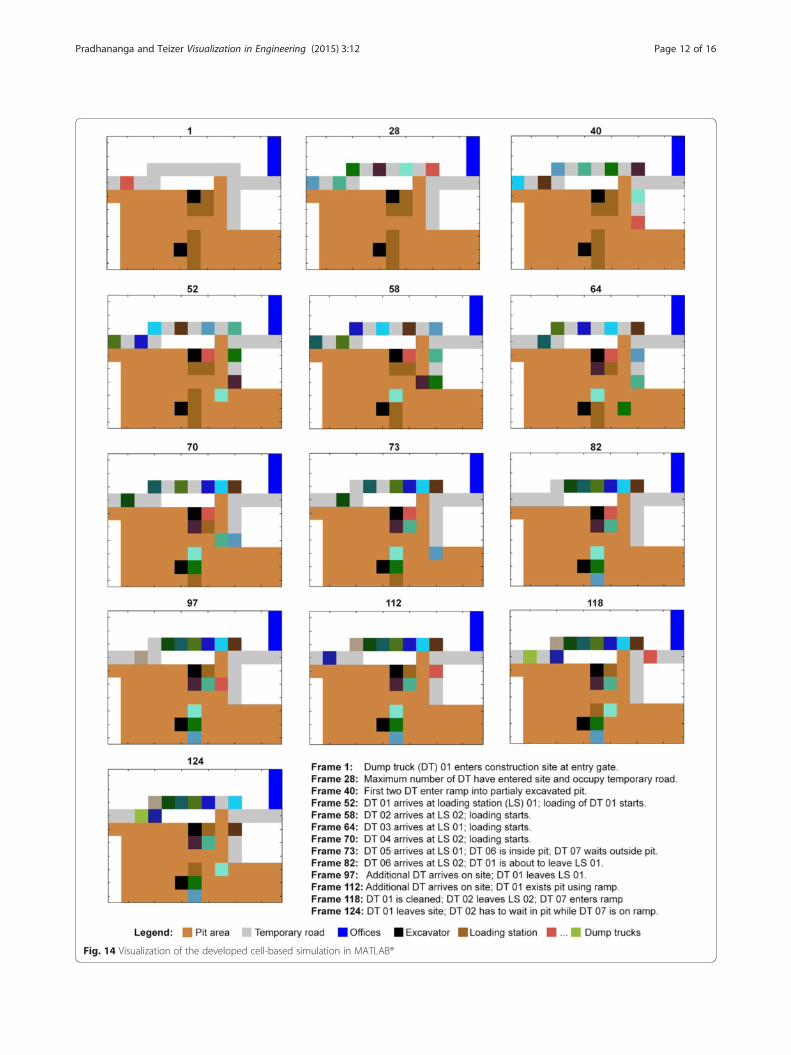
Fig. 14 Visualization of the developed cell-based simulation in MATLAB®
Pradhananga and Teizer Visualization in Engineering (2015) 3:12 Page 12 of 16
Pradhananga and Teizer Visualization in Engineering (2015) 3:12 Page 13 of 16
Cell 52: This is the exit cell. It assigns the next arrivaltime for the truck and moves the truck out of the sys-tem. The trucks arrive at the entry cell (40) based on theinter-arrival time assigned here.
Output analysisThe first advantage of implementing a cell-based systemis that it can visualize the site and resource movementsdirectly without any further processing. Figure 14 visual-izes one instance. The locations of the trucks in all in-stances can be recorded and used for spatio-temporalanalysis, as done in early research work by Pradhanangaand Teizer (2014) and Vasenev et al. (2014).Like traditional simulation models, cell-based models
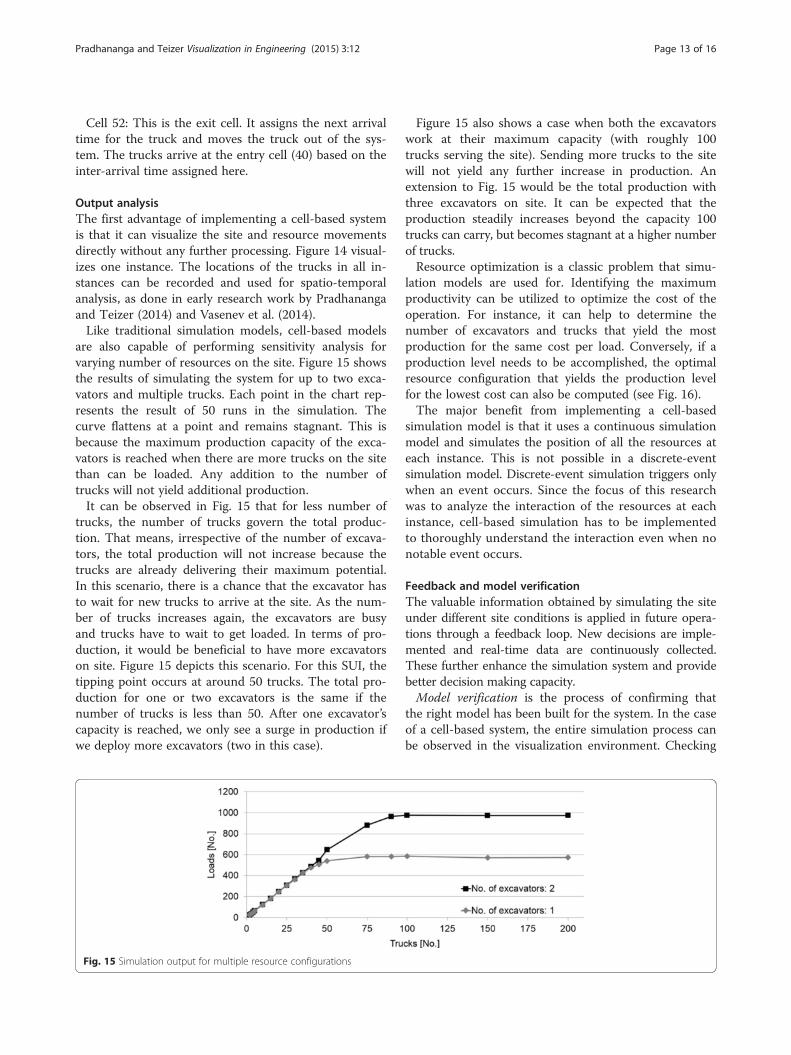
are also capable of performing sensitivity analysis forvarying number of resources on the site. Figure 15 showsthe results of simulating the system for up to two exca-vators and multiple trucks. Each point in the chart rep-resents the result of 50 runs in the simulation. Thecurve flattens at a point and remains stagnant. This isbecause the maximum production capacity of the exca-vators is reached when there are more trucks on the sitethan can be loaded. Any addition to the number oftrucks will not yield additional production.It can be observed in Fig. 15 that for less number of
trucks, the number of trucks govern the total produc-tion. That means, irrespective of the number of excava-tors, the total production will not increase because thetrucks are already delivering their maximum potential.In this scenario, there is a chance that the excavator hasto wait for new trucks to arrive at the site. As the num-ber of trucks increases again, the excavators are busyand trucks have to wait to get loaded. In terms of pro-duction, it would be beneficial to have more excavatorson site. Figure 15 depicts this scenario. For this SUI, thetipping point occurs at around 50 trucks. The total pro-duction for one or two excavators is the same if thenumber of trucks is less than 50. After one excavator’scapacity is reached, we only see a surge in production ifwe deploy more excavators (two in this case).
Fig. 15 Simulation output for multiple resource configurations
Figure 15 also shows a case when both the excavatorswork at their maximum capacity (with roughly 100trucks serving the site). Sending more trucks to the sitewill not yield any further increase in production. Anextension to Fig. 15 would be the total production withthree excavators on site. It can be expected that theproduction steadily increases beyond the capacity 100trucks can carry, but becomes stagnant at a higher numberof trucks.Resource optimization is a classic problem that simu-
lation models are used for. Identifying the maximumproductivity can be utilized to optimize the cost of theoperation. For instance, it can help to determine thenumber of excavators and trucks that yield the mostproduction for the same cost per load. Conversely, if aproduction level needs to be accomplished, the optimalresource configuration that yields the production levelfor the lowest cost can also be computed (see Fig. 16).The major benefit from implementing a cell-based
simulation model is that it uses a continuous simulationmodel and simulates the position of all the resources ateach instance. This is not possible in a discrete-eventsimulation model. Discrete-event simulation triggers onlywhen an event occurs. Since the focus of this researchwas to analyze the interaction of the resources at eachinstance, cell-based simulation has to be implementedto thoroughly understand the interaction even when nonotable event occurs.
Feedback and model verificationThe valuable information obtained by simulating the siteunder different site conditions is applied in future opera-tions through a feedback loop. New decisions are imple-mented and real-time data are continuously collected.These further enhance the simulation system and providebetter decision making capacity.Model verification is the process of confirming that
the right model has been built for the system. In the caseof a cell-based system, the entire simulation process canbe observed in the visualization environment. Checking
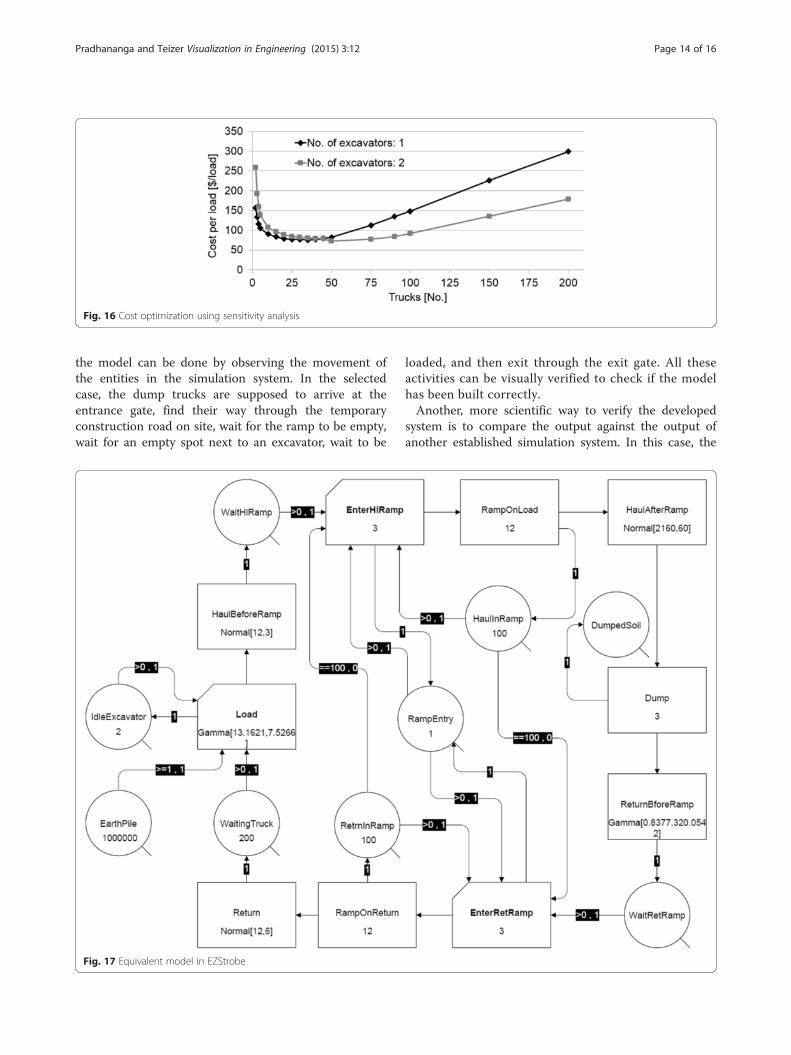
Fig. 16 Cost optimization using sensitivity analysis
Pradhananga and Teizer Visualization in Engineering (2015) 3:12 Page 14 of 16
the model can be done by observing the movement ofthe entities in the simulation system. In the selectedcase, the dump trucks are supposed to arrive at theentrance gate, find their way through the temporaryconstruction road on site, wait for the ramp to be empty,wait for an empty spot next to an excavator, wait to be
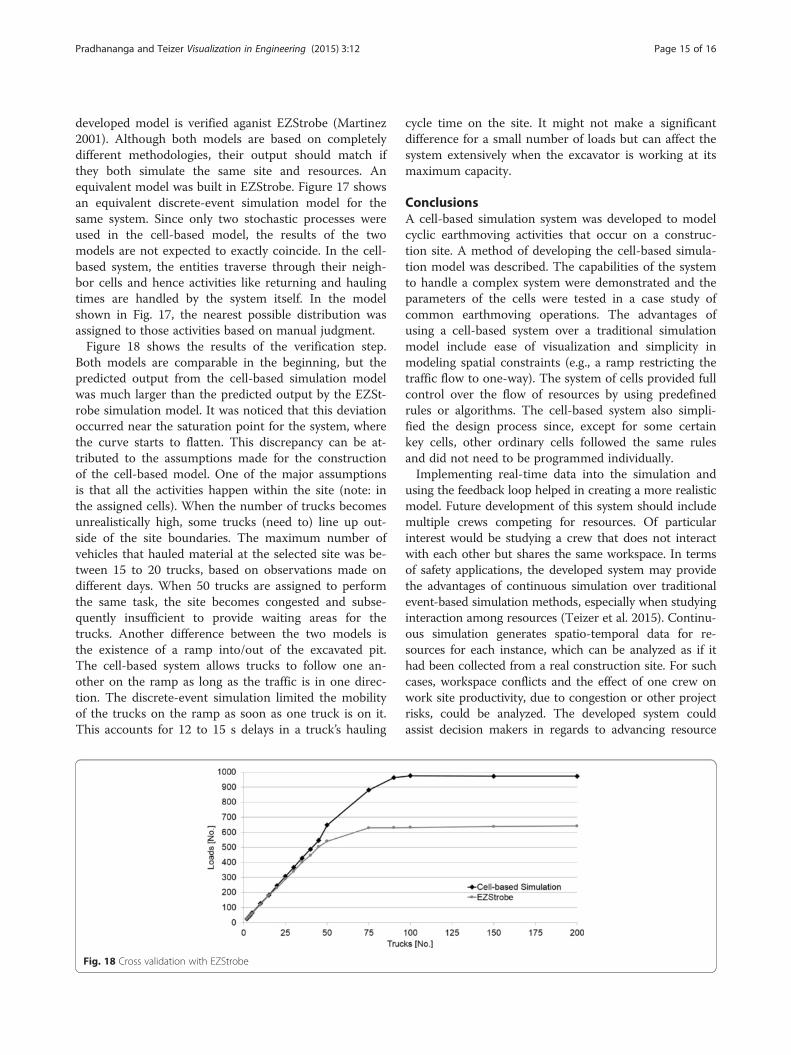
Fig. 17 Equivalent model in EZStrobe
loaded, and then exit through the exit gate. All theseactivities can be visually verified to check if the modelhas been built correctly.Another, more scientific way to verify the developed
system is to compare the output against the output ofanother established simulation system. In this case, the
Pradhananga and Teizer Visualization in Engineering (2015) 3:12 Page 15 of 16
developed model is verified aganist EZStrobe (Martinez2001). Although both models are based on completelydifferent methodologies, their output should match ifthey both simulate the same site and resources. Anequivalent model was built in EZStrobe. Figure 17 showsan equivalent discrete-event simulation model for thesame system. Since only two stochastic processes wereused in the cell-based model, the results of the twomodels are not expected to exactly coincide. In the cell-based system, the entities traverse through their neigh-bor cells and hence activities like returning and haulingtimes are handled by the system itself. In the modelshown in Fig. 17, the nearest possible distribution wasassigned to those activities based on manual judgment.Figure 18 shows the results of the verification step.
Both models are comparable in the beginning, but thepredicted output from the cell-based simulation modelwas much larger than the predicted output by the EZSt-robe simulation model. It was noticed that this deviationoccurred near the saturation point for the system, wherethe curve starts to flatten. This discrepancy can be at-tributed to the assumptions made for the constructionof the cell-based model. One of the major assumptionsis that all the activities happen within the site (note: inthe assigned cells). When the number of trucks becomesunrealistically high, some trucks (need to) line up out-side of the site boundaries. The maximum number ofvehicles that hauled material at the selected site was be-tween 15 to 20 trucks, based on observations made ondifferent days. When 50 trucks are assigned to performthe same task, the site becomes congested and subse-quently insufficient to provide waiting areas for thetrucks. Another difference between the two models isthe existence of a ramp into/out of the excavated pit.The cell-based system allows trucks to follow one an-other on the ramp as long as the traffic is in one direc-tion. The discrete-event simulation limited the mobilityof the trucks on the ramp as soon as one truck is on it.This accounts for 12 to 15 s delays in a truck’s hauling
Fig. 18 Cross validation with EZStrobe
cycle time on the site. It might not make a significantdifference for a small number of loads but can affect thesystem extensively when the excavator is working at itsmaximum capacity.
ConclusionsA cell-based simulation system was developed to modelcyclic earthmoving activities that occur on a construc-tion site. A method of developing the cell-based simula-tion model was described. The capabilities of the systemto handle a complex system were demonstrated and theparameters of the cells were tested in a case study ofcommon earthmoving operations. The advantages ofusing a cell-based system over a traditional simulationmodel include ease of visualization and simplicity inmodeling spatial constraints (e.g., a ramp restricting thetraffic flow to one-way). The system of cells provided fullcontrol over the flow of resources by using predefinedrules or algorithms. The cell-based system also simpli-fied the design process since, except for some certainkey cells, other ordinary cells followed the same rulesand did not need to be programmed individually.Implementing real-time data into the simulation and
using the feedback loop helped in creating a more realisticmodel. Future development of this system should includemultiple crews competing for resources. Of particularinterest would be studying a crew that does not interactwith each other but shares the same workspace. In termsof safety applications, the developed system may providethe advantages of continuous simulation over traditionalevent-based simulation methods, especially when studyinginteraction among resources (Teizer et al. 2015). Continu-ous simulation generates spatio-temporal data for re-sources for each instance, which can be analyzed as if ithad been collected from a real construction site. For suchcases, workspace conflicts and the effect of one crew onwork site productivity, due to congestion or other projectrisks, could be analyzed. The developed system couldassist decision makers in regards to advancing resource
Pradhananga and Teizer Visualization in Engineering (2015) 3:12 Page 16 of 16
allocation and site layout planning. It could also beused as a training tool to allow project managers to be-come familiar with the effects of changing resourcequantity levels on site.
Competing interestsThe authors declare that they have no competing interests.
Authors’ contributionsBoth authors contributed extensively to the work presented in this paper.NP reviewed and analyzed the literature, developed the simulation model,conducted the case study, analyzed the results, and drafted the manuscript.JT coordinated and supervised the entire research process of this study andedited the manuscript. Both authors read and approved the final manuscript.
Author details1OHL School of Construction, College of Engineering and Computing, FloridaState University, 10555 West Flagler Street, Miami, FL 33174, USA. 2RAPIDSConstruction Safety and Technology Laboratory, Ettlingen, Germany.
Received: 17 February 2015 Accepted: 29 May 2015
ReferencesAlbin, PS. (1975). The analysis of complex socioeconomic systems. Massachusetts,
USA: Lexington Books.Benjamin, SC, & Johnson, NF. (1997). A possible nanometer-scale computing
device based on an adding cellular automaton. Applied Physics Letters,70(17), 2321–2323.
Burraston, D, Edmonds, E, Livingstone, D, & Miranda, ER. (2004). Cellular automatain midi based computer music. In Proceedings of the International ComputerMusic Conference (pp. 71–78).
Gershenson, C, & Rosenblueth, DA. (2011). Modeling self-organizing traffic lightswith elementary cellular automata. Complex Systems, 19(4), 30–322.
Hajjar, D, & AbouRizk, S. (1999). Simphony: An environment for building specialpurpose construction simulation tools. In Proceedings of the 31st Conferenceon Winter Simulation (Vol. 2, pp. 998–1006).
Halpin, DW. (1977). Cyclone-method for modeling job site processes. ASCEJournal of the Construction Division, 103(3), 489–499.
Hammad, A, & Zhang, C. (2011). Towards real-time simulation of constructionactivities considering spatio-temporal resolution requirements for improvingsafety and productivity. In IEEE Proceedings of the Winter Simulation Conference(WSC) (pp. 3533–3544).
Kamat, VR, & Martinez, JC. (2001). Visualizing simulated construction operations in3D. Journal of Computing in Civil Engineering, 15(4), 329–337.
Keedwell, E, & Khu, ST. (2006). Novel cellular automata approach to optimal waterdistribution network design. Journal of Computing in Civil Engineering,20(1), 49–56.
Li, X, & Yeh, AGO. (2000). Modelling sustainable urban development by theintegration of constrained cellular automata and GIS. International Journal ofGeographical Information Science, 14(2), 131–152.
Martinez, JC. (1996). STROBOSCOPE: State and resource based simulation ofconstruction processes. University of Michigan: Dissertation.
Martinez, JC. (2001). Ezstrobe: General-purpose simulation system based on activitycycle diagrams, IEEE Proceedings of the. In 33nd Conference on Winter Simulation(pp. 1556–1564).
Missoum, S, Gurdal, Z, & Setoodeh, S. (2005). Study of a new local updatescheme for cellular automata in structural design. Structural andMultidisciplinary Optimization, 29(2), 103–112.
Mitchell, M. (2009). Complexity: A guided tour. USA: Oxford University Press.Ning, X, Lam, KC, & Lam, MCK. (2011). A decision-making system for construction
site layout planning. Automation in Construction, 20(4), 459–473.Nowak, MA, & May, RM. (1993). The spatial dilemmas of evolution. International
Journal of Bifurcation and Chaos, 3(1), 35–78.Pradhananga, N, & Teizer, J. (2013). Automatic spatio-temporal analysis of
construction site equipment operations using GPS data. Automation inConstruction, 29, 107–122.
Pradhananga, N, & Teizer, J. (2014). Congestion Analysis for Construction Site LayoutPlanning using Real-time Data and Cell-based Simulation Model (pp. 681–688).Orlando, Florida: Proceedings of the ICCCBE Conference.
Siebert, S, & Teizer, J. (2014). Mobile 3D Mapping for Surveying EarthworkProjects using an Unmanned Aerial Vehicle (UAV) System. Automation inConstruction, 41, 1–14.
Smith, L, Beckman, R, Anson, D, Nagel, K, & Williams, M. (1995). TRANSIMS:Transportation analysis and simulation system. Seattle, WA: Proceedings of theFifth National Conference on Transportation Planning Methods Applications.April 17-21, LA-UR 95-1664.
Teizer, J, Golovina, O, Wang, D, & Pradhananga, N. (2015). Automated Collection,Identification, Localization, and Analysis of Worker-Related Proximity HazardEvents in Heavy Construction Equipment Operation. Oulu, Finland: Proceedingsof the 32nd International Symposium on Automation and Robotics inConstruction.
Toffoli, T. (1984). Cellular automata as an alternative to rather than anapproximation of differential equations in modeling physics. Physica D:Nonlinear Phenomena, 10(1), 117–127.
Toffoli, T & Margolus, N (1987). Cellular Automata Machines: A New Environmentfor Modeling, MIT Press, ISBN: 9780262200608, p. 60.
Vasenev, A, Pradhananga, N, Bijleveld, F, Ionita, D, Hartmann, T, Teizer, J, & Dorée,A. (2014). Information fusion approach to increase the quality of GNSS datasets in construction equipment operations. Advanced Engineering Informatics,28, 297–310.
Wainer, GA. (2009). Discrete-event modeling and simulation: a practitioner'sapproach, CRC Press LLC, ISBN 9781420053364.
Wolfram, S. (2002). A new kind of science, Wolfram Media, 1st edition, ISBN1-57955-008-8.
Zeigler, B. (1976). Theory of modelling and simulation. New York: John Wiley.Zhang, C, Hammad, A, Zayed, TM, Wainer, G, & Pang, H. (2007). Cell-based
representation and analysis of spatial resources in construction simulation.Automation in construction, 16(4), 436–448.
Submit your manuscript to a journal and benefi t from:
7 Convenient online submission
7 Rigorous peer review
7 Immediate publication on acceptance
7 Open access: articles freely available online
7 High visibility within the fi eld
7 Retaining the copyright to your article
Submit your next manuscript at 7 springeropen.com