Embed Size (px)
Citation preview
Cell Adhesion Study Using MEMS and Digital Image
CorrelationKeith Gall
Tareef Jafferi
Matt Schwabauer

Presentation Outline
• Device and experiment concept
• Digital Image Correlation (DIC)
– What is DIC?
– How can it be used in MEMS and Bio applications?
• Device design considerations
– Force Capacity
– Calibration
– Static and dynamic tests
• Fabrication and Processing
– Mask design
– Surface micro-machining
• Conclusions/Questions?

Cell
Loading Plates
Surface Florescent Beads
Cellular Florescent Beads
Anchors
Top View
Side ViewProtein Coating
Preloading
750 combs 750 combs
MEMS Tensile Device: Schematic

< 10microns
Top View
Side ViewCell will neck
Surface Florescent Beads
Cellular Florescent Beads
Protein Coating
Loaded
Loading Plates
750 combs 750 combs
MEMS Tensile Device: Schematic

<1 micron
8 microns
40 microns
5 microns
30 microns
MEMS Tensile Device: Fluorescent Markers
• Fluorescent beads embedded in substrate
– Commercially available fluorescent microspheres (FluoSpheres, Molecular Probes, Eugene, OR)
– Size 0.2 micron, well defined
– Latex beads embedded in polyacrylimide
– Substrate funtionalized with fibronectin
• Chemical labels tag specific cell substructures
– Size <1 micron but variable
– GFP-zyxin, vinculin,
– Tagging of; lamellipodia, focal adhesion sites, extracellular matrix
• Technique sucessfully used in studies of: fish fin, monkey liver, bovine endothelial, rabbit and human corneal fibroblasts, H-ras
3T3 cancer cells, etc.
– Petrol, et al, Investigative Opthalmology & Visual Science, (2004)
– Munevar, et al, Biophysical Journal, (2001) – Yang, et al, IEEE, (2004)

• Computer assisted technique for measuring displacements
• Compares the location of points from a reference image to the location of those points in a second
(deformed) image
• Typically used to generate 2-D strain maps (or 3-D using stereo triangulation or confocal microscopy)
• Why is it useful?– Strain maps provide detailed information– Non-intrusive measurement– Measurement in controlled environment
– Large range of time scales (static to 50 KHz)– Large range of length scales (10^-9 to 10^12 meters)– Sub-pixel accuracy obtained thru interpolation functions and
iterative, correlation-function maximization
Digital Image Correlation: Optical Measurement
QuickTime™ and aTIFF (LZW) decompressor
are needed to see this picture.
W. Petroll, et al, Journal of Cell Science, (2004)
Munevar, et al, Biophysical Journal, (2001)

Digital Image Correlation: Methodology
Image 1 Image 2(deformed sample)
•Pattern displaces 1 pixel up, and 1
pixel over•Subset (5 x 5) in red, required to track
unique signature in Image 2•Use Correlation Function to score
possible candidate displacements,
minimize function to find perfect match
€
C(x,y,u,v) = (I(x + i,y + j) − I*(i, j=−n / 2
n / 2
∑ x + u+ i,y + v + j))2
Pixel coord., reference image
Correlation function
Displacement
n: subset size(5x5)
Image before motion Image after motion
Pixel value at (x+u+i; y+v+j) Pixel value at (x+i; y+j)
Sum of Squared Differences
€
(0 − 0)2 + (100 −100)2 + (100 −100)2 + (100 −100)2 + (0 − 0)2 +
(100 −100)2 + (100 −100)2 + (100 −100)2 + (100 −100)2 + (100 −100)2 +
(100 −100)2 + (100 −100)2 + (100 −100)2 + (100 −100)2 + (100 −100)2 +
(100 −100)2 + (100 −100)2 + (100 −100)2 + (100 −100)2 + (100 −100)2 +
(0 − 0)2 + (100 −100)2 + (100 −100)2 + (100 −100)2 + (100 −100)2 = 0
C(5,5,1,1) = 0 Perfect match!!
Example as presented in “Introduction to Digital Image Correlation”, at the SEM X international Congress in Costa Mesa, CA on June 6, 2004 by Dorian Garcia

Digital Image Correlation: Experimental Considerations
• Spatial Resolution
– Speckle size, <1micron
– Speckle contrast = signal to noise ratio, good
– Random speckle pattern, good
• Out-of-plane deformation
• 3-D deformation maps possible
– Stereo triangulation
– Z-axis or confocal microscopy
• 3-D reconstruction by imaging at different focal lengths along z-axis
• Possible for static tests
• Possible for dynamic tests, but limited by camera exposure time
• Non-intrusive measurement
– Cells tested in suitable environment
– Measurements can be made in hydrated state (submerged test device?)
• Use different color fluorescent trackers
– Use filters to monitor either substrate beads or cell structure
– Isolate cell cytoskeleton response from substrate/adhesive response
M. Miller, et al, Proceedings of National Academy of the Sciences of USA, (2003)
in-vivo Z-axis tracking of migrating T cells in mouse lymh nodes

Design Parameters: Comb Drive
• Reaction/Applied Force
– Force applied between plates = Force of cell stretch
– Force applied thru plate = reaction force of cell shear + reaction force of deforming substrate
• Comb Drive Force
– Electrostatic force applied by comb drive
– Gap 2 µm, thickness=1µm, voltage = 20V
• Beam Bending Force
– 4 folded beams
– Modulus of elasticity for Silicon E=170 GPa
– Ktotal=18.36 N/m
• Maximum Displacement
– gap between testing plates = travel of comb drive = bending of beams
€
Freaction = Fcomb − Fbeam
€
F1−comb =εV 2
2
w
z
⎛
⎝ ⎜
⎞
⎠ ⎟= 3.53x10⁻⁹N
€
Fbeam =K total ∗δgap
€
Ftotal−comb = 2∗2∗750∗F1−comb
€
Ftotal−comb =1.06x10⁻⁵N =10.6μN
€
∑Forces = Fcomb − Fbeam − Freaction = 0
€
Fbeam =18.36N /m∗0.67x10−6m
€
Fbeam = 8.95x10⁻⁶N = 8.9μN€
Fcell−membrane = 40nN (per adhsion site)
€
Fmax =10.6μN − 8.9μN =1.7μN
Max force applied by device
€
Fmax =1.7μN
~40 adhesion sites

Design Parameters: Calibration
• Proof test with “standard” material first
– Soft polymer or gel
– Calibrate using material that matches stiffness/response of typical cell
• Compare calibration results to literature
– Static test: Modulus, ultimate tensile strength, adhesive failure
– Dynamic test: Viscoelasticity, hysteresis, fatigue

Design Parameters: Design of Experiment
• Eliminate Cell creep into gap
– Apply negative voltage to close gap
– Place cell on closed plates
• Static test on Cell
– More consistent Data
– Less error due to inertial effects
– Closely monitor cell response to external force
• Dynamic test on Cell
– Data analysis more complex
– Measure time-dependent effects
– Simulate real world conditions of cells

(a)
(b)
(c)
(d)
(a) Copper is deposited on the glass substrate by E-beam evaporation
(b) Photoresist (PR) is coated on the copper layer and is patterned as the etching mask of the copper. The pole layer of copper is patterned with wet etching techniques in FeCl3 etching solutions (Mask 1)
(c) Polyimide (PI) is spun as sacrificial layer and achor is defined. The PI is cured at 150 C to endure the next process steps
(d) A seed layer of Ti/Cu (300A/500A) for electroplating Ni is deposited on the sacrificial layer
Fabrication Process of Device: Part 1 (The Comb Driver)
Comb drive fabrication method as described by Chien, et al, Design, Test, Integration & Packaging of MEMS, (2003)
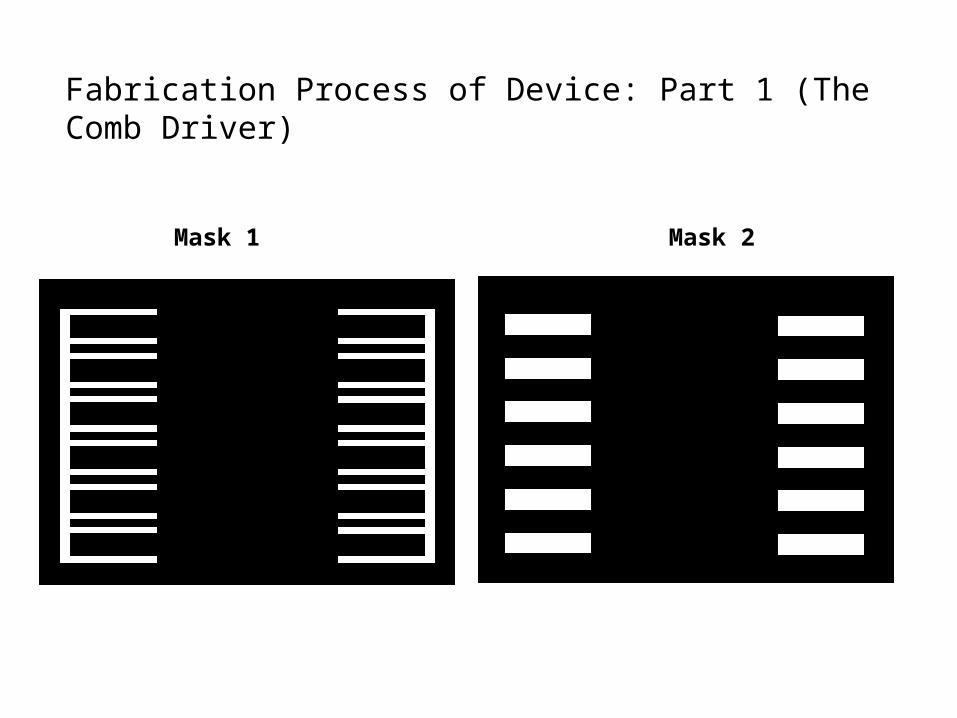
Mask 1 Mask 2
Fabrication Process of Device: Part 1 (The Comb Driver)
(e)
(f)
(g)
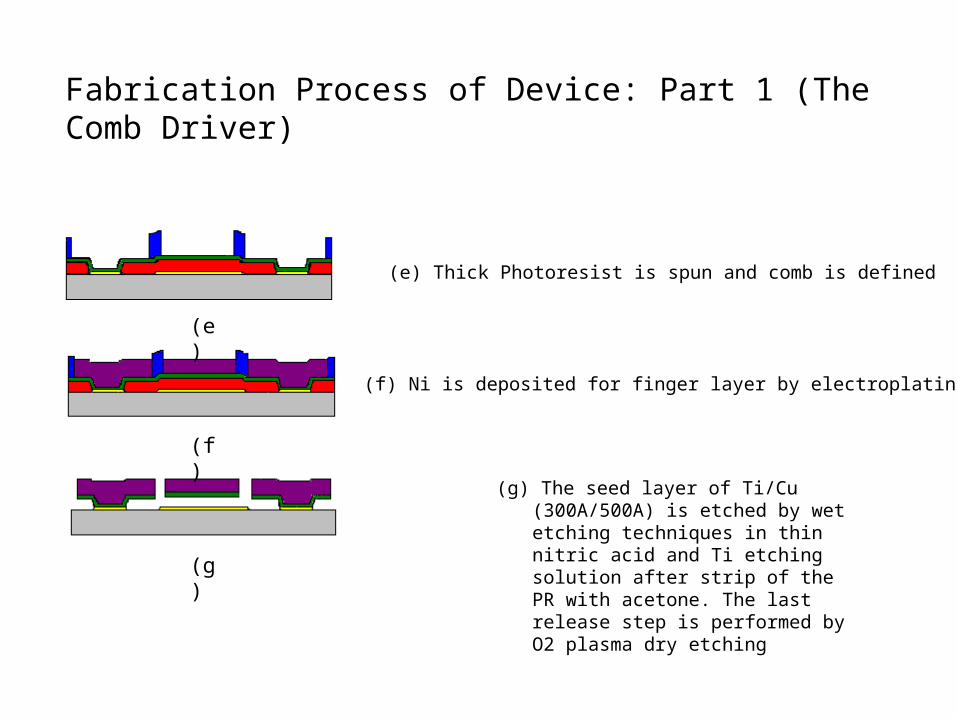
(e) Thick Photoresist is spun and comb is defined
(f) Ni is deposited for finger layer by electroplating
(g) The seed layer of Ti/Cu (300A/500A) is etched by wet etching techniques in thin nitric acid and Ti etching solution after strip of the PR with acetone. The last release step is performed by O2 plasma dry etching
Fabrication Process of Device: Part 1 (The Comb Driver)

Fabrication Process of Device: Part 1 (The Comb Driver)
Mask 3

a) Metal deposition and patterning (using Mask 1)
b) Sacrificial layer coating and patterning
c) PR + patterning + Ti/Au e-beam deposition and lift off (using Mask 2)
d) Removal of sacrificial layer by dry etching
Fabrication Process of Device: Part 2 (The Stage and Beams)

Mask 1 Mask 2
Fabrication Process of Device: Part 2 (The Stage and Beams)

Conclusions and Questions
• Existing cellular studies lack
– Cell response to external loading
– Reliable methods for collecting data
• Digital image correlation enables accurate measurements through non-contacting methods
• The proposed device:
– Can apply forces and accurately measure deformation
– Tests both static and dynamic response of cells
• Simplified design process by adopting existing fabrication methods
Questions?