Embed Size (px)
Citation preview
Vol. 109: 83-94.1994 MARINE ECOLOGY PROGRESS SERIES Mar. Ecol. Prog. Ser.
Published June 9
Effects of pH on the growth and carbon uptake of marine phytoplankton
Celia Y. Chenl, Edward G. Durbin2
'Department of Biological Sciences, Dartmouth College, Hanover, New Hampshire 03755, USA 'Graduate School of Oceanography, University of Rhode Island, Narragansett, Rhode Island 02882, USA
ABSTRACT: This study examines the growth and photosynthetic response of marine phytoplankton to a naturally occurring range of pH's. Growth rates were determined for Thalassiosira pseudonana and Thalassiosira oceanica via in vivo fluorescence measurements; photosynthetic rates were measured via I4carbon uptake using mesocosm tank assemblages of phytoplankton. A pH range of 7.0 to 9.4 was used for both sets of experiments and consistent declines of growth rate and photosynthesis were observed at high pH levels (>pH 8.8). The pH response of the 2 phytoplankton species and the tank assemblages appeared to correlate with calculated concentrations of free carbon dioxide indicating a possible carbon substrate limitation at high pH. Half-aturation values for calculated [CO2] were deter- mined for cell growth rates and for photosynthesis using the Monod equation (K, = 0.5 PM) and Michaelis-Menten equahon (K, = 1.3 PM), respectively. These values were within the range of values measured for phytoplankton in previous studes. Based on this evidence, it is suggested that at high pH levels the availabhty of CO2 may become limiting to manne phytoplankton growth and photo- synthesis.
KEY WORDS: Phytoplankton . pH . Carbon uptake . Algal growth rates . CO2 limitation
INTRODUCTION
Variation in pH can affect algal growth in a number of ways. It can change the distribution of carbon diox- ide species and carbon availability, alter the availabil- ity of trace metals and essential nutrients, and at extreme pH levels potentially cause direct physiologi- cal effects. Most studies of pH effects on algae have been conducted in freshwater systems where the car- bonate buffering system is weaker than in seawater and pH may fluctuate dramatically. However, a num- ber of studies have demonstrated that pH also changes significantly in marine systems despite the strong buffering capacity of the carbonate system in seawater (Marshal1 & Orr 1948, Park et al. 1958, Frithsen et al. 1985, Pegler & Kempe 1988). In many marine systems, pH may be an important factor regulating algal abun- dance and distribution.
In general, changes in pH levels in marine systems appear to correlate with changes in temperature, dis- solved oxygen, and phytoplankton production. Condi- tions of high pH, high phytoplankton production, and
low oxygen conditions are characteristic of nutrient- enriched systems and often are found in coastal waters or enclosed bodies of water (lagoons, salt ponds, embayments, etc.) which receive anthropogenic inputs such as sewage effluent or agricultural runoff (Mar- shall & Orr 1948, Park et al. 1958, King 1970, Oviatt et al. 1986). In these systems, pH ranges approaching pH 9 have been measured. pH levels exceeding pH 9.0 have been recorded in a number of coastal marine sys- tems (Hires et al. 1963, Emery 1969), and in experi- mental mesocosms receiving nutrient enrichment (Frithsen et al. 1985, Hinga 1992).
Several studies have shown that pH variations within these ranges influence phytoplankton abundance and species distribution. Freshwater studies have sug- gested that species succession is determined by the ability of certain species to proliferate at high pH's pre- sumably due to their tolerance of low CO2 levels (Brock 1973, Goldman & Shapiro 1973, Shapiro 1973). In marine mesocosms, Hinga (1992) also correlated pH changes with the succession of diatoms to dinoflagel- lates. Goldman et al. (1982) suggested that the domi-
O Inter-Research 1994 Resale of full article not permitted
Mar. Ecol. Prog. Ser. 109: 83-94, 1994
nance of Phaeodactylum tricornutum over other spe- cies in outdoor mass cultures of marine phytoplankton was due to its ability to grow at pH levels up to pH 10.3. Pruder & Bolton (1979) provided evidence for an interaction of pH and CO2 causing decreased growth of Thalassiosira pseudonana, a coastal diatom species.
The relative concentrations of CO2, HC03-, and CO3'- of the carbonate system and the pH of seawater are closely linked. As pH increases, carbonate increases and bicarbonate and molecular CO2 decrease. At the average pH of seawater (pH 8.2), only about 1 % of total CO2 is found as molecular CO2, 90 % as HC03-, and the rest as CO3'- (Steeman Nielsen 1975). At any given pH, the concentrations of these species are set by any one of the following: partial pressure of CO2, total alkalinity, or ICO?. The removal of CO2 by photosynthetic uptake leads to an increase in pH and a decrease in CO2 partial pressure when CO2 replacement processes occur more slowly than the utilization. These replacement processes include atmospheric CO2 influx via diffusion, respiration, fer- mentation, and the slow hydration and dehydration reactions of dissolved CO2 (Goldman et al. 1974, Owens & Essias 1976).
In this study, we examine the effects of pH variation on marine phytoplankton by measuring 2 types of phytoplankton response. First, we tested the effects of pH and alkalinity changes on growth in the laboratory of a coastal and an oceanic species. Second, we exam- ined photosynthetic response of natural phytoplankton assemblages to changes in pH. Based upon existing pH data for natural marine systems and experimental marine mesocosms (Hires et al. 1963, Emery 1969, Frithsen et al. 1985), a pH range of 7.0 to 9.4 was chosen for both sets of experiments. Finally, carbon species concentrations were calculated in order to examine the potential relationship between carbon availability and phytoplankton growth rate and photo- synthesis.
METHODS
Growth rate response of phytoplankton cultures. The diatoms Thalassiosira pseudonana (3H), a coastal species, and Thalassiosira oceanica (13-l), an oceanic species, were used in the growth rate experiments. Stock cultures were obtained from T. Smayda (Gradu- ate School of Oceanography, URI) and maintained in batch culture at 18OC. Continuous light was provided by cool white fluorescent tubes at an irradiance of 75 pE m-2 S-'.
Experimental cultures were grown in acid-cleaned 250 m1 polycarbonate bottles with 0.2 pm filtered Sar- gasso Seawater containing modified F/2 nutrient con-
centrations (Guillard 1972). Experimental treatments were incubated in a water bath at 20 'C with continu- ous light at 100 pE m-' S-'. Inocula for each experiment were taken from exponentially growing cells. The vol- ume of the inoculum was chosen such that the initial cell concentration was just above the lower detection limit of the fluorometer (Turner Designs) used to mea- sure cell densities. This provided a period of about 40 h before a measurable change in pH (0.1 pH units) was caused by the CO2 uptake of the phytoplankton. Prior to inoculation of an experiment, the fluorescence and pH of the stock culture were measured to determine the appropriate volume of inoculum.
pH adjustment: The pH of the experimental culture media was adjusted using 2 different methods. The first method required bubbling with compressed gases (CO2, compressed air, and a mixture of nitrogen and oxygen). The pH of a 4 1 volume of culture medium was raised to pH 8.9 prior to bubbling by adding diluted NaOH. The medium was then divided into four 1 1 vol- umes. Three of these were bubbled for 2 h by either CO2, compressed air, or a mixture of NZ and 02, respectively producing pH levels of approximately 7, 8, and 9. The fourth 1 1 volume remained unchanged and was used as a control for phytoplankton growth in the initial pH and alkalinity levels. For the second method of pH adjustment, both alkalinity and pH lev- els were altered. An initial acid/base titration of the medium was conducted and appropriate acid and base additions were made to 1 1 volumes of culture medium to attain the desired pH levels. Generally, 6 or more pH levels were tested simultaneously in these experi- ments.
The pH was measured prior to and after pH adjust- ments and at the beginning and end of experiments with an Altex Model 071 pH meter and a Ross combi- nation electrode. An effort was made to maintain the pH of all treatments within 0.1 pH units of the initial measurement. However, in the lower pH treatments (pH 7.0 to 7.5) pH levels sometimes increased up to 0.4 pH units during the course of the 40 h incubations.
Calculation of carbon speciation: Concentrations of COz and HC03- were calculated for each experiment to examine the possible effect of carbon substrate limi- tation. The following equations were used:
in which CA = carbonate alkalinity; a~ = 10-pH, activity of the hydrogen ions; K, = 1st apparent dissociation constant of carbonic acid; K, = 2nd apparent dissocia- tion constant of carbonic acid.
Chen & Durbin: Effects of pH on phytoplankton
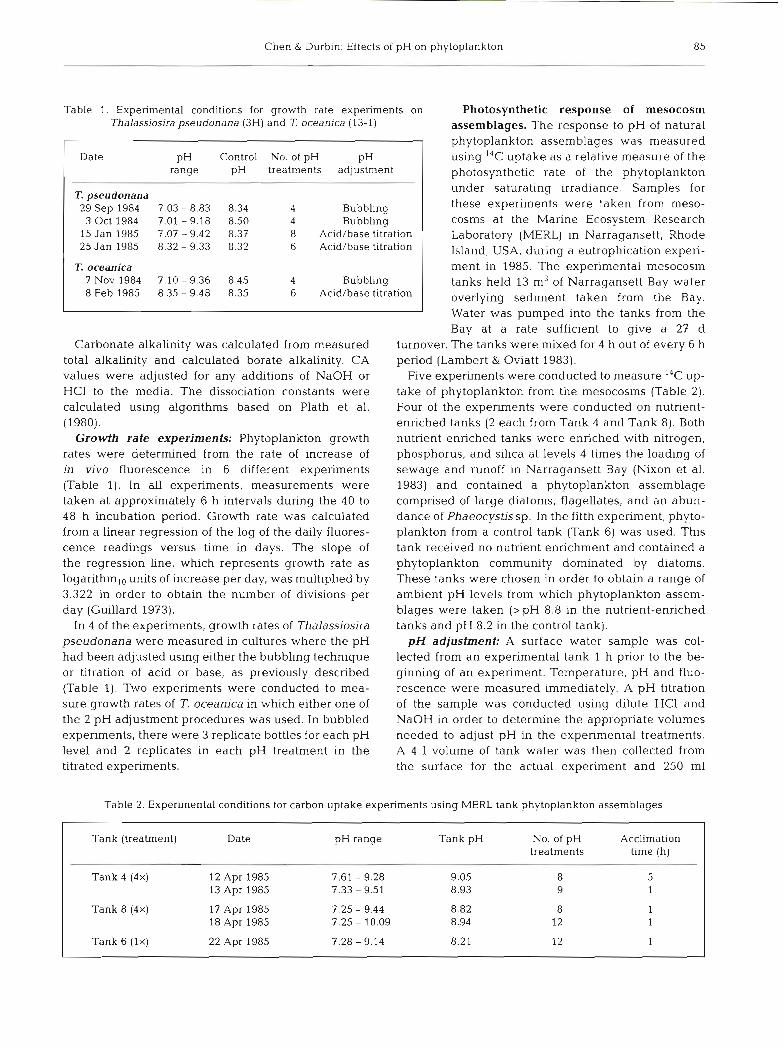
Table 1. Experimental conditions for growth rate experiments on Thalassiosira pseudonana (3H) and T oceanica (13-1)
Date pH Control No. of pH PH range pH treatments adjustment
T. pseudonana 29 Sep 1984 7.03 - 8.83 8.34 4 Bubbling 3 Oct 1984 7.01 - 9.18 8.50 4 Bubbling 15 Jan 1985 7.07 - 9.42 8.37 8 Acid/base t~tration 25 Jan 1985 8.32 - 9.33 8.32 6 Acid/base titration
T. oceanica 7 Nov 1984 7.10 - 9.36 8.45 4 Bubbl~ng 8 Feb 1985 8.35 - 9.48 8.35 6 Acid/base t~tration
Carbonate alkalinity was calculated from measured total alkalinity and calculated borate alkalinity. CA values were adjusted for any additions of NaOH or HC1 to the media. The dissociation constants were calculated using algorithms based on Plath et al. (1980).
Growth rate experiments: Phytoplankton growth rates were determined from the rate of increase of in vivo fluorescence in 6 different experiments (Table 1). In all experiments, measurements were taken at approximately 6 h intervals during the 40 to 48 h incubation period. Growth rate was calculated from a linear regression of the log of the daily fluores- cence readings versus time in days. The slope of the regression line, which represents growth rate as logarithm,,, units of increase per day, was multiplied by 3.322 in order to obtain the number of divisions per day (Guillard 1973).
In 4 of the experiments, growth rates of Thalassiosira pseudonana were measured in cultures where the pH had been adjusted using either the bubbling technique or titration of acid or base, as previously described (Table 1). Two experiments were conducted to mea- sure growth rates of T, oceanica in which either one of the 2 pH adjustment procedures was used. In bubbled experiments, there were 3 replicate bottles for each pH level and 2 replicates in each pH treatment in the titrated experiments.
Photosynthetic response of mesocosm assemblages. The response to pH of natural phytoplankton assemblages was measured using I4C uptake as a relative measure of the photosynthetic rate of the phytoplankton under saturating irradiance. Samples for these experiments were taken from meso- cosms at the Marine Ecosystem Research Laboratory (MERL) in Narragansett, Rhode Island, USA, during a eutrophication experi- ment in 1985. The experimental mesocosm tanks held 13 m3 of Narragansett Bay water overlying sediment taken from the Bay. Water was pumped into the tanks from the Bay at a rate sufficient to give a 27 d
turnover. The tanks were mixed for 4 h out of every 6 h period (Lambert & Oviatt 1983).
Five experiments were conducted to measure I4C up- take of phytoplankton from the mesocosms (Table 2) . Four of the experiments were conducted on nutrient- enriched tanks (2 each from Tank 4 and Tank 8). Both nutrient-enriched tanks were enriched with nitrogen, phosphorus, and silica at levels 4 times the loading of sewage and runoff in Narragansett Bay (Nixon et al. 1983) and contained a phytoplankton assemblage comprised of large diatoms, flagellates, and an abun- dance of Phaeocystis sp. In the fifth experiment, phyto- plankton from a control tank (Tank 6) was used. This tank received no nutrient enrichment and contained a phytoplankton community dominated by diatoms. These tanks were chosen in order to obtain a range of ambient pH levels from which phytoplankton assem- blages were taken (>pH 8.8 in the nutrient-enriched tanks and pH 8.2 in the control tank).
pH adjustment: A surface water sample was col- lected from an experimental tank 1 h prior to the be- ginning of an experiment. Temperature, pH and fluo- rescence were measured immediately. A pH titration of the sample was conducted using dilute HC1 and NaOH in order to determine the appropriate volumes needed to adjust pH in the experimental treatments. A 4 1 volume of tank water was then collected from the surface for the actual experiment and 250 m1
Table 2. Experimental conditions for carbon uptake experiments using MERL tank phytoplankton assemblages
Tank (treatment) Date pH range Tank pH No. of pH Acclimation treatments time (h)
Tank 4 (4x) 12 Apr 1985 7.61 - 9.28 9.05 13 Apr 1985 7.33 - 9.51 8.93
Tank 8 (4x) 17 Apr 1985 18 Apr 1985
Tank 6 (lx) 22 Apr 1985 7.28 - 9.14 8.21 12 1
86 Mar. Ecol. Prog. Ser. 109: 83-94.1994
aliquots poured into acid-cleaned polycarbonate bot- tles. The predetermined volumes of dilute HCl and NaOH were added to the bottles to adjust pH to the desired treatment levels (Table 2). The bottles were then placed in an illuminated water bath which was set for continuous light (100 pE m-' S-') at the same temperature as the MERL tanks in order to acclimate the phytoplankton cells to the new pH levels. Two of the experiments conducted on phytoplankton from Tank 4 , a nutrient-enriched tank, examined the effect of acclimation time (1 h or 5 h) on the pH response (Table 2). The 3 other experiments were acclimated for 1 h. During the acclimation period, each bottle was removed briefly and weighed in order to determine the gravimetric volume.
Carbon uptake experiments: Carbon uptake was measured in the 5 separate experiments using NaH14C03, After pH adjustment and acclimation of the natural phytoplankton assemblages, the pH treatment samples were poured into replicate acid-cleaned, 85 m1 polycarbonate centrifuge tubes, and 100 p1 of 10 pCi ml-' NaHI4CO, solution was inoculated into each tube. The changes in alkalinity and pH due to the labeled bicarbonate addition were 0.0067 meq. 1-' and at most 0.05 pH units at the lowest pH levels. Experi- mental tubes were inserted into a rack and placed into the illuminated water bath (100 pE m-' S-') for approx- imately 3 h. The actual activity added to each tube was determined separately by measuring the activity of 100 p1 aliquots of the stock NaH1"C03 solution. Initial pH and fluorescence of the experimental treatments were measured using the remaining unlabeled sample from each 250 m1 bottle.
After the 3 h incubation, the 14C labeled treatments were filtered immediately using 25 mm A E glass fiber filters at 125 mm Hg maximum vacuum. The filters were then transferred to glass scintillation mini-vials and 3 m1 of scintillation fluid were added. All samples were shaken continuously for 8 h to allow the cocktail to fully saturate the filter and to allow any degassing of residual inorganic 14C. The vials were then counted in a Beckman LS 3801 scintillation counter. Counts per minute were converted to disintegrations per minute using a third order polynomial regression (least- squares cubic fit) to relate sample quench to counting efficiency. Sample quench was determined using a cesium 137 external standard. Counting efficiency was about 92% for all experiments (Lambert & Oviatt 1983).
Calculation o f carbon uptake: Radiocarbon activi- ties were converted into carbon uptake rates (mg C m-3 h-') using the following equation (Strickland &
Parsons 1965): R x W x 1.05
U = A x T
where U = uptake (mg C m-3 h-'); R = activity counted for each sample (DPM); A = activity added to each sample (DPM); W = weight of carbonate carbon (mg C m-3); T = incubation time (h); 1.05 = isotope discrimi- nation factor (14C02 vs '2C02).
The available carbon concentration (W) of the sam- ple water in each pH treatment was calculated from the following equation:
W = mg C m-3 = 12000 (TA - BA) F,
Total alkalinity (TA) of the initial tank water sample was determined using the method of Culberson et al. (1970). Any changes due to the addition of an acid or base were then calculated by adding (for a base) or subtracting (for acid) the number of milliequivalents of acid or base added to the sample. Borate alkalinity (BA) was calculated as a function of the sample chlo- rinity, temperature, and pH using the dissociation con- stant for boric acid (Lyman 1956). Carbonate alkalinity (CA) was determined from the difference of the two (TA - BA = CA). F,, which is a conversion factor to derive total CO2 from carbonate alkalinity, was calcu- lated by using the a~ and the first and second dissoci- ation constants for carbonic acid (Plath et al. 1980).
RESULTS
Growth rate response of phytoplankton cultures
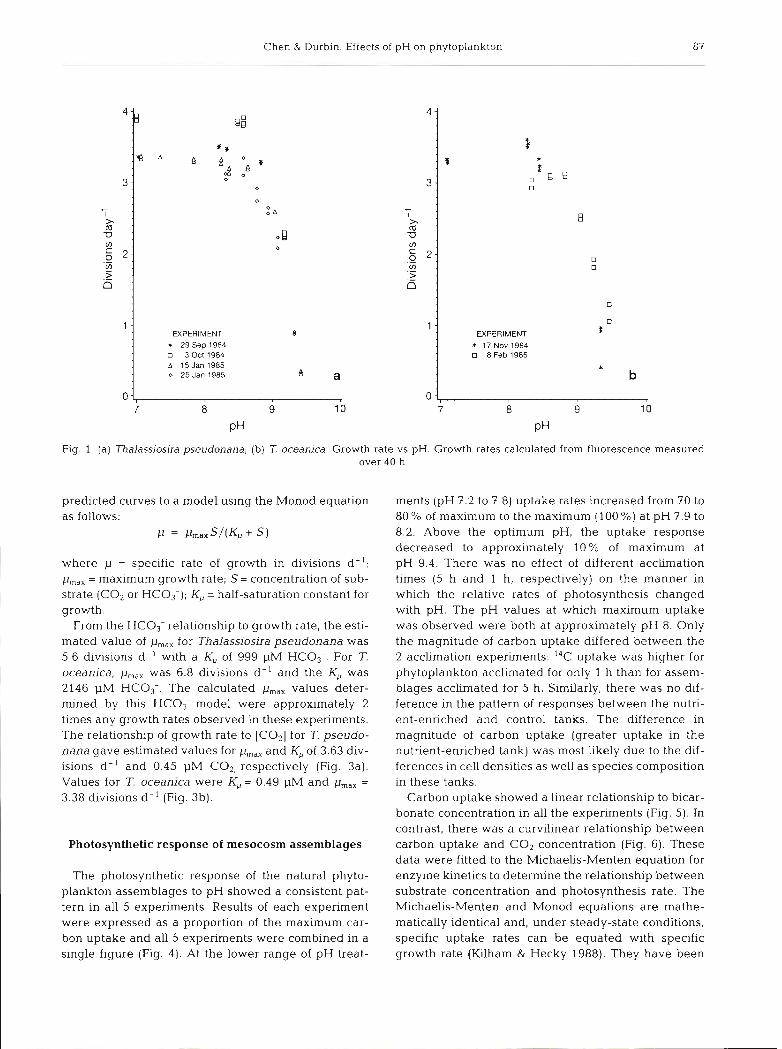
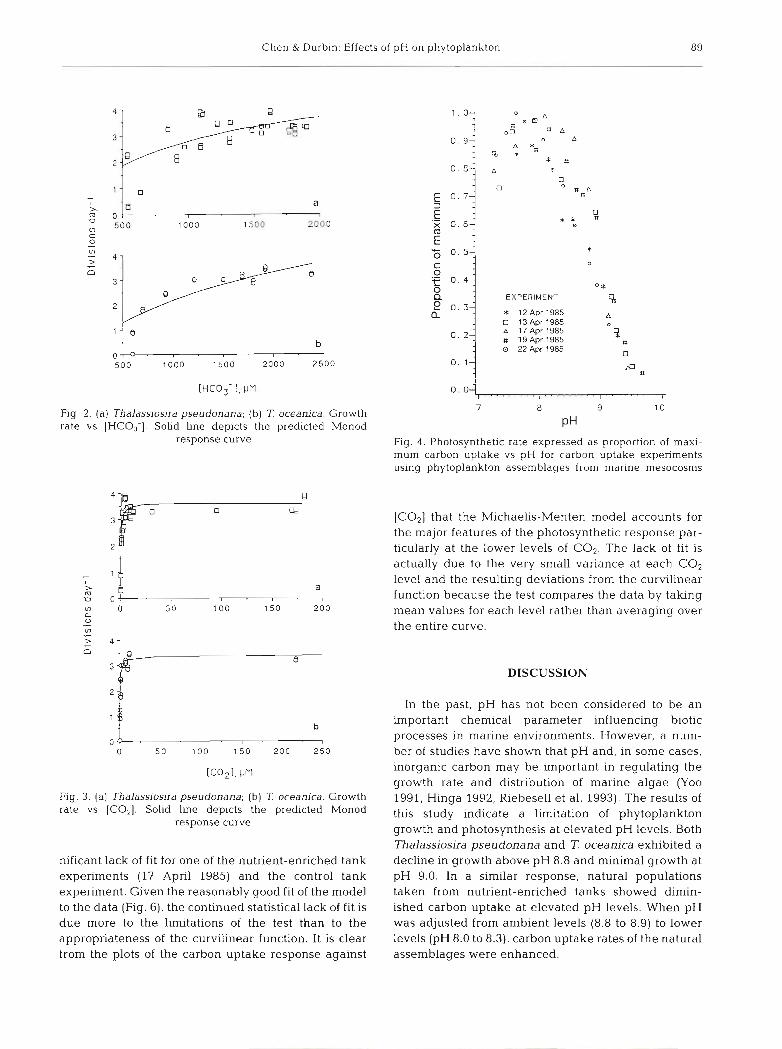
Both Thalassiosira pseudonana and T. oceanica showed consistent decreases in growth rates at higher pH levels (Fig, l a , b) and lower [CO,] and [HC03-] (Table 3). In the 3 experiments where pH levels were adjusted by bubbling, both T, pseudonana and T. oceanica grew at maximal rates at all pH treatments up to pH 8.8 but growth rates began to decrease at levels above pH 8.8 (Table 3). Both phytoplankton species also showed similar trends in experiments in which pH was adjusted by acid and base titrations. Since the growth rates of both phytoplankton species in the bub- bled experiments (in which alkalinity was unchanged) responded similarly to the titrated experiments in which alkalinity was altered, we concluded that the response to high pH was attributed to the pH level rather than alkalinity (Table 3).
In order to determine whether the pH response was related to carbonate chemistry, growth rates measured at the different pH levels for each phytoplankton species were plotted against the calculated HC03- concentrations (Fig. 2a, b) and CO2 concentrations (Fig. 3a, b). The growth rate and external substrate concentration relationships for Thalassiosira pseudo- nana and T. oceanica were calculated by fitting the
Chen & Durbin: Effects of pH on phytoplankton
EXPERIMENT
i 17Nov1984 o 8 Feb 1985
4 -
3 -
- I h ' m . D '
I n ,
S 2: .- I n , .- > . .- n I
1 -
0
Fig. 1 (a) Thalassiosira pseudonana; (b) 7: oceanica. Growth rate vs pH. Growth rates calculated from fluorescence measured over 40 h
predicted curves to a model using the Monod equation as follows:
P = ~rnaxS/(Kp + S)
P H P H
4 -
:$ A
3 -
r I X ' a ' U
.- g 2; I n . .- .- 9 . n :
1 - EXPERIMENT
* 29 Sep 1984 0 3 Oct 1984 A 15Jan 1985 o 25 Jan 1985 A a
-, 0 - , 7 8 9 10
where p = specific rate of growth in divisions d- l ; p,,, = maximum growth rate; S = concentration of sub- strate (CO2 or HC03-); K, = half-saturation constant for growth.
From the HC03- relationship to growth rate, the esti- mated value of p,,, for Thalassiosira pseudonana was 5.6 divisions d - ' with a K, of 999 pM HC03-. For T. oceanica, pmal was 6.8 divisions d- ' and the K,, was 2146 PM HC03-. The calculated p,,, values deter- mined by this HCO,- model were approximately 2 times any growth rates observed in these experiments. The relationship of growth rate to [COz] for T. pseudo- nana gave estimated values for p,,, and K, of 3.63 div- isions d - ' and 0.45 pM CO2, respectively (Fig. 3a). Values for T. oceanica were K, = 0.49 pM and p,,, =
3.38 divisions d - ' (Fig. 3b).
. f
0 0
0
0
Z
* b
7 8 9 10
Photosynthetic response of mesocosm assemblages
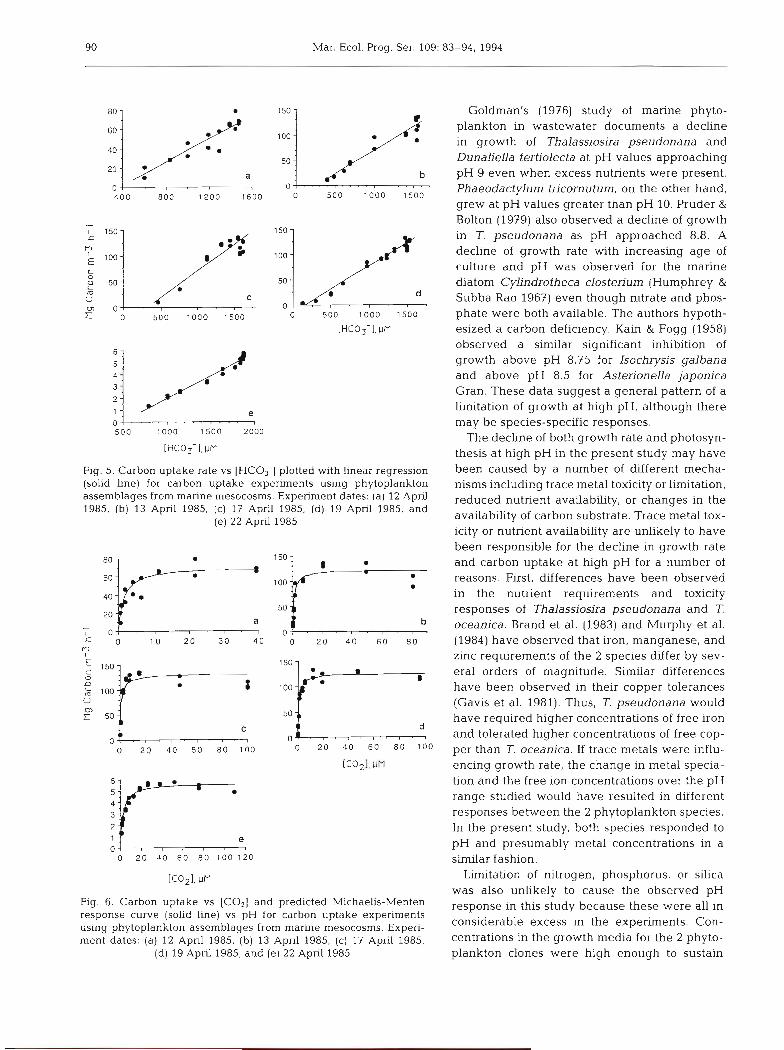
The photosynthetic response of the natural phyto- plankton assemblages to pH showed a consistent pat- tern in all 5 experiments. Results of each experiment were expressed as a proportion of the maximum car- bon uptake and all 5 experiments were combined in a single figure (Fig. 4). At the lower range of pH treat-
ments (pH 7.2 to 7.8) uptake rates increased from 70 to 80 % of maximum to the maximum ( l00 %) at pH 7.9 to 8.2. Above the optimum pH, the uptake response decreased to approximately 10% of maximum at pH 9.4. There was no effect of different acclirnation times (5 h and 1 h, respectively) on the manner in which the relative rates of photosynthesis changed with pH. The pH values at which maximum uptake was observed were both at approximately pH 8. Only the magnitude of carbon uptake differed between the 2 acclimation experiments: I4C uptake was higher for phytoplankton acclimated for only 1 h than for assem- blages acclimated for 5 h. Similarly, there was no dif- ference in the pattern of responses between the nutri- ent-enriched and control tanks. The difference in magnitude of carbon uptake (greater uptake in the nutrient-enriched tank) was most likely due to the dif- ferences in cell densities as well as species composition in these tanks.
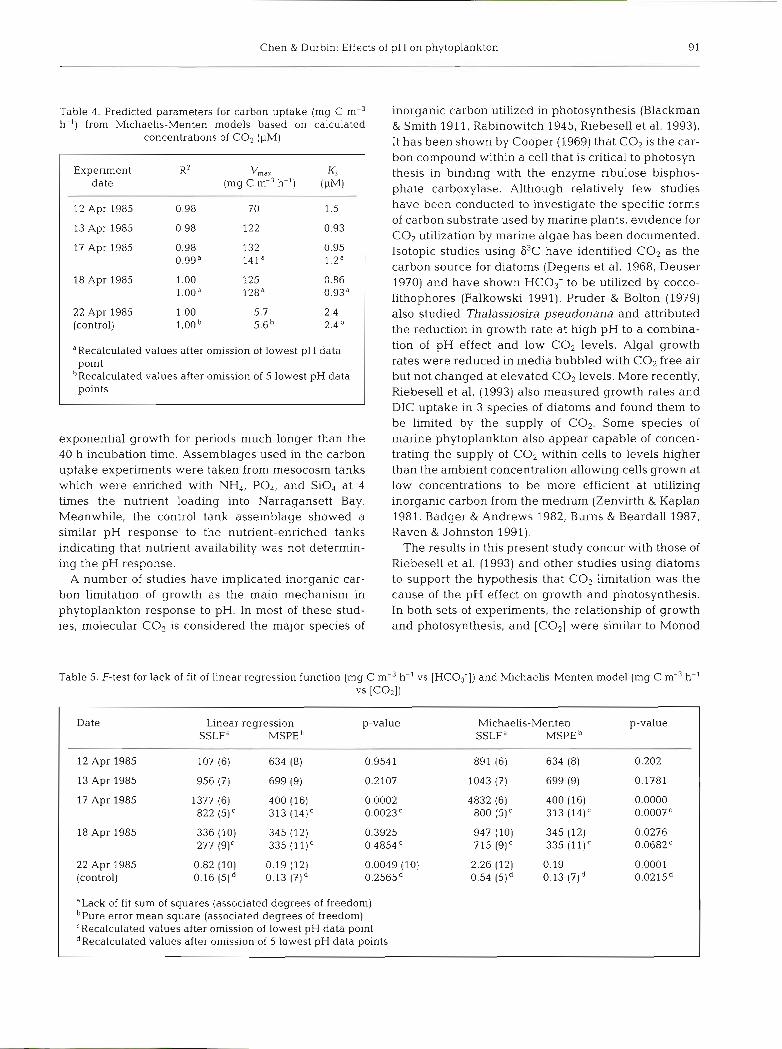
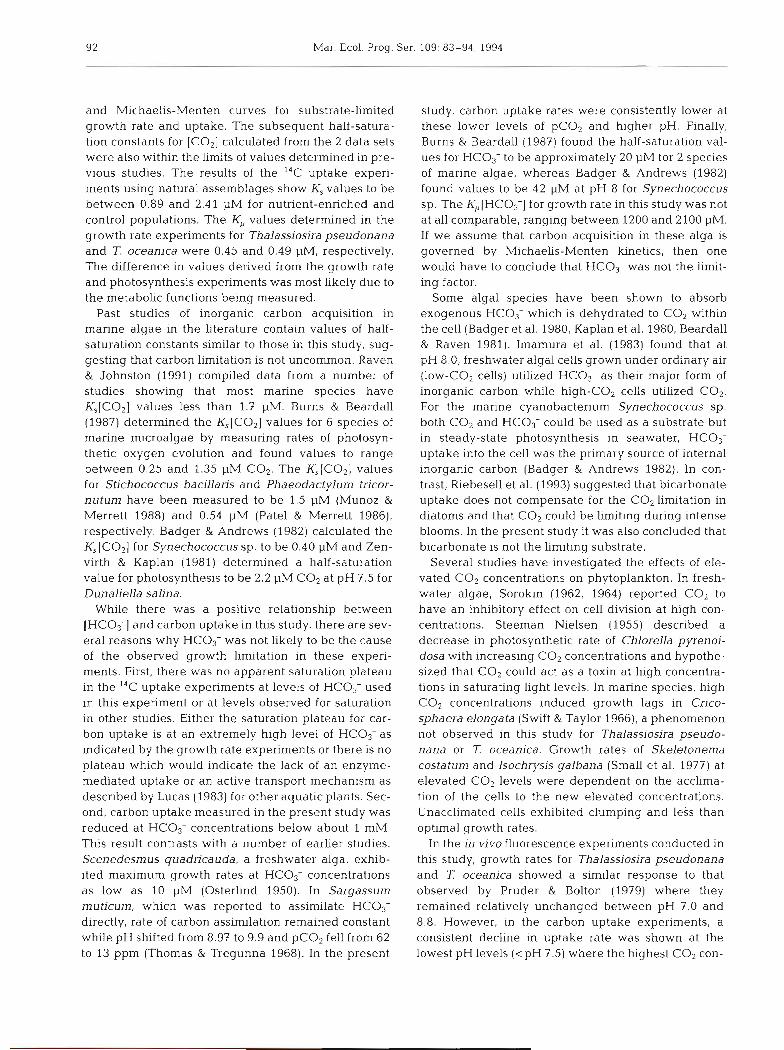
Carbon uptake showed a linear relationship to bicar- bonate concentration in all the experiments (Fig. 5). In contrast, there was a curvilinear relationship between carbon uptake and CO2 concentration (Fig. 6). These data were fitted to the Michaelis-Menten equation for enzyme kinetics to determine the relationship between substrate concentration and photosynthesis rate. The Michaelis-Menten and Monod equations are mathe- matically identical and, under steady-state conditions, specific uptake rates can be equated with specific growth rate (Kilham & Hecky 1988). They have been
88 Mar. Ecol. Prog. Ser. 109: 83-94, 1994
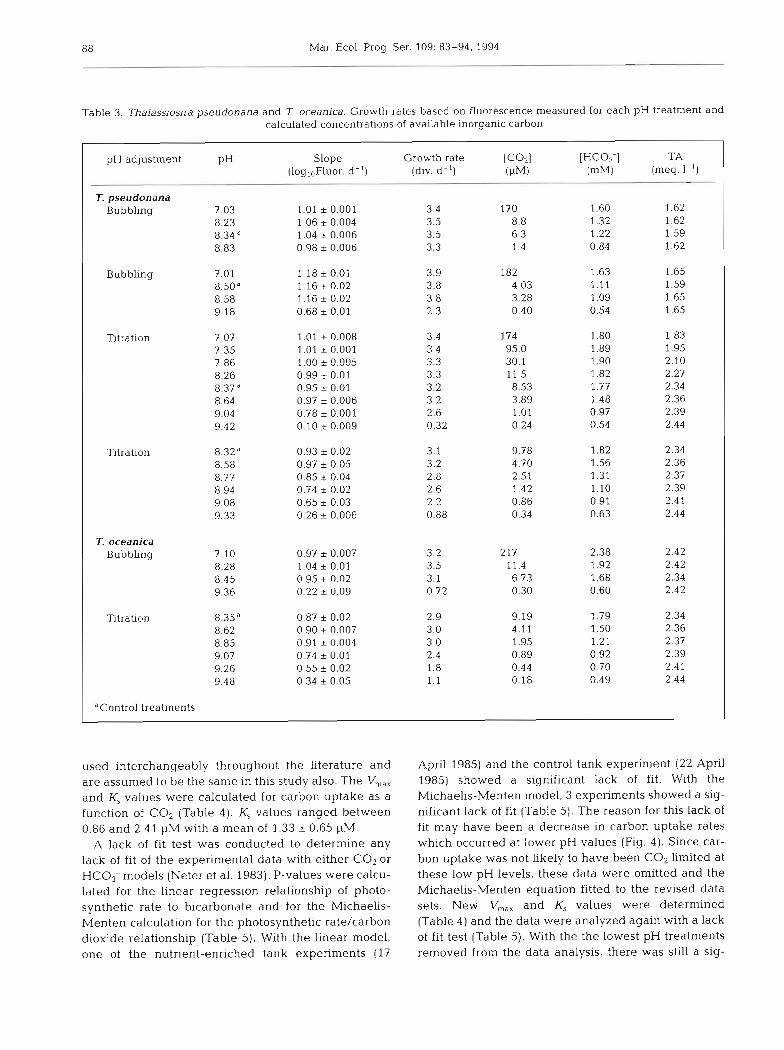
Table 3. Thalassiosira pseudonana and 7 oceanica. Growth rates based on fluorescence measured for each pH treatment and calculated concentrations of available inorganic carbon
pH adjustment PH Slope Growth rate [c021 [HC03-1 TA ( l ~ g , ~ F l u o r . d - ' ) (div. d-l) (PM) (meq. I- ')
7. pseudonana Bubbling 7 03 1.01 i 0.001 3.4 170 1.60 1.62
8 23 1.06 r 0.004 3.5 8.8 1.32 1.62 8.34 1.04 i 0.006 3.5 6.3 1.22 1.59 8.83 0.98 i 0.006 3.3 1.4 0.84 1.62
Bubbling 7.01 1.18 i 0.01 3.9 182 1.63 1.65 8.50" 1.16 i 0.02 3.8 4.03 1.11 1.59 8.58 1.16 i 0.02 3.8 3.28 1.09 1.65 9.18 0.68 i 0.01 2.3 0.40 0.54 1.65
Titration 7.07 7.35 7.86 8.26 8.37" 8.64 9.04 9.42
Titration 8.32d 0.93 * 0.02 3.1 9.78 1.82 2.34 8.58 0.97 i 0.05 3.2 4.70 1.56 2.36 8.77 0.85 i 0.04 2.8 2.51 1.31 2.37 8.94 0.74 i 0.02 2.6 1.42 1.10 2.39 9.08 0.65 i 0.03 2.2 0.86 0.91 2.41 9.33 0.26 i 0.006 0.88 0.34 0.63 2.44
T. oceanica Bubbling 7.10 0.97 * 0.007 3.2 217 2.38 2.42
8.28 1.04 i 0.01 3.5 11.4 1.92 2.42 8.45 0.95 i 0.02 3.1 6.73 1.68 2.34 9.36 0.22 * 0.09 0.72 0.30 0.60 2.42
Titration 8.35" 0.87 * 0.02 2.9 9.19 1.79 2.34 8.62 0.90 * 0.007 3 0 4.11 1 50 2.36 8.85 0.91 * 0.004 3.0 1.95 1.21 2.37 9.07 0.74 r 0.01 2.4 0.89 0.92 2.39 9.26 0.55 i 0.02 1.8 0.44 0.70 2.41 9.48 0.34 i 0.05 1.1 0.18 0.49 2.44
I 'Control treatments I
used interchangeably throughout the literature and are assumed to be the same in this study also. The V,,, and K, values were calculated for carbon uptake as a function of CO, (Table 4 ) . K, values ranged between 0.86 and 2.41 pM with a mean of 1.33 0.65 pM.
A lack of fit test was conducted to determine any lack of fit of the experimental data with either CO2 or HC03-models (Neter et al. 1983). P-values were calcu- lated for the linear regression relationship of photo- synthetic rate to bicarbonate and for the Michaelis- Menten calculation for the photosynthetic rate/carbon dioxide relationship (Table 5). With the linear model, one of the nutrient-enriched tank experiments (l?
April 1985) and the control tank experiment (22 April 1985) showed a significant lack of fit. With the Michaelis-Menten model, 3 experiments showed a sig- nificant lack of fit (Table 5). The reason for this lack of fit may have been a decrease in carbon uptake rates which occurred at lower pH values (Fig. 4). Since car- bon uptake was not likely to have been CO2 limited at these low pH levels, these data were omitted and the Michaelis-Menten equation fitted to the revised data sets. New V,,,,, and K, values were determined (Table 4) and the data were analyzed again with a lack of fit test (Table 5). With the the lowest pH treatments removed from the data analysis, there was still a sig-
Chen & Durbin: Effects of pH on phytoplankton 89
Fig. 2. (a) Thalassiosjra pseudonana; (b) T oceanica. Growth rate vs [HCO,-1. Solid line depicts the predicted Monod
response curve
Fig. 3. (a) Thalassjosira pseudonana; (b) 7: oceanlca. Growth rate vs [COz]. Solid line depicts the predicted Monod
response curve
nificant lack of fit for one of the nutrient-enriched tank experiments (l? April 1985) and the control tank experiment. Given the reasonably good fit of the model to the data (Fig. 6 ) , the continued statistical lack of fit is due more to the limitations of the test than to the appropriateness of the curvilinear function. It is clear from the plots of the carbon uptake response against
EXPERIMENT
0.0 I " " " " I
7 8 9 10
P H
Fig. 4 . Photosynthetic rate expressed as proportion of maxi- mum carbon uptake vs pH for carbon uptake expenments using phytoplankton assemblages from marine niesocosms
[CO2] that the Michaelis-Menten model accounts for the major features of the photosynthetic response par- ticularly at the lower levels of CO2. The lack of fit is actually due to the very small variance at each CO2 level and the resulting deviations from the curvilinear function because the test compares the data by taking mean values for each level rather than averaging over the entire curve.
DISCUSSION
In the past, pH has not been considered to be an important chemical parameter influencing biotic processes in marine environments. However, a num- ber of studies have shown that pH and, in some cases, inorganic carbon may be important in regulating the growth rate and distribution of marine algae (Yoo 1991, Hinga 1992, Riebesell et al. 1993). The results of this study indicate a limitation of phytoplankton growth and photosynthesis at elevated pH levels. Both Thalassiosira pseudonana and 'T: oceanica exhibited a decline in growth above pH 8.8 and minimal growth at pH 9.0. In a similar response, natural populations taken from nutrient-enriched tanks showed dimin- ished carbon uptake at elevated pH levels. When pH was adjusted from ambient levels (8.8 to 8.9) to lower levels (pH 8.0 to 8.3), carbon uptake rates of the natural assemblages were enhanced.
Mar. Ecol. Prog. Ser. 109: 83-94, 1994
Fig. 5. Carbon uptake rate vs [HC03-J plotted with linear regression (solid line) for carbon uptake experiments using phytoplankton assemblages from marine rnesocosms. Experiment dates: (a) 12 April 1985, (b) 13 April 1985, (c) 17 April 1985, (d) 19 April 1985, and
(e) 22 April 1985
Goldman's (1976) study of marine phyto- ::pa, plankton in wastewater documents a decline in growth of Thalassiosira pseudonana and
40 Dunaliella tertiolecta at pH values approaching
20 pH 9 even when excess nutrients were present. o o Phaeodactylum tricornutum, on the other hand, 400 800 1200 1600 0 500 1000 l500
grew at pH values greater than pH 10. Pruder & Bolton (1979) also observed a decline of growth in T. pseudonana as pH approached 8.8. A decline of growth rate with increasing age of cuiture and p i i was observed for the marine diatom Cylindrotheca closterium (Humphrey & Subba Rao 1967) even though nitrate and phos- phate were both available. The authors hypoth- esized a carbon deficiency. Kain & Fogg (1958) observed a similar significant inhibition of growth above pH 8.75 for Isochrysis galbana and above pH 8.5 for Astenonella japonica Gran. These data suggest a general pattern of a limitation of growth at high pH, although there may be species-specific responses.
The decline of both growth rate and photosyn- thesis at high pH in the present study may have been caused by a number of different mecha- nisms including trace metal toxicity or limitation, reduced nutrient availability, or changes in the availability of carbon substrate. Trace metal tox- icity or nutrient availability are unlikely to have been responsible for the decline in growth rate and carbon uptake at high pH for a number of reasons. First, differences have been observed in the nutrient requirements and toxicity responses of Thalassiosira pseudonana and T. oceanica. Brand et al. (1983) and Murphy et al. (1984) have observed that iron, manganese, and
Fig. 6. Carbon uptake vs [COz] and predicted Michaelis-Menten response curve (solid line) vs pH for carbon uptake experiments using phytoplankton assemblages from marine mesocosms. Experi- ment dates: (a) 12 April 1985, (b) 13 April 1985, (c) 17 April 1985,
(d) 19 Apnl 1985, and (e) 22 April 1985
zinc requirements of the 2 species differ by sev- rx :i r-aT, eral orders of magnitude. Similar differences loo have been observed in their copper tolerances (Gavis et al. 1981). Thus, T. pseudonana would
so have required higher concentrations of free iron
0 and tolerated higher concentrations of free cop-
o 20 40 60 80 loo 0 20 40 60 80 l o o per than T. oceanica. If trace metals were influ- [C021, UM encing growth rate, the change in metal specia-
tion and the free ion concentrations over the pH range studied would have resulted in different responses between the 2 phytoplankton species. In the present study, both species responded to pH and presumably metal concentrations in a similar fashion.
Limitation of nitrogen, phosphorus, or silica was also unlikely to cause the observed pH response in this study because these were all in considerable excess in the experiments. Con- centrations in the growth media for the 2 phyto- plankton clones were high enough to sustain
Chen & Durbin: Effects of pH on phytoplankton 91
Table 4. Predicted parameters for carbon uptake (mg C m-3 h-') from Michaelis-Menten models based on calculated
concentrations of CO, (PM)
Experiment KZ v,,, K, date (mg C m-3 h-') (pM)
12 Apr 1985 0.98 7 0 1.5
13 Apr 1985 0.98 122 0.93
17 Apr 1985
18 Apr 1985
22 Apr 1985 1.00 5.7 (control) l.OOb 5.6b
aRecalculated values after omission of lowest pH data point
bRecalculated values after omission of 5 lowest pH data points
exponential growth for periods much longer than the 40 h incubation time. Assemblages used in the carbon uptake experiments were taken from mesocosm tanks which were enriched with NH,, PO,, and SiO, at 4 times the nutrient loading into Narragansett Bay. Meanwhile, the control tank assemblage showed a similar pH response to the nutrient-enriched tanks indicating that nutrient availability was not determin- ing the pH response.
A number of studies have implicated inorganic car- bon limitation of growth as the main mechanism in phytoplankton response to pH. In most of these stud- ies, n~olecular CO2 is considered the major species of
inorganic carbon utilized in photosynthesis (Blackman & Smith 1911, Rabinowitch 1945, Riebesell et al. 1993). It has been shown by Cooper (1969) that CO2 is the car- bon compound within a cell that is critical to photosyn- thesis in binding with the enzyme ribulose bisphos- phate carboxylase. Although relatively few studies have been conducted to investigate the specific forms of carbon substrate used by marine plants, evidence for COz utilization by marine algae has been documented. Isotopic studies using Zi3c have identified CO2 as the carbon source for diatoms (Degens e t al. 1968, Deuser 1970) and have shown HC03- to be utilized by cocco- lithophores (Falkowski 1991). Pruder & Bolton (1979) also studied Thalassiosira pseudonana and attributed the reduction in growth rate at high pH to a combina- tion of pH effect and low CO2 levels. Algal growth rates were reduced in media bubbled with CO2 free air but not changed a t elevated COl levels. More recently, Riebesell e t al. (1993) also measured growth rates and DIC uptake in 3 species of diatoms and found them to be limited by the supply of CO2. Some species of marine phytoplankton also appear capable of concen- trating the supply of CO2 within cells to levels higher than the ambient concentration allowing cells grown at low concentrations to be more efficient at utilizing inorganic carbon from the medium (Zenvirth & Kaplan 1981, Badger & Andrews 1982, Burns & Beardall 1987, Raven & Johnston 1991).
The results in this present study concur with those of Riebesell e t al. (1993) and other studies using diatoms to support the hypothesis that CO2 limitation was the cause of the pH effect on growth and photosynthesis. In both sets of experiments, the relationship of growth and photosynthesis, and [COz] were similar to Monod
rable 5. F-test for lack of fit of linear regression function (mg C m-3 h-' vs [HC03-1) and Michaelis-Menten model (mg C m-3 h-' vs [COzl)
Date Linear regression p-value Michaelis-Menten p-value SSLFa MSPE SSLFa MSPE
12 Apr 1985 107 (6) 634 (8) 0.9541 891 (6) 634 (8) 0.202
13 Apr 1985 956 (7) 699 (9) 0.2107 1043 (7) 699 (9) 0.1781
17 Apr 1985 1377 (6) 400 (16) 0.0002 4832 (6) 400 (16) 0.0000 822 (5)' 313 (14)' 0.0023' 800 (5) C 313 (14)' 0.0007C
18 Apr 1985 336 (10) 345 (12) 0.3925 947 (10) 345 (12) 0.0276 277 (9)' 335 (l l)' 0.4854' 715 (9)' 335 (11)' 0.0682'
22 Apr 1985 0.82 (10) 0.19 (12) 0.0049 (10) 2.26 (12) 0.19 0.0001 (control) 0.16 (51d 0.13 (71d 0.2565d 0.54 (51d 0.13 (7)d 0.0215~
aLack of f i t sum of squares (associated degrees of freedom) bPure error mean square (associated degrees of freedom) CRecalculated values after omission of lowest pH data point dRecalculated values after omission of 5 lowest pH data points
Mar. Ecol. Prog. Ser. 109: 83-94, 1994
and Michaelis-Menten curves for substrate-limited growth rate and uptake. The subsequent half-satura- tion constants for [CO2] calculated from the 2 data sets were also within the limits of values determined in pre- vious studies. The results of the 14C uptake experi- ments using natural assemblages show K, values to be between 0.89 and 2.41 pM for nutrient-enriched and control populations. The K,, values determined in the growth rate experiments for Thalassiosira pseudonana and T. oceanica were 0.45 and 0.49 PM, respectively. T'ne difference in values derived from the growth rate and photosynthesis experiments was most likely due to the metabolic functions being measured.
Past studies of inorganic carbon acquisition in marine algae in the literature contain values of half- saturation constants similar to those in this study, sug- gesting that carbon limitation is not uncommon. Raven & Johnston (1991) compiled data from a number of studies showing that most marine species have K,[C02] values less than 1.7 PM. Burns & Beardall (1987) determined the K,[CO2] values for 6 species of marine microalgae by measuring rates of photosyn- thetic oxygen evolution and found values to range between 0.25 and 1.35 pM CO?. The Ks[C02] values for Stichococcus bacillaris and Phaeodactylum tricor- nutum have been measured to be 1.5 yM (Munoz &
Merrett 1988) and 0.54 pM (Pate1 & Merrett 1986), respectively. Badger & Andrews (1982) calculated the K,[CO2] for Synechococcus sp. to be 0.40 pM and Zen- virth & Kaplan (1981) determined a half-saturation value for photosynthesis to be 2.2 pM CO2 at pH 7.5 for Dunaliella salina.
While there was a positive relationship between [HC03-] and carbon uptake in this study, there are sev- eral reasons why HC03- was not likely to be the cause of the observed growth limitation in these experi- ments. First, there was no apparent saturation plateau in the I4C uptake experiments at levels of HCO,- used in this experiment or at levels observed for saturation in other studies. Either the saturation plateau for car- bon uptake is at an extremely high level of HC03-as indicated by the growth rate experiments or there is no plateau which would indicate the lack of an enzyme- mediated uptake or an active transport mechanism as described by Lucas (1983) for other aquatic plants. Sec- ond, carbon uptake measured in the present study was reduced at HC03- concentrations below about 1 mM. This result contrasts with a number of earlier studies. Scenedesmus quadricauda, a freshwater alga, exhib- ited maximum growth rates at HC03- concentrations as low as 10 pM (Osterlind 1950). In Sargassum muticum, which was reported to assimilate HC03- directly, rate of carbon assimilation remained constant while pH shifted from 8.97 to 9.9 and pC02 fell from 62 to 13 ppm (Thomas & Tregunna 1968). In the present
study, carbon uptake rates were consistently lower at these lower levels of pC02 and higher pH. Finally, Burns & Beardall (1987) found the half-saturation val- ues for HC03- to be approximately 20 pM for 2 species of marine algae, whereas Badger & Andrews (1982) found values to be 42 pM at pH 8 for Synechococcus sp. The K,[HCO3-] for growth rate in this study was not at all comparable, ranging between 1200 and 2100 pM. If we assume that carbon acquisition in these alga is governed by Michaelis-Menten kinetics, then one woulci have to conciude that HC03 was not the limit- ing factor.
Some algal species have been shown to absorb exogenous HC03- which is dehydrated to CO2 within the cell (Badger et al. 1980, Kaplan et al. 1980, Beardall & Raven 1981). Imamura et al. (1983) found that at pH 8.0, freshwater algal cells grown under ordinary air (low-CO2 cells) utilized HC03- as their major form of inorganic carbon while high-CO2 cells utilized CO2. For the marine cyanobacterium Synechococcus sp. both CO2 and HC03- could be used as a substrate but in steady-state photosynthesis in seawater, HC03- uptake into the cell was the primary source of internal inorganic carbon (Badger & Andrews 1982). In con- trast, Riebesell et al. (1993) suggested that bicarbonate uptake does not compensate for the CO2 limitation in diatoms and that CO2 could be limiting during intense blooms. In the present study it was also concluded that bicarbonate is not the limiting substrate.
Several studies have investigated the effects of ele- vated CO2 concentrations on phytoplankton. In fresh- water algae, Sorokin (1962, 1964) reported CO2 to have an inhibitory effect on cell division at high con- centrations. Steeman Nielsen (1955) described a decrease in photosynthetic rate of Chlorella pyrenoi- dosa with increasing CO2 concentrations and hypothe- sized that CO2 could act as a toxin at high concentra- tions in saturating light levels. In marine species, high CO2 concentrations induced growth lags in Crico- sphaera elongata (Swift & Taylor 1966), a phenomenon not observed in this study for Thalassiosira pseudo- nana or T oceanica. Growth rates of Skeletonema costatum and Isochrysis galbana (Small et al. 1977) at elevated CO2 levels were dependent on the acclima- tion of the cells to the new elevated concentrations. Unacclimated cells exhibited clumping and less than optimal growth rates.
In the in vivo fluorescence experiments conducted in this study, growth rates for Thalassiosira pseudonana and 7: oceanica showed a similar response to that observed by Pruder & Bolton (1979) where they remained relatively unchanged between pH 7.0 and 8.8. However, in the carbon uptake experiments, a consistent decline in uptake rate was shown at the lowest pH levels (<pH 7.5) where the highest CO2 con-
Chen 81 Durbin Effects of pH on phytoplankton 93
centrations were found. The response of the natural assemblages of phytoplankton in the present study to low pH and high CO2 could not be interpreted since potential effects of CO2 and pH could not be separated. While the reduction in photosynthesis may have been due to a toxic effect, other possible causes include a reduction in electrochemical potential of the cell mem- brane or acclimation effects such as those described by Small et al. (1977). The relatively short acclimation and incubation periods in the present study may have increased the effects of these factors.
Two different approaches for characterizing phyto- plankton response to pH used in this study yielded similar results over a broad pH range. Furthermore, consistent trends in response to high pH were observed despite the difference in organisms used, i.e. diatom cultures grown in media versus natural popula- tions from the MERL tanks. Based upon the findings in this study, it is suggested that CO2 was the limiting substrate at levels above pH 8.8. High pH levels which have been observed in nutrient-enriched marine sys- tems may have an inhibitory effect on phytoplankton metabolism via the carbonate system. At high pH lev- els, the availability of CO2 decreases and may become limiting to photosynthesis and growth of marine phyto- plankton. Therefore, pH mediated through [CO2] may be an important abiotic factor affecting the ecology of marine phytoplankton.
Acknowledgements. We thank D. Kester and P. Donaghay for their helpful input in the development and execution of this research, C. Ovlatt for the use of the MERL facility, R. Chin- man and R. Sands for their computer assistance, and J. Dykes for his statistical expertise. We also thank P. Schulze, R. Moeller, and K. Hlnga for reviewing the manuscript.
LITERATURE CITED
Badger. M. R.. Andrews, T. J. (1982). Photosynthesis and inor- ganic carbon usage by the marine cyanobacterium, Syne- chococcus sp. Plant Physiol. 70: 517-523
Badger, M. R., Kaplan, A., Berry, J. A. (1980). Internal inor- ganic carbon pool of Chlamydomonas reinhardtii: evi- dence for a carbon dioxide concentrating mechanism. Plant Physiol. 66: 407-413
Beardall, J . , Raven, J. A. (1981). Transport of inorganic carbon and the 'CO:! concentrating mechanism' in Chlorella emersonii (Chlorophyceae). J. Phycol. 17: 134-141
Blackman, F. F., Smith, A. M. (1911). Experimental researches on vegetable assimilation and respiration. IX. On assirnila- tion in submerged water-plants and its relation to the con- centration of carbon dioxide and other factors. Proc. R. Soc. Lond. 83: 389-412
Brand, L. E., Sunda, W. G., Guillard, R. R. L. (1983). Limitation of marine phytoplankton reproductive rates by zinc, man- ganese, and iron. Limnol. Oceanogr. 28: 1182-1198
Brock, T. D. (1973). Lower pH limit for the existence of blue- green algae: evolutionary and ecological implications. Sci- ence 179: 480-483
Burns, B. D., Beardall, J . (1987). Utilization of inorganic car- bon by marine microalgae. J . exp. mar. Biol. Ecol. 107. 75-86
Cooper, T G., Filmer, D , Wishnick, M , , Lane, M. D. (1969). The active species of 'CO*' utilized by ribulose bisphos- phate carboxylase. J . Biol Chem. 244: 1081-1083
Culberson, C., Pytkowicz, R M , Hawley, J . E. (1970). Sea water determination by the pH method. J , mar Kes. 28: 15-21
Degens. E. T., Guillard, R . R . L., Sackett, W. M., Hellebus, J. A. (1968). Metabolic fractionation of carbon isotopes in marine plankton - I. Temperature and respiration experi- ments. Deep Sea Res. 15: 1-9
Deuser, W. G. (1970). Isotopic evidence for diminishing sup- ply of available carbon during a diatom bloom in the Black Sea. Nature 225: 1069-1071
Emery, K. 0 . (1969). A coastal pond. Elsevier, New York Falkowski. P. G. (1991). Species variability in the fractionation
of 13C and ''C by marine phytoplankton. J. Plankton Res. 13: S21-S28
Frithsen. J. B.. Keller, A. A.. Pilson, M. E. Q. (1985). Effects of inorganic nutrient additions in coastal areas: a rnesocosm experiment data report. Vol. 1. MERL Series, Report No. 3, Univ. Rhode Island. Kingston. RI
Gavis. J., Guillard. R. L.. Woodward. B. L. (1981). Cupric ion activity and the growth of phytoplankton clones isolated from different marine environments. J. mar. Res. 39: 315-333
Goldman, J C. (1976). Phytoplankton response to waste- water nutnent enrichment in continuous culture. J. exp. mar. Biol Ecol 23 31-43
Goldman, J C., Azov, Y , Rdey, C B., Dennett, M. R. (1982). The effect of pH in intensive mcroalgal cultures. I. Bio- mass regulation. J. exp. mar Biol Ecol 57: 1-13
Goldman, J. C., Oswald, W J . , Jenkins, D (1974). The kinet- ics of inorganic carbon llmited algal growth. J. Wat. Pollut. Control Fed 46: 554-575
Goldman, J . C. , Riley, C B., Dennett, M. R. (1982). The effect of pH in intensive microalgal cultures. 11. Species competi- tion J , exp. mar. Biol. Ecol 57: 15-24
Goldman, J C , Shapiro, M R. (1973). Carbon dioxide and pH: effect on species succession of algae. Limnol. Oceanogr. 182: 306-307
Guillard, R. R. L. (1973). Division rates. In: Stein, J R. (ed.) Handbook of phycological methods. Cambndge Univer- sity Press. New York. p. 289-31 1
Guillard, R. R. L. (1972). Culture of phytoplankton for feeding marine invertebrates. In: Smith. W. L.. Chanley. M. H. (eds.) Culture of marine invertebrate animals. Plenum Press, New York. p. 29-60
Hinga, K. R. (1992). CO-occurence of dinoflagellate blooms and high pH in marine enclosures. Mar. Ecol. Prog. Ser. 86: 181-187
Hires, R. I., Stroup, E. D., Seitz, R. C. (1963). Atlas of the dis- tribution of dissolved oxygen and pH in Chesapeake Bay, 1949-1961 Ref. 63-4, Chesapeake Bay Institute, Johns Hopkins Univ.. Baltimore
Humphrey, G. F., Subba Rao, D. V. (1967). Photosynthetic rate of the marine diatom Cylindrotheca clostenum. Aust. J . mar. Freshwat. Res. 18: 123-127
Imamura, M,, Tsuzuki, M., Shiraiwa, Y., Miyachi, S. (1983). Form of inorganic carbon utilized for photosynthesis in Chlamydomonas reinhardtii. Plant Cell Physiol. 24: 533-540
Kain, J. M., Fogg, G . E. (1958). Studies on the growth of marine phytoplankton. I. Asterionella japonica Gran. J . mar. biol. Ass. U.K. 37: 781-788
Mar. Ecol. Prog. Ser. 109: 83-94. 1994
Kaplan, A., Badger, M. R., Berry, J. A. (1980). Photosynthesis and the intracellular inorganic carbon pool in the blue- green alga Anabaena variabilis: response to external CO2 concentration. Planta 149: 219-226
Kilham, P,, Hecky, R. E. (1988). Comparative ecology of marine and freshwater phytoplankton. Limnol. Oceanogr. 33: 776-795
King, L. (1970). The role of carbon in eutrophication. J. Wat. Pollut. Control Fed. 42: 2035-2051
Lambert, C., Oviatt, C. (1983). Manual of biological and geo- chemical techniques in coastal areas. MERL Senes # l , Mar. Tech. Rep. 86, Univ. Rhode Island, Kingston, RI
Lucas, W. J. (1983). Photosynthetic assimilation of exogenous HC03- by aquatic plants. A. Rev. Plant. Physiol. 34: 71-104
Lyman, J . (1956). Dissociation of carbonic acid. In: Riley, J. P,, Chester. R. (eds.) Introduction to marine chemistry. Acad- emic Press, London
Marshall, S. M,, Orr, A. P. (1948). Further experiments on the fertilization of a sea loch (Loch Craiglin). The effect of dif- ferent plant nutrients on the phytoplankton. J mar. biol. ASS. U.K. 27: 360-379
Munoz, J., Merrett, M. J. (1988). Inorganic-carbon uptake by a small-celled strain of Stichococcus bacillaris. Planta 175: 460-464
Murphy, L. S., Guillard, R. R. L., Brown, J. F. (1984). The effects of iron and manganese on copper sensitivity in diatoms: differences in the responses of closely related neritic and oceanic species. Biol. Oceanogr. 3: 187-201
Neter, J., Wasserman, W., Kutner, M. H. (1983). Applied lin- ear regression models. Irwin, Hornewood, IL, p. 122-132
Nixon, S. W., Pilson, M. E. Q., Oviatt, C. A., Donaghay, P., Sul- livan, B , Seitzinger, S., Rudnick, D., Frithsen, J . (1983). Eutrophication of a coastal marine ecosystem - an experi- mental study using the MERL microcosms. In: Fasham, M. (ed.) Marine ecosystems: theory and practice. Plenum Press, New York, p. 103-135
Osterlind. S. (1950). Inorganic carbon sources of green algae: 11. Carbonic anhydrase in Scenedesmus quadricauda and Chlorella pyrenoidosa. Physiol. Plant. 3: 430-434
Oviatt, C. A . , Keller, A. A . , Sampou, P. A . , Beatty, L. L. (1986). Patterns of productivity during eutrophication: a meso- cosm experiment. Mar. Ecol. Prog. Ser. 28: 69-80
Owens, 0. H., Essias, W. E. (1976). Physiological responses of phytoplankton to major environmental factors. A. Rev. Plant Physiol. 27. 461-483
Park, K., Hood, D. W., Odum, H. T (1958). Diurnal pH varia- tion in Texas bays and its application to primary produc- tion estimation. Contr, mar Sci. Univ. Texas 5: 47-64
Patel, B. N.. Merrett, M. J. (1986). Inorganic-carbon uptake by the marine diatom Phaeodactylum tricornutum. Planta 169: 222-227
This article was presented by N. S. Fisher, Stony Brook, New York, USA
Pegler, K., Kempe, S. (1988). The carbonate system of the North Sea: determination of alkalinity and TC02 and cal- culation of PCO, and SIcal (Spring 1986). Mitt. geol. palaont. Inst. Univ. Hamb 65: 35-87
Plath, D. C., Johnson, K. S., Pytkowicz, R. M. (1980). The sol- ubhty of calcite - probably containing magnesium - in seawater. Mar. Chem. 10: 9-29
Pruder, G. D., Bolton, E. T. (1979). The role of CO2 enrichment of aerating gas in the growth of an estuarine diatom. Aquaculture 17: 1-15
Rabinowitch, E. 1. (1945). Photosynthesis and related processes. Vol. I . Chemistry of photosynthesis, chemosyn- thesis and related processes in vitro and in vivo. Inter- science Publishers, Inc., New York
Raven, J. A. , Johnston, A. M. (1991). Mechanisms of inor- ganic-carbon acquistion In marine phytoplankton and their implications for the use of other resources. Limnol. Oceanogr. 36: 1701-1714
Riebesell U., Wolf-Gladrow, D. A., Smetacek, V. (1993). Car- bon dioxide limitation of marine phytoplankton growth rates. Nature 361: 249-251
Shapiro. J. (1973). Blue-green algae: why they become domi- nant. Science 179: 382-384
Small, L. F., Donaghay, P. L . , Pytkowicz, R. M. (1977). Effects of enhanced CO2 levels on growth characteristics of two marine phytoplankton species. In: Andersen, N. R., Mala- hoff, A. (eds.) The fate of fossil fuel CO2 in the oceans. Plenum Press, New York, p. 183-204
Sorokin. C. (1962). Inhibition of cell division by carbon diox- ide. Nature 194: 496-497
Sorokin, C. (1964). Carbon dioxide and cell division. Nature 203 1252-1254
Steeman Nielsen. E. (1955). Carbon dioxide as a carbon source and narcotic in photosynthesis and growth of Chlorella pyrenoidosa. Physiol. Plant. 8: 317-335
Steeman Nielsen, E. (1975). Marine photosynthesis with spe- cial emphasis on the ecological aspects. Elsevier Scientific Publishing Co.. New York
Strickland. J. D. H., Parsons. T. R. (1965). A manual of sea water analysis. Bull. Fish. Res. Bd Can. 125
Swift, E., Taylor, W. R. (1966). The effect of pH on the division rate of the coccolithophorid Cncosphaera elongata. J . Phy- col. 2: 121-125
Thomas, E. A . , TI-egunna, E. P. (1968). Carbonate ion assimi- lation in photosynthesis by Sargassum muLicum. Can. J. Bot. 46: 411-416
Yoo, K. 1. (1991). Population dynamics of dinoflagellate com- munity in Masan Bay with a note on the impact of envi- ronmental parameters. Mar. Pollut. Bull. 23: 185-188
Zenvirth, D., Kaplan, A. (1981). Uptake and efflux of inor- ganic carbon in Dunaliella salina. Planta 152: 8-12
Manuscrjpt first received: Apnl20, 1993 Revised version accepted: March 14, 1994