Embed Size (px)
Citation preview
Celebrating Our 2021 Retailer of the Year:Sawall Health Foods
The State of Natural and Organic Expo East 2021
Biofach America 2021
State of Natural and Organic Sponsor
Kate WeidnerSRW Agency
Charlie StoneSRW Agency
CARLOTTA MASTSVP & Market LeaderNew Hope Network
NICK MCCOYManaging PartnerWhipstitch Capital
KATHRYN PETERSEVP – Strategic Initiatives
SPINS
State of Natural and Organic Presenters
Creating a World Worth Saving by 2030
#expoeast2021
The State of Our Natural& Organic Industry Today
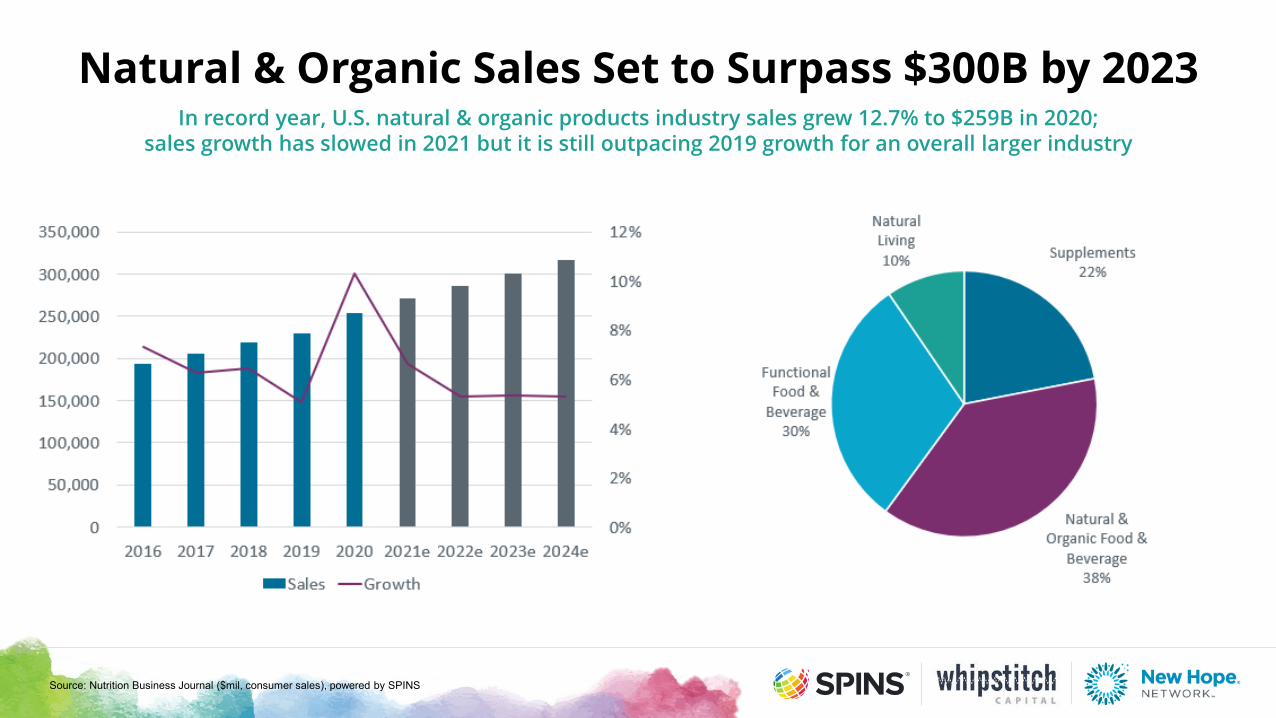
In record year, U.S. natural & organic products industry sales grew 12.7% to $259B in 2020; sales growth has slowed in 2021 but it is still outpacing 2019 growth for an overall larger industry
Natural & Organic Sales Set to Surpass $300B by 2023
Source: Nutrition Business Journal ($mil, consumer sales), powered by SPINS
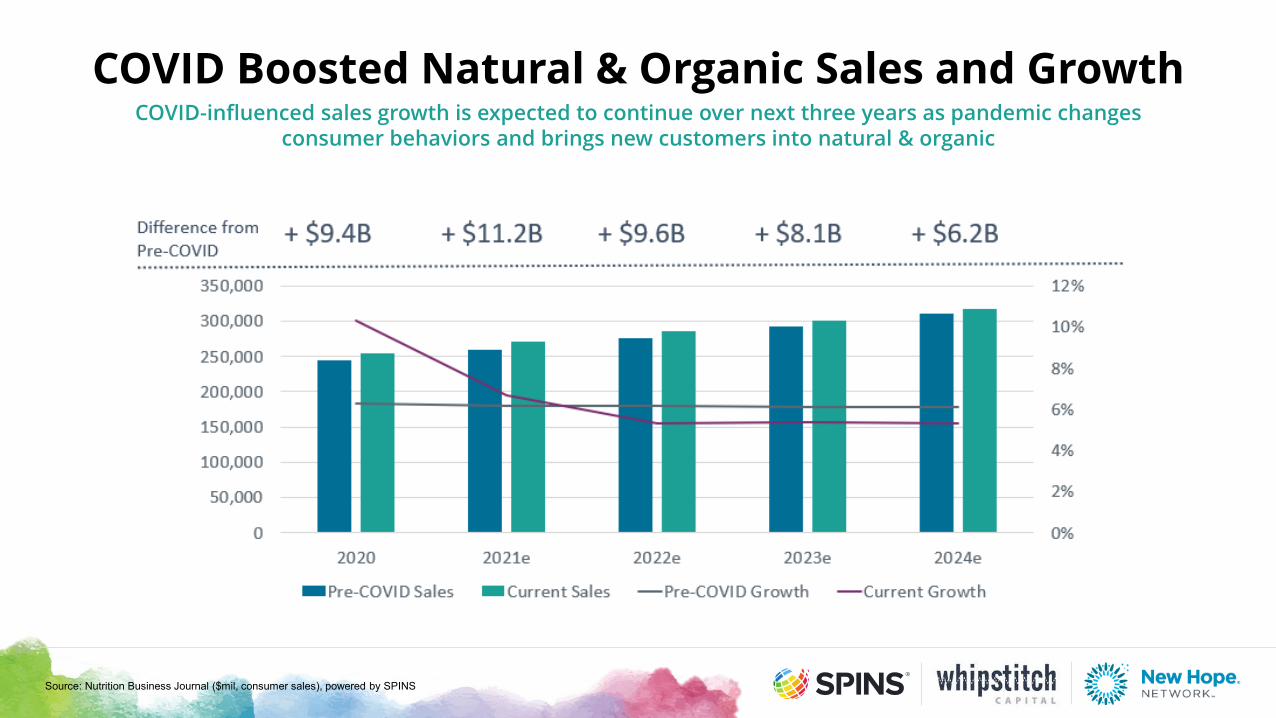
COVID-influenced sales growth is expected to continue over next three years as pandemic changes consumer behaviors and brings new customers into natural & organic
COVID Boosted Natural & Organic Sales and Growth
Source: Nutrition Business Journal ($mil, consumer sales), powered by SPINS
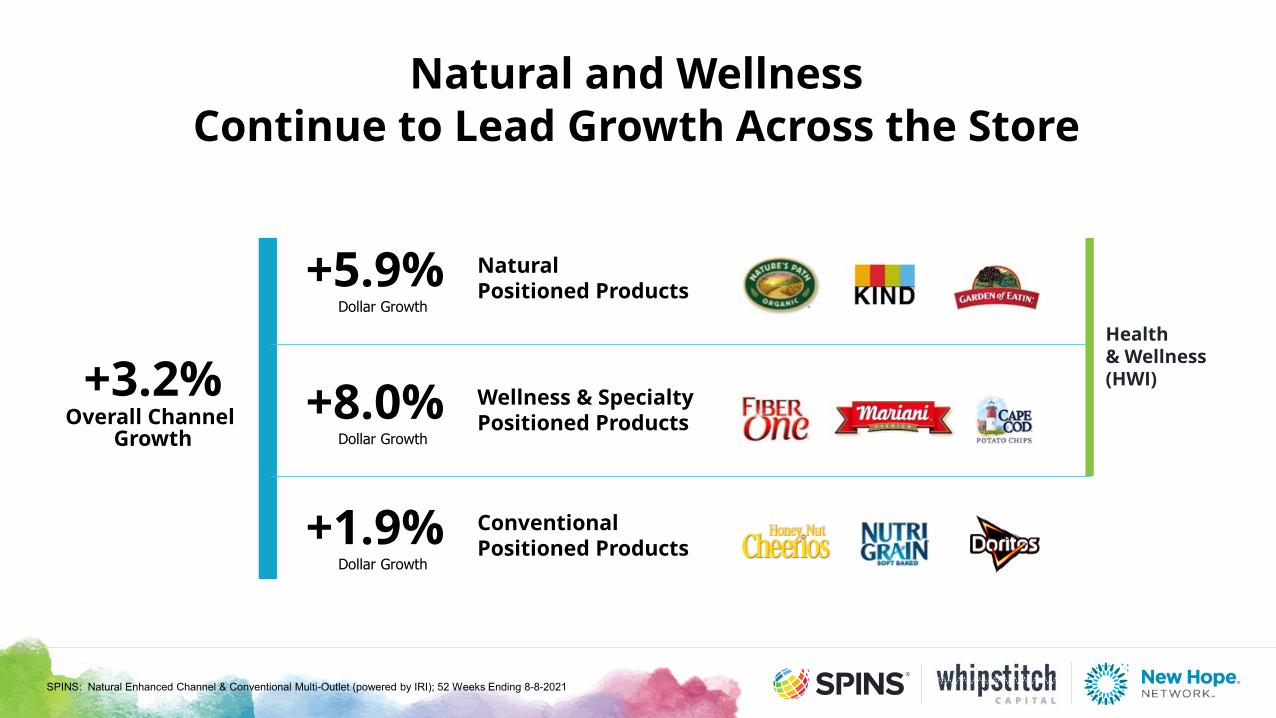
Natural and Wellness Continue to Lead Growth Across the Store
SPINS: Natural Enhanced Channel & Conventional Multi-Outlet (powered by IRI); 52 Weeks Ending 8-8-2021
Conventional Positioned Products
Natural Positioned Products
Dollar Growth+5.9%
Wellness & Specialty Positioned Products
Health & Wellness (HWI)
+8.0%Dollar Growth
+1.9%Dollar Growth
+3.2%Overall Channel
Growth
Source: IRI All Outlet Panel, Enhanced with SPINS Product Attribution. Quad Weeks Ending 4.18.2021
22.2%18.9%
16.5%18.2% 17.2% 15.9%
18.0%
13.5%
-15.8%
4.1%0.7%
4.1% 3.4%
15.6%
12.3% 12.8% 13.0% 13.0%
9.8%
14.6%
11.3%
-16.0%
0.3% -0.6%
-20.0%
-15.0%
-10.0%
-5.0%
0.0%
5.0%
10.0%
15.0%
20.0%
25.0%
4 WE Aug-09-2020
4 WE Sep-06-2020
4 WE Oct-04-2020
4 WE Nov-01-2020
4 WE Nov-29-2020
4 WE Dec-27-2020
4 WE Jan-24-2021 4 WE Feb-21-2021
4 WE Mar-21-2021
4 WE Apr-18-2021
4 WE May-16-2021
4 WE Jun-13-2021
4 WE Jul-11-2021
NPI TPL
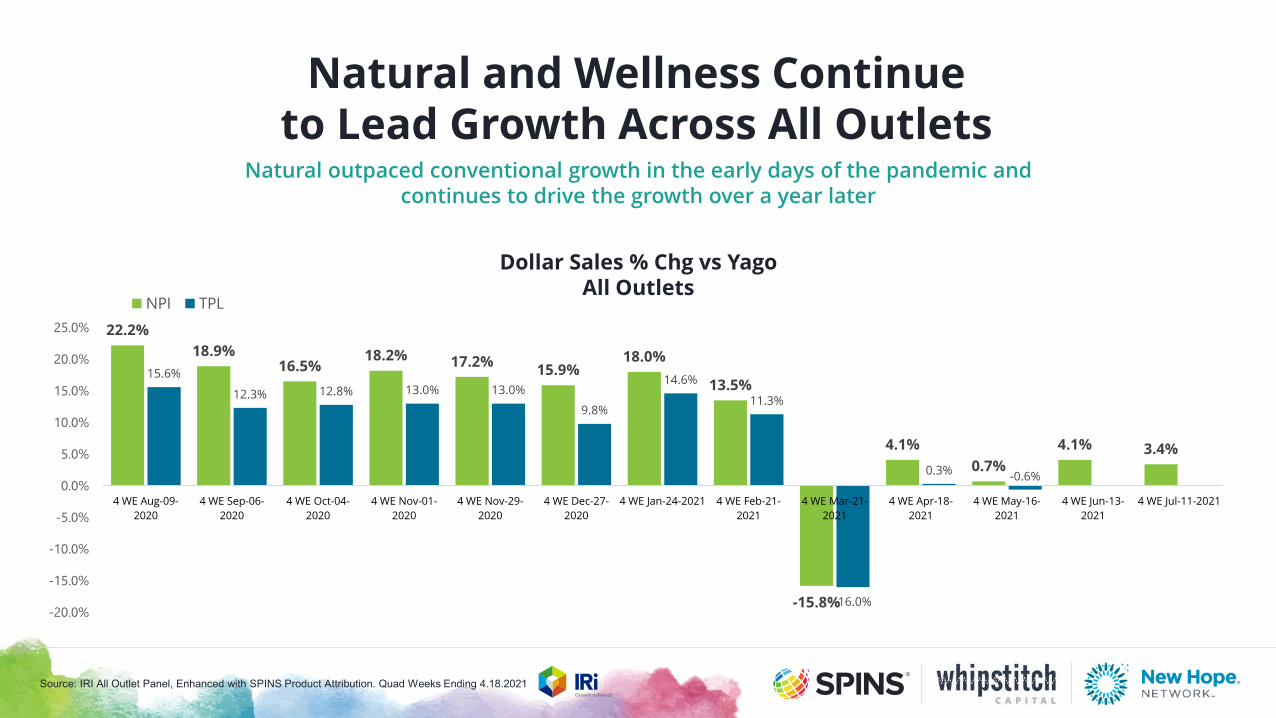
Dollar Sales % Chg vs YagoAll Outlets
Natural outpaced conventional growth in the early days of the pandemic and continues to drive the growth over a year later
Natural and Wellness Continue to Lead Growth Across All Outlets
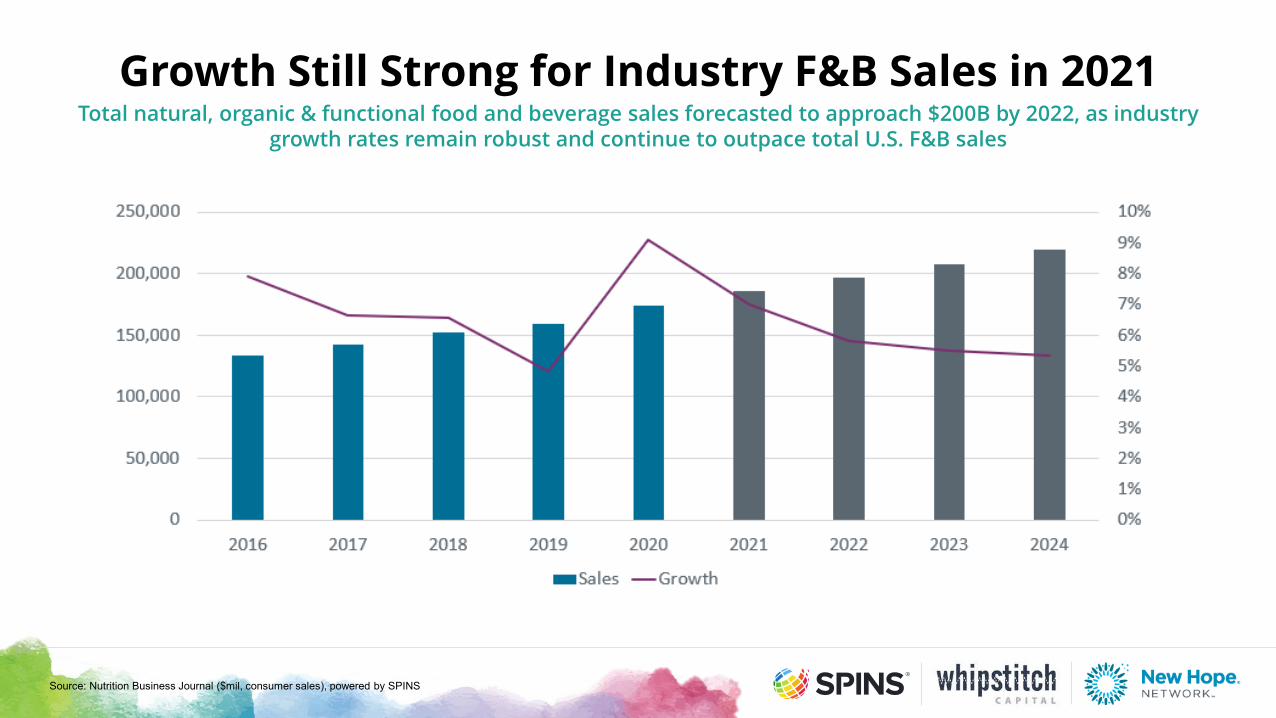
Total natural, organic & functional food and beverage sales forecasted to approach $200B by 2022, as industry growth rates remain robust and continue to outpace total U.S. F&B sales
Growth Still Strong for Industry F&B Sales in 2021
Source: Nutrition Business Journal ($mil, consumer sales), powered by SPINS
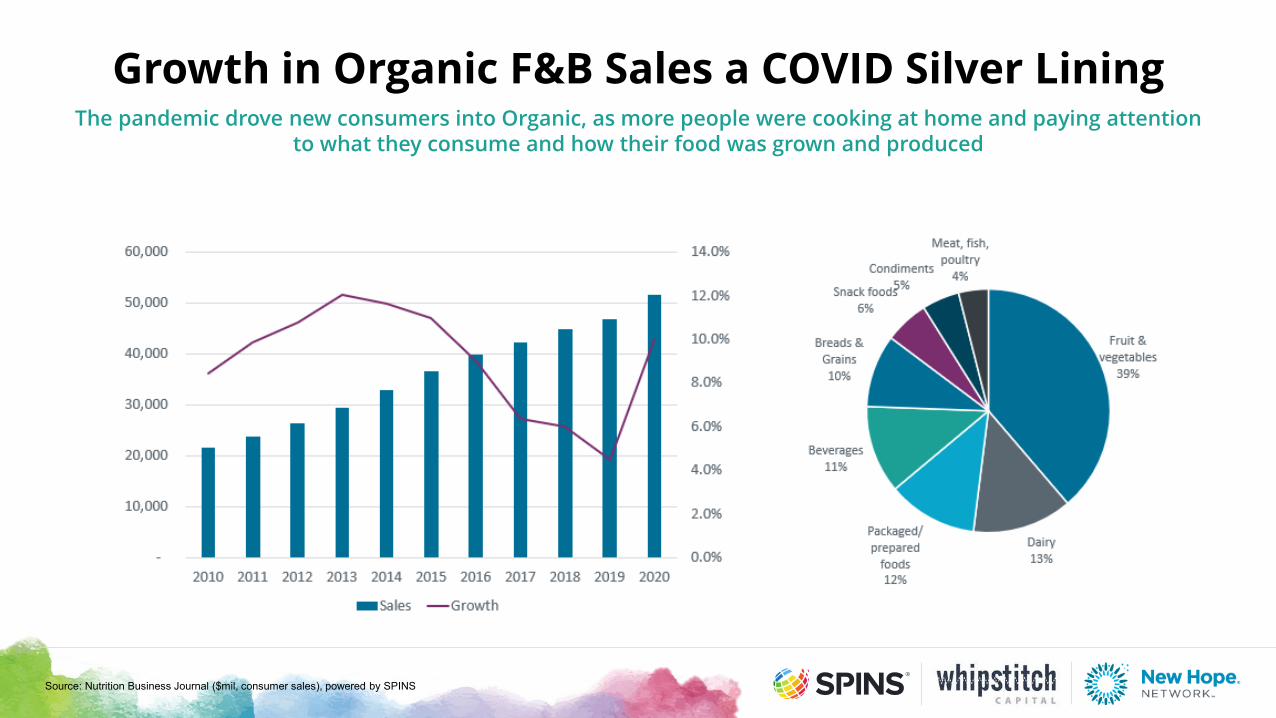
The pandemic drove new consumers into Organic, as more people were cooking at home and paying attention to what they consume and how their food was grown and produced
Growth in Organic F&B Sales a COVID Silver Lining
Source: Nutrition Business Journal ($mil, consumer sales), powered by SPINS
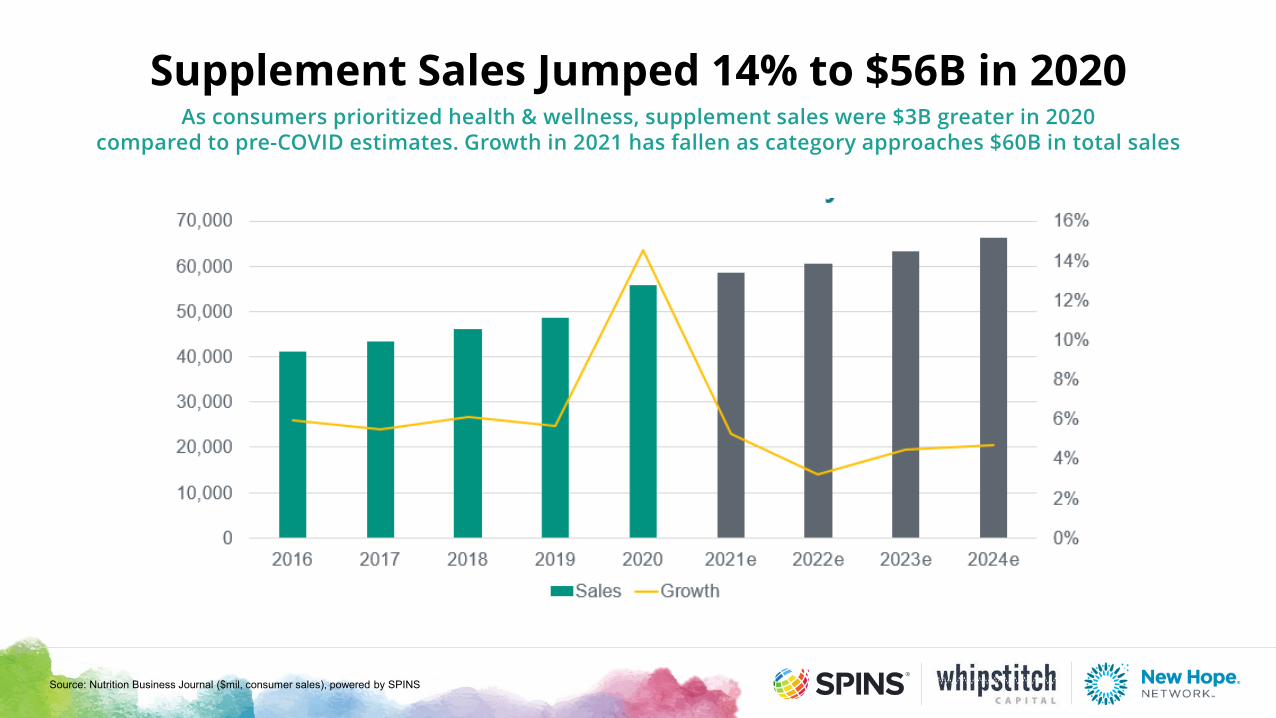
Source: Nutrition Business Journal ($mil, consumer sales), powered by SPINS
Supplement Sales Jumped 14% to $56B in 2020As consumers prioritized health & wellness, supplement sales were $3B greater in 2020
compared to pre-COVID estimates. Growth in 2021 has fallen as category approaches $60B in total sales
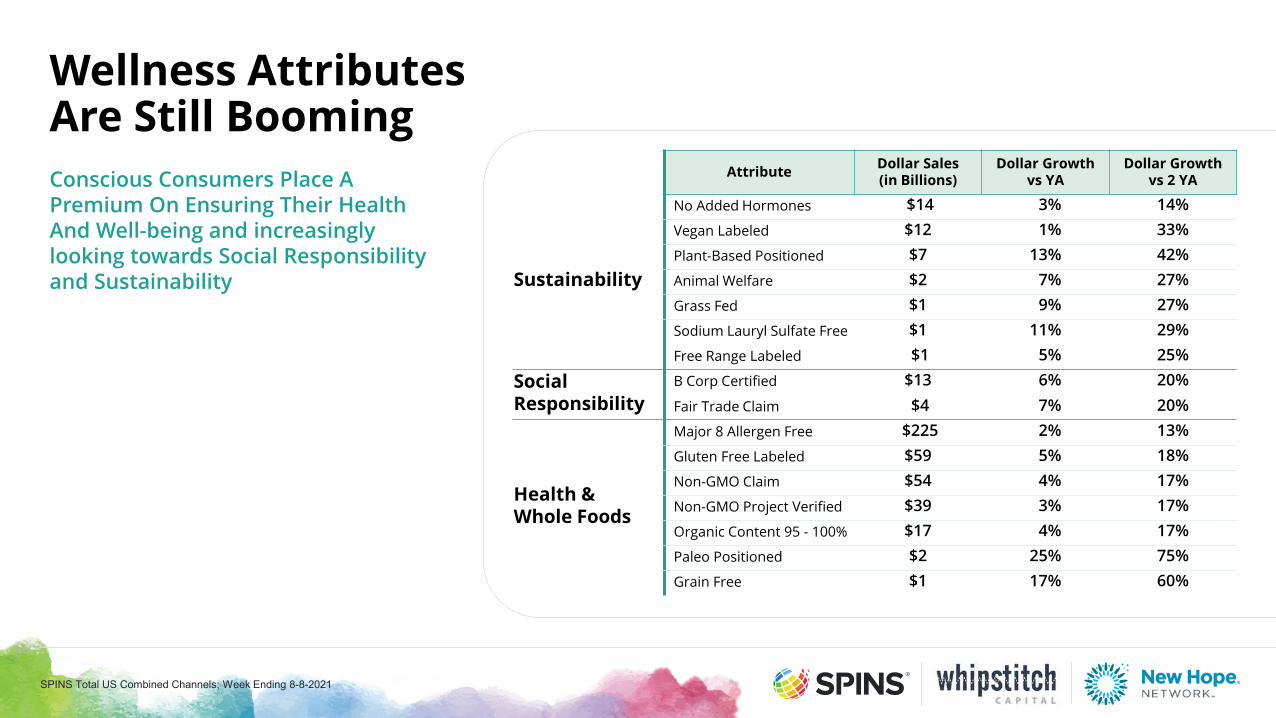
Wellness Attributes Are Still Booming
SPINS Total US Combined Channels; Week Ending 8-8-2021
Conscious Consumers Place A Premium On Ensuring Their Health And Well-being and increasingly looking towards Social Responsibility and Sustainability
Attribute Dollar Sales (in Billions)
Dollar Growth vs YA
Dollar Growth vs 2 YA
Sustainability
No Added Hormones $14 3% 14%Vegan Labeled $12 1% 33%Plant-Based Positioned $7 13% 42%Animal Welfare $2 7% 27%Grass Fed $1 9% 27%Sodium Lauryl Sulfate Free $1 11% 29%Free Range Labeled $1 5% 25%
Social Responsibility
B Corp Certified $13 6% 20%Fair Trade Claim $4 7% 20%
Health & Whole Foods
Major 8 Allergen Free $225 2% 13%Gluten Free Labeled $59 5% 18%Non-GMO Claim $54 4% 17%Non-GMO Project Verified $39 3% 17%Organic Content 95 - 100% $17 4% 17%Paleo Positioned $2 25% 75%Grain Free $1 17% 60%
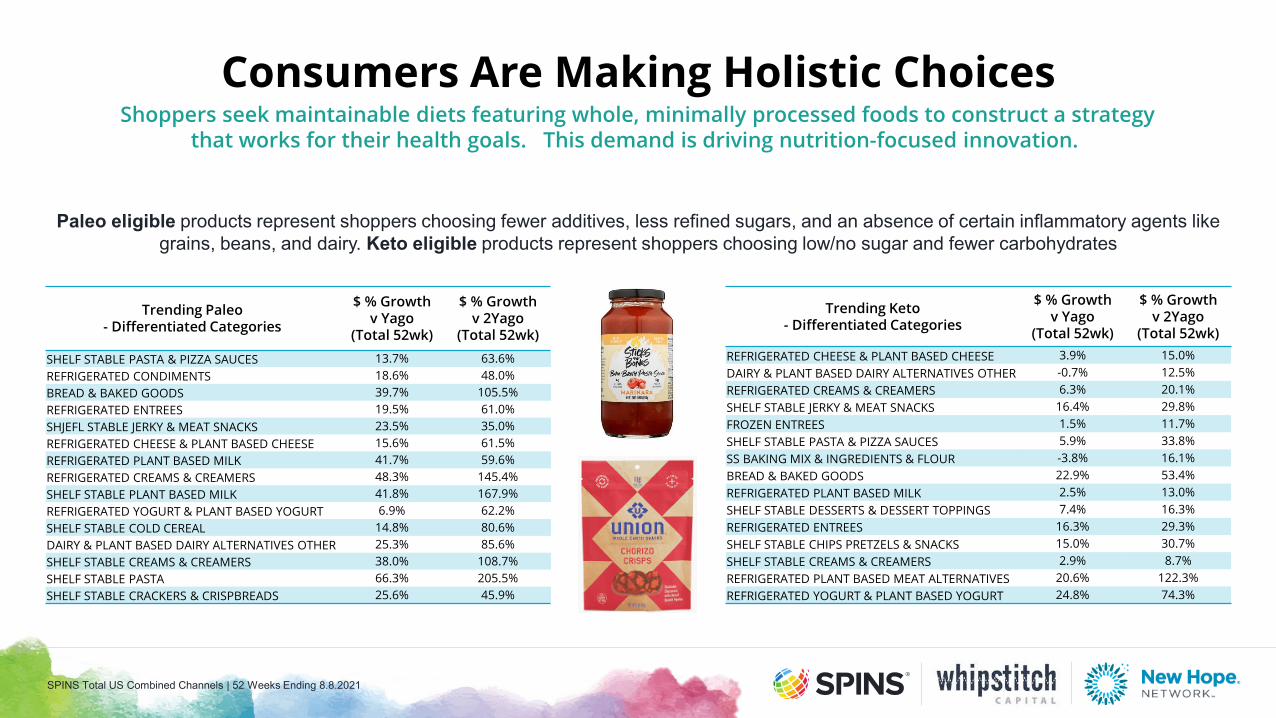
Consumers Are Making Holistic Choices
Trending Keto - Differentiated Categories
$ % Growth v Yago
(Total 52wk)
$ % Growth v 2Yago
(Total 52wk)REFRIGERATED CHEESE & PLANT BASED CHEESE 3.9% 15.0%DAIRY & PLANT BASED DAIRY ALTERNATIVES OTHER -0.7% 12.5%REFRIGERATED CREAMS & CREAMERS 6.3% 20.1%SHELF STABLE JERKY & MEAT SNACKS 16.4% 29.8%FROZEN ENTREES 1.5% 11.7%SHELF STABLE PASTA & PIZZA SAUCES 5.9% 33.8%SS BAKING MIX & INGREDIENTS & FLOUR -3.8% 16.1%BREAD & BAKED GOODS 22.9% 53.4%REFRIGERATED PLANT BASED MILK 2.5% 13.0%SHELF STABLE DESSERTS & DESSERT TOPPINGS 7.4% 16.3%REFRIGERATED ENTREES 16.3% 29.3%SHELF STABLE CHIPS PRETZELS & SNACKS 15.0% 30.7%SHELF STABLE CREAMS & CREAMERS 2.9% 8.7%REFRIGERATED PLANT BASED MEAT ALTERNATIVES 20.6% 122.3%REFRIGERATED YOGURT & PLANT BASED YOGURT 24.8% 74.3%
Paleo eligible products represent shoppers choosing fewer additives, less refined sugars, and an absence of certain inflammatory agents likegrains, beans, and dairy. Keto eligible products represent shoppers choosing low/no sugar and fewer carbohydrates
Trending Paleo - Differentiated Categories
$ % Growth v Yago
(Total 52wk)
$ % Growth v 2Yago
(Total 52wk)
SHELF STABLE PASTA & PIZZA SAUCES 13.7% 63.6%REFRIGERATED CONDIMENTS 18.6% 48.0%BREAD & BAKED GOODS 39.7% 105.5%REFRIGERATED ENTREES 19.5% 61.0%SHJEFL STABLE JERKY & MEAT SNACKS 23.5% 35.0%REFRIGERATED CHEESE & PLANT BASED CHEESE 15.6% 61.5%REFRIGERATED PLANT BASED MILK 41.7% 59.6%REFRIGERATED CREAMS & CREAMERS 48.3% 145.4%SHELF STABLE PLANT BASED MILK 41.8% 167.9%REFRIGERATED YOGURT & PLANT BASED YOGURT 6.9% 62.2%SHELF STABLE COLD CEREAL 14.8% 80.6%DAIRY & PLANT BASED DAIRY ALTERNATIVES OTHER 25.3% 85.6%SHELF STABLE CREAMS & CREAMERS 38.0% 108.7%SHELF STABLE PASTA 66.3% 205.5%SHELF STABLE CRACKERS & CRISPBREADS 25.6% 45.9%
SPINS Total US Combined Channels | 52 Weeks Ending 8.8.2021
Shoppers seek maintainable diets featuring whole, minimally processed foods to construct a strategy that works for their health goals. This demand is driving nutrition-focused innovation.
Frozen, Refrigerated, & Grocery Departments, 52 weeks ending 8.8.21.
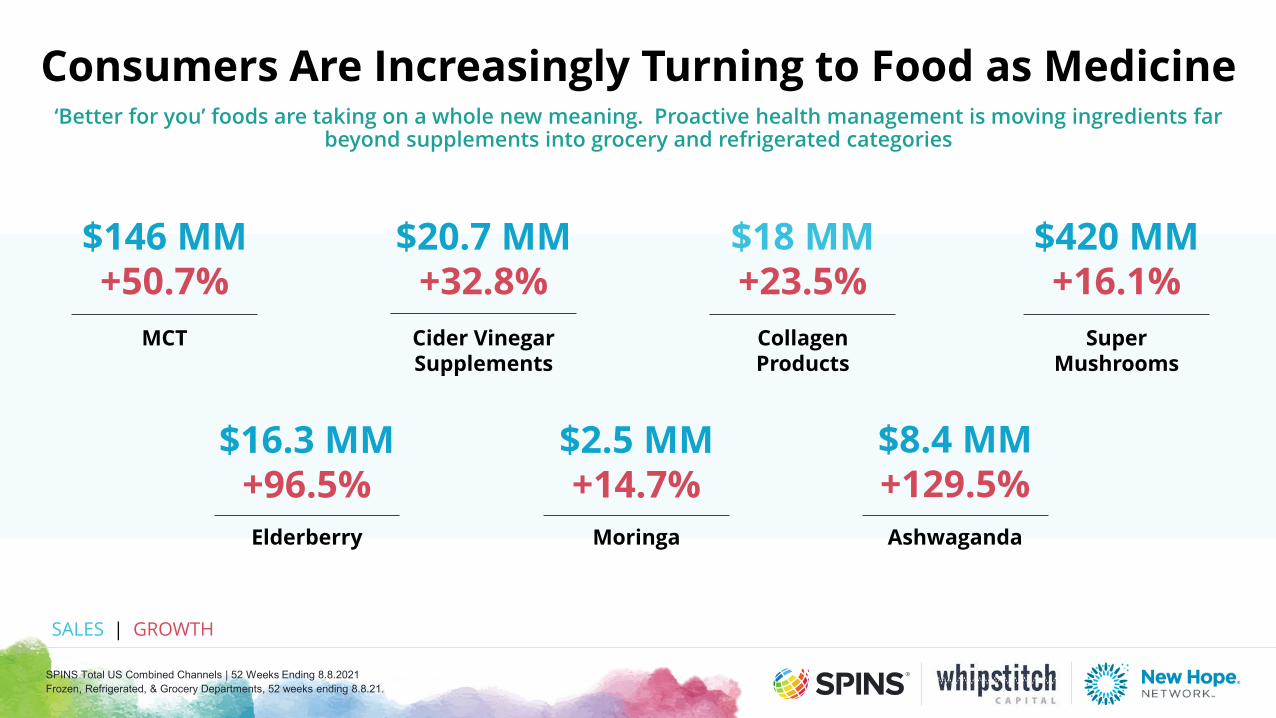
‘Better for you’ foods are taking on a whole new meaning. Proactive health management is moving ingredients far beyond supplements into grocery and refrigerated categories
Consumers Are Increasingly Turning to Food as Medicine
Cider VinegarSupplements
$20.7 MM+32.8%
MCT
$146 MM+50.7%
CollagenProducts
$18 MM+23.5%
SuperMushrooms
$420 MM+16.1%
Elderberry
$16.3 MM+96.5%
Moringa
$2.5 MM+14.7%
Ashwaganda
$8.4 MM+129.5%
SALES | GROWTH
SPINS Total US Combined Channels | 52 Weeks Ending 8.8.2021
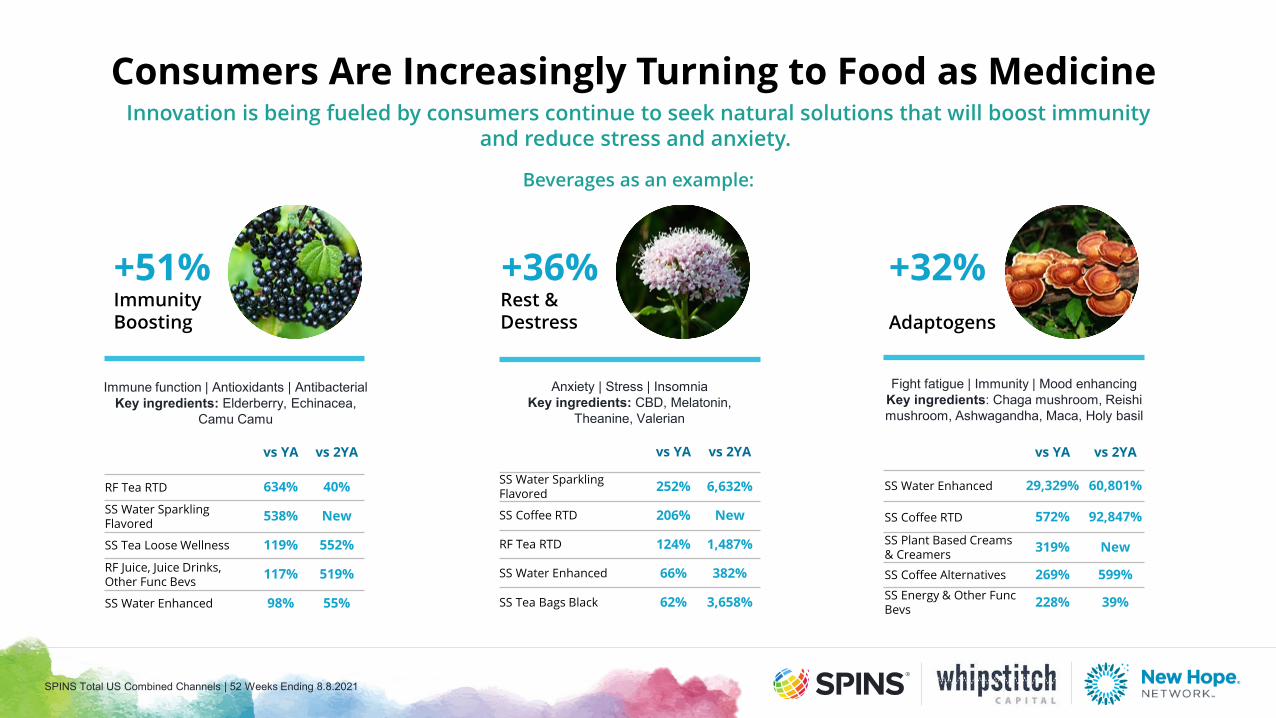
Innovation is being fueled by consumers continue to seek natural solutions that will boost immunity and reduce stress and anxiety.
Beverages as an example:
Fight fatigue | Immunity | Mood enhancingKey ingredients: Chaga mushroom, Reishimushroom, Ashwagandha, Maca, Holy basil
Immune function | Antioxidants | AntibacterialKey ingredients: Elderberry, Echinacea,
Camu Camu
vs YA vs 2YA
RF Tea RTD 634% 40%SS Water Sparkling Flavored 538% New
SS Tea Loose Wellness 119% 552%RF Juice, Juice Drinks, Other Func Bevs 117% 519%
SS Water Enhanced 98% 55%
Anxiety | Stress | InsomniaKey ingredients: CBD, Melatonin,
Theanine, Valerian
Consumers Are Increasingly Turning to Food as Medicine
vs YA vs 2YA
SS Water Sparkling Flavored 252% 6,632%
SS Coffee RTD 206% New
RF Tea RTD 124% 1,487%
SS Water Enhanced 66% 382%
SS Tea Bags Black 62% 3,658%
vs YA vs 2YA
SS Water Enhanced 29,329% 60,801%
SS Coffee RTD 572% 92,847%
SS Plant Based Creams & Creamers 319% New
SS Coffee Alternatives 269% 599%SS Energy & Other Func Bevs 228% 39%
Immunity Boosting
+51% +36% +32%Rest &Destress Adaptogens
SPINS Total US Combined Channels | 52 Weeks Ending 8.8.2021
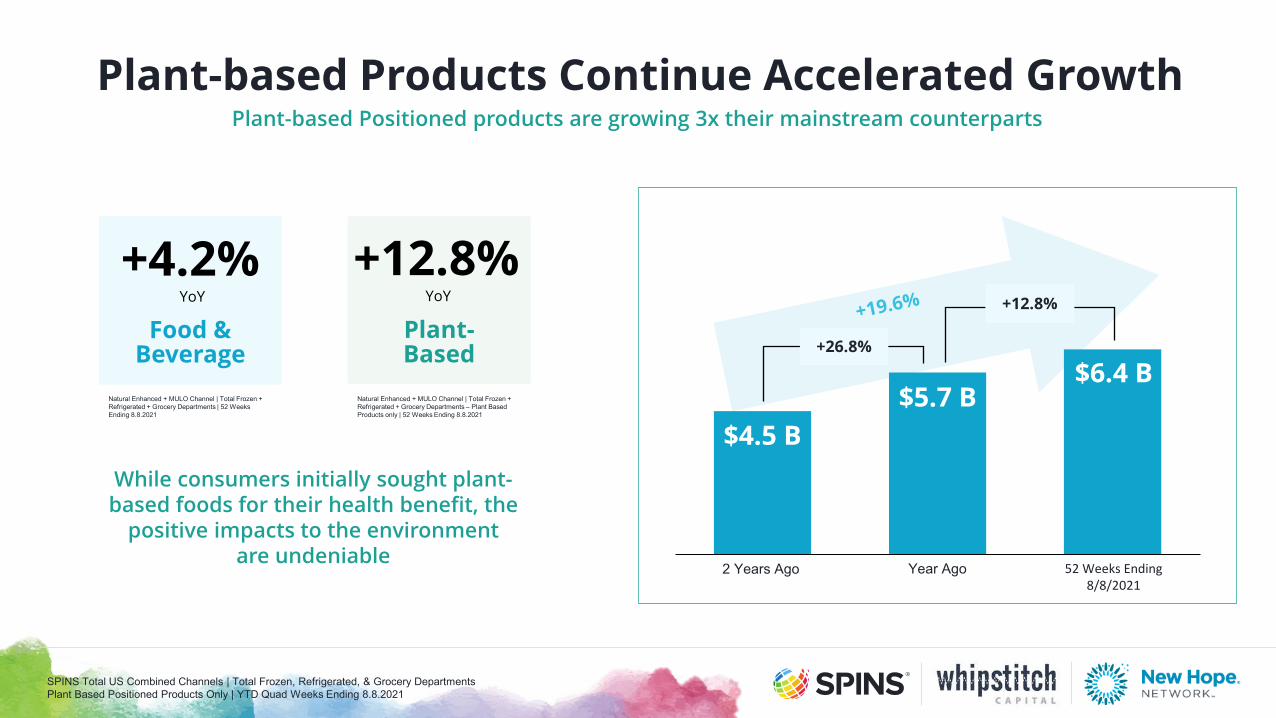
Plant-based Products Continue Accelerated Growth
SPINS Total US Combined Channels | Total Frozen, Refrigerated, & Grocery Departments Plant Based Positioned Products Only | YTD Quad Weeks Ending 8.8.2021
Plant-based Positioned products are growing 3x their mainstream counterparts
2 Years Ago
$6.4 B
Year Ago
$4.5 B
52 Weeks Ending 8/8/2021
$5.7 B
+26.8%
+12.8%
Natural Enhanced + MULO Channel | Total Frozen + Refrigerated + Grocery Departments | 52 Weeks Ending 8.8.2021
Natural Enhanced + MULO Channel | Total Frozen + Refrigerated + Grocery Departments – Plant Based Products only | 52 Weeks Ending 8.8.2021
Food & Beverage
Plant-Based
+4.2%YoY
+12.8%YoY
While consumers initially sought plant-based foods for their health benefit, the
positive impacts to the environment are undeniable
Source: Nutrition Business Journal ($mil, consumer sales), powered by SPINS
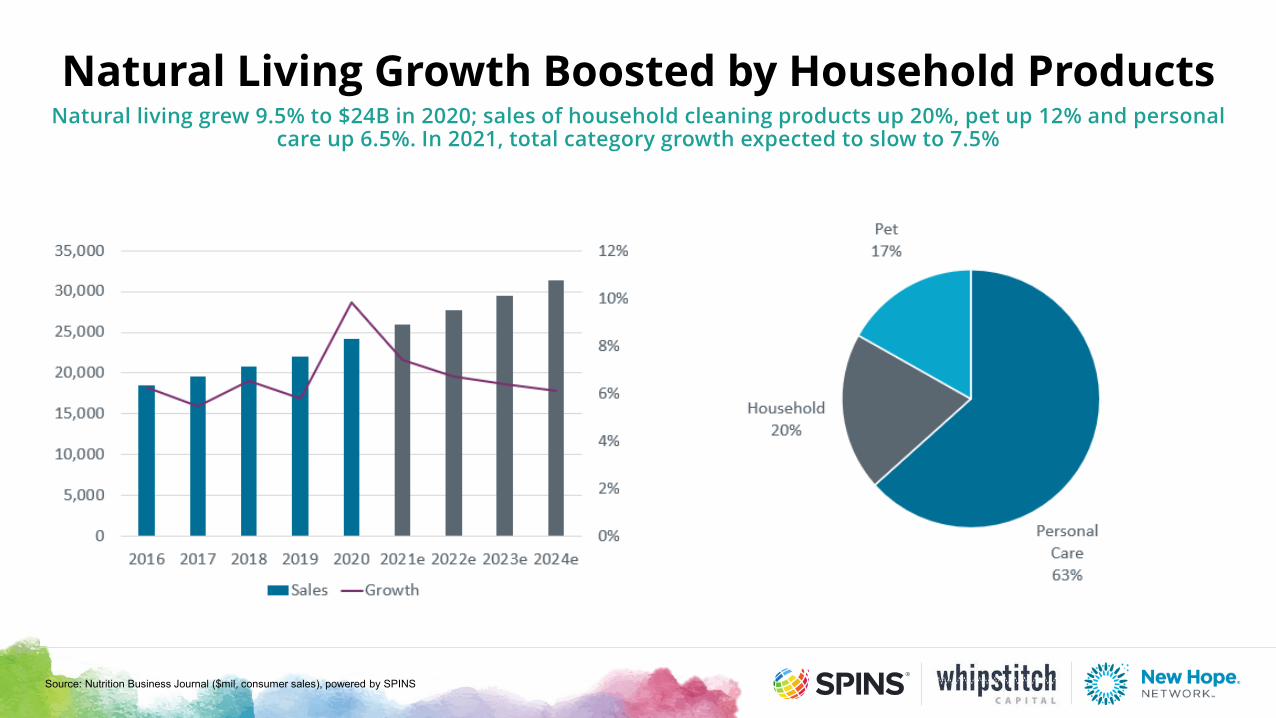
Natural Living Growth Boosted by Household ProductsNatural living grew 9.5% to $24B in 2020; sales of household cleaning products up 20%, pet up 12% and personal
care up 6.5%. In 2021, total category growth expected to slow to 7.5%
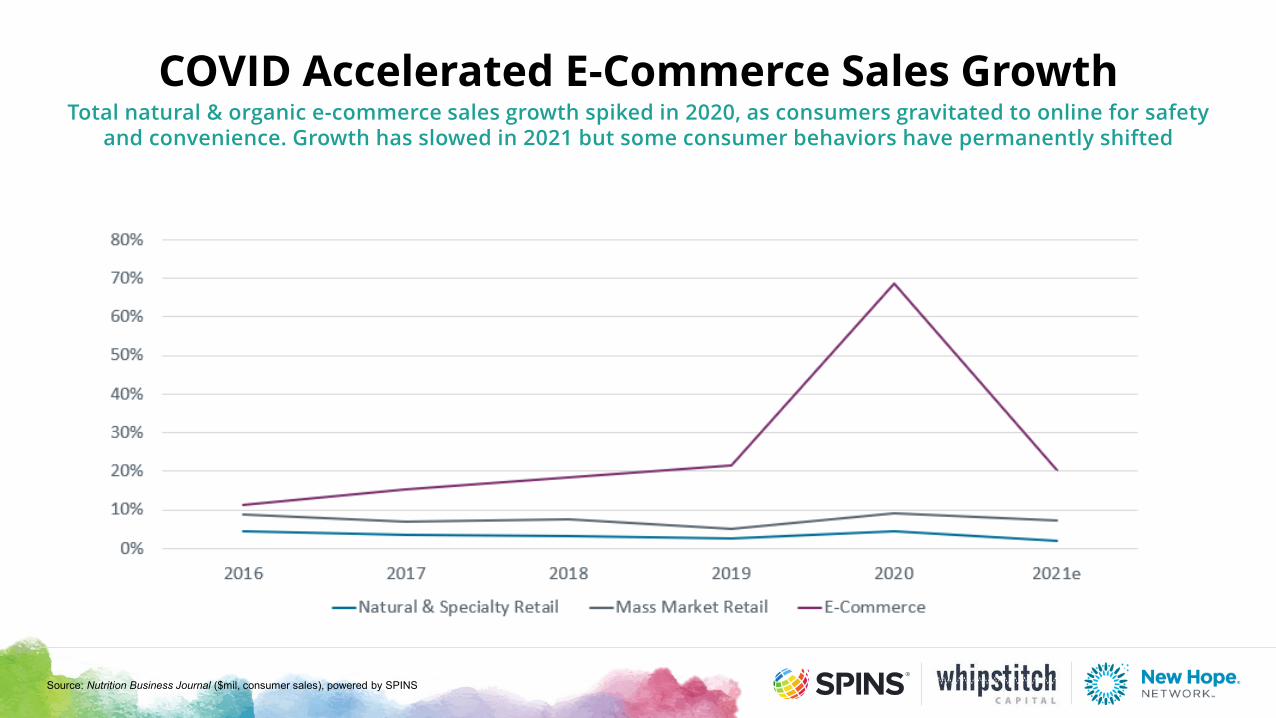
COVID Accelerated E-Commerce Sales GrowthTotal natural & organic e-commerce sales growth spiked in 2020, as consumers gravitated to online for safety
and convenience. Growth has slowed in 2021 but some consumer behaviors have permanently shifted
Source: Nutrition Business Journal ($mil, consumer sales), powered by SPINS
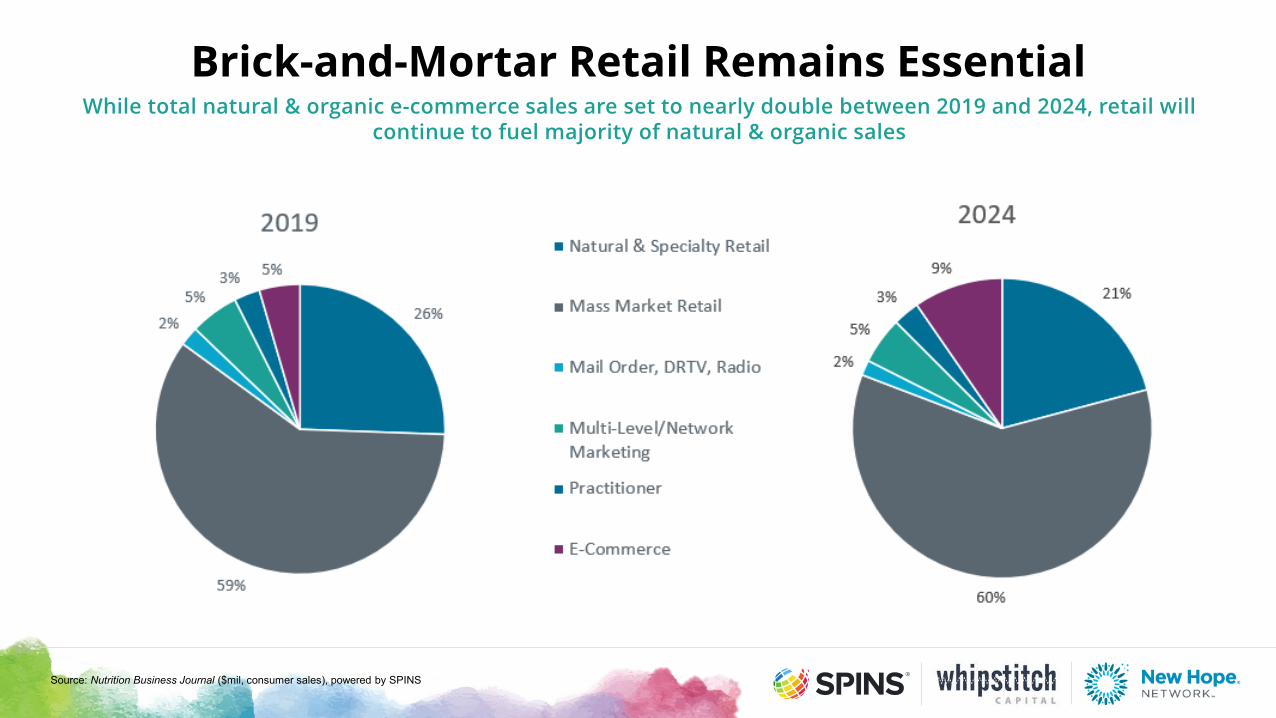
Brick-and-Mortar Retail Remains EssentialWhile total natural & organic e-commerce sales are set to nearly double between 2019 and 2024, retail will
continue to fuel majority of natural & organic sales
Source: Nutrition Business Journal ($mil, consumer sales), powered by SPINS
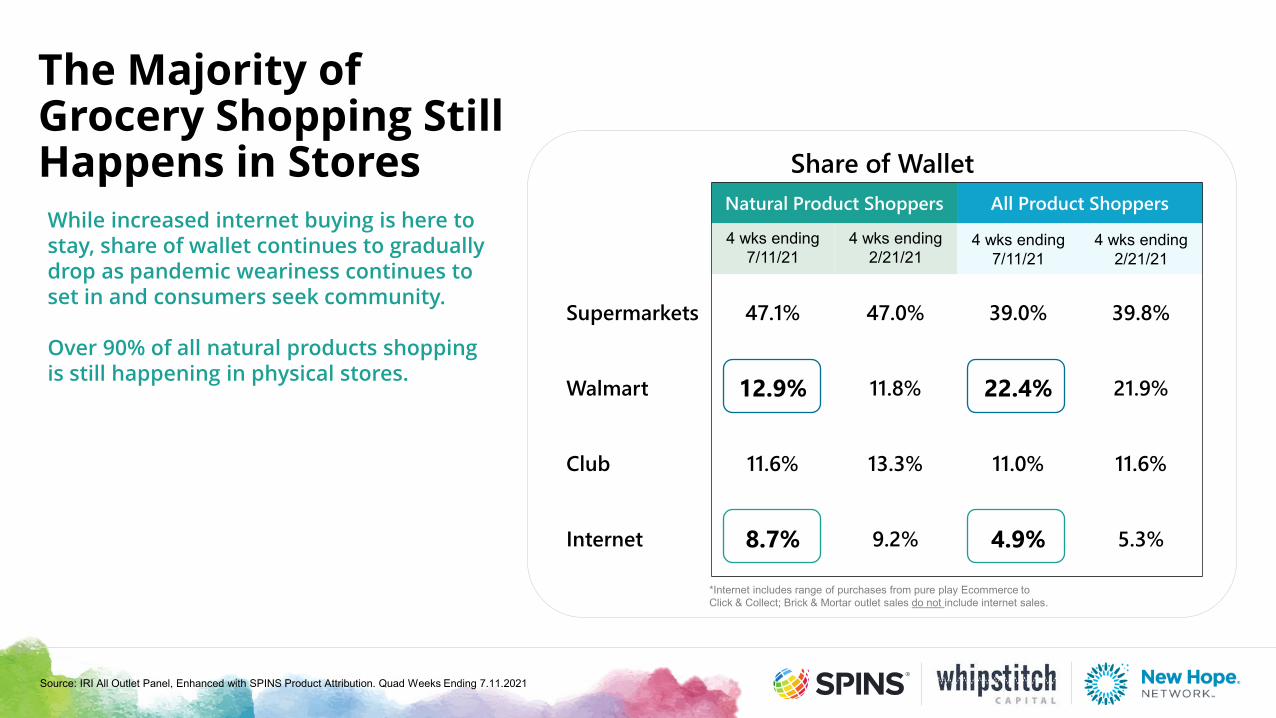
The Majority of Grocery Shopping Still Happens in StoresWhile increased internet buying is here to stay, share of wallet continues to gradually drop as pandemic weariness continues to set in and consumers seek community.
Over 90% of all natural products shopping is still happening in physical stores.
Source: IRI All Outlet Panel, Enhanced with SPINS Product Attribution. Quad Weeks Ending 7.11.2021
Share of WalletNatural Product Shoppers All Product Shoppers
4 wks ending 7/11/21
4 wks ending 2/21/21
4 wks ending 7/11/21
4 wks ending 2/21/21
Supermarkets 47.1% 47.0% 39.0% 39.8%
Walmart 12.9% 11.8% 22.4% 21.9%
Club 11.6% 13.3% 11.0% 11.6%
Internet 8.7% 9.2% 4.9% 5.3%
*Internet includes range of purchases from pure play Ecommerce to Click & Collect; Brick & Mortar outlet sales do not include internet sales.
The State of Our World Today
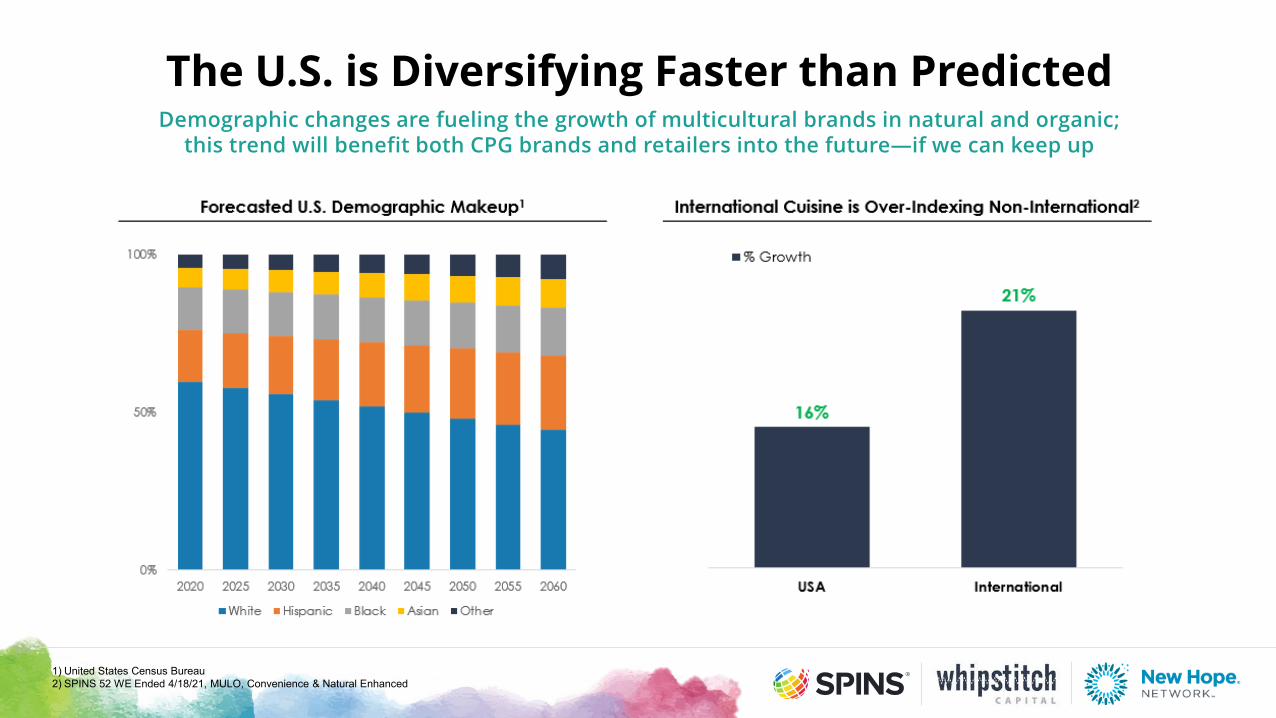
The U.S. is Diversifying Faster than PredictedDemographic changes are fueling the growth of multicultural brands in natural and organic;
this trend will benefit both CPG brands and retailers into the future—if we can keep up
1) United States Census Bureau2) SPINS 52 WE Ended 4/18/21, MULO, Convenience & Natural Enhanced
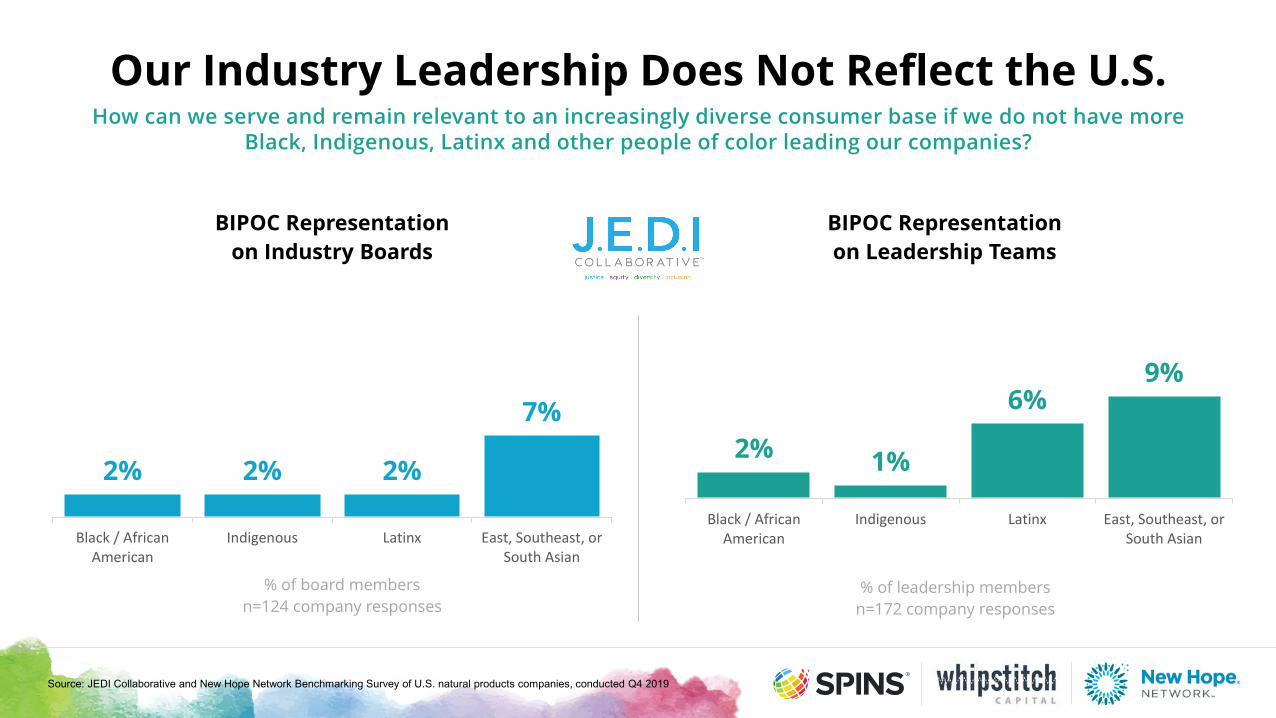
2% 2% 2%
7%
Black / AfricanAmerican
Indigenous Latinx East, Southeast, orSouth Asian
% of board membersn=124 company responses
BIPOC Representation on Industry Boards
2% 1%
6%9%
Black / AfricanAmerican
Indigenous Latinx East, Southeast, orSouth Asian
% of leadership membersn=172 company responses
BIPOC Representation on Leadership Teams
Source: JEDI Collaborative and New Hope Network Benchmarking Survey of U.S. natural products companies, conducted Q4 2019
Our Industry Leadership Does Not Reflect the U.S.How can we serve and remain relevant to an increasingly diverse consumer base if we do not have more
Black, Indigenous, Latinx and other people of color leading our companies?
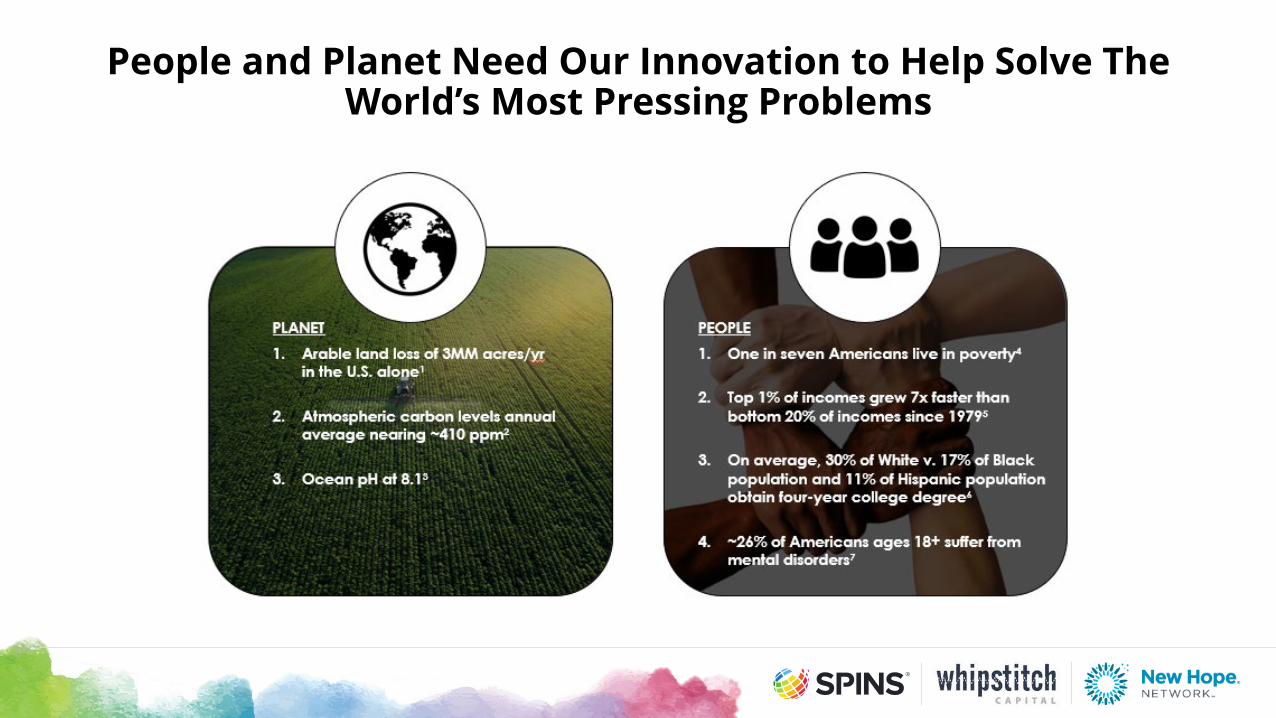
People and Planet Need Our Innovation to Help Solve The World’s Most Pressing Problems
Where Our Industry Could Be by 2030
Source: Nutrition Business Journal ($mil, consumer sales), powered by SPINS
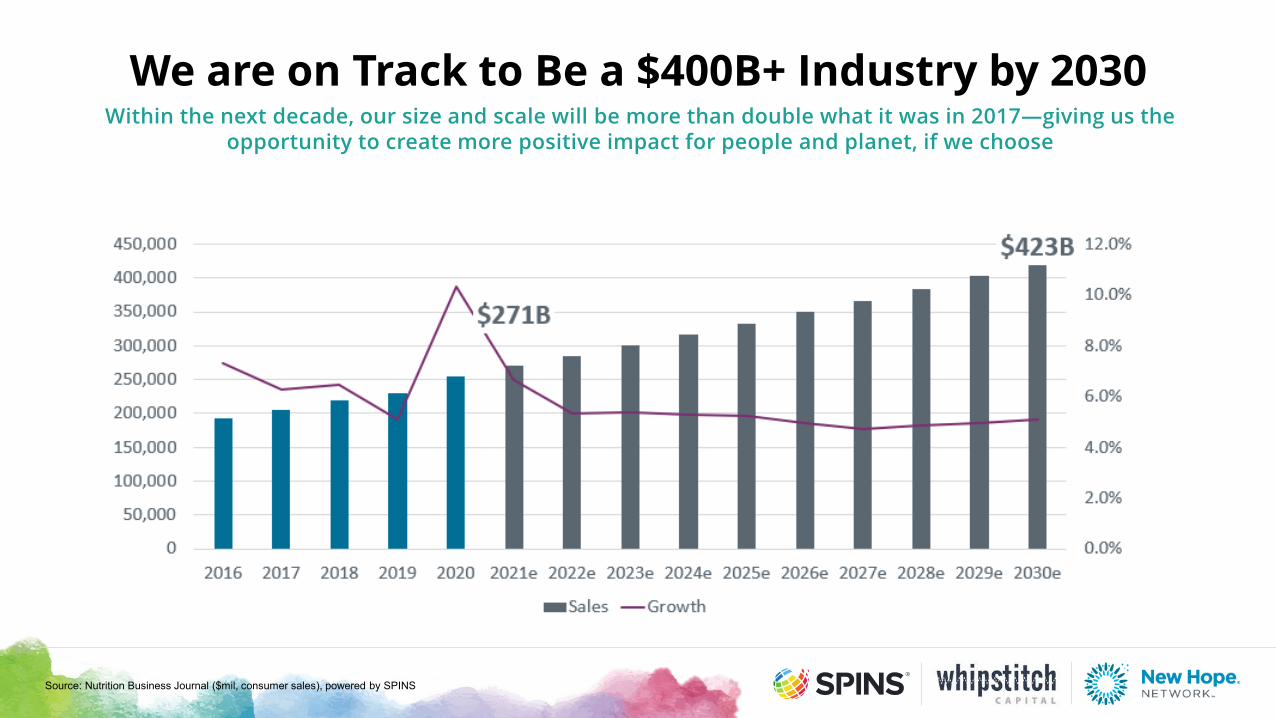
We are on Track to Be a $400B+ Industry by 2030Within the next decade, our size and scale will be more than double what it was in 2017—giving us the
opportunity to create more positive impact for people and planet, if we choose
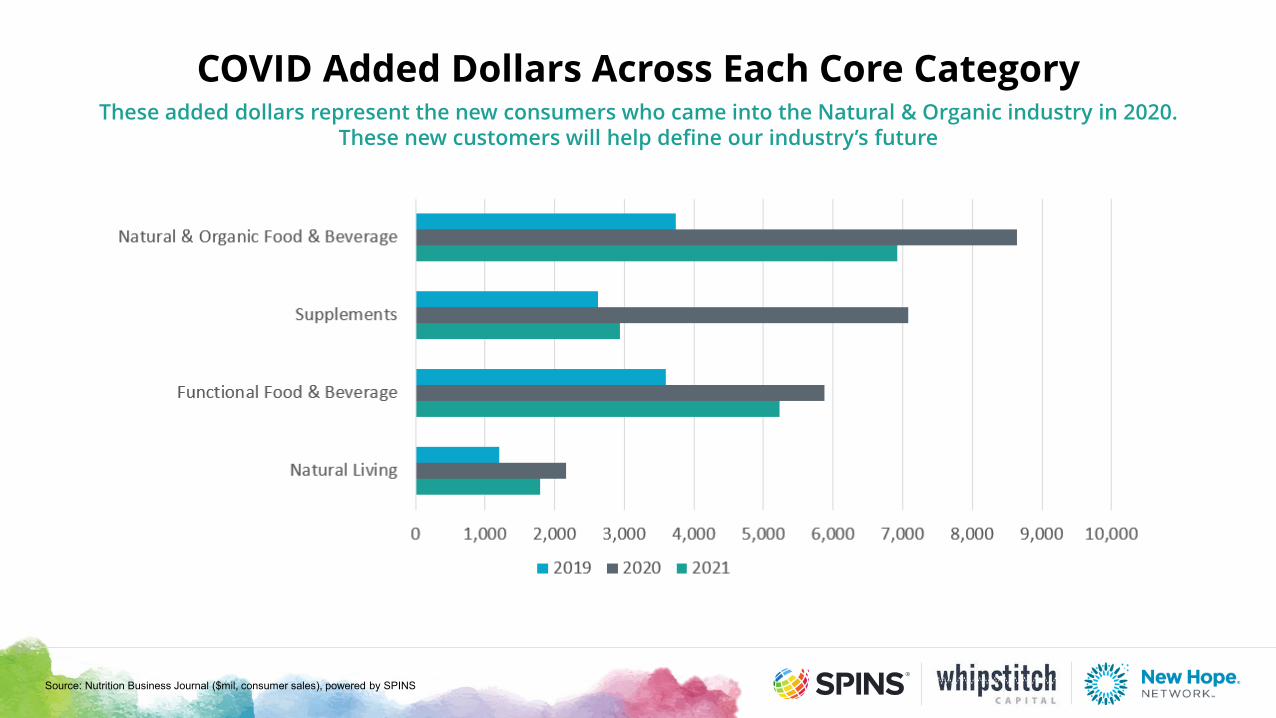
These added dollars represent the new consumers who came into the Natural & Organic industry in 2020. These new customers will help define our industry’s future
COVID Added Dollars Across Each Core Category
Source: Nutrition Business Journal ($mil, consumer sales), powered by SPINS
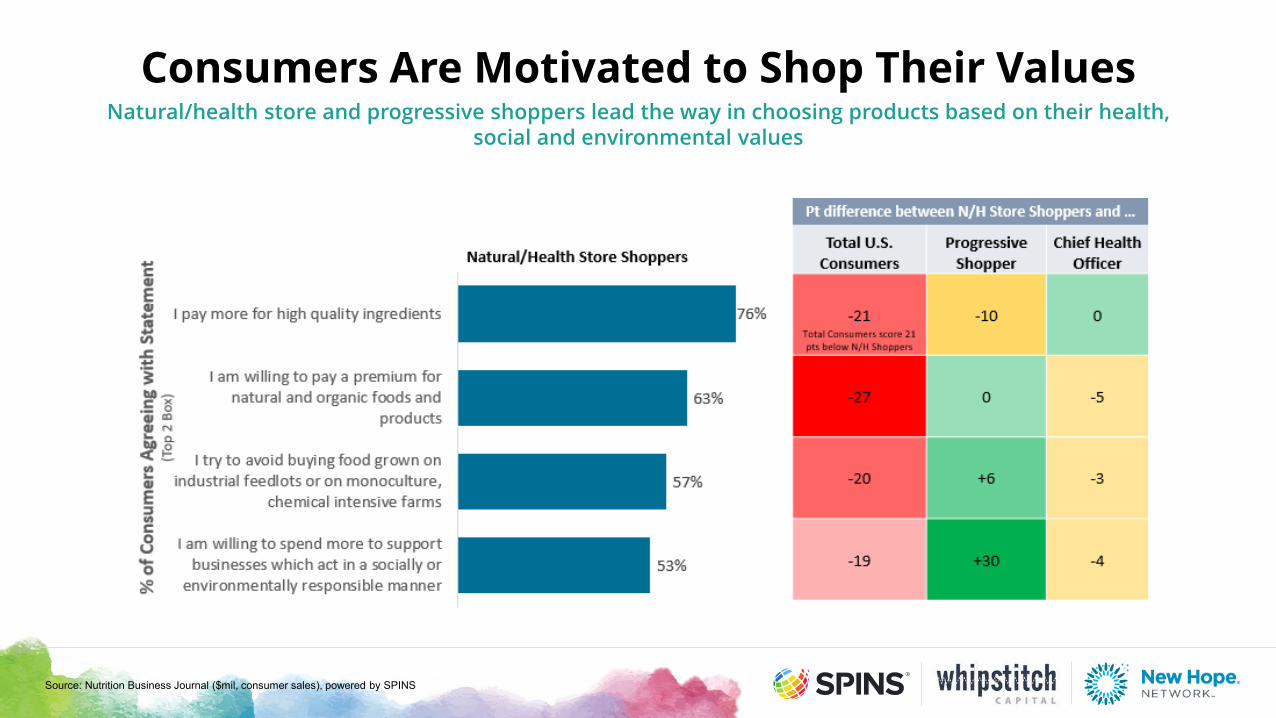
Natural/health store and progressive shoppers lead the way in choosing products based on their health, social and environmental values
Consumers Are Motivated to Shop Their Values
Source: Nutrition Business Journal ($mil, consumer sales), powered by SPINS
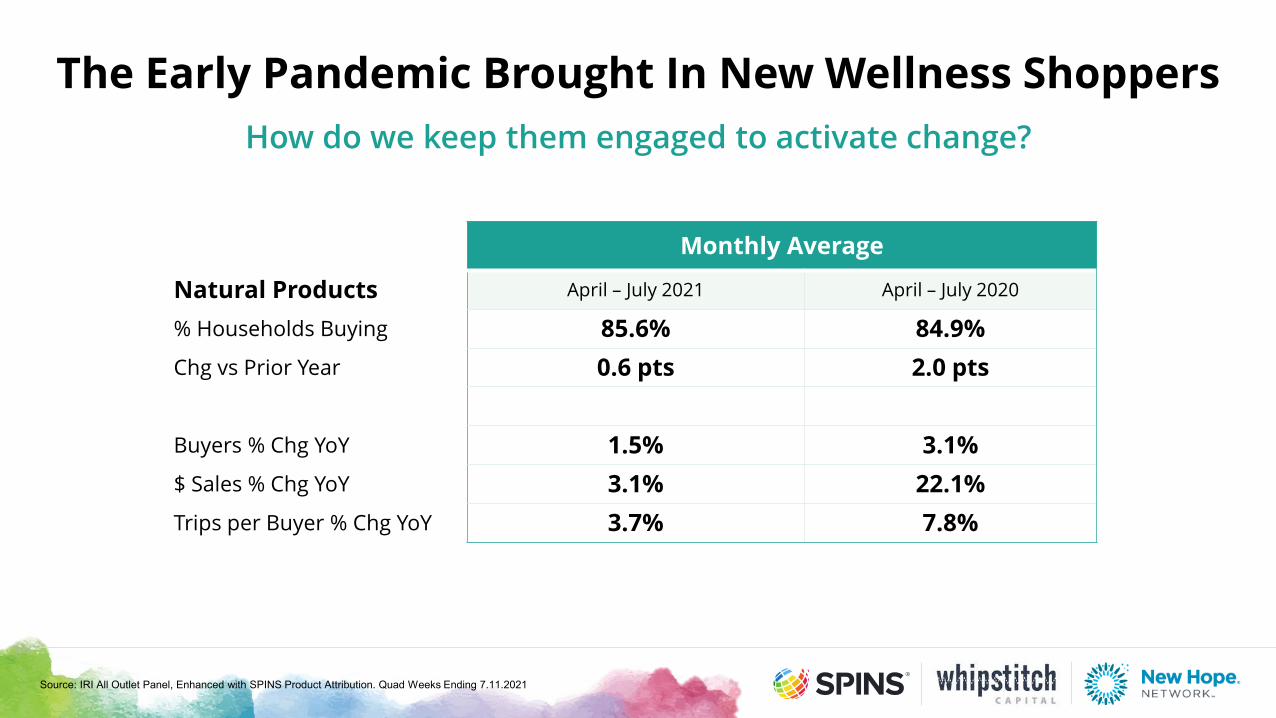
The Early Pandemic Brought In New Wellness Shoppers How do we keep them engaged to activate change?
Monthly Average
Natural Products April – July 2021 April – July 2020
% Households Buying 85.6% 84.9%Chg vs Prior Year 0.6 pts 2.0 pts
Buyers % Chg YoY 1.5% 3.1%$ Sales % Chg YoY 3.1% 22.1%Trips per Buyer % Chg YoY 3.7% 7.8%
Source: IRI All Outlet Panel, Enhanced with SPINS Product Attribution. Quad Weeks Ending 7.11.2021
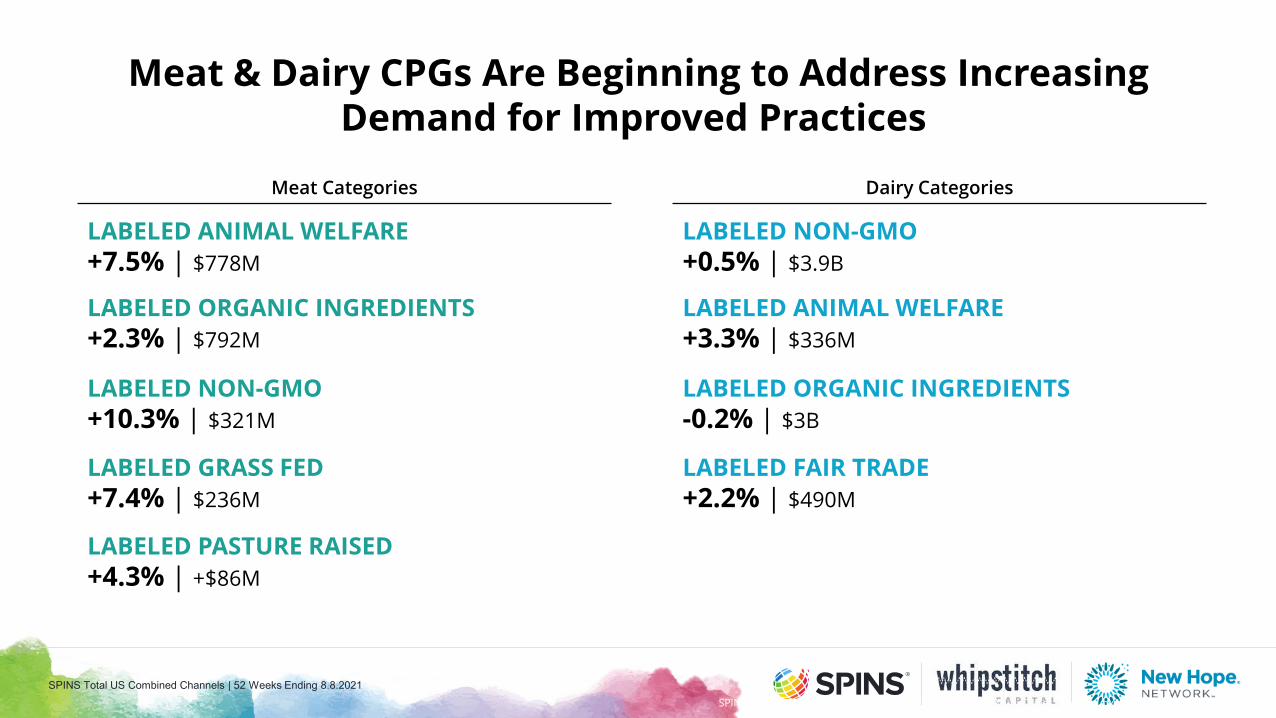
LABELED GRASS FED+7.4% | $236M
LABELED ORGANIC INGREDIENTS+2.3% | $792M
LABELED ANIMAL WELFARE+7.5% | $778M
LABELED NON-GMO+10.3% | $321M
LABELED PASTURE RAISED+4.3% | +$86M
SPINS Natural Enhanced Channel and SPINS Conventional Multi Outlet (powered by IRI) | 52 Weeks Ending 8-8-2021
LABELED ORGANIC INGREDIENTS-0.2% | $3B
LABELED ANIMAL WELFARE+3.3% | $336M
LABELED NON-GMO+0.5% | $3.9B
LABELED FAIR TRADE+2.2% | $490M
Meat & Dairy CPGs Are Beginning to Address Increasing Demand for Improved Practices
Meat Categories Dairy Categories
SPINS Total US Combined Channels | 52 Weeks Ending 8.8.2021
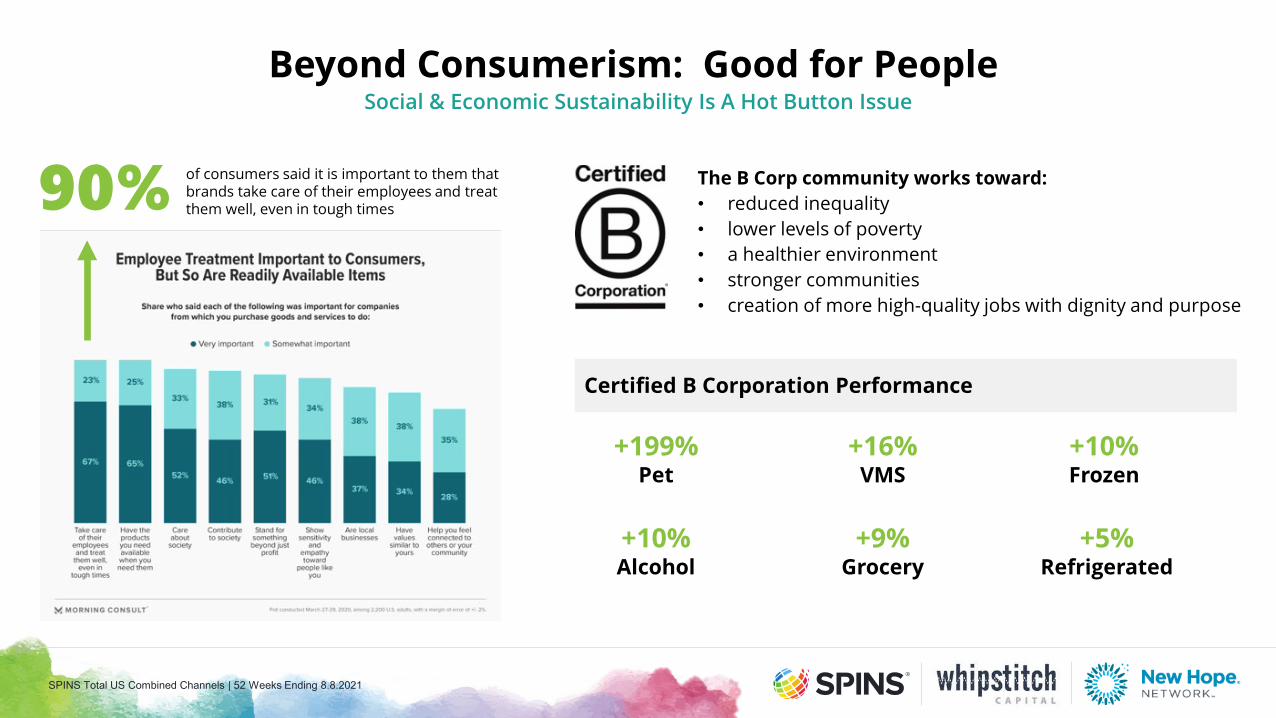
90% The B Corp community works toward:• reduced inequality• lower levels of poverty• a healthier environment• stronger communities• creation of more high-quality jobs with dignity and purpose
+199%Pet
Certified B Corporation Performance
+10% Frozen
+10% Alcohol
of consumers said it is important to them that brands take care of their employees and treat them well, even in tough times
+5%Refrigerated
+16%VMS
+9%Grocery
Social & Economic Sustainability Is A Hot Button IssueBeyond Consumerism: Good for People
SPINS Total US Combined Channels | 52 Weeks Ending 8.8.2021
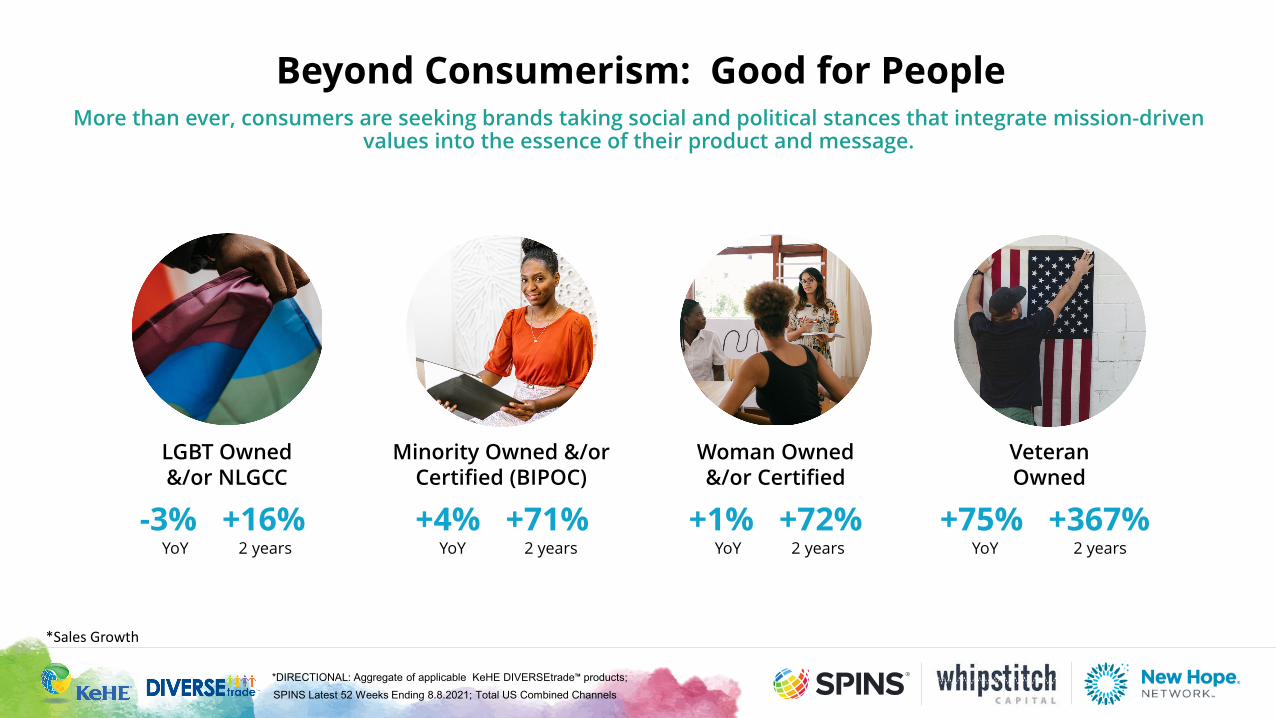
More than ever, consumers are seeking brands taking social and political stances that integrate mission-driven values into the essence of their product and message.
Beyond Consumerism: Good for People
SPINS Latest 52 Weeks Ending 8.8.2021; Total US Combined Channels*DIRECTIONAL: Aggregate of applicable KeHE DIVERSEtrade™ products;
*Sales Growth
Minority Owned &/or Certified (BIPOC)
Woman Owned &/or Certified
LGBT Owned&/or NLGCC
Veteran Owned
-3% +16% YoY 2 years
+4% +71% YoY 2 years
+1% +72% YoY 2 years
+75% +367% YoY 2 years
Harnessing Our Powerfor People and Planet
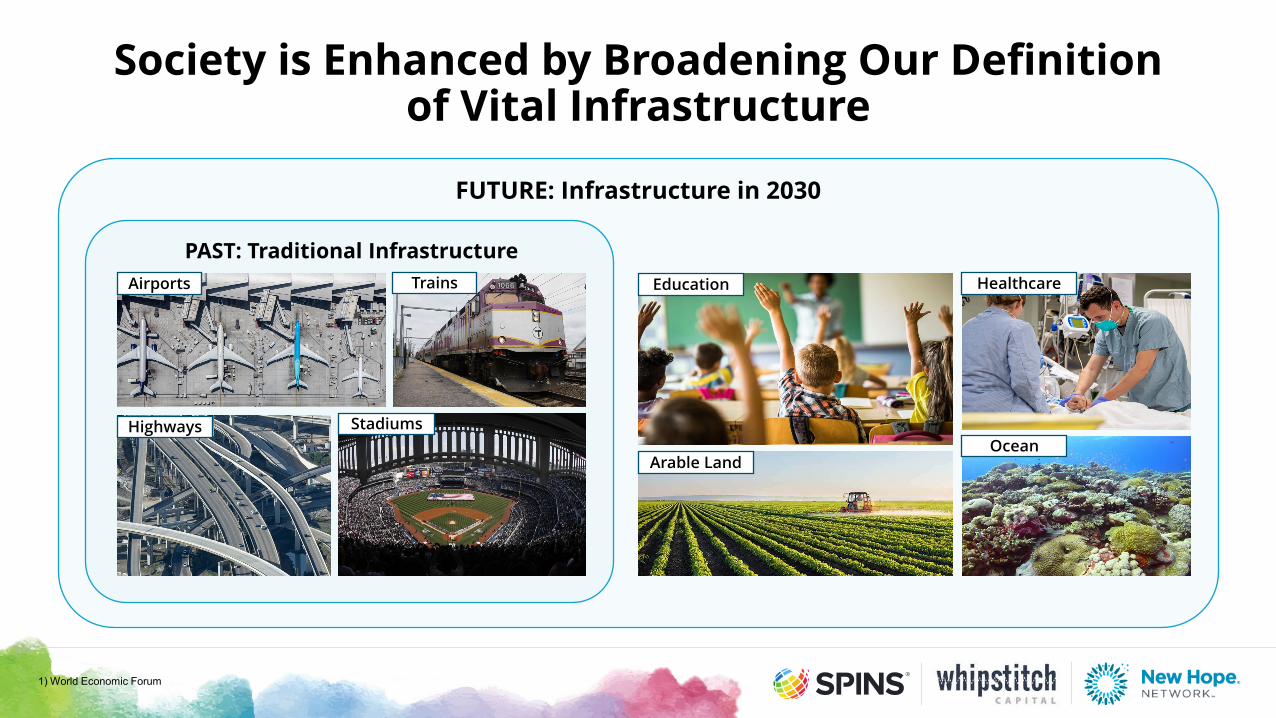
Society is Enhanced by Broadening Our Definition of Vital Infrastructure
1) World Economic Forum
FUTURE: Infrastructure in 2030
PAST: Traditional InfrastructureAirports Trains
StadiumsHighways
Education
Arable LandOcean
Healthcare
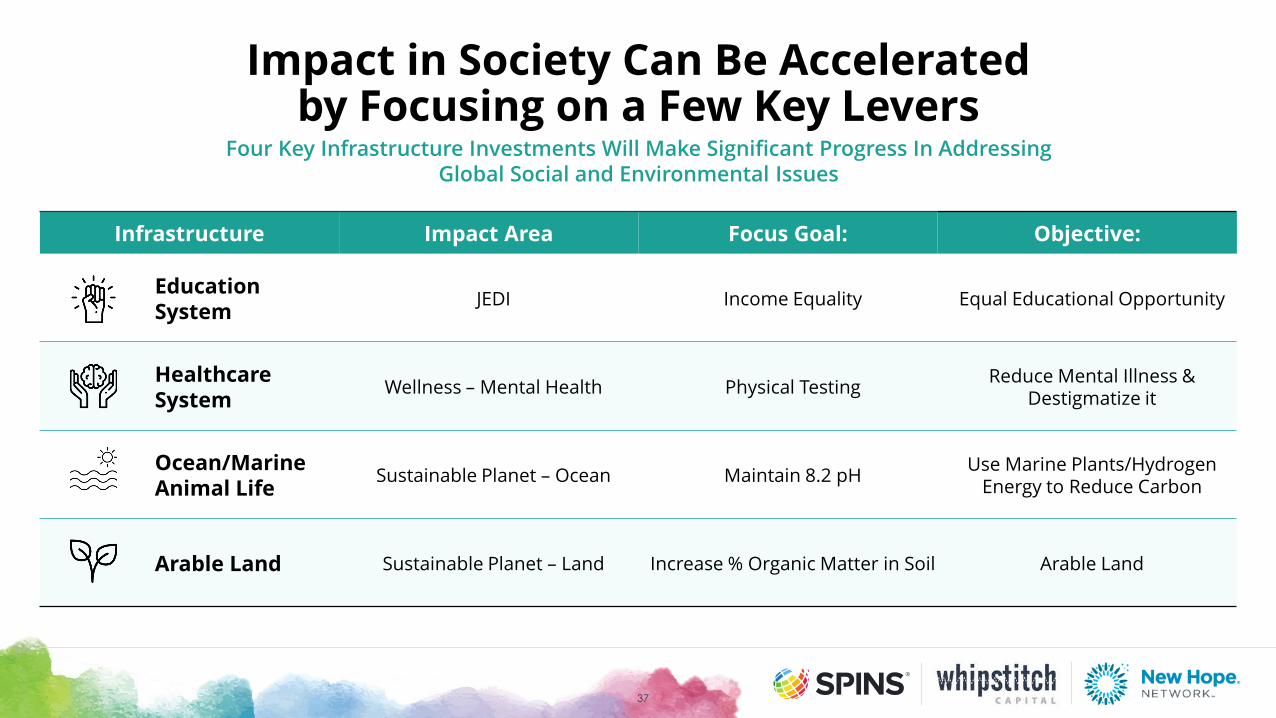
Impact in Society Can Be Accelerated by Focusing on a Few Key Levers
Infrastructure Impact Area Focus Goal: Objective:
Education System JEDI Income Equality Equal Educational Opportunity
HealthcareSystem Wellness – Mental Health Physical Testing Reduce Mental Illness &
Destigmatize it
Ocean/Marine Animal Life Sustainable Planet – Ocean Maintain 8.2 pH Use Marine Plants/Hydrogen
Energy to Reduce Carbon
Arable Land Sustainable Planet – Land Increase % Organic Matter in Soil Arable Land
Four Key Infrastructure Investments Will Make Significant Progress In Addressing Global Social and Environmental Issues
37
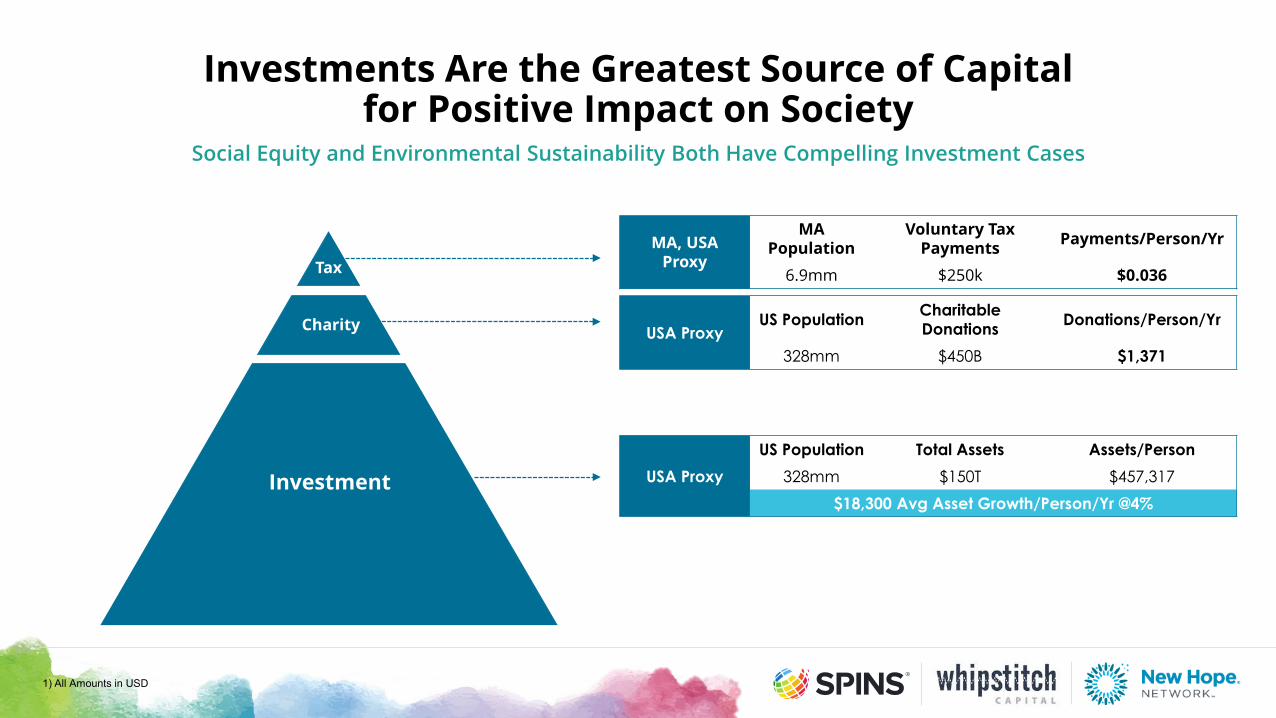
Investments Are the Greatest Source of Capital for Positive Impact on Society
Tax
Charity
Investment
Social Equity and Environmental Sustainability Both Have Compelling Investment Cases
USA ProxyUS Population Charitable
Donations Donations/Person/Yr
328mm $450B $1,371
MA, USA Proxy
MA Population
Voluntary Tax Payments Payments/Person/Yr
6.9mm $250k $0.036
USA ProxyUS Population Total Assets Assets/Person
328mm $150T $457,317$18,300 Avg Asset Growth/Person/Yr @4%
1) All Amounts in USD
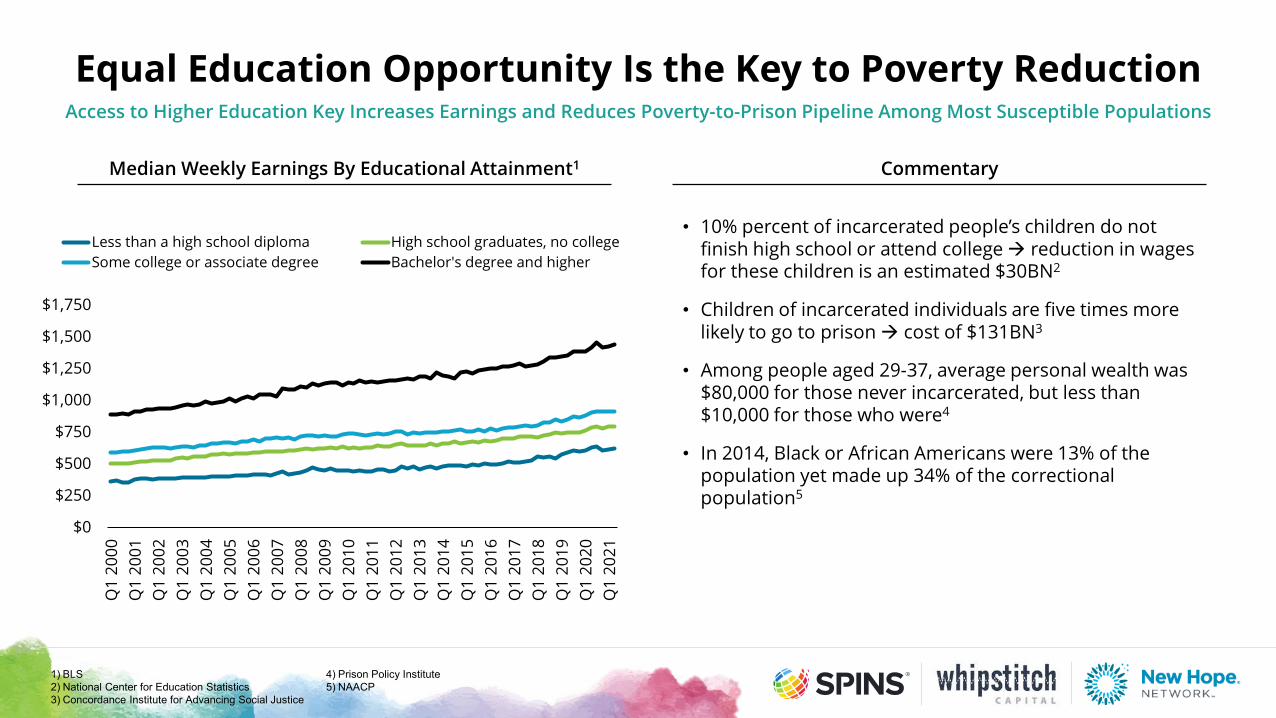
Equal Education Opportunity Is the Key to Poverty Reduction
Median Weekly Earnings By Educational Attainment1 Commentary
Access to Higher Education Key Increases Earnings and Reduces Poverty-to-Prison Pipeline Among Most Susceptible Populations
$0
$250
$500
$750
$1,000
$1,250
$1,500
$1,750
Q1
2000
Q1
2001
Q1
2002
Q1
2003
Q1
2004
Q1
2005
Q1
2006
Q1
2007
Q1
2008
Q1
2009
Q1
2010
Q1
2011
Q1
2012
Q1
2013
Q1
2014
Q1
2015
Q1
2016
Q1
2017
Q1
2018
Q1
2019
Q1
2020
Q1
2021
Less than a high school diploma High school graduates, no collegeSome college or associate degree Bachelor's degree and higher
1) BLS2) National Center for Education Statistics3) Concordance Institute for Advancing Social Justice
4) Prison Policy Institute5) NAACP
• 10% percent of incarcerated people’s children do not finish high school or attend college reduction in wages for these children is an estimated $30BN2
• Children of incarcerated individuals are five times more likely to go to prison cost of $131BN3
• Among people aged 29-37, average personal wealth was $80,000 for those never incarcerated, but less than $10,000 for those who were4
• In 2014, Black or African Americans were 13% of the population yet made up 34% of the correctional population5
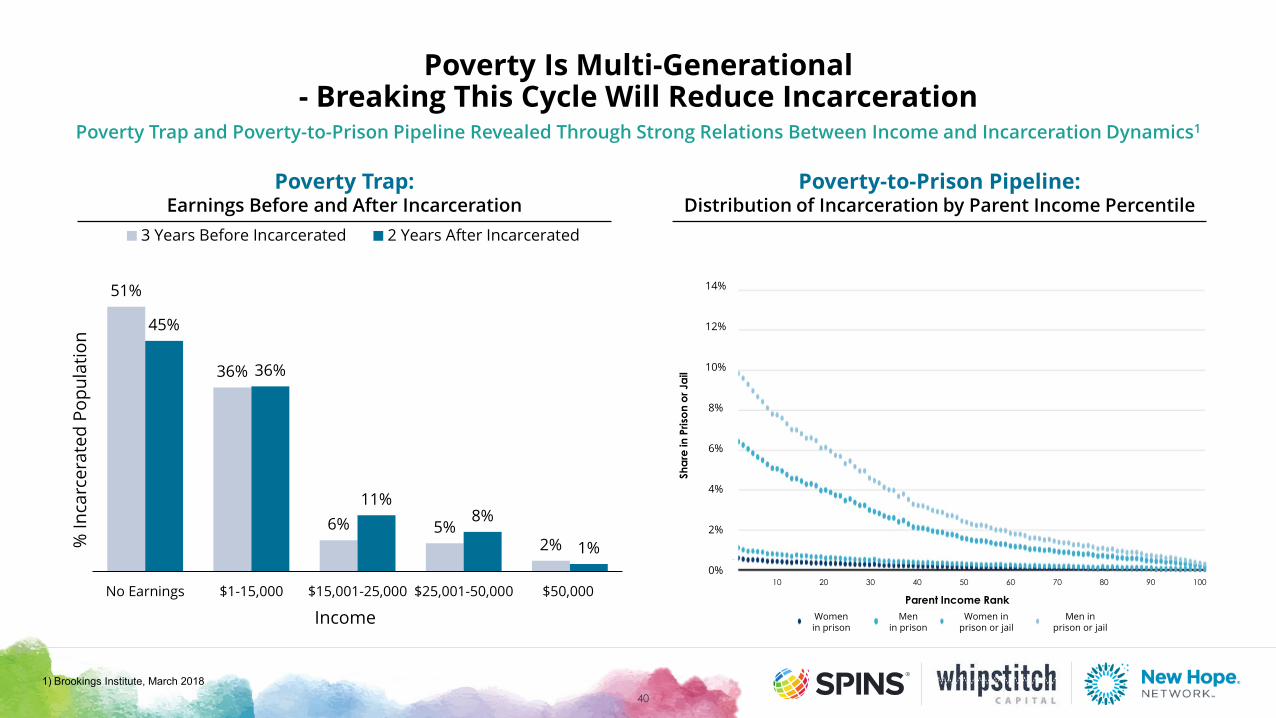
Poverty Is Multi-Generational - Breaking This Cycle Will Reduce Incarceration
Poverty Trap: Earnings Before and After Incarceration
Poverty-to-Prison Pipeline: Distribution of Incarceration by Parent Income Percentile
Poverty Trap and Poverty-to-Prison Pipeline Revealed Through Strong Relations Between Income and Incarceration Dynamics1
51%
36%
6% 5%2%
45%
36%
11%8%
1%
No Earnings $1-15,000 $15,001-25,000 $25,001-50,000 $50,000
% In
carc
erat
ed P
opul
atio
n
Income
3 Years Before Incarcerated 2 Years After Incarcerated
401) Brookings Institute, March 2018
Women in prison
Menin prison
Women in prison or jail
Men in prison or jail
Parent Income Rank
Shar
e in
Pris
on o
r Jai
l
0 10 20 30 40 50 60 70 80 90 100
14%
12%
10%
8%
6%
4%
2%
0%
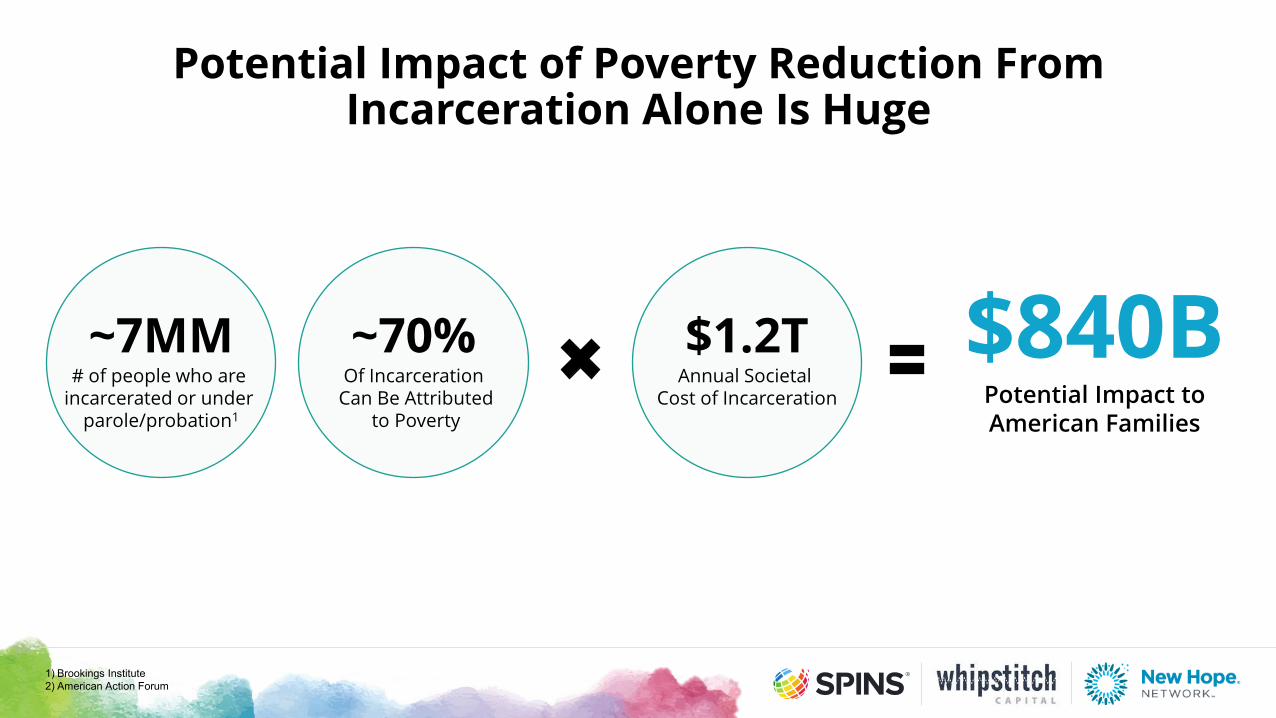
Potential Impact of Poverty Reduction From Incarceration Alone Is Huge
~7MM# of people who are
incarcerated or under parole/probation1
~70%Of Incarceration
Can Be Attributedto Poverty
$1.2TAnnual Societal
Cost of Incarceration
1) Brookings Institute2) American Action Forum
$840BPotential Impact to American Families
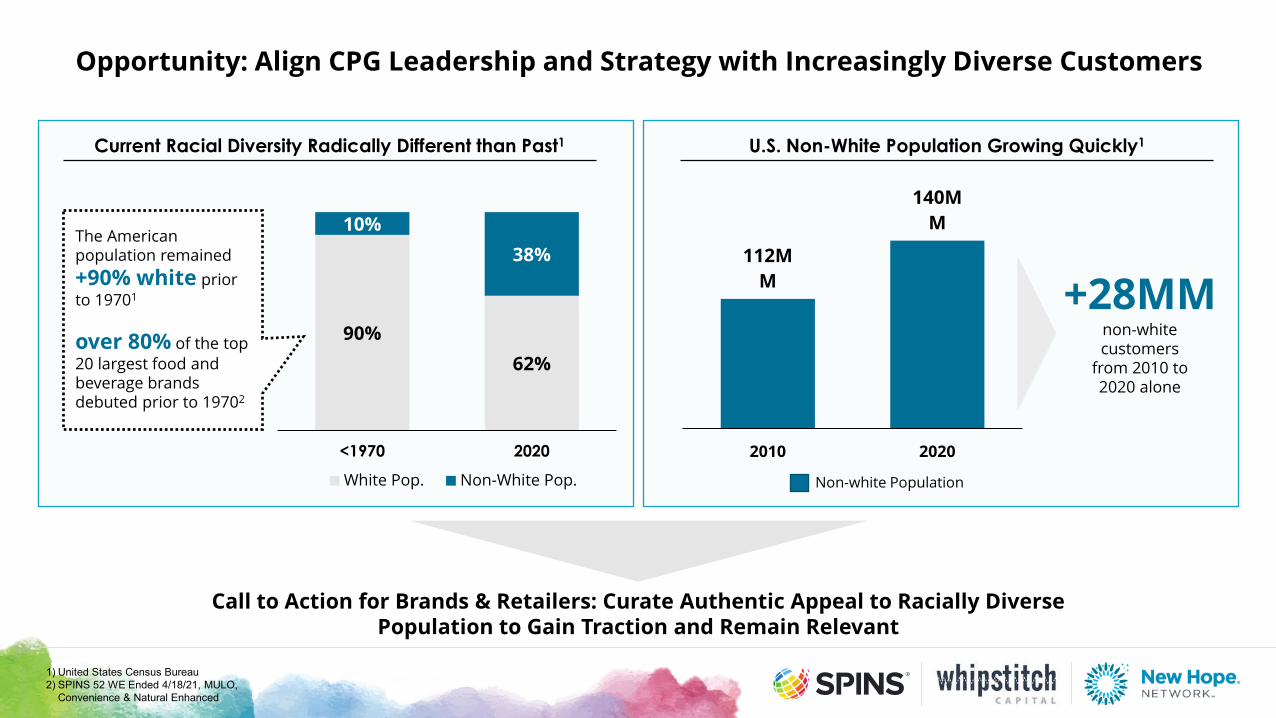
Opportunity: Align CPG Leadership and Strategy with Increasingly Diverse Customers
90%62%
10%38%
<1970 2020
White Pop. Non-White Pop.
Current Racial Diversity Radically Different than Past1 U.S. Non-White Population Growing Quickly1
Call to Action for Brands & Retailers: Curate Authentic Appeal to Racially Diverse Population to Gain Traction and Remain Relevant
The American population remained +90% white prior to 19701
over 80% of the top 20 largest food and beverage brands debuted prior to 19702
112MM
140MM
2010 2020
Non-white Population
+28MM non-white customers
from 2010 to 2020 alone
1) United States Census Bureau2) SPINS 52 WE Ended 4/18/21, MULO,
Convenience & Natural Enhanced
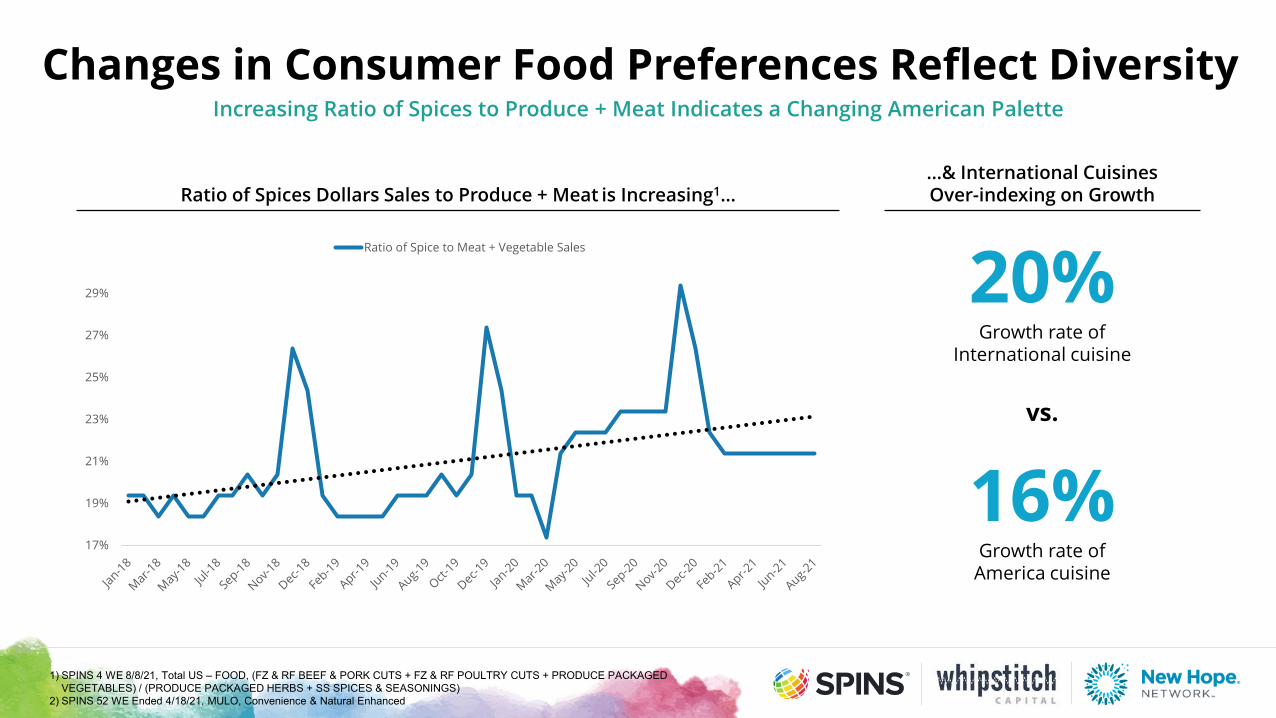
Changes in Consumer Food Preferences Reflect Diversity
17%
19%
21%
23%
25%
27%
29%
Ratio of Spice to Meat + Vegetable Sales
1) SPINS 4 WE 8/8/21, Total US – FOOD, (FZ & RF BEEF & PORK CUTS + FZ & RF POULTRY CUTS + PRODUCE PACKAGED VEGETABLES) / (PRODUCE PACKAGED HERBS + SS SPICES & SEASONINGS)
2) SPINS 52 WE Ended 4/18/21, MULO, Convenience & Natural Enhanced
Increasing Ratio of Spices to Produce + Meat Indicates a Changing American Palette
Ratio of Spices Dollars Sales to Produce + Meat is Increasing1…
20%Growth rate of
International cuisine
16%Growth rate of
America cuisine
vs.
…& International Cuisines Over-indexing on Growth
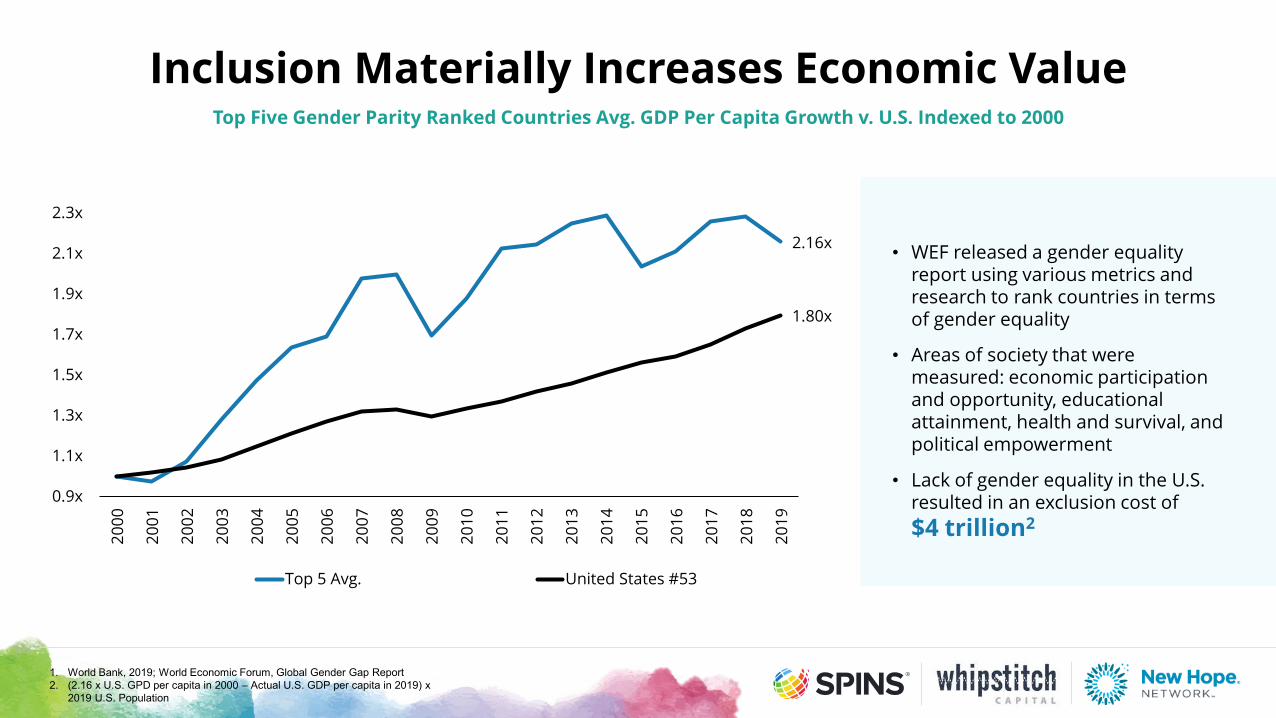
Inclusion Materially Increases Economic Value
• WEF released a gender equality report using various metrics and research to rank countries in terms of gender equality
• Areas of society that were measured: economic participation and opportunity, educational attainment, health and survival, and political empowerment
• Lack of gender equality in the U.S. resulted in an exclusion cost of $4 trillion2
2.16x
1.80x
0.9x
1.1x
1.3x
1.5x
1.7x
1.9x
2.1x
2.3x
2000
2001
2002
2003
2004
2005
2006
2007
2008
2009
2010
2011
2012
2013
2014
2015
2016
2017
2018
2019
Top 5 Avg. United States #53
Top Five Gender Parity Ranked Countries Avg. GDP Per Capita Growth v. U.S. Indexed to 2000
1. World Bank, 2019; World Economic Forum, Global Gender Gap Report2. (2.16 x U.S. GPD per capita in 2000 – Actual U.S. GDP per capita in 2019) x
2019 U.S. Population
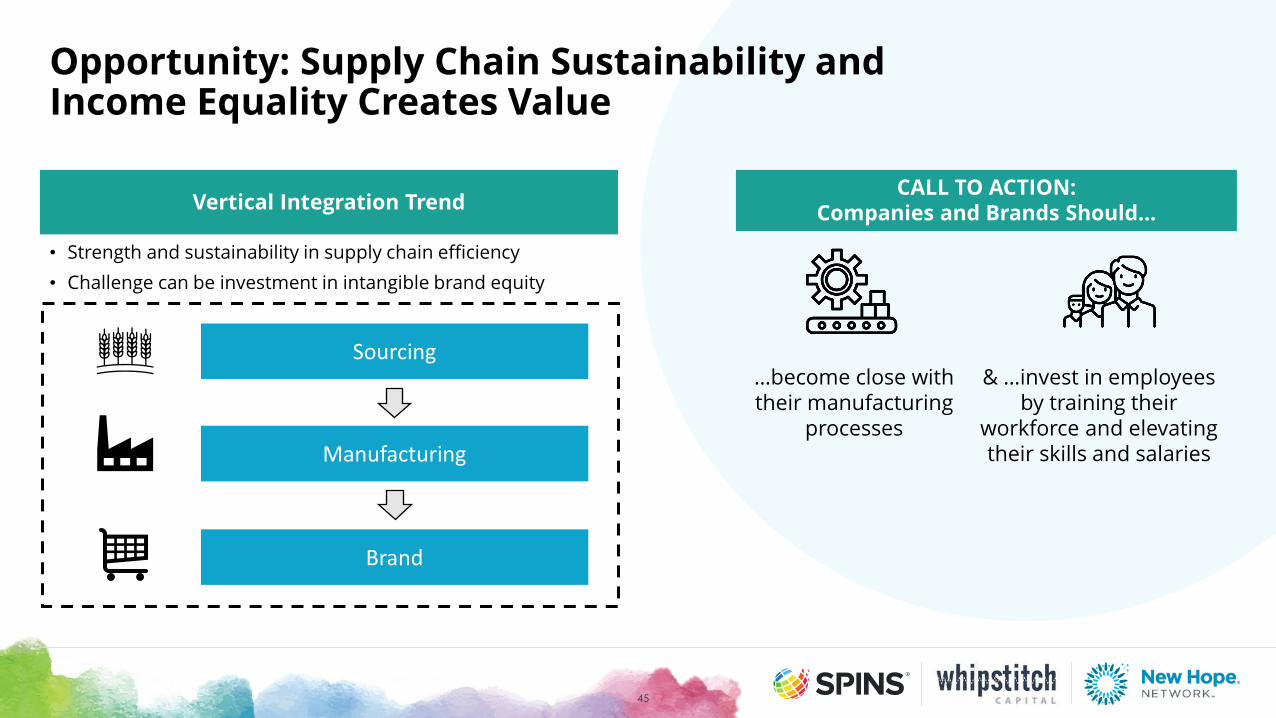
Opportunity: Supply Chain Sustainability and Income Equality Creates Value
Vertical Integration TrendCALL TO ACTION:
Companies and Brands Should…
Sourcing
Manufacturing
Brand
…become close with their manufacturing
processes
• Strength and sustainability in supply chain efficiency• Challenge can be investment in intangible brand equity
45
& …invest in employees by training their
workforce and elevating their skills and salaries
-
250
500
750
1,000
1 - 139 140 - 999 1000+ Total
Acre
age
Ow
ners
hip
Farm Size (Acre)
2012 2017
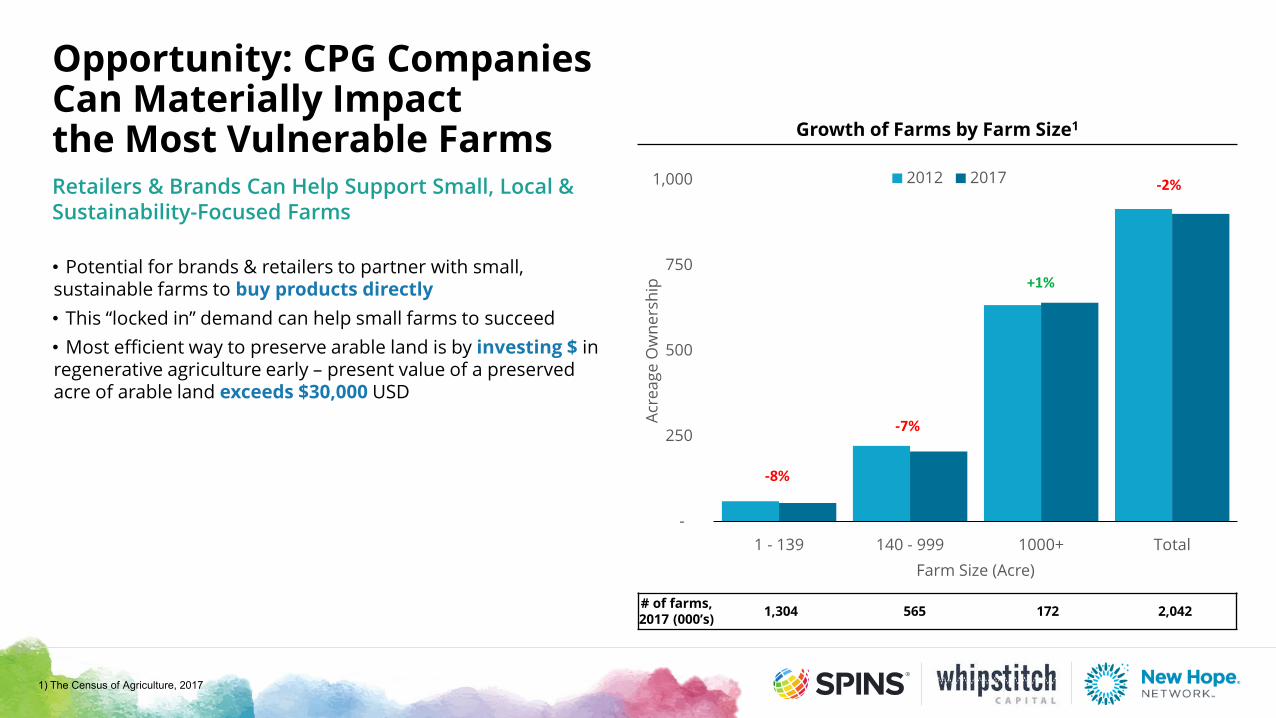
Opportunity: CPG Companies Can Materially Impact the Most Vulnerable Farms
• Potential for brands & retailers to partner with small, sustainable farms to buy products directly• This “locked in” demand can help small farms to succeed• Most efficient way to preserve arable land is by investing $ in regenerative agriculture early – present value of a preserved acre of arable land exceeds $30,000 USD
Growth of Farms by Farm Size1
-8%
# of farms, 2017 (000’s) 1,304 565 172 2,042
-7%
+1%
-2%Retailers & Brands Can Help Support Small, Local & Sustainability-Focused Farms
1) The Census of Agriculture, 2017
Takeaways and Actions
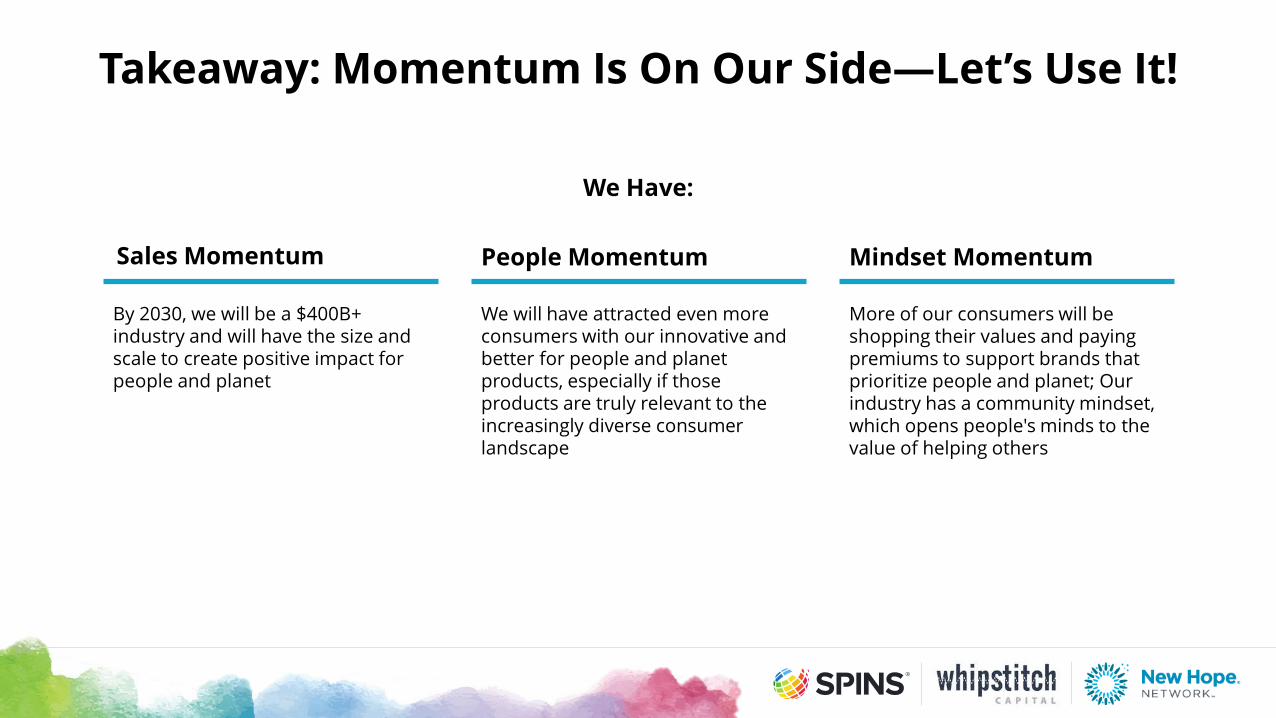
Takeaway: Momentum Is On Our Side—Let’s Use It!
We Have:
Sales Momentum People Momentum Mindset Momentum
By 2030, we will be a $400B+ industry and will have the size and scale to create positive impact for people and planet
We will have attracted even more consumers with our innovative and better for people and planet products, especially if those products are truly relevant to the increasingly diverse consumer landscape
More of our consumers will be shopping their values and paying premiums to support brands that prioritize people and planet; Our industry has a community mindset, which opens people's minds to the value of helping others
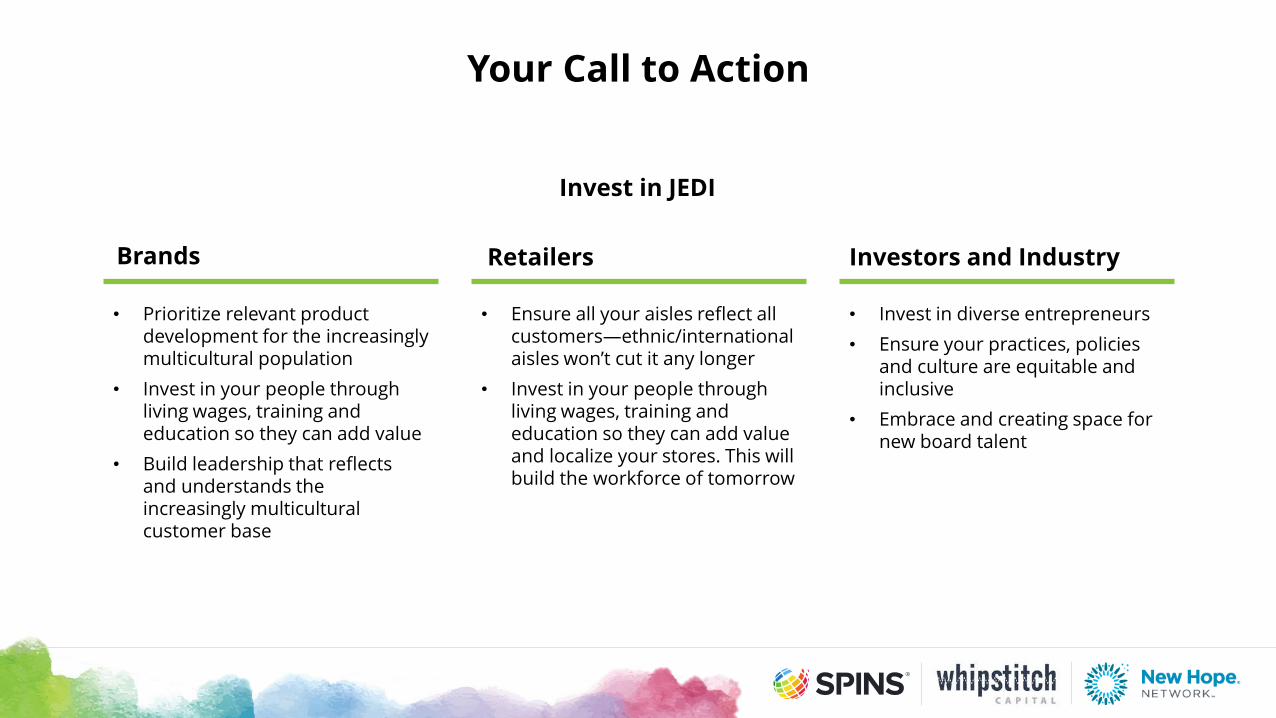
Your Call to Action
Invest in JEDI
Brands Retailers Investors and Industry
• Prioritize relevant product development for the increasingly multicultural population
• Invest in your people through living wages, training and education so they can add value
• Build leadership that reflects and understands the increasingly multicultural customer base
• Ensure all your aisles reflect all customers—ethnic/international aisles won’t cut it any longer
• Invest in your people through living wages, training and education so they can add value and localize your stores. This will build the workforce of tomorrow
• Invest in diverse entrepreneurs• Ensure your practices, policies
and culture are equitable and inclusive
• Embrace and creating space for new board talent
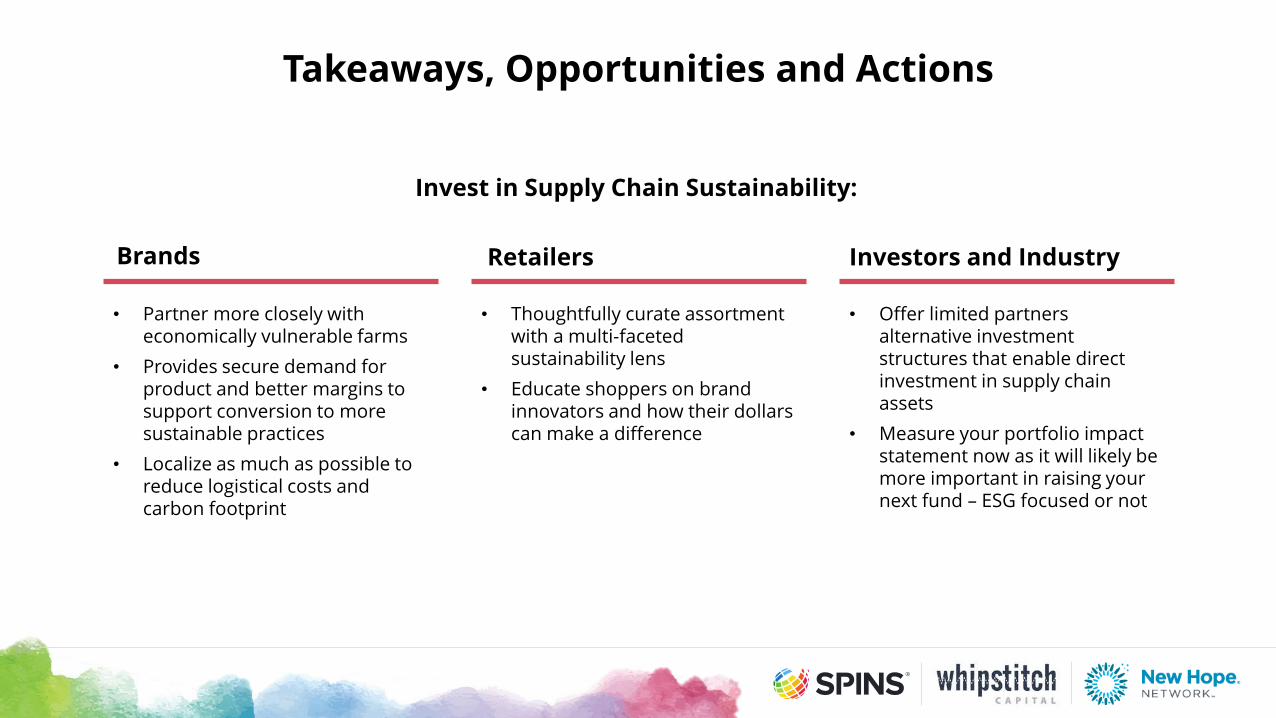
Takeaways, Opportunities and Actions
Invest in Supply Chain Sustainability:
Brands Retailers Investors and Industry
• Partner more closely with economically vulnerable farms
• Provides secure demand for product and better margins to support conversion to more sustainable practices
• Localize as much as possible to reduce logistical costs and carbon footprint
• Thoughtfully curate assortment with a multi-faceted sustainability lens
• Educate shoppers on brand innovators and how their dollars can make a difference
• Offer limited partners alternative investment structures that enable direct investment in supply chain assets
• Measure your portfolio impact statement now as it will likely be more important in raising your next fund – ESG focused or not

Panelists Making Positive Impact Possible
Carlotta MastNew Hope Network
Moderator
Corwin HeatwoleFarmer Focus
Panelist
Stephen RitzGreen Bronx Machine
Panelist
Le’Spencer WalkerTarget
Virtual panelist


![Dominant Distribution to Retailer/WholesaleLakeland, Florida “The Shelby Report really dials in to the [Midwest] regional news. Industry ... Deli/Prepared Foods Bakery Dairy Snacks](https://img.pdfslide.us/doc/110x75/5f37f4cbdd44c5761630a821/dominant-distribution-to-retailerwholesale-lakeland-florida-aoethe-shelby-report.jpg)