Embed Size (px)
Citation preview
CELANESE CORP
FORM 10-K(Annual Report)
Filed 02/08/13 for the Period Ending 12/31/12
Address 222 W. LAS COLINAS BLVD., SUITE 900N
IRVING, TX 75039-5421Telephone 972-443-4000
CIK 0001306830Symbol CE
SIC Code 2820 - Plastics Materials And Synthetic Resins, SyntheticIndustry Chemical Manufacturing
Sector Basic MaterialsFiscal Year 12/31
http://www.edgar-online.com© Copyright 2013, EDGAR Online, Inc. All Rights Reserved.
Distribution and use of this document restricted under EDGAR Online, Inc. Terms of Use.
UNITED STATES SECURITIES AND EXCHANGE COMMISSION
Washington, D.C. 20549 _______________________________________________________
Form 10-K
(Commission File Number) 001-32410
CELANESE CORPORATION (Exact Name of Registrant as Specified in its Charter)
(972) 443-4000 (Registrant’s telephone number, including area code)
Securities registered pursuant to Section 12(b) of the Act
Securities registered pursuant to Section 12(g) of the Act None
Indicate by check mark if the registrant is a well-known seasoned issuer, as defined in Rule 405 of the Securities Act. Yes � No �
Indicate by check mark if the registrant is not required to file reports pursuant to Section 13 or Section 15(d) of the Act. Yes � No �
Indicate by check mark whether the registrant (1) has filed all reports required to be filed by Section 13 or 15(d) of the Securities Exchange Act of 1934 during the preceding 12 months (or for such shorter period that the registrant was required to file such reports), and (2) has been subject to such filing requirements for the past 90 days. Yes � No �
Indicate by check mark whether the registrant has submitted electronically and posted on its corporate Website, if any, every Interactive Data File required to be submitted and posted pursuant to Rule 405 of Regulation S-T (§ 232.405 of this chapter) during the preceding 12 months (or for such shorter period that the registrant was required to submit and post such files). Yes � No �
Indicate by check mark if disclosure of delinquent filers pursuant to Item 405 of Regulation S-K is not contained herein, and will not be contained, to the best of the registrant’s knowledge, in definitive proxy or information statements incorporated by reference in Part III of this Form 10-K or any amendment to this Form 10-K. �
Indicate by check mark whether the registrant is a large accelerated filer, an accelerated filer, a non-accelerated filer, or a smaller reporting company. See the definitions of "large accelerated filer," "accelerated filer" and "smaller reporting company" in Rule 12b-2 of the Exchange Act. (Check one):
(Do not check if a smaller reporting company)
Indicate by check mark whether the registrant is a shell company (as defined in Rule 12b-2 of the Act). Yes � No �
The aggregate market value of the registrant’s Series A Common Stock held by non-affiliates as of June 30, 2012 (the last business day of the registrants’ most recently completed second fiscal quarter) was $4,829,670,405 .
The number of outstanding shares of the registrant’s Series A Common Stock, $0.0001 par value, as of February 4, 2013 was 159,652,401 .
DOCUMENTS INCORPORATED BY REFERENCE
� ANNUAL REPORT PURSUANT TO SECTION 13 OR 15(d) OF THE SECURITIES EXCHANGE ACT OF 1934 For the fiscal year ended December 31, 2012
OR
� TRANSITION REPORT PURSUANT TO SECTION 13 OR 15(d) OF THE SECURITIES EXCHANGE ACT OF 1934
Delaware (State or Other Jurisdiction of Incorporation or Organization)
98-0420726 (I.R.S. Employer Identification No.)
222 West Las Colinas Blvd., Suite 900N Irving TX
(Address of Principal Executive Offices) 75039-5421 (Zip Code)
Name of Each Exchange Title of Each Class on Which Registered
Series A Common Stock, par value $0.0001 per share New York Stock Exchange
Large accelerated filer � Accelerated filer � Non-accelerated filer � Smaller reporting company �

Certain portions of the registrant’s Definitive Proxy Statement relating to the 2013 annual meeting of stockholders, to be filed with the Securities and Exchange Commission, are incorporated by reference into Part III.
CELANESE CORPORATION
Form 10-K For the Fiscal Year Ended December 31, 2012
TABLE OF CONTENTS
2
Page
Special Note Regarding Forward-Looking Statements 3
PART I
Item 1. Business 4
Item 1A. Risk Factors 16
Item 1B. Unresolved Staff Comments 26
Item 2. Properties 27
Item 3. Legal Proceedings 29
Item 4. Mine Safety Disclosures 29
Executive Officers of the Registrant 29
PART II
Item 5. Market for the Registrant’s Common Equity, Related Stockholder Matters and Issuer Purchases of Equity Securities 31
Item 6. Selected Financial Data 34
Item 7. Management’s Discussion and Analysis of Financial Condition and Results of Operations 35
Item 7A. Quantitative and Qualitative Disclosures About Market Risk 59
Item 8 Financial Statements and Supplementary Data 60
Item 9. Changes in and Disagreements with Accountants on Accounting and Financial Disclosure 62
Item 9A Controls and Procedures 62
Item 9B. Other Information 64
PART III
Item 10. Directors, Executive Officers and Corporate Governance 64
Item 11. Executive Compensation 64
Item 12. Security Ownership of Certain Beneficial Owners and Management and Related Stockholder Matters 64
Item 13. Certain Relationships and Related Transactions, and Director Independence 65
Item 14. Principal Accounting Fees and Services 65
PART IV
Item 15. Exhibits, Financial Statement Schedules 65
Signatures 66
Special Note Regarding Forward-Looking Statements
Certain statements in this Annual Report on Form 10-K ("Annual Report") or in other materials we have filed or will file with the Securities and Exchange Commission ("SEC"), and incorporated herein by reference, are forward-looking in nature as defined in Section 27A of the Securities Act of 1933, as amended, Section 21E of the Securities Exchange Act of 1934, as amended, and the Private Securities Litigation Reform Act of 1995. You can identify these statements by the fact that they do not relate to matters of a strictly factual or historical nature and generally discuss or relate to forecasts, estimates or other expectations regarding future events. Generally, the words "believe," "expect," "intend," "estimate," "anticipate," "project," "plan," "may," "can," "could," "might," "will" and similar expressions identify forward-looking statements, including statements that relate to such matters as planned and expected capacity increases and utilization; anticipated capital spending; environmental matters; legal proceedings; exposure to, and effects of hedging of raw material and energy costs and foreign currencies; interest rate fluctuations; global and regional economic, political, and business conditions; expectations, strategies, and plans for individual assets and products, business segments, as well as for the whole Company; cash requirements and uses of available cash; financing plans; pension expenses and funding; anticipated restructuring, divestiture, and consolidation activities; cost reduction and control efforts and targets and integration of acquired businesses.
Forward-looking statements are not historical facts or guarantees of future performance but instead represent only our beliefs at the time the statements were made regarding future events, which are subject to significant risks, uncertainties, and other factors, many of which are outside of our control and certain of which are listed above. Any or all of the forward-looking statements included in this Annual Report and in any other materials incorporated by reference herein may turn out to be materially inaccurate. This can occur as a result of incorrect assumptions, in some cases based upon internal estimates and analyses of current market conditions and trends, management plans and strategies, economic conditions, or as a consequence of known or unknown risks and uncertainties. Many of the risks and uncertainties mentioned in this Annual Report, such as those discussed in Item 1A. Risk Factors , Item 3. Legal Proceedings and Item 7. Management’s Discussion and Analysis of Financial Condition and Results of Operations will be important in determining whether these forward-looking statements prove to be accurate. Consequently, neither our stockholders nor any other person should place undue reliance on our forward-looking statements and should recognize that actual results may differ materially from those anticipated by us.
All forward-looking statements made in this Annual Report are made as of the date hereof, and the risk that actual results will differ materially from expectations expressed in this Annual Report will increase with the passage of time. We undertake no obligation, and disclaim any duty, to publicly update or revise any forward-looking statements, whether as a result of new information, future events, changes in our expectations or otherwise. However, we may make further disclosures regarding future events, trends and uncertainties in our subsequent reports on Forms 10-K, 10-Q and 8-K to the extent required under the Exchange Act. The above cautionary discussion of risks, uncertainties and possible inaccurate assumptions relevant to our business includes factors we believe could cause our actual results to differ materially from expected and historical results. Other factors beyond those listed above or in Item 1A. Risk Factors , Item 3. Legal Proceedings and Item 7. Management’s Discussion and Analysis of Financial Condition and Results of Operations below, including factors unknown to us and factors known to us which we have determined not to be material, could also adversely affect us.
3
Item 1. Business
Basis of Presentation
In this Annual Report on Form 10-K, the term "Celanese" refers to Celanese Corporation, a Delaware corporation, and not its subsidiaries. The terms "Company," "we," "our" and "us" refer to Celanese and its subsidiaries on a consolidated basis. The term "Celanese US" refers to the Company’s subsidiary, Celanese US Holdings LLC, a Delaware limited liability company, and not its subsidiaries.
Industry
This Annual Report on Form 10-K includes industry data obtained from industry publications and surveys as well as our own internal company surveys. Third-party industry publications, surveys and forecasts generally state that the information contained therein has been obtained from sources believed to be reliable. The statements regarding the Company’s industry position in this document are based on information derived from, among others, the 2012 IHS Chemicals Economics Handbook.
Overview
The Company is a global technology and specialty materials company that engineers and manufactures a wide variety of products essential to everyday living. As a recognized innovator in product and process technology in the chemicals industry, we help to create applications that meet the needs of our customers worldwide. We are one of the world's largest producers of acetyl products, which are intermediate chemicals for nearly all major industries. We are also a leading global producer of high performance engineered polymers that are used in a variety of high-value applications.
Our highly-diversified product portfolio serves a broad range of end-use applications including paints and coatings, textiles, automotive applications, consumer and medical applications, performance industrial applications, filter media, paper and packaging, chemical additives, construction, consumer and industrial adhesives, and food and beverage applications. Serving a diverse global customer base, our products hold leading global positions in the major product industries that we serve, supported by our large global production capacity, operating efficiencies, proprietary production technology and competitive cost structures.
Celanese's history began in 1918, the year that its predecessor company, The American Cellulose & Chemical Manufacturing Company, was incorporated. The company, which manufactured cellulose acetate, was founded by Swiss brothers Drs. Camille and Henri Dreyfus. Since that time, the Company has transformed into a leading global chemical company. The current Celanese was incorporated in 2005 under the laws of the State of Delaware and is a US-based public company traded on the NYSE under the ticker symbol CE.
Headquartered in Irving, Texas, our operations are primarily located in North America, Europe and Asia and consist of 27 global production facilities, and an additional 9 strategic affiliate production facilities. As of December 31, 2012 , we employed approximately 7,550 people worldwide.
Due to our geographic breadth, our net sales are balanced across the global regions. For the year ended December 31, 2012 , 28% of our net sales were to customers located in the United States. See Note 25 - Segment Information in the accompanying consolidated financial statements for further details on our international sales.
4
Business Segment Overview
We operate principally through four business segments: Advanced Engineered Materials, Consumer Specialties, Industrial Specialties and Acetyl Intermediates. See Note 25 - Segment Information in the accompanying consolidated financial statements for further details on our business segments.
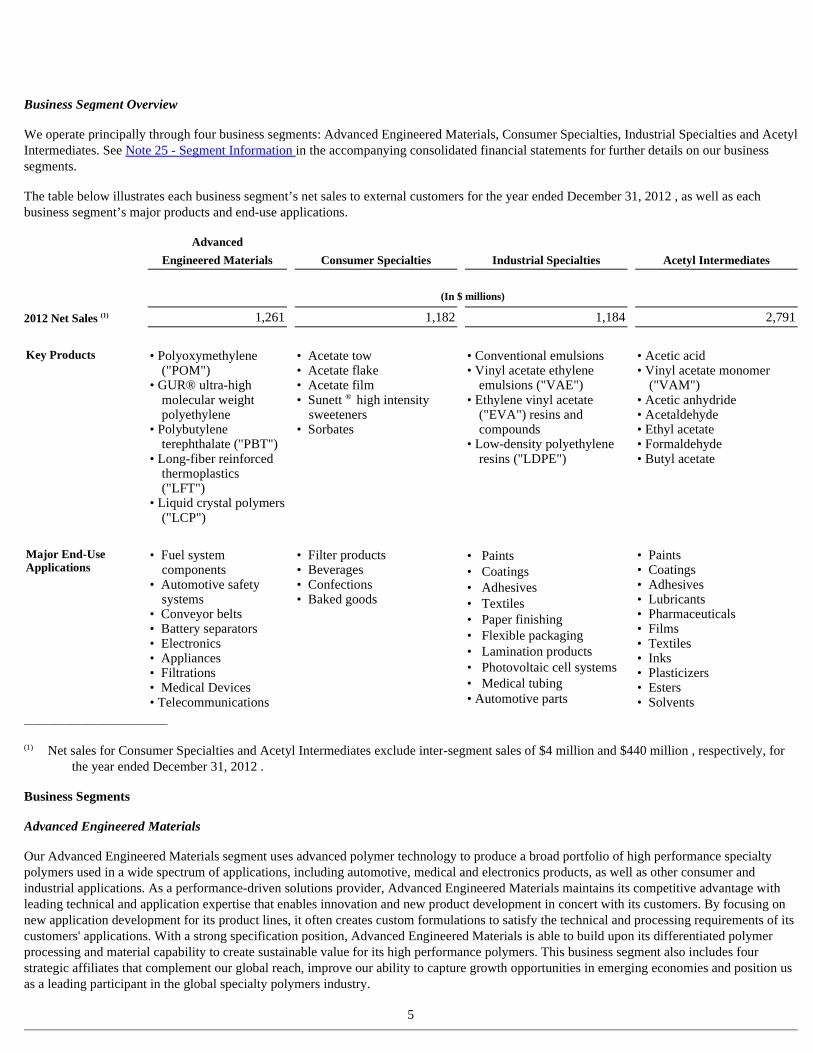
The table below illustrates each business segment’s net sales to external customers for the year ended December 31, 2012 , as well as each business segment’s major products and end-use applications.
___________________________
Business Segments
Advanced Engineered Materials
Our Advanced Engineered Materials segment uses advanced polymer technology to produce a broad portfolio of high performance specialty polymers used in a wide spectrum of applications, including automotive, medical and electronics products, as well as other consumer and industrial applications. As a performance-driven solutions provider, Advanced Engineered Materials maintains its competitive advantage with leading technical and application expertise that enables innovation and new product development in concert with its customers. By focusing on new application development for its product lines, it often creates custom formulations to satisfy the technical and processing requirements of its customers' applications. With a strong specification position, Advanced Engineered Materials is able to build upon its differentiated polymer processing and material capability to create sustainable value for its high performance polymers. This business segment also includes four strategic affiliates that complement our global reach, improve our ability to capture growth opportunities in emerging economies and position us as a leading participant in the global specialty polymers industry.
5
Advanced
Engineered Materials Consumer Specialties Industrial Specialties Acetyl Intermediates
(In $ millions)
2012 Net Sales (1) 1,261 1,182 1,184 2,791
Key Products • Polyoxymethylene
("POM") • GUR® ultra-high
molecular weight polyethylene
• Polybutylene terephthalate ("PBT")
• Long-fiber reinforced thermoplastics ("LFT")
• Liquid crystal polymers ("LCP")
• Acetate tow • Acetate flake • Acetate film • Sunett ® high intensity
sweeteners • Sorbates
• Conventional emulsions • Vinyl acetate ethylene
emulsions ("VAE") • Ethylene vinyl acetate
("EVA") resins and compounds
• Low-density polyethylene resins ("LDPE")
• Acetic acid • Vinyl acetate monomer
("VAM") • Acetic anhydride • Acetaldehyde • Ethyl acetate • Formaldehyde • Butyl acetate
Major End-Use Applications
• Fuel system components
• Automotive safety systems
• Conveyor belts • Battery separators • Electronics • Appliances • Filtrations • Medical Devices • Telecommunications
• Filter products • Beverages • Confections • Baked goods
• Paints • Coatings • Adhesives • Textiles • Paper finishing • Flexible packaging • Lamination products • Photovoltaic cell systems • Medical tubing • Automotive parts
• Paints • Coatings • Adhesives • Lubricants • Pharmaceuticals • Films • Textiles • Inks • Plasticizers • Esters • Solvents
(1) Net sales for Consumer Specialties and Acetyl Intermediates exclude inter-segment sales of $4 million and $440 million , respectively, for
the year ended December 31, 2012 .
Advanced Engineered Materials' specialty polymers have chemical and physical properties that enable them to perform in a variety of conditions. These include enduring elevated temperatures, resisting adverse chemical interactions with solvents and withstanding deformation. POM, PBT and LFT are used in a broad range of performance-demanding applications including automotive components, medical devices, electronics, appliances and industrial applications. GUR ® ultra-high molecular weight polyethylene is used in battery separators, conveyor belts, filtration equipment, coatings and medical devices. Primary end uses for LCP are electrical and electronics applications or products. These value-added applications in diverse end-uses support the business' global growth trends.
Value-in-use pricing for most of these products, particularly specialized product grades for targeted applications, generally reflect the value added in complex polymer chemistry, precision formulation and compounding, and the extensive application development services provided.
Advanced Engineered Materials has polymerization, compounding and research and technology centers in Germany, Brazil, China and the United States. In 2010, we announced the construction of a new 50,000 ton POM manufacturing facility in Saudi Arabia through our Ibn Sina affiliate. This facility is expected to be completed in late 2015. In 2011, we opened a state-of-the art POM production facility in Frankfurt Hoechst Industrial Park, Germany. This new POM facility is the world's largest and is expected to meet the increased global demand for innovative specialty solutions in polymer-based products.
POM . Polyoxymethylene, also commonly known as polyacetal in the chemical industry, is sold by Advanced Engineered Materials under the trademarks Celcon ® and Hostaform ® . POM is used for mechanical parts in automotive applications, including fuel system components, and in electrical, medical and consumer applications such as drug delivery systems and gears for large appliances. Polyplastics Co., Ltd., our 45%-owned strategic venture ("Polyplastics"), and Korea Engineering Plastics Co., Ltd., our 50%-owned strategic venture ("KEPCO"), also manufacture POM and other engineering resins in the Asia-Pacific region.
The primary raw material for POM is formaldehyde, which is manufactured from methanol. Advanced Engineered Materials sources formaldehyde in the United States from our Acetyl Intermediates segment and manufactures formaldehyde in Germany from purchased methanol.
Ultra-high molecular weight polyethylene. Our ultra-high molecular weight polyethylene products, sold under the trademark GUR ® , are highly engineered materials designed for heavy-duty industrial and automotive applications. They are used in items such as industrial conveyor belts, car battery separator panels, as well as specialty medical and consumer applications, such as sports prostheses and equipment. GUR ® micro powder grades are used for high-performance filters, membranes, diagnostic devices, coatings and additives for thermoplastics and elastomers. High tenacity fibers based on GUR ® ultra-high molecular weight polyethylene are also used in protective ballistic applications. The primary raw material for GUR ® ultra-high molecular weight polyethylene is ethylene.
Polyesters. Our products include a series of thermoplastic polyesters including Celanex ® PBT, Celanex ® PET, Thermx ® PCT and Vandar ® , as well as Riteflex ® , a thermoplastic polyester elastomer. They are used in a wide variety of automotive, electrical and consumer applications, including ignition system parts, radiator grilles, electrical switches, appliance and sensor housings, light emitting diodes ("LEDs") and technical fibers.
LCP. Liquid crystal polymers, such as Vectra ® and Zenite ® , are primarily used in electrical and electronics applications for precision parts with thin walls and complex shapes. They are also used in high heat cookware applications. Raw materials for LCP include acetic anhydride, which is sourced from our Acetyl Intermediates segment, and monomers such as hydroxybenzoic acid.
LFT. Celstran ® and Compel ® are long-fiber reinforced thermoplastics that impart extra strength and stiffness, making them more suitable for larger parts than conventional thermoplastics. Both products are used in automotive, transportation and industrial applications, such as instrument panels, consoles and front end modules. The primary raw materials for LFT include polypropylene and a variety of fibers such as glass, stainless steel and carbon.
6
• Key Products
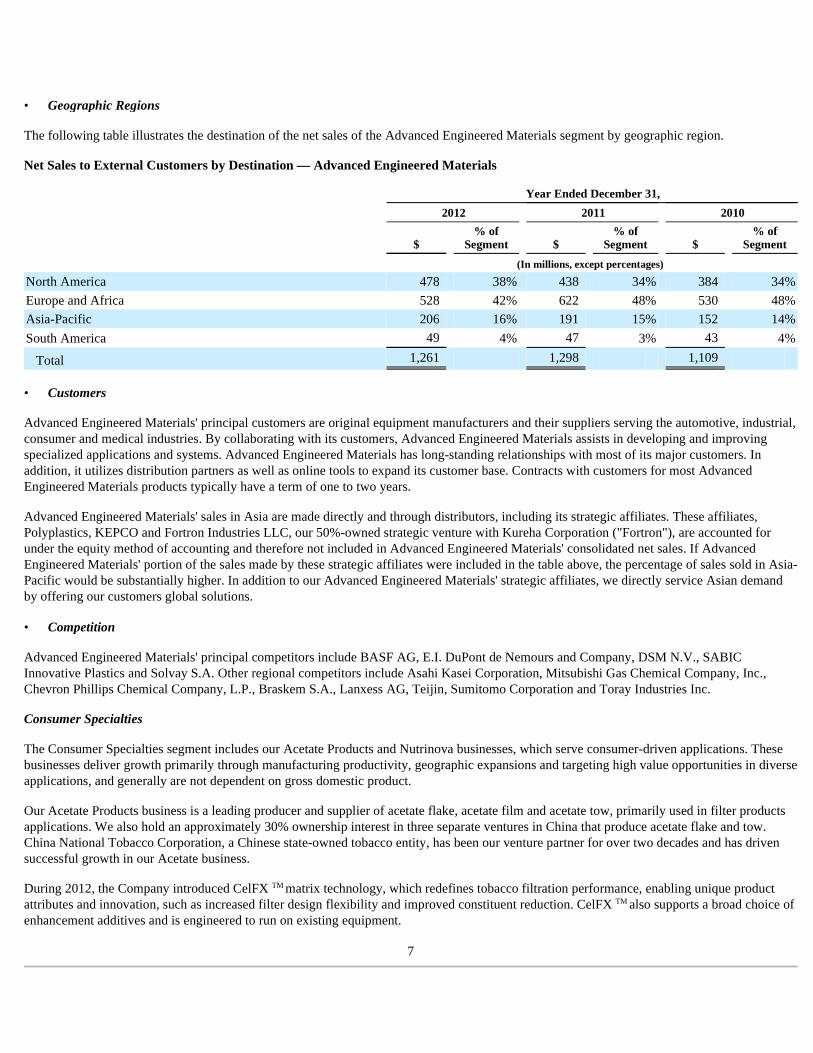
The following table illustrates the destination of the net sales of the Advanced Engineered Materials segment by geographic region.
Net Sales to External Customers by Destination — Advanced Engineered Materials
Advanced Engineered Materials' principal customers are original equipment manufacturers and their suppliers serving the automotive, industrial, consumer and medical industries. By collaborating with its customers, Advanced Engineered Materials assists in developing and improving specialized applications and systems. Advanced Engineered Materials has long-standing relationships with most of its major customers. In addition, it utilizes distribution partners as well as online tools to expand its customer base. Contracts with customers for most Advanced Engineered Materials products typically have a term of one to two years.
Advanced Engineered Materials' sales in Asia are made directly and through distributors, including its strategic affiliates. These affiliates, Polyplastics, KEPCO and Fortron Industries LLC, our 50%-owned strategic venture with Kureha Corporation ("Fortron"), are accounted for under the equity method of accounting and therefore not included in Advanced Engineered Materials' consolidated net sales. If Advanced Engineered Materials' portion of the sales made by these strategic affiliates were included in the table above, the percentage of sales sold in Asia-Pacific would be substantially higher. In addition to our Advanced Engineered Materials' strategic affiliates, we directly service Asian demand by offering our customers global solutions.
Advanced Engineered Materials' principal competitors include BASF AG, E.I. DuPont de Nemours and Company, DSM N.V., SABIC Innovative Plastics and Solvay S.A. Other regional competitors include Asahi Kasei Corporation, Mitsubishi Gas Chemical Company, Inc., Chevron Phillips Chemical Company, L.P., Braskem S.A., Lanxess AG, Teijin, Sumitomo Corporation and Toray Industries Inc.
Consumer Specialties
The Consumer Specialties segment includes our Acetate Products and Nutrinova businesses, which serve consumer-driven applications. These businesses deliver growth primarily through manufacturing productivity, geographic expansions and targeting high value opportunities in diverse applications, and generally are not dependent on gross domestic product.
Our Acetate Products business is a leading producer and supplier of acetate flake, acetate film and acetate tow, primarily used in filter products applications. We also hold an approximately 30% ownership interest in three separate ventures in China that produce acetate flake and tow. China National Tobacco Corporation, a Chinese state-owned tobacco entity, has been our venture partner for over two decades and has driven successful growth in our Acetate business.
During 2012, the Company introduced CelFX TM matrix technology, which redefines tobacco filtration performance, enabling unique product attributes and innovation, such as increased filter design flexibility and improved constituent reduction. CelFX TM also supports a broad choice of enhancement additives and is engineered to run on existing equipment.
7
• Geographic Regions
Year Ended December 31,
2012 2011 2010
$ % of
Segment $ % of
Segment $ % of
Segment
(In millions, except percentages)
North America 478 38 % 438 34 % 384 34 %
Europe and Africa 528 42 % 622 48 % 530 48 %
Asia-Pacific 206 16 % 191 15 % 152 14 %
South America 49 4 % 47 3 % 43 4 %
Total 1,261 1,298 1,109
• Customers
• Competition
Acetate Products has production sites in the United States, Mexico, the United Kingdom and Belgium, along with sites at its three acetate ventures in China. In November 2012, we ceased manufacturing acetate tow and acetate flake at our Spondon, Derby, United Kingdom site. We will continue to manufacture our Clarifoil ® film at this facility.
Our Nutrinova business is a leading international supplier of premium quality ingredients for the food, beverage and pharmaceutical industries. The company produces and sells Sunett ® (acesulfame potassium), a high intensity sweetener. It is also one of the world's largest producers of food protection ingredients, such as potassium sorbates and sorbic acid. Nutrinova's expertise is based on its more than sixty years of experience in developing and marketing specialty ingredients to the food and beverage and pharmaceutical industries. While this business has traditionally focused on providing low calorie sweeteners in the beverage industry, it continues to target high value opportunities in more diverse applications such as oral hygiene, pharmaceuticals, dairy and cereals.
During 2012, Nutrinova announced Sunett ® SL, the first new line of product from the Nutrinova's Sunsation SM platform. Sunett ® SL products are drop-in solutions that can be easily incorporated into customers' food and beverage formulations, helping customers bring products to market faster. Sensory tests carried out by an accredited external institute confirm that Sunett ® SL significantly improves the sweetness and mouth-feel perception of sugar-free and sugar-reduced products.
Nutrinova has a production facility in Germany, with sales and distribution facilities in all major regions of the world.
Acetate flake, acetate tow and acetate film (Clarifoil) . Acetate tow is a fiber used primarily in cigarette filters. In order to produce acetate tow, we first produce acetate flake by processing wood pulp with acetic acid and acetic anhydride. Wood pulp generally comes from reforested trees and is purchased externally from a variety of sources, and acetic anhydride is an intermediate chemical that we produce from acetic acid. The acetate flake is then further processed into acetate tow. Flake can also be solvent cast to create a film which is primarily used in packaging for food and high-end luxury goods.
Sales of acetate tow amounted to 15% , 14% and 15% of our consolidated net sales for the years ended December 31, 2012 , 2011 and 2010 , respectively.
Sunett ® sweeteners. Acesulfame potassium, a high intensity sweetener sold under the trademark Sunett ® , is used in a variety of beverages, confections and dairy products throughout the world. Sunett ® sweetener is the ideal blending partner for caloric and non-caloric sweeteners and is recognized for its consistent product quality and reliable supply.
Food protection ingredients. Nutrinova's food protection ingredients are mainly used in foods, beverages and personal care products. Sorbates pricing is extremely sensitive to demand and industry capacity and is not necessarily dependent on the cost of raw materials.
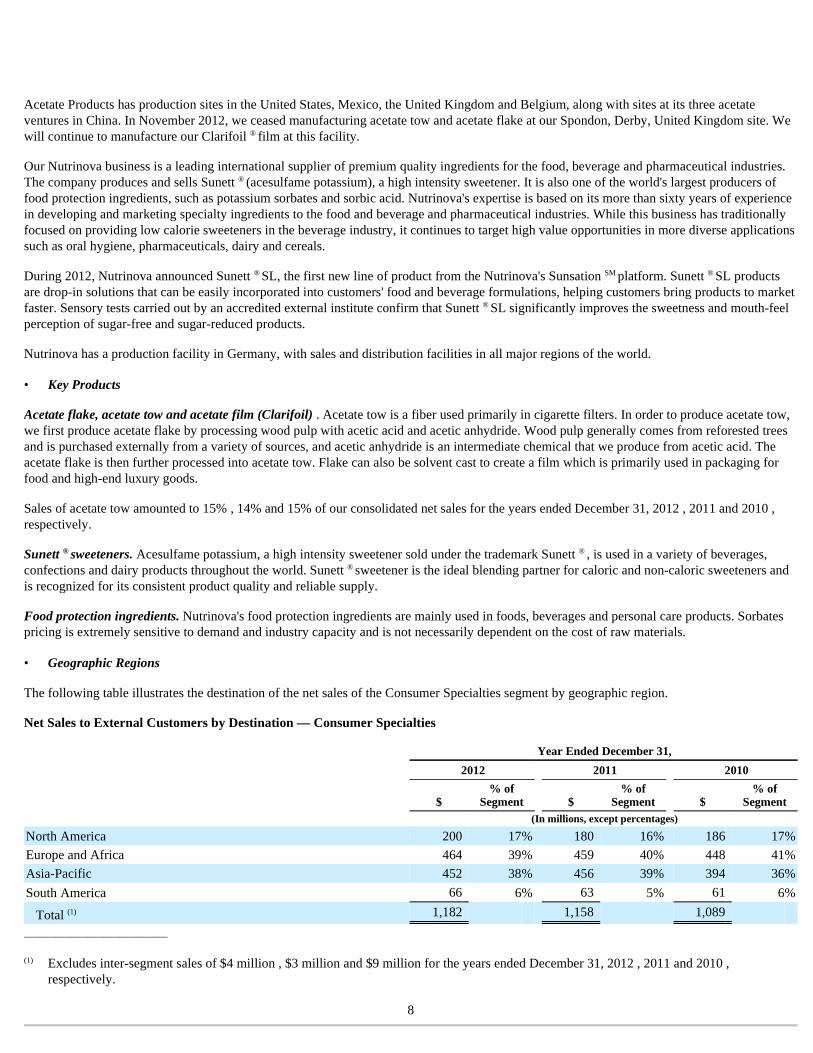
The following table illustrates the destination of the net sales of the Consumer Specialties segment by geographic region.
Net Sales to External Customers by Destination — Consumer Specialties
___________________________
8
• Key Products
• Geographic Regions
Year Ended December 31,
2012 2011 2010
$ % of
Segment $ % of
Segment $ % of
Segment (In millions, except percentages)
North America 200 17 % 180 16 % 186 17 %
Europe and Africa 464 39 % 459 40 % 448 41 %
Asia-Pacific 452 38 % 456 39 % 394 36 %
South America 66 6 % 63 5 % 61 6 %
Total (1) 1,182 1,158 1,089
(1) Excludes inter-segment sales of $4 million , $3 million and $9 million for the years ended December 31, 2012 , 2011 and 2010 , respectively.
Acetate tow is sold principally to the major tobacco companies that account for a majority of worldwide cigarette production. Contracts with most of our customers are generally entered into on an annual basis.
Customers of Clarifoil ® include printers, carton manufacturers, retailers, packaging buyers, publishers and designers.
Nutrinova primarily sells Sunett ® sweeteners to a limited number of large multinational and regional customers in the beverage and food industry under long-term and annual contracts. Nutrinova sells food protection ingredients primarily through regional distributors to small and medium sized customers and directly to large multinational customers in the food industry.
Acetate Products’ principal competitors include Daicel Chemical Industries Ltd., Eastman Chemical Corporation and Solvay S.A.
The principal competitors for Sunett ® sweetener include The NutraSweet Company, Ajinomoto Co., Inc., Tate & Lyle PLC and several Chinese manufacturers. In sorbates, Nutrinova competes with Nantong AA, Daicel Chemical Industries Ltd. and other Chinese manufacturers.
Industrial Specialties
The Industrial Specialties segment, which includes the Emulsions and EVA Performance Polymers businesses, is active in every major global industrial sector and serves diverse industrial and consumer end-use applications. These include traditional vinyl-based end uses, such as paints and coatings and adhesives, as well as other unique, high-value end uses including solar cells and medical applications.
The Emulsions business is a leading global producer of vinyl acetate-based emulsions and develops products and application technologies to improve performance, create value and drive innovation in applications such as paints and coatings, adhesives, construction, glass fiber, textiles and paper. The business has manufacturing facilities in major global regions and is supported by expert technical service regionally. Celanese emulsion products are sold under globally and regionally recognized brands including EcoVAE ® , Mowilith ® , Vinamul ® , Celvolit ® , BriteCoat ® , TufCOR TM and Avicor TM . The Emulsions business has production sites in the United States, Canada, China, Spain, Sweden, the Netherlands and Germany.
EVA Performance Polymers is a leading North American manufacturer of a full range of low-density polyethylene and specialty EVA resins and compounds. Sold under the Ateva ® and VitalDose ® brands, these products are used in many applications, including flexible packaging films, lamination film products, hot melt adhesives, medical products, automotive, carpeting and photovoltaic cells. EVA Performance Polymers has a production facility in Edmonton, Alberta, Canada.
The Industrial Specialties segment builds on our leading acetyl technology. Our Acetyl Intermediates segment produces VAM, a primary raw material for our Emulsions and EVA Performance Polymers businesses. Ethylene, another key raw material, is purchased externally from a variety of sources.
Our Industrial Specialties businesses have experienced significant growth in Asia, and we have made investments to support continued growth in the region. In 2011, we doubled the VAE capacity at our integrated chemical complex in Nanjing, China to meet the increased global demand for innovative specialty solutions in vinyl-based emulsions.
In addition to geographic growth, the Industrial Specialties businesses are focused on innovation efforts to increase value. The business segment has successfully launched new innovative products and technologies in non-traditional applications such as medical, carpet, textiles and paper.
Our Emulsions business produces conventional vinyl- and acrylate-based emulsions and VAE. Emulsions are made from VAM, ethylene, acrylate esters and styrene. VAE is a key component of water-based architectural coatings, adhesives, non-wovens, textiles, glass fiber and other applications.
EVA Performance Polymers produces low-density polyethylene and EVA resins and compounds. EVA resins and compounds are produced in high-pressure reactors from ethylene and VAM.
9
• Customers
• Competition
• Key Products
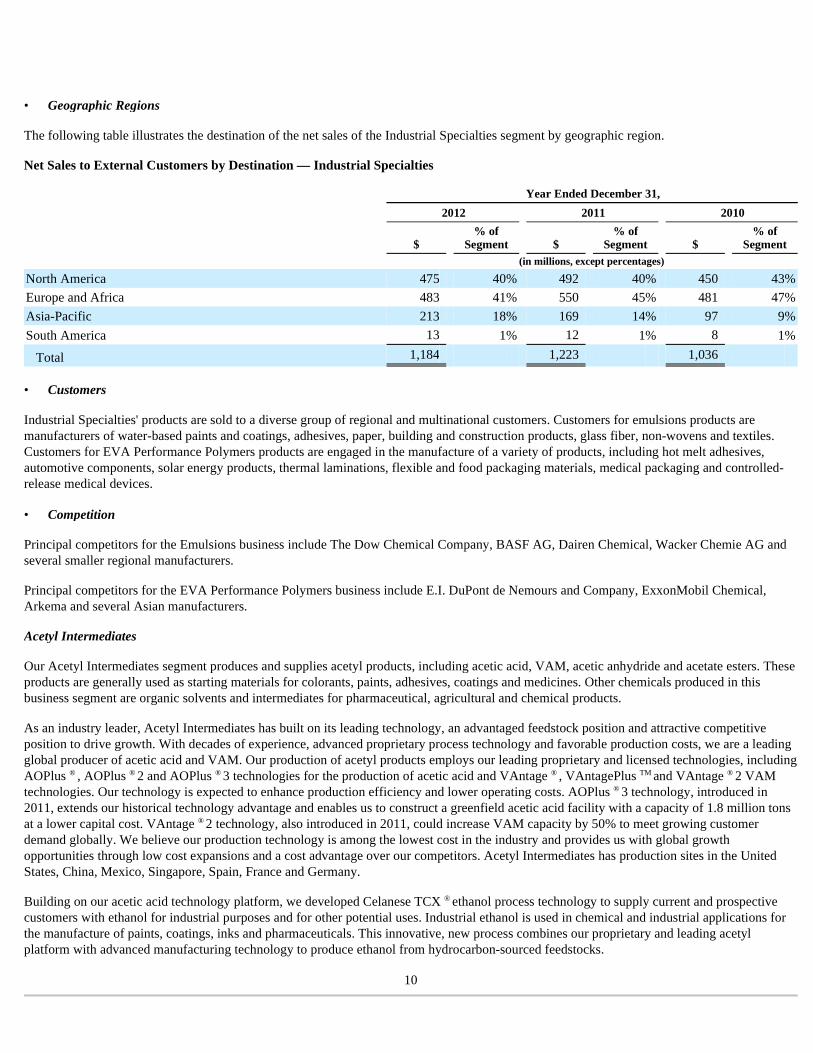
The following table illustrates the destination of the net sales of the Industrial Specialties segment by geographic region.
Net Sales to External Customers by Destination — Industrial Specialties
Industrial Specialties' products are sold to a diverse group of regional and multinational customers. Customers for emulsions products are manufacturers of water-based paints and coatings, adhesives, paper, building and construction products, glass fiber, non-wovens and textiles. Customers for EVA Performance Polymers products are engaged in the manufacture of a variety of products, including hot melt adhesives, automotive components, solar energy products, thermal laminations, flexible and food packaging materials, medical packaging and controlled-release medical devices.
Principal competitors for the Emulsions business include The Dow Chemical Company, BASF AG, Dairen Chemical, Wacker Chemie AG and several smaller regional manufacturers.
Principal competitors for the EVA Performance Polymers business include E.I. DuPont de Nemours and Company, ExxonMobil Chemical, Arkema and several Asian manufacturers.
Acetyl Intermediates
Our Acetyl Intermediates segment produces and supplies acetyl products, including acetic acid, VAM, acetic anhydride and acetate esters. These products are generally used as starting materials for colorants, paints, adhesives, coatings and medicines. Other chemicals produced in this business segment are organic solvents and intermediates for pharmaceutical, agricultural and chemical products.
As an industry leader, Acetyl Intermediates has built on its leading technology, an advantaged feedstock position and attractive competitive position to drive growth. With decades of experience, advanced proprietary process technology and favorable production costs, we are a leading global producer of acetic acid and VAM. Our production of acetyl products employs our leading proprietary and licensed technologies, including AOPlus ® , AOPlus ® 2 and AOPlus ® 3 technologies for the production of acetic acid and VAntage ® , VAntagePlus TM and VAntage ® 2 VAM technologies. Our technology is expected to enhance production efficiency and lower operating costs. AOPlus ® 3 technology, introduced in 2011, extends our historical technology advantage and enables us to construct a greenfield acetic acid facility with a capacity of 1.8 million tons at a lower capital cost. VAntage ® 2 technology, also introduced in 2011, could increase VAM capacity by 50% to meet growing customer demand globally. We believe our production technology is among the lowest cost in the industry and provides us with global growth opportunities through low cost expansions and a cost advantage over our competitors. Acetyl Intermediates has production sites in the United States, China, Mexico, Singapore, Spain, France and Germany.
Building on our acetic acid technology platform, we developed Celanese TCX ® ethanol process technology to supply current and prospective customers with ethanol for industrial purposes and for other potential uses. Industrial ethanol is used in chemical and industrial applications for the manufacture of paints, coatings, inks and pharmaceuticals. This innovative, new process combines our proprietary and leading acetyl platform with advanced manufacturing technology to produce ethanol from hydrocarbon-sourced feedstocks.
10
• Geographic Regions
Year Ended December 31,
2012 2011 2010
$ % of
Segment $ % of
Segment $ % of
Segment (in millions, except percentages)
North America 475 40 % 492 40 % 450 43 %
Europe and Africa 483 41 % 550 45 % 481 47 %
Asia-Pacific 213 18 % 169 14 % 97 9 %
South America 13 1 % 12 1 % 8 1 %
Total 1,184 1,223 1,036
• Customers
• Competition
In 2012, we completed construction of a technology development unit for ethanol production at our facility in Clear Lake, Texas which will allow us to continue the advancement of our acetyl and TCX ® technologies. In addition, we are in the process of modifying and enhancing our existing integrated acetyl facility in Nanjing, China with our TCX ® advanced technology. The modifications would add approximately 275,000 tons of ethanol production capacity by mid-2013. We also intend to construct one, and possibly two, additional industrial ethanol complexes in China, following necessary approvals, utilizing Celanese TCX ® ethanol process technology to help supply applications for the growing Asia region.
Acetyl Products. Acetyl products include acetic acid, VAM, acetic anhydride and acetaldehyde. Acetic acid is primarily used to manufacture VAM, purified terephthalic acid and other acetyl derivatives. VAM is used in a variety of adhesives, paints, films, coatings and textiles. Acetic anhydride is a raw material used in the production of cellulose acetate, detergents and pharmaceuticals. Acetaldehyde is a major feedstock for the production of a variety of derivatives, such as pyridines, which are used in agricultural products. We manufacture acetic acid, VAM and acetic anhydride for our own use, as well as for sale to third parties.
Acetic acid and VAM, our basic acetyl intermediates products, are impacted by global supply and demand fundamentals and are cyclical in nature. The principal raw materials in these products are: carbon monoxide, which we generally purchase under long-term contracts; methanol, which we generally purchase under both long-term and short-term contracts; and ethylene, which we purchase from numerous sources. Generally, methanol and ethylene are commodity products available from a wide variety of sources.
Sales from acetyl products amounted to 32% of our consolidated net sales for the year ended December 31, 2012 and 34% for each of the years ended December 31, 2011 and 2010 .
Solvents and Derivatives. We manufacture a variety of solvents, formaldehyde and other chemicals, which in turn are used in the manufacture of paints, coatings, adhesives and other products. Many solvents and derivatives products are derived from our production of acetic acid. Primary products are:
Sales from solvents and derivatives products amounted to 11% , 12% and 11% of our consolidated net sales for the years ended December 31, 2012 , 2011 and 2010 , respectively.
11
• Key Products
• Ethyl acetate, an acetate ester that is a solvent used in coatings, inks and adhesives and in the manufacture of photographic films and coated papers;
• Butyl acetate, an acetate ester that is a solvent used in inks, pharmaceuticals and perfume;
• Formaldehyde, paraformaldehyde and formcels, which are primarily used to produce adhesive resins for plywood, particle board, coatings, POM engineering resins and a compound used in making polyurethane; and
• Other chemicals, such as crotonaldehyde, which are used by the Nutrinova business for the production of sorbates, as well as raw materials for the fragrance and food ingredients industry.
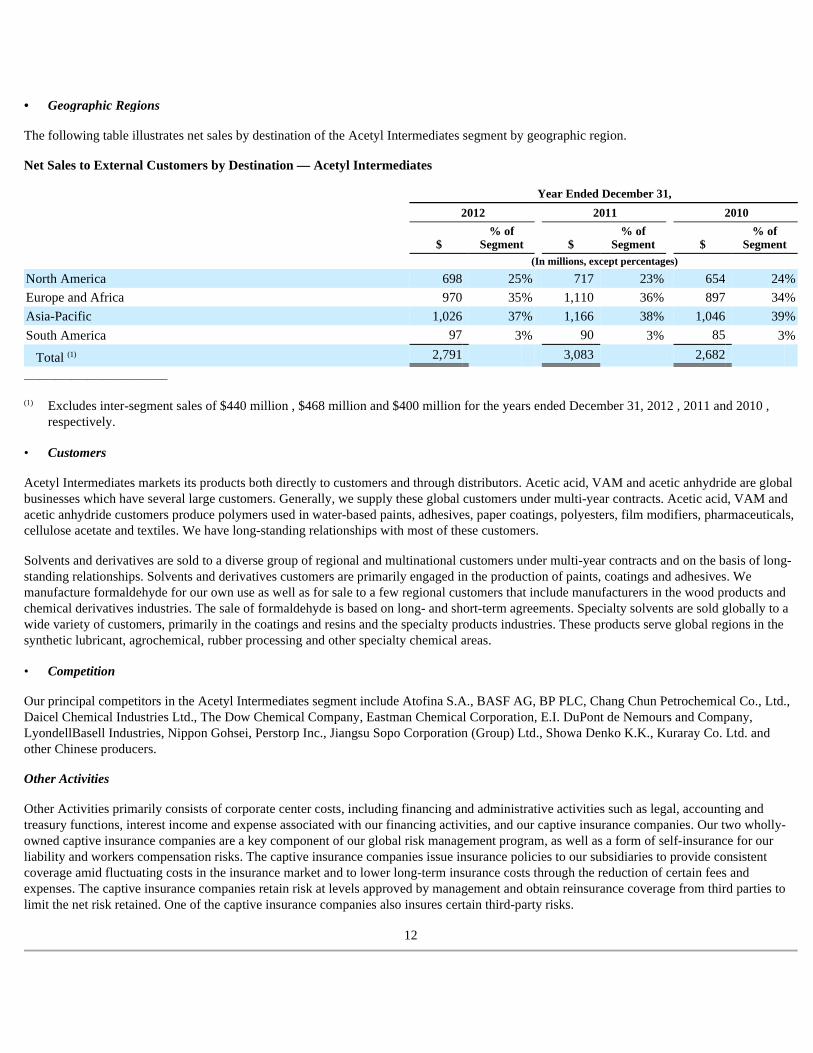
The following table illustrates net sales by destination of the Acetyl Intermediates segment by geographic region.
Net Sales to External Customers by Destination — Acetyl Intermediates
___________________________
Acetyl Intermediates markets its products both directly to customers and through distributors. Acetic acid, VAM and acetic anhydride are global businesses which have several large customers. Generally, we supply these global customers under multi-year contracts. Acetic acid, VAM and acetic anhydride customers produce polymers used in water-based paints, adhesives, paper coatings, polyesters, film modifiers, pharmaceuticals, cellulose acetate and textiles. We have long-standing relationships with most of these customers.
Solvents and derivatives are sold to a diverse group of regional and multinational customers under multi-year contracts and on the basis of long-standing relationships. Solvents and derivatives customers are primarily engaged in the production of paints, coatings and adhesives. We manufacture formaldehyde for our own use as well as for sale to a few regional customers that include manufacturers in the wood products and chemical derivatives industries. The sale of formaldehyde is based on long- and short-term agreements. Specialty solvents are sold globally to a wide variety of customers, primarily in the coatings and resins and the specialty products industries. These products serve global regions in the synthetic lubricant, agrochemical, rubber processing and other specialty chemical areas.
Our principal competitors in the Acetyl Intermediates segment include Atofina S.A., BASF AG, BP PLC, Chang Chun Petrochemical Co., Ltd., Daicel Chemical Industries Ltd., The Dow Chemical Company, Eastman Chemical Corporation, E.I. DuPont de Nemours and Company, LyondellBasell Industries, Nippon Gohsei, Perstorp Inc., Jiangsu Sopo Corporation (Group) Ltd., Showa Denko K.K., Kuraray Co. Ltd. and other Chinese producers.
Other Activities
Other Activities primarily consists of corporate center costs, including financing and administrative activities such as legal, accounting and treasury functions, interest income and expense associated with our financing activities, and our captive insurance companies. Our two wholly-owned captive insurance companies are a key component of our global risk management program, as well as a form of self-insurance for our liability and workers compensation risks. The captive insurance companies issue insurance policies to our subsidiaries to provide consistent coverage amid fluctuating costs in the insurance market and to lower long-term insurance costs through the reduction of certain fees and expenses. The captive insurance companies retain risk at levels approved by management and obtain reinsurance coverage from third parties to limit the net risk retained. One of the captive insurance companies also insures certain third-party risks.
12
• Geographic Regions
Year Ended December 31,
2012 2011 2010
$ % of
Segment $ % of
Segment $ % of
Segment (In millions, except percentages)
North America 698 25 % 717 23 % 654 24 %
Europe and Africa 970 35 % 1,110 36 % 897 34 %
Asia-Pacific 1,026 37 % 1,166 38 % 1,046 39 %
South America 97 3 % 90 3 % 85 3 %
Total (1) 2,791 3,083 2,682
(1) Excludes inter-segment sales of $440 million , $468 million and $400 million for the years ended December 31, 2012 , 2011 and 2010 , respectively.
• Customers
• Competition
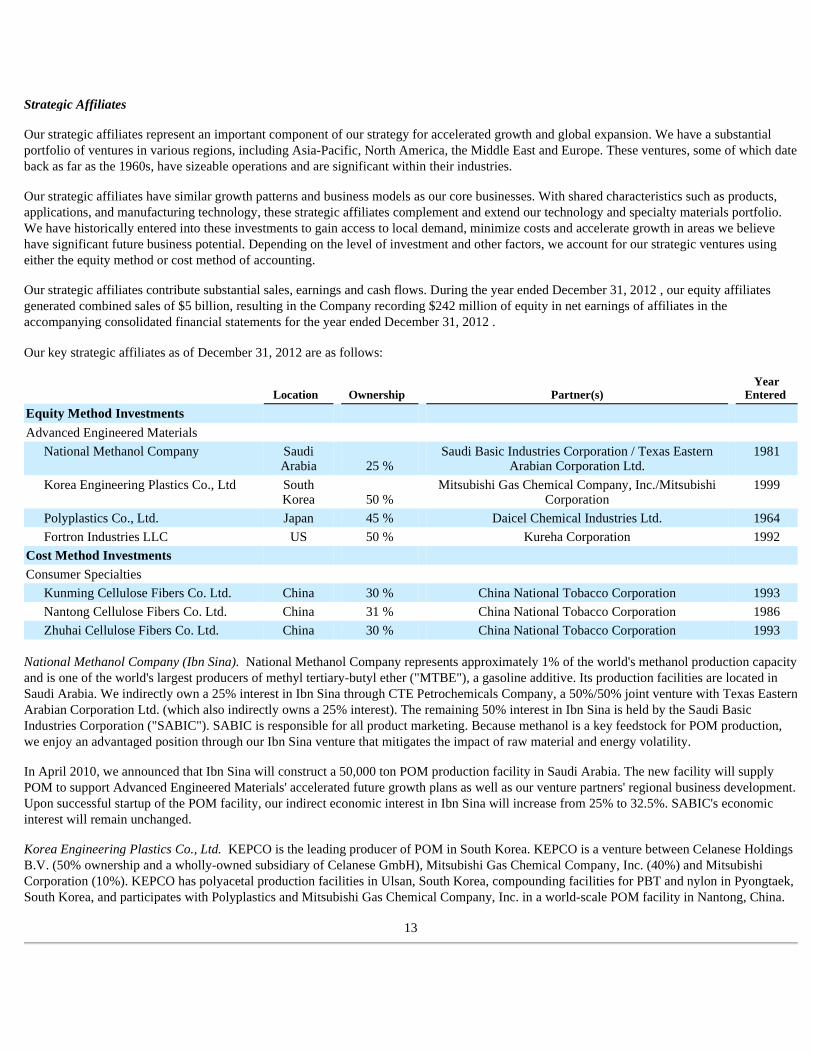
Strategic Affiliates
Our strategic affiliates represent an important component of our strategy for accelerated growth and global expansion. We have a substantial portfolio of ventures in various regions, including Asia-Pacific, North America, the Middle East and Europe. These ventures, some of which date back as far as the 1960s, have sizeable operations and are significant within their industries.
Our strategic affiliates have similar growth patterns and business models as our core businesses. With shared characteristics such as products, applications, and manufacturing technology, these strategic affiliates complement and extend our technology and specialty materials portfolio. We have historically entered into these investments to gain access to local demand, minimize costs and accelerate growth in areas we believe have significant future business potential. Depending on the level of investment and other factors, we account for our strategic ventures using either the equity method or cost method of accounting.
Our strategic affiliates contribute substantial sales, earnings and cash flows. During the year ended December 31, 2012 , our equity affiliates generated combined sales of $5 billion, resulting in the Company recording $242 million of equity in net earnings of affiliates in the accompanying consolidated financial statements for the year ended December 31, 2012 .
Our key strategic affiliates as of December 31, 2012 are as follows:
National Methanol Company (Ibn Sina). National Methanol Company represents approximately 1% of the world's methanol production capacity and is one of the world's largest producers of methyl tertiary-butyl ether ("MTBE"), a gasoline additive. Its production facilities are located in Saudi Arabia. We indirectly own a 25% interest in Ibn Sina through CTE Petrochemicals Company, a 50%/50% joint venture with Texas Eastern Arabian Corporation Ltd. (which also indirectly owns a 25% interest). The remaining 50% interest in Ibn Sina is held by the Saudi Basic Industries Corporation ("SABIC"). SABIC is responsible for all product marketing. Because methanol is a key feedstock for POM production, we enjoy an advantaged position through our Ibn Sina venture that mitigates the impact of raw material and energy volatility.
In April 2010, we announced that Ibn Sina will construct a 50,000 ton POM production facility in Saudi Arabia. The new facility will supply POM to support Advanced Engineered Materials' accelerated future growth plans as well as our venture partners' regional business development. Upon successful startup of the POM facility, our indirect economic interest in Ibn Sina will increase from 25% to 32.5%. SABIC's economic interest will remain unchanged.
Korea Engineering Plastics Co., Ltd. KEPCO is the leading producer of POM in South Korea. KEPCO is a venture between Celanese Holdings B.V. (50% ownership and a wholly-owned subsidiary of Celanese GmbH), Mitsubishi Gas Chemical Company, Inc. (40%) and Mitsubishi Corporation (10%). KEPCO has polyacetal production facilities in Ulsan, South Korea, compounding facilities for PBT and nylon in Pyongtaek, South Korea, and participates with Polyplastics and Mitsubishi Gas Chemical Company, Inc. in a world-scale POM facility in Nantong, China.
13
Location Ownership Partner(s) Year
Entered
Equity Method Investments
Advanced Engineered Materials
National Methanol Company Saudi Arabia 25 %
Saudi Basic Industries Corporation / Texas Eastern Arabian Corporation Ltd.
1981
Korea Engineering Plastics Co., Ltd South Korea 50 %
Mitsubishi Gas Chemical Company, Inc./Mitsubishi Corporation
1999
Polyplastics Co., Ltd. Japan 45 % Daicel Chemical Industries Ltd. 1964
Fortron Industries LLC US 50 % Kureha Corporation 1992
Cost Method Investments
Consumer Specialties
Kunming Cellulose Fibers Co. Ltd. China 30 % China National Tobacco Corporation 1993
Nantong Cellulose Fibers Co. Ltd. China 31 % China National Tobacco Corporation 1986
Zhuhai Cellulose Fibers Co. Ltd. China 30 % China National Tobacco Corporation 1993
Polyplastics Co., Ltd. Polyplastics is a leading supplier of engineered plastics in the Asia-Pacific region and is a venture between Daicel Chemical Industries Ltd., Japan (55%) and Ticona LLC (45% ownership and a wholly-owned subsidiary of CNA Holdings LLC). Polyplastics is a producer and marketer of POM and LCP, with principal production facilities located in Japan, Taiwan, Malaysia and China.
Fortron Industries LLC. Fortron is a leading global producer of polyphenylene sulfide ("PPS"), sold under the Fortron ® brand, which is used in a wide variety of automotive and other applications, especially those requiring heat and/or chemical resistance. Fortron is a limited liability company whose members are Ticona Fortron Inc. (50% ownership and a wholly-owned subsidiary of CNA Holdings LLC) and Kureha Corporation (50%). Fortron's facility is located in Wilmington, North Carolina. This venture combines the sales, marketing, distribution, compounding and manufacturing expertise of Celanese with the PPS polymer technology expertise of Kureha.
China acetate strategic ventures. We hold ownership interest in three separate acetate production ventures in China as follows: Nantong Cellulose Fibers Co. Ltd. (31%), Kunming Cellulose Fibers Co. Ltd. (30%) and Zhuhai Cellulose Fibers Co. Ltd. (30%). The China National Tobacco Corporation, the Chinese state-owned tobacco entity, controls the remaining ownership interest in each of these ventures.
Our Chinese acetate ventures fund their operations using operating cash flow and pay a dividend in the second quarter of each fiscal year based on the ventures' performance for the preceding year. In 2012 , 2011 and 2010 , we received cash dividends of $83 million , $78 million and $71 million , respectively.
During 2012, our venture's Nantong facility completed an expansion of its acetate flake and acetate tow capacity, each by 30,000 tons. We made contributions of $29 million over three years related to the capacity expansion in Nantong. Similar expansions since the ventures were formed have led to earnings growth and increased dividends for the Company.
According to the Euromonitor database services, China is estimated to have a 42% share of the world's 2011 cigarette consumption and is the fastest growing area for cigarette consumption at an estimated growth rate of 3.5% per year from 2011 through 2016. Combined, these ventures are a leader in Chinese domestic acetate production and we believe we are well positioned to supply Chinese cigarette producers.
Although our ownership interest in each of our China acetate ventures exceeds 20%, we account for these investments using the cost method of accounting because we determined that we cannot exercise significant influence over these entities due to local government investment in and influence over these entities, limitations on our involvement in the day-to-day operations and the present inability of the entities to provide timely financial information prepared in accordance with generally accepted accounting principles in the United States ("US GAAP").
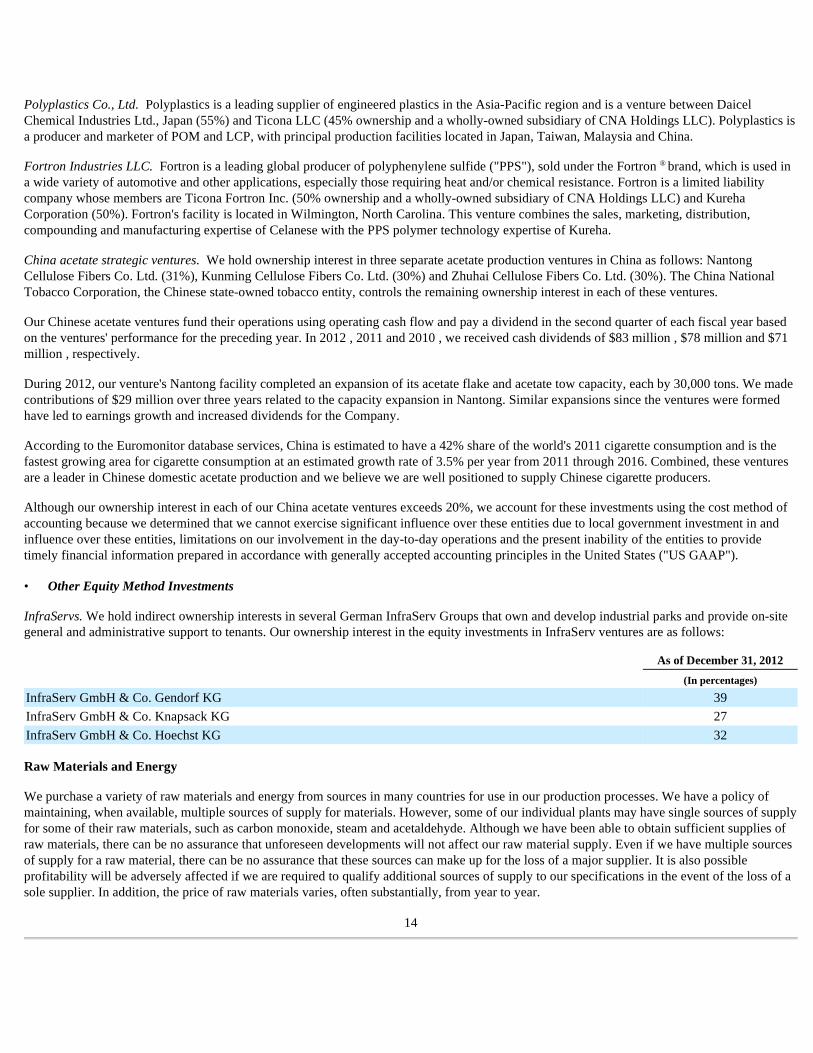
InfraServs. We hold indirect ownership interests in several German InfraServ Groups that own and develop industrial parks and provide on-site general and administrative support to tenants. Our ownership interest in the equity investments in InfraServ ventures are as follows:
Raw Materials and Energy
We purchase a variety of raw materials and energy from sources in many countries for use in our production processes. We have a policy of maintaining, when available, multiple sources of supply for materials. However, some of our individual plants may have single sources of supply for some of their raw materials, such as carbon monoxide, steam and acetaldehyde. Although we have been able to obtain sufficient supplies of raw materials, there can be no assurance that unforeseen developments will not affect our raw material supply. Even if we have multiple sources of supply for a raw material, there can be no assurance that these sources can make up for the loss of a major supplier. It is also possible profitability will be adversely affected if we are required to qualify additional sources of supply to our specifications in the event of the loss of a sole supplier. In addition, the price of raw materials varies, often substantially, from year to year.
14
• Other Equity Method Investments
As of December 31, 2012
(In percentages)
InfraServ GmbH & Co. Gendorf KG 39
InfraServ GmbH & Co. Knapsack KG 27
InfraServ GmbH & Co. Hoechst KG 32
A substantial portion of our products and raw materials are commodities whose prices fluctuate as supply and demand fundamentals change. Our production facilities rely largely on natural gas, coal, fuel oil and electricity for energy. We manage our exposure to commodity risk primarily through the use of long-term supply agreements, multi-year purchasing and sales agreements and forward purchase contracts.
We also currently purchase and lease supplies of various precious metals, such as rhodium, used as catalysts for the manufacture of Acetyl Intermediates products. For precious metals, the leases are normally distributed among multiple lessors for each product.
Research and Development
Our businesses are innovation-oriented and conduct research and development activities to develop new, and optimize existing, production technologies, as well as to develop commercially viable new products and applications. We consider the amounts spent during each of the last three fiscal years on research and development activities to be sufficient to execute our current strategic initiatives.
Intellectual Property
We attach importance to protecting our intellectual property, including through patents, trademarks, copyrights and product designs in order to preserve our investment in research and development, manufacturing and marketing. Patents may cover processes, products, intermediate products and product uses. We also seek to register trademarks as a means of protecting the brand names of our products. We protect our intellectual property against infringement and also seek to register design protection where appropriate.
Patents. In most industrial countries, patent protection exists for new substances and formulations, as well as for certain unique applications and production processes. However, we do business in regions of the world where intellectual property protection may be limited and difficult to enforce. We maintain strict information security policies and procedures wherever we do business. Such information security policies and procedures include data encryption, controls over the disclosure and safekeeping of confidential information, as well as employee awareness training. Moreover, we monitor competitive developments and defend against infringements on our intellectual property rights.
Trademarks. AOPlus ® , AOPlus ® 2, AOPlus ® 3, VAntage ® , VAntagePlus TM , VAntage ® 2, BuyTiconaDirect TM , Celanex ® , Celcon ® , Celstran ® , CelFX TM , Celvolit ® , Clarifoil ® , Compel ® , GUR ® , Hostaform ® , Impet ® , Mowilith ® , Nutrinova ® , Riteflex ® , Sunett ® , Sunsation SM , Thermx ® , Zenite ® , Vandar ® , Vectra ® , Vinamul ® , EcoVAE ® , Duroset ® , Ateva ® , Acetex ® , TCX ® , VitalDose ® , BriteCoat ®
and certain other branded products and services named in this document are registered or reserved trademarks or service marks owned or licensed by Celanese. The foregoing is not intended to be an exhaustive or comprehensive list of all registered or reserved trademarks and service marks owned or licensed by Celanese. Fortron ® is a registered trademark of Fortron.
Neither Celanese nor any particular business segment is materially dependent upon any one patent, trademark, copyright or trade secret.
Environmental and Other Regulation
Matters pertaining to environmental and other regulations are discussed in Item 1A. Risk Factors , Item 7. Management’s Discussion and Analysis of Financial Condition and Results of Operations – Critical Accounting Policies and Estimates – Accounting for Commitments and Contingencies , and Note 15 - Environmental and Note 23 - Commitments and Contingencies in the accompanying consolidated financial statements.
15
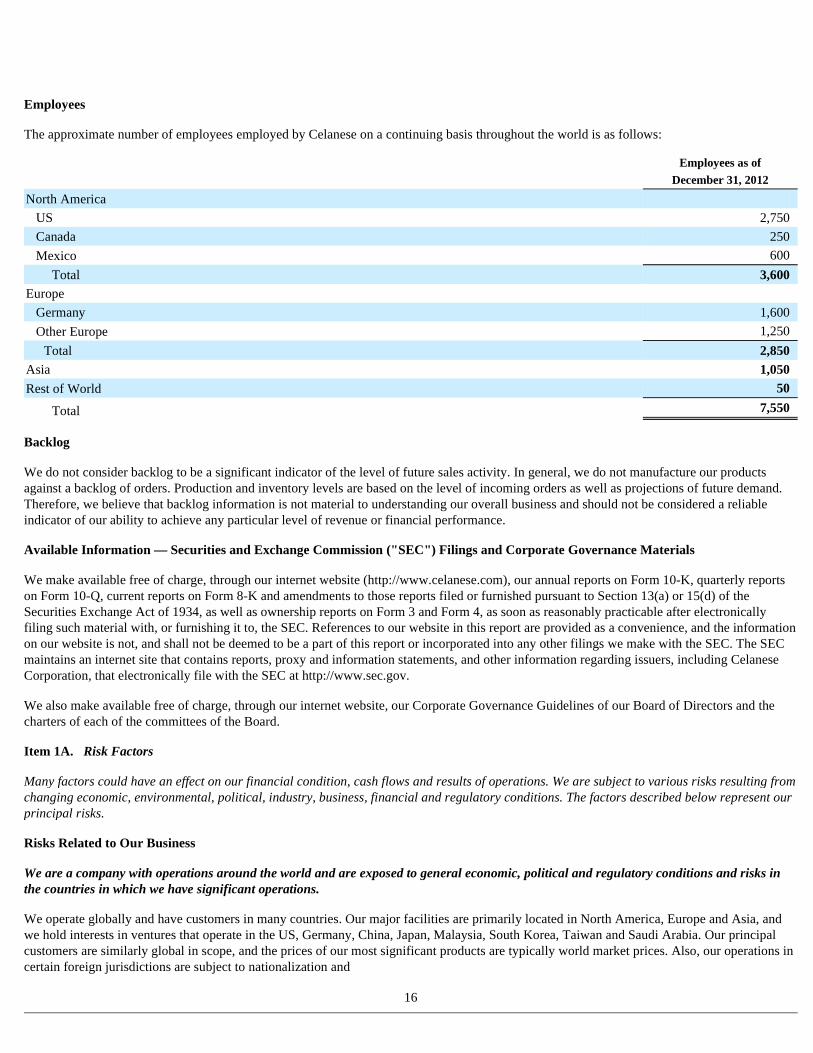
Employees
The approximate number of employees employed by Celanese on a continuing basis throughout the world is as follows:
Backlog
We do not consider backlog to be a significant indicator of the level of future sales activity. In general, we do not manufacture our products against a backlog of orders. Production and inventory levels are based on the level of incoming orders as well as projections of future demand. Therefore, we believe that backlog information is not material to understanding our overall business and should not be considered a reliable indicator of our ability to achieve any particular level of revenue or financial performance.
Available Information — Securities and Exchange Commission ("SEC") Filings and Corporate Governance Materials
We make available free of charge, through our internet website (http://www.celanese.com), our annual reports on Form 10-K, quarterly reports on Form 10-Q, current reports on Form 8-K and amendments to those reports filed or furnished pursuant to Section 13(a) or 15(d) of the Securities Exchange Act of 1934, as well as ownership reports on Form 3 and Form 4, as soon as reasonably practicable after electronically filing such material with, or furnishing it to, the SEC. References to our website in this report are provided as a convenience, and the information on our website is not, and shall not be deemed to be a part of this report or incorporated into any other filings we make with the SEC. The SEC maintains an internet site that contains reports, proxy and information statements, and other information regarding issuers, including Celanese Corporation, that electronically file with the SEC at http://www.sec.gov.
We also make available free of charge, through our internet website, our Corporate Governance Guidelines of our Board of Directors and the charters of each of the committees of the Board.
Item 1A. Risk Factors
Many factors could have an effect on our financial condition, cash flows and results of operations. We are subject to various risks resulting from changing economic, environmental, political, industry, business, financial and regulatory conditions. The factors described below represent our principal risks.
Risks Related to Our Business
We are a company with operations around the world and are exposed to general economic, political and regulatory conditions and risks in the countries in which we have significant operations.
We operate globally and have customers in many countries. Our major facilities are primarily located in North America, Europe and Asia, and we hold interests in ventures that operate in the US, Germany, China, Japan, Malaysia, South Korea, Taiwan and Saudi Arabia. Our principal customers are similarly global in scope, and the prices of our most significant products are typically world market prices. Also, our operations in certain foreign jurisdictions are subject to nationalization and
16
Employees as of
December 31, 2012
North America US 2,750 Canada 250 Mexico 600
Total 3,600 Europe
Germany 1,600 Other Europe 1,250
Total 2,850 Asia 1,050 Rest of World 50
Total 7,550
expropriation risk, and some of our contractual relationships within these jurisdictions are subject to cancellation without full compensation for loss. In certain cases where we benefit from local government subsidies or other undertakings, such benefits are subject to the solvency of local government entities and are subject to termination without meaningful recourse or remedies. Consequently, our business and financial results are affected, directly and indirectly, by world economic, political and regulatory conditions.
In addition to the worldwide economic downturn, conditions such as the uncertainties associated with war, terrorist activities, civil unrest, epidemics, pandemics, weather, natural disasters, the effects of climate change or political instability in any of the countries in which we operate or have significant customers or suppliers could affect us by causing delays or losses in the supply or delivery of raw materials and products, as well as increasing security costs, insurance premiums and other expenses. These conditions could also result in or lengthen economic recession in the United States, Europe, Asia or elsewhere.
Failure to comply with applicable laws, rules, regulations or court decisions could expose us to fines, penalties and other costs. Moreover, changes in laws or regulations, such as unexpected changes in regulatory requirements (including import or export licensing requirements), or changes in the reporting requirements of the United States, Canadian, Mexican, German, European Union ("EU") or Asian governmental agencies, could increase the cost of doing business in these regions. Any of these conditions may have an effect on our business and financial results as a whole and may result in volatile current and future prices for our securities, including our stock.
In particular, we have invested significant resources in China and other Asian countries. This region's growth may slow, and we may fail to realize the anticipated benefits associated with our investment there and our financial results may be adversely impacted.
In addition, we have significant operations and financial relationships based in Europe. Europe has historically accounted for over one-third of our net revenues and more than 40% in 2012. The European sovereign debt crisis and bank funding pressures in the Eurozone may continue to negatively impact our overall financial results due to reduced economic growth and resulting decreased end-use customer demand.
As of December 31, 2012, we held $189 million in cash in Europe. This cash is primarily invested in deposits in several European banks, a European money market fund that invests only in highly rated and liquid European sovereign debt and a US Treasury money market fund. The allocation of the cash invested in each of these options fluctuates based on market conditions. As of December 31, 2012, we also had $75 million of direct investments in highly rated European sovereign debt in our pension funds, accounting for less than 3% of our total pension fund assets, that may be affected if European economic conditions worsen. Finally, our ability to access additional liquidity from European financial institutions in the future may also be impaired.
We are subject to risks associated with the increased volatility in the prices and availability of key raw materials and energy, which could have a significant adverse effect on the margins of our products and our financial results.
We purchase significant amounts of ethylene, methanol, carbon monoxide and natural gas from third parties primarily for use in our production of basic chemicals in the Acetyl Intermediates segment, principally acetic acid, VAM and formaldehyde. We use a portion of our output of these chemicals, in turn, as inputs in the production of downstream products in all our business segments. We also purchase some of these raw materials for use in our Industrial Specialties segment, primarily for VAE and EVA production, as well as significant amounts of wood pulp for use in our production of cellulose acetate in our Consumer Specialties segment. The price of many of these items is dependent on the available supply of that item and may increase significantly as a result of natural disasters, plant or production disruptions, strikes or other labor unrest, war or other outbreak of hostilities or terrorism, breakdown or degradation of transportation infrastructure used for delivery of strategic raw materials and energy commodities, or changes in laws or regulations. In particular, to the extent of our vertical integration in the production of chemicals, shortages in the availability of raw material chemicals, such as natural gas, ethylene and methanol, or the loss of our dedicated supplies of carbon monoxide, may have an increased adverse impact on us as it can cause a shortage in intermediate and finished products. Such shortages would adversely impact our ability to produce certain products and increase our costs resulting in reduced margins and adverse financial results.
We are exposed to volatility in the prices of our raw materials and energy. Although we have agreements providing for the supply of ethylene, methanol, carbon monoxide, wood pulp, natural gas, electricity and fuel oil, the contractual prices for these raw materials and energy can vary with economic conditions and may be highly volatile. In addition to the factors noted above that may impact supply or price, factors that have caused volatility in our raw material prices in the past and which may do so in the future include:
17
If we are not able to fully offset the effects of higher energy and raw material costs through price increases, productivity improvements or cost reduction programs, or if such commodities become unavailable, it could have a significant adverse effect on our ability to timely and profitably manufacture and deliver our products with a resulting reduction in our margins and financial results.
A portion of our supply of methanol in North America is currently obtained under a contract expiring in 2015. If we are unable to obtain a reliable source of supply prior to expiration of the contract, we will likely purchase methanol on the open market. We currently plan to construct a methanol plant in the US to partially replace the methanol obtained under that contract.
Production at our manufacturing facilities could be disrupted for a variety of reasons, which could prevent us from producing enough of our products to maintain our sales and satisfy our customers' demands.
A disruption in production at one or more of our manufacturing facilities could have a material adverse effect on our business. Disruptions could occur for many reasons, including fire, natural disasters, weather, unplanned maintenance or other manufacturing problems, disease, strikes or other labor unrest, transportation interruption, government regulation, political unrest or terrorism. Alternative facilities with sufficient capacity or capabilities may not be available, may cost substantially more or may take a significant time to start production, each of which could negatively affect our business and financial performance. If one of our key manufacturing facilities is unable to produce our products for an extended period of time, our sales may be reduced by the shortfall caused by the disruption and we may not be able to meet our customers' needs, which could cause them to seek other suppliers. In particular, production disruptions at our manufacturing facilities that produce chemicals used as inputs in the production of chemicals in other business segments, such as acetic acid, VAM and formaldehyde, could have a more significant adverse effect on our business and financial performance and results of operation to the extent of such vertical integration. Furthermore, to the extent a production disruption occurs at a manufacturing facility that has been operating at or near full capacity, the resulting shortage of our product could be particularly harmful because production at the manufacturing facility may not be able to reach levels achieved prior to the disruption.
Failure to develop new products and production technologies or to implement productivity and cost reduction initiatives successfully may harm our competitive position.
Our operating results depend significantly on the development of commercially viable new products, product grades and applications, as well as process technologies, free of any legal restrictions. If we are unsuccessful in developing new products, applications and production processes in the future, our competitive position and operating results may be negatively affected. For example, we recently announced our intention to construct new ethanol manufacturing facilities in China and the US that will utilize advanced technology developed with elements of our proprietary advanced acetyl platform. However, as we invest in the commercialization of this new process technology, we face the risk of unanticipated operational or commercialization difficulties, including an inability to obtain necessary permits or governmental approvals, the development of competing technologies, failure of facilities or processes to operate in accordance with specifications or expectations, construction delays, cost over-runs, the unavailability of financing, required materials or equipment and various other factors. Likewise, we have undertaken and are continuing to undertake initiatives in all business segments to improve productivity and performance and to generate cost savings. These initiatives may not be completed or beneficial or the estimated cost savings from such activities may not be realized.
Our business is exposed to risks associated with the creditworthiness of our suppliers, customers and business partners and the industries in which our suppliers, customers and business partners participate are cyclical in nature, both of which may adversely affect our business and results of operations.
Some of the industries in which our end-use customers participate, such as the automotive, electrical, construction and textile industries, are cyclical in nature, thus posing a risk to us which is beyond our control. The industries in which these customers
18
• Shortages of raw materials due to increasing demand, e.g., from growing uses or new uses;
• Capacity constraints, e.g., due to construction delays, labor disruption or involuntary shutdowns;
• The inability of a supplier to meet our delivery orders or a supplier's choice not to fulfill orders or to terminate a supply contract or our inability to obtain or renew supply contracts on favorable terms;
• The general level of business and economic activity; and
• The direct or indirect effect of governmental regulation (including the impact of government regulation relating to climate change).
participate are highly competitive, to a large extent driven by end-use applications, and may experience overcapacity, all of which may affect demand for and pricing of our products. Our business is exposed to risks associated with the creditworthiness of our key suppliers, customers and business partners and reductions in demand for our customers' products. The consequences of this could include the interruption of production at the facilities of our customers, the reduction, delay or cancellation of customer orders, delays in or the inability of customers to obtain financing to purchase our products, delays or interruptions of the supply of raw materials we purchase and bankruptcy of customers, suppliers or other creditors. The occurrence of any of these events may adversely affect our cash flow, profitability and financial condition. Furthermore, the continuing European sovereign debt crisis could increase the likelihood and impact of these events for our European customers by potentially limiting end-use customer demand and restricting our customers' access to capital, which could continue to negatively affect our financial results.
Environmental regulations and other obligations relating to environmental matters could subject us to liability for fines, clean-ups and other damages, require us to incur significant costs to modify our operations and increase our manufacturing and delivery costs.
Costs related to our compliance with environmental laws and regulations, and potential obligations with respect to sites currently or formerly owned or operated by us, may have a significant negative impact on our operating results. We also have obligations related to the indemnity agreement contained in the demerger and transfer agreement between Celanese GmbH and Hoechst AG, also referred to as the demerger agreement, for environmental matters arising out of certain divestitures that took place prior to the demerger.
Our operations are subject to extensive international, national, state, local and other laws and regulations that govern environmental and health and safety matters. We incur substantial capital and other costs to comply with these requirements. If we violate any one of those laws or regulations, we can be held liable for substantial fines and other sanctions, including limitations on our operations as a result of changes to or revocations of environmental permits involved. Stricter environmental, safety and health laws, regulations and enforcement policies could result in substantial costs and liabilities to us or limitations on our operations and could subject our handling, manufacture, transport, use, reuse or disposal of substances or pollutants to more rigorous scrutiny than at present.
One example of such regulations is the National Emission Standard for Hazardous Air Pollutants for Industrial, Commercial, and Institutional Boilers and Process Heaters ("Boiler MACT"), which was published by the Environmental Protection Agency ("EPA") in the Federal Register on March 21, 2011. EPA issued a revised final rule on December 20, 2012. The Boiler MACT regulation will require us to make significant capital expenditures to comply with stricter emissions requirements for industrial boilers and process heaters at our facilities in the next three to four years. Consequently, compliance with these laws and regulations may negatively affect our earnings and cash flows in a particular reporting period.
Changes in environmental, health and safety regulations in the jurisdictions where we manufacture and sell our products could lead to a decrease in demand for our products.
New or revised governmental regulations and independent studies relating to the effect of our products on health, safety and the environment may affect demand for our products and the cost of producing our products.
In June 2009, the California Office of Environmental Health Hazard Assessment ("OEHHA") formally proposed to add VAM, along with 11 other substances, to a list of chemicals "known to the state of California" to cause cancer. OEHHA is required to maintain this list under the Safe Drinking Water and Toxic Enforcement Act of 1986 ("Proposition 65"). Celanese successfully defeated the attempt to list VAM through a judicial challenge that is now final, and OEHHA has withdrawn VAM from its list of proposed chemicals for the Proposition 65 list. However, OEHHA initially proposed VAM to the Proposition 65 list as a result of a lawsuit by an environmental group. Activists may again seek to require OEHHA to consider listing VAM or other chemicals on the Proposition 65 list. In addition, VAM or other chemicals we produce may be classified in other jurisdictions in a manner that would adversely affect demand for such products.
We are a producer of formaldehyde and plastics derived from formaldehyde. Several studies have investigated possible links between formaldehyde exposure and various end points including leukemia. The International Agency for Research on Cancer ("IARC"), a private research agency, has reclassified formaldehyde from Group 2A (probable human carcinogen) to Group 1 (known human carcinogen) based on studies linking formaldehyde exposure to nasopharyngeal cancer, a rare cancer in humans. In October 2009, IARC also concluded based on a recent study that there is sufficient evidence for a causal association between formaldehyde and the development of leukemia. We expect the results of IARC's review will be examined and considered by government agencies with responsibility for setting worker and environmental exposure standards and labeling requirements.
19
Other pending initiatives will potentially require toxicological testing and risk assessments of a wide variety of chemicals, including chemicals used or produced by us. These initiatives include the Voluntary Children's Chemical Evaluation Program, High Production Volume Chemical Initiative and expected modifications to the Toxic Substances Control Act ("TSCA") in the United States, as well as various European Commission programs, such as the Registration, Evaluation, Authorization and Restriction of Chemicals ("REACH").
The above-mentioned assessments in the United States and Europe may result in heightened concerns about the chemicals involved and additional requirements being placed on the production, handling, labeling or use of the subject chemicals. Such concerns and additional requirements could also increase the cost incurred by our customers to use our chemical products and otherwise limit the use of these products, which could lead to a decrease in demand for these products. Such a decrease in demand would likely have an adverse impact on our business and results of operations.
US federal regulations aimed at increasing security at certain chemical production plants and similar legislation that may be proposed in the future, if passed into law, may increase our operating costs and cause an adverse effect on our results of operations.
Regulations are being implemented by the US Department of Homeland Security ("DHS") aimed at decreasing the risk, and effects, of potential terrorist attacks on chemical plants located within the United States. Pursuant to these regulations, these goals would be accomplished in part through the requirement that certain high-priority facilities develop a prevention, preparedness, and response plan after conducting a vulnerability assessment. In addition, companies may be required to evaluate the possibility of using less dangerous chemicals and technologies as part of their vulnerability assessments and security plans and implementing feasible safer technologies in order to minimize potential damage to their facilities from a terrorist attack. We have registered certain of our sites with DHS in accordance with these regulations, have conducted vulnerability assessments at applicable sites and are awaiting DHS review and approval of security plans. Until that is done we cannot determine with certainty the costs associated with any security measures that DHS may require.
We are subject to risks associated with possible climate change legislation, regulation and international accords.
Greenhouse gas emissions have become the subject of a large amount of international, national, regional, state and local attention. Cap and trade initiatives to limit greenhouse gas emissions have been introduced in the EU. The EPA has promulgated rules concerning greenhouse gas emissions. In addition, regulation of greenhouse gas also could occur pursuant to future US treaty obligations, statutory or regulatory changes under the Clean Air Act or new climate change legislation.
While not all are likely to become law, many countries are considering or have implemented regulatory programs to reduce greenhouse gas emissions. Future environmental legislative and regulatory developments related to climate change are possible, which could materially increase operating costs in the chemical industry and thereby increase our manufacturing and delivery costs.
Our business exposes us to potential product liability claims and recalls, which could adversely affect our financial condition and performance.
The development, manufacture and sales of specialty chemical products by us, including products produced for the food, beverage, cigarette, automobile, medical device and pharmaceutical industries, involve a risk of exposure to product liability claims, product recalls, product seizures and related adverse publicity. A product liability claim or judgment against us could also result in substantial and unexpected expenditures, affect consumer or customer confidence in our products, and divert management's attention from other responsibilities. Although we maintain product liability insurance, there can be no assurance that this type or the level of coverage is adequate or that we will be able to continue to maintain our existing insurance or obtain comparable insurance at a reasonable cost, if at all. A product recall or a partially or completely uninsured judgment against us could have a material adverse effect on our results of operations or financial condition. Although we have standard contracting policies and controls, we may not always be able to contractually limit our exposure to third party claims should our failure to perform result in downstream supply disruptions or product recalls.
Our production facilities handle the processing of some volatile and hazardous materials that subject us to operating risks that could have a negative effect on our operating results.
Our operations are subject to operating risks associated with chemical manufacturing, including the related storage and transportation of raw materials, finished products and waste. These risks include, among other things, pipeline and storage tank leaks and ruptures, explosions and fires and discharges or releases of toxic or hazardous substances.
20
These operating risks can cause personal injury, property damage and environmental contamination, and may result in the shutdown of affected facilities and the imposition of civil or criminal penalties. The occurrence of any of these events may disrupt production and have a negative effect on the productivity and profitability of a particular manufacturing facility and our operating results and cash flows.
Our business and financial results may be adversely affected by various legal and regulatory proceedings.
We are subject to legal and regulatory proceedings, lawsuits and claims in the normal course of business and could become subject to additional claims in the future, some of which could be material. The outcome of existing proceedings, lawsuits and claims may differ from our expectations because the outcomes of litigation, including regulatory matters, are often difficult to reliably predict. Various factors or developments can lead us to change current estimates of liabilities and related insurance receivables where applicable, or permit us to make such estimates for matters previously not susceptible to reasonable estimates, such as a significant judicial ruling or judgment, a significant settlement, significant regulatory developments, or changes in applicable law. A future adverse ruling, settlement, or unfavorable development could result in charges that could have a material adverse effect on our business, results of operations or financial condition in any particular period. For a more detailed discussion of our legal proceedings, see Item 3. Legal Proceedings below.
Changes in tax legislation throughout the world could materially impact our results.
Our future effective tax rate and related tax balance sheet attributes could be impacted by changes in tax legislation throughout the world. In particular, proposed US tax legislation could materially impact our results. Currently, the majority of our revenue is generated from customers located outside of the US, and a substantial portion of our assets and employees are located outside of the US. We have not accrued income taxes and foreign withholding taxes on undistributed earnings for most non-US subsidiaries, because those earnings are intended to be indefinitely reinvested in the operations of those subsidiaries. Certain proposals could substantially increase our tax expense, which would substantially reduce our income and have a material adverse effect on our results of operations and cash flows from operating activities.
Changes in our tax rates could affect our future results.
Our future effective tax rates could be affected by changes in the mix of earnings in countries with differing statutory tax rates, expirations of tax holidays, changes in the valuation of deferred tax assets and liabilities, or changes in tax laws and regulations or their interpretation. We are subject to the regular examination of our income tax returns by various tax authorities. We regularly assess the likelihood of adverse outcomes resulting from these examinations to determine the adequacy of our provision for taxes. There can be no assurance that the outcomes from these examinations will not have a material adverse effect on our financial condition and operating results.
Our success depends upon our ability to attract and retain key employees and the identification and development of talent to succeed senior management.
Our success depends on our ability to attract and retain key personnel, and we rely heavily on our management team. The inability to recruit and retain key personnel or the unexpected loss of key personnel may adversely affect our operations. In addition, because of the reliance on our management team, our future success depends in part on our ability to identify and develop talent to succeed senior management. The retention of key personnel and appropriate senior management succession planning will continue to be critically important to the successful implementation of our strategies.
Some of our employees are unionized, represented by workers councils or are subject to local laws that are less favorable to employers than the laws of the US.
As of December 31, 2012 , we had approximately 7,550 employees. Approximately 19% of our 2,750 US based employees are unionized. Our two US based collective bargaining agreements expire in 2014 and 2016. In addition, a large number of our employees are employed in countries in which employment laws provide greater bargaining or other employment rights than the laws of the US. Such employment rights require us to work collaboratively with the legal representatives of the employees to effect any changes to labor agreements. Most of our employees in Europe are represented by workers councils and/or unions that must approve any changes in terms and conditions of employment, including potentially salaries and benefits. They may also impede efforts to restructure our workforce. Although we believe we have a good working relationship with our employees and their legal representatives and the chances are low, a strike, work stoppage, or slowdown by our employees could occur, resulting in a disruption of our operations or higher ongoing labor costs.
21
We may not be able to complete future acquisitions or successfully integrate future acquisitions into our business, which could affect adversely our business or results of operations.
As part of our growth strategy, we intend to pursue acquisitions and joint venture opportunities. Successful accomplishment of this objective may be limited by the availability and suitability of acquisition candidates and by our financial resources, including available cash and borrowing capacity. Acquisitions involve numerous risks, including difficulty determining appropriate valuation, integrating operations, technologies, services and products of the acquired lines or businesses, personnel turnover and the diversion of management's attention from other business matters. In addition, we may be unable to achieve anticipated benefits from these acquisitions in the timeframe that we anticipate, or at all, which could affect adversely our business or results of operations.
Our significant non-US operations expose us to global exchange rate fluctuations that could adversely impact our profitability.
Because we conduct a significant portion of our operations outside the United States, fluctuations in currencies of other countries, especially the Euro, may materially affect our operating results. For example, changes in currency exchange rates may decrease our profits in comparison to the profits of our competitors on the same products sold in the same markets and increase the cost of items required in our operations.
A substantial portion of our net sales is denominated in currencies other than the US dollar. In our consolidated financial statements, we translate our local currency financial results into US dollars based on average exchange rates prevailing during a reporting period or the exchange rate at the end of that period. During times of a strengthening US dollar our reported international sales, earnings, assets and liabilities will be reduced because the local currency will translate into fewer US dollars.
In addition to currency translation risks, we incur a currency transaction risk whenever one of our operating subsidiaries enters into either a purchase or a sales transaction using a currency different from the operating subsidiary's functional currency. Given the volatility of exchange rates, we may not be able to manage our currency transaction and translation risks effectively, and volatility in currency exchange rates may expose our financial condition or results of operations to a significant additional risk. Since a portion of our indebtedness is and will be denominated in currencies other than US dollars, a weakening of the US dollar could make it more difficult for us to repay our indebtedness denominated in foreign currencies unless we have cash flows in those foreign currencies from our foreign operations to repay such indebtedness.
We use financial instruments to hedge certain exposure to foreign currency fluctuations, but we cannot guarantee that our hedging strategies will be effective. In addition, the use of financial instruments creates counterparty settlement risk. Failure to effectively manage these risks could have an adverse impact on our financial position, results of operations and cash flows.
Significant changes in pension fund investment performance or assumptions relating to pension costs may have a material effect on the valuation of pension obligations, the funded status of pension plans and our pension cost.
The cost of our pension plans is incurred over long periods of time and involves many uncertainties during those periods of time. Our funding policy for pension plans is to accumulate plan assets that, over the long run, will approximate the present value of projected benefit obligations. Our pension cost is materially affected by the discount rate used to measure pension obligations, the level and value of plan assets available to fund those obligations at the measurement date and the expected long-term rate of return on plan assets. Significant changes in investment performance or a change in the portfolio mix of invested assets will likely result in corresponding increases and decreases in the valuation of plan assets and a change in the discount rate will likely result in an increase or decrease in the valuation of pension obligations. The combined impact of these changes will affect the reported funded status of our pension plans as well as the net periodic pension cost in the following fiscal years. In recent years, an extended duration strategy in the asset portfolio has been implemented in some plans to reduce the influence of liability volatility due to changes in interest rates. If the funded status of a pension plan declines, we may be required to make unscheduled contributions in addition to those contributions for which we have already planned.
Our future success depends in part on our ability to protect our intellectual property rights. Our inability to protect and enforce these rights could reduce our ability to maintain our market position and our profit margins.
We attach importance to our patents, trademarks, copyrights, know-how and trade secrets in order to protect our investment in research and development, and competitive commercial positions in manufacturing and marketing of our products. We have also adopted internal policies for protecting our valuable know-how and trade secrets. We sometimes license patents and other technology from third parties. Our practice is to seek protection for significant developments that provide us competitive
22
advantages and freedom to practice for our businesses. Patents may cover catalysts, processes, products, intermediate products and product uses. These patents are usually filed throughout the world and provide varying periods and scope of protection based on the filing date and the type of patent application. The legal life and scope of protections provided by patents may vary between countries in which we seek protection. As patents expire, the catalysts, processes and products described and claimed in those patents may become generally available for use by the public subject to our continued protection for associated know-how and trade secrets. We also seek to register trademarks as a means of protecting the brand names of our products, which brand names become more important once the corresponding product or process patents have expired. We operate in regions of the world where intellectual property protection may be limited and difficult to enforce and our continued growth strategy may bring us to additional regions with similar challenges. If we are not successful in protecting or maintaining our patent, license, trademark or other intellectual property rights, our revenues, results of operations and cash flows may be adversely affected.
We are subject to information technology security threats that could materially affect our business.
We have been and will continue to be subject to advanced persistent information technology security threats. While some unauthorized access to our information technology systems occurs, we believe to date these threats have not had a material impact on our business. We seek to detect and investigate these security incidents and to prevent their recurrence but in some cases we might be unaware of an incident or its magnitude and effects. The theft, mis-use or publication of our intellectual property and/or confidential business information or the compromising of our systems or networks could harm our competitive position, cause operational disruption, reduce the value of our investment in research and development of new products and other strategic initiatives or otherwise adversely affect our business or results of operations. To the extent that any security breach results in inappropriate disclosure of our employees', customers' or vendors' confidential information, we may incur liability as a result. Although we attempt to mitigate these risks by employing a number of measures, including monitoring of our systems and networks, and maintenance of backup and protective systems, our systems, networks, products and services remain potentially vulnerable to increasingly sophisticated advanced persistent threats that may have a material effect on our business. In addition, the devotion of additional resources to the security of our information technology systems in the future could significantly increase the cost of doing business or otherwise adversely impact our financial results.
We may incur significant charges in the event we close or divest all or part of a manufacturing plant or facility.
We periodically assess our manufacturing operations in order to manufacture and distribute our products in the most efficient manner. Based on our assessments, we may make capital improvements to modernize certain units, move manufacturing or distribution capabilities from one plant or facility to another plant or facility, discontinue manufacturing or distributing certain products or close or divest all or part of a manufacturing plant or facility. We also have shared services agreements at several of our plants and if such agreements are terminated or revised, we would assess and potentially adjust our manufacturing operations. The closure or divestiture of all or part of a manufacturing plant or facility could result in future charges that could be significant.
Provisions in our certificate of incorporation and bylaws, as well as any stockholders' rights plan, may discourage a takeover attempt.
Provisions contained in our certificate of incorporation and bylaws could make it more difficult for a third party to acquire us, even if doing so might be beneficial to our stockholders. Provisions of our certificate of incorporation and bylaws impose various procedural and other requirements, which could make it more difficult for stockholders to effect certain corporate actions. For example, our certificate of incorporation authorizes our Board of Directors to determine the rights, preferences, privileges and restrictions of unissued series of preferred stock, without any vote or action by our stockholders. Thus, our Board of Directors can authorize and issue shares of preferred stock with voting or conversion rights that could adversely affect the voting or other rights of holders of our Series A common stock. These rights may have the effect of delaying or deterring a change of control of our Company. In addition, a change of control of our Company may be delayed or deterred as a result of our having three classes of directors (each class elected for a three year term) or as a result of any stockholders' rights plan that our Board of Directors may adopt. These provisions could limit the price that certain investors might be willing to pay in the future for shares of our Series A common stock.
We could be subject to damages based on claims brought against us by our customers or lose customers as a result of the failure of our products to meet certain quality specifications.
Our products provide important performance attributes to our customers' products. If a product fails to perform in a manner consistent with quality specifications, a customer could seek replacement of the product or damages for costs incurred as a result of the product failing to perform as guaranteed. A successful claim or series of claims against us could have a material adverse effect on our financial condition and results of operations and could result in a loss of one or more key customers.
23
The insurance coverage that we maintain may not fully cover all operational risks.
We maintain property, business interruption and casualty insurance but such insurance may not cover all of the risks associated with the hazards of our business and is subject to limitations, including deductibles and maximum liabilities covered. We may incur losses beyond the limits, or outside the coverage, of our insurance policies, including liabilities for environmental remediation. In the future, there can be no assurance that the types of insurance we obtain or the level of coverage we maintain is adequate or that we will be able to continue to maintain our existing insurance or obtain comparable insurance at a reasonable cost, if at all.
Differences in views with our joint venture participants may cause our joint ventures not to operate according to their business plans, which may adversely affect our results of operations.
We currently participate in a number of joint ventures and may enter into additional joint ventures in the future. The nature of a joint venture requires us to share control with unaffiliated third parties. Differences in views among joint venture participants may result in delayed decisions or failure to agree on major decisions. If these differences cause the joint ventures to deviate from their business plans or to fail to achieve their desired operating performance, our results of operations could be adversely affected.
Risks Related to Our Indebtedness
Our level of indebtedness could diminish our ability to raise additional capital to fund our operations, limit our ability to react to changes in the economy or the chemicals industry and prevent us from meeting obligations under our indebtedness.
Our total indebtedness is $3.1 billion as of December 31, 2012 . See Note 13 - Debt in the accompanying consolidated financial statements for further information.
Our level of indebtedness could have important consequences, including:
We may incur additional indebtedness in the future, which could increase the risks described above.
Although covenants under the Senior Credit Agreement and the indentures governing the $600 million in aggregate principal amount of 6.625% Senior Notes due 2018, the $400 million in aggregate principal amount of 5.875% Senior Notes due 2021, and the $500 million in aggregate principal amount of 4.625% Senior Notes due 2022 (together, the "Notes") limit our ability to incur certain additional indebtedness, these restrictions are subject to a number of qualifications and exceptions, and the indebtedness we could incur in compliance with these restrictions could be significant. To the extent that we incur additional indebtedness, the risks associated with our debt described above, including our possible inability to service our debt, including the Notes, would increase.
Our variable rate indebtedness subjects us to interest rate risk, which could cause our debt service obligations to increase significantly and affect our operating results.
Certain of our borrowings are at variable rates of interest and expose us to interest rate risk. If interest rates were to increase, our debt service obligations on our variable rate indebtedness would increase. As of December 31, 2012 , we had $781 million , €214 million and CNY680 million of variable rate debt and outstanding US-dollar interest rate swap agreements with a
24
• Increasing our vulnerability to general economic and industry conditions including exacerbating the impact of any adverse business effects that are determined to be material adverse events under our existing senior credit facilities (the "Senior Credit Agreement");
• Requiring a substantial portion of cash flow from operations to be dedicated to the payment of principal and interest on indebtedness, therefore reducing our ability to use our cash flow to fund operations, capital expenditures and future business opportunities or pay dividends on our common stock;
• Exposing us to the risk of increased interest rates as certain of our borrowings are at variable rates of interest;
• Limiting our ability to obtain additional financing for working capital, capital expenditures, product development, debt service requirements, acquisitions and general corporate or other purposes; and
• Limiting our ability to adjust to changing market conditions and placing us at a competitive disadvantage compared to our competitors who have less debt.
notional value of $1.1 billion that expire January 2, 2014. These interest rate swap agreements have the economic effect of modifying the US-dollar variable rate obligations into fixed interest obligations. Accordingly, a 1% increase in interest rates would increase annual interest expense by $1 million .
On February 1, 2012, we executed forward-starting interest rate swap agreements with a notional value of $500 million which are effective January 2, 2014 through January 2, 2016. See Item 7. Management's Discussion and Analysis of Financial Condition and Results of Operations - Liquidity and Capital Resources, Item 7A. Quantitative and Qualitative Disclosures About Market Risk below and Note 21 - Derivative Financial Instruments in the accompanying consolidated financial statements for further information.
We may not be able to generate sufficient cash to service our indebtedness and may be forced to take other actions to satisfy obligations under our indebtedness, which may not be successful.
Our ability to make scheduled payments on or to refinance our debt obligations depends on the financial condition and operating performance of our subsidiaries, which are subject to prevailing economic and competitive conditions and to certain financial, business and other factors beyond our control. We may not be able to maintain a level of cash flows from operating activities sufficient to permit us to pay the principal, premium, if any, and interest on our indebtedness.
If our cash flows and capital resources are insufficient to fund our debt service obligations, we may be forced to reduce or delay capital expenditures, sell assets, seek additional capital or restructure or refinance our indebtedness. These alternative measures may not be successful and may not permit us to meet our scheduled debt service obligations. In the absence of such operating results and resources, we could face substantial liquidity problems and might be required to dispose of material assets or operations to meet our debt service and other obligations. The Senior Credit Agreement restricts our ability to dispose of assets and use the proceeds from the disposition. We may not be able to consummate those dispositions or to obtain the proceeds which we could realize from them and these proceeds may not be adequate to meet any debt service obligations then due.
Restrictive covenants in our debt agreements may limit our ability to engage in certain transactions and may diminish our ability to make payments on our indebtedness.
The Senior Credit Agreement and the indentures governing the Notes each contain various covenants that limit our ability to engage in specified types of transactions. The indentures governing the Notes limit Celanese US's and certain of its subsidiaries' ability to, among other things, incur additional debt; pay dividends or make other restricted payments; consummate specified asset sales; enter into transactions with affiliates; incur liens, impose restrictions on the ability of a subsidiary to pay dividends or make payments to Celanese US and its restricted subsidiaries; merge or consolidate with any other person; and sell, assign, transfer, lease, convey or otherwise dispose of all or substantially all of Celanese US's assets or the assets of its restricted subsidiaries.
In addition, the Senior Credit Agreement requires us to maintain a maximum first lien senior secured leverage ratio if there are outstanding borrowings or letters of credit issued under the revolving credit facility. Our ability to meet this financial ratio can be affected by events beyond our control, and we may not be able to meet this test at all.
Such restrictions in our debt instruments could result in us having to obtain the consent of holders of the Notes and of our lenders in order to take certain actions. Disruptions in credit markets may prevent us from obtaining or make it more difficult or more costly for us to obtain such consents. Our ability to expand our business or to address declines in our business may be limited if we are unable to obtain such consents.
A breach of any of these covenants could result in a default, which, if not cured or waived, could have a material adverse effect on our business, financial condition and results of operations. Furthermore, a default under the Senior Credit Agreement could permit lenders to accelerate the maturity of our indebtedness under the Senior Credit Agreement and to terminate any commitments to lend. If we were unable to repay or refinance such indebtedness, the lenders under the Senior Credit Agreement could proceed against the collateral granted to them to secure that indebtedness. Our subsidiaries have pledged a significant portion of our assets as collateral to secure our indebtedness under the Senior Credit Agreement. If the lenders under the Senior Credit Agreement accelerate the repayment of such indebtedness, we may not have sufficient assets to repay such amounts or our other indebtedness, including the Notes. In such event, we could be forced into bankruptcy or liquidation.
25
Celanese and Celanese US are holding companies and depend on subsidiaries to satisfy their obligations under the Notes and the guarantee of Celanese US's obligations under the Notes by Celanese.
As holding companies, Celanese and Celanese US conduct substantially all of their operations through their subsidiaries, which own substantially all of our consolidated assets. Consequently, the principal source of cash to pay Celanese and Celanese US's obligations, including obligations under the Notes and the guarantee of the Celanese US's obligations under the Notes by Celanese, is the cash that our subsidiaries generate from their operations. We cannot assure that our subsidiaries will be able to, or be permitted to, make distributions to enable Celanese US and/or Celanese to make payments in respect of their obligations. Each of our subsidiaries is a distinct legal entity and, under certain circumstances, applicable country or state laws, regulatory limitations and terms of our debt instruments may limit our subsidiaries' ability to distribute cash to Celanese US and Celanese. While the indentures governing the Notes limit the ability of our subsidiaries to put restrictions on paying dividends or making other intercompany payments to us, these limitations are subject to certain qualifications and exceptions, which may have the effect of significantly restricting the applicability of those limits. In the event Celanese US and/or Celanese do not receive distributions from our subsidiaries, Celanese US and/or Celanese may be unable to make required payments on the Notes, the guarantee of Celanese US's obligations under the Notes by Celanese, or our other indebtedness.
Item 1B. Unresolved Staff Comments
None.
26
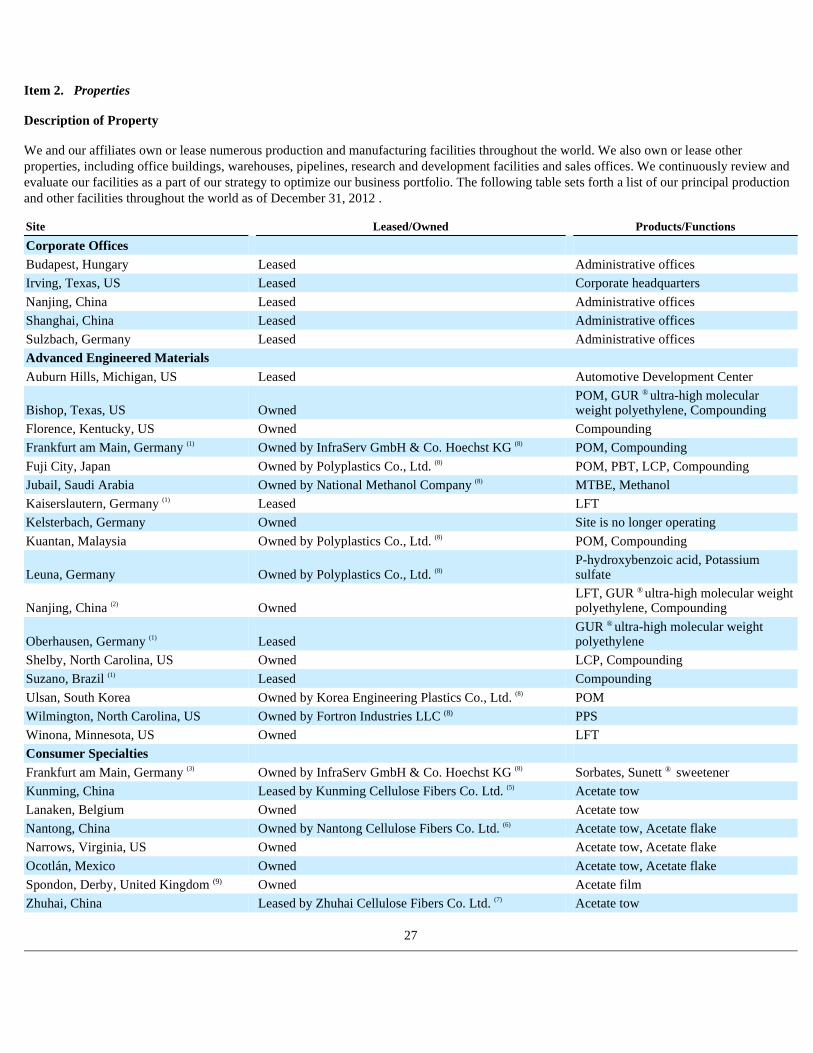
Item 2. Properties
Description of Property
We and our affiliates own or lease numerous production and manufacturing facilities throughout the world. We also own or lease other properties, including office buildings, warehouses, pipelines, research and development facilities and sales offices. We continuously review and evaluate our facilities as a part of our strategy to optimize our business portfolio. The following table sets forth a list of our principal production and other facilities throughout the world as of December 31, 2012 .
27
Site Leased/Owned Products/Functions
Corporate Offices
Budapest, Hungary Leased Administrative offices
Irving, Texas, US Leased Corporate headquarters
Nanjing, China Leased Administrative offices
Shanghai, China Leased Administrative offices
Sulzbach, Germany Leased Administrative offices
Advanced Engineered Materials Auburn Hills, Michigan, US Leased Automotive Development Center
Bishop, Texas, US Owned POM, GUR ® ultra-high molecular weight polyethylene, Compounding
Florence, Kentucky, US Owned Compounding
Frankfurt am Main, Germany (1) Owned by InfraServ GmbH & Co. Hoechst KG (8) POM, Compounding
Fuji City, Japan Owned by Polyplastics Co., Ltd. (8) POM, PBT, LCP, Compounding
Jubail, Saudi Arabia Owned by National Methanol Company (8) MTBE, Methanol
Kaiserslautern, Germany (1) Leased LFT
Kelsterbach, Germany Owned Site is no longer operating
Kuantan, Malaysia Owned by Polyplastics Co., Ltd. (8) POM, Compounding
Leuna, Germany Owned by Polyplastics Co., Ltd. (8) P-hydroxybenzoic acid, Potassium sulfate
Nanjing, China (2) Owned LFT, GUR ® ultra-high molecular weight polyethylene, Compounding
Oberhausen, Germany (1) Leased GUR ® ultra-high molecular weight polyethylene
Shelby, North Carolina, US Owned LCP, Compounding
Suzano, Brazil (1) Leased Compounding
Ulsan, South Korea Owned by Korea Engineering Plastics Co., Ltd. (8) POM
Wilmington, North Carolina, US Owned by Fortron Industries LLC (8) PPS
Winona, Minnesota, US Owned LFT
Consumer Specialties
Frankfurt am Main, Germany (3) Owned by InfraServ GmbH & Co. Hoechst KG (8) Sorbates, Sunett ® sweetener
Kunming, China Leased by Kunming Cellulose Fibers Co. Ltd. (5) Acetate tow
Lanaken, Belgium Owned Acetate tow
Nantong, China Owned by Nantong Cellulose Fibers Co. Ltd. (6) Acetate tow, Acetate flake
Narrows, Virginia, US Owned Acetate tow, Acetate flake
Ocotlán, Mexico Owned Acetate tow, Acetate flake
Spondon, Derby, United Kingdom (9) Owned Acetate film
Zhuhai, China Leased by Zhuhai Cellulose Fibers Co. Ltd. (7) Acetate tow
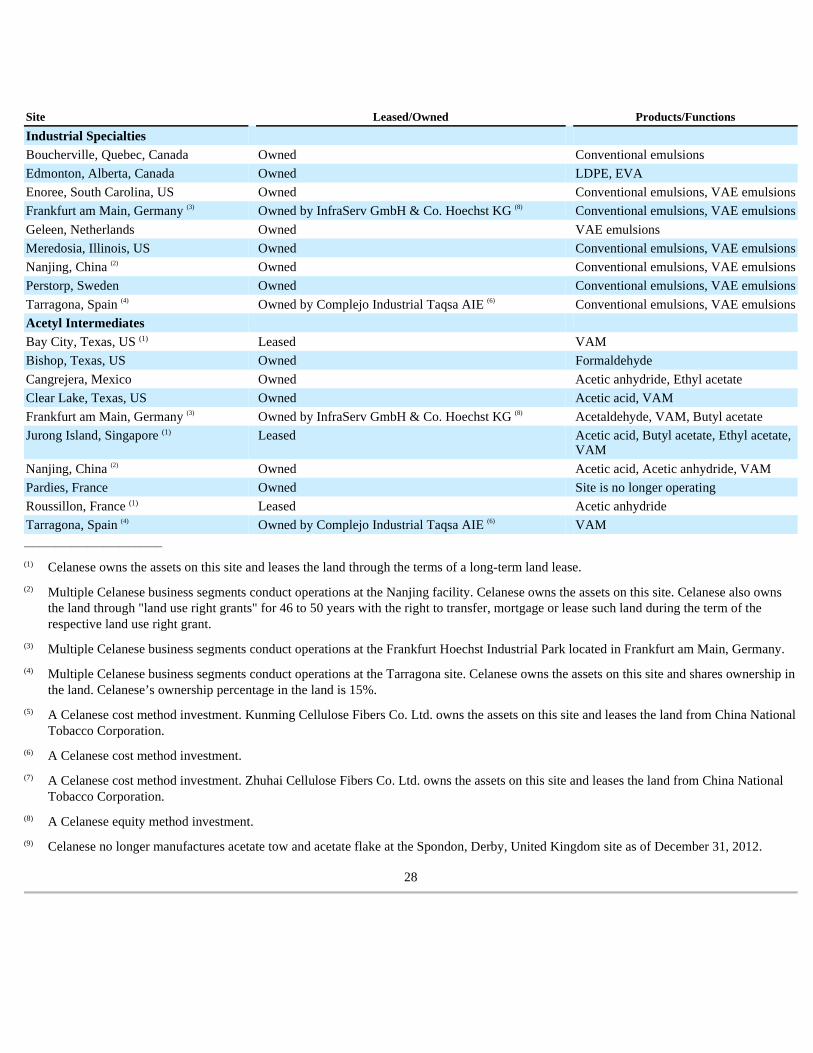
__________________________
28
Site Leased/Owned Products/Functions
Industrial Specialties
Boucherville, Quebec, Canada Owned Conventional emulsions
Edmonton, Alberta, Canada Owned LDPE, EVA
Enoree, South Carolina, US Owned Conventional emulsions, VAE emulsions
Frankfurt am Main, Germany (3) Owned by InfraServ GmbH & Co. Hoechst KG (8) Conventional emulsions, VAE emulsions
Geleen, Netherlands Owned VAE emulsions
Meredosia, Illinois, US Owned Conventional emulsions, VAE emulsions
Nanjing, China (2) Owned Conventional emulsions, VAE emulsions
Perstorp, Sweden Owned Conventional emulsions, VAE emulsions
Tarragona, Spain (4) Owned by Complejo Industrial Taqsa AIE (6) Conventional emulsions, VAE emulsions
Acetyl Intermediates
Bay City, Texas, US (1) Leased VAM
Bishop, Texas, US Owned Formaldehyde
Cangrejera, Mexico Owned Acetic anhydride, Ethyl acetate
Clear Lake, Texas, US Owned Acetic acid, VAM
Frankfurt am Main, Germany (3) Owned by InfraServ GmbH & Co. Hoechst KG (8) Acetaldehyde, VAM, Butyl acetate
Jurong Island, Singapore (1)
Leased
Acetic acid, Butyl acetate, Ethyl acetate, VAM
Nanjing, China (2) Owned Acetic acid, Acetic anhydride, VAM
Pardies, France Owned Site is no longer operating
Roussillon, France (1) Leased Acetic anhydride
Tarragona, Spain (4) Owned by Complejo Industrial Taqsa AIE (6) VAM
(1) Celanese owns the assets on this site and leases the land through the terms of a long-term land lease.
(2) Multiple Celanese business segments conduct operations at the Nanjing facility. Celanese owns the assets on this site. Celanese also owns the land through "land use right grants" for 46 to 50 years with the right to transfer, mortgage or lease such land during the term of the respective land use right grant.
(3) Multiple Celanese business segments conduct operations at the Frankfurt Hoechst Industrial Park located in Frankfurt am Main, Germany.
(4) Multiple Celanese business segments conduct operations at the Tarragona site. Celanese owns the assets on this site and shares ownership in the land. Celanese’s ownership percentage in the land is 15%.
(5) A Celanese cost method investment. Kunming Cellulose Fibers Co. Ltd. owns the assets on this site and leases the land from China National Tobacco Corporation.
(6) A Celanese cost method investment.
(7) A Celanese cost method investment. Zhuhai Cellulose Fibers Co. Ltd. owns the assets on this site and leases the land from China National Tobacco Corporation.
(8) A Celanese equity method investment.
(9) Celanese no longer manufactures acetate tow and acetate flake at the Spondon, Derby, United Kingdom site as of December 31, 2012.
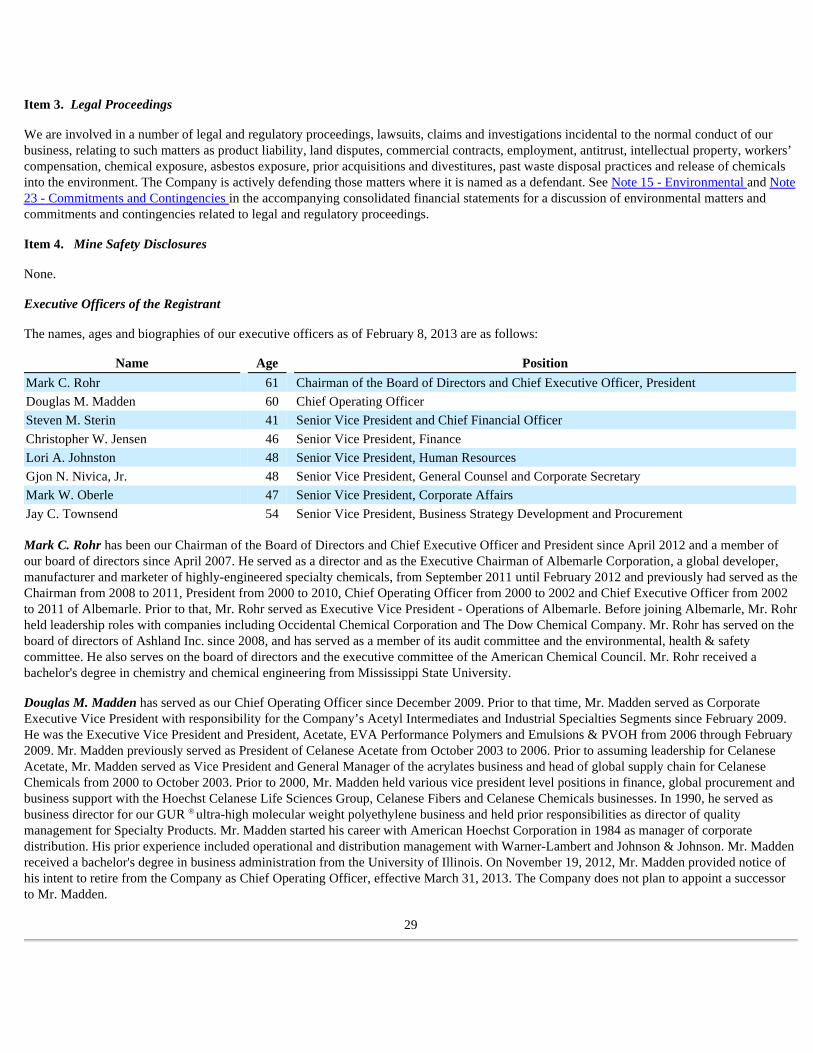
Item 3. Legal Proceedings
We are involved in a number of legal and regulatory proceedings, lawsuits, claims and investigations incidental to the normal conduct of our business, relating to such matters as product liability, land disputes, commercial contracts, employment, antitrust, intellectual property, workers’ compensation, chemical exposure, asbestos exposure, prior acquisitions and divestitures, past waste disposal practices and release of chemicals into the environment. The Company is actively defending those matters where it is named as a defendant. See Note 15 - Environmental and Note 23 - Commitments and Contingencies in the accompanying consolidated financial statements for a discussion of environmental matters and commitments and contingencies related to legal and regulatory proceedings.
Item 4. Mine Safety Disclosures
None.
Executive Officers of the Registrant
The names, ages and biographies of our executive officers as of February 8, 2013 are as follows:
Mark C. Rohr has been our Chairman of the Board of Directors and Chief Executive Officer and President since April 2012 and a member of our board of directors since April 2007. He served as a director and as the Executive Chairman of Albemarle Corporation, a global developer, manufacturer and marketer of highly-engineered specialty chemicals, from September 2011 until February 2012 and previously had served as the Chairman from 2008 to 2011, President from 2000 to 2010, Chief Operating Officer from 2000 to 2002 and Chief Executive Officer from 2002 to 2011 of Albemarle. Prior to that, Mr. Rohr served as Executive Vice President - Operations of Albemarle. Before joining Albemarle, Mr. Rohr held leadership roles with companies including Occidental Chemical Corporation and The Dow Chemical Company. Mr. Rohr has served on the board of directors of Ashland Inc. since 2008, and has served as a member of its audit committee and the environmental, health & safety committee. He also serves on the board of directors and the executive committee of the American Chemical Council. Mr. Rohr received a bachelor's degree in chemistry and chemical engineering from Mississippi State University.
Douglas M. Madden has served as our Chief Operating Officer since December 2009. Prior to that time, Mr. Madden served as Corporate Executive Vice President with responsibility for the Company’s Acetyl Intermediates and Industrial Specialties Segments since February 2009. He was the Executive Vice President and President, Acetate, EVA Performance Polymers and Emulsions & PVOH from 2006 through February 2009. Mr. Madden previously served as President of Celanese Acetate from October 2003 to 2006. Prior to assuming leadership for Celanese Acetate, Mr. Madden served as Vice President and General Manager of the acrylates business and head of global supply chain for Celanese Chemicals from 2000 to October 2003. Prior to 2000, Mr. Madden held various vice president level positions in finance, global procurement and business support with the Hoechst Celanese Life Sciences Group, Celanese Fibers and Celanese Chemicals businesses. In 1990, he served as business director for our GUR ® ultra-high molecular weight polyethylene business and held prior responsibilities as director of quality management for Specialty Products. Mr. Madden started his career with American Hoechst Corporation in 1984 as manager of corporate distribution. His prior experience included operational and distribution management with Warner-Lambert and Johnson & Johnson. Mr. Madden received a bachelor's degree in business administration from the University of Illinois. On November 19, 2012, Mr. Madden provided notice of his intent to retire from the Company as Chief Operating Officer, effective March 31, 2013. The Company does not plan to appoint a successor to Mr. Madden.
29
Name Age Position
Mark C. Rohr 61 Chairman of the Board of Directors and Chief Executive Officer, President
Douglas M. Madden 60 Chief Operating Officer
Steven M. Sterin 41 Senior Vice President and Chief Financial Officer
Christopher W. Jensen 46 Senior Vice President, Finance
Lori A. Johnston 48 Senior Vice President, Human Resources
Gjon N. Nivica, Jr. 48 Senior Vice President, General Counsel and Corporate Secretary
Mark W. Oberle 47 Senior Vice President, Corporate Affairs
Jay C. Townsend 54 Senior Vice President, Business Strategy Development and Procurement
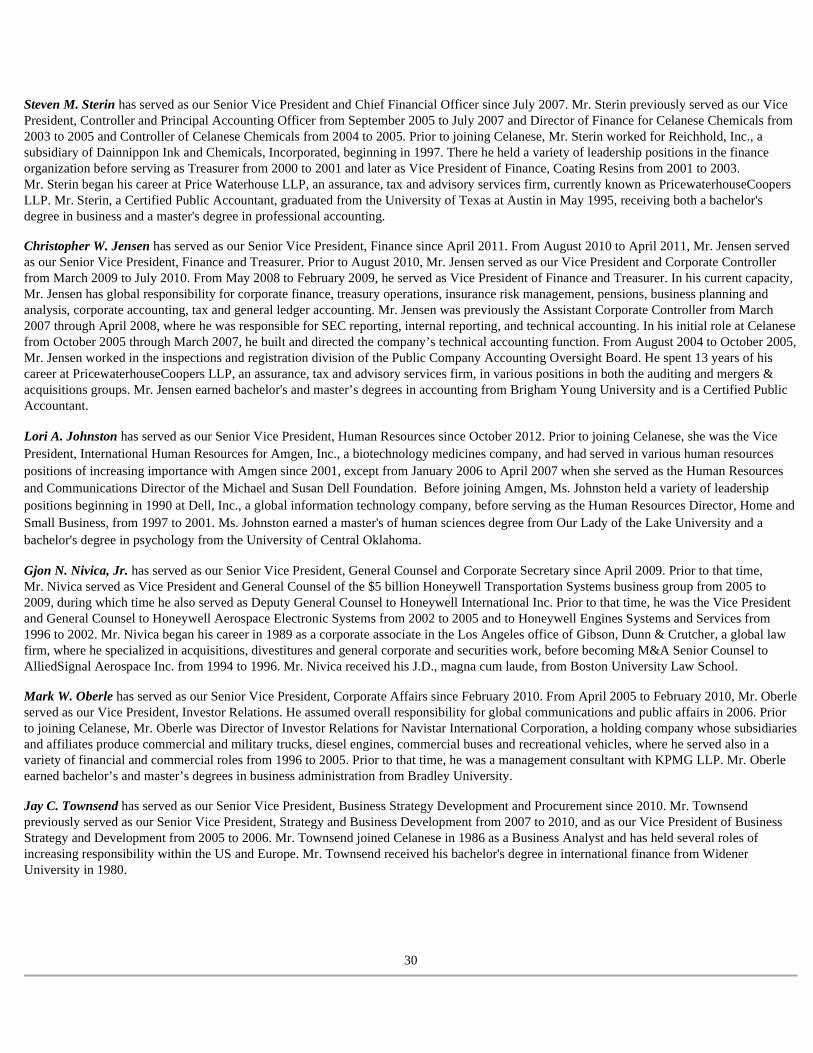
Steven M. Sterin has served as our Senior Vice President and Chief Financial Officer since July 2007. Mr. Sterin previously served as our Vice President, Controller and Principal Accounting Officer from September 2005 to July 2007 and Director of Finance for Celanese Chemicals from 2003 to 2005 and Controller of Celanese Chemicals from 2004 to 2005. Prior to joining Celanese, Mr. Sterin worked for Reichhold, Inc., a subsidiary of Dainnippon Ink and Chemicals, Incorporated, beginning in 1997. There he held a variety of leadership positions in the finance organization before serving as Treasurer from 2000 to 2001 and later as Vice President of Finance, Coating Resins from 2001 to 2003. Mr. Sterin began his career at Price Waterhouse LLP, an assurance, tax and advisory services firm, currently known as PricewaterhouseCoopers LLP. Mr. Sterin, a Certified Public Accountant, graduated from the University of Texas at Austin in May 1995, receiving both a bachelor's degree in business and a master's degree in professional accounting.
Christopher W. Jensen has served as our Senior Vice President, Finance since April 2011. From August 2010 to April 2011, Mr. Jensen served as our Senior Vice President, Finance and Treasurer. Prior to August 2010, Mr. Jensen served as our Vice President and Corporate Controller from March 2009 to July 2010. From May 2008 to February 2009, he served as Vice President of Finance and Treasurer. In his current capacity, Mr. Jensen has global responsibility for corporate finance, treasury operations, insurance risk management, pensions, business planning and analysis, corporate accounting, tax and general ledger accounting. Mr. Jensen was previously the Assistant Corporate Controller from March 2007 through April 2008, where he was responsible for SEC reporting, internal reporting, and technical accounting. In his initial role at Celanese from October 2005 through March 2007, he built and directed the company’s technical accounting function. From August 2004 to October 2005, Mr. Jensen worked in the inspections and registration division of the Public Company Accounting Oversight Board. He spent 13 years of his career at PricewaterhouseCoopers LLP, an assurance, tax and advisory services firm, in various positions in both the auditing and mergers & acquisitions groups. Mr. Jensen earned bachelor's and master’s degrees in accounting from Brigham Young University and is a Certified Public Accountant.
Lori A. Johnston has served as our Senior Vice President, Human Resources since October 2012. Prior to joining Celanese, she was the Vice President, International Human Resources for Amgen, Inc., a biotechnology medicines company, and had served in various human resources positions of increasing importance with Amgen since 2001, except from January 2006 to April 2007 when she served as the Human Resources and Communications Director of the Michael and Susan Dell Foundation. Before joining Amgen, Ms. Johnston held a variety of leadership positions beginning in 1990 at Dell, Inc., a global information technology company, before serving as the Human Resources Director, Home and Small Business, from 1997 to 2001. Ms. Johnston earned a master's of human sciences degree from Our Lady of the Lake University and a bachelor's degree in psychology from the University of Central Oklahoma.
Gjon N. Nivica, Jr. has served as our Senior Vice President, General Counsel and Corporate Secretary since April 2009. Prior to that time, Mr. Nivica served as Vice President and General Counsel of the $5 billion Honeywell Transportation Systems business group from 2005 to 2009, during which time he also served as Deputy General Counsel to Honeywell International Inc. Prior to that time, he was the Vice President and General Counsel to Honeywell Aerospace Electronic Systems from 2002 to 2005 and to Honeywell Engines Systems and Services from 1996 to 2002. Mr. Nivica began his career in 1989 as a corporate associate in the Los Angeles office of Gibson, Dunn & Crutcher, a global law firm, where he specialized in acquisitions, divestitures and general corporate and securities work, before becoming M&A Senior Counsel to AlliedSignal Aerospace Inc. from 1994 to 1996. Mr. Nivica received his J.D., magna cum laude, from Boston University Law School.
Mark W. Oberle has served as our Senior Vice President, Corporate Affairs since February 2010. From April 2005 to February 2010, Mr. Oberle served as our Vice President, Investor Relations. He assumed overall responsibility for global communications and public affairs in 2006. Prior to joining Celanese, Mr. Oberle was Director of Investor Relations for Navistar International Corporation, a holding company whose subsidiaries and affiliates produce commercial and military trucks, diesel engines, commercial buses and recreational vehicles, where he served also in a variety of financial and commercial roles from 1996 to 2005. Prior to that time, he was a management consultant with KPMG LLP. Mr. Oberle earned bachelor’s and master’s degrees in business administration from Bradley University.
Jay C. Townsend has served as our Senior Vice President, Business Strategy Development and Procurement since 2010. Mr. Townsend previously served as our Senior Vice President, Strategy and Business Development from 2007 to 2010, and as our Vice President of Business Strategy and Development from 2005 to 2006. Mr. Townsend joined Celanese in 1986 as a Business Analyst and has held several roles of increasing responsibility within the US and Europe. Mr. Townsend received his bachelor's degree in international finance from Widener University in 1980.
30
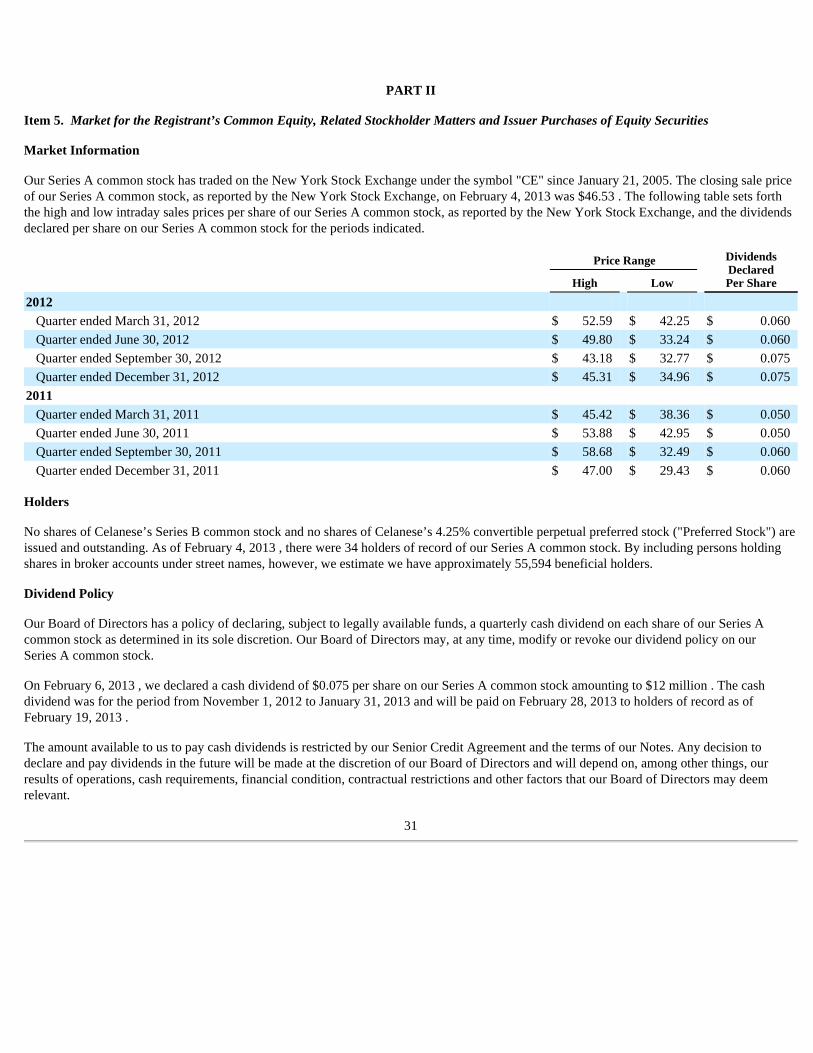
PART II
Item 5. Market for the Registrant’s Common Equity, Related Stockholder Matters and Issuer Purchases of Equity Securities
Market Information
Our Series A common stock has traded on the New York Stock Exchange under the symbol "CE" since January 21, 2005. The closing sale price of our Series A common stock, as reported by the New York Stock Exchange, on February 4, 2013 was $46.53 . The following table sets forth the high and low intraday sales prices per share of our Series A common stock, as reported by the New York Stock Exchange, and the dividends declared per share on our Series A common stock for the periods indicated.
Holders
No shares of Celanese’s Series B common stock and no shares of Celanese’s 4.25% convertible perpetual preferred stock ("Preferred Stock") are issued and outstanding. As of February 4, 2013 , there were 34 holders of record of our Series A common stock. By including persons holding shares in broker accounts under street names, however, we estimate we have approximately 55,594 beneficial holders.
Dividend Policy
Our Board of Directors has a policy of declaring, subject to legally available funds, a quarterly cash dividend on each share of our Series A common stock as determined in its sole discretion. Our Board of Directors may, at any time, modify or revoke our dividend policy on our Series A common stock.
On February 6, 2013 , we declared a cash dividend of $0.075 per share on our Series A common stock amounting to $12 million . The cash dividend was for the period from November 1, 2012 to January 31, 2013 and will be paid on February 28, 2013 to holders of record as of February 19, 2013 .
The amount available to us to pay cash dividends is restricted by our Senior Credit Agreement and the terms of our Notes. Any decision to declare and pay dividends in the future will be made at the discretion of our Board of Directors and will depend on, among other things, our results of operations, cash requirements, financial condition, contractual restrictions and other factors that our Board of Directors may deem relevant.
31
Price Range Dividends Declared Per Share High Low
2012
Quarter ended March 31, 2012 $ 52.59 $ 42.25 $ 0.060 Quarter ended June 30, 2012 $ 49.80 $ 33.24 $ 0.060 Quarter ended September 30, 2012 $ 43.18 $ 32.77 $ 0.075 Quarter ended December 31, 2012 $ 45.31 $ 34.96 $ 0.075
2011
Quarter ended March 31, 2011 $ 45.42 $ 38.36 $ 0.050 Quarter ended June 30, 2011 $ 53.88 $ 42.95 $ 0.050 Quarter ended September 30, 2011 $ 58.68 $ 32.49 $ 0.060 Quarter ended December 31, 2011 $ 47.00 $ 29.43 $ 0.060
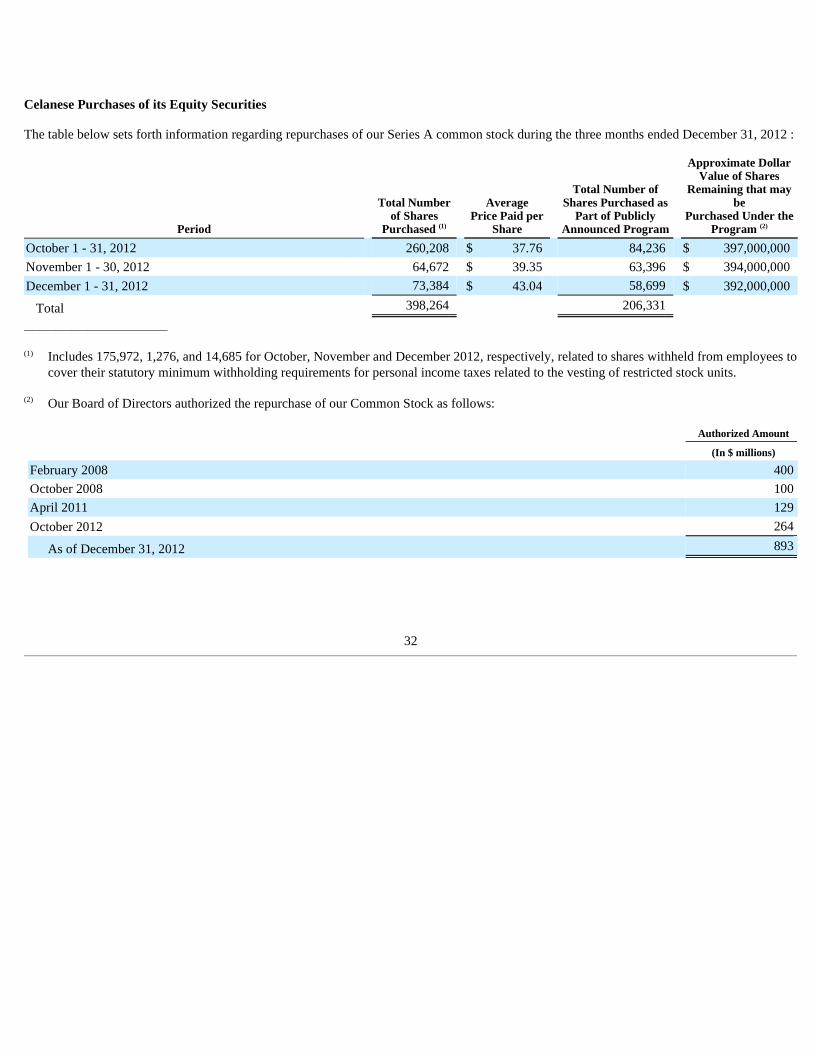
Celanese Purchases of its Equity Securities
The table below sets forth information regarding repurchases of our Series A common stock during the three months ended December 31, 2012 :
___________________________
32
Period
Total Number of Shares
Purchased (1)
Average Price Paid per
Share
Total Number of Shares Purchased as
Part of Publicly Announced Program
Approximate Dollar Value of Shares
Remaining that may be
Purchased Under the Program (2)
October 1 - 31, 2012 260,208 $ 37.76 84,236 $ 397,000,000 November 1 - 30, 2012 64,672 $ 39.35 63,396 $ 394,000,000 December 1 - 31, 2012 73,384 $ 43.04 58,699 $ 392,000,000
Total 398,264 206,331
(1) Includes 175,972, 1,276, and 14,685 for October, November and December 2012, respectively, related to shares withheld from employees to cover their statutory minimum withholding requirements for personal income taxes related to the vesting of restricted stock units.
(2)
Our Board of Directors authorized the repurchase of our Common Stock as follows:
Authorized Amount
(In $ millions)
February 2008 400 October 2008 100 April 2011 129 October 2012 264
As of December 31, 2012 893
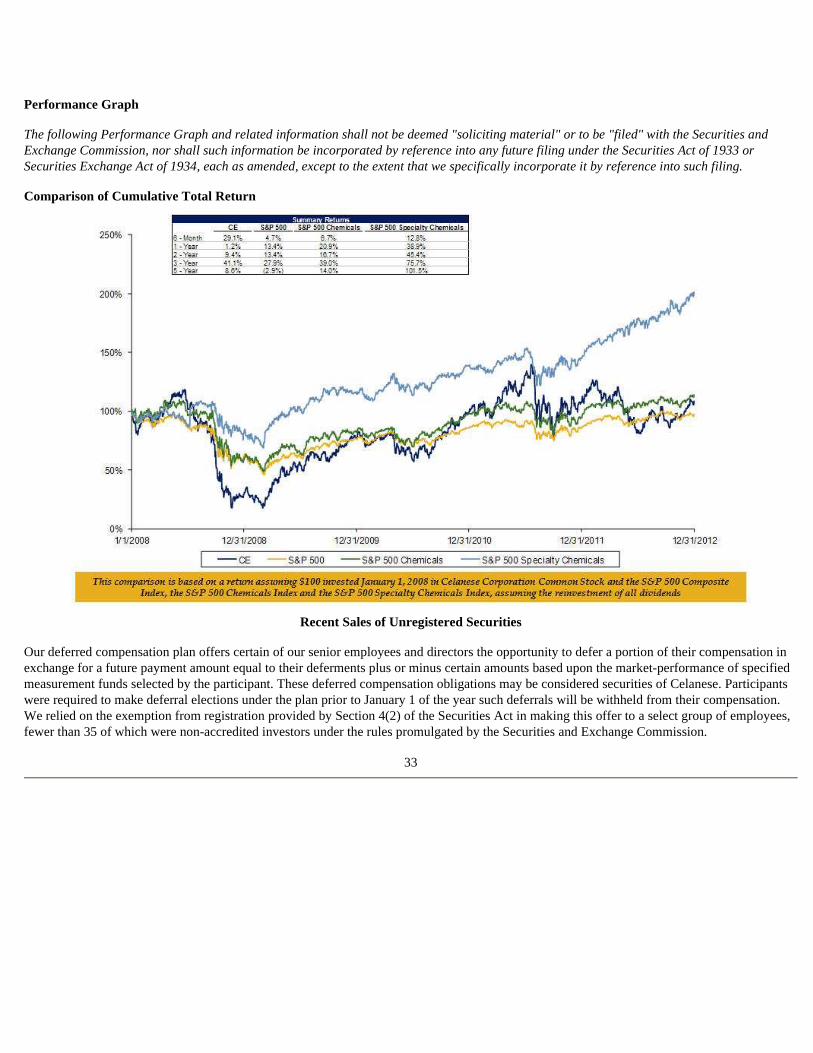
Performance Graph
The following Performance Graph and related information shall not be deemed "soliciting material" or to be "filed" with the Securities and Exchange Commission, nor shall such information be incorporated by reference into any future filing under the Securities Act of 1933 or Securities Exchange Act of 1934, each as amended, except to the extent that we specifically incorporate it by reference into such filing.
Comparison of Cumulative Total Return
Recent Sales of Unregistered Securities
Our deferred compensation plan offers certain of our senior employees and directors the opportunity to defer a portion of their compensation in exchange for a future payment amount equal to their deferments plus or minus certain amounts based upon the market-performance of specified measurement funds selected by the participant. These deferred compensation obligations may be considered securities of Celanese. Participants were required to make deferral elections under the plan prior to January 1 of the year such deferrals will be withheld from their compensation. We relied on the exemption from registration provided by Section 4(2) of the Securities Act in making this offer to a select group of employees, fewer than 35 of which were non-accredited investors under the rules promulgated by the Securities and Exchange Commission.
33
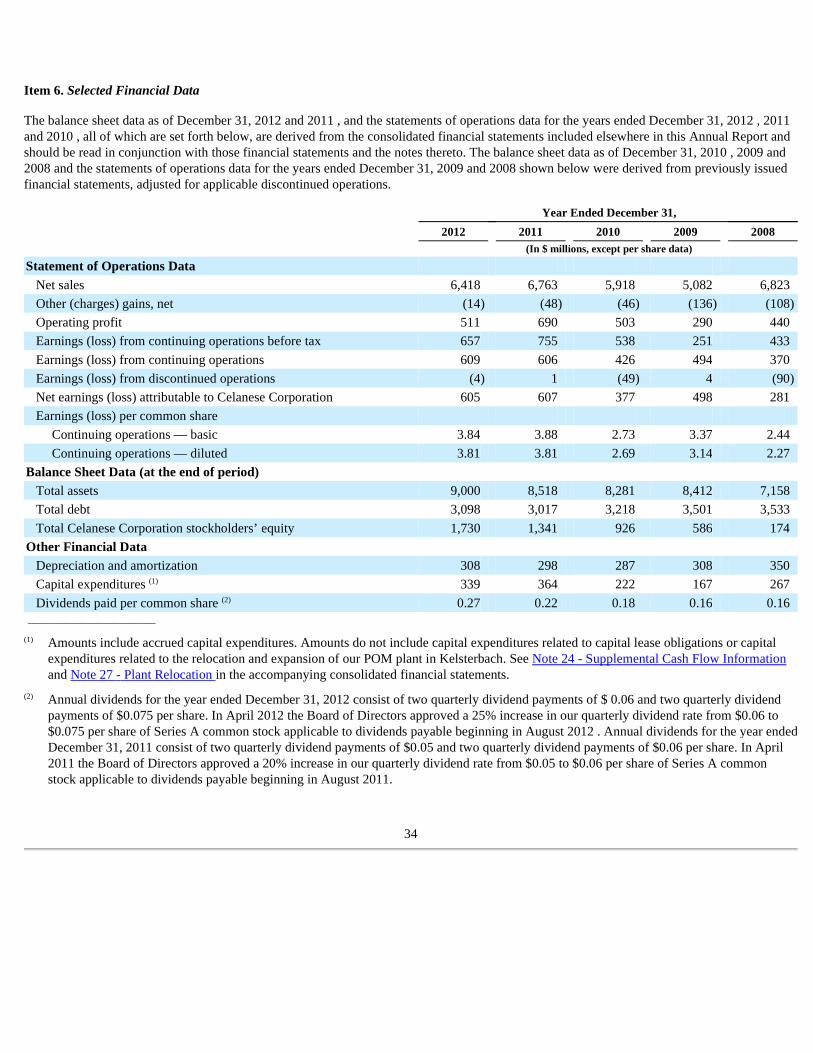
Item 6. Selected Financial Data
The balance sheet data as of December 31, 2012 and 2011 , and the statements of operations data for the years ended December 31, 2012 , 2011 and 2010 , all of which are set forth below, are derived from the consolidated financial statements included elsewhere in this Annual Report and should be read in conjunction with those financial statements and the notes thereto. The balance sheet data as of December 31, 2010 , 2009 and 2008 and the statements of operations data for the years ended December 31, 2009 and 2008 shown below were derived from previously issued financial statements, adjusted for applicable discontinued operations.
________________________
34
Year Ended December 31,
2012 2011 2010 2009 2008 (In $ millions, except per share data)
Statement of Operations Data Net sales 6,418 6,763 5,918 5,082 6,823 Other (charges) gains, net (14 ) (48 ) (46 ) (136 ) (108 )
Operating profit 511 690 503 290 440 Earnings (loss) from continuing operations before tax 657 755 538 251 433 Earnings (loss) from continuing operations 609 606 426 494 370 Earnings (loss) from discontinued operations (4 ) 1 (49 ) 4 (90 )
Net earnings (loss) attributable to Celanese Corporation 605 607 377 498 281 Earnings (loss) per common share
Continuing operations — basic 3.84 3.88 2.73 3.37 2.44 Continuing operations — diluted 3.81 3.81 2.69 3.14 2.27
Balance Sheet Data (at the end of period) Total assets 9,000 8,518 8,281 8,412 7,158 Total debt 3,098 3,017 3,218 3,501 3,533 Total Celanese Corporation stockholders’ equity 1,730 1,341 926 586 174
Other Financial Data Depreciation and amortization 308 298 287 308 350 Capital expenditures (1) 339 364 222 167 267 Dividends paid per common share (2) 0.27 0.22 0.18 0.16 0.16
(1) Amounts include accrued capital expenditures. Amounts do not include capital expenditures related to capital lease obligations or capital expenditures related to the relocation and expansion of our POM plant in Kelsterbach. See Note 24 - Supplemental Cash Flow Information and Note 27 - Plant Relocation in the accompanying consolidated financial statements.
(2) Annual dividends for the year ended December 31, 2012 consist of two quarterly dividend payments of $ 0.06 and two quarterly dividend payments of $0.075 per share. In April 2012 the Board of Directors approved a 25% increase in our quarterly dividend rate from $0.06 to $0.075 per share of Series A common stock applicable to dividends payable beginning in August 2012 . Annual dividends for the year ended December 31, 2011 consist of two quarterly dividend payments of $0.05 and two quarterly dividend payments of $0.06 per share. In April 2011 the Board of Directors approved a 20% increase in our quarterly dividend rate from $0.05 to $0.06 per share of Series A common stock applicable to dividends payable beginning in August 2011.
Item 7. Management’s Discussion and Analysis of Financial Condition and Results of Operations
In this Annual Report on Form 10-K ("Annual Report"), the term "Celanese" refers to Celanese Corporation, a Delaware corporation, and not its subsidiaries. The terms the "Company," "we," "our" and "us," refer to Celanese and its subsidiaries on a consolidated basis. The term "Celanese US" refers to the Company’s subsidiary, Celanese US Holdings LLC, a Delaware limited liability company, and not its subsidiaries.
The following discussion should be read in conjunction with the accompanying consolidated financial statements and notes to the consolidated financial statements, which are prepared in accordance with accounting principles generally accepted in the United States of America (" US GAAP" ).
Investors are cautioned that the forward-looking statements contained in this section and other parts of this Annual Report involve both risk and uncertainty. Several important factors could cause actual results to differ materially from those anticipated by these statements. Many of these statements are macroeconomic in nature and are, therefore, beyond the control of management. See "Forward-Looking Statements" below.
Forward-Looking Statements
Management's Discussion and Analysis of Financial Condition and Results of Operations ("MD&A") and other parts of this Annual Report contain certain forward-looking statements and information relating to us that are based on the beliefs of our management as well as assumptions made by, and information currently available to, us. Generally, words such as "believe," "expect," "intend," "estimate," "anticipate," "project," "plan," "may," "can," "could," "might," and "will," and similar expressions, as they relate to us are intended to identify forward-looking statements. These statements reflect our current views with respect to future events, are not guarantees of future performance and involve risks and uncertainties that are difficult to predict. Further, certain forward-looking statements are based upon assumptions as to future events that may not prove to be accurate. See " Special Note Regarding Forward-Looking Statements" at the beginning of this Annual Report for further discussion. Item 1A. Risk Factors of this Annual Report also contains a description of certain risk factors that you should consider which could significantly affect our financial results. In addition, the following factors could cause our actual results to differ materially from those results, performance or achievements that may be expressed or implied by such forward-looking statements. These factors include, among other things:
35
• changes in general economic, business, political and regulatory conditions in the countries or regions in which we operate;
• the length and depth of product and industry business cycles particularly in the automotive, electrical, textiles, electronics and construction industries;
• changes in the price and availability of raw materials, particularly changes in the demand for, supply of, and market prices of ethylene, methanol, natural gas, wood pulp and fuel oil and the prices for electricity and other energy sources;
• the ability to pass increases in raw material prices on to customers or otherwise improve margins through price increases;
• the ability to maintain plant utilization rates and to implement planned capacity additions and expansions;
• the ability to reduce or maintain at their current levels production costs and improve productivity by implementing technological improvements to existing plants;
• increased price competition and the introduction of competing products by other companies;
• changes in the degree of intellectual property and other legal protection afforded to our products or technologies, or the theft of such intellectual property;
• costs and potential disruption or interruption of production or operations due to accidents, cyber security incidents, terrorism or political unrest, or other unforeseen events or delays in construction of facilities;
• potential liability for remedial actions and increased costs under existing or future environmental regulations, including those relating to climate change;
Many of these factors are macroeconomic in nature and are, therefore, beyond our control. Should one or more of these risks or uncertainties materialize, or should underlying assumptions prove incorrect, our actual results, performance or achievements may vary materially from those described in this Annual Report as anticipated, believed, estimated, expected, intended, planned or projected. We neither intend nor assume any obligation to update these forward-looking statements, which speak only as of their dates.
Overview
We are a global technology and specialty materials company. We are one of the world’s largest producers of acetyl products, which are intermediate chemicals, for nearly all major industries, as well as a leading global producer of high performance engineered polymers that are used in a variety of high-value applications. As a recognized innovator in the chemicals industry, we engineer and manufacture a wide variety of products essential to everyday living. Our broad product portfolio serves a diverse set of end-use applications including paints and coatings, textiles, automotive applications, consumer and medical applications, performance industrial applications, filter media, paper and packaging, chemical additives, construction, consumer and industrial adhesives, and food and beverage applications. Our products enjoy leading global positions due to our large global production capacity, operating efficiencies, proprietary production technology and competitive cost structures.
Our large and diverse global customer base primarily consists of major companies in a broad array of industries. We hold geographically balanced global positions and participate in diversified end-use applications. We combine a demonstrated track record of execution, strong performance built on shared principles and objectives, and a clear focus on growth and value creation. Known for operational excellence and execution of our business strategies, we deliver value to customers around the globe with best-in-class technologies and solutions.
2012 Highlights
36
• potential liability resulting from pending or future litigation, or from changes in the laws, regulations or policies of governments or other governmental activities in the countries in which we operate;
• changes in currency exchange rates and interest rates;
• our level of indebtedness, which could diminish our ability to raise additional capital to fund operations or limit our ability to react to changes in the economy or the chemicals industry; and
• various other factors, both referenced and not referenced in this Annual Report.
• We completed an offering of $500 million in aggregate principal amount of 4.625% senior unsecured notes due 2022. In connection with completion of the offering, we repaid $400 million of our existing senior secured credit facility indebtedness that was set to mature in 2016 and used the remaining proceeds, together with cash on hand, to make a $100 million contribution to our US pension plan.
• We ceased manufacturing acetate tow and acetate flake at our Spondon, Derby, United Kingdom site.
• We announced our new CelFX TM matrix technology for filter media. CelFX TM provides a flexible additive platform for innovation that allows our customers increased filter design flexibility, improved constituent reduction and supports a broad choice for enhancement additives.
• We announced plans to construct and operate a methanol production facility at our Clear Lake, Texas acetyl complex which is expected to start up after July 1, 2015. As one of the world's largest producers of acetyl products, we plan to utilize our existing infrastructure to capture the opportunities created by abundant and affordable US natural gas supplies.
• We announced that the Board of Directors increased our remaining share repurchase authorization as of September 30, 2012 to $400 million.
• We launched the new Sunsation SM platform to help food and beverage manufacturers develop low- and no-calorie products that are better tasting and simplify the formulation process to bring products to market faster.
• We entered into a joint statement of cooperation to advance the development of fuel ethanol projects with Pertamina, the state-owned energy company of Indonesia. In line with our long-term strategy to develop new and renewable energy capabilities, Pertamina will collaborate exclusively with us to jointly develop synthetic fuel ethanol projects in the Republic of Indonesia utilizing our proprietary TCX ® ethanol process technology.
2013 Outlook
37
• We started up our technology development unit for ethanol production at our facility in Clear Lake, Texas. The unit will support our continuing development of TCX ® ethanol process technology for customers in both industrial-grade and fuel ethanol.
• We completed the acquisition of certain assets from Ashland Inc., including two product lines, Vinac ® and Flexbond ® , which will support the strategic growth of our Emulsions business.
• We received key government approvals necessary to proceed with previously announced plans to modify and enhance our existing integrated acetyl facility at the Nanjing Chemical Industrial Park in China to produce ethanol for industrial uses. Based upon continued advancements to our TCX ® ethanol process technology, we now expect to have approximately 30 to 40 percent additional ethanol production capacity above the originally announced 200,000 tons with no increase in the capital investment for the modification and enhancement. The unit is expected to startup in late 2013.
• Moody's Investors Service and Standard & Poor's Ratings Services both upgraded its outlook for Celanese to "Positive" from "Stable." In raising our outlook, both agencies cited improved operating performance, debt reduction as well as our operational, geographical and product diversity.
• We announced that our Board of Directors approved a 25% increase in our quarterly Series A Common Stock cash dividend. The Board of Directors increased the quarterly dividend rate from $0.06 to $0.075 per share of Common Stock on a quarterly basis and $0.24 to $0.30 per share of Common Stock on an annual basis. The new dividend rate began in August 2012.
• We anticipate a challenging global economic environment will continue into 2013, particularly with the uncertainty in the European Union. We expect growth in China will improve throughout the year but remain modest compared to historic levels. As a result, a higher proportion of our earnings is expected to be generated in higher tax jurisdictions, but should not impact our earnings growth. We expect our earnings growth in 2013 to be consistent with our long-term growth objectives of 12% to 14% and to be driven by Celanese-specific initiatives. In addition to productivity initiatives, we will continue to focus on technology platforms that expand our addressable opportunities, invest in technology innovation that enhances our growth prospects and to increase the effectiveness and speed of new product introductions.
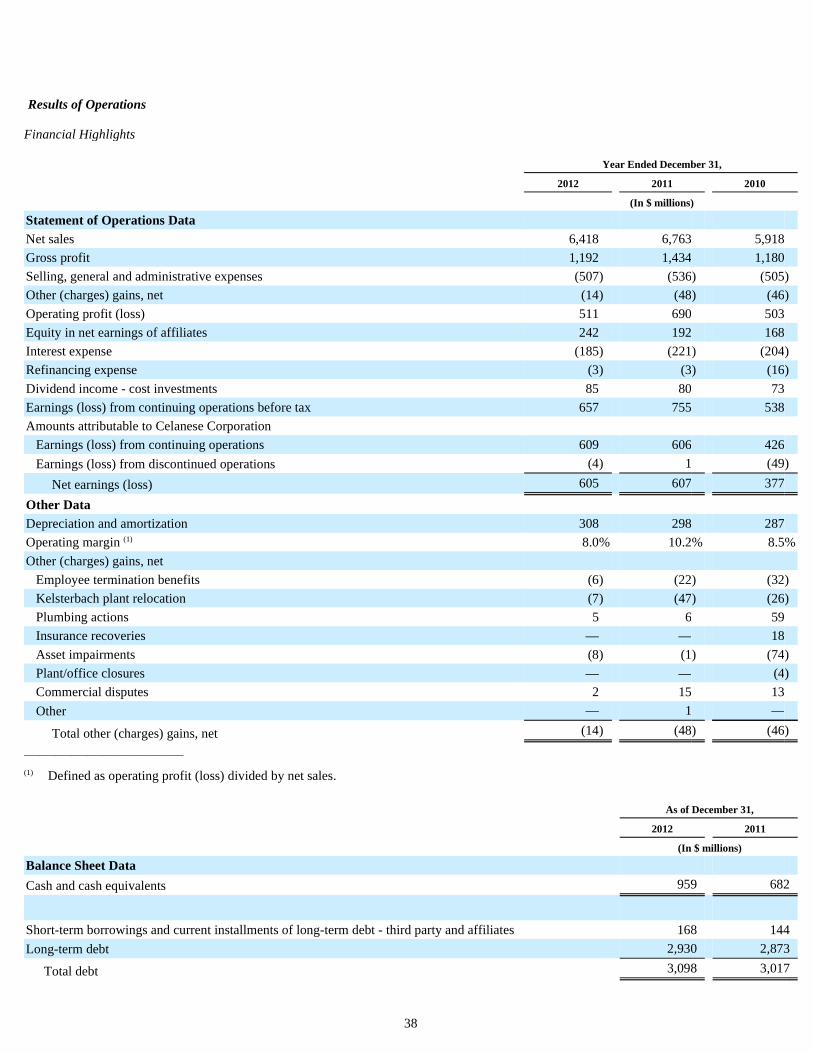
Results of Operations
Financial Highlights
______________________________
38
Year Ended December 31,
2012 2011 2010
(In $ millions)
Statement of Operations Data Net sales 6,418 6,763 5,918 Gross profit 1,192 1,434 1,180 Selling, general and administrative expenses (507 ) (536 ) (505 )
Other (charges) gains, net (14 ) (48 ) (46 )
Operating profit (loss) 511 690 503 Equity in net earnings of affiliates 242 192 168 Interest expense (185 ) (221 ) (204 )
Refinancing expense (3 ) (3 ) (16 )
Dividend income - cost investments 85 80 73 Earnings (loss) from continuing operations before tax 657 755 538 Amounts attributable to Celanese Corporation
Earnings (loss) from continuing operations 609 606 426 Earnings (loss) from discontinued operations (4 ) 1 (49 )
Net earnings (loss) 605 607 377
Other Data Depreciation and amortization 308 298 287 Operating margin (1) 8.0 % 10.2 % 8.5 %
Other (charges) gains, net
Employee termination benefits (6 ) (22 ) (32 )
Kelsterbach plant relocation (7 ) (47 ) (26 )
Plumbing actions 5 6 59 Insurance recoveries — — 18 Asset impairments (8 ) (1 ) (74 )
Plant/office closures — — (4 )
Commercial disputes 2 15 13 Other — 1 —
Total other (charges) gains, net (14 ) (48 ) (46 )
(1) Defined as operating profit (loss) divided by net sales.
As of December 31,
2012 2011
(In $ millions)
Balance Sheet Data Cash and cash equivalents 959 682
Short-term borrowings and current installments of long-term debt - third party and affiliates 168 144 Long-term debt 2,930 2,873
Total debt 3,098 3,017

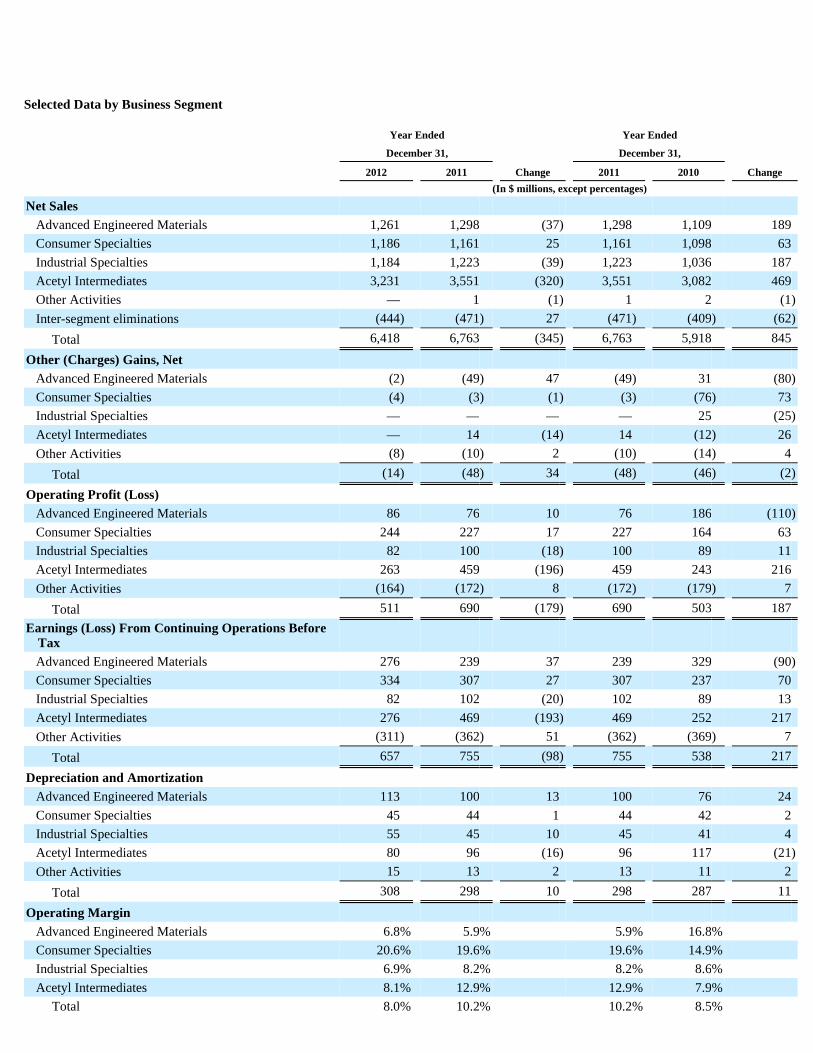
Selected Data by Business Segment
Year Ended Year Ended
December 31, December 31,
2012 2011 Change 2011 2010 Change
(In $ millions, except percentages)
Net Sales
Advanced Engineered Materials 1,261 1,298 (37 ) 1,298 1,109 189 Consumer Specialties 1,186 1,161 25 1,161 1,098 63 Industrial Specialties 1,184 1,223 (39 ) 1,223 1,036 187 Acetyl Intermediates 3,231 3,551 (320 ) 3,551 3,082 469 Other Activities — 1 (1 ) 1 2 (1 )
Inter-segment eliminations (444 ) (471 ) 27 (471 ) (409 ) (62 )
Total 6,418 6,763 (345 ) 6,763 5,918 845
Other (Charges) Gains, Net Advanced Engineered Materials (2 ) (49 ) 47 (49 ) 31 (80 )
Consumer Specialties (4 ) (3 ) (1 ) (3 ) (76 ) 73 Industrial Specialties — — — — 25 (25 )
Acetyl Intermediates — 14 (14 ) 14 (12 ) 26 Other Activities (8 ) (10 ) 2 (10 ) (14 ) 4
Total (14 ) (48 ) 34 (48 ) (46 ) (2 )
Operating Profit (Loss) Advanced Engineered Materials 86 76 10 76 186 (110 )
Consumer Specialties 244 227 17 227 164 63 Industrial Specialties 82 100 (18 ) 100 89 11 Acetyl Intermediates 263 459 (196 ) 459 243 216 Other Activities (164 ) (172 ) 8 (172 ) (179 ) 7
Total 511 690 (179 ) 690 503 187 Earnings (Loss) From Continuing Operations Before
Tax Advanced Engineered Materials 276 239 37 239 329 (90 )
Consumer Specialties 334 307 27 307 237 70 Industrial Specialties 82 102 (20 ) 102 89 13 Acetyl Intermediates 276 469 (193 ) 469 252 217 Other Activities (311 ) (362 ) 51 (362 ) (369 ) 7
Total 657 755 (98 ) 755 538 217
Depreciation and Amortization Advanced Engineered Materials 113 100 13 100 76 24 Consumer Specialties 45 44 1 44 42 2 Industrial Specialties 55 45 10 45 41 4 Acetyl Intermediates 80 96 (16 ) 96 117 (21 )
Other Activities 15 13 2 13 11 2
Total 308 298 10 298 287 11
Operating Margin Advanced Engineered Materials 6.8 % 5.9 % 5.9 % 16.8 %
Consumer Specialties 20.6 % 19.6 % 19.6 % 14.9 %
Industrial Specialties 6.9 % 8.2 % 8.2 % 8.6 %
Acetyl Intermediates 8.1 % 12.9 % 12.9 % 7.9 %
Total 8.0 % 10.2 % 10.2 % 8.5 %

39
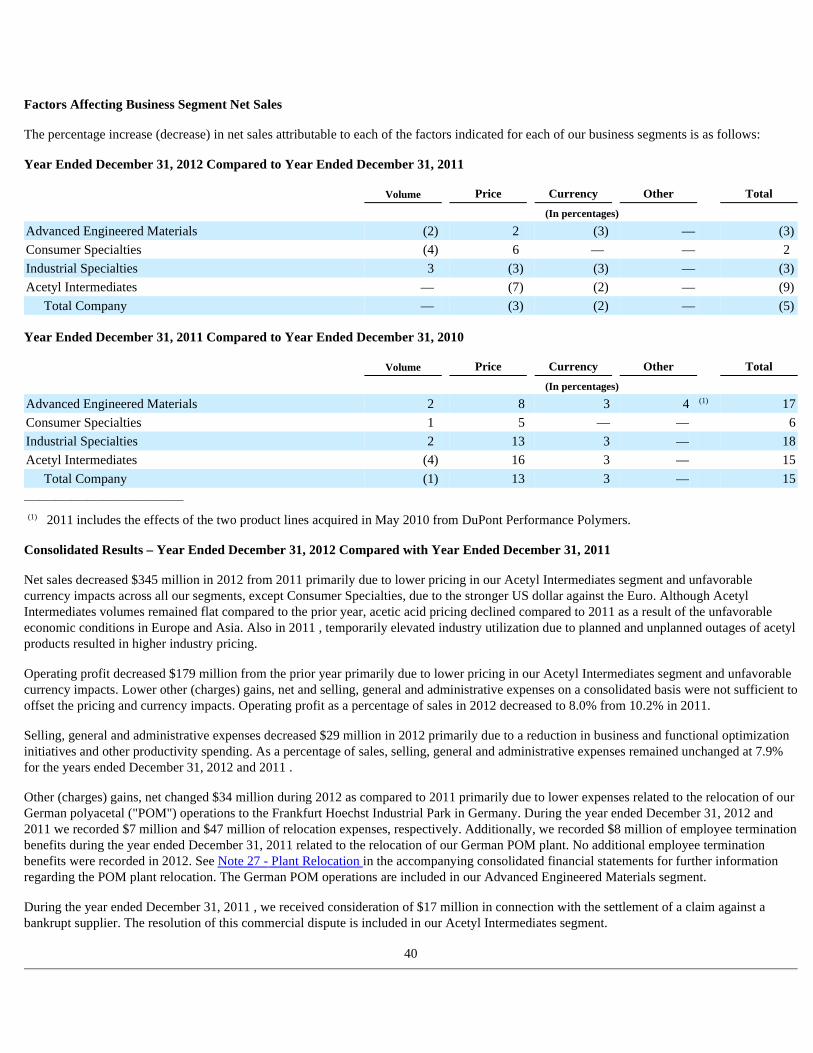
Factors Affecting Business Segment Net Sales
The percentage increase (decrease) in net sales attributable to each of the factors indicated for each of our business segments is as follows:
Year Ended December 31, 2012 Compared to Year Ended December 31, 2011
Year Ended December 31, 2011 Compared to Year Ended December 31, 2010
______________________________
(1) 2011 includes the effects of the two product lines acquired in May 2010 from DuPont Performance Polymers.
Consolidated Results – Year Ended December 31, 2012 Compared with Year Ended December 31, 2011
Net sales decreased $345 million in 2012 from 2011 primarily due to lower pricing in our Acetyl Intermediates segment and unfavorable currency impacts across all our segments, except Consumer Specialties, due to the stronger US dollar against the Euro. Although Acetyl Intermediates volumes remained flat compared to the prior year, acetic acid pricing declined compared to 2011 as a result of the unfavorable economic conditions in Europe and Asia. Also in 2011 , temporarily elevated industry utilization due to planned and unplanned outages of acetyl products resulted in higher industry pricing.
Operating profit decreased $179 million from the prior year primarily due to lower pricing in our Acetyl Intermediates segment and unfavorable currency impacts. Lower other (charges) gains, net and selling, general and administrative expenses on a consolidated basis were not sufficient to offset the pricing and currency impacts. Operating profit as a percentage of sales in 2012 decreased to 8.0% from 10.2% in 2011.
Selling, general and administrative expenses decreased $29 million in 2012 primarily due to a reduction in business and functional optimization initiatives and other productivity spending. As a percentage of sales, selling, general and administrative expenses remained unchanged at 7.9% for the years ended December 31, 2012 and 2011 .
Other (charges) gains, net changed $34 million during 2012 as compared to 2011 primarily due to lower expenses related to the relocation of our German polyacetal ("POM") operations to the Frankfurt Hoechst Industrial Park in Germany. During the year ended December 31, 2012 and 2011 we recorded $7 million and $47 million of relocation expenses, respectively. Additionally, we recorded $8 million of employee termination benefits during the year ended December 31, 2011 related to the relocation of our German POM plant. No additional employee termination benefits were recorded in 2012. See Note 27 - Plant Relocation in the accompanying consolidated financial statements for further information regarding the POM plant relocation. The German POM operations are included in our Advanced Engineered Materials segment.
During the year ended December 31, 2011 , we received consideration of $17 million in connection with the settlement of a claim against a bankrupt supplier. The resolution of this commercial dispute is included in our Acetyl Intermediates segment.
40
Volume Price Currency Other Total
(In percentages)
Advanced Engineered Materials (2 ) 2 (3 ) — (3 )
Consumer Specialties (4 ) 6 — — 2 Industrial Specialties 3 (3 ) (3 ) — (3 )
Acetyl Intermediates — (7 ) (2 ) — (9 )
Total Company — (3 ) (2 ) — (5 )
Volume Price Currency Other Total
(In percentages)
Advanced Engineered Materials 2 8 3 4 (1) 17
Consumer Specialties 1 5 — — 6
Industrial Specialties 2 13 3 — 18
Acetyl Intermediates (4 ) 16 3 — 15
Total Company (1 ) 13 3 — 15
Equity in net earnings of affiliates increased $50 million in 2012 compared to the prior year primarily due to $18 million in higher earnings in our Ibn Sina affiliate and $13 million in our Polyplastics affiliate both included in our Advanced Engineered Materials segment. During the year ended December 31, 2012 , a subsidiary of our Infraserv Hoechst affiliate restructured its debt resulting in additional net earnings of affiliates of $22 million of which $3 million was attributable to our Consumer Specialties segment, $6 million to our Acetyl Intermediates segment and $13 million to Other Activities.
Our effective income tax rate for the year ended December 31, 2012 was 7% compared to 20% for the year ended December 31, 2011 . The effective tax rate for 2012 was favorably impacted by foreign tax credit carryforwards realized in the US during the three months ended March 31, 2012 and offset by deferred tax charges related to changes in assessment regarding the permanent reinvestment of certain foreign earnings.
Consolidated Results - Year Ended December 31, 2011 Compared with Year Ended December 31, 2010
Net sales increased $845 million in 2011 from 2010 primarily due to higher pricing across all of our business segments. Favorable foreign currency impacts due to the weakening of the US dollar against the Euro also added to the increase in net sales. In addition to higher pricing, our Advanced Engineered Materials segment contributed to our increase in net sales reflecting the impact of the two product lines, Zenite ® liquid crystal polymers ("LCP") and Thermx ® polycyclohexylene-dimethylene terephthalate ("PCT"), acquired in May 2010, as well as higher volumes in almost all of its product lines, particularly in long-fiber reinforced thermoplastics ("LFT") and GUR ® ultra-high molecular weight polyethylene. Increased net sales also were a result of strong global demand and higher innovation volumes from our Emulsions business. Volumes in our Consumer Specialties segment remained relatively flat while volumes in our Acetyl Intermediates segment decreased primarily due to planned and unplanned production outages at our Nanjing facility and industry destocking across the supply chain at the end of the year.
Operating profit increased $187 million from the prior year due to higher net sales, primarily in our Acetyl Intermediates segment, which more than offset the increase in raw materials, other variable costs, and selling, general and administrative expenses. Operating profit also increased due to the absence of certain write-offs and accelerated amortization recorded in 2010. During the year ended December 31, 2010 , we wrote-off other productive assets of $18 million related to our Singapore and Nanjing, China facilities, which are included in our Acetyl Intermediates segment. We also recorded $22 million of accelerated amortization to write-off the asset associated with a raw material purchase agreement with a supplier who filed for bankruptcy in 2009. The accelerated amortization was recorded as $20 million to our Acetyl Intermediates segment and $2 million to our Advanced Engineered Materials segment. Both the write-off of other productive assets and accelerated amortization were recorded to Cost of Sales in the accompanying consolidated statements of operations during the year ended December 31, 2010 .
Selling, general and administrative expenses increased $31 million in 2011 primarily due to costs associated with business and functional optimization initiatives and higher spending on innovation. However, as a percentage of sales, selling, general and administrative expenses declined from 8.5% to 7.9% for the year ended December 31, 2011 as compared to the same period in 2010 due to sustainable efficiencies.
Other (charges) gains, net changed $2 million during 2011 as compared to 2010 primarily due to a decrease in asset impairments and employee termination benefits offset by an increase in plant relocation costs, a decrease in insurance recoveries and the absence of reductions in legal reserves.
During 2010, we concluded that certain long-lived assets were partially impaired at our acetate flake and tow manufacturing operations in Spondon, Derby, United Kingdom. Accordingly, we wrote down the related property, plant and equipment to its fair value of $31 million , resulting in long-lived asset impairment losses of $72 million . The Spondon, Derby, United Kingdom operations are included in our Consumer Specialties segment.
Employee termination benefits decreased $10 million compared to prior year, primarily due to lower severance costs associated with the planned closure of our Spondon, Derby, United Kingdom facility and our "Project of Closure" at our Pardies, France operations, offset by additional severance costs related to our Kelsterbach plant relocation. The Pardies, France operations are included in our Acetyl Intermediates segment. See Note 4, Acquisitions - Dispositions, Ventures and Plant Closures in the accompanying consolidated financial statements for further information regarding these plant closures. We recorded $8 million of employee termination benefits during the year ended December 31, 2011 related to the relocation of our POM Kelsterbach, Germany operations to the Frankfurt Hoechst Industrial Park, Germany. On September 26, 2011, we announced the start-up of the new POM production facility in the Frankfurt Hoechst Industrial Park.
41
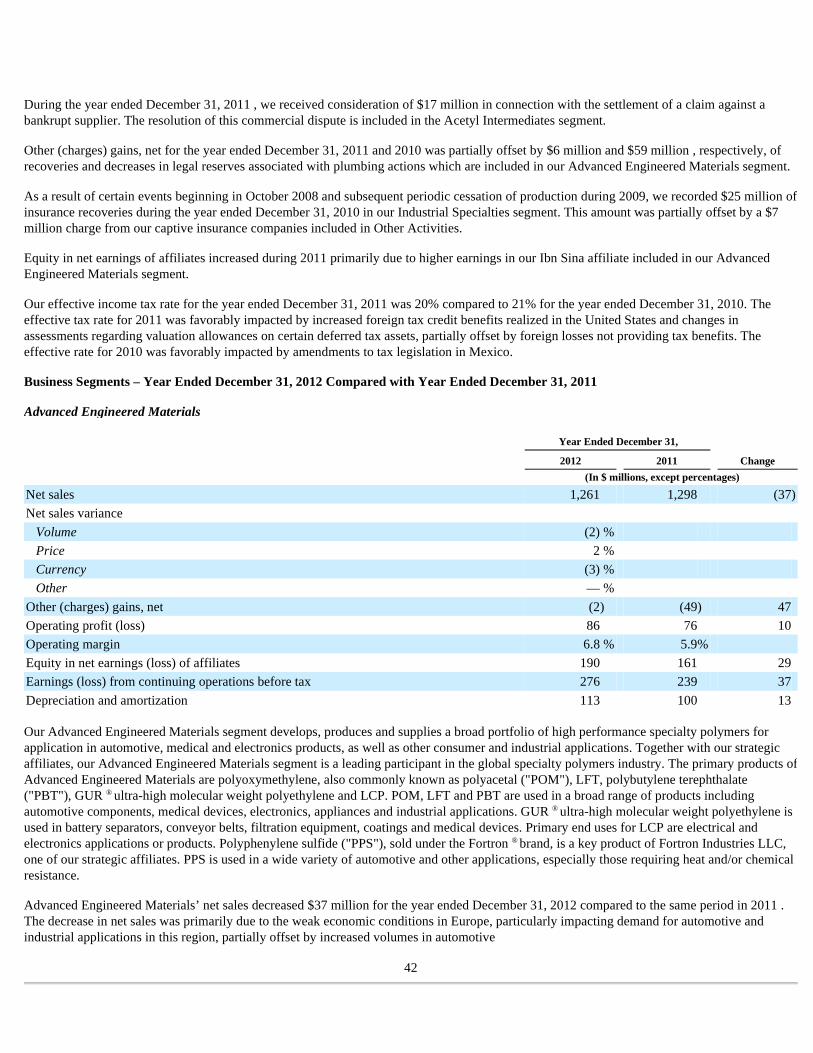
During the year ended December 31, 2011 , we received consideration of $17 million in connection with the settlement of a claim against a bankrupt supplier. The resolution of this commercial dispute is included in the Acetyl Intermediates segment.
Other (charges) gains, net for the year ended December 31, 2011 and 2010 was partially offset by $6 million and $59 million , respectively, of recoveries and decreases in legal reserves associated with plumbing actions which are included in our Advanced Engineered Materials segment.
As a result of certain events beginning in October 2008 and subsequent periodic cessation of production during 2009, we recorded $25 million of insurance recoveries during the year ended December 31, 2010 in our Industrial Specialties segment. This amount was partially offset by a $7 million charge from our captive insurance companies included in Other Activities.
Equity in net earnings of affiliates increased during 2011 primarily due to higher earnings in our Ibn Sina affiliate included in our Advanced Engineered Materials segment.
Our effective income tax rate for the year ended December 31, 2011 was 20% compared to 21% for the year ended December 31, 2010. The effective tax rate for 2011 was favorably impacted by increased foreign tax credit benefits realized in the United States and changes in assessments regarding valuation allowances on certain deferred tax assets, partially offset by foreign losses not providing tax benefits. The effective rate for 2010 was favorably impacted by amendments to tax legislation in Mexico.
Business Segments – Year Ended December 31, 2012 Compared with Year Ended December 31, 2011
Advanced Engineered Materials
Our Advanced Engineered Materials segment develops, produces and supplies a broad portfolio of high performance specialty polymers for application in automotive, medical and electronics products, as well as other consumer and industrial applications. Together with our strategic affiliates, our Advanced Engineered Materials segment is a leading participant in the global specialty polymers industry. The primary products of Advanced Engineered Materials are polyoxymethylene, also commonly known as polyacetal ("POM"), LFT, polybutylene terephthalate ("PBT"), GUR ® ultra-high molecular weight polyethylene and LCP. POM, LFT and PBT are used in a broad range of products including automotive components, medical devices, electronics, appliances and industrial applications. GUR ® ultra-high molecular weight polyethylene is used in battery separators, conveyor belts, filtration equipment, coatings and medical devices. Primary end uses for LCP are electrical and electronics applications or products. Polyphenylene sulfide ("PPS"), sold under the Fortron ® brand, is a key product of Fortron Industries LLC, one of our strategic affiliates. PPS is used in a wide variety of automotive and other applications, especially those requiring heat and/or chemical resistance.
Advanced Engineered Materials’ net sales decreased $37 million for the year ended December 31, 2012 compared to the same period in 2011 . The decrease in net sales was primarily due to the weak economic conditions in Europe, particularly impacting demand for automotive and industrial applications in this region, partially offset by increased volumes in automotive
42
Year Ended December 31,
2012 2011 Change
(In $ millions, except percentages)
Net sales 1,261 1,298 (37 )
Net sales variance Volume (2) % Price 2 % Currency (3) % Other — %
Other (charges) gains, net (2 ) (49 ) 47 Operating profit (loss) 86 76 10 Operating margin 6.8 % 5.9 %
Equity in net earnings (loss) of affiliates 190 161 29 Earnings (loss) from continuing operations before tax 276 239 37 Depreciation and amortization 113 100 13
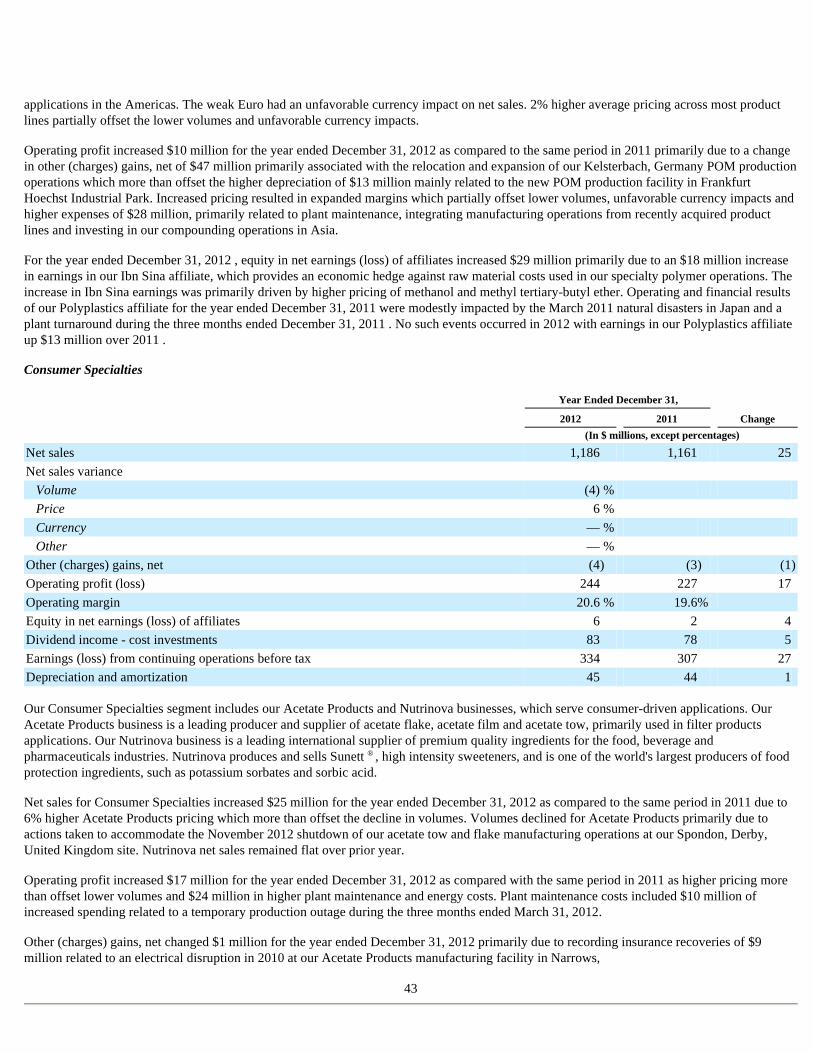
applications in the Americas. The weak Euro had an unfavorable currency impact on net sales. 2% higher average pricing across most product lines partially offset the lower volumes and unfavorable currency impacts.
Operating profit increased $10 million for the year ended December 31, 2012 as compared to the same period in 2011 primarily due to a change in other (charges) gains, net of $47 million primarily associated with the relocation and expansion of our Kelsterbach, Germany POM production operations which more than offset the higher depreciation of $13 million mainly related to the new POM production facility in Frankfurt Hoechst Industrial Park. Increased pricing resulted in expanded margins which partially offset lower volumes, unfavorable currency impacts and higher expenses of $28 million, primarily related to plant maintenance, integrating manufacturing operations from recently acquired product lines and investing in our compounding operations in Asia.
For the year ended December 31, 2012 , equity in net earnings (loss) of affiliates increased $29 million primarily due to an $18 million increase in earnings in our Ibn Sina affiliate, which provides an economic hedge against raw material costs used in our specialty polymer operations. The increase in Ibn Sina earnings was primarily driven by higher pricing of methanol and methyl tertiary-butyl ether. Operating and financial results of our Polyplastics affiliate for the year ended December 31, 2011 were modestly impacted by the March 2011 natural disasters in Japan and a plant turnaround during the three months ended December 31, 2011 . No such events occurred in 2012 with earnings in our Polyplastics affiliate up $13 million over 2011 .
Consumer Specialties
Our Consumer Specialties segment includes our Acetate Products and Nutrinova businesses, which serve consumer-driven applications. Our Acetate Products business is a leading producer and supplier of acetate flake, acetate film and acetate tow, primarily used in filter products applications. Our Nutrinova business is a leading international supplier of premium quality ingredients for the food, beverage and pharmaceuticals industries. Nutrinova produces and sells Sunett ® , high intensity sweeteners, and is one of the world's largest producers of food protection ingredients, such as potassium sorbates and sorbic acid.
Net sales for Consumer Specialties increased $25 million for the year ended December 31, 2012 as compared to the same period in 2011 due to 6% higher Acetate Products pricing which more than offset the decline in volumes. Volumes declined for Acetate Products primarily due to actions taken to accommodate the November 2012 shutdown of our acetate tow and flake manufacturing operations at our Spondon, Derby, United Kingdom site. Nutrinova net sales remained flat over prior year.
Operating profit increased $17 million for the year ended December 31, 2012 as compared with the same period in 2011 as higher pricing more than offset lower volumes and $24 million in higher plant maintenance and energy costs. Plant maintenance costs included $10 million of increased spending related to a temporary production outage during the three months ended March 31, 2012.
Other (charges) gains, net changed $1 million for the year ended December 31, 2012 primarily due to recording insurance recoveries of $9 million related to an electrical disruption in 2010 at our Acetate Products manufacturing facility in Narrows,
43
Year Ended December 31,
2012 2011 Change
(In $ millions, except percentages)
Net sales 1,186 1,161 25 Net sales variance
Volume (4) % Price 6 % Currency — % Other — %
Other (charges) gains, net (4 ) (3 ) (1 )
Operating profit (loss) 244 227 17 Operating margin 20.6 % 19.6 %
Equity in net earnings (loss) of affiliates 6 2 4 Dividend income - cost investments 83 78 5 Earnings (loss) from continuing operations before tax 334 307 27 Depreciation and amortization 45 44 1
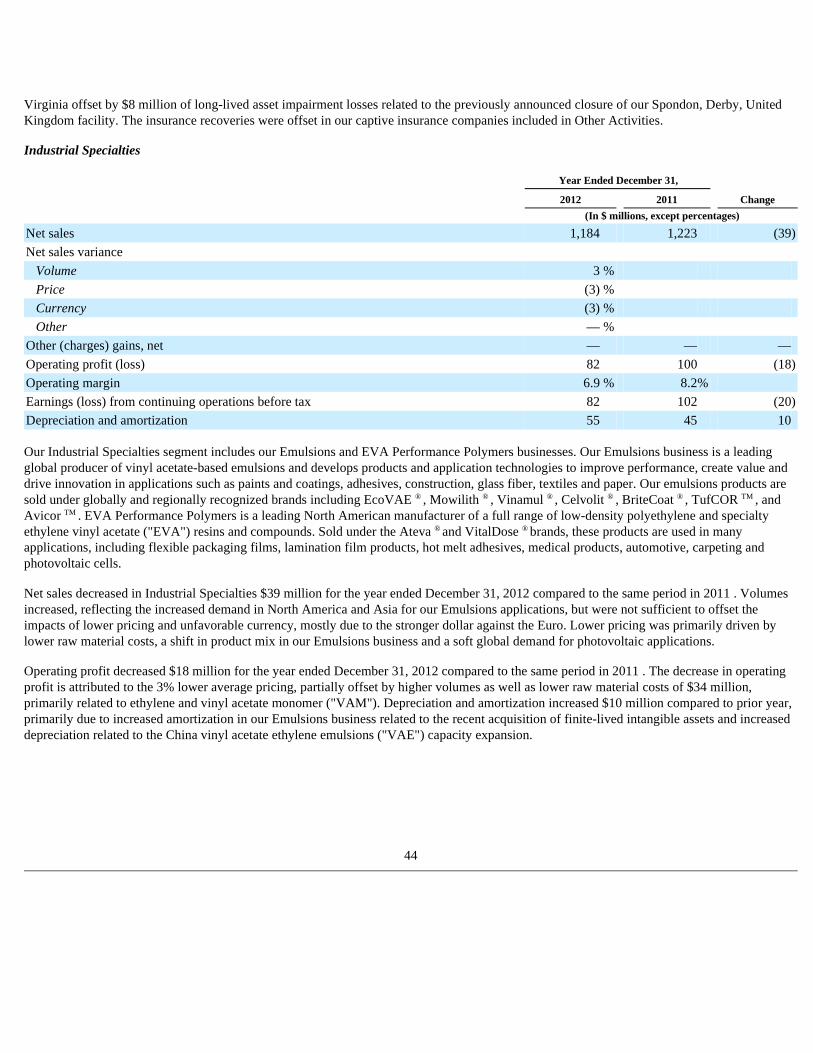
Virginia offset by $8 million of long-lived asset impairment losses related to the previously announced closure of our Spondon, Derby, United Kingdom facility. The insurance recoveries were offset in our captive insurance companies included in Other Activities.
Industrial Specialties
Our Industrial Specialties segment includes our Emulsions and EVA Performance Polymers businesses. Our Emulsions business is a leading global producer of vinyl acetate-based emulsions and develops products and application technologies to improve performance, create value and drive innovation in applications such as paints and coatings, adhesives, construction, glass fiber, textiles and paper. Our emulsions products are sold under globally and regionally recognized brands including EcoVAE ® , Mowilith ® , Vinamul ® , Celvolit ® , BriteCoat ® , TufCOR TM , and Avicor TM . EVA Performance Polymers is a leading North American manufacturer of a full range of low-density polyethylene and specialty ethylene vinyl acetate ("EVA") resins and compounds. Sold under the Ateva ® and VitalDose ® brands, these products are used in many applications, including flexible packaging films, lamination film products, hot melt adhesives, medical products, automotive, carpeting and photovoltaic cells.
Net sales decreased in Industrial Specialties $39 million for the year ended December 31, 2012 compared to the same period in 2011 . Volumes increased, reflecting the increased demand in North America and Asia for our Emulsions applications, but were not sufficient to offset the impacts of lower pricing and unfavorable currency, mostly due to the stronger dollar against the Euro. Lower pricing was primarily driven by lower raw material costs, a shift in product mix in our Emulsions business and a soft global demand for photovoltaic applications.
Operating profit decreased $18 million for the year ended December 31, 2012 compared to the same period in 2011 . The decrease in operating profit is attributed to the 3% lower average pricing, partially offset by higher volumes as well as lower raw material costs of $34 million, primarily related to ethylene and vinyl acetate monomer ("VAM"). Depreciation and amortization increased $10 million compared to prior year, primarily due to increased amortization in our Emulsions business related to the recent acquisition of finite-lived intangible assets and increased depreciation related to the China vinyl acetate ethylene emulsions ("VAE") capacity expansion.
44
Year Ended December 31,
2012 2011 Change
(In $ millions, except percentages)
Net sales 1,184 1,223 (39 )
Net sales variance Volume 3 % Price (3) % Currency (3) % Other — %
Other (charges) gains, net — — — Operating profit (loss) 82 100 (18 )
Operating margin 6.9 % 8.2 %
Earnings (loss) from continuing operations before tax 82 102 (20 )
Depreciation and amortization 55 45 10
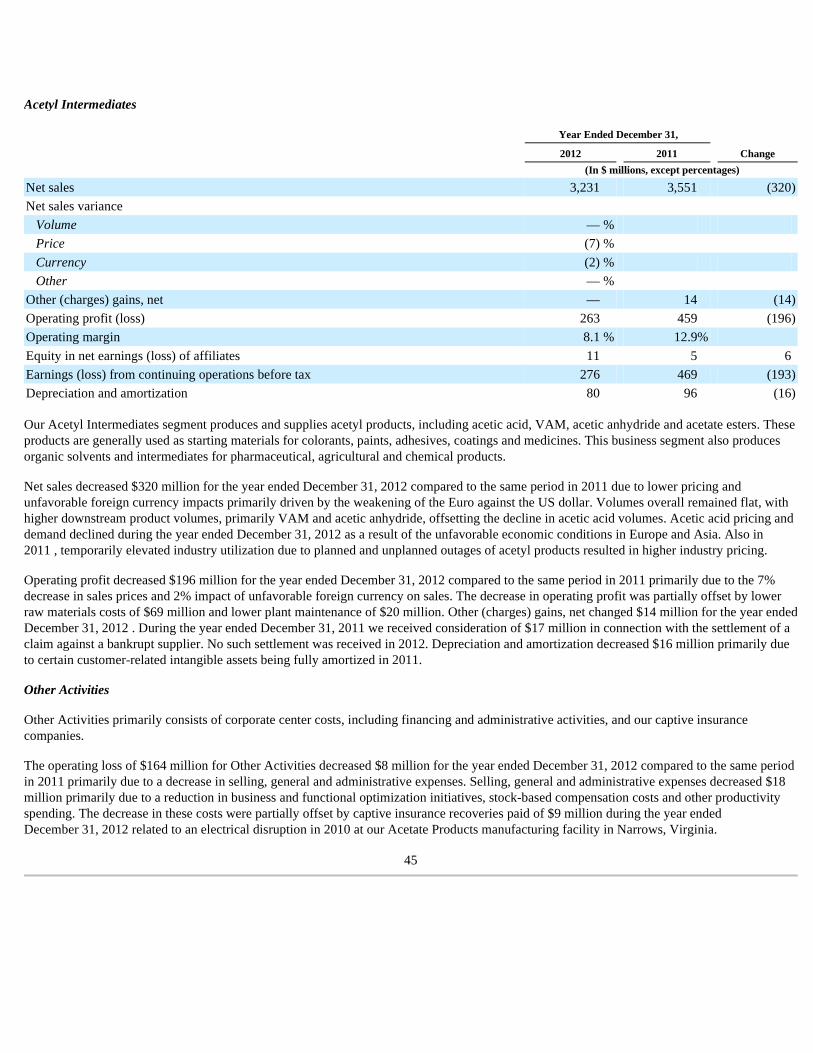
Acetyl Intermediates
Our Acetyl Intermediates segment produces and supplies acetyl products, including acetic acid, VAM, acetic anhydride and acetate esters. These products are generally used as starting materials for colorants, paints, adhesives, coatings and medicines. This business segment also produces organic solvents and intermediates for pharmaceutical, agricultural and chemical products.
Net sales decreased $320 million for the year ended December 31, 2012 compared to the same period in 2011 due to lower pricing and unfavorable foreign currency impacts primarily driven by the weakening of the Euro against the US dollar. Volumes overall remained flat, with higher downstream product volumes, primarily VAM and acetic anhydride, offsetting the decline in acetic acid volumes. Acetic acid pricing and demand declined during the year ended December 31, 2012 as a result of the unfavorable economic conditions in Europe and Asia. Also in 2011 , temporarily elevated industry utilization due to planned and unplanned outages of acetyl products resulted in higher industry pricing.
Operating profit decreased $196 million for the year ended December 31, 2012 compared to the same period in 2011 primarily due to the 7% decrease in sales prices and 2% impact of unfavorable foreign currency on sales. The decrease in operating profit was partially offset by lower raw materials costs of $69 million and lower plant maintenance of $20 million. Other (charges) gains, net changed $14 million for the year ended December 31, 2012 . During the year ended December 31, 2011 we received consideration of $17 million in connection with the settlement of a claim against a bankrupt supplier. No such settlement was received in 2012. Depreciation and amortization decreased $16 million primarily due to certain customer-related intangible assets being fully amortized in 2011.
Other Activities
Other Activities primarily consists of corporate center costs, including financing and administrative activities, and our captive insurance companies.
The operating loss of $164 million for Other Activities decreased $8 million for the year ended December 31, 2012 compared to the same period in 2011 primarily due to a decrease in selling, general and administrative expenses. Selling, general and administrative expenses decreased $18 million primarily due to a reduction in business and functional optimization initiatives, stock-based compensation costs and other productivity spending. The decrease in these costs were partially offset by captive insurance recoveries paid of $9 million during the year ended December 31, 2012 related to an electrical disruption in 2010 at our Acetate Products manufacturing facility in Narrows, Virginia.
45
Year Ended December 31,
2012 2011 Change
(In $ millions, except percentages)
Net sales 3,231 3,551 (320 )
Net sales variance Volume — % Price (7) % Currency (2) % Other — %
Other (charges) gains, net — 14 (14 )
Operating profit (loss) 263 459 (196 )
Operating margin 8.1 % 12.9 %
Equity in net earnings (loss) of affiliates 11 5 6 Earnings (loss) from continuing operations before tax 276 469 (193 )
Depreciation and amortization 80 96 (16 )
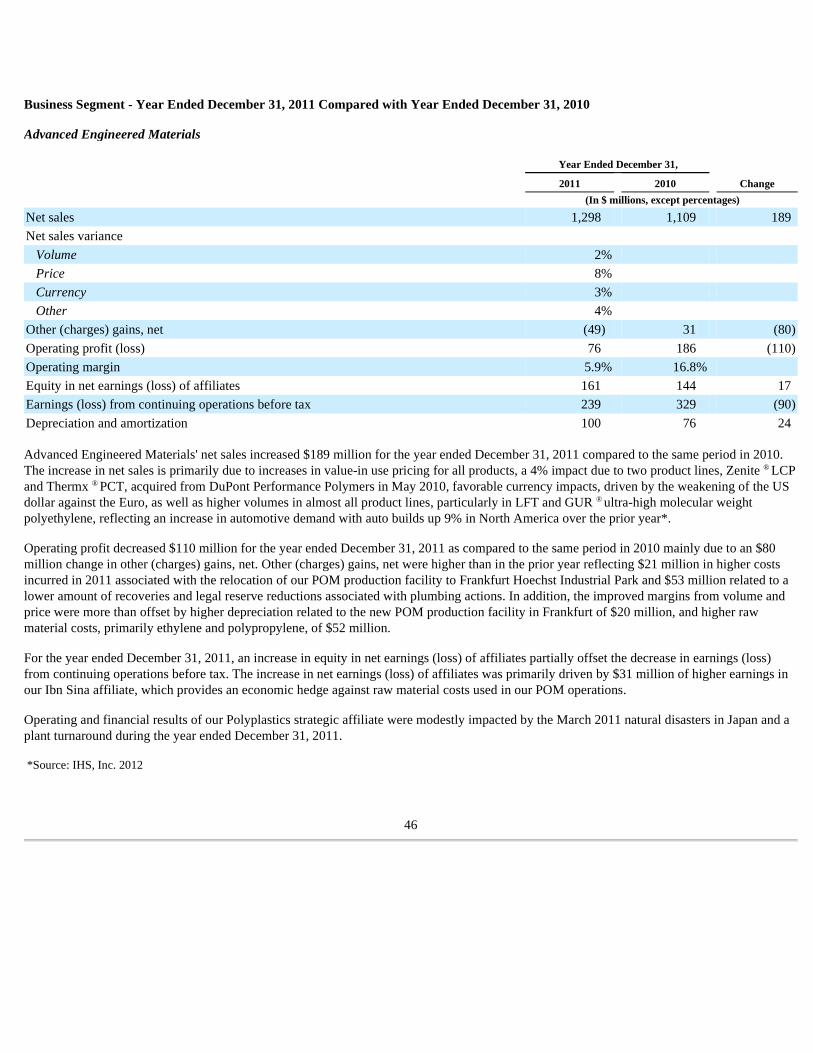
Business Segment - Year Ended December 31, 2011 Compared with Year Ended December 31, 2010
Advanced Engineered Materials
Advanced Engineered Materials' net sales increased $189 million for the year ended December 31, 2011 compared to the same period in 2010. The increase in net sales is primarily due to increases in value-in use pricing for all products, a 4% impact due to two product lines, Zenite ® LCP and Thermx ® PCT, acquired from DuPont Performance Polymers in May 2010, favorable currency impacts, driven by the weakening of the US dollar against the Euro, as well as higher volumes in almost all product lines, particularly in LFT and GUR ® ultra-high molecular weight polyethylene, reflecting an increase in automotive demand with auto builds up 9% in North America over the prior year*.
Operating profit decreased $110 million for the year ended December 31, 2011 as compared to the same period in 2010 mainly due to an $80 million change in other (charges) gains, net. Other (charges) gains, net were higher than in the prior year reflecting $21 million in higher costs incurred in 2011 associated with the relocation of our POM production facility to Frankfurt Hoechst Industrial Park and $53 million related to a lower amount of recoveries and legal reserve reductions associated with plumbing actions. In addition, the improved margins from volume and price were more than offset by higher depreciation related to the new POM production facility in Frankfurt of $20 million, and higher raw material costs, primarily ethylene and polypropylene, of $52 million.
For the year ended December 31, 2011, an increase in equity in net earnings (loss) of affiliates partially offset the decrease in earnings (loss) from continuing operations before tax. The increase in net earnings (loss) of affiliates was primarily driven by $31 million of higher earnings in our Ibn Sina affiliate, which provides an economic hedge against raw material costs used in our POM operations.
Operating and financial results of our Polyplastics strategic affiliate were modestly impacted by the March 2011 natural disasters in Japan and a plant turnaround during the year ended December 31, 2011.
*Source: IHS, Inc. 2012
46
Year Ended December 31,
2011 2010 Change
(In $ millions, except percentages)
Net sales 1,298 1,109 189 Net sales variance
Volume 2 %
Price 8 %
Currency 3 %
Other 4 %
Other (charges) gains, net (49 ) 31 (80 )
Operating profit (loss) 76 186 (110 )
Operating margin 5.9 % 16.8 %
Equity in net earnings (loss) of affiliates 161 144 17 Earnings (loss) from continuing operations before tax 239 329 (90 )
Depreciation and amortization 100 76 24
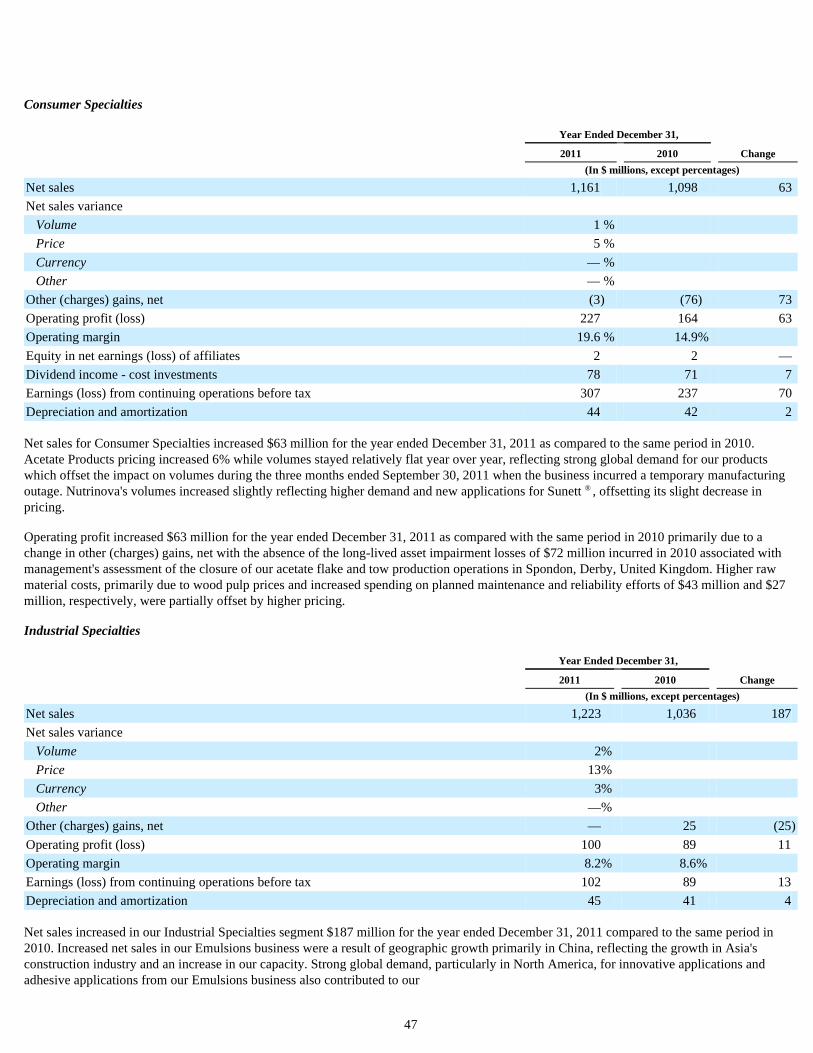
Consumer Specialties
Net sales for Consumer Specialties increased $63 million for the year ended December 31, 2011 as compared to the same period in 2010. Acetate Products pricing increased 6% while volumes stayed relatively flat year over year, reflecting strong global demand for our products which offset the impact on volumes during the three months ended September 30, 2011 when the business incurred a temporary manufacturing outage. Nutrinova's volumes increased slightly reflecting higher demand and new applications for Sunett ® , offsetting its slight decrease in pricing.
Operating profit increased $63 million for the year ended December 31, 2011 as compared with the same period in 2010 primarily due to a change in other (charges) gains, net with the absence of the long-lived asset impairment losses of $72 million incurred in 2010 associated with management's assessment of the closure of our acetate flake and tow production operations in Spondon, Derby, United Kingdom. Higher raw material costs, primarily due to wood pulp prices and increased spending on planned maintenance and reliability efforts of $43 million and $27 million, respectively, were partially offset by higher pricing.
Industrial Specialties
Net sales increased in our Industrial Specialties segment $187 million for the year ended December 31, 2011 compared to the same period in 2010. Increased net sales in our Emulsions business were a result of geographic growth primarily in China, reflecting the growth in Asia's construction industry and an increase in our capacity. Strong global demand, particularly in North America, for innovative applications and adhesive applications from our Emulsions business also contributed to our
47
Year Ended December 31,
2011 2010 Change
(In $ millions, except percentages)
Net sales 1,161 1,098 63 Net sales variance
Volume 1 %
Price 5 %
Currency — %
Other — %
Other (charges) gains, net (3 ) (76 ) 73 Operating profit (loss) 227 164 63 Operating margin 19.6 % 14.9 %
Equity in net earnings (loss) of affiliates 2 2 — Dividend income - cost investments 78 71 7 Earnings (loss) from continuing operations before tax 307 237 70 Depreciation and amortization 44 42 2
Year Ended December 31,
2011 2010 Change
(In $ millions, except percentages)
Net sales 1,223 1,036 187 Net sales variance
Volume 2 %
Price 13 %
Currency 3 %
Other —%
Other (charges) gains, net — 25 (25 )
Operating profit (loss) 100 89 11 Operating margin 8.2 % 8.6 %
Earnings (loss) from continuing operations before tax 102 89 13 Depreciation and amortization 45 41 4

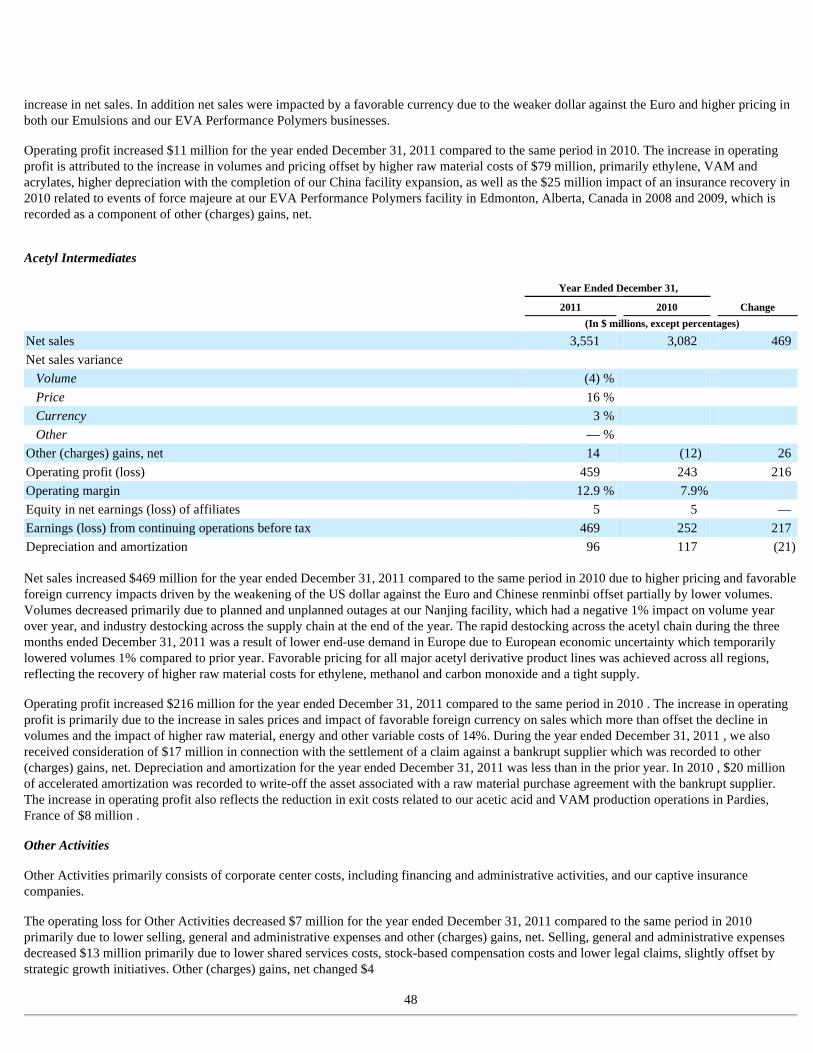
increase in net sales. In addition net sales were impacted by a favorable currency due to the weaker dollar against the Euro and higher pricing in both our Emulsions and our EVA Performance Polymers businesses.
Operating profit increased $11 million for the year ended December 31, 2011 compared to the same period in 2010. The increase in operating profit is attributed to the increase in volumes and pricing offset by higher raw material costs of $79 million, primarily ethylene, VAM and acrylates, higher depreciation with the completion of our China facility expansion, as well as the $25 million impact of an insurance recovery in 2010 related to events of force majeure at our EVA Performance Polymers facility in Edmonton, Alberta, Canada in 2008 and 2009, which is recorded as a component of other (charges) gains, net.
Acetyl Intermediates
Net sales increased $469 million for the year ended December 31, 2011 compared to the same period in 2010 due to higher pricing and favorable foreign currency impacts driven by the weakening of the US dollar against the Euro and Chinese renminbi offset partially by lower volumes. Volumes decreased primarily due to planned and unplanned outages at our Nanjing facility, which had a negative 1% impact on volume year over year, and industry destocking across the supply chain at the end of the year. The rapid destocking across the acetyl chain during the three months ended December 31, 2011 was a result of lower end-use demand in Europe due to European economic uncertainty which temporarily lowered volumes 1% compared to prior year. Favorable pricing for all major acetyl derivative product lines was achieved across all regions, reflecting the recovery of higher raw material costs for ethylene, methanol and carbon monoxide and a tight supply.
Operating profit increased $216 million for the year ended December 31, 2011 compared to the same period in 2010 . The increase in operating profit is primarily due to the increase in sales prices and impact of favorable foreign currency on sales which more than offset the decline in volumes and the impact of higher raw material, energy and other variable costs of 14%. During the year ended December 31, 2011 , we also received consideration of $17 million in connection with the settlement of a claim against a bankrupt supplier which was recorded to other (charges) gains, net. Depreciation and amortization for the year ended December 31, 2011 was less than in the prior year. In 2010 , $20 million of accelerated amortization was recorded to write-off the asset associated with a raw material purchase agreement with the bankrupt supplier. The increase in operating profit also reflects the reduction in exit costs related to our acetic acid and VAM production operations in Pardies, France of $8 million .
Other Activities
Other Activities primarily consists of corporate center costs, including financing and administrative activities, and our captive insurance companies.
The operating loss for Other Activities decreased $7 million for the year ended December 31, 2011 compared to the same period in 2010 primarily due to lower selling, general and administrative expenses and other (charges) gains, net. Selling, general and administrative expenses decreased $13 million primarily due to lower shared services costs, stock-based compensation costs and lower legal claims, slightly offset by strategic growth initiatives. Other (charges) gains, net changed $4
48
Year Ended December 31,
2011 2010 Change
(In $ millions, except percentages)
Net sales 3,551 3,082 469 Net sales variance
Volume (4) %
Price 16 %
Currency 3 %
Other — %
Other (charges) gains, net 14 (12 ) 26 Operating profit (loss) 459 243 216 Operating margin 12.9 % 7.9 %
Equity in net earnings (loss) of affiliates 5 5 — Earnings (loss) from continuing operations before tax 469 252 217 Depreciation and amortization 96 117 (21 )
million due to the resolution of a commercial dispute and the absence of insurance recovery payments. Offsetting these lower costs was the absence of the $14 million gain on the sale of an office building in 2010.
Liquidity and Capital Resources
Our primary source of liquidity is cash generated from operations, available cash and cash equivalents and dividends from our portfolio of strategic investments. In addition, as of December 31, 2012 we have $108 million available for borrowing under our credit-linked revolving facility and $600 million available under our revolving credit facility to assist in meeting our working capital needs and other contractual obligations, if required.
While our contractual obligations, commitments and debt service requirements over the next several years are significant, we continue to believe we will have available resources to meet our liquidity requirements, including debt service, in 2013 . If our cash flow from operations is insufficient to fund our debt service and other obligations, we may be required to use other means available to us such as increasing our borrowings, reducing or delaying capital expenditures, seeking additional capital or seeking to restructure or refinance our indebtedness. There can be no assurance, however, that we will continue to generate cash flows at or above current levels. As a result of the National Emission Standard for Hazardous Air Pollutants for Industrial, Commercial, and Institutional Boilers and Process Heaters ("Boiler MACT") regulations discussed in Item 1A. Risk Factors , we will be required to make significant capital expenditures to comply with stricter emissions requirements for industrial boilers and process heaters at our facilities in the next three to four years. In October 2012, we received approval to proceed with replacing the coal-fired boilers at our Narrows, Virginia site with new, natural gas-fired boilers. Our total investment is estimated at over $150 million. Upon approval of construction permits, we anticipate construction will begin in early 2013 with completion approximately 2 years later.
In June 2012, we announced our intent to build a new 1.3 million ton per year methanol plant in Clear Lake, Texas. The unit is expected to start up in mid-July 2015. We are currently evaluating various strategic alternatives that would allow us to share the off-take and minimize our portion of the capital expenditures of this planned facility.
In June 2011, we announced our plans to modify and enhance our existing integrated acetyl facility at the Nanjing Chemical Industrial Park with our TCX ® advanced technology. In March 2012, we received key government approvals necessary to proceed with our plans to modify and enhance our Nanjing facility. The unit is expected to startup in late 2013 with a capacity of approximately 275,000 tons per year. We also intend to construct one, and possibly two, additional industrial ethanol complexes in China, following necessary approvals, utilizing Celanese TCX ®
ethanol process technology to help supply applications for the growing Asia region.
In April 2010, we announced that, through our strategic affiliate Ibn Sina, we will construct a 50,000 ton POM production facility in Saudi Arabia. Our pro rata share of invested capital in the POM expansion is expected to total approximately $165 million over a five year period which began in late 2010.
Total cash outflows for capital expenditures, including the specific projects above, are expected to be in the range of $375 million to $400 million in 2013 .
On a stand-alone basis, Celanese and its immediate 100% owned subsidiary, Celanese US Holdings LLC ("Celanese US"), have no material assets other than the stock of their subsidiaries and no independent external operations of their own. Accordingly, they generally depend on the cash flow of their subsidiaries and their ability to pay dividends and make other distributions to Celanese and Celanese US in order to meet their obligations, including their obligations under senior credit facilities and senior notes and to pay dividends on Celanese Series A common stock.
Cash Flows
Cash and cash equivalents as of December 31, 2012 were $959 million , which is an increase of $277 million from December 31, 2011 . As of December 31, 2012 , $674 million of the $959 million of cash and cash equivalents was held by our foreign subsidiaries. If these funds are needed for our operations in the US, we may be required to accrue and pay US taxes to repatriate these funds. Our intent is to permanently reinvest these funds outside of the US, with the possible exception of funds that have been previously subject to US federal and state taxation. Our current plans do not demonstrate a need to repatriate cash held by our foreign subsidiaries in a taxable transaction to fund our US operations. Cash and cash equivalents as of December 31, 2011 were $682 million , which was a decrease of $58 million from December 31, 2010 .
49
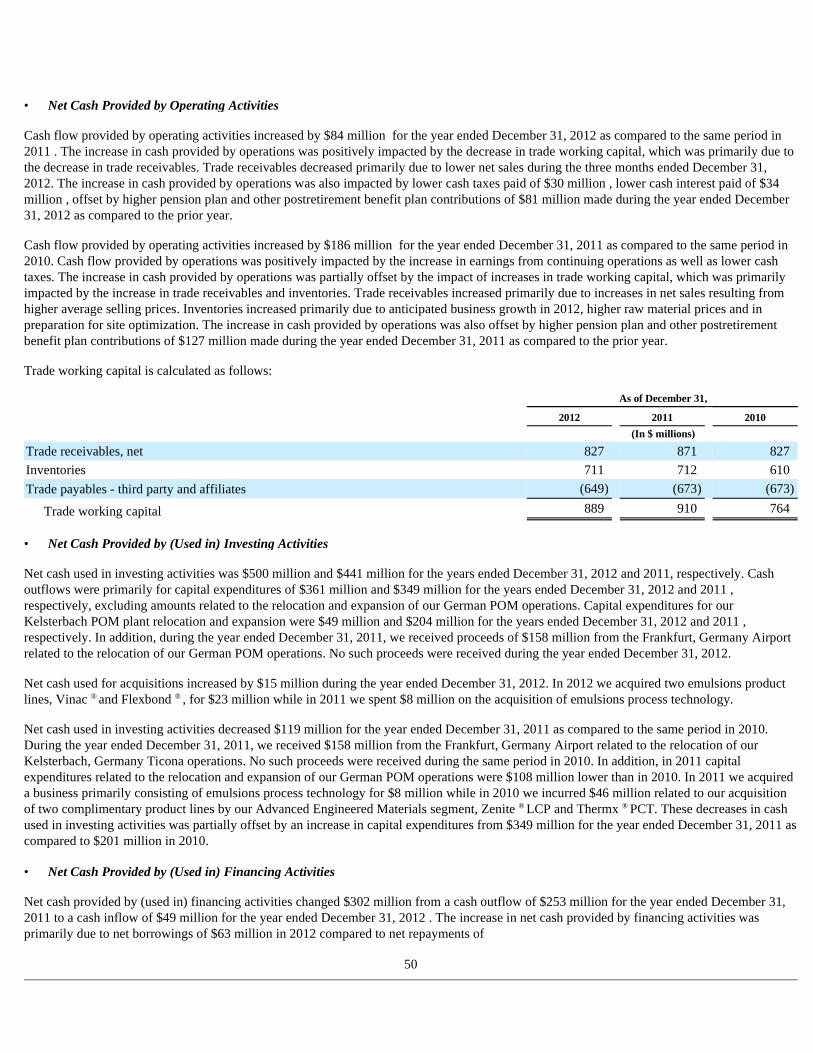
Cash flow provided by operating activities increased by $84 million for the year ended December 31, 2012 as compared to the same period in 2011 . The increase in cash provided by operations was positively impacted by the decrease in trade working capital, which was primarily due to the decrease in trade receivables. Trade receivables decreased primarily due to lower net sales during the three months ended December 31, 2012. The increase in cash provided by operations was also impacted by lower cash taxes paid of $30 million , lower cash interest paid of $34 million , offset by higher pension plan and other postretirement benefit plan contributions of $81 million made during the year ended December 31, 2012 as compared to the prior year.
Cash flow provided by operating activities increased by $186 million for the year ended December 31, 2011 as compared to the same period in 2010. Cash flow provided by operations was positively impacted by the increase in earnings from continuing operations as well as lower cash taxes. The increase in cash provided by operations was partially offset by the impact of increases in trade working capital, which was primarily impacted by the increase in trade receivables and inventories. Trade receivables increased primarily due to increases in net sales resulting from higher average selling prices. Inventories increased primarily due to anticipated business growth in 2012, higher raw material prices and in preparation for site optimization. The increase in cash provided by operations was also offset by higher pension plan and other postretirement benefit plan contributions of $127 million made during the year ended December 31, 2011 as compared to the prior year.
Trade working capital is calculated as follows:
Net cash used in investing activities was $500 million and $441 million for the years ended December 31, 2012 and 2011, respectively. Cash outflows were primarily for capital expenditures of $361 million and $349 million for the years ended December 31, 2012 and 2011 , respectively, excluding amounts related to the relocation and expansion of our German POM operations. Capital expenditures for our Kelsterbach POM plant relocation and expansion were $49 million and $204 million for the years ended December 31, 2012 and 2011 , respectively. In addition, during the year ended December 31, 2011, we received proceeds of $158 million from the Frankfurt, Germany Airport related to the relocation of our German POM operations. No such proceeds were received during the year ended December 31, 2012.
Net cash used for acquisitions increased by $15 million during the year ended December 31, 2012. In 2012 we acquired two emulsions product lines, Vinac ® and Flexbond ® , for $23 million while in 2011 we spent $8 million on the acquisition of emulsions process technology.
Net cash used in investing activities decreased $119 million for the year ended December 31, 2011 as compared to the same period in 2010. During the year ended December 31, 2011, we received $158 million from the Frankfurt, Germany Airport related to the relocation of our Kelsterbach, Germany Ticona operations. No such proceeds were received during the same period in 2010. In addition, in 2011 capital expenditures related to the relocation and expansion of our German POM operations were $108 million lower than in 2010. In 2011 we acquired a business primarily consisting of emulsions process technology for $8 million while in 2010 we incurred $46 million related to our acquisition of two complimentary product lines by our Advanced Engineered Materials segment, Zenite ® LCP and Thermx ® PCT. These decreases in cash used in investing activities was partially offset by an increase in capital expenditures from $349 million for the year ended December 31, 2011 as compared to $201 million in 2010.
Net cash provided by (used in) financing activities changed $302 million from a cash outflow of $253 million for the year ended December 31, 2011 to a cash inflow of $49 million for the year ended December 31, 2012 . The increase in net cash provided by financing activities was primarily due to net borrowings of $63 million in 2012 compared to net repayments of
50
• Net Cash Provided by Operating Activities
As of December 31,
2012 2011 2010
(In $ millions)
Trade receivables, net 827 871 827 Inventories 711 712 610 Trade payables - third party and affiliates (649 ) (673 ) (673 )
Trade working capital 889 910 764
• Net Cash Provided by (Used in) Investing Activities
• Net Cash Provided by (Used in) Financing Activities
$196 million in 2011. Net cash provided by financing activities also benefited from higher stock option exercises in 2012 of $62 million compared to $20 million of stock option exercises in 2011. On November 13, 2012, Celanese US completed an offering of $ 500 million in aggregate principal amount of 4.625% senior unsecured notes due 2022 (the " 4.625% Notes"). We used part of the proceeds from the 4.625% Notes to prepay $ 400 million of our outstanding Term C loan facility. The remaining proceeds, together with cash on hand, were used to make a $100 million contribution to our US pension plan. Net cash provided by (used in) financing activities changed $135 million from a cash outflow of $388 million for the year ended December 31, 2010 to a cash outflow of $253 million for the year ended December 31, 2011. The decrease in cash used in financing activities was primarily related to lower net borrowings and fewer stock repurchase transactions when compared to the same period in 2010 . In May 2011, we completed an offering of $400 million of 5.875% senior unsecured notes due 2021 (the " 5.875% Notes"). We used the proceeds from the issuance of the 5.875% Notes and cash on hand to prepay the outstanding balance of $516 million on our Term B loan facility. In addition, exchange rate effects on cash and cash equivalents were a favorable currency impact of $6 million in 2012 compared to unfavorable impacts of $2 million and $18 million for the years ended December 31, 2011 and 2010 , respectively.
Debt and Other Obligations
On November 13, 2012, Celanese US completed an offering of $ 500 million in aggregate principal amount of 4.625% senior unsecured notes due 2022 (the " 4.625% Notes") in a public offering registered under the Securities Act of 1933, as amended (the "Securities Act"). The 4.625% Notes are guaranteed on a senior unsecured basis by Celanese and each of the domestic subsidiaries of Celanese US that guarantee its obligations under its senior secured credit facilities (the "Subsidiary Guarantors").
The 4.625% Notes were issued under an indenture dated May 6, 2011, as amended by a second supplemental indenture, dated November 13, 2012 (the "Second Supplemental Indenture") among Celanese US, Celanese, the Subsidiary Guarantors and Wells Fargo Bank, National Association, as trustee. Celanese US will pay interest on the 4.625% Notes on March 15 and September 15 of each year commencing on March 15, 2013. Prior to November 15, 2022, Celanese US may redeem some or all of the 4.625% Notes at a redemption price of 100% of the principal amount, plus a "make-whole" premium as specified in the Second Supplemental Indenture, plus accrued and unpaid interest, if any, to the redemption date. The 4.625% Notes are senior unsecured obligations of Celanese US and rank equally in right of payment with all other unsubordinated indebtedness of Celanese US.
In May 2011 , Celanese US completed an offering of $400 million in aggregate principal amount of 5.875% senior unsecured notes due 2021 (the " 5.875% Notes") in a public offering registered under the Securities Act. The 5.875% Notes are guaranteed on a senior unsecured basis by Celanese and the Subsidiary Guarantors.
The 5.875% Notes were issued under an indenture and a first supplemental indenture, each dated May 6, 2011 (the "First Supplemental Indenture") among Celanese US, Celanese, the Subsidiary Guarantors and Wells Fargo Bank, National Association, as trustee. Celanese US pays interest on the 5.875% Notes on June 15 and December 15 of each year commencing on December 15, 2011 . Prior to June 15, 2021 , Celanese US may redeem some or all of the 5.875% Notes at a redemption price of 100% of the principal amount, plus a "make-whole" premium as specified in the First Supplemental Indenture, plus accrued and unpaid interest, if any, to the redemption date. The 5.875% Notes are senior unsecured obligations of Celanese US and rank equally in right of payment with all other unsubordinated indebtedness of Celanese US.
In September 2010, Celanese US completed the private placement of $600 million in aggregate principal amount of 6.625% senior unsecured notes due 2018 (the " 6.625% Notes") under an indenture dated September 24, 2010 (the "Indenture") among Celanese US, Celanese, the Subsidiary Guarantors and Wells Fargo Bank, National Association, as trustee. In April 2011, Celanese US registered the 6.625% Notes under the Securities Act. Celanese US pays interest on the 6.625% Notes on April 15 and October 15 of each year commencing on April 15, 2011. The 6.625% Notes are redeemable, in whole or in part, at any time on or after October 15, 2014 at the redemption prices specified in the Indenture. Prior to October 15, 2014, Celanese US may redeem some or all of the 6.625% Notes at a redemption price of 100% of the principal amount, plus a "make-whole" premium as specified in the Indenture, plus accrued and unpaid interest, if any, to the redemption date. The 6.625% Notes are senior unsecured obligations of Celanese US and rank equally in right of payment with all other unsubordinated indebtedness of Celanese US. The 6.625% Notes are guaranteed on a senior unsecured basis by Celanese and the Subsidiary Guarantors.
51
• Senior Notes
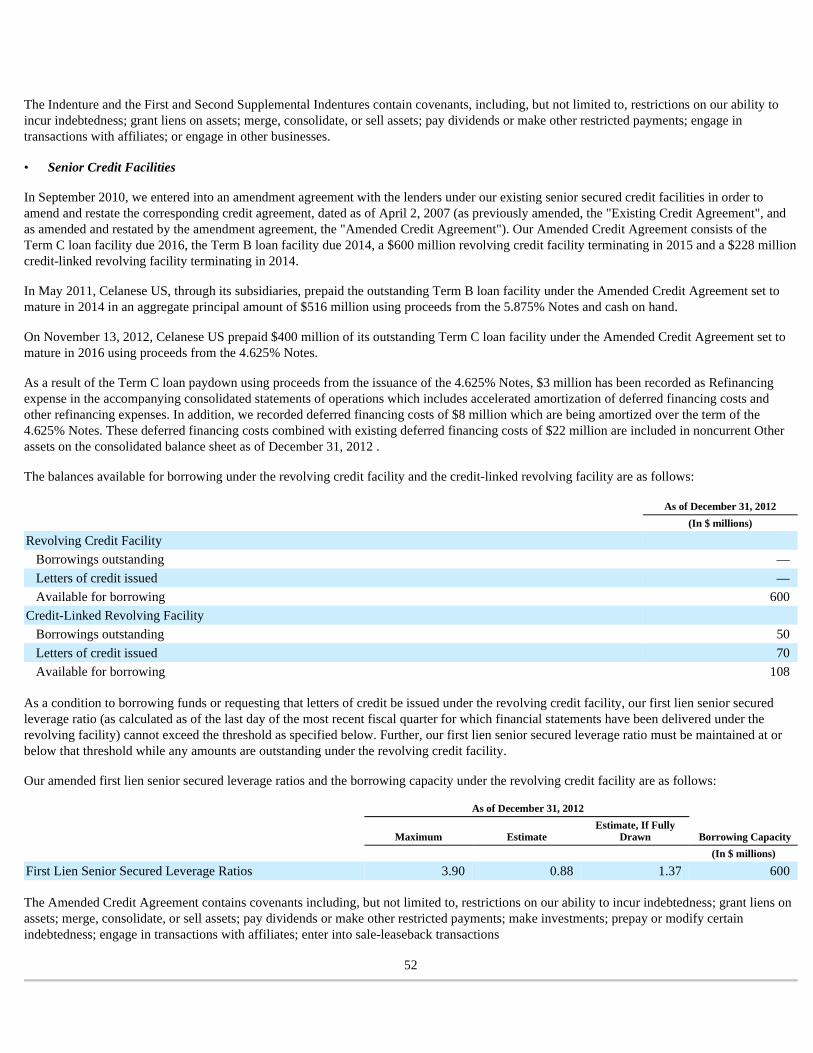
The Indenture and the First and Second Supplemental Indentures contain covenants, including, but not limited to, restrictions on our ability to incur indebtedness; grant liens on assets; merge, consolidate, or sell assets; pay dividends or make other restricted payments; engage in transactions with affiliates; or engage in other businesses.
In September 2010, we entered into an amendment agreement with the lenders under our existing senior secured credit facilities in order to amend and restate the corresponding credit agreement, dated as of April 2, 2007 (as previously amended, the "Existing Credit Agreement", and as amended and restated by the amendment agreement, the "Amended Credit Agreement"). Our Amended Credit Agreement consists of the Term C loan facility due 2016, the Term B loan facility due 2014, a $600 million revolving credit facility terminating in 2015 and a $228 million credit-linked revolving facility terminating in 2014.
In May 2011, Celanese US, through its subsidiaries, prepaid the outstanding Term B loan facility under the Amended Credit Agreement set to mature in 2014 in an aggregate principal amount of $516 million using proceeds from the 5.875% Notes and cash on hand.
On November 13, 2012, Celanese US prepaid $400 million of its outstanding Term C loan facility under the Amended Credit Agreement set to mature in 2016 using proceeds from the 4.625% Notes.
As a result of the Term C loan paydown using proceeds from the issuance of the 4.625% Notes, $3 million has been recorded as Refinancing expense in the accompanying consolidated statements of operations which includes accelerated amortization of deferred financing costs and other refinancing expenses. In addition, we recorded deferred financing costs of $8 million which are being amortized over the term of the 4.625% Notes. These deferred financing costs combined with existing deferred financing costs of $22 million are included in noncurrent Other assets on the consolidated balance sheet as of December 31, 2012 .
The balances available for borrowing under the revolving credit facility and the credit-linked revolving facility are as follows:
As a condition to borrowing funds or requesting that letters of credit be issued under the revolving credit facility, our first lien senior secured leverage ratio (as calculated as of the last day of the most recent fiscal quarter for which financial statements have been delivered under the revolving facility) cannot exceed the threshold as specified below. Further, our first lien senior secured leverage ratio must be maintained at or below that threshold while any amounts are outstanding under the revolving credit facility.
Our amended first lien senior secured leverage ratios and the borrowing capacity under the revolving credit facility are as follows:
The Amended Credit Agreement contains covenants including, but not limited to, restrictions on our ability to incur indebtedness; grant liens on assets; merge, consolidate, or sell assets; pay dividends or make other restricted payments; make investments; prepay or modify certain indebtedness; engage in transactions with affiliates; enter into sale-leaseback transactions
52
• Senior Credit Facilities
As of December 31, 2012
(In $ millions)
Revolving Credit Facility Borrowings outstanding — Letters of credit issued — Available for borrowing 600
Credit-Linked Revolving Facility
Borrowings outstanding 50 Letters of credit issued 70 Available for borrowing 108
As of December 31, 2012
Maximum Estimate Estimate, If Fully
Drawn Borrowing Capacity
(In $ millions)
First Lien Senior Secured Leverage Ratios 3.90 0.88 1.37 600
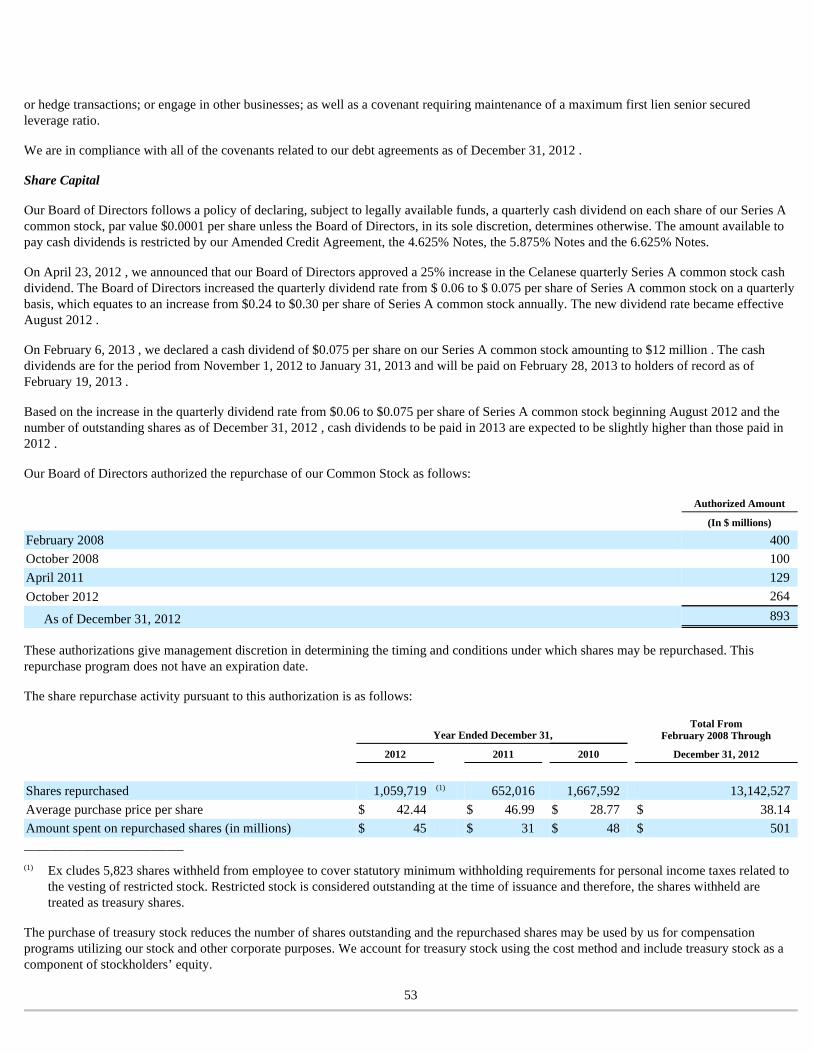
or hedge transactions; or engage in other businesses; as well as a covenant requiring maintenance of a maximum first lien senior secured leverage ratio.
We are in compliance with all of the covenants related to our debt agreements as of December 31, 2012 .
Share Capital
Our Board of Directors follows a policy of declaring, subject to legally available funds, a quarterly cash dividend on each share of our Series A common stock, par value $0.0001 per share unless the Board of Directors, in its sole discretion, determines otherwise. The amount available to pay cash dividends is restricted by our Amended Credit Agreement, the 4.625% Notes, the 5.875% Notes and the 6.625% Notes.
On April 23, 2012 , we announced that our Board of Directors approved a 25% increase in the Celanese quarterly Series A common stock cash dividend. The Board of Directors increased the quarterly dividend rate from $ 0.06 to $ 0.075 per share of Series A common stock on a quarterly basis, which equates to an increase from $0.24 to $0.30 per share of Series A common stock annually. The new dividend rate became effective August 2012 .
On February 6, 2013 , we declared a cash dividend of $0.075 per share on our Series A common stock amounting to $12 million . The cash dividends are for the period from November 1, 2012 to January 31, 2013 and will be paid on February 28, 2013 to holders of record as of February 19, 2013 .
Based on the increase in the quarterly dividend rate from $0.06 to $0.075 per share of Series A common stock beginning August 2012 and the number of outstanding shares as of December 31, 2012 , cash dividends to be paid in 2013 are expected to be slightly higher than those paid in 2012 .
Our Board of Directors authorized the repurchase of our Common Stock as follows:
These authorizations give management discretion in determining the timing and conditions under which shares may be repurchased. This repurchase program does not have an expiration date.
The share repurchase activity pursuant to this authorization is as follows:
______________________________
The purchase of treasury stock reduces the number of shares outstanding and the repurchased shares may be used by us for compensation programs utilizing our stock and other corporate purposes. We account for treasury stock using the cost method and include treasury stock as a component of stockholders’ equity.
53
Authorized Amount
(In $ millions)
February 2008 400 October 2008 100 April 2011 129 October 2012 264
As of December 31, 2012 893
Year Ended December 31, Total From
February 2008 Through
2012 2011 2010 December 31, 2012
Shares repurchased 1,059,719 (1) 652,016 1,667,592 13,142,527 Average purchase price per share $ 42.44 $ 46.99 $ 28.77 $ 38.14 Amount spent on repurchased shares (in millions) $ 45 $ 31 $ 48 $ 501
(1) Ex cludes 5,823 shares withheld from employee to cover statutory minimum withholding requirements for personal income taxes related to the vesting of restricted stock. Restricted stock is considered outstanding at the time of issuance and therefore, the shares withheld are treated as treasury shares.
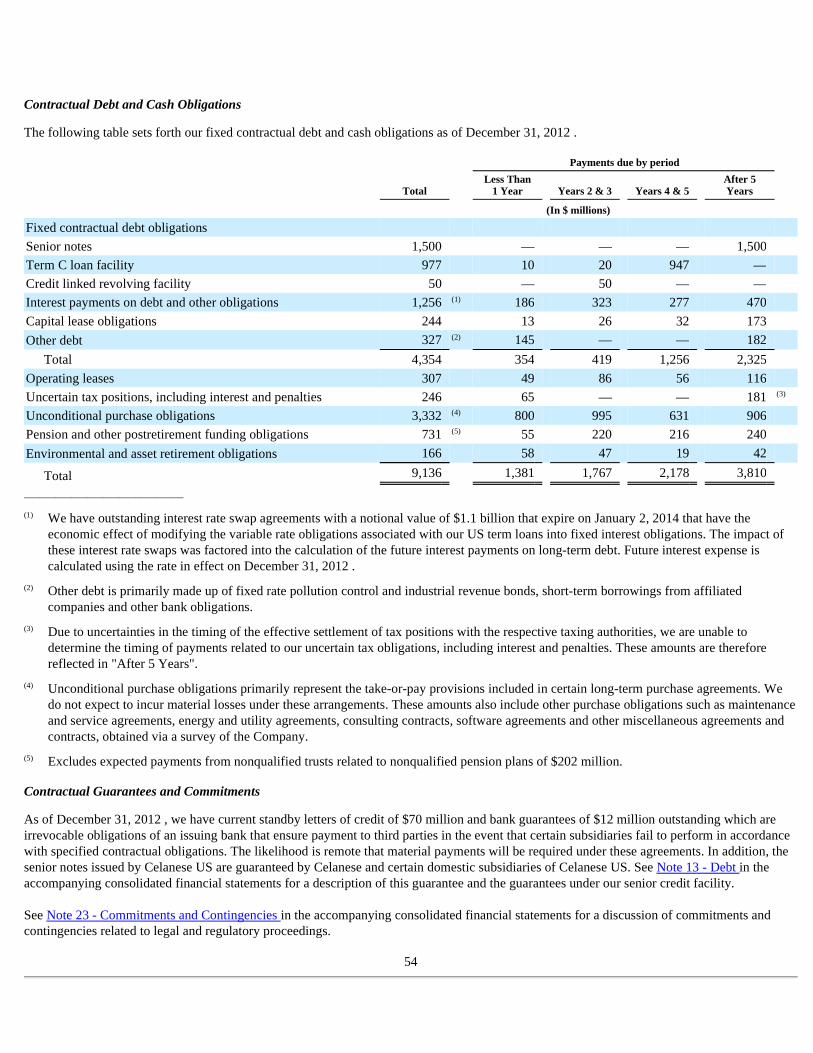
Contractual Debt and Cash Obligations
The following table sets forth our fixed contractual debt and cash obligations as of December 31, 2012 .
______________________________
Contractual Guarantees and Commitments
As of December 31, 2012 , we have current standby letters of credit of $70 million and bank guarantees of $12 million outstanding which are irrevocable obligations of an issuing bank that ensure payment to third parties in the event that certain subsidiaries fail to perform in accordance with specified contractual obligations. The likelihood is remote that material payments will be required under these agreements. In addition, the senior notes issued by Celanese US are guaranteed by Celanese and certain domestic subsidiaries of Celanese US. See Note 13 - Debt in the accompanying consolidated financial statements for a description of this guarantee and the guarantees under our senior credit facility. See Note 23 - Commitments and Contingencies in the accompanying consolidated financial statements for a discussion of commitments and contingencies related to legal and regulatory proceedings.
54
Payments due by period
Total Less Than
1 Year Years 2 & 3 Years 4 & 5 After 5 Years
(In $ millions)
Fixed contractual debt obligations
Senior notes 1,500 — — — 1,500
Term C loan facility 977 10 20 947 —
Credit linked revolving facility 50 — 50 — —
Interest payments on debt and other obligations 1,256 (1) 186 323 277 470
Capital lease obligations 244 13 26 32 173
Other debt 327 (2) 145 — — 182
Total 4,354 354 419 1,256 2,325
Operating leases 307 49 86 56 116
Uncertain tax positions, including interest and penalties 246 65 — — 181 (3)
Unconditional purchase obligations 3,332 (4) 800 995 631 906
Pension and other postretirement funding obligations 731 (5) 55 220 216 240
Environmental and asset retirement obligations 166 58 47 19 42
Total 9,136 1,381 1,767 2,178 3,810
(1) We have outstanding interest rate swap agreements with a notional value of $1.1 billion that expire on January 2, 2014 that have the economic effect of modifying the variable rate obligations associated with our US term loans into fixed interest obligations. The impact of these interest rate swaps was factored into the calculation of the future interest payments on long-term debt. Future interest expense is calculated using the rate in effect on December 31, 2012 .
(2) Other debt is primarily made up of fixed rate pollution control and industrial revenue bonds, short-term borrowings from affiliated companies and other bank obligations.
(3) Due to uncertainties in the timing of the effective settlement of tax positions with the respective taxing authorities, we are unable to determine the timing of payments related to our uncertain tax obligations, including interest and penalties. These amounts are therefore reflected in "After 5 Years".
(4) Unconditional purchase obligations primarily represent the take-or-pay provisions included in certain long-term purchase agreements. We do not expect to incur material losses under these arrangements. These amounts also include other purchase obligations such as maintenance and service agreements, energy and utility agreements, consulting contracts, software agreements and other miscellaneous agreements and contracts, obtained via a survey of the Company.
(5) Excludes expected payments from nonqualified trusts related to nonqualified pension plans of $202 million.
Off-Balance Sheet Arrangements
We have not entered into any material off-balance sheet arrangements.
Market Risks
Please see Item 7A. Quantitative and Qualitative Disclosure about Market Risk of this Form 10-K for additional information about our Market Risks.
Critical Accounting Policies and Estimates
Our consolidated financial statements are based on the selection and application of significant accounting policies. The preparation of consolidated financial statements in conformity with US Generally Accepted Accounting Principles ("US GAAP") requires management to make estimates and assumptions that affect the reported amounts of assets and liabilities, disclosure of contingent assets and liabilities at the date of the consolidated financial statements and the reported amounts of revenues, expenses and allocated charges during the reporting period. Actual results could differ from those estimates. However, we are not currently aware of any reasonably likely events or circumstances that would result in materially different results.
We believe the following accounting policies and estimates are critical to understanding the financial reporting risks present in the current economic environment. These matters, and the judgments and uncertainties affecting them, are also essential to understanding our reported and future operating results. See Note 2 - Summary of Accounting Policies in the accompanying consolidated financial statements for further discussion of our significant accounting policies.
Recoverability of Goodwill and Indefinite-Lived Assets
We test for impairment of goodwill at the reporting unit level. Our reporting units are either our operating business segments or one level below our operating business segments for which discrete financial information is available and for which operating results are regularly reviewed by business segment management and the chief operating decision maker. Our operating business segments have been designated as our reporting units and include Advanced Engineered Materials, Acetate Products, Nutrinova, Emulsions, Celanese EVA Performance Polymers and Acetyl Intermediates businesses. We assess the recoverability of the carrying value of our goodwill and other indefinite-lived intangible assets annually during the third quarter of our fiscal year using June 30 balances or whenever events or changes in circumstances indicate that the carrying amount of the asset may not be fully recoverable. Recoverability of goodwill and other indefinite-lived intangible assets is measured using a discounted cash flow model incorporating discount rates commensurate with the risks involved for each reporting unit. Use of a discounted cash flow model is common practice in impairment testing in the absence of available transactional market evidence to determine the fair value.
The key assumptions used in the discounted cash flow valuation model include discount rates, growth rates, cash flow projections and terminal value rates. Discount rates, growth rates and cash flow projections are the most sensitive and susceptible to change as they require significant management judgment. Discount rates are determined by using a weighted average cost of capital ("WACC"). The WACC considers market and industry data as well as company-specific risk factors for each reporting unit in determining the appropriate discount rate to be used. The discount rate utilized for each reporting unit is indicative of the return an investor would expect to receive for investing in such a business. Operational management, considering industry and company-specific historical and projected data, develops growth rates and cash flow projections for each reporting unit. Terminal value rate determination follows common methodology of capturing the present value of perpetual cash flow estimates beyond the last projected period assuming a constant WACC and low long-term growth rates. If the calculated fair value is less than the current carrying value, impairment of the reporting unit may exist. If the recoverability test indicates potential impairment, we calculate an implied fair value of goodwill for the reporting unit. The implied fair value of goodwill is determined in a manner similar to how goodwill is calculated in a business combination. If the implied fair value of goodwill exceeds the carrying value of goodwill assigned to the reporting unit, there is no impairment. If the carrying value of goodwill assigned to a reporting unit exceeds the implied fair value of the goodwill, an impairment charge is recorded to write down the carrying value. An impairment loss cannot exceed the carrying value of goodwill assigned to a reporting unit but may indicate certain long-lived and amortizable intangible assets associated with the reporting unit may require additional impairment testing.
55
• Recoverability of Long-Lived Assets
Management tests indefinite-lived intangible assets utilizing the relief from royalty method to determine the estimated fair value for each indefinite-lived intangible asset. The relief from royalty method estimates the Company's theoretical royalty savings from ownership of the intangible asset. Key assumptions used in this model include discount rates, royalty rates, growth rates, sales projections and terminal value rates. Discount rates, royalty rates, growth rates and sales projections are the assumptions most sensitive and susceptible to change as they require significant management judgment. Discount rates used are similar to the rates estimated by the WACC considering any differences in company-specific risk factors. Royalty rates are established by management and are periodically substantiated by third-party valuation consultants. Operational management, considering industry and company-specific historical and projected data, develops growth rates and sales projections associated with each indefinite-lived intangible asset. Terminal value rate determination follows common methodology of capturing the present value of perpetual sales estimates beyond the last projected period assuming a constant WACC and low long-term growth rates.
For all significant goodwill and indefinite-lived intangible assets, the estimated fair value of the asset exceeded the carrying value of the asset by a substantial margin at the date of the most recent impairment test.
Recoverability of Long-Lived and Amortizable Intangible Assets
We assess the recoverability of long-lived and amortizable intangible assets whenever events or circumstances indicate that the carrying value of the asset may not be recoverable. Examples of a change in events or circumstances include, but are not limited to, a decrease in the market price of the asset, a history of cash flow losses related to the use of the asset or a significant adverse change in the extent or manner in which an asset is being used. To assess the recoverability of long-lived and amortizable intangible assets we compare the carrying amount of the asset or group of assets to the future net undiscounted cash flows expected to be generated by the asset or asset group. Long-lived and amortizable intangible assets are tested for recognition and measurement of an impairment loss at the lowest level for which identifiable cash flows are largely independent of the cash flows of other assets and liabilities. If such assets are considered impaired, the impairment recognized is measured as the amount by which the carrying amount of the asset exceeds the fair value of the asset.
The development of future net undiscounted cash flow projections require management projections related to sales and profitability trends and the remaining useful life of the asset. Projections of sales and profitability trends are the assumptions most sensitive and susceptible to change as they require significant management judgment. These projections are consistent with projections we use to manage our operations internally. When impairment is indicated, a discounted cash flow valuation model similar to that used to value goodwill at the reporting unit level, incorporating discount rates commensurate with risks associated with each asset, is used to determine the fair value of the asset to measure potential impairment. We believe the assumptions used are reflective of what a market participant would have used in calculating fair value.
Valuation methodologies utilized to evaluate goodwill and indefinite-lived intangible, amortizable intangible and long-lived assets for impairment were consistent with prior periods. We periodically engage third-party valuation consultants to assist us with this process. Specific assumptions discussed above are updated at the date of each test to consider current industry and company-specific risk factors from the perspective of a market participant. The current business environment is subject to evolving market conditions and requires significant management judgment to interpret the potential impact to the Company's assumptions. To the extent that changes in the current business environment result in adjusted management projections, impairment losses may occur in future periods.
We regularly review our deferred tax assets for recoverability and establish a valuation allowance if needed based on historical taxable income, projected future taxable income, applicable tax planning strategies, and the expected timing of the reversals of existing temporary differences. A valuation allowance is provided when it is more likely than not that some portion or all of the deferred tax assets will not be realized. In forming our judgment regarding the recoverability of deferred tax assets related to deductible temporary differences and tax attribute carryforwards, we give weight to positive and negative evidence based on the extent to which the forms of evidence can be objectively verified. We attach the most weight to historical earnings due to its verifiable nature. Weight is attached to tax planning strategies if the strategies are prudent and feasible and implementable without significant obstacles. Less weight is attached to forecasted future earnings due to its subjective nature, and expected timing of reversal of taxable temporary differences is given little weight unless the reversal of taxable and deductible temporary differences coincide. Valuation allowances are established primarily on net operating loss carryforwards and other deferred tax assets in the US, Luxembourg, France, Spain, China, the United Kingdom and Canada. We have appropriately reflected increases and decreases in our valuation allowance based on the overall weight of positive versus negative evidence on a jurisdiction by jurisdiction basis.
56
• Income Taxes
We record accruals for income taxes and associated interest that may become payable in future years as a result of audits by tax authorities. We recognize tax benefits when it is more likely than not (likelihood of greater than 50%), based on technical merits, that the position will be sustained upon examination. Tax positions that meet the more-likely-than-not threshold are measured using a probability weighted approach as the largest amount of tax benefit that is greater than 50% likely of being realized upon settlement. Whether the more-likely-than-not recognition threshold is met for a tax position is a matter of judgment based on the individual facts and circumstances of that position evaluated in light of all available evidence.
The recoverability of deferred tax assets and the recognition and measurement of uncertain tax positions are subject to various assumptions and management judgment. If actual results differ from the estimates made by management in establishing or maintaining valuation allowances against deferred tax assets, the resulting change in the valuation allowance would generally impact earnings or Other comprehensive income depending on the nature of the respective deferred tax asset. In addition, the positions taken with regard to tax contingencies may be subject to audit and review by tax authorities which may result in future taxes, interest and penalties.
We have pension and other postretirement benefit plans covering substantially all employees who meet eligibility requirements. With respect to its US qualified defined benefit pension plan, minimum funding requirements are determined by the Pension Protection Act of 2006. Various assumptions are used in the calculation of the actuarial valuation of the employee benefit plans. These assumptions include the discount rate, compensation levels, expected long-term rates of return on plan assets and trends in health care costs. In addition to the above mentioned assumptions, actuarial consultants use factors such as withdrawal and mortality rates to estimate the projected benefit obligation. The actuarial assumptions used may differ materially from actual results due to changing market and economic conditions, higher or lower withdrawal rates or longer or shorter life spans of participants. These differences may result in a significant impact to the amount of net periodic benefit cost recorded in future periods.
The amounts recognized in the consolidated financial statements related to pension and other postretirement benefits are determined on an actuarial basis. A significant assumption used in determining our net periodic benefit cost is the expected long-term rate of return on plan assets. As of December 31, 2012 , we assumed an expected long-term rate of return on plan assets of 8.5% for the US defined benefit pension plans, which represent approximately 83% and 84% of our fair value of pension plan assets and projected benefit obligation, respectively. On average, the actual return on the US qualified defined pension plans' assets over the long-term (20 years) has exceeded 8.5%.
Another estimate that affects our pension and other postretirement net periodic benefit cost is the discount rate used in the annual actuarial valuations of pension and other postretirement benefit plan obligations. At the end of each year, we determine the appropriate discount rate, used to determine the present value of future cash flows currently expected to be required to settle the pension and other postretirement benefit obligations. The discount rate is generally based on the yield on high-quality corporate fixed-income securities. As of December 31, 2012 , we decreased the discount rate to 3.8% from 4.6% as of December 31, 2011 for the US plans.
Other postretirement benefit plans provide medical and life insurance benefits to retirees who meet minimum age and service requirements. The key determinants of the accumulated postretirement benefit obligation ("APBO") are the discount rate and the health care cost trend rate. The health care cost trend rate has a significant effect on the reported amounts of APBO and related expense.
Pension assumptions are reviewed annually on a plan and country-specific basis by third-party actuaries and senior management. Such assumptions are adjusted as appropriate to reflect changes in market rates and outlook. We determine the long-term expected rate of return on plan assets by considering the current target asset allocation, as well as the historical and expected rates of return on various asset categories in which the plans are invested. A single long-term expected rate of return on plan assets is then calculated for each plan as the weighted average of the target asset allocation and the long-term expected rate of return assumptions for each asset category within each plan.
Differences between actual rates of return of plan assets and the long-term expected rate of return on plan assets are generally not recognized in net periodic benefit cost in the year that the difference occurs. These differences are deferred and amortized into net periodic benefit cost over the average remaining future service of employees. We apply the long-term expected rate of return on plan assets to a market-related value of plan assets to stabilize variability in the plan asset values.
57
• Benefit Obligations
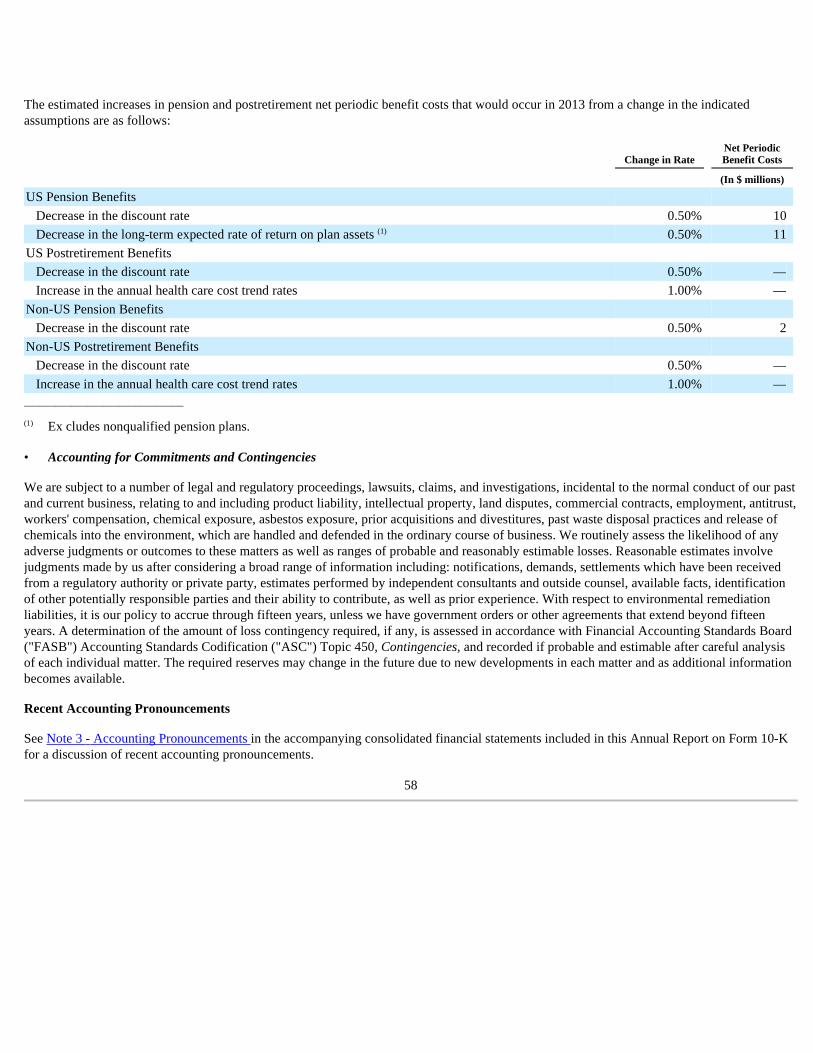
The estimated increases in pension and postretirement net periodic benefit costs that would occur in 2013 from a change in the indicated assumptions are as follows:
______________________________
We are subject to a number of legal and regulatory proceedings, lawsuits, claims, and investigations, incidental to the normal conduct of our past and current business, relating to and including product liability, intellectual property, land disputes, commercial contracts, employment, antitrust, workers' compensation, chemical exposure, asbestos exposure, prior acquisitions and divestitures, past waste disposal practices and release of chemicals into the environment, which are handled and defended in the ordinary course of business. We routinely assess the likelihood of any adverse judgments or outcomes to these matters as well as ranges of probable and reasonably estimable losses. Reasonable estimates involve judgments made by us after considering a broad range of information including: notifications, demands, settlements which have been received from a regulatory authority or private party, estimates performed by independent consultants and outside counsel, available facts, identification of other potentially responsible parties and their ability to contribute, as well as prior experience. With respect to environmental remediation liabilities, it is our policy to accrue through fifteen years, unless we have government orders or other agreements that extend beyond fifteen years. A determination of the amount of loss contingency required, if any, is assessed in accordance with Financial Accounting Standards Board ("FASB") Accounting Standards Codification ("ASC") Topic 450, Contingencies, and recorded if probable and estimable after careful analysis of each individual matter. The required reserves may change in the future due to new developments in each matter and as additional information becomes available.
Recent Accounting Pronouncements
See Note 3 - Accounting Pronouncements in the accompanying consolidated financial statements included in this Annual Report on Form 10-K for a discussion of recent accounting pronouncements.
58
Change in Rate Net Periodic Benefit Costs
(In $ millions)
US Pension Benefits
Decrease in the discount rate 0.50 % 10 Decrease in the long-term expected rate of return on plan assets (1) 0.50 % 11
US Postretirement Benefits
Decrease in the discount rate 0.50 % — Increase in the annual health care cost trend rates 1.00 % —
Non-US Pension Benefits
Decrease in the discount rate 0.50 % 2 Non-US Postretirement Benefits
Decrease in the discount rate 0.50 % — Increase in the annual health care cost trend rates 1.00 % —
(1) Ex cludes nonqualified pension plans.
• Accounting for Commitments and Contingencies
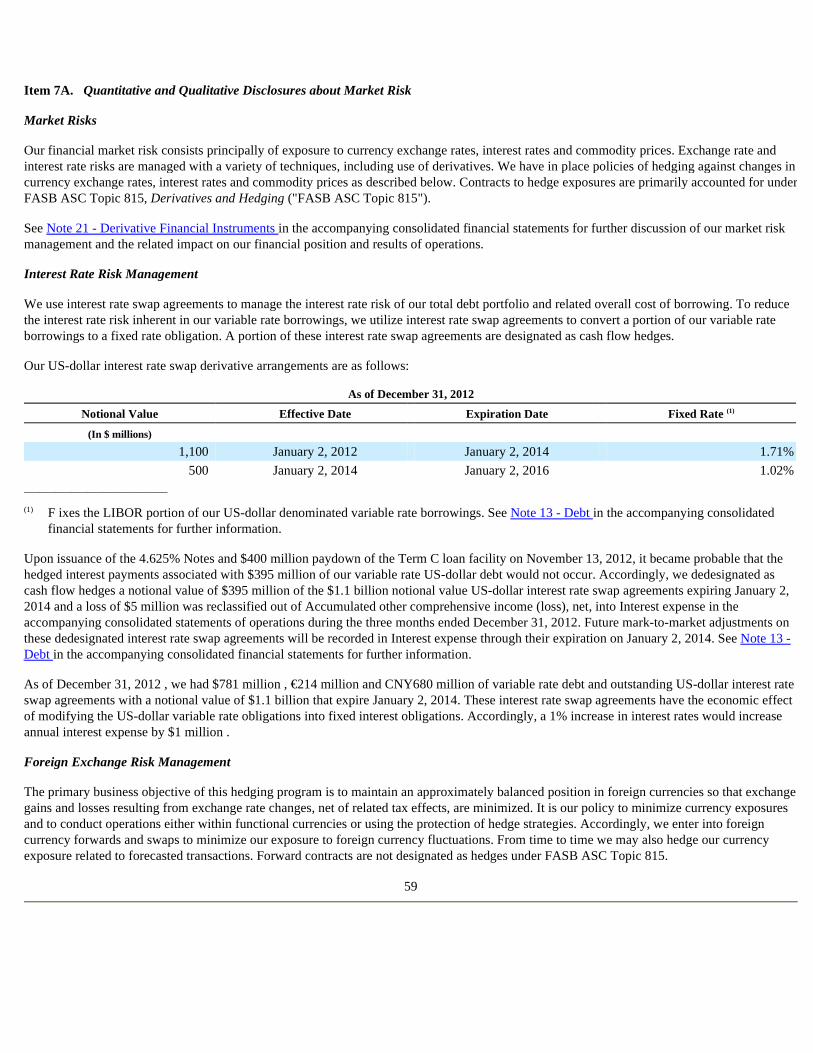
Item 7A. Quantitative and Qualitative Disclosures about Market Risk
Market Risks
Our financial market risk consists principally of exposure to currency exchange rates, interest rates and commodity prices. Exchange rate and interest rate risks are managed with a variety of techniques, including use of derivatives. We have in place policies of hedging against changes in currency exchange rates, interest rates and commodity prices as described below. Contracts to hedge exposures are primarily accounted for under FASB ASC Topic 815, Derivatives and Hedging ("FASB ASC Topic 815").
See Note 21 - Derivative Financial Instruments in the accompanying consolidated financial statements for further discussion of our market risk management and the related impact on our financial position and results of operations.
Interest Rate Risk Management
We use interest rate swap agreements to manage the interest rate risk of our total debt portfolio and related overall cost of borrowing. To reduce the interest rate risk inherent in our variable rate borrowings, we utilize interest rate swap agreements to convert a portion of our variable rate borrowings to a fixed rate obligation. A portion of these interest rate swap agreements are designated as cash flow hedges.
Our US-dollar interest rate swap derivative arrangements are as follows:
___________________________
Upon issuance of the 4.625% Notes and $400 million paydown of the Term C loan facility on November 13, 2012, it became probable that the hedged interest payments associated with $395 million of our variable rate US-dollar debt would not occur. Accordingly, we dedesignated as cash flow hedges a notional value of $395 million of the $1.1 billion notional value US-dollar interest rate swap agreements expiring January 2, 2014 and a loss of $5 million was reclassified out of Accumulated other comprehensive income (loss), net, into Interest expense in the accompanying consolidated statements of operations during the three months ended December 31, 2012. Future mark-to-market adjustments on these dedesignated interest rate swap agreements will be recorded in Interest expense through their expiration on January 2, 2014. See Note 13 - Debt in the accompanying consolidated financial statements for further information.
As of December 31, 2012 , we had $781 million , €214 million and CNY680 million of variable rate debt and outstanding US-dollar interest rate swap agreements with a notional value of $1.1 billion that expire January 2, 2014. These interest rate swap agreements have the economic effect of modifying the US-dollar variable rate obligations into fixed interest obligations. Accordingly, a 1% increase in interest rates would increase annual interest expense by $1 million .
Foreign Exchange Risk Management
The primary business objective of this hedging program is to maintain an approximately balanced position in foreign currencies so that exchange gains and losses resulting from exchange rate changes, net of related tax effects, are minimized. It is our policy to minimize currency exposures and to conduct operations either within functional currencies or using the protection of hedge strategies. Accordingly, we enter into foreign currency forwards and swaps to minimize our exposure to foreign currency fluctuations. From time to time we may also hedge our currency exposure related to forecasted transactions. Forward contracts are not designated as hedges under FASB ASC Topic 815.
59
As of December 31, 2012
Notional Value Effective Date Expiration Date Fixed Rate (1)
(In $ millions) 1,100 January 2, 2012 January 2, 2014 1.71 %
500 January 2, 2014 January 2, 2016 1.02 %
(1) F ixes the LIBOR portion of our US-dollar denominated variable rate borrowings. See Note 13 - Debt in the accompanying consolidated financial statements for further information.
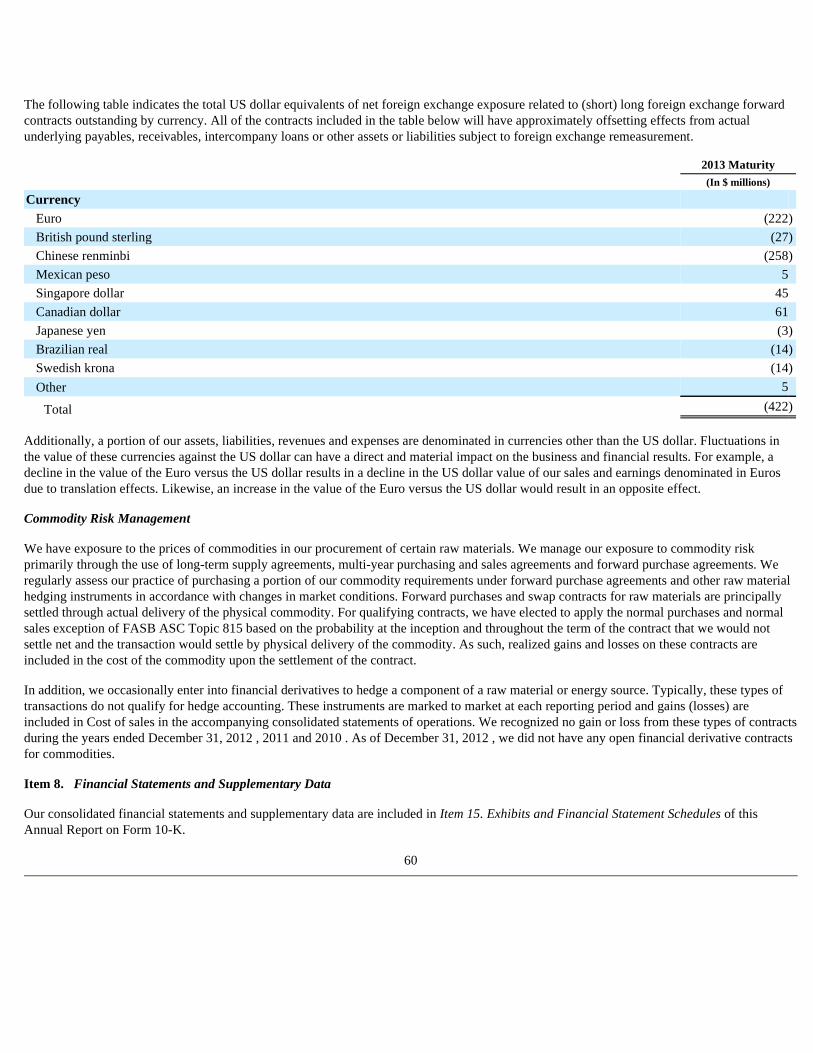
The following table indicates the total US dollar equivalents of net foreign exchange exposure related to (short) long foreign exchange forward contracts outstanding by currency. All of the contracts included in the table below will have approximately offsetting effects from actual underlying payables, receivables, intercompany loans or other assets or liabilities subject to foreign exchange remeasurement.
Additionally, a portion of our assets, liabilities, revenues and expenses are denominated in currencies other than the US dollar. Fluctuations in the value of these currencies against the US dollar can have a direct and material impact on the business and financial results. For example, a decline in the value of the Euro versus the US dollar results in a decline in the US dollar value of our sales and earnings denominated in Euros due to translation effects. Likewise, an increase in the value of the Euro versus the US dollar would result in an opposite effect.
Commodity Risk Management
We have exposure to the prices of commodities in our procurement of certain raw materials. We manage our exposure to commodity risk primarily through the use of long-term supply agreements, multi-year purchasing and sales agreements and forward purchase agreements. We regularly assess our practice of purchasing a portion of our commodity requirements under forward purchase agreements and other raw material hedging instruments in accordance with changes in market conditions. Forward purchases and swap contracts for raw materials are principally settled through actual delivery of the physical commodity. For qualifying contracts, we have elected to apply the normal purchases and normal sales exception of FASB ASC Topic 815 based on the probability at the inception and throughout the term of the contract that we would not settle net and the transaction would settle by physical delivery of the commodity. As such, realized gains and losses on these contracts are included in the cost of the commodity upon the settlement of the contract.
In addition, we occasionally enter into financial derivatives to hedge a component of a raw material or energy source. Typically, these types of transactions do not qualify for hedge accounting. These instruments are marked to market at each reporting period and gains (losses) are included in Cost of sales in the accompanying consolidated statements of operations. We recognized no gain or loss from these types of contracts during the years ended December 31, 2012 , 2011 and 2010 . As of December 31, 2012 , we did not have any open financial derivative contracts for commodities.
Item 8. Financial Statements and Supplementary Data
Our consolidated financial statements and supplementary data are included in Item 15. Exhibits and Financial Statement Schedules of this Annual Report on Form 10-K.
60
2013 Maturity (In $ millions)
Currency Euro (222 )
British pound sterling (27 )
Chinese renminbi (258 )
Mexican peso 5 Singapore dollar 45 Canadian dollar 61 Japanese yen (3 )
Brazilian real (14 )
Swedish krona (14 )
Other 5
Total (422 )
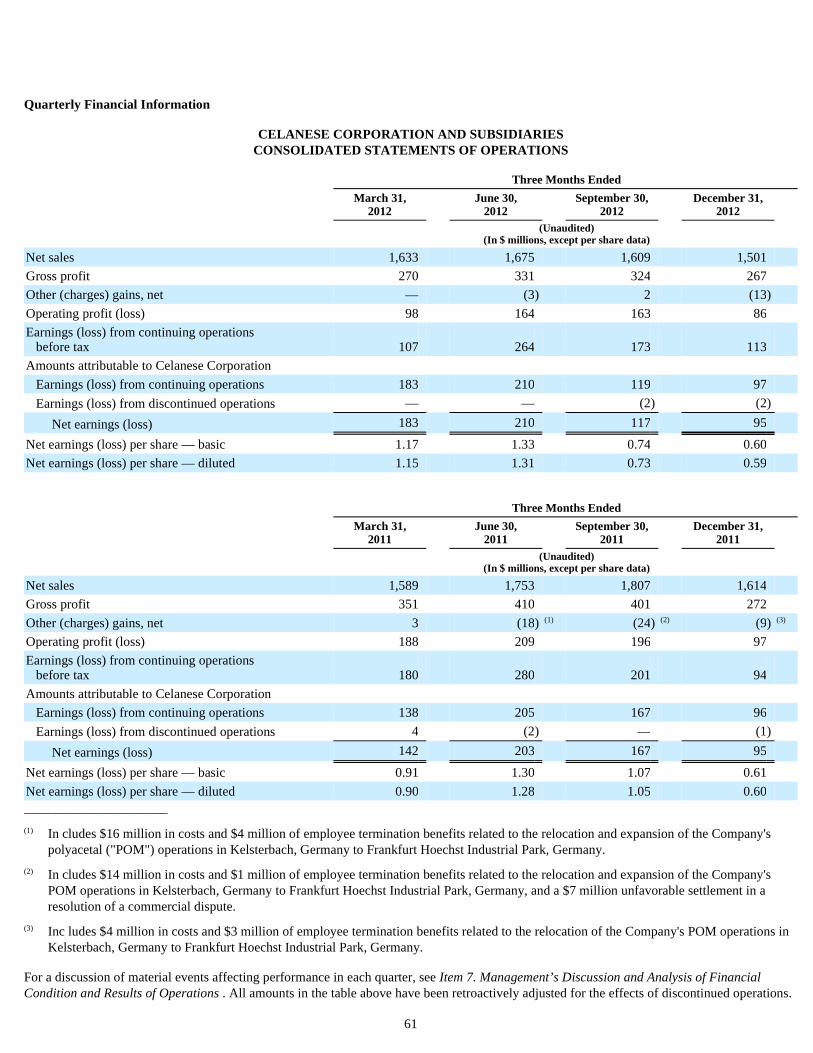
Quarterly Financial Information
CELANESE CORPORATION AND SUBSIDIARIES CONSOLIDATED STATEMENTS OF OPERATIONS
___________________________
For a discussion of material events affecting performance in each quarter, see Item 7. Management’s Discussion and Analysis of Financial Condition and Results of Operations . All amounts in the table above have been retroactively adjusted for the effects of discontinued operations.
61
Three Months Ended
March 31,
2012 June 30,
2012 September 30,
2012 December 31,
2012
(Unaudited)
(In $ millions, except per share data)
Net sales 1,633 1,675 1,609 1,501
Gross profit 270 331 324 267
Other (charges) gains, net — (3 ) 2 (13 )
Operating profit (loss) 98 164 163 86
Earnings (loss) from continuing operations before tax 107 264 173 113
Amounts attributable to Celanese Corporation
Earnings (loss) from continuing operations 183 210 119 97
Earnings (loss) from discontinued operations — — (2 ) (2 )
Net earnings (loss) 183 210 117 95
Net earnings (loss) per share — basic 1.17 1.33 0.74 0.60
Net earnings (loss) per share — diluted 1.15 1.31 0.73 0.59
Three Months Ended
March 31,
2011 June 30,
2011 September 30,
2011 December 31,
2011
(Unaudited)
(In $ millions, except per share data)
Net sales 1,589 1,753 1,807 1,614
Gross profit 351 410 401 272
Other (charges) gains, net 3 (18 ) (1) (24 ) (2) (9 ) (3)
Operating profit (loss) 188 209 196 97
Earnings (loss) from continuing operations before tax 180 280 201 94
Amounts attributable to Celanese Corporation
Earnings (loss) from continuing operations 138 205 167 96
Earnings (loss) from discontinued operations 4 (2 ) — (1 )
Net earnings (loss) 142 203 167 95
Net earnings (loss) per share — basic 0.91 1.30 1.07 0.61
Net earnings (loss) per share — diluted 0.90 1.28 1.05 0.60
(1) In cludes $16 million in costs and $4 million of employee termination benefits related to the relocation and expansion of the Company's polyacetal ("POM") operations in Kelsterbach, Germany to Frankfurt Hoechst Industrial Park, Germany.
(2) In cludes $14 million in costs and $1 million of employee termination benefits related to the relocation and expansion of the Company's POM operations in Kelsterbach, Germany to Frankfurt Hoechst Industrial Park, Germany, and a $7 million unfavorable settlement in a resolution of a commercial dispute.
(3) Inc ludes $4 million in costs and $3 million of employee termination benefits related to the relocation of the Company's POM operations in Kelsterbach, Germany to Frankfurt Hoechst Industrial Park, Germany.

Item 9. Changes in and Disagreements with Accountants on Accounting and Financial Disclosure
None.
Item 9A. Controls and Procedures
Under the supervision and with the participation of our management, including the Chief Executive Officer and Chief Financial Officer, we have evaluated the effectiveness of our disclosure controls and procedures pursuant to Exchange Act Rule 13a-15(b) as of the end of the period covered by this Annual Report. Based on that evaluation, as of December 31, 2012 , the Chief Executive Officer and Chief Financial Officer have concluded that our disclosure controls and procedures are effective.
Changes in Internal Control Over Financial Reporting
During the three months ended December 31, 2012 , there were no changes in our internal control over financial reporting that have materially affected, or are reasonably likely to materially affect, our internal control over financial reporting.
Report of Management on Internal Control Over Financial Reporting
Our management is responsible for establishing and maintaining adequate internal control over financial reporting for the Company. Internal control over financial reporting is a process to provide reasonable assurance regarding the reliability of our financial reporting for external purposes in accordance with accounting principles generally accepted in the United States of America. Internal control over financial reporting includes maintaining records that in reasonable detail accurately and fairly reflect our transactions; providing reasonable assurance that transactions are recorded as necessary for preparation of our consolidated financial statements; providing reasonable assurance that receipts and expenditures of company assets are made in accordance with management authorization; and providing reasonable assurance that unauthorized acquisition, use or disposition of company assets that could have a material effect on our consolidated financial statements would be prevented or detected on a timely basis. Because of its inherent limitations, internal control over financial reporting is not intended to provide absolute assurance that a misstatement of our consolidated financial statements would be prevented or detected.
Management conducted an evaluation of the effectiveness of our internal control over financial reporting based on the framework in Internal Control — Integrated Framework issued by the Committee of Sponsoring Organizations of the Treadway Commission. Based on this evaluation, management concluded that the Company’s internal control over financial reporting was effective as of December 31, 2012 . The Company's independent registered public accounting firm, KPMG LLP, has issued an audit report on the effectiveness of the Company's internal control over financial reporting. Their report follows.
62
Report of Independent Registered Public Accounting Firm
The Board of Directors and Stockholders Celanese Corporation:
We have audited Celanese Corporation and subsidiaries’ (the "Company") internal control over financial reporting as of December 31, 2012 , based on criteria established in Internal Control — Integrated Framework issued by the Committee of Sponsoring Organizations of the Treadway Commission (COSO). The Company’s management is responsible for maintaining effective internal control over financial reporting and for its assessment of the effectiveness of internal control over financial reporting, included in the accompanying Report of Management on Internal Control Over Financial Reporting. Our responsibility is to express an opinion on the Company’s internal control over financial reporting based on our audit.
We conducted our audit in accordance with the standards of the Public Company Accounting Oversight Board (United States). Those standards require that we plan and perform the audit to obtain reasonable assurance about whether effective internal control over financial reporting was maintained in all material respects. Our audit included obtaining an understanding of internal control over financial reporting, assessing the risk that a material weakness exists, and testing and evaluating the design and operating effectiveness of internal control based on the assessed risk. Our audit also included performing such other procedures as we considered necessary in the circumstances. We believe that our audit provides a reasonable basis for our opinion.
A company’s internal control over financial reporting is a process designed to provide reasonable assurance regarding the reliability of financial reporting and the preparation of financial statements for external purposes in accordance with generally accepted accounting principles. A company’s internal control over financial reporting includes those policies and procedures that (1) pertain to the maintenance of records that, in reasonable detail, accurately and fairly reflect the transactions and dispositions of the assets of the company; (2) provide reasonable assurance that transactions are recorded as necessary to permit preparation of financial statements in accordance with generally accepted accounting principles, and that receipts and expenditures of the company are being made only in accordance with authorizations of management and directors of the company; and (3) provide reasonable assurance regarding prevention or timely detection of unauthorized acquisition, use, or disposition of the company’s assets that could have a material effect on the financial statements.
Because of its inherent limitations, internal control over financial reporting may not prevent or detect misstatements. Also, projections of any evaluation of effectiveness to future periods are subject to the risk that controls may become inadequate because of changes in conditions, or that the degree of compliance with the policies or procedures may deteriorate.
In our opinion, the Company maintained, in all material respects, effective internal control over financial reporting as of December 31, 2012 , based on criteria established in Internal Control — Integrated Framework issued by the Committee of Sponsoring Organizations of the Treadway Commission.
We also have audited, in accordance with the standards of the Public Company Accounting Oversight Board (United States), the consolidated balance sheets of the Company as of December 31, 2012 and 2011 , and the related consolidated statements of operations, comprehensive income (loss), equity, and cash flows for each of the years in the three-year period ended December 31, 2012 , and our report dated February 8, 2013 expressed an unqualified opinion on those consolidated financial statements.
/s/ KPMG LLP
Dallas, Texas February 8, 2013
63
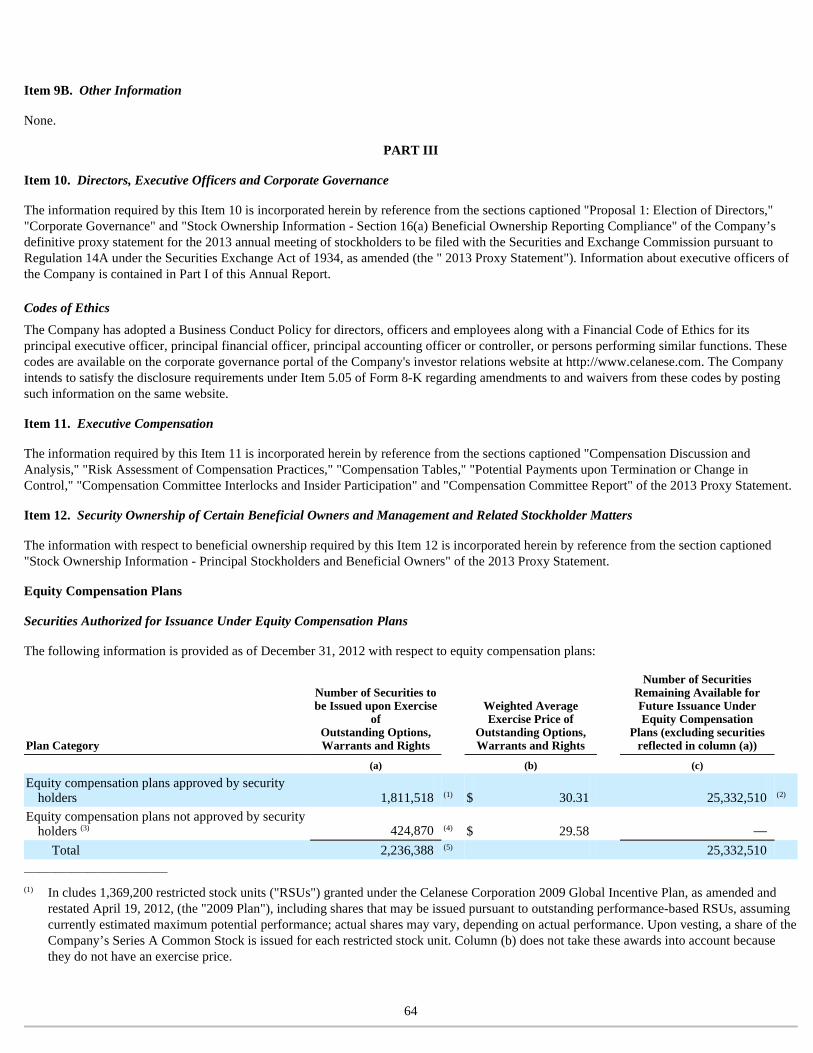
Item 9B. Other Information
None.
PART III
Item 10. Directors, Executive Officers and Corporate Governance
The information required by this Item 10 is incorporated herein by reference from the sections captioned "Proposal 1: Election of Directors," "Corporate Governance" and "Stock Ownership Information - Section 16(a) Beneficial Ownership Reporting Compliance" of the Company’s definitive proxy statement for the 2013 annual meeting of stockholders to be filed with the Securities and Exchange Commission pursuant to Regulation 14A under the Securities Exchange Act of 1934, as amended (the " 2013 Proxy Statement"). Information about executive officers of the Company is contained in Part I of this Annual Report.
Codes of Ethics
The Company has adopted a Business Conduct Policy for directors, officers and employees along with a Financial Code of Ethics for its principal executive officer, principal financial officer, principal accounting officer or controller, or persons performing similar functions. These codes are available on the corporate governance portal of the Company's investor relations website at http://www.celanese.com. The Company intends to satisfy the disclosure requirements under Item 5.05 of Form 8-K regarding amendments to and waivers from these codes by posting such information on the same website.
Item 11. Executive Compensation
The information required by this Item 11 is incorporated herein by reference from the sections captioned "Compensation Discussion and Analysis," "Risk Assessment of Compensation Practices," "Compensation Tables," "Potential Payments upon Termination or Change in Control," "Compensation Committee Interlocks and Insider Participation" and "Compensation Committee Report" of the 2013 Proxy Statement.
Item 12. Security Ownership of Certain Beneficial Owners and Management and Related Stockholder Matters
The information with respect to beneficial ownership required by this Item 12 is incorporated herein by reference from the section captioned "Stock Ownership Information - Principal Stockholders and Beneficial Owners" of the 2013 Proxy Statement.
Equity Compensation Plans
Securities Authorized for Issuance Under Equity Compensation Plans
The following information is provided as of December 31, 2012 with respect to equity compensation plans:
___________________________
64
Plan Category
Number of Securities to be Issued upon Exercise
of Outstanding Options, Warrants and Rights
Weighted Average Exercise Price of
Outstanding Options, Warrants and Rights
Number of Securities Remaining Available for Future Issuance Under Equity Compensation
Plans (excluding securities reflected in column (a))
(a) (b) (c)
Equity compensation plans approved by security holders 1,811,518 (1) $ 30.31 25,332,510 (2)
Equity compensation plans not approved by security holders (3) 424,870 (4) $ 29.58 —
Total 2,236,388 (5) 25,332,510
(1) In cludes 1,369,200 restricted stock units ("RSUs") granted under the Celanese Corporation 2009 Global Incentive Plan, as amended and restated April 19, 2012, (the "2009 Plan"), including shares that may be issued pursuant to outstanding performance-based RSUs, assuming currently estimated maximum potential performance; actual shares may vary, depending on actual performance. Upon vesting, a share of the Company’s Series A Common Stock is issued for each restricted stock unit. Column (b) does not take these awards into account because they do not have an exercise price.
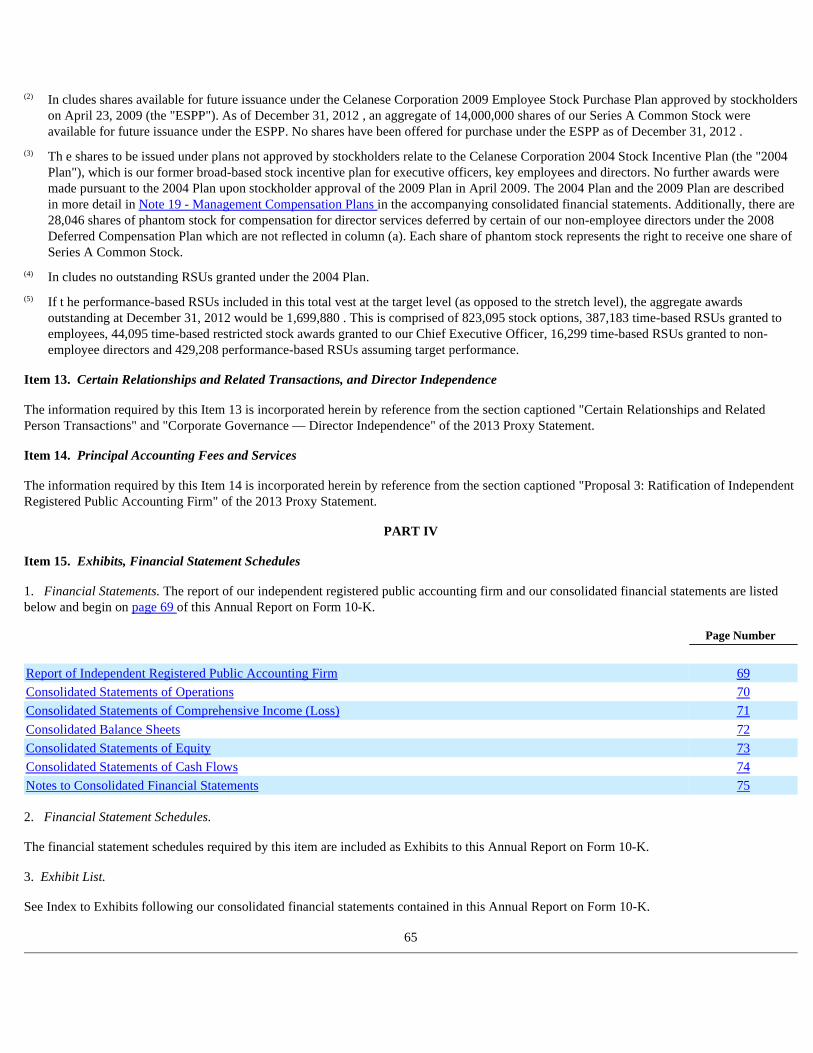
Item 13. Certain Relationships and Related Transactions, and Director Independence
The information required by this Item 13 is incorporated herein by reference from the section captioned "Certain Relationships and Related Person Transactions" and "Corporate Governance — Director Independence" of the 2013 Proxy Statement.
Item 14. Principal Accounting Fees and Services
The information required by this Item 14 is incorporated herein by reference from the section captioned "Proposal 3: Ratification of Independent Registered Public Accounting Firm" of the 2013 Proxy Statement.
PART IV
Item 15. Exhibits, Financial Statement Schedules
1. Financial Statements. The report of our independent registered public accounting firm and our consolidated financial statements are listed below and begin on page 69 of this Annual Report on Form 10-K.
2. Financial Statement Schedules.
The financial statement schedules required by this item are included as Exhibits to this Annual Report on Form 10-K.
3. Exhibit List.
See Index to Exhibits following our consolidated financial statements contained in this Annual Report on Form 10-K.
65
(2) In cludes shares available for future issuance under the Celanese Corporation 2009 Employee Stock Purchase Plan approved by stockholders on April 23, 2009 (the "ESPP"). As of December 31, 2012 , an aggregate of 14,000,000 shares of our Series A Common Stock were available for future issuance under the ESPP. No shares have been offered for purchase under the ESPP as of December 31, 2012 .
(3) Th e shares to be issued under plans not approved by stockholders relate to the Celanese Corporation 2004 Stock Incentive Plan (the "2004 Plan"), which is our former broad-based stock incentive plan for executive officers, key employees and directors. No further awards were made pursuant to the 2004 Plan upon stockholder approval of the 2009 Plan in April 2009. The 2004 Plan and the 2009 Plan are described in more detail in Note 19 - Management Compensation Plans in the accompanying consolidated financial statements. Additionally, there are 28,046 shares of phantom stock for compensation for director services deferred by certain of our non-employee directors under the 2008 Deferred Compensation Plan which are not reflected in column (a). Each share of phantom stock represents the right to receive one share of Series A Common Stock.
(4) In cludes no outstanding RSUs granted under the 2004 Plan.
(5) If t he performance-based RSUs included in this total vest at the target level (as opposed to the stretch level), the aggregate awards outstanding at December 31, 2012 would be 1,699,880 . This is comprised of 823,095 stock options, 387,183 time-based RSUs granted to employees, 44,095 time-based restricted stock awards granted to our Chief Executive Officer, 16,299 time-based RSUs granted to non-employee directors and 429,208 performance-based RSUs assuming target performance.
Page Number
Report of Independent Registered Public Accounting Firm 69
Consolidated Statements of Operations 70
Consolidated Statements of Comprehensive Income (Loss) 71
Consolidated Balance Sheets 72
Consolidated Statements of Equity 73
Consolidated Statements of Cash Flows 74
Notes to Consolidated Financial Statements 75
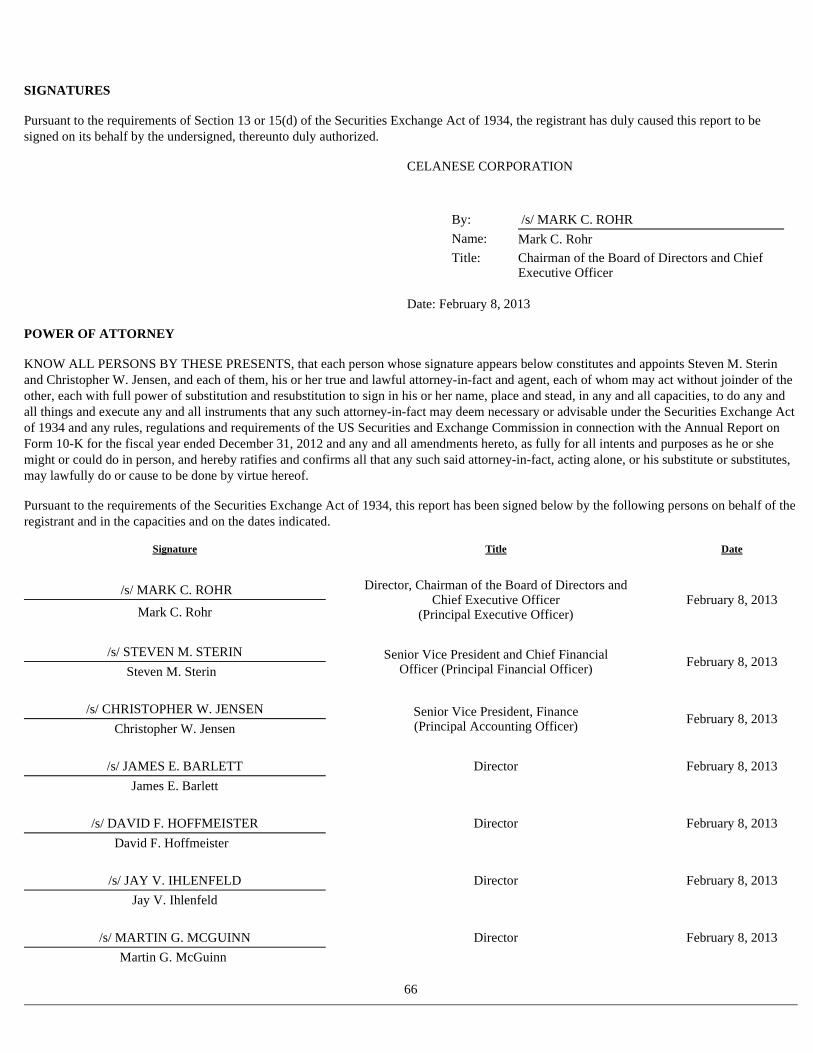
SIGNATURES
Pursuant to the requirements of Section 13 or 15(d) of the Securities Exchange Act of 1934, the registrant has duly caused this report to be signed on its behalf by the undersigned, thereunto duly authorized.
CELANESE CORPORATION
Date: February 8, 2013
POWER OF ATTORNEY
KNOW ALL PERSONS BY THESE PRESENTS, that each person whose signature appears below constitutes and appoints Steven M. Sterin and Christopher W. Jensen, and each of them, his or her true and lawful attorney-in-fact and agent, each of whom may act without joinder of the other, each with full power of substitution and resubstitution to sign in his or her name, place and stead, in any and all capacities, to do any and all things and execute any and all instruments that any such attorney-in-fact may deem necessary or advisable under the Securities Exchange Act of 1934 and any rules, regulations and requirements of the US Securities and Exchange Commission in connection with the Annual Report on Form 10-K for the fiscal year ended December 31, 2012 and any and all amendments hereto, as fully for all intents and purposes as he or she might or could do in person, and hereby ratifies and confirms all that any such said attorney-in-fact, acting alone, or his substitute or substitutes, may lawfully do or cause to be done by virtue hereof.
Pursuant to the requirements of the Securities Exchange Act of 1934, this report has been signed below by the following persons on behalf of the registrant and in the capacities and on the dates indicated.
66
By: /s/ MARK C. ROHR
Name: Mark C. Rohr
Title: Chairman of the Board of Directors and Chief
Executive Officer
Signature Title Date
/s/ MARK C. ROHR Director, Chairman of the Board of Directors and Chief Executive Officer
(Principal Executive Officer) February 8, 2013
Mark C. Rohr
/s/ STEVEN M. STERIN Senior Vice President and Chief Financial Officer (Principal Financial Officer) February 8, 2013
Steven M. Sterin
/s/ CHRISTOPHER W. JENSEN Senior Vice President, Finance (Principal Accounting Officer) February 8, 2013
Christopher W. Jensen
/s/ JAMES E. BARLETT Director February 8, 2013
James E. Barlett
/s/ DAVID F. HOFFMEISTER Director February 8, 2013
David F. Hoffmeister
/s/ JAY V. IHLENFELD Director February 8, 2013
Jay V. Ihlenfeld
/s/ MARTIN G. MCGUINN Director February 8, 2013
Martin G. McGuinn
67
Signature Title Date
/s/ PAUL H. O’NEILL Director February 8, 2013
Paul H. O’Neill
/s/ DANIEL S. SANDERS Director February 8, 2013
Daniel S. Sanders
/s/ FARAH M. WALTERS Director February 8, 2013
Farah M. Walters
/s/ JOHN K. WULFF Director February 8, 2013
John K. Wulff
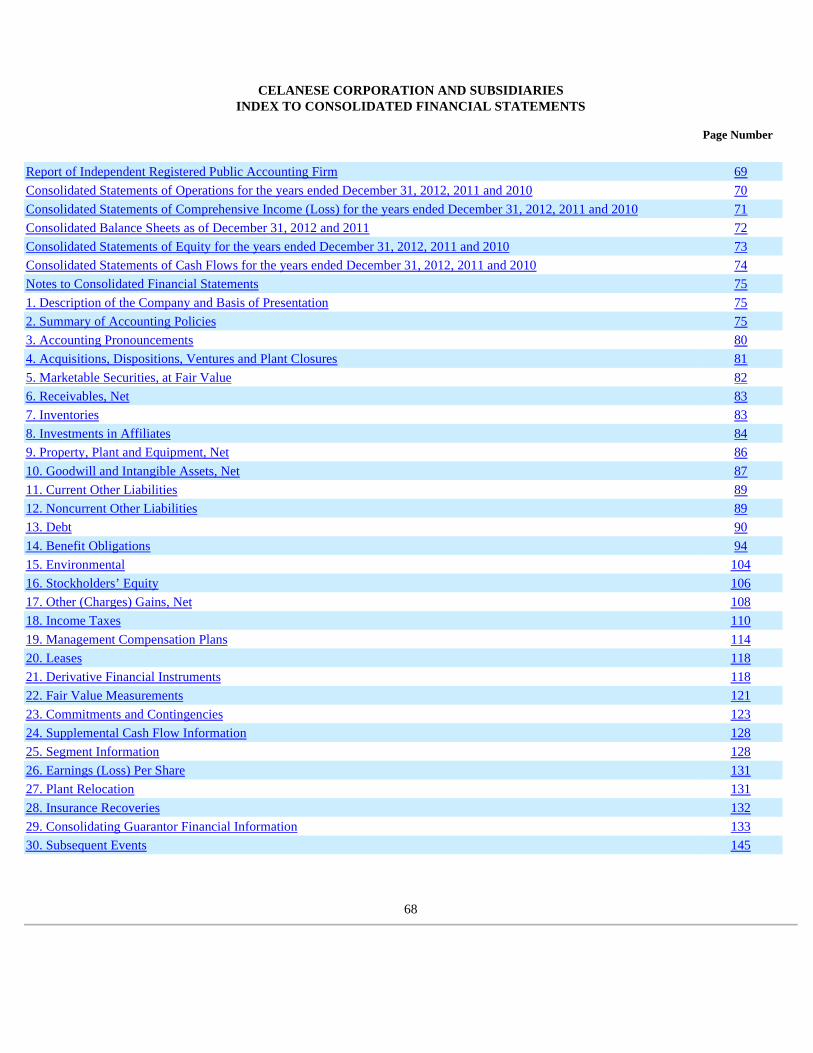
CELANESE CORPORATION AND SUBSIDIARIES INDEX TO CONSOLIDATED FINANCIAL STATEMENTS
68
Page Number
Report of Independent Registered Public Accounting Firm 69
Consolidated Statements of Operations for the years ended December 31, 2012, 2011 and 2010 70
Consolidated Statements of Comprehensive Income (Loss) for the years ended December 31, 2012, 2011 and 2010 71
Consolidated Balance Sheets as of December 31, 2012 and 2011 72
Consolidated Statements of Equity for the years ended December 31, 2012, 2011 and 2010 73
Consolidated Statements of Cash Flows for the years ended December 31, 2012, 2011 and 2010 74
Notes to Consolidated Financial Statements 75
1. Description of the Company and Basis of Presentation 75
2. Summary of Accounting Policies 75
3. Accounting Pronouncements 80
4. Acquisitions, Dispositions, Ventures and Plant Closures 81
5. Marketable Securities, at Fair Value 82
6. Receivables, Net 83
7. Inventories 83
8. Investments in Affiliates 84
9. Property, Plant and Equipment, Net 86
10. Goodwill and Intangible Assets, Net 87
11. Current Other Liabilities 89
12. Noncurrent Other Liabilities 89
13. Debt 90
14. Benefit Obligations 94
15. Environmental 104
16. Stockholders’ Equity 106
17. Other (Charges) Gains, Net 108
18. Income Taxes 110
19. Management Compensation Plans 114
20. Leases 118
21. Derivative Financial Instruments 118
22. Fair Value Measurements 121
23. Commitments and Contingencies 123
24. Supplemental Cash Flow Information 128
25. Segment Information 128
26. Earnings (Loss) Per Share 131
27. Plant Relocation 131
28. Insurance Recoveries 132
29. Consolidating Guarantor Financial Information 133
30. Subsequent Events 145
Report of Independent Registered Public Accounting Firm
The Board of Directors and Stockholders Celanese Corporation: We have audited the accompanying consolidated balance sheets of Celanese Corporation and subsidiaries (the "Company") as of December 31, 2012 and 2011 , and the related consolidated statements of operations, comprehensive income (loss), equity, and cash flows for each of the years in the three-year period ended December 31, 2012 . These consolidated financial statements are the responsibility of the Company’s management. Our responsibility is to express an opinion on these consolidated financial statements based on our audits. We conducted our audits in accordance with the standards of the Public Company Accounting Oversight Board (United States). Those standards require that we plan and perform the audit to obtain reasonable assurance about whether the financial statements are free of material misstatement. An audit includes examining, on a test basis, evidence supporting the amounts and disclosures in the financial statements. An audit also includes assessing the accounting principles used and significant estimates made by management, as well as evaluating the overall financial statement presentation. We believe that our audits provide a reasonable basis for our opinion. In our opinion, the consolidated financial statements referred to above present fairly, in all material respects, the financial position of the Company as of December 31, 2012 and 2011 , and the results of its operations and its cash flows for each of the years in the three-year period ended December 31, 2012 , in conformity with U.S. generally accepted accounting principles. We also have audited, in accordance with the standards of the Public Company Accounting Oversight Board (United States), the Company’s internal control over financial reporting as of December 31, 2012 , based on criteria established in Internal Control — Integrated Framework issued by the Committee of Sponsoring Organizations of the Treadway Commission (COSO), and our report dated February 8, 2013 expressed an unqualified opinion on the effectiveness of the Company’s internal control over financial reporting. /s/ KPMG LLP Dallas, Texas February 8, 2013
69
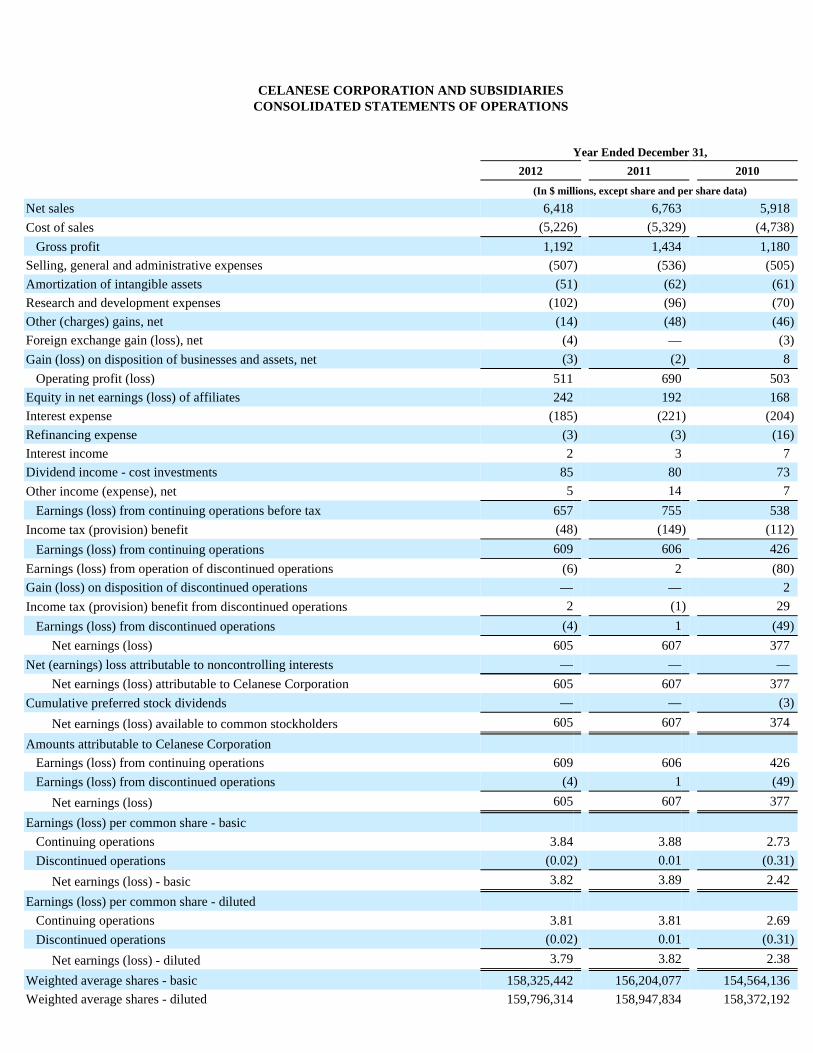
CELANESE CORPORATION AND SUBSIDIARIES CONSOLIDATED STATEMENTS OF OPERATIONS
Year Ended December 31,
2012 2011 2010
(In $ millions, except share and per share data)
Net sales 6,418 6,763 5,918 Cost of sales (5,226 ) (5,329 ) (4,738 )
Gross profit 1,192 1,434 1,180 Selling, general and administrative expenses (507 ) (536 ) (505 )
Amortization of intangible assets (51 ) (62 ) (61 )
Research and development expenses (102 ) (96 ) (70 )
Other (charges) gains, net (14 ) (48 ) (46 )
Foreign exchange gain (loss), net (4 ) — (3 )
Gain (loss) on disposition of businesses and assets, net (3 ) (2 ) 8 Operating profit (loss) 511 690 503
Equity in net earnings (loss) of affiliates 242 192 168 Interest expense (185 ) (221 ) (204 )
Refinancing expense (3 ) (3 ) (16 )
Interest income 2 3 7 Dividend income - cost investments 85 80 73 Other income (expense), net 5 14 7
Earnings (loss) from continuing operations before tax 657 755 538 Income tax (provision) benefit (48 ) (149 ) (112 )
Earnings (loss) from continuing operations 609 606 426 Earnings (loss) from operation of discontinued operations (6 ) 2 (80 )
Gain (loss) on disposition of discontinued operations — — 2 Income tax (provision) benefit from discontinued operations 2 (1 ) 29
Earnings (loss) from discontinued operations (4 ) 1 (49 )
Net earnings (loss) 605 607 377 Net (earnings) loss attributable to noncontrolling interests — — —
Net earnings (loss) attributable to Celanese Corporation 605 607 377 Cumulative preferred stock dividends — — (3 )
Net earnings (loss) available to common stockholders 605 607 374
Amounts attributable to Celanese Corporation
Earnings (loss) from continuing operations 609 606 426 Earnings (loss) from discontinued operations (4 ) 1 (49 )
Net earnings (loss) 605 607 377
Earnings (loss) per common share - basic
Continuing operations 3.84 3.88 2.73 Discontinued operations (0.02 ) 0.01 (0.31 )
Net earnings (loss) - basic 3.82 3.89 2.42
Earnings (loss) per common share - diluted
Continuing operations 3.81 3.81 2.69 Discontinued operations (0.02 ) 0.01 (0.31 )
Net earnings (loss) - diluted 3.79 3.82 2.38
Weighted average shares - basic 158,325,442 156,204,077 154,564,136 Weighted average shares - diluted 159,796,314 158,947,834 158,372,192

See the accompanying notes to the consolidated financial statements.
70
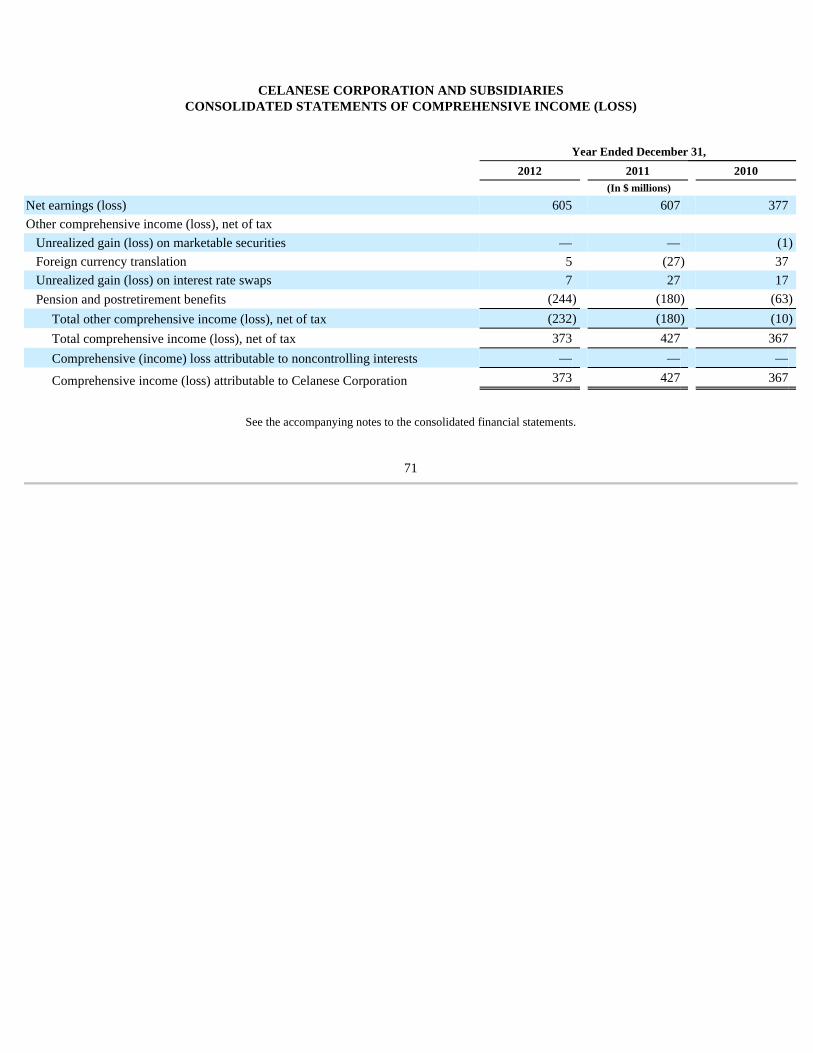
CELANESE CORPORATION AND SUBSIDIARIES CONSOLIDATED STATEMENTS OF COMPREHENSIVE INCOME (LO SS)
See the accompanying notes to the consolidated financial statements.
71
Year Ended December 31,
2012 2011 2010 (In $ millions)
Net earnings (loss) 605 607 377 Other comprehensive income (loss), net of tax
Unrealized gain (loss) on marketable securities — — (1 )
Foreign currency translation 5 (27 ) 37 Unrealized gain (loss) on interest rate swaps 7 27 17 Pension and postretirement benefits (244 ) (180 ) (63 )
Total other comprehensive income (loss), net of tax (232 ) (180 ) (10 )
Total comprehensive income (loss), net of tax 373 427 367 Comprehensive (income) loss attributable to noncontrolling interests — — —
Comprehensive income (loss) attributable to Celanese Corporation 373 427 367
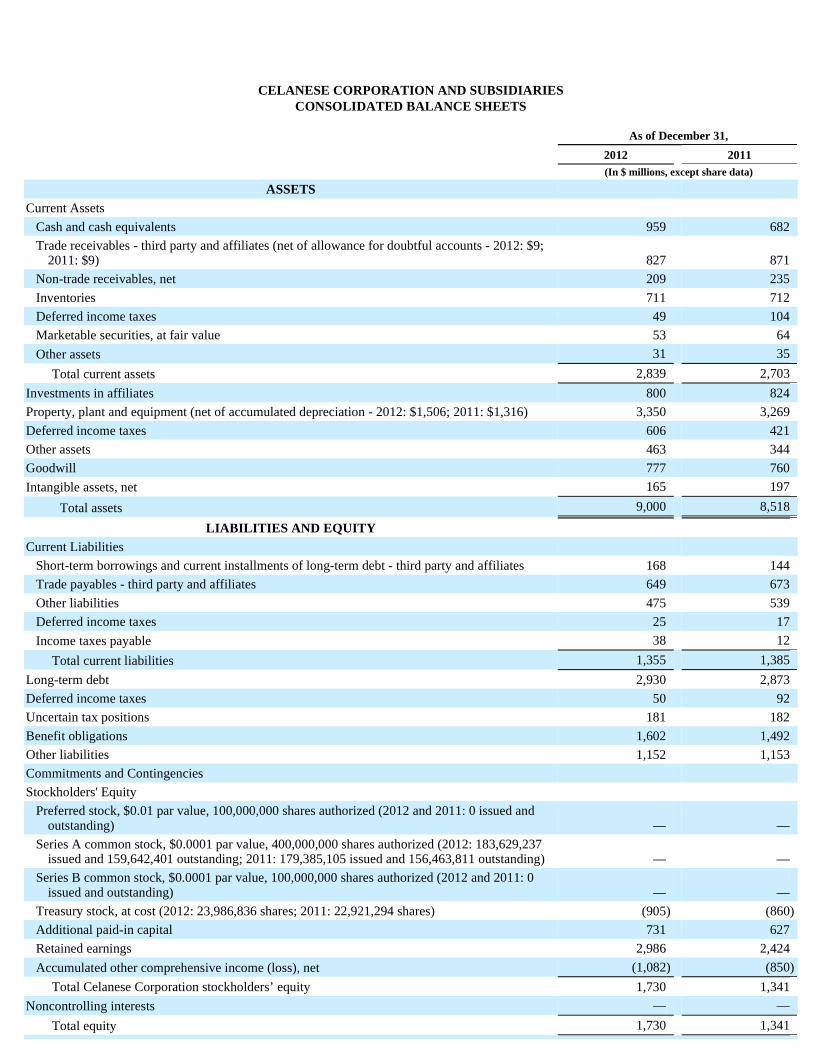
CELANESE CORPORATION AND SUBSIDIARIES CONSOLIDATED BALANCE SHEETS
As of December 31,
2012 2011
(In $ millions, except share data)
ASSETS
Current Assets Cash and cash equivalents 959 682 Trade receivables - third party and affiliates (net of allowance for doubtful accounts - 2012: $9;
2011: $9) 827 871 Non-trade receivables, net 209 235 Inventories 711 712 Deferred income taxes 49 104 Marketable securities, at fair value 53 64 Other assets 31 35
Total current assets 2,839 2,703 Investments in affiliates 800 824 Property, plant and equipment (net of accumulated depreciation - 2012: $1,506; 2011: $1,316) 3,350 3,269 Deferred income taxes 606 421 Other assets 463 344 Goodwill 777 760 Intangible assets, net 165 197
Total assets 9,000 8,518
LIABILITIES AND EQUITY
Current Liabilities Short-term borrowings and current installments of long-term debt - third party and affiliates 168 144 Trade payables - third party and affiliates 649 673 Other liabilities 475 539 Deferred income taxes 25 17 Income taxes payable 38 12
Total current liabilities 1,355 1,385 Long-term debt 2,930 2,873 Deferred income taxes 50 92 Uncertain tax positions 181 182 Benefit obligations 1,602 1,492 Other liabilities 1,152 1,153 Commitments and Contingencies Stockholders' Equity
Preferred stock, $0.01 par value, 100,000,000 shares authorized (2012 and 2011: 0 issued and outstanding) — —
Series A common stock, $0.0001 par value, 400,000,000 shares authorized (2012: 183,629,237 issued and 159,642,401 outstanding; 2011: 179,385,105 issued and 156,463,811 outstanding) — —
Series B common stock, $0.0001 par value, 100,000,000 shares authorized (2012 and 2011: 0 issued and outstanding) — —
Treasury stock, at cost (2012: 23,986,836 shares; 2011: 22,921,294 shares) (905 ) (860 )
Additional paid-in capital 731 627 Retained earnings 2,986 2,424 Accumulated other comprehensive income (loss), net (1,082 ) (850 )
Total Celanese Corporation stockholders’ equity 1,730 1,341 Noncontrolling interests — —
Total equity 1,730 1,341

See the accompanying notes to the consolidated financial statements.
72
Total liabilities and equity 9,000 8,518
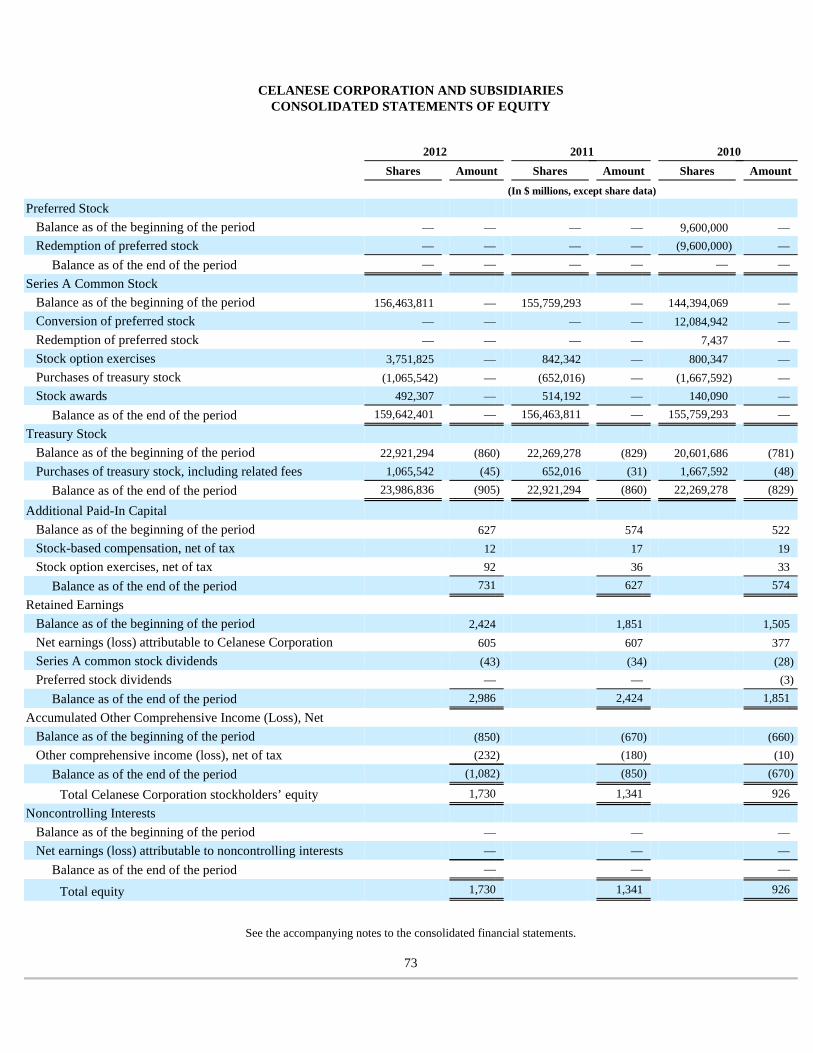
CELANESE CORPORATION AND SUBSIDIARIES CONSOLIDATED STATEMENTS OF EQUITY
See the accompanying notes to the consolidated financial statements.
73
2012 2011 2010
Shares Amount Shares Amount Shares Amount
(In $ millions, except share data)
Preferred Stock
Balance as of the beginning of the period — — — — 9,600,000 — Redemption of preferred stock — — — — (9,600,000 ) —
Balance as of the end of the period — — — — — — Series A Common Stock
Balance as of the beginning of the period 156,463,811 — 155,759,293 — 144,394,069 — Conversion of preferred stock — — — — 12,084,942 — Redemption of preferred stock — — — — 7,437 — Stock option exercises 3,751,825 — 842,342 — 800,347 — Purchases of treasury stock (1,065,542 ) — (652,016 ) — (1,667,592 ) — Stock awards 492,307 — 514,192 — 140,090 —
Balance as of the end of the period 159,642,401 — 156,463,811 — 155,759,293 — Treasury Stock
Balance as of the beginning of the period 22,921,294 (860 ) 22,269,278 (829 ) 20,601,686 (781 )
Purchases of treasury stock, including related fees 1,065,542 (45 ) 652,016 (31 ) 1,667,592 (48 )
Balance as of the end of the period 23,986,836 (905 ) 22,921,294 (860 ) 22,269,278 (829 )
Additional Paid-In Capital Balance as of the beginning of the period 627 574 522 Stock-based compensation, net of tax 12 17 19 Stock option exercises, net of tax 92 36 33
Balance as of the end of the period 731 627 574 Retained Earnings
Balance as of the beginning of the period 2,424 1,851 1,505 Net earnings (loss) attributable to Celanese Corporation 605 607 377 Series A common stock dividends (43 ) (34 ) (28 )
Preferred stock dividends — — (3 )
Balance as of the end of the period 2,986 2,424 1,851 Accumulated Other Comprehensive Income (Loss), Net
Balance as of the beginning of the period (850 ) (670 ) (660 )
Other comprehensive income (loss), net of tax (232 ) (180 ) (10 )
Balance as of the end of the period (1,082 ) (850 ) (670 )
Total Celanese Corporation stockholders’ equity 1,730 1,341 926 Noncontrolling Interests
Balance as of the beginning of the period — — — Net earnings (loss) attributable to noncontrolling interests — — —
Balance as of the end of the period — — —
Total equity 1,730 1,341 926
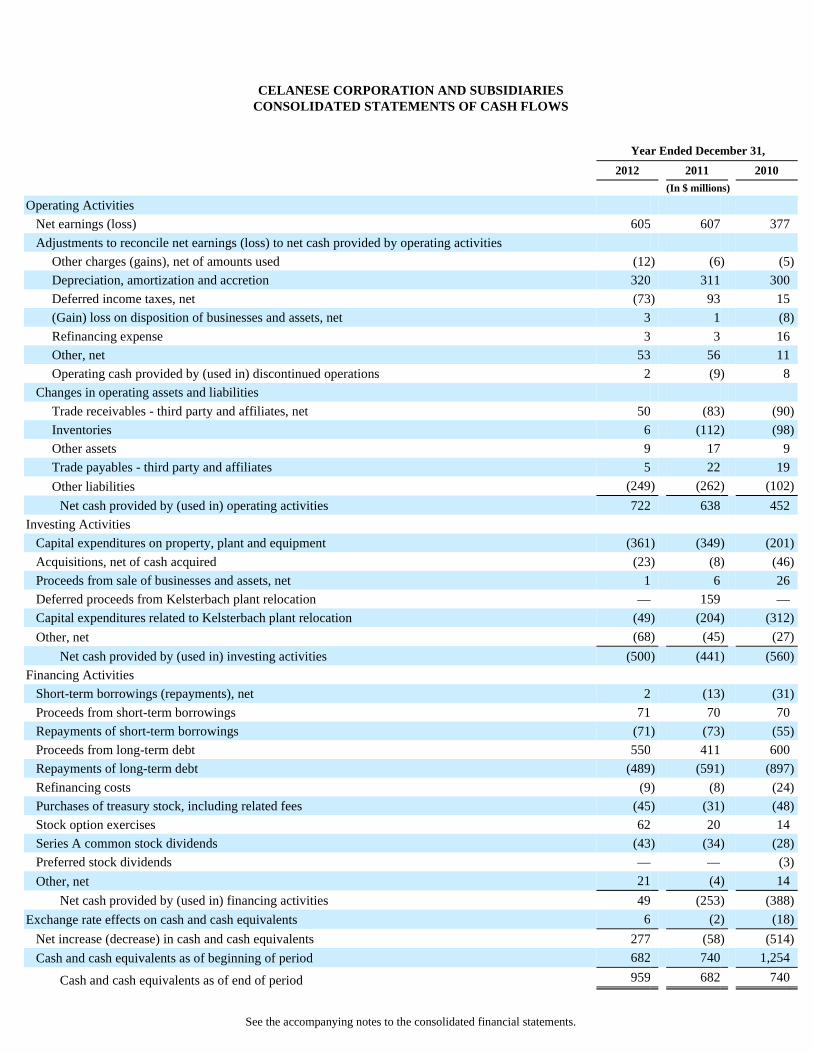
CELANESE CORPORATION AND SUBSIDIARIES CONSOLIDATED STATEMENTS OF CASH FLOWS
See the accompanying notes to the consolidated financial statements.
Year Ended December 31,
2012 2011 2010 (In $ millions)
Operating Activities
Net earnings (loss) 605 607 377 Adjustments to reconcile net earnings (loss) to net cash provided by operating activities
Other charges (gains), net of amounts used (12 ) (6 ) (5 )
Depreciation, amortization and accretion 320 311 300 Deferred income taxes, net (73 ) 93 15 (Gain) loss on disposition of businesses and assets, net 3 1 (8 )
Refinancing expense 3 3 16 Other, net 53 56 11 Operating cash provided by (used in) discontinued operations 2 (9 ) 8
Changes in operating assets and liabilities
Trade receivables - third party and affiliates, net 50 (83 ) (90 )
Inventories 6 (112 ) (98 )
Other assets 9 17 9 Trade payables - third party and affiliates 5 22 19 Other liabilities (249 ) (262 ) (102 )
Net cash provided by (used in) operating activities 722 638 452 Investing Activities
Capital expenditures on property, plant and equipment (361 ) (349 ) (201 )
Acquisitions, net of cash acquired (23 ) (8 ) (46 )
Proceeds from sale of businesses and assets, net 1 6 26 Deferred proceeds from Kelsterbach plant relocation — 159 — Capital expenditures related to Kelsterbach plant relocation (49 ) (204 ) (312 )
Other, net (68 ) (45 ) (27 )
Net cash provided by (used in) investing activities (500 ) (441 ) (560 )
Financing Activities
Short-term borrowings (repayments), net 2 (13 ) (31 )
Proceeds from short-term borrowings 71 70 70 Repayments of short-term borrowings (71 ) (73 ) (55 )
Proceeds from long-term debt 550 411 600 Repayments of long-term debt (489 ) (591 ) (897 )
Refinancing costs (9 ) (8 ) (24 )
Purchases of treasury stock, including related fees (45 ) (31 ) (48 )
Stock option exercises 62 20 14 Series A common stock dividends (43 ) (34 ) (28 )
Preferred stock dividends — — (3 )
Other, net 21 (4 ) 14 Net cash provided by (used in) financing activities 49 (253 ) (388 )
Exchange rate effects on cash and cash equivalents 6 (2 ) (18 )
Net increase (decrease) in cash and cash equivalents 277 (58 ) (514 )
Cash and cash equivalents as of beginning of period 682 740 1,254
Cash and cash equivalents as of end of period 959 682 740

74
CELANESE CORPORATION AND SUBSIDIARIES NOTES TO CONSOLIDATED FINANCIAL STATEMENTS
1. Description of the Company and Basis of Presentation
Description of the Company
Celanese Corporation and its subsidiaries (collectively, the "Company") is a global technology and specialty materials company. The Company’s business involves processing chemical raw materials, such as methanol, carbon monoxide and ethylene, and natural products, including wood pulp, into value-added chemicals, thermoplastic polymers and other chemical-based products.
Definitions
In this Annual Report on Form 10-K ("Annual Report"), the term "Celanese" refers to Celanese Corporation, a Delaware corporation, and not its subsidiaries. The term "Celanese US" refers to the Company's subsidiary, Celanese US Holdings LLC, a Delaware limited liability company, and not its subsidiaries.
Basis of Presentation
The consolidated financial statements contained in this Annual Report were prepared in accordance with accounting principles generally accepted in the United States of America ("US GAAP") for all periods presented. The consolidated financial statements and other financial information included in this Annual Report, unless otherwise specified, have been presented to separately show the retroactive effects of discontinued operations.
In the ordinary course of business, the Company enters into contracts and agreements relative to a number of topics, including acquisitions, dispositions, joint ventures, supply agreements, product sales and other arrangements. The Company endeavors to describe those contracts or agreements that are material to its business, results of operations or financial position. The Company may also describe some arrangements that are not material but in which the Company believes investors may have an interest or which may have been included in a Form 8-K filing. Investors should not assume the Company has described all contracts and agreements relative to the Company’s business in this Annual Report.
For those consolidated subsidiaries in which the Company's ownership is less than 100% , the outside stockholders' interests are shown as noncontrolling interests.
The Company has reclassified certain prior period amounts to conform to the current period’s presentation.
2. Summary of Accounting Policies
The consolidated financial statements have been prepared in accordance with US GAAP for all periods presented and include the accounts of the Company and its majority owned subsidiaries over which the Company exercises control. All intercompany accounts and transactions have been eliminated in consolidation.
The preparation of consolidated financial statements in conformity with US GAAP requires management to make estimates and assumptions that affect the reported amounts of assets and liabilities, disclosure of contingent assets and liabilities at the date of the consolidated financial statements and the reported amounts of revenues, expenses and allocated charges during the reporting period. Significant estimates pertain to impairments of goodwill, intangible assets and other long-lived assets, purchase price allocations, restructuring costs and other (charges) gains, net, income taxes, pension and other postretirement benefits, asset retirement obligations, environmental liabilities and loss contingencies, among others. Actual results could differ from those estimates.
All highly liquid investments with original maturities of three months or less are considered cash equivalents.
75
• Consolidation principles
• Estimates and assumptions
• Cash and cash equivalents
Inventories, including stores and supplies, are stated at the lower of cost or market. Cost for inventories is determined using the first-in, first-out ("FIFO") method. Cost includes raw materials, direct labor and manufacturing overhead. Cost for stores and supplies is primarily determined by the average cost method.
The Company classifies its investments in debt and equity securities as "available-for-sale" and reports those investments at their fair market values in the consolidated balance sheets as Marketable securities, at fair value. Unrealized gains or losses, net of the related tax effect on available-for-sale securities, are excluded from earnings and are reported as a component of Accumulated other comprehensive income (loss), net until realized. The cost of securities sold is determined by using the specific identification method.
A decline in the market value of any available-for-sale security below cost that is deemed to be other-than-temporary results in a reduction in the carrying amount to fair value. The impairment is charged to earnings and a new cost basis for the security is established. To determine whether impairment is other-than-temporary, the Company considers whether it has the ability and intent to hold the investment until a market price recovery and evidence indicating the cost of the investment is recoverable outweighs evidence to the contrary. Evidence considered in this assessment includes the reasons for the impairment, the severity and duration of the impairment, changes in value subsequent to year end and forecasted performance of the investee.
The Company reviews all investments for other-than-temporary impairment at least quarterly or as indicators of impairment exist. Indicators of impairment include the duration and severity of the decline in fair value below carrying value as well as the intent and ability to hold the investment to allow for a recovery in the market value of the investment. In addition, the Company considers qualitative factors that include, but are not limited to: (i) the financial condition and business plans of the investee including its future earnings potential, (ii) the investee’s credit rating, and (iii) the current and expected market and industry conditions in which the investee operates. If a decline in the fair value of an investment is deemed by management to be other-than-temporary, the Company writes down the carrying value of the investment to fair value, and the amount of the write-down is included in net earnings. Such a determination is dependent on the facts and circumstances relating to each investment.
Financial Accounting Standards Board ("FASB") Accounting Standards Codification ("ASC") Topic 323, Investments - Equity Method and Joint Ventures ("FASB ASC Topic 323"), stipulates that the equity method should be used to account for investments whereby an investor has "the ability to exercise significant influence over operating and financial policies of an investee", but does not exercise control. FASB ASC Topic 323 generally considers an investor to have the ability to exercise significant influence when it owns 20% or more of the voting stock of an investee. FASB ASC Topic 323 lists circumstances under which, despite 20% ownership, an investor may not be able to exercise significant influence. Certain investments where the Company owns greater than a 20% ownership interest are accounted for under the cost method of accounting because the Company cannot exercise significant influence or control. The Company determined that it cannot exercise significant influence over these entities due to local government investment in and influence over these entities, limitations on the Company's involvement in the day-to-day operations and the present inability of the entities to provide timely financial information prepared in accordance with US GAAP.
In certain instances, the financial information of the Company's equity investees is not available on a timely basis. Accordingly, the Company records its proportional share of the investee's earnings or losses on a consistent lag of no more than one quarter .
The Company assesses the recoverability of the carrying value of its investments whenever events or changes in circumstances indicate a loss in value that is other than a temporary decline. A loss in value of an equity method or cost method investment which is other than a temporary decline will be recognized as the difference between the carrying amount of the investment and its fair value.
The Company's estimates of fair value are determined based on a discounted cash flow model. The Company periodically engages third-party valuation consultants to assist with this process.
Land is recorded at historical cost. Buildings, machinery and equipment, including capitalized interest, and property under capital lease agreements, are recorded at cost less accumulated depreciation. The Company records depreciation and amortization in its consolidated statements of operations as either Cost of sales or Selling, general and administrative expenses
76
• Inventories
• Investments in marketable securities
• Investments in affiliates
• Property, plant and equipment, net
consistent with the utilization of the underlying assets. Depreciation is calculated on a straight-line basis over the following estimated useful lives of depreciable assets:
Leasehold improvements are amortized over 10 years or the remaining life of the respective lease, whichever is shorter.
Accelerated depreciation is recorded when the estimated useful life is shortened. Ordinary repair and maintenance costs, including costs for planned maintenance turnarounds, that do not extend the useful life of the asset are charged to earnings as incurred. Fully depreciated assets are retained in property and depreciation accounts until sold or otherwise disposed. In the case of disposals, assets and related depreciation are removed from the accounts, and the net amounts, less proceeds from disposal, are included in earnings.
The Company also leases property, plant and equipment under operating and capital leases. Rent expense for operating leases, which may have escalating rentals or rent holidays over the term of the lease, is recorded on a straight-line basis over the lease term. Amortization of capital lease assets is included as a component of depreciation expense.
Assets acquired in business combinations are recorded at their fair values and depreciated over the assets' remaining useful lives or the Company's policy lives, whichever is shorter.
The Company assesses the recoverability of the carrying amount of its property, plant and equipment whenever events or changes in circumstances indicate that the carrying amount of an asset or asset group may not be recoverable. An impairment loss would be assessed when estimated undiscounted future cash flows from the operation and disposition of the asset group are less than the carrying amount of the asset group. Asset groups have identifiable cash flows and are largely independent of other asset groups. Measurement of an impairment loss is based on the excess of the carrying amount of the asset group over its fair value. Fair value is measured using discounted cash flows or independent appraisals, as appropriate. Impairment losses are recorded primarily to Other (charges) gains, net.
Customer-related intangible assets and other intangibles with finite lives are amortized on a straight-line basis over their estimated useful lives. The excess of the purchase price over fair value of net identifiable assets and liabilities of an acquired business ("goodwill"), trademarks and trade names and other indefinite-lived intangible assets are not amortized, but rather tested for impairment, at least annually. The Company tests for goodwill and indefinite-lived intangible asset impairment during the third quarter of its fiscal year using June 30 balances.
The Company assesses the recoverability of the carrying value of goodwill at least annually or whenever events or changes in circumstances indicate that the carrying amount of the goodwill of a reporting unit may not be fully recoverable. Recoverability is measured at the reporting unit level based on the provisions of FASB ASC Topic 350, Intangibles - Goodwill and Other ("FASB ASC Topic 350"). Impairment losses are recorded primarily to Other (charges) gains, net.
The Company measures the recoverability of goodwill for each reporting unit using a discounted cash flow model incorporating discount rates commensurate with the risks involved, which is classified as a Level 3 measurement under FASB ASC Topic 820, Fair Value Measurement ("FASB ASC Topic 820"). The key assumptions used in the discounted cash flow valuation model include discount rates, growth rates, cash flow projections and terminal value rates. Discount rates, growth rates and cash flow projections are the most sensitive and susceptible to change as they require significant management judgment. The Company periodically engages third-party valuation consultants to assist with this process. The valuation consultants assess fair value by equally weighting a combination of two market approaches (market multiple analysis and comparable transaction analysis) and the discounted cash flow approach.
If the calculated fair value is less than the current carrying value, impairment of the reporting unit may exist. When the recoverability test indicates potential impairment, the Company, or in certain circumstances, a third-party valuation consultant engaged by the Company to assist with the process, will calculate an implied fair value of goodwill for the reporting unit. The implied fair value of goodwill is determined in a manner similar to how goodwill is calculated in a business combination. If the implied fair value of goodwill exceeds the carrying value of goodwill assigned to the reporting unit, there is no impairment. If the carrying value of goodwill assigned to a reporting unit exceeds the implied fair value of the goodwill, an impairment loss is recorded to write down the carrying value. An impairment loss cannot exceed the carrying value of goodwill assigned to a
77
Land improvements 20 years
Buildings and improvements 30 years
Machinery and equipment 20 years
• Goodwill and other intangible assets
reporting unit but may indicate certain long-lived and amortizable intangible assets associated with the reporting unit may require additional impairment testing.
The Company assesses recoverability of other indefinite-lived intangible assets at least annually or whenever events or changes in circumstances indicate that the carrying amount of the indefinite-lived intangible asset may not be fully recoverable. Recoverability is measured by a comparison of the carrying value of the indefinite-lived intangible asset over its fair value. Any excess of the carrying value of the indefinite-lived intangible asset over its fair value is recognized as an impairment loss. The Company periodically engages third-party valuation consultants to assist with this process. Impairment losses are recorded primarily to Other (charges) gains, net.
Management tests indefinite-lived intangible assets utilizing the relief from royalty method to determine the estimated fair value for each indefinite-lived intangible asset which is classified as a Level 3 measurement under FASB ASC Topic 820. The relief from royalty method estimates the Company's theoretical royalty savings from ownership of the intangible asset. Key assumptions used in this model include discount rates, royalty rates, growth rates, sales projections and terminal value rates. Discount rates, royalty rates, growth rates and sales projections are the assumptions most sensitive and susceptible to change as they require significant management judgment. Discount rates used are similar to the rates estimated by the weighted average cost of capital ("WACC") considering any differences in company-specific risk factors. Royalty rates are established by management and are periodically substantiated by third-party valuation consultants. Operational management, considering industry and company-specific historical and projected data, develops growth rates and sales projections associated with each indefinite-lived intangible asset. Terminal value rate determination follows common methodology of capturing the present value of perpetual sales estimates beyond the last projected period assuming a constant WACC and low long-term growth rates.
The Company assesses the recoverability of finite-lived intangible assets in the same manner as for property, plant and equipment as described above. Impairment losses are recorded primarily to Other (charges) gains, net.
The Company manages its exposures to currency exchange rates, interest rates and commodity prices through a risk management program that includes the use of derivative financial instruments. The Company does not use derivative financial instruments for speculative trading purposes. The fair value of all derivative instruments is recorded as an asset or liability at the balance sheet date. Changes in the fair value of these instruments are reported in earnings or Accumulated other comprehensive income (loss), net, depending on the use of the derivative and whether it qualifies for hedge accounting treatment under the provisions of FASB ASC Topic 815, Derivatives and Hedging ("FASB ASC Topic 815").
Gains and losses on derivative instruments qualifying as cash flow hedges are recorded in Accumulated other comprehensive income (loss), net, to the extent the hedges are effective, until the underlying transactions are recognized in earnings. To the extent effective, gains and losses on derivative and non-derivative instruments used as hedges of the Company's net investment in foreign operations are recorded in Accumulated other comprehensive income (loss), net as part of the foreign currency translation adjustment. The ineffective portions of cash flow hedges and hedges of net investment in foreign operations, if any, are recognized in earnings immediately. Derivative instruments not designated as hedges are marked to market at the end of each accounting period with the change in fair value recorded in earnings.
The Company is exposed to credit risk in the event of nonpayment by customers and counterparties. The creditworthiness of customers and counterparties is subject to continuing review, including the use of master netting agreements, where the Company deems appropriate. The Company minimizes concentrations of credit risk through diverse customers across many different industries and geographies. In addition, credit risk arising from derivative instruments is not significant because the counterparties to these contracts are primarily major international financial institutions and, to a lesser extent, major chemical companies. Where appropriate, the Company has diversified its selection of counterparties. Generally, collateral is not required from customers and counterparties and allowances are provided for specific risks inherent in receivables.
The Company maintains allowances for doubtful accounts for estimated losses resulting from the inability of its customers to make required payments. The Company believes, based on historical results, the likelihood of actual write-offs having a material impact on financial results is low. The allowance for doubtful accounts is estimated using factors such as customer credit ratings, past collection history and general risk profile. Receivables are charged against the allowance for doubtful accounts when it is probable that the receivable will not be recovered.
78
• Financial instruments
• Concentrations of credit risk
• Allowance for doubtful accounts
The Company capitalizes direct costs incurred to obtain debt financings and amortizes these costs using a method that approximates the effective interest rate method over the terms of the related debt. Upon the extinguishment of the related debt, any unamortized capitalized debt financing costs are immediately expensed.
The Company manufactures and sells a diverse line of chemical products throughout the world. Accordingly, the Company's operations are subject to various hazards incidental to the production of industrial chemicals including the use, handling, processing, storage and transportation of hazardous materials. The Company recognizes losses and accrues liabilities relating to environmental matters if available information indicates that it is probable that a liability has been incurred and the amount of loss can be reasonably estimated. Depending on the nature of the site, the Company accrues through 15 years , unless the Company has government orders or other agreements that extend beyond 15 years . If the event of loss is neither probable nor reasonably estimable, but is reasonably possible, the Company provides appropriate disclosure in the notes to the consolidated financial statements if the contingency is considered material. The Company estimates environmental liabilities on a case-by-case basis using the most current status of available facts, existing technology, presently enacted laws and regulations and prior experience in remediation of contaminated sites. Recoveries of environmental costs from other parties are recorded as assets when their receipt is deemed probable.
An environmental reserve related to cleanup of a contaminated site might include, for example, a provision for one or more of the following types of costs: site investigation and testing costs, cleanup costs, costs related to soil and water contamination resulting from tank ruptures and post-remediation monitoring costs. These reserves do not take into account any claims or recoveries from insurance. The measurement of environmental liabilities is based on the Company's periodic estimate of what it will cost to perform each of the elements of the remediation effort. The Company utilizes third parties to assist in the management and development of cost estimates for its sites. Changes to environmental regulations or other factors affecting environmental liabilities are reflected in the consolidated financial statements in the period in which they occur.
The Company accrues for legal fees related to loss contingency matters when the costs associated with defending these matters can be reasonably estimated and are probable of occurring. All other legal fees are expensed as incurred.
The Company recognizes revenue when title and risk of loss have been transferred to the customer, generally at the time of shipment of products, and provided that four basic criteria are met: (a) persuasive evidence of an arrangement exists; (b) delivery has occurred or services have been rendered; (c) the fee is fixed or determinable; and (d) collectibility is reasonably assured. Should changes in conditions cause the Company to determine revenue recognition criteria are not met for certain transactions, revenue recognition would be delayed until such time that the transactions become realizable and fully earned. Payments received in advance of meeting the above revenue recognition criteria are recorded as deferred revenue. Shipping and handling fees billed to customers in a sales transaction are recorded in Net sales and shipping and handling costs incurred are recorded in Cost of sales.
The costs of research and development are charged as an expense in the period in which they are incurred.
The Company has two wholly-owned insurance companies (the "Captives") that are used as a form of self insurance for liability and workers compensation risks. The Captives enter into reinsurance arrangements to reduce their risk of loss. The reinsurance arrangements do not relieve the Captives from their obligations to policyholders. Failure of the reinsurers to honor their obligations could result in losses to the Captives. The Captives evaluate the financial condition of their reinsurers and monitor concentrations of credit risk to minimize their exposure to significant losses from reinsurer insolvencies and to establish allowances for amounts deemed non-collectible.
One of the Captives also insures certain third-party risks. The liabilities recorded by the Captives relate to the estimated risk of loss, which is based on management estimates and actuarial valuations, and unearned premiums, which represent the portion of the third-party premiums written applicable to the unexpired terms of the policies in-force. Liabilities are recognized for known
79
• Deferred financing costs
• Environmental liabilities
• Legal fees
• Revenue recognition
• Research and development
• Insurance loss reserves
claims when sufficient information has been developed to indicate involvement of a specific policy and the Company can reasonably estimate its liability. In addition, liabilities have been established to cover additional exposure on both known and unasserted claims. Estimates of the liabilities are reviewed and updated regularly. It is possible that actual results could differ significantly from the recorded liabilities. Premiums written are recognized as revenue as earned based on the terms of the policies. Capitalization of the Captives is determined by regulatory guidelines.
The provision for income taxes is determined using the asset and liability approach of accounting for income taxes. Under this approach, deferred income taxes reflect the net tax effects of temporary differences between the carrying amounts of assets and liabilities for financial reporting purposes and the amounts used for income tax purposes and net operating loss and tax credit carryforwards. The amount of deferred taxes on these temporary differences is determined using the tax rates that are expected to apply to the period when the asset is realized or the liability is settled, as applicable, based on tax rates and laws in the respective tax jurisdiction enacted as of the balance sheet date.
The Company reviews its deferred tax assets for recoverability and establishes a valuation allowance based on historical taxable income, projected future taxable income, applicable tax strategies and the expected timing of the reversals of existing temporary differences. A valuation allowance is provided when it is more likely than not (likelihood of greater than 50% ) that some portion or all of the deferred tax assets will not be realized.
The Company considers many factors when evaluating and estimating its tax positions and tax benefits, which may require periodic adjustments and which may not accurately anticipate actual outcomes. Tax positions are recognized only when it is more likely than not, based on technical merits, that the positions will be sustained upon examination. Tax positions that meet the more-likely-than-not threshold are measured using a probability weighted approach as the largest amount of tax benefit that is greater than 50% likely of being realized upon settlement. Whether the more-likely-than-not recognition threshold is met for a tax position is a matter of judgment based on the individual facts and circumstances of that position evaluated in light of all available evidence.
The Company recognizes interest and penalties related to uncertain tax positions in Income tax (provision) benefit in the consolidated statement of operations.
For the Company's international operations where the functional currency is other than the US dollar, assets and liabilities are translated using period-end exchange rates, while the statement of operations amounts are translated using the average exchange rates for the respective period. Differences arising from the translation of assets and liabilities in comparison with the translation of the previous periods or from initial recognition during the period are included as a separate component of Accumulated other comprehensive income (loss), net.
3. Accounting Pronouncements
In February 2013, the FASB issued Accounting Standards Update ("ASU") 2013-02, Reporting of Amounts Reclassified Out of Accumulated Other Comprehensive Income , an amendment to FASB ASC Topic 220. The update requires disclosure of amounts reclassified out of accumulated other comprehensive income by component. In addition, an entity is required to present either on the face of the statement of operations or in the notes, significant amounts reclassified out of accumulated other comprehensive income by the respective line items of net income but only if the amount reclassified is required to be reclassified to net income in its entirety in the same reporting period. For amounts not reclassified in their entirety to net income, an entity is required to cross-reference to other disclosures that provide additional detail about those amounts. This ASU is effective prospectively for the Company for annual and interim periods beginning January 1, 2013. The Company will comply with the disclosure requirements of this ASU for the quarter ending March 31, 2013.
In January 2013, the FASB issued ASU 2013-01, Clarifying the Scope of Disclosures about Offsetting Assets and Liabilities , an amendment to FASB ASC Topic 210. The update clarifies that the scope of ASU 2011-11, Disclosures about Offsetting Assets and Liabilities , applies to derivatives accounted for in accordance with FASB ASC Topic 815, Derivatives and Hedging , including bifurcated embedded derivatives, repurchase agreements and reverse repurchase agreements, and securities borrowing and securities lending transactions that are either offset or subject to an enforceable master netting arrangement or similar agreement. This ASU is effective for the Company for annual and interim periods beginning January 1, 2013. The Company will comply with the disclosure requirements of this ASU for the quarter ending March 31, 2013.
80
• Income taxes
• Functional and reporting currencies
In July 2012, the FASB issued ASU 2012-02, Testing Indefinite-Lived Intangible Assets for Impairment , an amendment to FASB ASC Topic 350. The update provides an entity with the option first to assess qualitative factors in determining whether it is more likely than not that the indefinite-lived intangible asset is impaired. After assessing the qualitative factors, if an entity determines that it is not more likely than not that the indefinite-lived intangible asset is impaired, then the entity is not required to take further action. If an entity concludes otherwise, then it is required to determine the fair value of the indefinite-lived intangible asset and perform the quantitative impairment test. The ASU is effective for the Company for annual and interim impairment tests performed for fiscal years beginning after September 15, 2012. Early adoption was permitted. The Company did not early adopt the provisions of this ASU; however, the Company does not expect the impact of adopting this ASU to be material to the Company's financial position, results of operations or cash flows.
4. Acquisitions, Dispositions, Ventures and Plant Closures
Acquisitions
On January 3, 2012, the Company completed the acquisition of certain assets from Ashland Inc., including two product lines, Vinac ® and Flexbond ® , to support the strategic growth of the Company's Emulsions business. In February 2011, the Company acquired a business primarily consisting of emulsions process technology from Crown Paints Limited. Both of the acquired operations are included in the Industrial Specialties segment ( Note 10 ).
In May 2010, the Company acquired Zenite ® liquid crystal polymer ("LCP") and Thermx ® polycyclohexylene-dimethylene terephthalate ("PCT") product lines from DuPont Performance Polymers. The acquisition builds on the Company’s position as a global supplier of high performance materials and technology-driven applications. The acquired product lines are included in the Advanced Engineered Materials segment.
Pro forma financial information since the respective acquisition dates has not been provided as the acquisitions did not have a material impact on the Company’s financial information.
The Company allocated the purchase price of the acquisitions to identifiable intangible assets acquired based on their estimated fair values. The excess of purchase price over the aggregate fair values was recorded as goodwill. Intangible assets were valued using the relief from royalty and discounted cash flow methodologies which are considered Level 3 measurements under FASB ASC Topic 820. The relief from royalty method estimates the Company’s theoretical royalty savings from ownership of the intangible asset. Key assumptions used in this model include discount rates, royalty rates, growth rates, sales projections and terminal value rates, all of which require significant management judgment and, therefore, are susceptible to change. The key assumptions used in the discounted cash flow valuation model include discount rates, growth rates, cash flow projections and terminal value rates. Discount rates, growth rates and cash flow projections are the most sensitive and susceptible to change as they require significant management judgment. The Company, with the assistance of third-party valuation consultants, calculated the fair value of the intangible assets acquired to allocate the purchase price at the respective acquisition date.
Ventures
The Company indirectly owns a 25% interest in its National Methanol Company ("Ibn Sina") affiliate through CTE Petrochemicals Company ("CTE"), a joint venture with Texas Eastern Arabian Corporation Ltd. (which also indirectly owns 25% of Ibn Sina). The remaining interest in Ibn Sina is held by Saudi Basic Industries Corporation ("SABIC"). SABIC and CTE entered into the Ibn Sina joint venture agreement in 1981. In April 2010, the Company announced that Ibn Sina will construct a 50,000 ton per year polyacetal ("POM") production facility in Saudi Arabia and that the term of the joint venture agreement was extended until 2032. Ibn Sina’s existing natural gas supply contract expires in 2022. Upon successful startup of the POM facility, which is expected to be completed in 2015, the Company’s indirect economic interest in Ibn Sina will increase from 25% to 32.5% although the Company's indirect ownership interest will remain unchanged. SABIC’s economic and ownership interest will remain unchanged. The Ibn Sina equity method investment is included in the Advanced Engineered Materials segment.
Plant Closures
• Spondon, Derby, United Kingdom
In March 2010, the Company assessed the possibility of consolidating its global acetate flake and acetate tow manufacturing operations to strengthen the Company's competitive position, reduce fixed costs and align future production capacities with anticipated industry demand trends. Based on this assessment, the Company concluded that certain long-lived assets were partially impaired and recorded long-lived asset impairment losses of $72 million ( Note 17 ) to Other (charges) gains, net in the consolidated statements of operations. The Spondon, Derby, United Kingdom operations are included in the Consumer
81
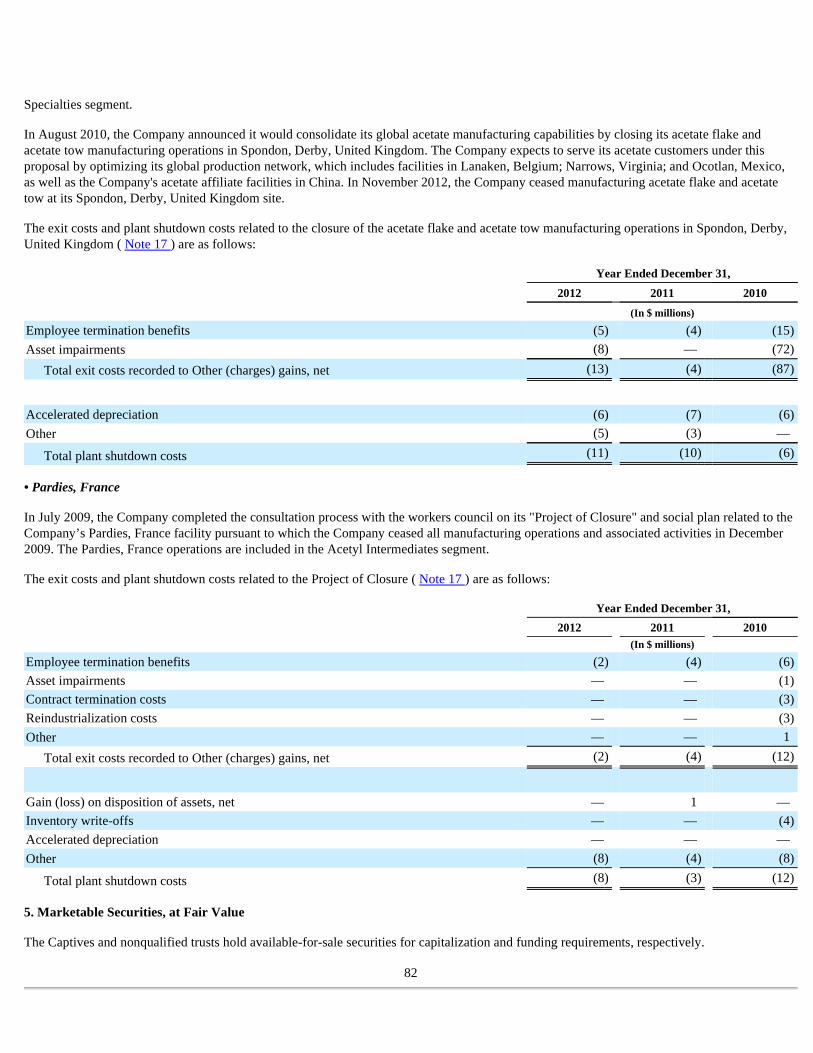
Specialties segment.
In August 2010, the Company announced it would consolidate its global acetate manufacturing capabilities by closing its acetate flake and acetate tow manufacturing operations in Spondon, Derby, United Kingdom. The Company expects to serve its acetate customers under this proposal by optimizing its global production network, which includes facilities in Lanaken, Belgium; Narrows, Virginia; and Ocotlan, Mexico, as well as the Company's acetate affiliate facilities in China. In November 2012, the Company ceased manufacturing acetate flake and acetate tow at its Spondon, Derby, United Kingdom site.
The exit costs and plant shutdown costs related to the closure of the acetate flake and acetate tow manufacturing operations in Spondon, Derby, United Kingdom ( Note 17 ) are as follows:
• Pardies, France
In July 2009, the Company completed the consultation process with the workers council on its "Project of Closure" and social plan related to the Company’s Pardies, France facility pursuant to which the Company ceased all manufacturing operations and associated activities in December 2009. The Pardies, France operations are included in the Acetyl Intermediates segment.
The exit costs and plant shutdown costs related to the Project of Closure ( Note 17 ) are as follows:
5. Marketable Securities, at Fair Value
The Captives and nonqualified trusts hold available-for-sale securities for capitalization and funding requirements, respectively.
82
Year Ended December 31,
2012 2011 2010
(In $ millions)
Employee termination benefits (5 ) (4 ) (15 )
Asset impairments (8 ) — (72 )
Total exit costs recorded to Other (charges) gains, net (13 ) (4 ) (87 )
Accelerated depreciation (6 ) (7 ) (6 )
Other (5 ) (3 ) —
Total plant shutdown costs (11 ) (10 ) (6 )
Year Ended December 31,
2012 2011 2010 (In $ millions)
Employee termination benefits (2 ) (4 ) (6 )
Asset impairments — — (1 )
Contract termination costs — — (3 )
Reindustrialization costs — — (3 )
Other — — 1
Total exit costs recorded to Other (charges) gains, net (2 ) (4 ) (12 )
Gain (loss) on disposition of assets, net — 1 — Inventory write-offs — — (4 )
Accelerated depreciation — — — Other (8 ) (4 ) (8 )
Total plant shutdown costs (8 ) (3 ) (12 )
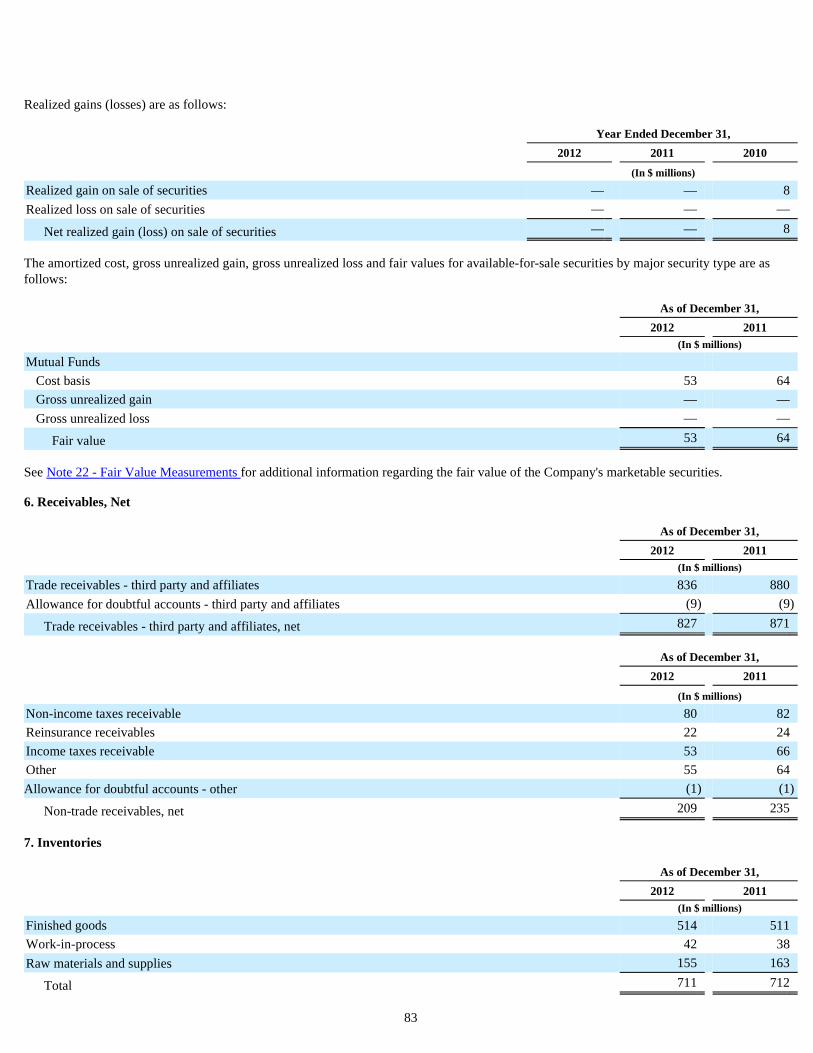
Realized gains (losses) are as follows:
The amortized cost, gross unrealized gain, gross unrealized loss and fair values for available-for-sale securities by major security type are as follows:
See Note 22 - Fair Value Measurements for additional information regarding the fair value of the Company's marketable securities.
6. Receivables, Net
7. Inventories
83
Year Ended December 31,
2012 2011 2010
(In $ millions)
Realized gain on sale of securities — — 8 Realized loss on sale of securities — — —
Net realized gain (loss) on sale of securities — — 8
As of December 31,
2012 2011 (In $ millions)
Mutual Funds
Cost basis 53 64 Gross unrealized gain — — Gross unrealized loss — —
Fair value 53 64
As of December 31,
2012 2011 (In $ millions)
Trade receivables - third party and affiliates 836 880 Allowance for doubtful accounts - third party and affiliates (9 ) (9 )
Trade receivables - third party and affiliates, net 827 871
As of December 31,
2012 2011
(In $ millions)
Non-income taxes receivable 80 82 Reinsurance receivables 22 24 Income taxes receivable 53 66 Other 55 64 Allowance for doubtful accounts - other (1 ) (1 )
Non-trade receivables, net 209 235
As of December 31,
2012 2011 (In $ millions)
Finished goods 514 511 Work-in-process 42 38 Raw materials and supplies 155 163
Total 711 712

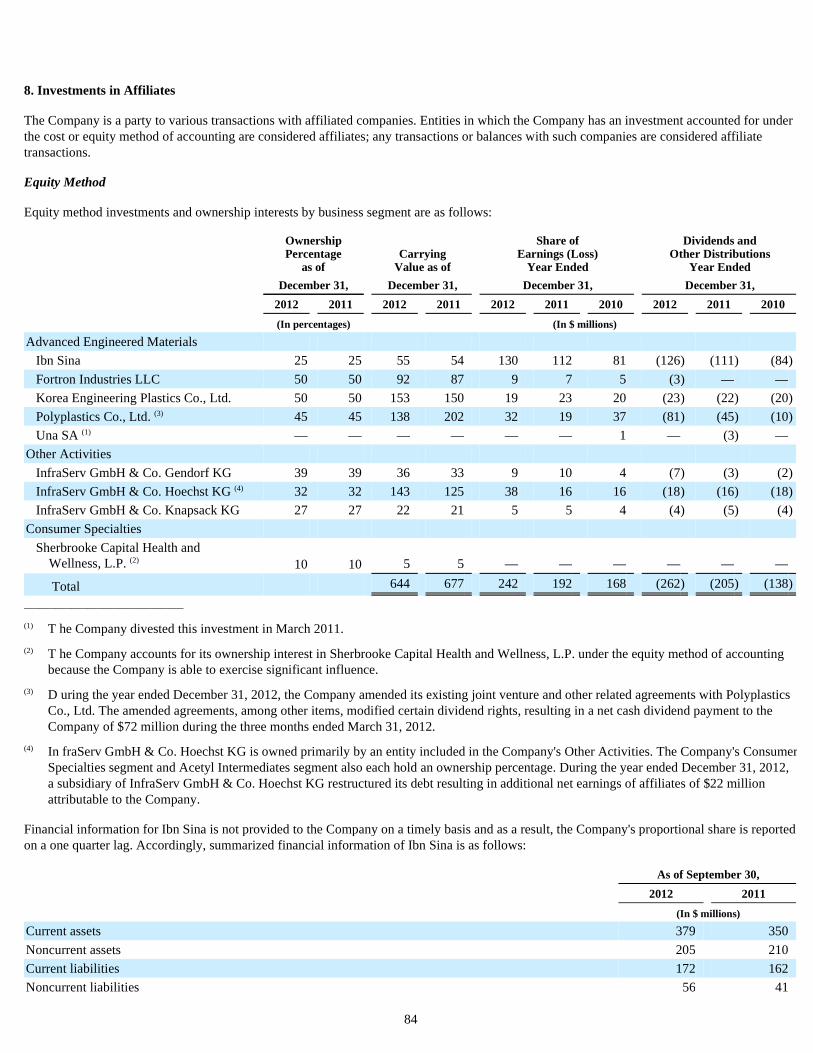
8. Investments in Affiliates
The Company is a party to various transactions with affiliated companies. Entities in which the Company has an investment accounted for under the cost or equity method of accounting are considered affiliates; any transactions or balances with such companies are considered affiliate transactions.
Equity Method
Equity method investments and ownership interests by business segment are as follows:
______________________________
Financial information for Ibn Sina is not provided to the Company on a timely basis and as a result, the Company's proportional share is reported on a one quarter lag. Accordingly, summarized financial information of Ibn Sina is as follows:
84
Ownership Percentage
as of Carrying
Value as of
Share of Earnings (Loss)
Year Ended
Dividends and Other Distributions
Year Ended
December 31, December 31, December 31, December 31,
2012 2011 2012 2011 2012 2011 2010 2012 2011 2010
(In percentages) (In $ millions)
Advanced Engineered Materials
Ibn Sina 25 25 55 54 130 112 81 (126 ) (111 ) (84 )
Fortron Industries LLC 50 50 92 87 9 7 5 (3 ) — — Korea Engineering Plastics Co., Ltd. 50 50 153 150 19 23 20 (23 ) (22 ) (20 )
Polyplastics Co., Ltd. (3) 45 45 138 202 32 19 37 (81 ) (45 ) (10 )
Una SA (1) — — — — — — 1 — (3 ) — Other Activities
InfraServ GmbH & Co. Gendorf KG 39 39 36 33 9 10 4 (7 ) (3 ) (2 )
InfraServ GmbH & Co. Hoechst KG (4) 32 32 143 125 38 16 16 (18 ) (16 ) (18 )
InfraServ GmbH & Co. Knapsack KG 27 27 22 21 5 5 4 (4 ) (5 ) (4 )
Consumer Specialties
Sherbrooke Capital Health and Wellness, L.P. (2) 10 10 5 5 — — — — — —
Total 644 677 242 192 168 (262 ) (205 ) (138 )
(1) T he Company divested this investment in March 2011.
(2) T he Company accounts for its ownership interest in Sherbrooke Capital Health and Wellness, L.P. under the equity method of accounting because the Company is able to exercise significant influence.
(3) D uring the year ended December 31, 2012, the Company amended its existing joint venture and other related agreements with Polyplastics Co., Ltd. The amended agreements, among other items, modified certain dividend rights, resulting in a net cash dividend payment to the Company of $72 million during the three months ended March 31, 2012.
(4) In fraServ GmbH & Co. Hoechst KG is owned primarily by an entity included in the Company's Other Activities. The Company's Consumer Specialties segment and Acetyl Intermediates segment also each hold an ownership percentage. During the year ended December 31, 2012, a subsidiary of InfraServ GmbH & Co. Hoechst KG restructured its debt resulting in additional net earnings of affiliates of $22 million attributable to the Company.
As of September 30,
2012 2011
(In $ millions)
Current assets 379 350 Noncurrent assets 205 210 Current liabilities 172 162 Noncurrent liabilities 56 41

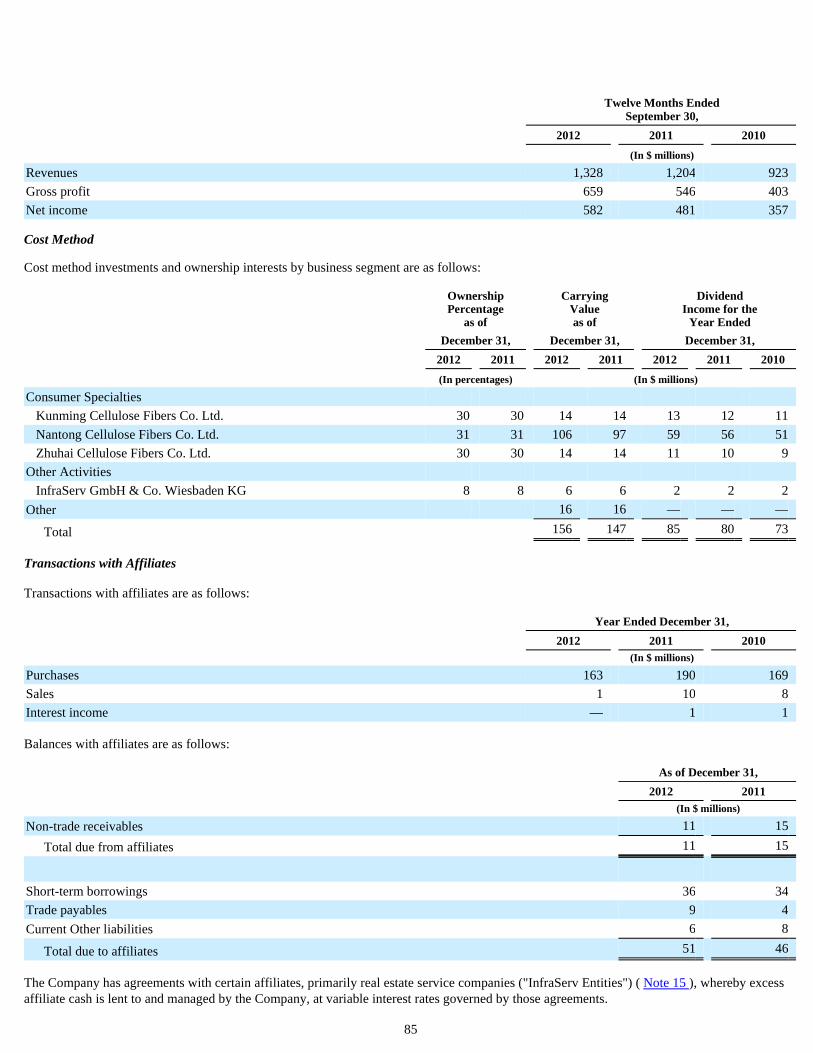
Cost Method
Cost method investments and ownership interests by business segment are as follows:
Transactions with Affiliates
Transactions with affiliates are as follows:
Balances with affiliates are as follows:
The Company has agreements with certain affiliates, primarily real estate service companies ("InfraServ Entities") ( Note 15 ), whereby excess affiliate cash is lent to and managed by the Company, at variable interest rates governed by those agreements.
85
Twelve Months Ended
September 30,
2012 2011 2010
(In $ millions)
Revenues 1,328 1,204 923 Gross profit 659 546 403 Net income 582 481 357
Ownership Percentage
as of
Carrying Value as of
Dividend Income for the
Year Ended
December 31, December 31, December 31,
2012 2011 2012 2011 2012 2011 2010
(In percentages) (In $ millions)
Consumer Specialties
Kunming Cellulose Fibers Co. Ltd. 30 30 14 14 13 12 11 Nantong Cellulose Fibers Co. Ltd. 31 31 106 97 59 56 51 Zhuhai Cellulose Fibers Co. Ltd. 30 30 14 14 11 10 9
Other Activities
InfraServ GmbH & Co. Wiesbaden KG 8 8 6 6 2 2 2 Other 16 16 — — —
Total 156 147 85 80 73
Year Ended December 31,
2012 2011 2010 (In $ millions)
Purchases 163 190 169 Sales 1 10 8 Interest income — 1 1
As of December 31,
2012 2011 (In $ millions)
Non-trade receivables 11 15
Total due from affiliates 11 15
Short-term borrowings 36 34 Trade payables 9 4 Current Other liabilities 6 8
Total due to affiliates 51 46

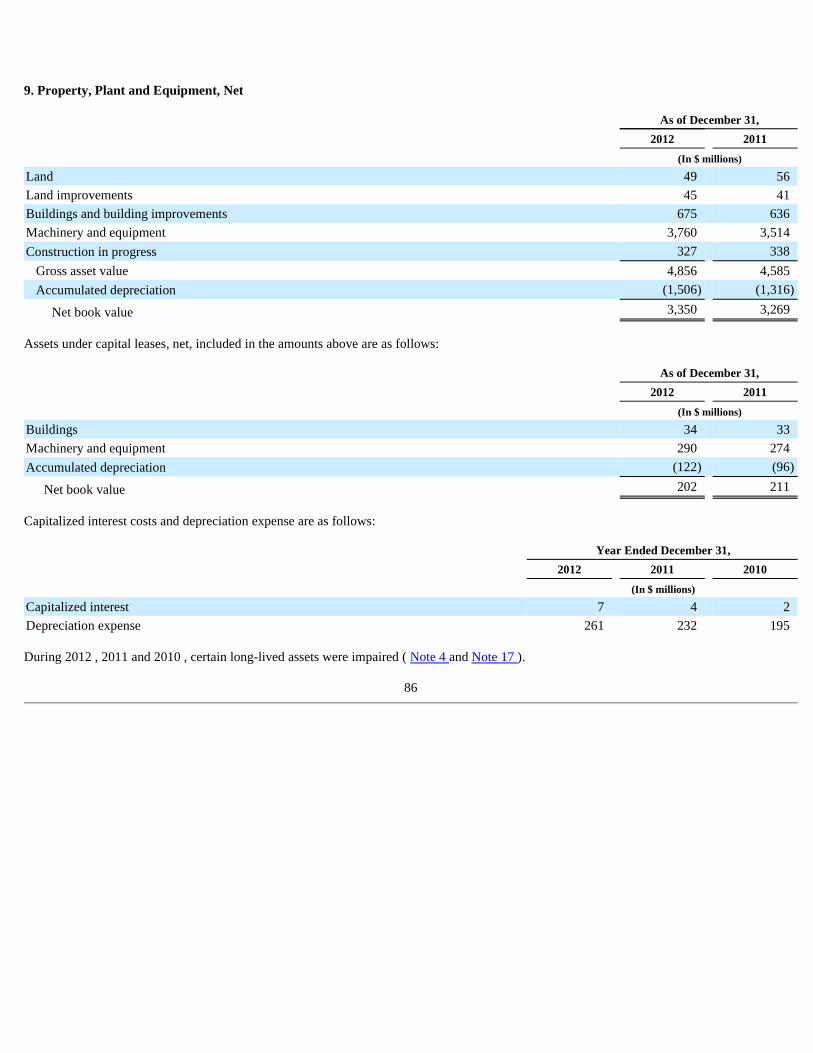
9. Property, Plant and Equipment, Net
Assets under capital leases, net, included in the amounts above are as follows:
Capitalized interest costs and depreciation expense are as follows:
During 2012 , 2011 and 2010 , certain long-lived assets were impaired ( Note 4 and Note 17 ).
86
As of December 31,
2012 2011
(In $ millions)
Land 49 56 Land improvements 45 41 Buildings and building improvements 675 636 Machinery and equipment 3,760 3,514 Construction in progress 327 338
Gross asset value 4,856 4,585 Accumulated depreciation (1,506 ) (1,316 )
Net book value 3,350 3,269
As of December 31,
2012 2011
(In $ millions)
Buildings 34 33 Machinery and equipment 290 274 Accumulated depreciation (122 ) (96 )
Net book value 202 211
Year Ended December 31,
2012 2011 2010
(In $ millions)
Capitalized interest 7 4 2 Depreciation expense 261 232 195
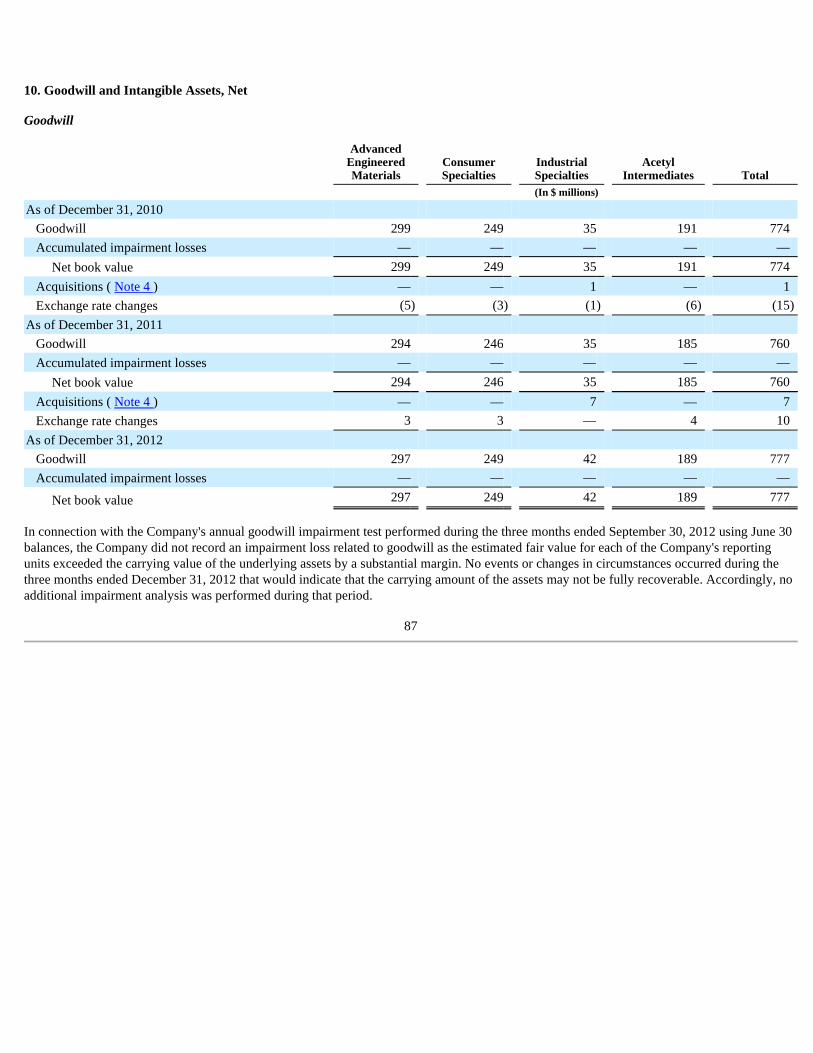
10. Goodwill and Intangible Assets, Net
Goodwill
In connection with the Company's annual goodwill impairment test performed during the three months ended September 30, 2012 using June 30 balances, the Company did not record an impairment loss related to goodwill as the estimated fair value for each of the Company's reporting units exceeded the carrying value of the underlying assets by a substantial margin. No events or changes in circumstances occurred during the three months ended December 31, 2012 that would indicate that the carrying amount of the assets may not be fully recoverable. Accordingly, no additional impairment analysis was performed during that period.
87
Advanced Engineered Materials
Consumer Specialties
Industrial Specialties
Acetyl Intermediates Total
(In $ millions)
As of December 31, 2010
Goodwill 299 249 35 191 774 Accumulated impairment losses — — — — —
Net book value 299 249 35 191 774 Acquisitions ( Note 4 ) — — 1 — 1 Exchange rate changes (5 ) (3 ) (1 ) (6 ) (15 )
As of December 31, 2011
Goodwill 294 246 35 185 760 Accumulated impairment losses — — — — —
Net book value 294 246 35 185 760 Acquisitions ( Note 4 ) — — 7 — 7 Exchange rate changes 3 3 — 4 10
As of December 31, 2012
Goodwill 297 249 42 189 777 Accumulated impairment losses — — — — —
Net book value 297 249 42 189 777
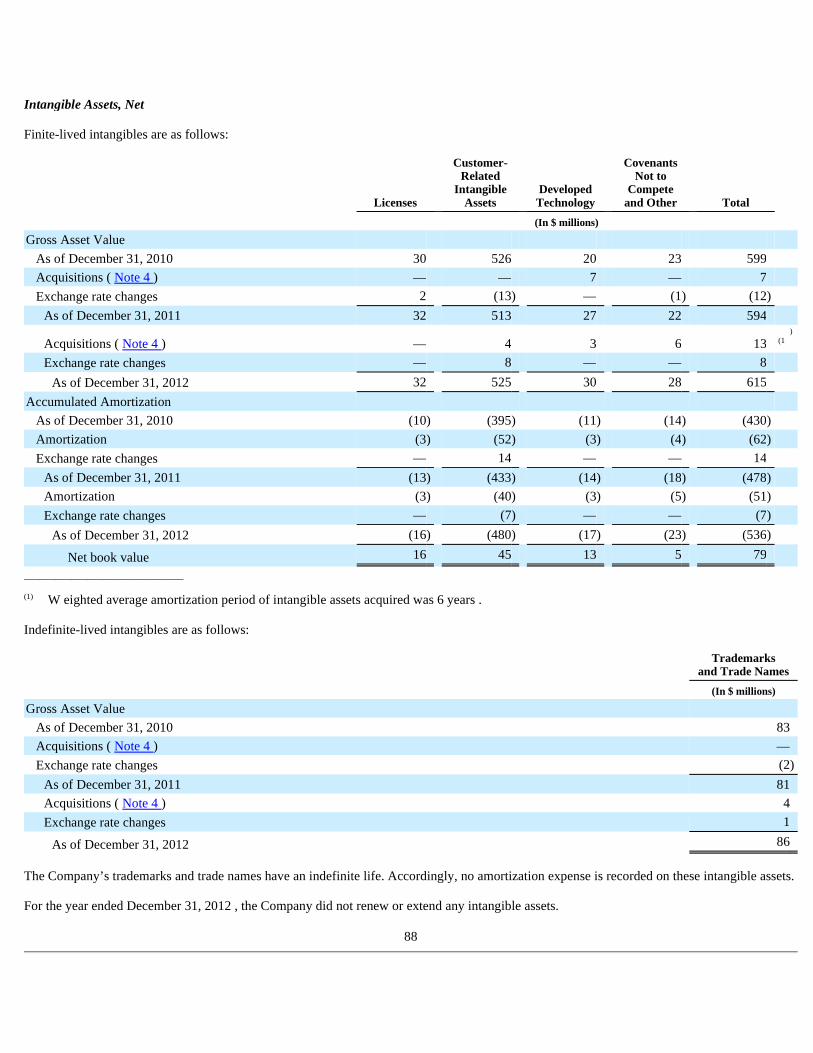
Intangible Assets, Net
Finite-lived intangibles are as follows:
______________________________
Indefinite-lived intangibles are as follows:
The Company’s trademarks and trade names have an indefinite life. Accordingly, no amortization expense is recorded on these intangible assets.
For the year ended December 31, 2012 , the Company did not renew or extend any intangible assets.
88
Licenses
Customer- Related
Intangible Assets
Developed Technology
Covenants Not to
Compete and Other Total
(In $ millions)
Gross Asset Value
As of December 31, 2010 30 526 20 23 599
Acquisitions ( Note 4 ) — — 7 — 7
Exchange rate changes 2 (13 ) — (1 ) (12 )
As of December 31, 2011 32 513 27 22 594
Acquisitions ( Note 4 ) — 4 3 6 13 (1 )
Exchange rate changes — 8 — — 8
As of December 31, 2012 32 525 30 28 615
Accumulated Amortization
As of December 31, 2010 (10 ) (395 ) (11 ) (14 ) (430 )
Amortization (3 ) (52 ) (3 ) (4 ) (62 )
Exchange rate changes — 14 — — 14
As of December 31, 2011 (13 ) (433 ) (14 ) (18 ) (478 )
Amortization (3 ) (40 ) (3 ) (5 ) (51 )
Exchange rate changes — (7 ) — — (7 )
As of December 31, 2012 (16 ) (480 ) (17 ) (23 ) (536 )
Net book value 16 45 13 5 79
(1) W eighted average amortization period of intangible assets acquired was 6 years .
Trademarks
and Trade Names
(In $ millions)
Gross Asset Value
As of December 31, 2010 83 Acquisitions ( Note 4 ) — Exchange rate changes (2 )
As of December 31, 2011 81 Acquisitions ( Note 4 ) 4 Exchange rate changes 1
As of December 31, 2012 86
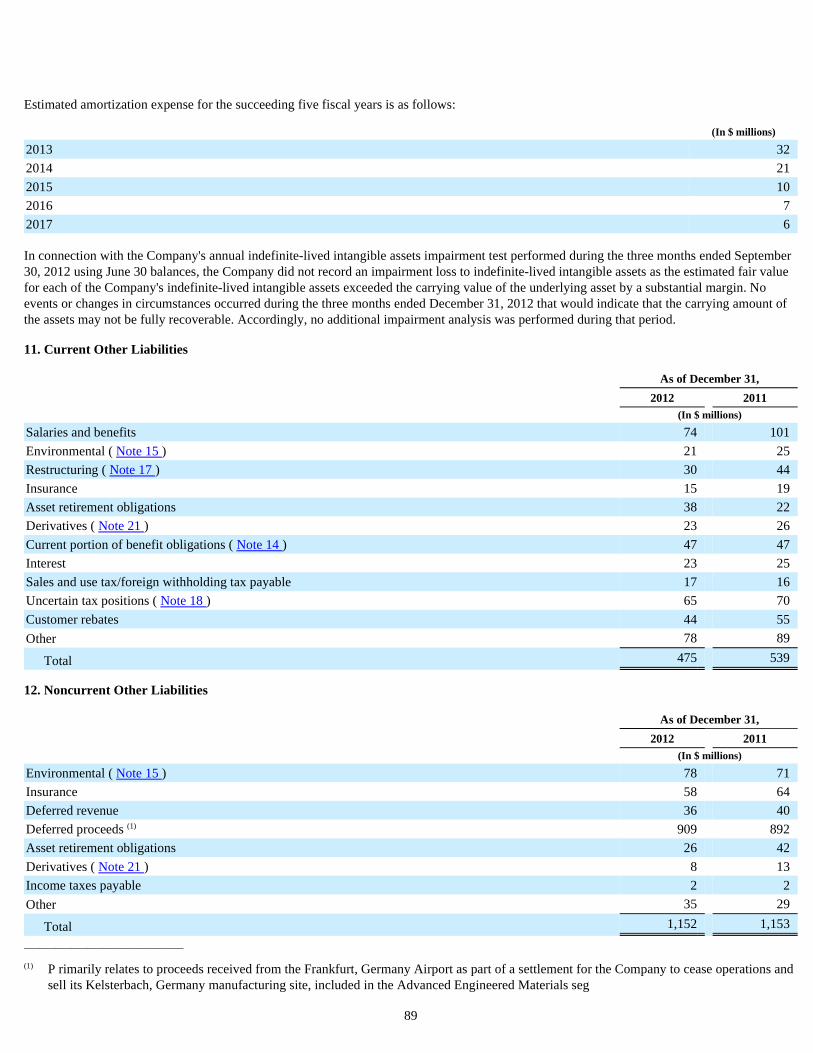
Estimated amortization expense for the succeeding five fiscal years is as follows:
In connection with the Company's annual indefinite-lived intangible assets impairment test performed during the three months ended September 30, 2012 using June 30 balances, the Company did not record an impairment loss to indefinite-lived intangible assets as the estimated fair value for each of the Company's indefinite-lived intangible assets exceeded the carrying value of the underlying asset by a substantial margin. No events or changes in circumstances occurred during the three months ended December 31, 2012 that would indicate that the carrying amount of the assets may not be fully recoverable. Accordingly, no additional impairment analysis was performed during that period.
11. Current Other Liabilities
12. Noncurrent Other Liabilities
______________________________
89
(In $ millions)
2013 32 2014 21 2015 10 2016 7 2017 6
As of December 31,
2012 2011 (In $ millions)
Salaries and benefits 74 101 Environmental ( Note 15 ) 21 25 Restructuring ( Note 17 ) 30 44 Insurance 15 19 Asset retirement obligations 38 22 Derivatives ( Note 21 ) 23 26 Current portion of benefit obligations ( Note 14 ) 47 47 Interest 23 25 Sales and use tax/foreign withholding tax payable 17 16 Uncertain tax positions ( Note 18 ) 65 70 Customer rebates 44 55 Other 78 89
Total 475 539
As of December 31,
2012 2011 (In $ millions)
Environmental ( Note 15 ) 78 71 Insurance 58 64 Deferred revenue 36 40 Deferred proceeds (1) 909 892 Asset retirement obligations 26 42 Derivatives ( Note 21 ) 8 13 Income taxes payable 2 2 Other 35 29
Total 1,152 1,153
(1) P rimarily relates to proceeds received from the Frankfurt, Germany Airport as part of a settlement for the Company to cease operations and sell its Kelsterbach, Germany manufacturing site, included in the Advanced Engineered Materials seg

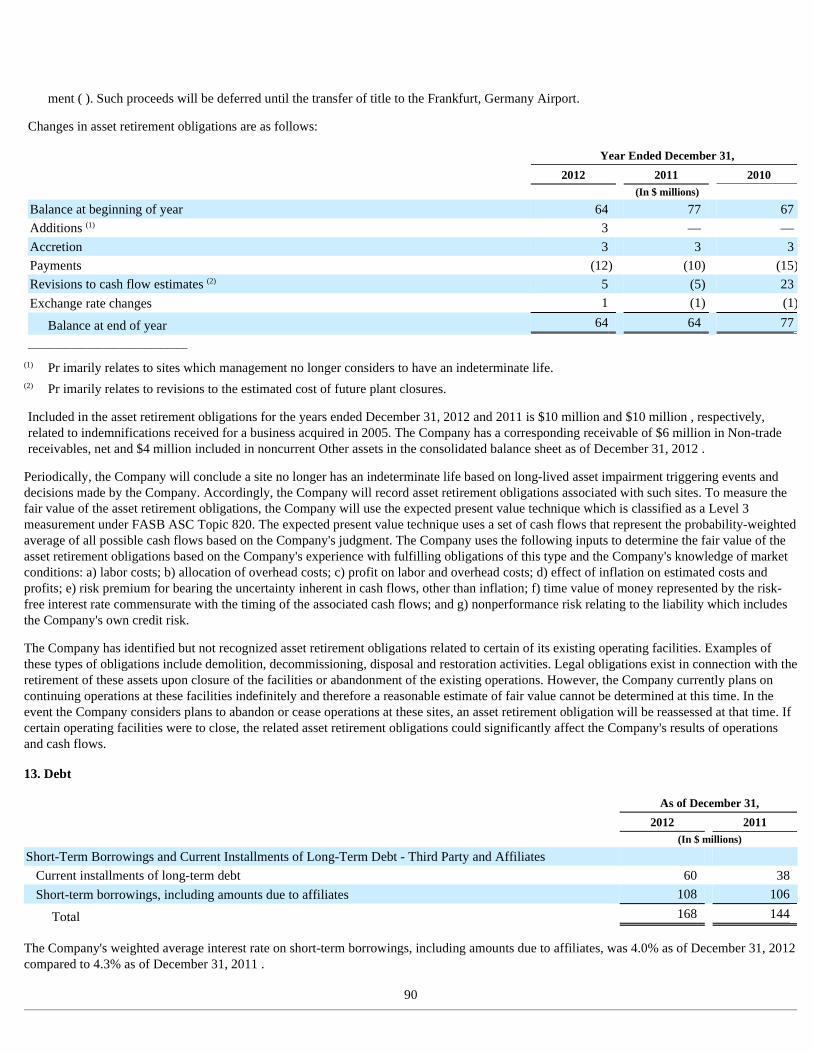
ment ( ). Such proceeds will be deferred until the transfer of title to the Frankfurt, Germany Airport.
Changes in asset retirement obligations are as follows:
______________________________
Included in the asset retirement obligations for the years ended December 31, 2012 and 2011 is $10 million and $10 million , respectively, related to indemnifications received for a business acquired in 2005. The Company has a corresponding receivable of $6 million in Non-trade receivables, net and $4 million included in noncurrent Other assets in the consolidated balance sheet as of December 31, 2012 .
Periodically, the Company will conclude a site no longer has an indeterminate life based on long-lived asset impairment triggering events and decisions made by the Company. Accordingly, the Company will record asset retirement obligations associated with such sites. To measure the fair value of the asset retirement obligations, the Company will use the expected present value technique which is classified as a Level 3 measurement under FASB ASC Topic 820. The expected present value technique uses a set of cash flows that represent the probability-weighted average of all possible cash flows based on the Company's judgment. The Company uses the following inputs to determine the fair value of the asset retirement obligations based on the Company's experience with fulfilling obligations of this type and the Company's knowledge of market conditions: a) labor costs; b) allocation of overhead costs; c) profit on labor and overhead costs; d) effect of inflation on estimated costs and profits; e) risk premium for bearing the uncertainty inherent in cash flows, other than inflation; f) time value of money represented by the risk-free interest rate commensurate with the timing of the associated cash flows; and g) nonperformance risk relating to the liability which includes the Company's own credit risk.
The Company has identified but not recognized asset retirement obligations related to certain of its existing operating facilities. Examples of these types of obligations include demolition, decommissioning, disposal and restoration activities. Legal obligations exist in connection with the retirement of these assets upon closure of the facilities or abandonment of the existing operations. However, the Company currently plans on continuing operations at these facilities indefinitely and therefore a reasonable estimate of fair value cannot be determined at this time. In the event the Company considers plans to abandon or cease operations at these sites, an asset retirement obligation will be reassessed at that time. If certain operating facilities were to close, the related asset retirement obligations could significantly affect the Company's results of operations and cash flows.
13. Debt
The Company's weighted average interest rate on short-term borrowings, including amounts due to affiliates, was 4.0% as of December 31, 2012 compared to 4.3% as of December 31, 2011 .
90
Year Ended December 31,
2012 2011 2010 (In $ millions)
Balance at beginning of year 64 77 67 Additions (1) 3 — — Accretion 3 3 3 Payments (12 ) (10 ) (15 )
Revisions to cash flow estimates (2) 5 (5 ) 23 Exchange rate changes 1 (1 ) (1 )
Balance at end of year 64 64 77
(1) Pr imarily relates to sites which management no longer considers to have an indeterminate life.
(2) Pr imarily relates to revisions to the estimated cost of future plant closures.
As of December 31,
2012 2011 (In $ millions)
Short-Term Borrowings and Current Installments of Long-Term Debt - Third Party and Affiliates
Current installments of long-term debt 60 38 Short-term borrowings, including amounts due to affiliates 108 106
Total 168 144
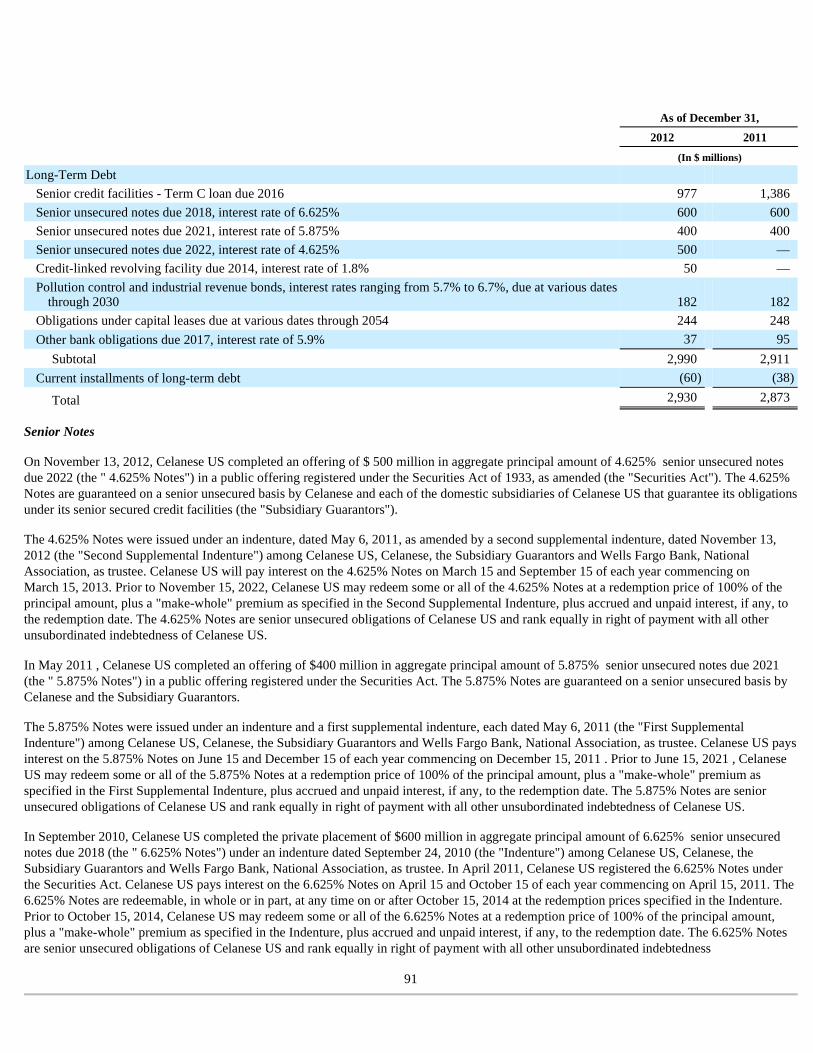
Senior Notes
On November 13, 2012, Celanese US completed an offering of $ 500 million in aggregate principal amount of 4.625% senior unsecured notes due 2022 (the " 4.625% Notes") in a public offering registered under the Securities Act of 1933, as amended (the "Securities Act"). The 4.625% Notes are guaranteed on a senior unsecured basis by Celanese and each of the domestic subsidiaries of Celanese US that guarantee its obligations under its senior secured credit facilities (the "Subsidiary Guarantors").
The 4.625% Notes were issued under an indenture, dated May 6, 2011, as amended by a second supplemental indenture, dated November 13, 2012 (the "Second Supplemental Indenture") among Celanese US, Celanese, the Subsidiary Guarantors and Wells Fargo Bank, National Association, as trustee. Celanese US will pay interest on the 4.625% Notes on March 15 and September 15 of each year commencing on March 15, 2013. Prior to November 15, 2022, Celanese US may redeem some or all of the 4.625% Notes at a redemption price of 100% of the principal amount, plus a "make-whole" premium as specified in the Second Supplemental Indenture, plus accrued and unpaid interest, if any, to the redemption date. The 4.625% Notes are senior unsecured obligations of Celanese US and rank equally in right of payment with all other unsubordinated indebtedness of Celanese US.
In May 2011 , Celanese US completed an offering of $400 million in aggregate principal amount of 5.875% senior unsecured notes due 2021 (the " 5.875% Notes") in a public offering registered under the Securities Act. The 5.875% Notes are guaranteed on a senior unsecured basis by Celanese and the Subsidiary Guarantors.
The 5.875% Notes were issued under an indenture and a first supplemental indenture, each dated May 6, 2011 (the "First Supplemental Indenture") among Celanese US, Celanese, the Subsidiary Guarantors and Wells Fargo Bank, National Association, as trustee. Celanese US pays interest on the 5.875% Notes on June 15 and December 15 of each year commencing on December 15, 2011 . Prior to June 15, 2021 , Celanese US may redeem some or all of the 5.875% Notes at a redemption price of 100% of the principal amount, plus a "make-whole" premium as specified in the First Supplemental Indenture, plus accrued and unpaid interest, if any, to the redemption date. The 5.875% Notes are senior unsecured obligations of Celanese US and rank equally in right of payment with all other unsubordinated indebtedness of Celanese US.
In September 2010, Celanese US completed the private placement of $600 million in aggregate principal amount of 6.625% senior unsecured notes due 2018 (the " 6.625% Notes") under an indenture dated September 24, 2010 (the "Indenture") among Celanese US, Celanese, the Subsidiary Guarantors and Wells Fargo Bank, National Association, as trustee. In April 2011, Celanese US registered the 6.625% Notes under the Securities Act. Celanese US pays interest on the 6.625% Notes on April 15 and October 15 of each year commencing on April 15, 2011. The 6.625% Notes are redeemable, in whole or in part, at any time on or after October 15, 2014 at the redemption prices specified in the Indenture. Prior to October 15, 2014, Celanese US may redeem some or all of the 6.625% Notes at a redemption price of 100% of the principal amount, plus a "make-whole" premium as specified in the Indenture, plus accrued and unpaid interest, if any, to the redemption date. The 6.625% Notes are senior unsecured obligations of Celanese US and rank equally in right of payment with all other unsubordinated indebtedness
91
As of December 31,
2012 2011
(In $ millions)
Long-Term Debt
Senior credit facilities - Term C loan due 2016 977 1,386 Senior unsecured notes due 2018, interest rate of 6.625% 600 600 Senior unsecured notes due 2021, interest rate of 5.875% 400 400 Senior unsecured notes due 2022, interest rate of 4.625% 500 — Credit-linked revolving facility due 2014, interest rate of 1.8% 50 — Pollution control and industrial revenue bonds, interest rates ranging from 5.7% to 6.7%, due at various dates
through 2030 182 182 Obligations under capital leases due at various dates through 2054 244 248 Other bank obligations due 2017, interest rate of 5.9% 37 95
Subtotal 2,990 2,911 Current installments of long-term debt (60 ) (38 )
Total 2,930 2,873
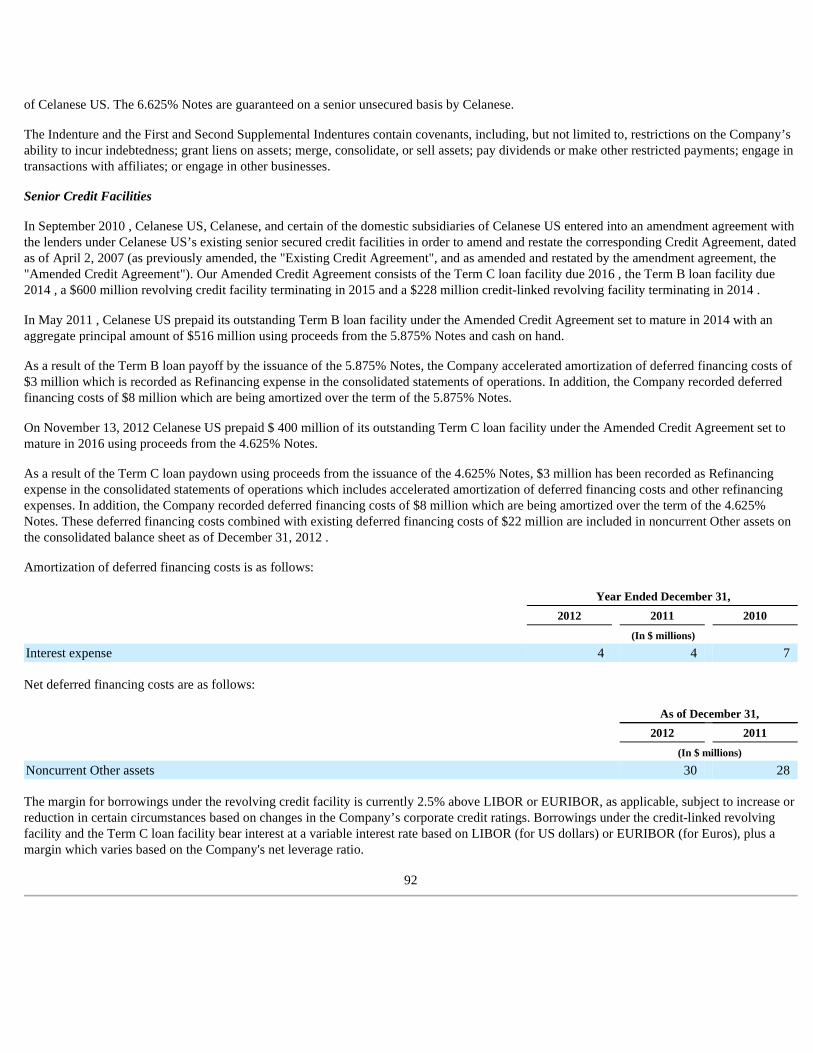
of Celanese US. The 6.625% Notes are guaranteed on a senior unsecured basis by Celanese.
The Indenture and the First and Second Supplemental Indentures contain covenants, including, but not limited to, restrictions on the Company’s ability to incur indebtedness; grant liens on assets; merge, consolidate, or sell assets; pay dividends or make other restricted payments; engage in transactions with affiliates; or engage in other businesses.
Senior Credit Facilities
In September 2010 , Celanese US, Celanese, and certain of the domestic subsidiaries of Celanese US entered into an amendment agreement with the lenders under Celanese US’s existing senior secured credit facilities in order to amend and restate the corresponding Credit Agreement, dated as of April 2, 2007 (as previously amended, the "Existing Credit Agreement", and as amended and restated by the amendment agreement, the "Amended Credit Agreement"). Our Amended Credit Agreement consists of the Term C loan facility due 2016 , the Term B loan facility due 2014 , a $600 million revolving credit facility terminating in 2015 and a $228 million credit-linked revolving facility terminating in 2014 .
In May 2011 , Celanese US prepaid its outstanding Term B loan facility under the Amended Credit Agreement set to mature in 2014 with an aggregate principal amount of $516 million using proceeds from the 5.875% Notes and cash on hand.
As a result of the Term B loan payoff by the issuance of the 5.875% Notes, the Company accelerated amortization of deferred financing costs of $3 million which is recorded as Refinancing expense in the consolidated statements of operations. In addition, the Company recorded deferred financing costs of $8 million which are being amortized over the term of the 5.875% Notes.
On November 13, 2012 Celanese US prepaid $ 400 million of its outstanding Term C loan facility under the Amended Credit Agreement set to mature in 2016 using proceeds from the 4.625% Notes.
As a result of the Term C loan paydown using proceeds from the issuance of the 4.625% Notes, $3 million has been recorded as Refinancing expense in the consolidated statements of operations which includes accelerated amortization of deferred financing costs and other refinancing expenses. In addition, the Company recorded deferred financing costs of $8 million which are being amortized over the term of the 4.625% Notes. These deferred financing costs combined with existing deferred financing costs of $22 million are included in noncurrent Other assets on the consolidated balance sheet as of December 31, 2012 .
Amortization of deferred financing costs is as follows:
Net deferred financing costs are as follows:
The margin for borrowings under the revolving credit facility is currently 2.5% above LIBOR or EURIBOR, as applicable, subject to increase or reduction in certain circumstances based on changes in the Company’s corporate credit ratings. Borrowings under the credit-linked revolving facility and the Term C loan facility bear interest at a variable interest rate based on LIBOR (for US dollars) or EURIBOR (for Euros), plus a margin which varies based on the Company's net leverage ratio.
92
Year Ended December 31,
2012 2011 2010
(In $ millions)
Interest expense 4 4 7
As of December 31,
2012 2011
(In $ millions)
Noncurrent Other assets 30 28
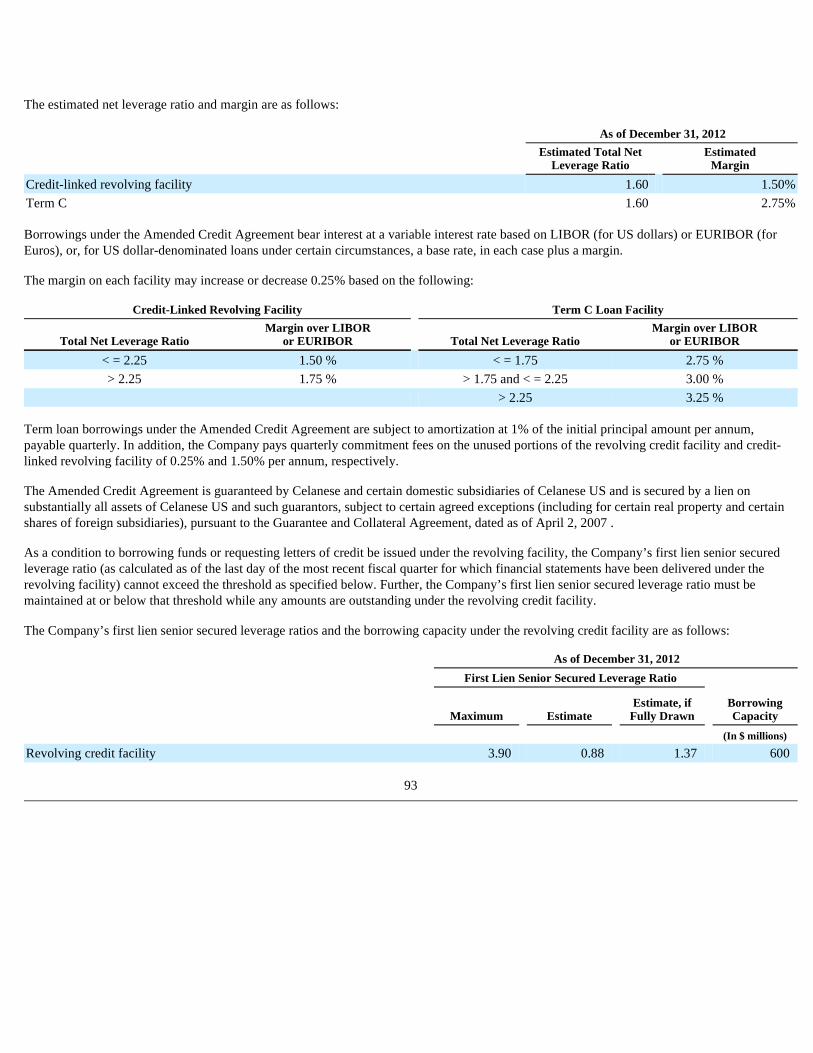
The estimated net leverage ratio and margin are as follows:
Borrowings under the Amended Credit Agreement bear interest at a variable interest rate based on LIBOR (for US dollars) or EURIBOR (for Euros), or, for US dollar-denominated loans under certain circumstances, a base rate, in each case plus a margin.
The margin on each facility may increase or decrease 0.25% based on the following:
Term loan borrowings under the Amended Credit Agreement are subject to amortization at 1% of the initial principal amount per annum, payable quarterly. In addition, the Company pays quarterly commitment fees on the unused portions of the revolving credit facility and credit-linked revolving facility of 0.25% and 1.50% per annum, respectively.
The Amended Credit Agreement is guaranteed by Celanese and certain domestic subsidiaries of Celanese US and is secured by a lien on substantially all assets of Celanese US and such guarantors, subject to certain agreed exceptions (including for certain real property and certain shares of foreign subsidiaries), pursuant to the Guarantee and Collateral Agreement, dated as of April 2, 2007 .
As a condition to borrowing funds or requesting letters of credit be issued under the revolving facility, the Company’s first lien senior secured leverage ratio (as calculated as of the last day of the most recent fiscal quarter for which financial statements have been delivered under the revolving facility) cannot exceed the threshold as specified below. Further, the Company’s first lien senior secured leverage ratio must be maintained at or below that threshold while any amounts are outstanding under the revolving credit facility.
The Company’s first lien senior secured leverage ratios and the borrowing capacity under the revolving credit facility are as follows:
93
As of December 31, 2012
Estimated Total Net
Leverage Ratio Estimated
Margin
Credit-linked revolving facility 1.60 1.50 %
Term C 1.60 2.75 %
Credit-Linked Revolving Facility Term C Loan Facility
Total Net Leverage Ratio Margin over LIBOR
or EURIBOR Total Net Leverage Ratio Margin over LIBOR
or EURIBOR
< = 2.25 1.50 % < = 1.75 2.75 %
> 2.25 1.75 % > 1.75 and < = 2.25 3.00 %
> 2.25 3.25 %
As of December 31, 2012
First Lien Senior Secured Leverage Ratio
Estimate, if Fully Drawn
Borrowing Capacity Maximum Estimate
(In $ millions)
Revolving credit facility 3.90 0.88 1.37 600
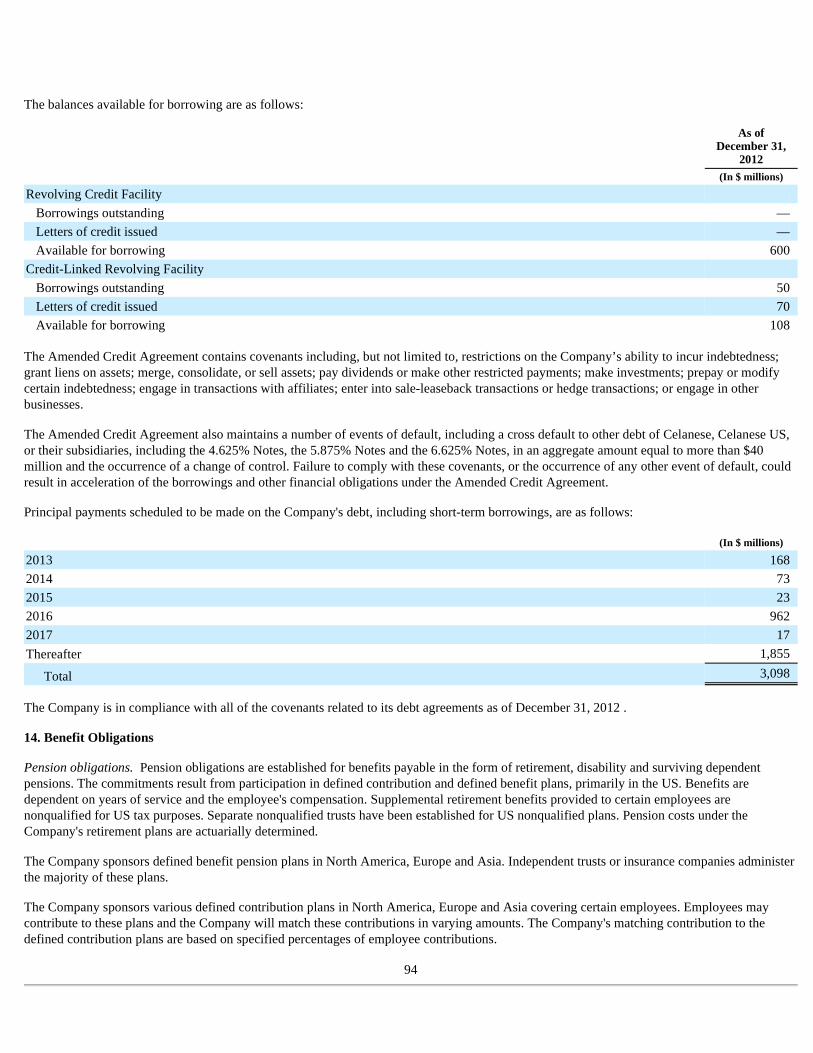
The balances available for borrowing are as follows:
The Amended Credit Agreement contains covenants including, but not limited to, restrictions on the Company’s ability to incur indebtedness; grant liens on assets; merge, consolidate, or sell assets; pay dividends or make other restricted payments; make investments; prepay or modify certain indebtedness; engage in transactions with affiliates; enter into sale-leaseback transactions or hedge transactions; or engage in other businesses.
The Amended Credit Agreement also maintains a number of events of default, including a cross default to other debt of Celanese, Celanese US, or their subsidiaries, including the 4.625% Notes, the 5.875% Notes and the 6.625% Notes, in an aggregate amount equal to more than $40 million and the occurrence of a change of control. Failure to comply with these covenants, or the occurrence of any other event of default, could result in acceleration of the borrowings and other financial obligations under the Amended Credit Agreement.
Principal payments scheduled to be made on the Company's debt, including short-term borrowings, are as follows:
The Company is in compliance with all of the covenants related to its debt agreements as of December 31, 2012 .
14. Benefit Obligations
Pension obligations. Pension obligations are established for benefits payable in the form of retirement, disability and surviving dependent pensions. The commitments result from participation in defined contribution and defined benefit plans, primarily in the US. Benefits are dependent on years of service and the employee's compensation. Supplemental retirement benefits provided to certain employees are nonqualified for US tax purposes. Separate nonqualified trusts have been established for US nonqualified plans. Pension costs under the Company's retirement plans are actuarially determined.
The Company sponsors defined benefit pension plans in North America, Europe and Asia. Independent trusts or insurance companies administer the majority of these plans.
The Company sponsors various defined contribution plans in North America, Europe and Asia covering certain employees. Employees may contribute to these plans and the Company will match these contributions in varying amounts. The Company's matching contribution to the defined contribution plans are based on specified percentages of employee contributions.
94
As of December 31,
2012 (In $ millions)
Revolving Credit Facility Borrowings outstanding — Letters of credit issued — Available for borrowing 600
Credit-Linked Revolving Facility
Borrowings outstanding 50 Letters of credit issued 70 Available for borrowing 108
(In $ millions)
2013 168 2014 73 2015 23 2016 962 2017 17 Thereafter 1,855
Total 3,098
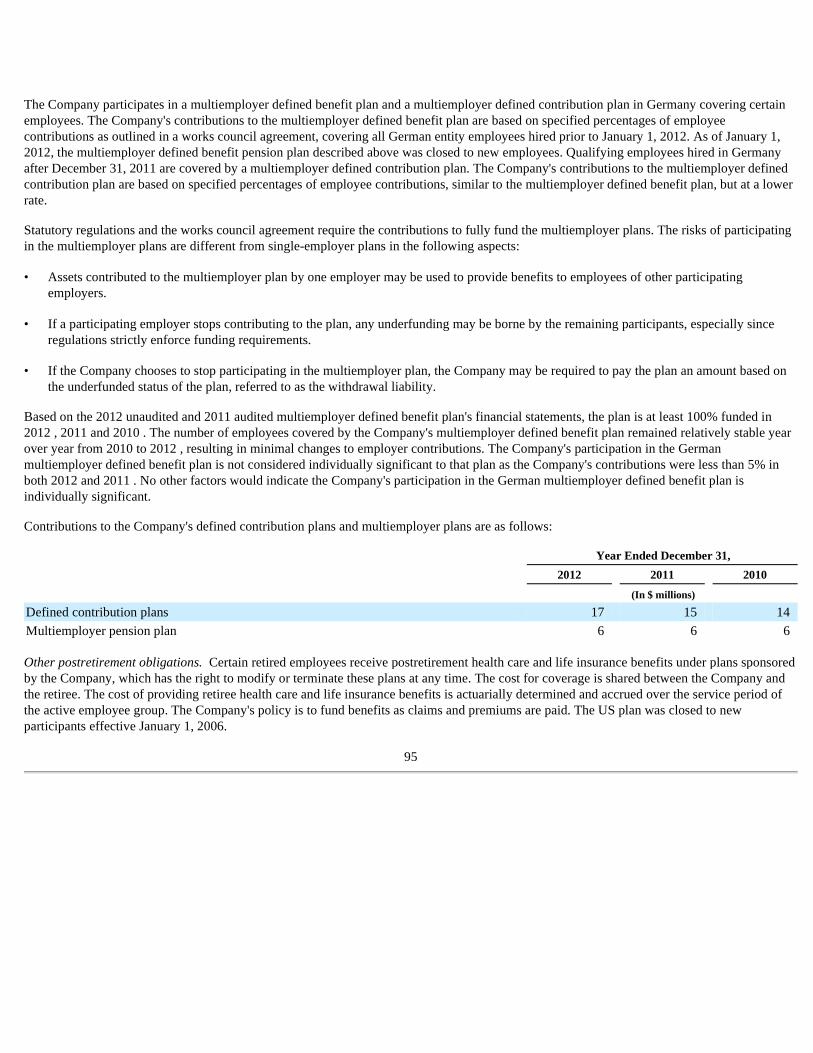
The Company participates in a multiemployer defined benefit plan and a multiemployer defined contribution plan in Germany covering certain employees. The Company's contributions to the multiemployer defined benefit plan are based on specified percentages of employee contributions as outlined in a works council agreement, covering all German entity employees hired prior to January 1, 2012. As of January 1, 2012, the multiemployer defined benefit pension plan described above was closed to new employees. Qualifying employees hired in Germany after December 31, 2011 are covered by a multiemployer defined contribution plan. The Company's contributions to the multiemployer defined contribution plan are based on specified percentages of employee contributions, similar to the multiemployer defined benefit plan, but at a lower rate.
Statutory regulations and the works council agreement require the contributions to fully fund the multiemployer plans. The risks of participating in the multiemployer plans are different from single-employer plans in the following aspects:
Based on the 2012 unaudited and 2011 audited multiemployer defined benefit plan's financial statements, the plan is at least 100% funded in 2012 , 2011 and 2010 . The number of employees covered by the Company's multiemployer defined benefit plan remained relatively stable year over year from 2010 to 2012 , resulting in minimal changes to employer contributions. The Company's participation in the German multiemployer defined benefit plan is not considered individually significant to that plan as the Company's contributions were less than 5% in both 2012 and 2011 . No other factors would indicate the Company's participation in the German multiemployer defined benefit plan is individually significant.
Contributions to the Company's defined contribution plans and multiemployer plans are as follows:
Other postretirement obligations. Certain retired employees receive postretirement health care and life insurance benefits under plans sponsored by the Company, which has the right to modify or terminate these plans at any time. The cost for coverage is shared between the Company and the retiree. The cost of providing retiree health care and life insurance benefits is actuarially determined and accrued over the service period of the active employee group. The Company's policy is to fund benefits as claims and premiums are paid. The US plan was closed to new participants effective January 1, 2006.
95
• Assets contributed to the multiemployer plan by one employer may be used to provide benefits to employees of other participating employers.
• If a participating employer stops contributing to the plan, any underfunding may be borne by the remaining participants, especially since regulations strictly enforce funding requirements.
• If the Company chooses to stop participating in the multiemployer plan, the Company may be required to pay the plan an amount based on the underfunded status of the plan, referred to as the withdrawal liability.
Year Ended December 31,
2012 2011 2010
(In $ millions)
Defined contribution plans 17 15 14 Multiemployer pension plan 6 6 6

Summarized information on the Company's pension and postretirement benefit plans is as follows:
______________________________
96
Pension Benefits Postretirement Benefits
As of December 31, As of December 31,
2012 2011 2012 2011
(In $ millions)
Change in Projected Benefit Obligation
Projected benefit obligation as of beginning of period 3,761 3,533 281 282 Service cost 28 28 1 1 Interest cost 170 182 11 13 Participant contributions — — 22 21 Plan amendments — (3 ) 4 — Net actuarial (gain) loss (1) 466 274 12 13 Divestitures — — — — Settlements — (1 ) — — Benefits paid (242 ) (236 ) (46 ) (53 )
Federal subsidy on Medicare Part D — — 6 4 Curtailments — (1 ) — — Exchange rate changes 16 (15 ) 1 —
Projected benefit obligation as of end of period 4,199 3,761 292 281 Change in Plan Assets
Fair value of plan assets as of beginning of period 2,562 2,460 — — Actual return on plan assets 294 169 — — Employer contributions 270 181 24 32 Participant contributions — — 22 21 Divestitures — — — — Settlements — — — — Benefits paid (3) (242 ) (236 ) (46 ) (53 )
Exchange rate changes 12 (12 ) — — Fair value of plan assets as of end of period 2,896 2,562 — —
Funded Status as of end of period (1,303 ) (1,199 ) (292 ) (281 )
Amounts Recognized in the Consolidated Balance Sheets Consist of:
Noncurrent Other assets 26 27 — — Current Other liabilities (23 ) (22 ) (24 ) (25 )
Benefit obligations (1,306 ) (1,204 ) (268 ) (256 )
Net amount recognized (1,303 ) (1,199 ) (292 ) (281 )
Amounts Recognized in Accumulated Other Comprehensive Income Consist of:
Net actuarial (gain) loss (2) 1,326 994 (21 ) (35 )
Prior service (benefit) cost 6 7 4 1
Net amount recognized 1,332 1,001 (17 ) (34 )
(1) Primarily relates to change in discount rates.
(2) Amount includes accumulated other comprehensive losses of $ 9 million and gains of $ 1 million as of December 31, 2012 and 2011 , respectively, related to the Company's equity method investments' pension plans. Amount shown net of an income tax benefit of $307 million and $203 million as of December 31, 2012 and 2011 , respectively, in the consolidated statements of equity ( Note 16 ).
(3) Includes benefit payments to nonqualified pension plans of $22 million and $22 million as of December 31, 2012 and 2011 , respectively.
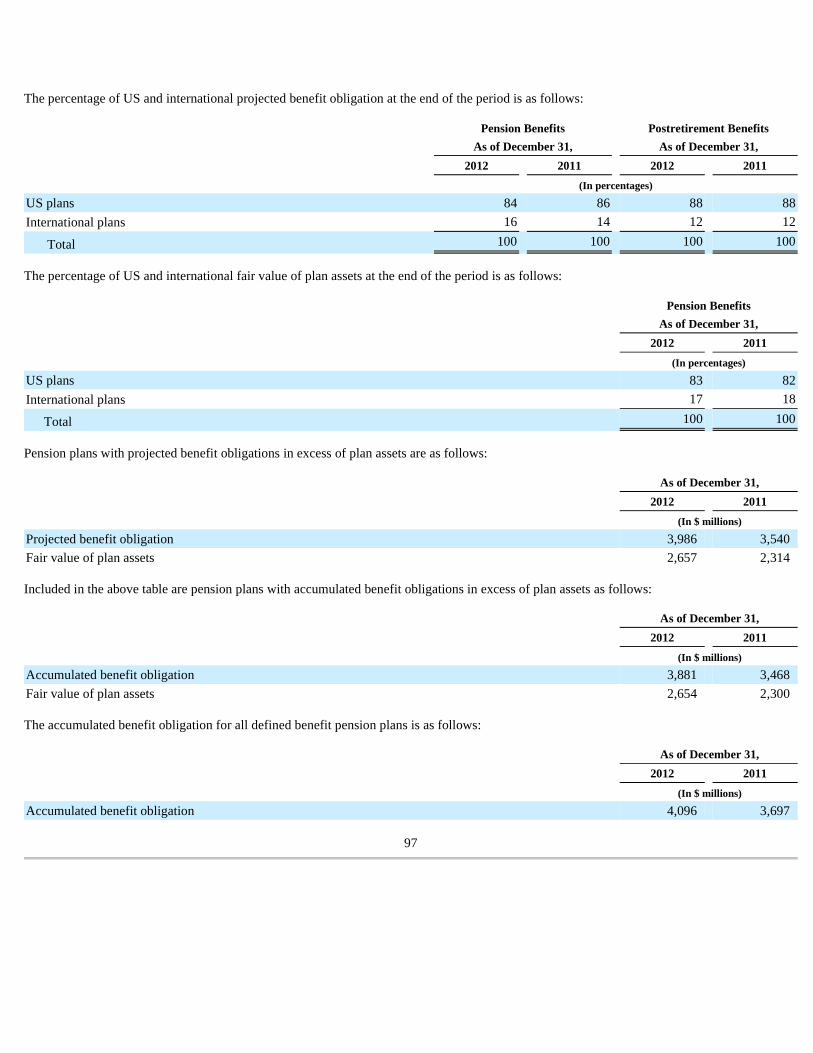
The percentage of US and international projected benefit obligation at the end of the period is as follows:
The percentage of US and international fair value of plan assets at the end of the period is as follows:
Pension plans with projected benefit obligations in excess of plan assets are as follows:
Included in the above table are pension plans with accumulated benefit obligations in excess of plan assets as follows:
The accumulated benefit obligation for all defined benefit pension plans is as follows:
97
Pension Benefits Postretirement Benefits
As of December 31, As of December 31,
2012 2011 2012 2011
(In percentages)
US plans 84 86 88 88
International plans 16 14 12 12
Total 100 100 100 100
Pension Benefits
As of December 31,
2012 2011
(In percentages)
US plans 83 82
International plans 17 18
Total 100 100
As of December 31,
2012 2011
(In $ millions)
Projected benefit obligation 3,986 3,540 Fair value of plan assets 2,657 2,314
As of December 31,
2012 2011
(In $ millions)
Accumulated benefit obligation 3,881 3,468 Fair value of plan assets 2,654 2,300
As of December 31,
2012 2011
(In $ millions)
Accumulated benefit obligation 4,096 3,697
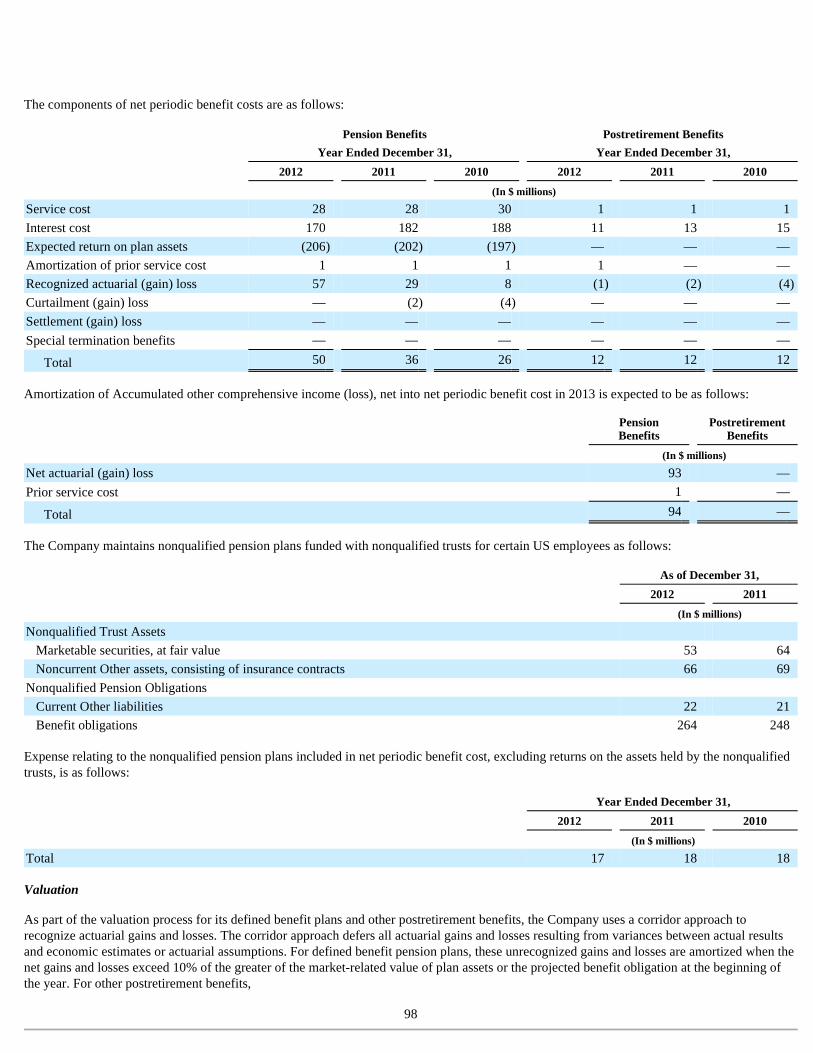
The components of net periodic benefit costs are as follows:
Amortization of Accumulated other comprehensive income (loss), net into net periodic benefit cost in 2013 is expected to be as follows:
The Company maintains nonqualified pension plans funded with nonqualified trusts for certain US employees as follows:
Expense relating to the nonqualified pension plans included in net periodic benefit cost, excluding returns on the assets held by the nonqualified trusts, is as follows:
Valuation
As part of the valuation process for its defined benefit plans and other postretirement benefits, the Company uses a corridor approach to recognize actuarial gains and losses. The corridor approach defers all actuarial gains and losses resulting from variances between actual results and economic estimates or actuarial assumptions. For defined benefit pension plans, these unrecognized gains and losses are amortized when the net gains and losses exceed 10% of the greater of the market-related value of plan assets or the projected benefit obligation at the beginning of the year. For other postretirement benefits,
98
Pension Benefits Postretirement Benefits
Year Ended December 31, Year Ended December 31,
2012 2011 2010 2012 2011 2010
(In $ millions)
Service cost 28 28 30 1 1 1 Interest cost 170 182 188 11 13 15 Expected return on plan assets (206 ) (202 ) (197 ) — — — Amortization of prior service cost 1 1 1 1 — — Recognized actuarial (gain) loss 57 29 8 (1 ) (2 ) (4 )
Curtailment (gain) loss — (2 ) (4 ) — — — Settlement (gain) loss — — — — — — Special termination benefits — — — — — —
Total 50 36 26 12 12 12
Pension Benefits
Postretirement Benefits
(In $ millions)
Net actuarial (gain) loss 93 — Prior service cost 1 —
Total 94 —
As of December 31,
2012 2011
(In $ millions)
Nonqualified Trust Assets
Marketable securities, at fair value 53 64 Noncurrent Other assets, consisting of insurance contracts 66 69
Nonqualified Pension Obligations
Current Other liabilities 22 21 Benefit obligations 264 248
Year Ended December 31,
2012 2011 2010
(In $ millions)
Total 17 18 18
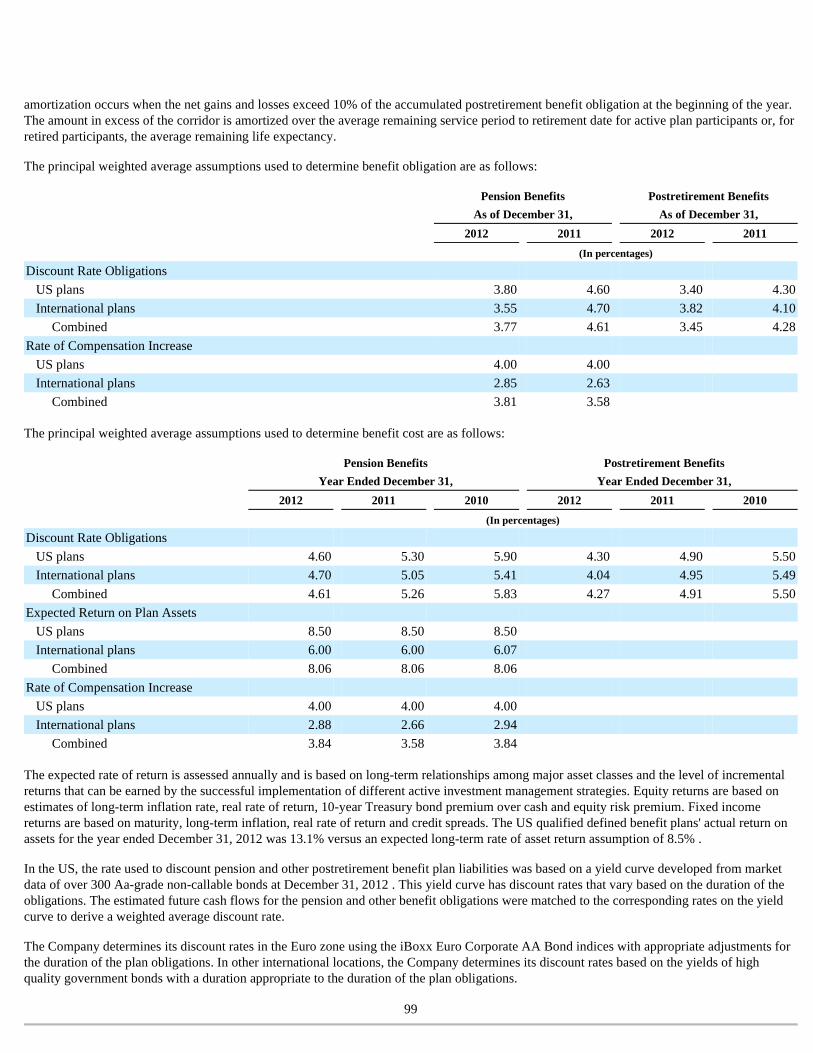
amortization occurs when the net gains and losses exceed 10% of the accumulated postretirement benefit obligation at the beginning of the year. The amount in excess of the corridor is amortized over the average remaining service period to retirement date for active plan participants or, for retired participants, the average remaining life expectancy.
The principal weighted average assumptions used to determine benefit obligation are as follows:
The principal weighted average assumptions used to determine benefit cost are as follows:
The expected rate of return is assessed annually and is based on long-term relationships among major asset classes and the level of incremental returns that can be earned by the successful implementation of different active investment management strategies. Equity returns are based on estimates of long-term inflation rate, real rate of return, 10-year Treasury bond premium over cash and equity risk premium. Fixed income returns are based on maturity, long-term inflation, real rate of return and credit spreads. The US qualified defined benefit plans' actual return on assets for the year ended December 31, 2012 was 13.1% versus an expected long-term rate of asset return assumption of 8.5% .
In the US, the rate used to discount pension and other postretirement benefit plan liabilities was based on a yield curve developed from market data of over 300 Aa-grade non-callable bonds at December 31, 2012 . This yield curve has discount rates that vary based on the duration of the obligations. The estimated future cash flows for the pension and other benefit obligations were matched to the corresponding rates on the yield curve to derive a weighted average discount rate.
The Company determines its discount rates in the Euro zone using the iBoxx Euro Corporate AA Bond indices with appropriate adjustments for the duration of the plan obligations. In other international locations, the Company determines its discount rates based on the yields of high quality government bonds with a duration appropriate to the duration of the plan obligations.
99
Pension Benefits Postretirement Benefits
As of December 31, As of December 31,
2012 2011 2012 2011
(In percentages)
Discount Rate Obligations
US plans 3.80 4.60 3.40 4.30
International plans 3.55 4.70 3.82 4.10
Combined 3.77 4.61 3.45 4.28
Rate of Compensation Increase
US plans 4.00 4.00
International plans 2.85 2.63
Combined 3.81 3.58
Pension Benefits Postretirement Benefits
Year Ended December 31, Year Ended December 31,
2012 2011 2010 2012 2011 2010
(In percentages)
Discount Rate Obligations
US plans 4.60 5.30 5.90 4.30 4.90 5.50
International plans 4.70 5.05 5.41 4.04 4.95 5.49
Combined 4.61 5.26 5.83 4.27 4.91 5.50
Expected Return on Plan Assets
US plans 8.50 8.50 8.50
International plans 6.00 6.00 6.07
Combined 8.06 8.06 8.06
Rate of Compensation Increase
US plans 4.00 4.00 4.00
International plans 2.88 2.66 2.94
Combined 3.84 3.58 3.84
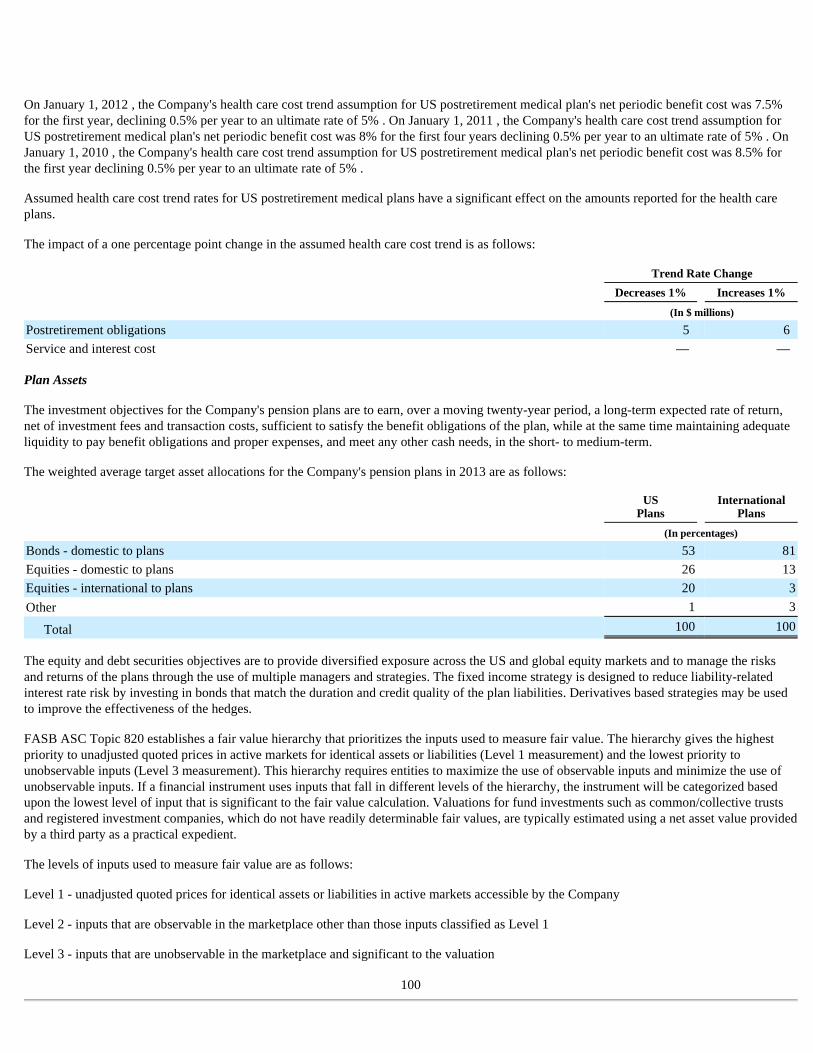
On January 1, 2012 , the Company's health care cost trend assumption for US postretirement medical plan's net periodic benefit cost was 7.5% for the first year, declining 0.5% per year to an ultimate rate of 5% . On January 1, 2011 , the Company's health care cost trend assumption for US postretirement medical plan's net periodic benefit cost was 8% for the first four years declining 0.5% per year to an ultimate rate of 5% . On January 1, 2010 , the Company's health care cost trend assumption for US postretirement medical plan's net periodic benefit cost was 8.5% for the first year declining 0.5% per year to an ultimate rate of 5% .
Assumed health care cost trend rates for US postretirement medical plans have a significant effect on the amounts reported for the health care plans.
The impact of a one percentage point change in the assumed health care cost trend is as follows:
Plan Assets
The investment objectives for the Company's pension plans are to earn, over a moving twenty-year period, a long-term expected rate of return, net of investment fees and transaction costs, sufficient to satisfy the benefit obligations of the plan, while at the same time maintaining adequate liquidity to pay benefit obligations and proper expenses, and meet any other cash needs, in the short- to medium-term.
The weighted average target asset allocations for the Company's pension plans in 2013 are as follows:
The equity and debt securities objectives are to provide diversified exposure across the US and global equity markets and to manage the risks and returns of the plans through the use of multiple managers and strategies. The fixed income strategy is designed to reduce liability-related interest rate risk by investing in bonds that match the duration and credit quality of the plan liabilities. Derivatives based strategies may be used to improve the effectiveness of the hedges.
FASB ASC Topic 820 establishes a fair value hierarchy that prioritizes the inputs used to measure fair value. The hierarchy gives the highest priority to unadjusted quoted prices in active markets for identical assets or liabilities (Level 1 measurement) and the lowest priority to unobservable inputs (Level 3 measurement). This hierarchy requires entities to maximize the use of observable inputs and minimize the use of unobservable inputs. If a financial instrument uses inputs that fall in different levels of the hierarchy, the instrument will be categorized based upon the lowest level of input that is significant to the fair value calculation. Valuations for fund investments such as common/collective trusts and registered investment companies, which do not have readily determinable fair values, are typically estimated using a net asset value provided by a third party as a practical expedient.
The levels of inputs used to measure fair value are as follows:
Level 1 - unadjusted quoted prices for identical assets or liabilities in active markets accessible by the Company
Level 2 - inputs that are observable in the marketplace other than those inputs classified as Level 1
Level 3 - inputs that are unobservable in the marketplace and significant to the valuation
100
Trend Rate Change
Decreases 1% Increases 1%
(In $ millions)
Postretirement obligations 5 6 Service and interest cost — —
US
Plans International
Plans
(In percentages)
Bonds - domestic to plans 53 81
Equities - domestic to plans 26 13
Equities - international to plans 20 3
Other 1 3
Total 100 100
The Company's defined benefit plan assets are measured at fair value on a recurring basis and include the following items:
Cash and Cash Equivalents: Foreign and domestic currencies as well as short term securities are valued at cost plus accrued interest, which approximates fair value.
Common/Collective Trusts: Composed of various funds whose diversified portfolio is comprised of foreign and domestic equities, fixed income securities, and short term investments. Investments are valued at the net asset value of units held by the plan at year-end.
Corporate stock and government and corporate debt: Valued at the closing price reported on the active market in which the individual securities are traded. Automated quotes are provided by multiple pricing services and validated by the plan custodian. These securities are traded on exchanges as well as in the over the counter market.
Registered Investment Companies: Composed of various mutual funds and other investment companies whose diversified portfolio is comprised of foreign and domestic equities, fixed income securities, and short term investments. Investments are valued at the net asset value of units held by the plan at year-end.
Mortgage Backed Securities: Fair value is estimated based on valuations obtained from third-party pricing services for identical or comparable assets. Mortgage Backed Securities are traded in the over the counter broker/dealer market.
Derivatives: Derivative financial instruments are valued in the market using discounted cash flow techniques. These techniques incorporate Level 1 and Level 2 inputs such as interest rates and foreign currency exchange rates. These market inputs are utilized in the discounted cash flow calculation considering the instrument's term, notional amount, discount rate and credit risk. Significant inputs to the derivative valuation for interest rate swaps, foreign currency forwards and swaps, and options are observable in the active markets and are classified as Level 2 in the hierarchy.
Insurance contracts: Valued at contributions made, plus earnings, less participant withdrawals and administrative expenses, which approximates fair value.
101
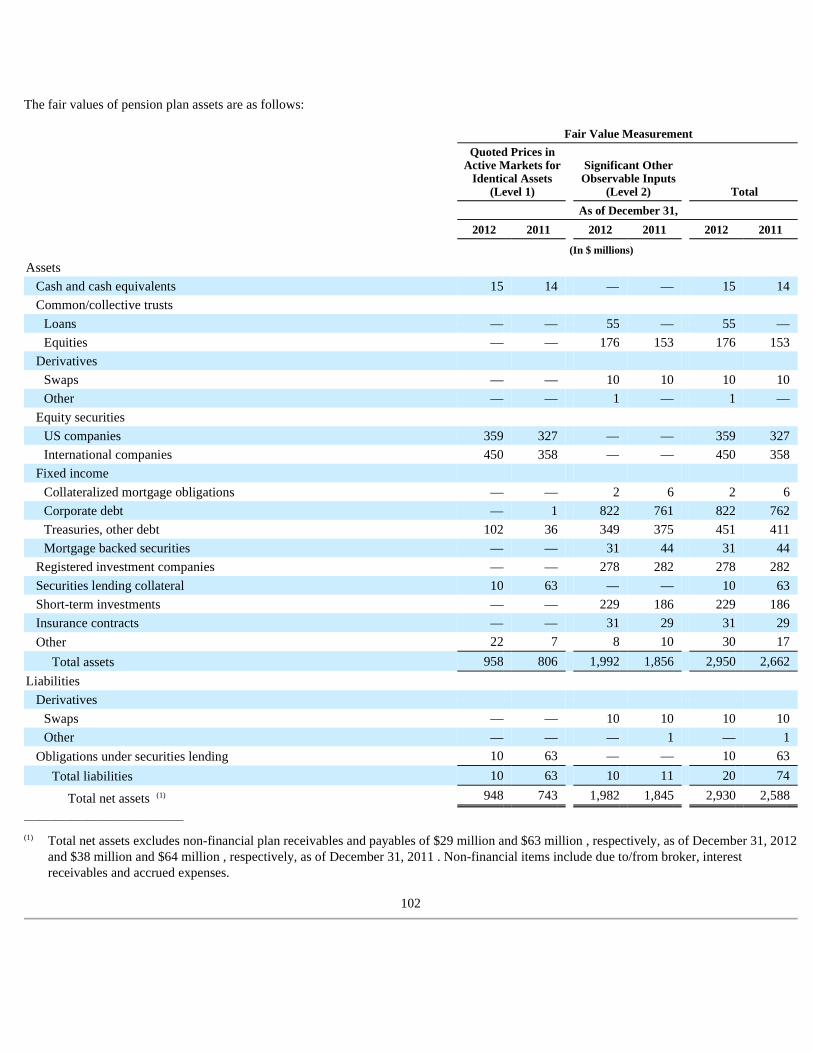
The fair values of pension plan assets are as follows:
______________________________
102
Fair Value Measurement
Quoted Prices in Active Markets for
Identical Assets (Level 1)
Significant Other Observable Inputs
(Level 2) Total
As of December 31,
2012 2011 2012 2011 2012 2011
(In $ millions)
Assets
Cash and cash equivalents 15 14 — — 15 14 Common/collective trusts
Loans — — 55 — 55 — Equities — — 176 153 176 153
Derivatives
Swaps — — 10 10 10 10 Other — — 1 — 1 —
Equity securities
US companies 359 327 — — 359 327 International companies 450 358 — — 450 358
Fixed income
Collateralized mortgage obligations — — 2 6 2 6 Corporate debt — 1 822 761 822 762 Treasuries, other debt 102 36 349 375 451 411 Mortgage backed securities — — 31 44 31 44
Registered investment companies — — 278 282 278 282 Securities lending collateral 10 63 — — 10 63 Short-term investments — — 229 186 229 186 Insurance contracts — — 31 29 31 29 Other 22 7 8 10 30 17
Total assets 958 806 1,992 1,856 2,950 2,662 Liabilities
Derivatives
Swaps — — 10 10 10 10 Other — — — 1 — 1
Obligations under securities lending 10 63 — — 10 63 Total liabilities 10 63 10 11 20 74
Total net assets (1) 948 743 1,982 1,845 2,930 2,588
(1) Total net assets excludes non-financial plan receivables and payables of $29 million and $63 million , respectively, as of December 31, 2012 and $38 million and $64 million , respectively, as of December 31, 2011 . Non-financial items include due to/from broker, interest receivables and accrued expenses.
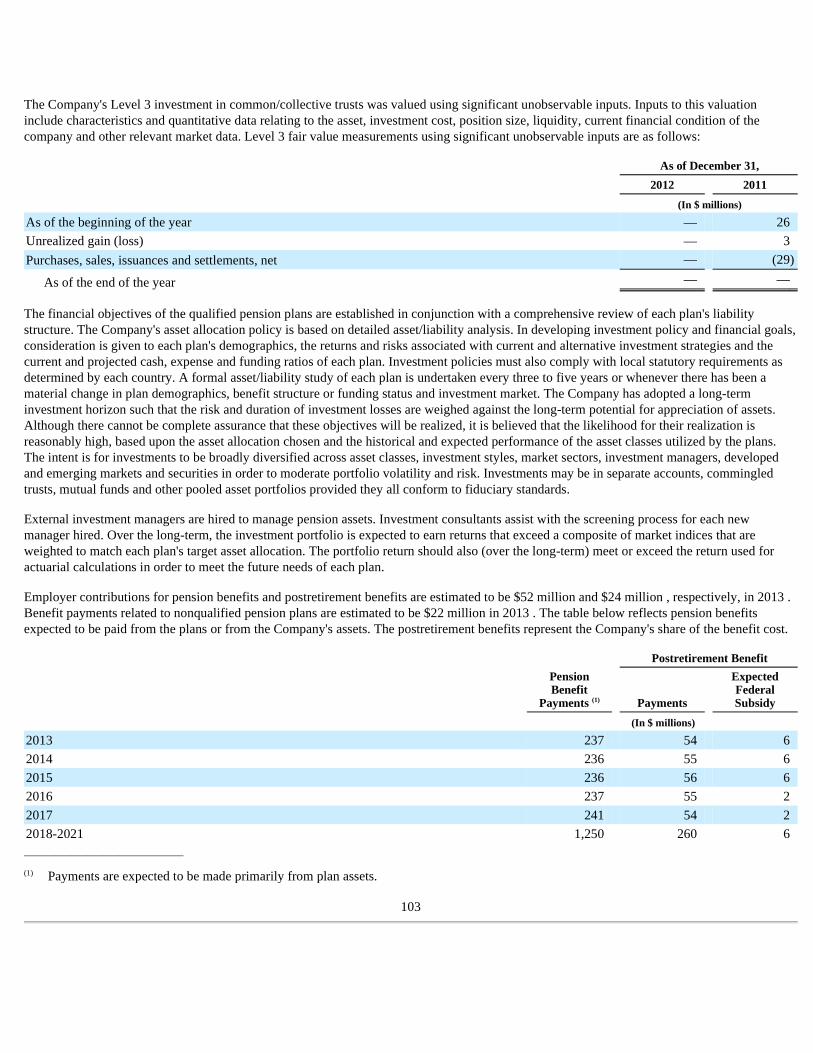
The Company's Level 3 investment in common/collective trusts was valued using significant unobservable inputs. Inputs to this valuation include characteristics and quantitative data relating to the asset, investment cost, position size, liquidity, current financial condition of the company and other relevant market data. Level 3 fair value measurements using significant unobservable inputs are as follows:
The financial objectives of the qualified pension plans are established in conjunction with a comprehensive review of each plan's liability structure. The Company's asset allocation policy is based on detailed asset/liability analysis. In developing investment policy and financial goals, consideration is given to each plan's demographics, the returns and risks associated with current and alternative investment strategies and the current and projected cash, expense and funding ratios of each plan. Investment policies must also comply with local statutory requirements as determined by each country. A formal asset/liability study of each plan is undertaken every three to five years or whenever there has been a material change in plan demographics, benefit structure or funding status and investment market. The Company has adopted a long-term investment horizon such that the risk and duration of investment losses are weighed against the long-term potential for appreciation of assets. Although there cannot be complete assurance that these objectives will be realized, it is believed that the likelihood for their realization is reasonably high, based upon the asset allocation chosen and the historical and expected performance of the asset classes utilized by the plans. The intent is for investments to be broadly diversified across asset classes, investment styles, market sectors, investment managers, developed and emerging markets and securities in order to moderate portfolio volatility and risk. Investments may be in separate accounts, commingled trusts, mutual funds and other pooled asset portfolios provided they all conform to fiduciary standards.
External investment managers are hired to manage pension assets. Investment consultants assist with the screening process for each new manager hired. Over the long-term, the investment portfolio is expected to earn returns that exceed a composite of market indices that are weighted to match each plan's target asset allocation. The portfolio return should also (over the long-term) meet or exceed the return used for actuarial calculations in order to meet the future needs of each plan.
Employer contributions for pension benefits and postretirement benefits are estimated to be $52 million and $24 million , respectively, in 2013 . Benefit payments related to nonqualified pension plans are estimated to be $22 million in 2013 . The table below reflects pension benefits expected to be paid from the plans or from the Company's assets. The postretirement benefits represent the Company's share of the benefit cost.
______________________________
103
As of December 31,
2012 2011
(In $ millions)
As of the beginning of the year — 26 Unrealized gain (loss) — 3 Purchases, sales, issuances and settlements, net — (29 )
As of the end of the year — —
Postretirement Benefit
Pension Benefit
Payments (1) Payments
Expected Federal Subsidy
(In $ millions)
2013 237 54 6 2014 236 55 6 2015 236 56 6 2016 237 55 2 2017 241 54 2 2018-2021 1,250 260 6
(1) Payments are expected to be made primarily from plan assets.
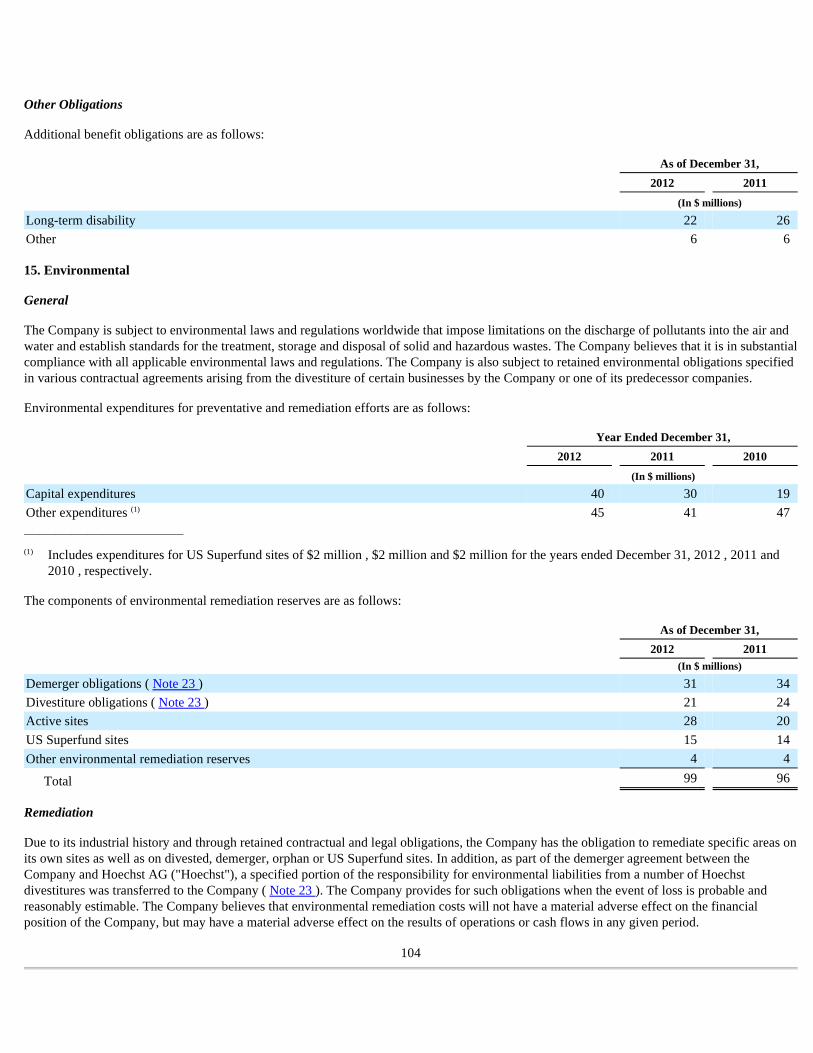
Other Obligations
Additional benefit obligations are as follows:
15. Environmental
General
The Company is subject to environmental laws and regulations worldwide that impose limitations on the discharge of pollutants into the air and water and establish standards for the treatment, storage and disposal of solid and hazardous wastes. The Company believes that it is in substantial compliance with all applicable environmental laws and regulations. The Company is also subject to retained environmental obligations specified in various contractual agreements arising from the divestiture of certain businesses by the Company or one of its predecessor companies.
Environmental expenditures for preventative and remediation efforts are as follows:
______________________________
The components of environmental remediation reserves are as follows:
Remediation
Due to its industrial history and through retained contractual and legal obligations, the Company has the obligation to remediate specific areas on its own sites as well as on divested, demerger, orphan or US Superfund sites. In addition, as part of the demerger agreement between the Company and Hoechst AG ("Hoechst"), a specified portion of the responsibility for environmental liabilities from a number of Hoechst divestitures was transferred to the Company ( Note 23 ). The Company provides for such obligations when the event of loss is probable and reasonably estimable. The Company believes that environmental remediation costs will not have a material adverse effect on the financial position of the Company, but may have a material adverse effect on the results of operations or cash flows in any given period.
104
As of December 31,
2012 2011
(In $ millions)
Long-term disability 22 26 Other 6 6
Year Ended December 31,
2012 2011 2010
(In $ millions)
Capital expenditures 40 30 19 Other expenditures (1) 45 41 47
(1) Includes expenditures for US Superfund sites of $2 million , $2 million and $2 million for the years ended December 31, 2012 , 2011 and 2010 , respectively.
As of December 31,
2012 2011
(In $ millions)
Demerger obligations ( Note 23 ) 31 34 Divestiture obligations ( Note 23 ) 21 24 Active sites 28 20 US Superfund sites 15 14 Other environmental remediation reserves 4 4
Total 99 96
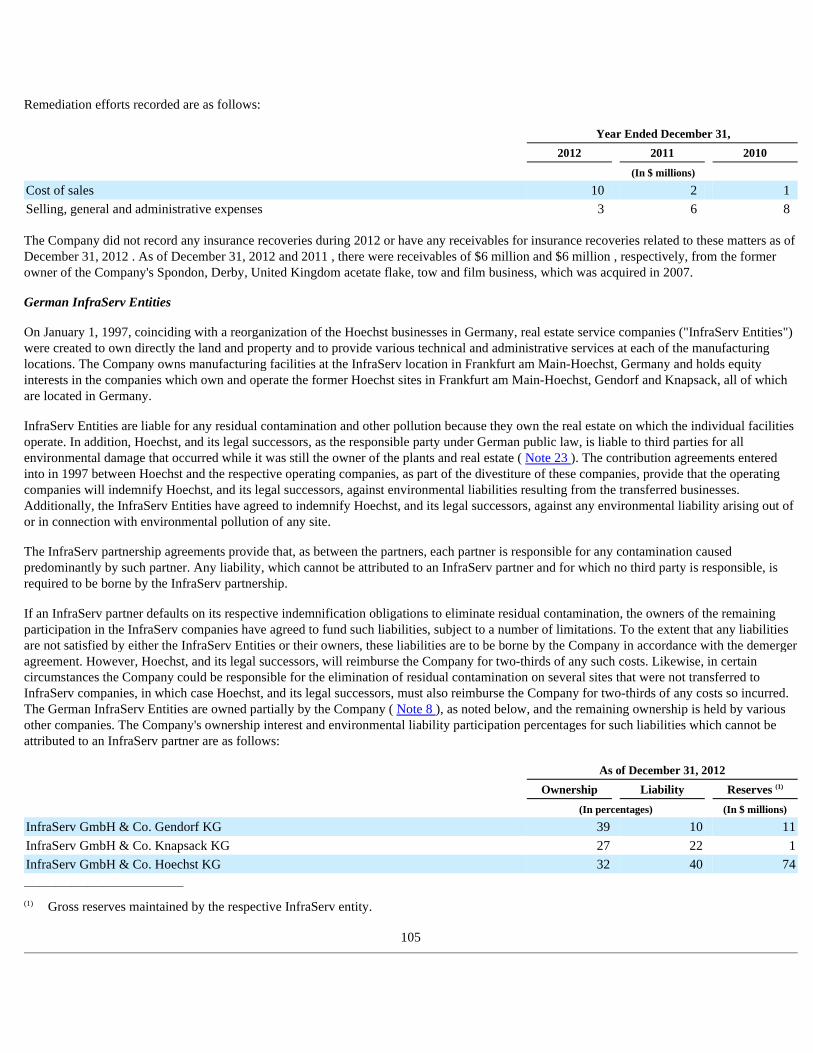
Remediation efforts recorded are as follows:
The Company did not record any insurance recoveries during 2012 or have any receivables for insurance recoveries related to these matters as of December 31, 2012 . As of December 31, 2012 and 2011 , there were receivables of $6 million and $6 million , respectively, from the former owner of the Company's Spondon, Derby, United Kingdom acetate flake, tow and film business, which was acquired in 2007.
German InfraServ Entities
On January 1, 1997, coinciding with a reorganization of the Hoechst businesses in Germany, real estate service companies ("InfraServ Entities") were created to own directly the land and property and to provide various technical and administrative services at each of the manufacturing locations. The Company owns manufacturing facilities at the InfraServ location in Frankfurt am Main-Hoechst, Germany and holds equity interests in the companies which own and operate the former Hoechst sites in Frankfurt am Main-Hoechst, Gendorf and Knapsack, all of which are located in Germany.
InfraServ Entities are liable for any residual contamination and other pollution because they own the real estate on which the individual facilities operate. In addition, Hoechst, and its legal successors, as the responsible party under German public law, is liable to third parties for all environmental damage that occurred while it was still the owner of the plants and real estate ( Note 23 ). The contribution agreements entered into in 1997 between Hoechst and the respective operating companies, as part of the divestiture of these companies, provide that the operating companies will indemnify Hoechst, and its legal successors, against environmental liabilities resulting from the transferred businesses. Additionally, the InfraServ Entities have agreed to indemnify Hoechst, and its legal successors, against any environmental liability arising out of or in connection with environmental pollution of any site.
The InfraServ partnership agreements provide that, as between the partners, each partner is responsible for any contamination caused predominantly by such partner. Any liability, which cannot be attributed to an InfraServ partner and for which no third party is responsible, is required to be borne by the InfraServ partnership.
If an InfraServ partner defaults on its respective indemnification obligations to eliminate residual contamination, the owners of the remaining participation in the InfraServ companies have agreed to fund such liabilities, subject to a number of limitations. To the extent that any liabilities are not satisfied by either the InfraServ Entities or their owners, these liabilities are to be borne by the Company in accordance with the demerger agreement. However, Hoechst, and its legal successors, will reimburse the Company for two-thirds of any such costs. Likewise, in certain circumstances the Company could be responsible for the elimination of residual contamination on several sites that were not transferred to InfraServ companies, in which case Hoechst, and its legal successors, must also reimburse the Company for two-thirds of any costs so incurred. The German InfraServ Entities are owned partially by the Company ( Note 8 ), as noted below, and the remaining ownership is held by various other companies. The Company's ownership interest and environmental liability participation percentages for such liabilities which cannot be attributed to an InfraServ partner are as follows:
______________________________
105
Year Ended December 31,
2012 2011 2010
(In $ millions)
Cost of sales 10 2 1 Selling, general and administrative expenses 3 6 8
As of December 31, 2012
Ownership Liability Reserves (1)
(In percentages) (In $ millions)
InfraServ GmbH & Co. Gendorf KG 39 10 11
InfraServ GmbH & Co. Knapsack KG 27 22 1
InfraServ GmbH & Co. Hoechst KG 32 40 74
(1) Gross reserves maintained by the respective InfraServ entity.
US Superfund Sites
In the US, the Company may be subject to substantial claims brought by US federal or state regulatory agencies or private individuals pursuant to statutory authority or common law. In particular, the Company has a potential liability under the US Federal Comprehensive Environmental Response, Compensation and Liability Act of 1980, as amended, and related state laws (collectively referred to as "Superfund") for investigation and cleanup costs at certain sites. At most of these sites, numerous companies, including the Company, or one of its predecessor companies, have been notified that the Environmental Protection Agency, state governing bodies or private individuals consider such companies to be potentially responsible parties ("PRP") under Superfund or related laws. The proceedings relating to these sites are in various stages. The cleanup process has not been completed at most sites and the status of the insurance coverage for some of these proceedings is uncertain. Consequently, the Company cannot accurately determine its ultimate liability for investigation or cleanup costs at these sites.
As events progress at each site for which it has been named a PRP, the Company accrues, as appropriate, a liability for site cleanup. Such liabilities include all costs that are probable and can be reasonably estimated. In establishing these liabilities, the Company considers its shipment of waste to a site, its percentage of total waste shipped to the site, the types of wastes involved, the conclusions of any studies, the magnitude of any remedial actions that may be necessary and the number and viability of other PRPs. Often the Company joins with other PRPs to sign joint defense agreements that settle, among PRPs, each party’s percentage allocation of costs at the site. Although the ultimate liability may differ from the estimate, the Company routinely reviews the liabilities and revises the estimate, as appropriate, based on the most current information available. One such site is the Lower Passaic River Study Area. The Company and 70 other companies are parties to a May 2007 Administrative Order on Consent with the US Environmental Protection Agency ("EPA") to perform a Remedial Investigation/Feasibility Study ("RI/FS") of the contaminants in the lower 17 mile stretch known as the Lower Passaic River Study Area. The RI/FS is ongoing and may take several more years to complete. The Company is among a group of settling parties to a June 2012 Administrative Order on Consent with the EPA to perform a removal action on a small section of the river. The Company has also been named as a third-party defendant along with more than 200 other entities in an action initially brought by the New Jersey Department of Environmental Protection ("NJDEP") in the Supreme Court of New Jersey against Occidental Chemical Corporation and several other companies. This suit by the NJDEP seeks recovery of past and future clean-up costs, as well as unspecified economic damages, punitive damages, penalties and a variety of other forms of relief arising from alleged discharges into the Lower Passaic River. In 2007, the EPA issued a draft study that evaluated alternatives for early remedial action of a portion of the Passaic River at an estimated cost of $900 million to $2.3 billion . Several parties commented on the draft study, and the EPA has announced its intention to issue a proposed plan in 2013. Although the Company's assessment that the contamination allegedly released by the Company is likely an insignificant aspect of the final remedy, because the RI/FS is still ongoing, and the EPA has not finalized its study or the scope of requested cleanup the Company cannot reliably estimate its portion of the final remedial costs for this matter at this time. However, the Company currently believes that its portion of the costs would be less than approximately 1% to 2% . The Company is vigorously defending these and all related matters.
Environmental Proceedings
On January 7, 2013, following self-disclosures by the Company, the Company's Meredosia, Illinois site received a Notice of Violation/Finding of Violation from the US Environmental Protection Agency Region 5 ("EPA") alleging Clean Air Act violations. The Company is working with the EPA and with the state agency to reach a resolution of this matter. Based on currently available information and the Company's past experience, we do not believe that resolution of this matter will have a significant impact on the Company, even though the Company cannot conclude that a penalty will be less than $100,000 . The Meredosia, Illinois site is included in the Industrial Specialties segment.
16. Stockholders’ Equity
Preferred Stock
In February 2010, the Company delivered notice to the holders of its 4.25% Convertible Perpetual Preferred Stock (the "Preferred Stock") that it was calling for the redemption of all 9,600,000 outstanding shares of Preferred Stock. Holders of the Preferred Stock were entitled to convert each share of Preferred Stock into 1.2600 shares of the Company’s Series A Common Stock, par value $0.0001 per share ("Common Stock"). Holders of the Preferred Stock elected to convert 9,591,276 shares of Preferred Stock into an aggregate of 12,084,942 shares of Common Stock. The 8,724 shares of Preferred Stock that remained outstanding after such conversions were redeemed by the Company for 7,437 shares of Common Stock, in accordance with the terms of the Preferred Stock. The Company paid cash in lieu of fractional shares.
106
Common Stock
The Company’s Board of Directors follows a policy of declaring, subject to legally available funds, a quarterly cash dividend on each share of Common Stock unless the Company’s Board of Directors, in its sole discretion, determines otherwise. The amount available to pay cash dividends is restricted by the Company’s Amended Credit Agreement, the 4.625% Notes, the 5.875% Notes and the 6.625% Notes.
In April 2011, the Company announced that its Board of Directors approved a 20% increase in the Company’s quarterly Common Stock cash dividend. The Board of Directors increased the quarterly dividend rate from $0.05 to $0.06 per share of Common Stock on a quarterly basis and $0.20 to $0.24 per share of Common Stock on an annual basis beginning in August 2011.
On April 23, 2012, the Company announced that its Board of Directors approved a 25% increase in the Company's quarterly Common Stock cash dividend. The Board of Directors increased the quarterly dividend rate from $0.06 to $0.075 per share of Common Stock on a quarterly basis and $0.24 to $0.30 per share of Common Stock on an annual basis beginning in August 2012.
Treasury Stock
The Company’s Board of Directors authorized the repurchase of Common Stock as follows:
The authorization gives management discretion in determining the timing and conditions under which shares may be repurchased. The share repurchase activity pursuant to this authorization is as follows:
______________________________
The purchase of treasury stock reduces the number of shares outstanding and the repurchased shares may be used by the Company for compensation programs utilizing the Company’s stock and other corporate purposes. The Company accounts for treasury stock using the cost method and includes treasury stock as a component of stockholders’ equity.
107
Authorized Amount
(In $ millions)
February 2008 400 October 2008 100 April 2011 129 October 2012 264
As of December 31, 2012 893
Year Ended December 31,
Total From February 2008
Through
2012 2011 2010 December 31, 2012
Shares repurchased 1,059,719 (1) 652,016 1,667,592 13,142,527 Average purchase price per share $ 42.44 $ 46.99 $ 28.77 $ 38.14 Amount spent on repurchased shares (in millions) $ 45 $ 31 $ 48 $ 501
(1) Ex cludes 5,823 shares withheld from employee to cover statutory minimum withholding requirements for personal income taxes related to the vesting of restricted stock. Restricted stock is considered outstanding at the time of issuance and therefore, the shares withheld are treated as treasury shares.
Other Comprehensive Income (Loss), Net
Adjustments to Accumulated other comprehensive income (loss), net, are as follows:
17. Other (Charges) Gains, Net
108
Year Ended December 31,
2012 2011 2010
Gross
Amount
Income Tax
(Provision) Benefit
Net Amount
Gross Amount
Income Tax
(Provision) Benefit
Net Amount
Gross Amount
Income Tax
(Provision) Benefit
Net Amount
(In $ millions)
Unrealized gain (loss) on marketable securities — — — — — — — (1 ) (1 )
Foreign currency translation 13 (8 ) 5 (29 ) 2 (27 ) 26 11 37 Unrealized gain (loss) on
interest rate swaps 10 (3 ) 7 37 (10 ) 27 32 (15 ) 17 Pension and postretirement
benefits (348 ) 104 (244 ) (290 ) 110 (180 ) (102 ) 39 (63 )
Total (325 ) 93 (232 ) (282 ) 102 (180 ) (44 ) 34 (10 )
Unrealized Gain (Loss) on
Marketable Securities
Foreign Currency
Translation
Unrealized Gain (Loss) on Interest Rate Swaps
Pension and
Postretirement Benefits
Accumulated Other
Comprehensive Income
(Loss), Net
(In $ millions)
As of December 31, 2009 — (38 ) (101 ) (521 ) (660 )
Current period change — 26 32 (102 ) (44 )
Income tax (provision) benefit (1 ) 11 (15 ) 39 34 As of December 31, 2010 (1 ) (1 ) (84 ) (584 ) (670 )
Current period change — (29 ) 37 (290 ) (282 )
Income tax (provision) benefit — 2 (10 ) 110 102 As of December 31, 2011 (1 ) (28 ) (57 ) (764 ) (850 )
Current period change — 13 10 (348 ) (325 )
Income tax (provision) benefit — (8 ) (3 ) 104 93
As of December 31, 2012 (1 ) (23 ) (50 ) (1,008 ) (1,082 )
Year Ended December 31,
2012 2011 2010
(In $ millions)
Employee termination benefits (6 ) (22 ) (32 )
Kelsterbach plant relocation ( Note 27 ) (7 ) (47 ) (26 )
Plumbing actions ( Note 23 ) 5 6 59 Insurance recoveries ( Note 28 ) — — 18 Asset impairments (8 ) (1 ) (74 )
Plant/office closures — — (4 )
Commercial disputes 2 15 13 Other — 1 —
Total (14 ) (48 ) (46 )
2012
During the year ended December 31, 2012 , the Company recorded $5 million of employee termination benefits, related to the previously announced closure of the Company's acetate flake and acetate tow manufacturing operations at its Spondon, Derby, United Kingdom site ( Note 4 ). Also during the year ended December 31, 2012 , the Company concluded that certain long-lived assets were partially impaired at its acetate flake and acetate tow manufacturing operations in Spondon, Derby, United Kingdom. Accordingly, the Company wrote down the related property, plant and equipment to its fair value of $3 million , measured at the date of impairment, resulting in long-lived asset impairment losses of $8 million for the year ended December 31, 2012 . The Company calculated the fair value using a discounted cash flow model incorporating discount rates commensurate with the risks involved for the reporting unit. This fair value measurement of long-lived assets is classified as a Level 3 measurement under FASB ASC Topic 820. The key assumptions used in the discounted cash flow valuation model include discount rates, growth rates, cash flow projections and terminal value rates. Discount rates, growth rates and cash flow projections involve significant judgment and are based on management's estimate of current and forecasted market conditions and cost structure.
2011
As a result of the Company’s Pardies, France "Project of Closure" and the previously announced closure of the Company’s acetate flake and acetate tow manufacturing operations at its Spondon, Derby, United Kingdom site ( Note 4 ), the Company recorded $4 million and $4 million , respectively, of employee termination benefits during the year ended December 31, 2011. Additionally, during the year ended December 31, 2011, the Company recorded $8 million of employee termination benefits related to the relocation of the Company's polyacetal ("POM") operations located in Kelsterbach, Germany to Frankfurt Hoechst Industrial Park, Germany ( Note 27 ) and $6 million of employee termination benefits related to a business optimization project which is included in the Other Activities segment.
During the year ended December 31, 2011, the Company received consideration of $17 million in connection with the settlement of a claim against a bankrupt supplier ( Note 23 ). The resolution of this commercial dispute is included in the Acetyl Intermediates segment.
2010
In 2010, the Company concluded that certain long-lived assets were partially impaired at its acetate flake and acetate tow manufacturing operations in Spondon, Derby, United Kingdom ( Note 4 ). Accordingly, the Company wrote down the related property, plant and equipment to its fair value of $31 million , measured at the date of impairment, resulting in long-lived asset impairment losses of $72 million for the year ended December 31, 2010. The Company calculated the fair value using a discounted cash flow model incorporating discount rates commensurate with the risks involved for the reporting unit. This fair value measurement of long-lived assets is classified as a Level 3 measurement under FASB ASC Topic 820. The key assumptions used in the discounted cash flow valuation model include discount rates, growth rates, cash flow projections and terminal value rates. Discount rates, growth rates and cash flow projections involve significant judgment and are based on management's estimate of current and forecasted market conditions and cost structure.
As a result of the announced closure of the Company's acetate flake and acetate tow manufacturing operations in Spondon, Derby, United Kingdom ( Note 4 ), the Company recorded $15 million of employee termination benefits during the year ended December 31, 2010.
As a result of the Company's Pardies, France "Project of Closure" ( Note 4 ), the Company recorded exit costs of $12 million during the year ended December 31, 2010, which primarily consisted of $6 million in employee termination benefits, $1 million of long-lived asset impairment losses, $3 million of contract termination costs and $3 million of reindustrialization costs.
As a result of several business optimization projects undertaken by the Company beginning in 2009 and continuing throughout 2010, the Company recorded $11 million in employee termination costs during the year ended December 31, 2010.
Other charges for the year ended December 31, 2010 also included gains of $13 million , net, related to settlements in resolution of commercial disputes. The settlements were recorded in the Company's Consumer Specialties segment.
109
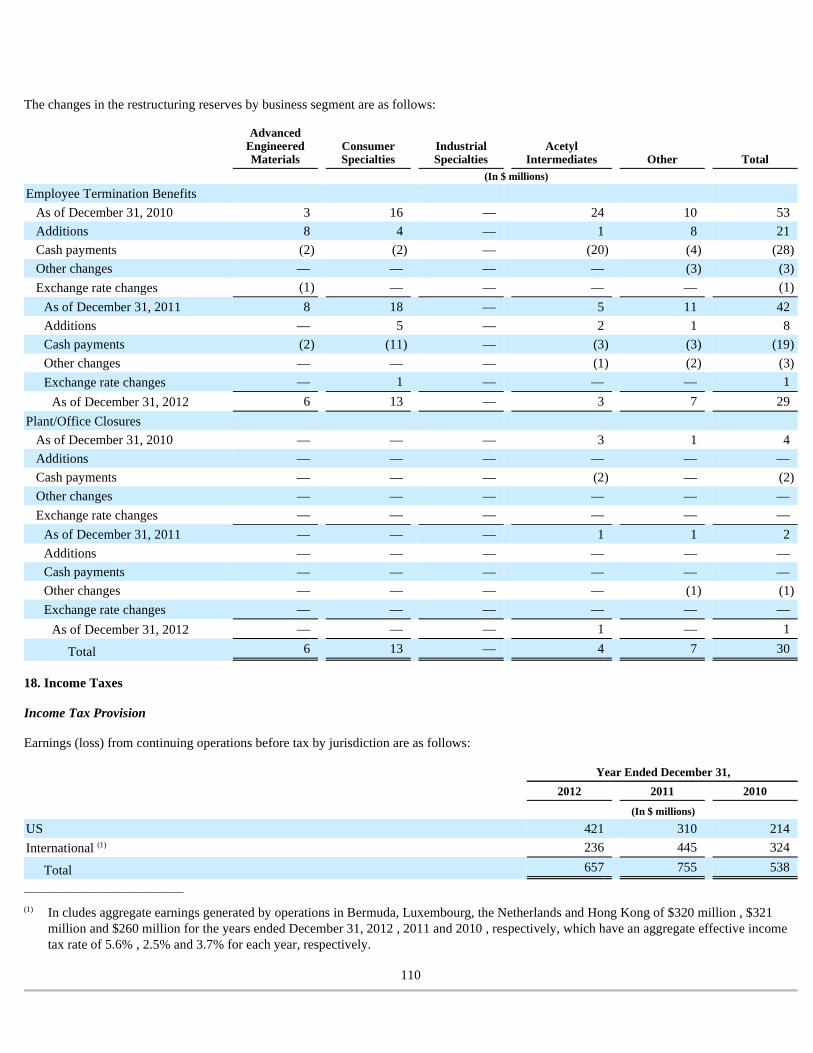
The changes in the restructuring reserves by business segment are as follows:
18. Income Taxes
Income Tax Provision
Earnings (loss) from continuing operations before tax by jurisdiction are as follows:
______________________________
110
Advanced Engineered Materials
Consumer Specialties
Industrial Specialties
Acetyl Intermediates Other Total
(In $ millions)
Employee Termination Benefits As of December 31, 2010 3 16 — 24 10 53 Additions 8 4 — 1 8 21 Cash payments (2 ) (2 ) — (20 ) (4 ) (28 )
Other changes — — — — (3 ) (3 )
Exchange rate changes (1 ) — — — — (1 )
As of December 31, 2011 8 18 — 5 11 42 Additions — 5 — 2 1 8 Cash payments (2 ) (11 ) — (3 ) (3 ) (19 )
Other changes — — — (1 ) (2 ) (3 )
Exchange rate changes — 1 — — — 1 As of December 31, 2012 6 13 — 3 7 29
Plant/Office Closures As of December 31, 2010 — — — 3 1 4 Additions — — — — — — Cash payments — — — (2 ) — (2 )
Other changes — — — — — — Exchange rate changes — — — — — —
As of December 31, 2011 — — — 1 1 2 Additions — — — — — — Cash payments — — — — — — Other changes — — — — (1 ) (1 )
Exchange rate changes — — — — — — As of December 31, 2012 — — — 1 — 1
Total 6 13 — 4 7 30
Year Ended December 31,
2012 2011 2010
(In $ millions)
US 421 310 214 International (1) 236 445 324
Total 657 755 538
(1) In cludes aggregate earnings generated by operations in Bermuda, Luxembourg, the Netherlands and Hong Kong of $320 million , $321 million and $260 million for the years ended December 31, 2012 , 2011 and 2010 , respectively, which have an aggregate effective income tax rate of 5.6% , 2.5% and 3.7% for each year, respectively.
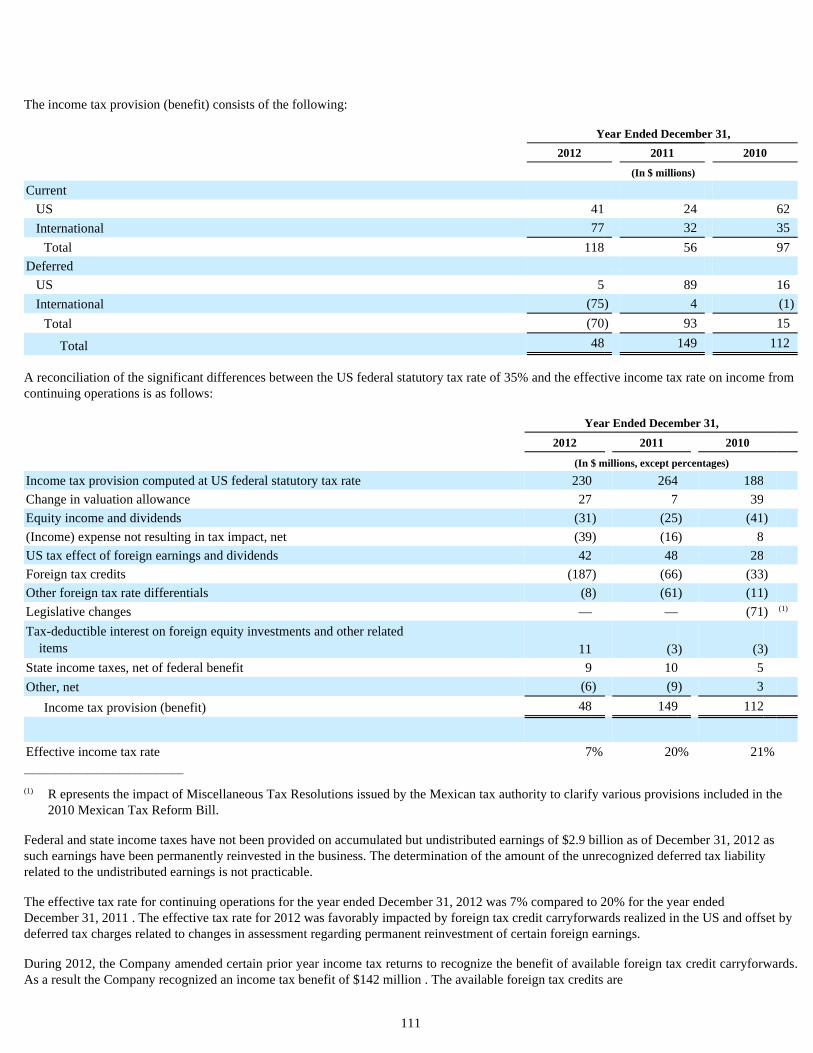
The income tax provision (benefit) consists of the following:
A reconciliation of the significant differences between the US federal statutory tax rate of 35% and the effective income tax rate on income from continuing operations is as follows:
______________________________
Federal and state income taxes have not been provided on accumulated but undistributed earnings of $2.9 billion as of December 31, 2012 as such earnings have been permanently reinvested in the business. The determination of the amount of the unrecognized deferred tax liability related to the undistributed earnings is not practicable.
The effective tax rate for continuing operations for the year ended December 31, 2012 was 7% compared to 20% for the year ended December 31, 2011 . The effective tax rate for 2012 was favorably impacted by foreign tax credit carryforwards realized in the US and offset by deferred tax charges related to changes in assessment regarding permanent reinvestment of certain foreign earnings.
During 2012, the Company amended certain prior year income tax returns to recognize the benefit of available foreign tax credit carryforwards. As a result the Company recognized an income tax benefit of $142 million . The available foreign tax credits are
111
Year Ended December 31,
2012 2011 2010
(In $ millions)
Current
US 41 24 62 International 77 32 35
Total 118 56 97 Deferred
US 5 89 16 International (75 ) 4 (1 )
Total (70 ) 93 15
Total 48 149 112
Year Ended December 31,
2012 2011 2010
(In $ millions, except percentages)
Income tax provision computed at US federal statutory tax rate 230 264 188
Change in valuation allowance 27 7 39
Equity income and dividends (31 ) (25 ) (41 )
(Income) expense not resulting in tax impact, net (39 ) (16 ) 8
US tax effect of foreign earnings and dividends 42 48 28
Foreign tax credits (187 ) (66 ) (33 )
Other foreign tax rate differentials (8 ) (61 ) (11 )
Legislative changes — — (71 ) (1)
Tax-deductible interest on foreign equity investments and other related items 11 (3 ) (3 )
State income taxes, net of federal benefit 9 10 5
Other, net (6 ) (9 ) 3
Income tax provision (benefit) 48 149 112
Effective income tax rate 7 % 20 % 21 %
(1) R epresents the impact of Miscellaneous Tax Resolutions issued by the Mexican tax authority to clarify various provisions included in the 2010 Mexican Tax Reform Bill.

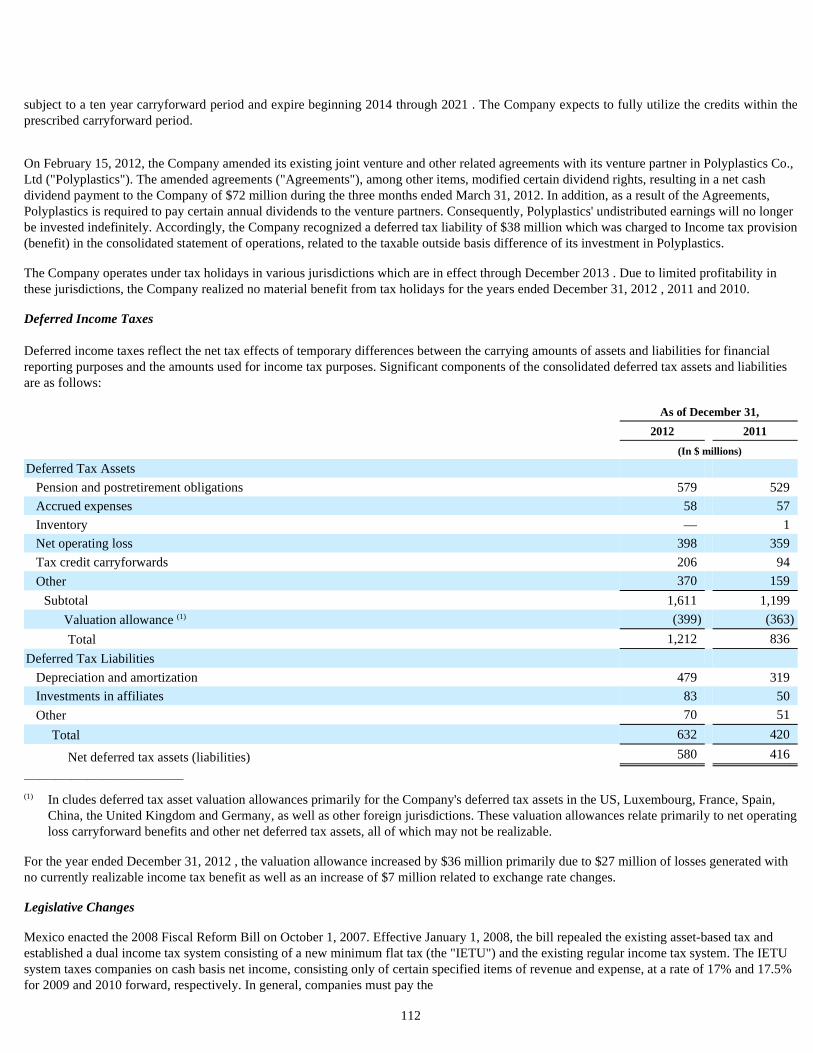
subject to a ten year carryforward period and expire beginning 2014 through 2021 . The Company expects to fully utilize the credits within the prescribed carryforward period.
On February 15, 2012, the Company amended its existing joint venture and other related agreements with its venture partner in Polyplastics Co., Ltd ("Polyplastics"). The amended agreements ("Agreements"), among other items, modified certain dividend rights, resulting in a net cash dividend payment to the Company of $72 million during the three months ended March 31, 2012. In addition, as a result of the Agreements, Polyplastics is required to pay certain annual dividends to the venture partners. Consequently, Polyplastics' undistributed earnings will no longer be invested indefinitely. Accordingly, the Company recognized a deferred tax liability of $38 million which was charged to Income tax provision (benefit) in the consolidated statement of operations, related to the taxable outside basis difference of its investment in Polyplastics.
The Company operates under tax holidays in various jurisdictions which are in effect through December 2013 . Due to limited profitability in these jurisdictions, the Company realized no material benefit from tax holidays for the years ended December 31, 2012 , 2011 and 2010.
Deferred Income Taxes Deferred income taxes reflect the net tax effects of temporary differences between the carrying amounts of assets and liabilities for financial reporting purposes and the amounts used for income tax purposes. Significant components of the consolidated deferred tax assets and liabilities are as follows:
______________________________
For the year ended December 31, 2012 , the valuation allowance increased by $36 million primarily due to $27 million of losses generated with no currently realizable income tax benefit as well as an increase of $7 million related to exchange rate changes.
Legislative Changes
Mexico enacted the 2008 Fiscal Reform Bill on October 1, 2007. Effective January 1, 2008, the bill repealed the existing asset-based tax and established a dual income tax system consisting of a new minimum flat tax (the "IETU") and the existing regular income tax system. The IETU system taxes companies on cash basis net income, consisting only of certain specified items of revenue and expense, at a rate of 17% and 17.5% for 2009 and 2010 forward, respectively. In general, companies must pay the
112
As of December 31,
2012 2011
(In $ millions)
Deferred Tax Assets
Pension and postretirement obligations 579 529 Accrued expenses 58 57 Inventory — 1 Net operating loss 398 359 Tax credit carryforwards 206 94 Other 370 159
Subtotal 1,611 1,199 Valuation allowance (1) (399 ) (363 )
Total 1,212 836 Deferred Tax Liabilities
Depreciation and amortization 479 319 Investments in affiliates 83 50 Other 70 51
Total 632 420
Net deferred tax assets (liabilities) 580 416
(1) In cludes deferred tax asset valuation allowances primarily for the Company's deferred tax assets in the US, Luxembourg, France, Spain, China, the United Kingdom and Germany, as well as other foreign jurisdictions. These valuation allowances relate primarily to net operating loss carryforward benefits and other net deferred tax assets, all of which may not be realizable.

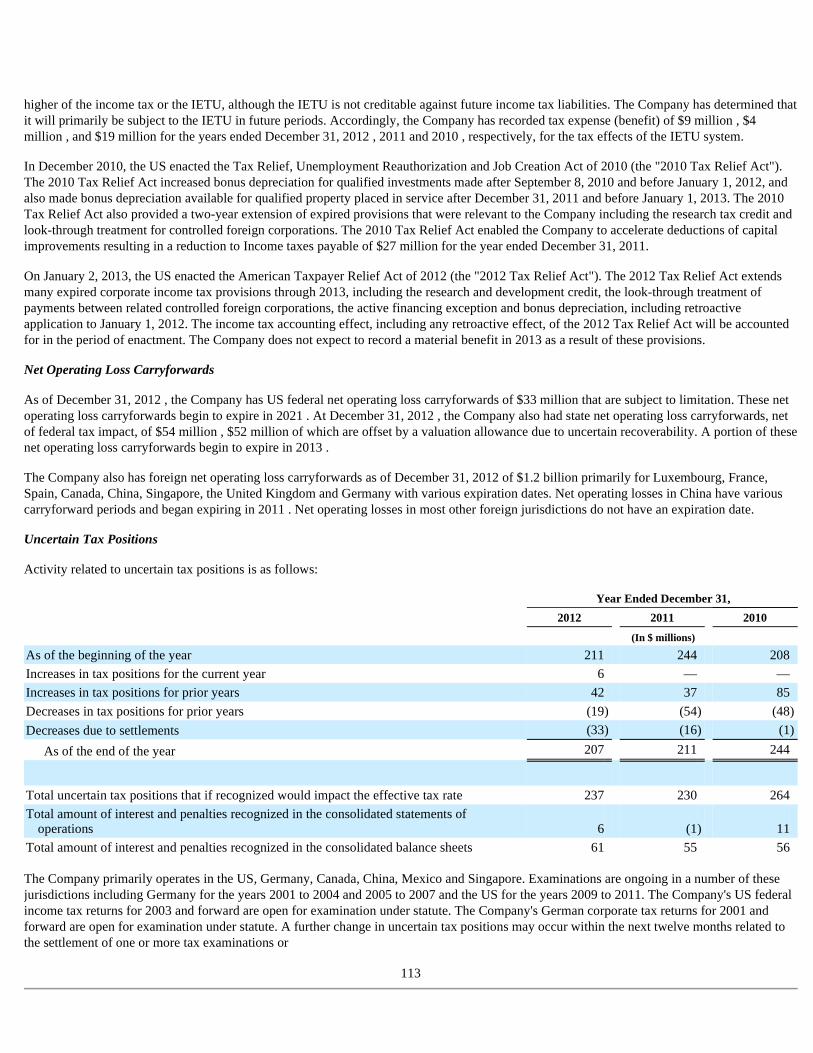
higher of the income tax or the IETU, although the IETU is not creditable against future income tax liabilities. The Company has determined that it will primarily be subject to the IETU in future periods. Accordingly, the Company has recorded tax expense (benefit) of $9 million , $4 million , and $19 million for the years ended December 31, 2012 , 2011 and 2010 , respectively, for the tax effects of the IETU system.
In December 2010, the US enacted the Tax Relief, Unemployment Reauthorization and Job Creation Act of 2010 (the "2010 Tax Relief Act"). The 2010 Tax Relief Act increased bonus depreciation for qualified investments made after September 8, 2010 and before January 1, 2012, and also made bonus depreciation available for qualified property placed in service after December 31, 2011 and before January 1, 2013. The 2010 Tax Relief Act also provided a two-year extension of expired provisions that were relevant to the Company including the research tax credit and look-through treatment for controlled foreign corporations. The 2010 Tax Relief Act enabled the Company to accelerate deductions of capital improvements resulting in a reduction to Income taxes payable of $27 million for the year ended December 31, 2011.
On January 2, 2013, the US enacted the American Taxpayer Relief Act of 2012 (the "2012 Tax Relief Act"). The 2012 Tax Relief Act extends many expired corporate income tax provisions through 2013, including the research and development credit, the look-through treatment of payments between related controlled foreign corporations, the active financing exception and bonus depreciation, including retroactive application to January 1, 2012. The income tax accounting effect, including any retroactive effect, of the 2012 Tax Relief Act will be accounted for in the period of enactment. The Company does not expect to record a material benefit in 2013 as a result of these provisions.
Net Operating Loss Carryforwards
As of December 31, 2012 , the Company has US federal net operating loss carryforwards of $33 million that are subject to limitation. These net operating loss carryforwards begin to expire in 2021 . At December 31, 2012 , the Company also had state net operating loss carryforwards, net of federal tax impact, of $54 million , $52 million of which are offset by a valuation allowance due to uncertain recoverability. A portion of these net operating loss carryforwards begin to expire in 2013 .
The Company also has foreign net operating loss carryforwards as of December 31, 2012 of $1.2 billion primarily for Luxembourg, France, Spain, Canada, China, Singapore, the United Kingdom and Germany with various expiration dates. Net operating losses in China have various carryforward periods and began expiring in 2011 . Net operating losses in most other foreign jurisdictions do not have an expiration date.
Uncertain Tax Positions
Activity related to uncertain tax positions is as follows:
The Company primarily operates in the US, Germany, Canada, China, Mexico and Singapore. Examinations are ongoing in a number of these jurisdictions including Germany for the years 2001 to 2004 and 2005 to 2007 and the US for the years 2009 to 2011. The Company's US federal income tax returns for 2003 and forward are open for examination under statute. The Company's German corporate tax returns for 2001 and forward are open for examination under statute. A further change in uncertain tax positions may occur within the next twelve months related to the settlement of one or more tax examinations or
113
Year Ended December 31,
2012 2011 2010
(In $ millions)
As of the beginning of the year 211 244 208 Increases in tax positions for the current year 6 — — Increases in tax positions for prior years 42 37 85 Decreases in tax positions for prior years (19 ) (54 ) (48 )
Decreases due to settlements (33 ) (16 ) (1 )
As of the end of the year 207 211 244
Total uncertain tax positions that if recognized would impact the effective tax rate 237 230 264 Total amount of interest and penalties recognized in the consolidated statements of
operations 6 (1 ) 11 Total amount of interest and penalties recognized in the consolidated balance sheets 61 55 56
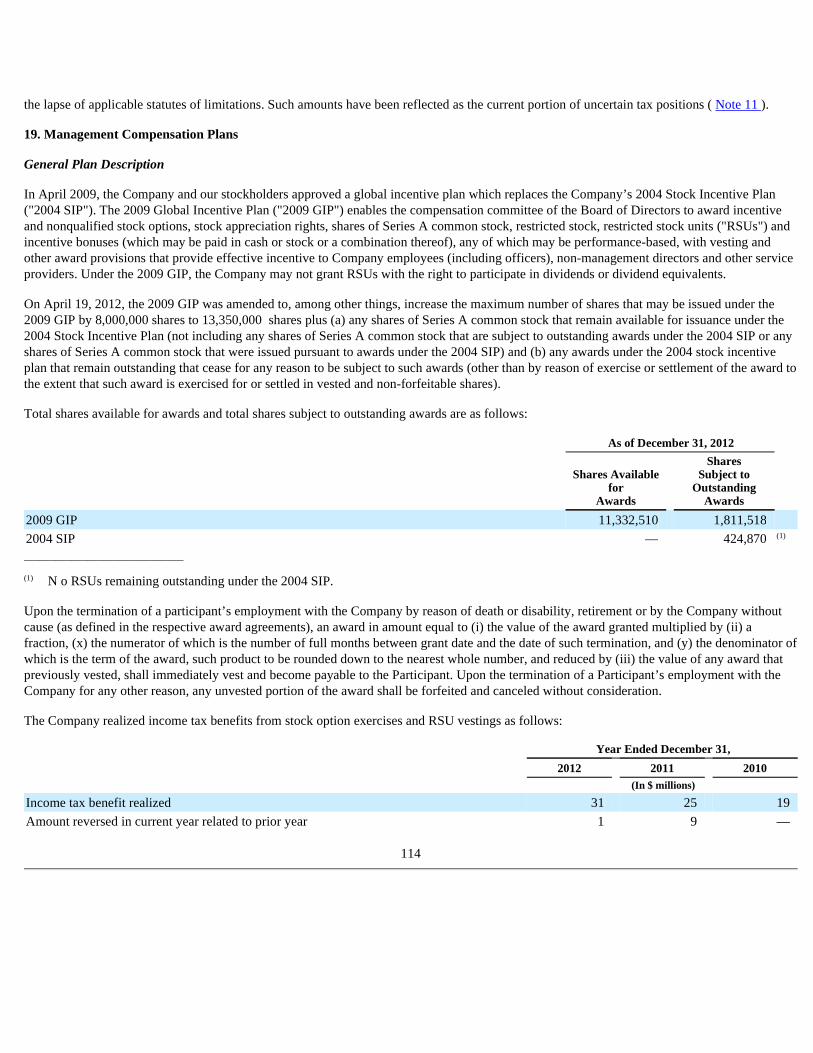
the lapse of applicable statutes of limitations. Such amounts have been reflected as the current portion of uncertain tax positions ( Note 11 ).
19. Management Compensation Plans
General Plan Description
In April 2009, the Company and our stockholders approved a global incentive plan which replaces the Company’s 2004 Stock Incentive Plan ("2004 SIP"). The 2009 Global Incentive Plan ("2009 GIP") enables the compensation committee of the Board of Directors to award incentive and nonqualified stock options, stock appreciation rights, shares of Series A common stock, restricted stock, restricted stock units ("RSUs") and incentive bonuses (which may be paid in cash or stock or a combination thereof), any of which may be performance-based, with vesting and other award provisions that provide effective incentive to Company employees (including officers), non-management directors and other service providers. Under the 2009 GIP, the Company may not grant RSUs with the right to participate in dividends or dividend equivalents.
On April 19, 2012, the 2009 GIP was amended to, among other things, increase the maximum number of shares that may be issued under the 2009 GIP by 8,000,000 shares to 13,350,000 shares plus (a) any shares of Series A common stock that remain available for issuance under the 2004 Stock Incentive Plan (not including any shares of Series A common stock that are subject to outstanding awards under the 2004 SIP or any shares of Series A common stock that were issued pursuant to awards under the 2004 SIP) and (b) any awards under the 2004 stock incentive plan that remain outstanding that cease for any reason to be subject to such awards (other than by reason of exercise or settlement of the award to the extent that such award is exercised for or settled in vested and non-forfeitable shares).
Total shares available for awards and total shares subject to outstanding awards are as follows:
______________________________
Upon the termination of a participant’s employment with the Company by reason of death or disability, retirement or by the Company without cause (as defined in the respective award agreements), an award in amount equal to (i) the value of the award granted multiplied by (ii) a fraction, (x) the numerator of which is the number of full months between grant date and the date of such termination, and (y) the denominator of which is the term of the award, such product to be rounded down to the nearest whole number, and reduced by (iii) the value of any award that previously vested, shall immediately vest and become payable to the Participant. Upon the termination of a Participant’s employment with the Company for any other reason, any unvested portion of the award shall be forfeited and canceled without consideration.
The Company realized income tax benefits from stock option exercises and RSU vestings as follows:
114
As of December 31, 2012
Shares Available for
Awards
Shares Subject to
Outstanding Awards
2009 GIP 11,332,510 1,811,518
2004 SIP — 424,870 (1)
(1) N o RSUs remaining outstanding under the 2004 SIP.
Year Ended December 31,
2012 2011 2010 (In $ millions)
Income tax benefit realized 31 25 19 Amount reversed in current year related to prior year 1 9 —
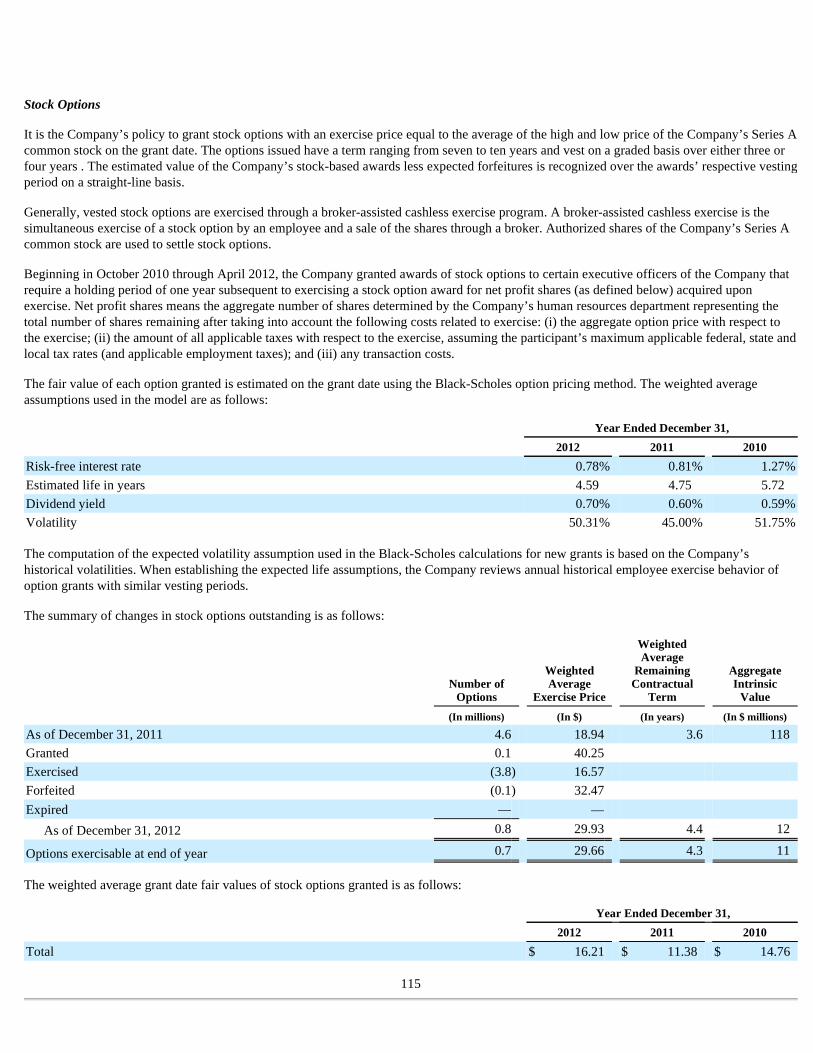
Stock Options
It is the Company’s policy to grant stock options with an exercise price equal to the average of the high and low price of the Company’s Series A common stock on the grant date. The options issued have a term ranging from seven to ten years and vest on a graded basis over either three or four years . The estimated value of the Company’s stock-based awards less expected forfeitures is recognized over the awards’ respective vesting period on a straight-line basis.
Generally, vested stock options are exercised through a broker-assisted cashless exercise program. A broker-assisted cashless exercise is the simultaneous exercise of a stock option by an employee and a sale of the shares through a broker. Authorized shares of the Company’s Series A common stock are used to settle stock options.
Beginning in October 2010 through April 2012, the Company granted awards of stock options to certain executive officers of the Company that require a holding period of one year subsequent to exercising a stock option award for net profit shares (as defined below) acquired upon exercise. Net profit shares means the aggregate number of shares determined by the Company’s human resources department representing the total number of shares remaining after taking into account the following costs related to exercise: (i) the aggregate option price with respect to the exercise; (ii) the amount of all applicable taxes with respect to the exercise, assuming the participant’s maximum applicable federal, state and local tax rates (and applicable employment taxes); and (iii) any transaction costs.
The fair value of each option granted is estimated on the grant date using the Black-Scholes option pricing method. The weighted average assumptions used in the model are as follows:
The computation of the expected volatility assumption used in the Black-Scholes calculations for new grants is based on the Company’s historical volatilities. When establishing the expected life assumptions, the Company reviews annual historical employee exercise behavior of option grants with similar vesting periods.
The summary of changes in stock options outstanding is as follows:
The weighted average grant date fair values of stock options granted is as follows:
115
Year Ended December 31,
2012 2011 2010
Risk-free interest rate 0.78 % 0.81 % 1.27 %
Estimated life in years 4.59 4.75 5.72 Dividend yield 0.70 % 0.60 % 0.59 %
Volatility 50.31 % 45.00 % 51.75 %
Number of
Options
Weighted Average
Exercise Price
Weighted Average
Remaining Contractual
Term
Aggregate Intrinsic
Value
(In millions) (In $) (In years) (In $ millions)
As of December 31, 2011 4.6 18.94 3.6 118 Granted 0.1 40.25 Exercised (3.8 ) 16.57 Forfeited (0.1 ) 32.47 Expired — —
As of December 31, 2012 0.8 29.93 4.4 12
Options exercisable at end of year 0.7 29.66 4.3 11
Year Ended December 31,
2012 2011 2010
Total $ 16.21 $ 11.38 $ 14.76
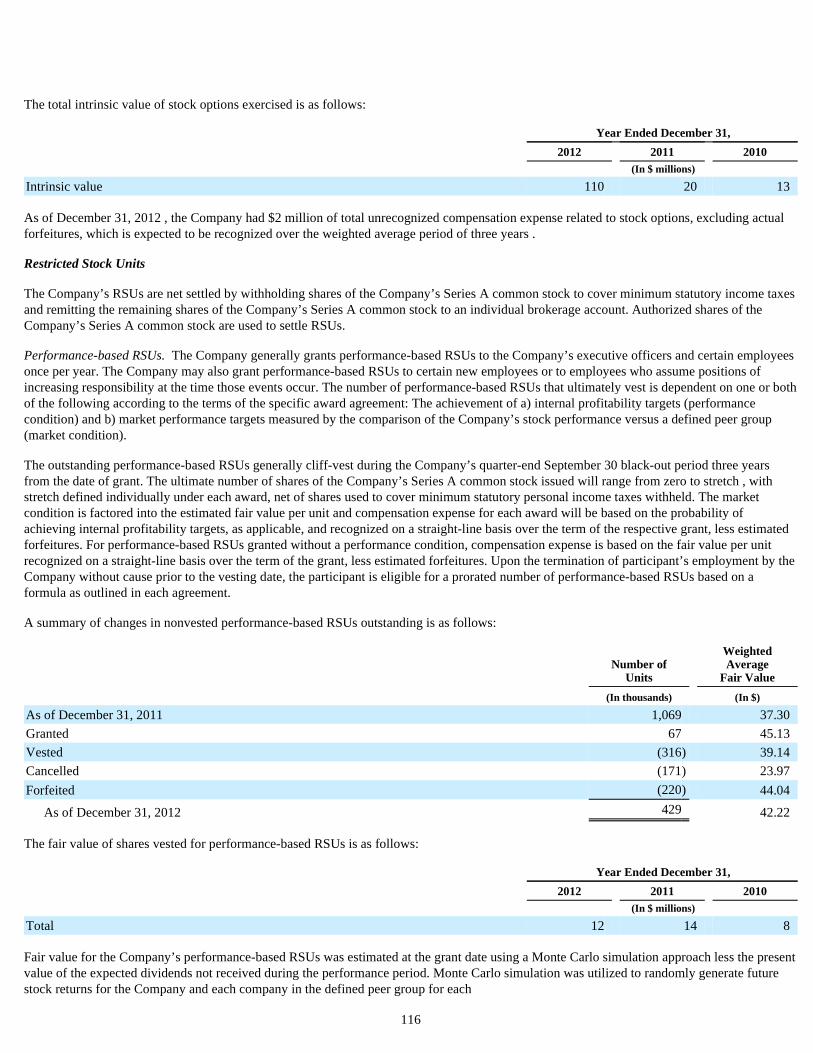
The total intrinsic value of stock options exercised is as follows:
As of December 31, 2012 , the Company had $2 million of total unrecognized compensation expense related to stock options, excluding actual forfeitures, which is expected to be recognized over the weighted average period of three years .
Restricted Stock Units
The Company’s RSUs are net settled by withholding shares of the Company’s Series A common stock to cover minimum statutory income taxes and remitting the remaining shares of the Company’s Series A common stock to an individual brokerage account. Authorized shares of the Company’s Series A common stock are used to settle RSUs.
Performance-based RSUs. The Company generally grants performance-based RSUs to the Company’s executive officers and certain employees once per year. The Company may also grant performance-based RSUs to certain new employees or to employees who assume positions of increasing responsibility at the time those events occur. The number of performance-based RSUs that ultimately vest is dependent on one or both of the following according to the terms of the specific award agreement: The achievement of a) internal profitability targets (performance condition) and b) market performance targets measured by the comparison of the Company’s stock performance versus a defined peer group (market condition).
The outstanding performance-based RSUs generally cliff-vest during the Company’s quarter-end September 30 black-out period three years from the date of grant. The ultimate number of shares of the Company’s Series A common stock issued will range from zero to stretch , with stretch defined individually under each award, net of shares used to cover minimum statutory personal income taxes withheld. The market condition is factored into the estimated fair value per unit and compensation expense for each award will be based on the probability of achieving internal profitability targets, as applicable, and recognized on a straight-line basis over the term of the respective grant, less estimated forfeitures. For performance-based RSUs granted without a performance condition, compensation expense is based on the fair value per unit recognized on a straight-line basis over the term of the grant, less estimated forfeitures. Upon the termination of participant’s employment by the Company without cause prior to the vesting date, the participant is eligible for a prorated number of performance-based RSUs based on a formula as outlined in each agreement.
A summary of changes in nonvested performance-based RSUs outstanding is as follows:
The fair value of shares vested for performance-based RSUs is as follows:
Fair value for the Company’s performance-based RSUs was estimated at the grant date using a Monte Carlo simulation approach less the present value of the expected dividends not received during the performance period. Monte Carlo simulation was utilized to randomly generate future stock returns for the Company and each company in the defined peer group for each
116
Year Ended December 31,
2012 2011 2010 (In $ millions)
Intrinsic value 110 20 13
Number of
Units
Weighted Average
Fair Value
(In thousands) (In $)
As of December 31, 2011 1,069 37.30 Granted 67 45.13 Vested (316 ) 39.14 Cancelled (171 ) 23.97 Forfeited (220 ) 44.04
As of December 31, 2012 429 42.22
Year Ended December 31,
2012 2011 2010 (In $ millions)
Total 12 14 8

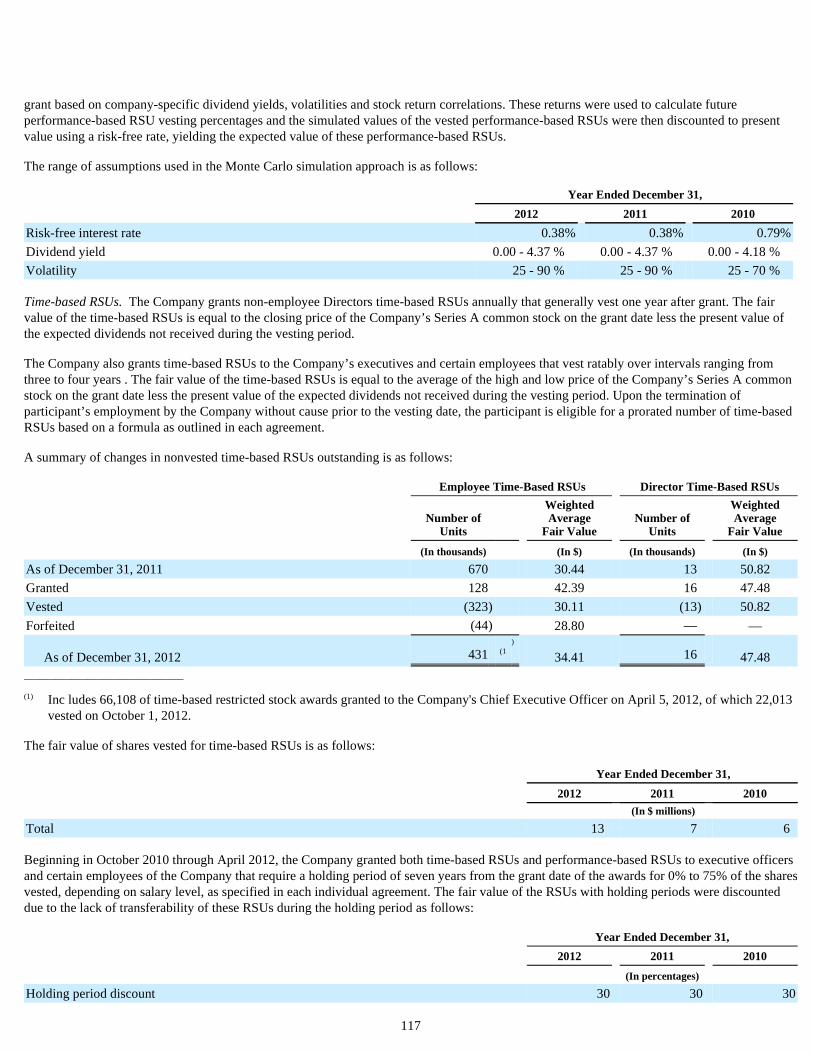
grant based on company-specific dividend yields, volatilities and stock return correlations. These returns were used to calculate future performance-based RSU vesting percentages and the simulated values of the vested performance-based RSUs were then discounted to present value using a risk-free rate, yielding the expected value of these performance-based RSUs.
The range of assumptions used in the Monte Carlo simulation approach is as follows:
Time-based RSUs. The Company grants non-employee Directors time-based RSUs annually that generally vest one year after grant. The fair value of the time-based RSUs is equal to the closing price of the Company’s Series A common stock on the grant date less the present value of the expected dividends not received during the vesting period.
The Company also grants time-based RSUs to the Company’s executives and certain employees that vest ratably over intervals ranging from three to four years . The fair value of the time-based RSUs is equal to the average of the high and low price of the Company’s Series A common stock on the grant date less the present value of the expected dividends not received during the vesting period. Upon the termination of participant’s employment by the Company without cause prior to the vesting date, the participant is eligible for a prorated number of time-based RSUs based on a formula as outlined in each agreement.
A summary of changes in nonvested time-based RSUs outstanding is as follows:
______________________________
The fair value of shares vested for time-based RSUs is as follows:
Beginning in October 2010 through April 2012, the Company granted both time-based RSUs and performance-based RSUs to executive officers and certain employees of the Company that require a holding period of seven years from the grant date of the awards for 0% to 75% of the shares vested, depending on salary level, as specified in each individual agreement. The fair value of the RSUs with holding periods were discounted due to the lack of transferability of these RSUs during the holding period as follows:
117
Year Ended December 31,
2012 2011 2010
Risk-free interest rate 0.38 % 0.38 % 0.79 %
Dividend yield 0.00 - 4.37 % 0.00 - 4.37 % 0.00 - 4.18 % Volatility 25 - 90 % 25 - 90 % 25 - 70 %
Employee Time-Based RSUs Director Time-Based RSUs
Number of
Units
Weighted Average
Fair Value Number of
Units
Weighted Average
Fair Value
(In thousands) (In $) (In thousands) (In $)
As of December 31, 2011 670 30.44 13 50.82
Granted 128 42.39 16 47.48
Vested (323 ) 30.11 (13 ) 50.82
Forfeited (44 ) 28.80 — —
As of December 31, 2012 431 (1 )
34.41 16 47.48
(1) Inc ludes 66,108 of time-based restricted stock awards granted to the Company's Chief Executive Officer on April 5, 2012, of which 22,013 vested on October 1, 2012.
Year Ended December 31,
2012 2011 2010 (In $ millions)
Total 13 7 6
Year Ended December 31,
2012 2011 2010
(In percentages)
Holding period discount 30 30 30

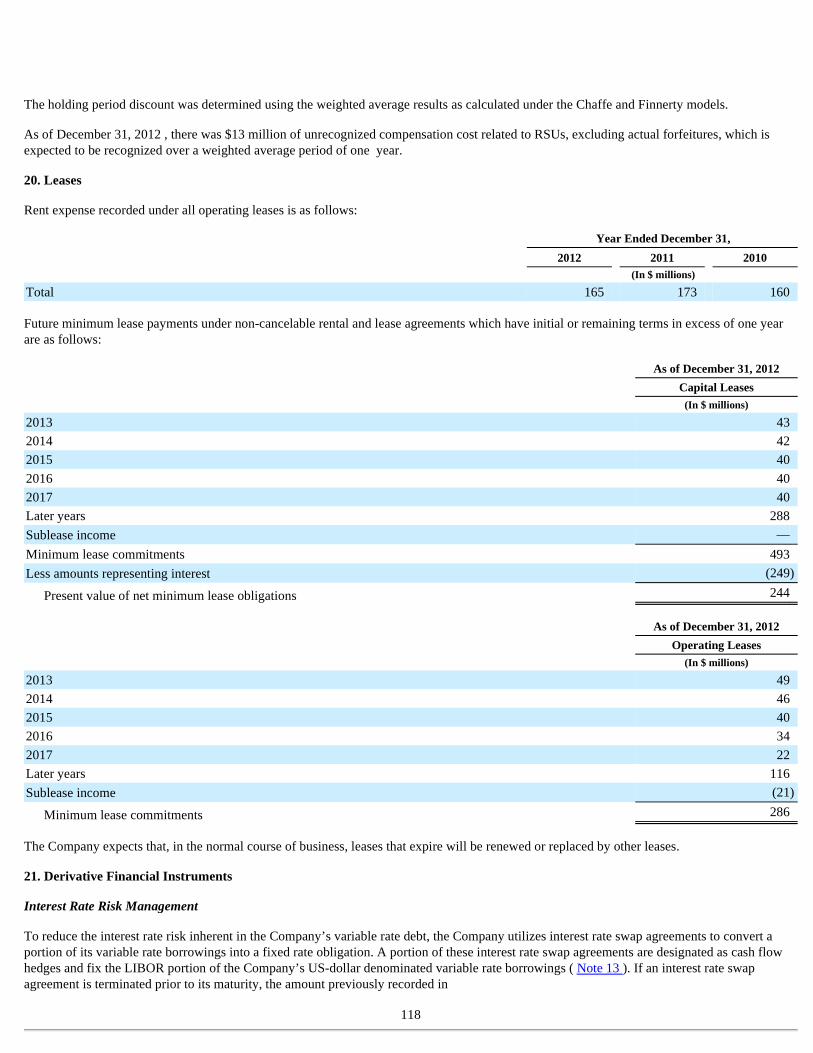
The holding period discount was determined using the weighted average results as calculated under the Chaffe and Finnerty models.
As of December 31, 2012 , there was $13 million of unrecognized compensation cost related to RSUs, excluding actual forfeitures, which is expected to be recognized over a weighted average period of one year.
20. Leases
Rent expense recorded under all operating leases is as follows:
Future minimum lease payments under non-cancelable rental and lease agreements which have initial or remaining terms in excess of one year are as follows:
The Company expects that, in the normal course of business, leases that expire will be renewed or replaced by other leases.
21. Derivative Financial Instruments
Interest Rate Risk Management
To reduce the interest rate risk inherent in the Company’s variable rate debt, the Company utilizes interest rate swap agreements to convert a portion of its variable rate borrowings into a fixed rate obligation. A portion of these interest rate swap agreements are designated as cash flow hedges and fix the LIBOR portion of the Company’s US-dollar denominated variable rate borrowings ( Note 13 ). If an interest rate swap agreement is terminated prior to its maturity, the amount previously recorded in
118
Year Ended December 31,
2012 2011 2010 (In $ millions)
Total 165 173 160
As of December 31, 2012
Capital Leases (In $ millions)
2013 43 2014 42 2015 40 2016 40 2017 40 Later years 288 Sublease income — Minimum lease commitments 493 Less amounts representing interest (249 )
Present value of net minimum lease obligations 244
As of December 31, 2012
Operating Leases (In $ millions)
2013 49 2014 46 2015 40 2016 34 2017 22 Later years 116 Sublease income (21 )
Minimum lease commitments 286
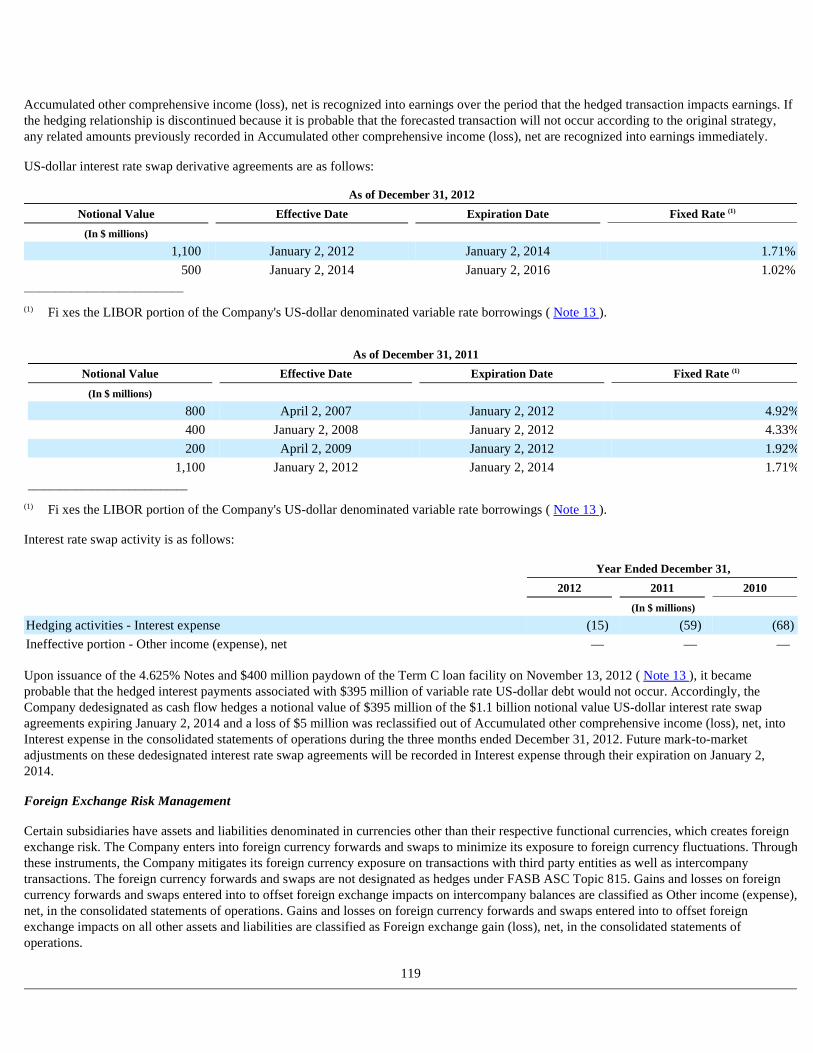
Accumulated other comprehensive income (loss), net is recognized into earnings over the period that the hedged transaction impacts earnings. If the hedging relationship is discontinued because it is probable that the forecasted transaction will not occur according to the original strategy, any related amounts previously recorded in Accumulated other comprehensive income (loss), net are recognized into earnings immediately.
US-dollar interest rate swap derivative agreements are as follows:
______________________________
______________________________
Interest rate swap activity is as follows:
Upon issuance of the 4.625% Notes and $400 million paydown of the Term C loan facility on November 13, 2012 ( Note 13 ), it became probable that the hedged interest payments associated with $395 million of variable rate US-dollar debt would not occur. Accordingly, the Company dedesignated as cash flow hedges a notional value of $395 million of the $1.1 billion notional value US-dollar interest rate swap agreements expiring January 2, 2014 and a loss of $5 million was reclassified out of Accumulated other comprehensive income (loss), net, into Interest expense in the consolidated statements of operations during the three months ended December 31, 2012. Future mark-to-market adjustments on these dedesignated interest rate swap agreements will be recorded in Interest expense through their expiration on January 2, 2014.
Foreign Exchange Risk Management
Certain subsidiaries have assets and liabilities denominated in currencies other than their respective functional currencies, which creates foreign exchange risk. The Company enters into foreign currency forwards and swaps to minimize its exposure to foreign currency fluctuations. Through these instruments, the Company mitigates its foreign currency exposure on transactions with third party entities as well as intercompany transactions. The foreign currency forwards and swaps are not designated as hedges under FASB ASC Topic 815. Gains and losses on foreign currency forwards and swaps entered into to offset foreign exchange impacts on intercompany balances are classified as Other income (expense), net, in the consolidated statements of operations. Gains and losses on foreign currency forwards and swaps entered into to offset foreign exchange impacts on all other assets and liabilities are classified as Foreign exchange gain (loss), net, in the consolidated statements of operations.
119
As of December 31, 2012
Notional Value Effective Date Expiration Date Fixed Rate (1)
(In $ millions)
1,100 January 2, 2012 January 2, 2014 1.71 %
500 January 2, 2014 January 2, 2016 1.02 %
(1) Fi xes the LIBOR portion of the Company's US-dollar denominated variable rate borrowings ( Note 13 ).
As of December 31, 2011
Notional Value Effective Date Expiration Date Fixed Rate (1)
(In $ millions)
800 April 2, 2007 January 2, 2012 4.92 %
400 January 2, 2008 January 2, 2012 4.33 %
200 April 2, 2009 January 2, 2012 1.92 %
1,100 January 2, 2012 January 2, 2014 1.71 %
(1) Fi xes the LIBOR portion of the Company's US-dollar denominated variable rate borrowings ( Note 13 ).
Year Ended December 31,
2012 2011 2010
(In $ millions)
Hedging activities - Interest expense (15 ) (59 ) (68 )
Ineffective portion - Other income (expense), net — — —
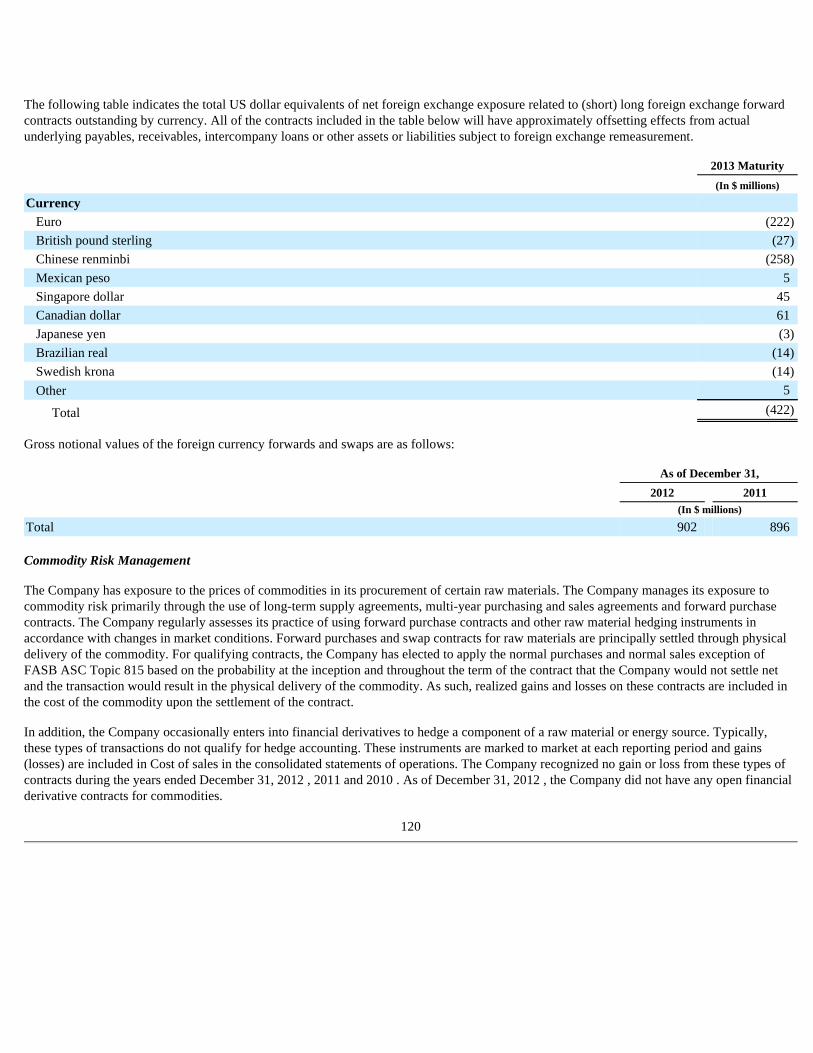
The following table indicates the total US dollar equivalents of net foreign exchange exposure related to (short) long foreign exchange forward contracts outstanding by currency. All of the contracts included in the table below will have approximately offsetting effects from actual underlying payables, receivables, intercompany loans or other assets or liabilities subject to foreign exchange remeasurement.
Gross notional values of the foreign currency forwards and swaps are as follows:
Commodity Risk Management
The Company has exposure to the prices of commodities in its procurement of certain raw materials. The Company manages its exposure to commodity risk primarily through the use of long-term supply agreements, multi-year purchasing and sales agreements and forward purchase contracts. The Company regularly assesses its practice of using forward purchase contracts and other raw material hedging instruments in accordance with changes in market conditions. Forward purchases and swap contracts for raw materials are principally settled through physical delivery of the commodity. For qualifying contracts, the Company has elected to apply the normal purchases and normal sales exception of FASB ASC Topic 815 based on the probability at the inception and throughout the term of the contract that the Company would not settle net and the transaction would result in the physical delivery of the commodity. As such, realized gains and losses on these contracts are included in the cost of the commodity upon the settlement of the contract.
In addition, the Company occasionally enters into financial derivatives to hedge a component of a raw material or energy source. Typically, these types of transactions do not qualify for hedge accounting. These instruments are marked to market at each reporting period and gains (losses) are included in Cost of sales in the consolidated statements of operations. The Company recognized no gain or loss from these types of contracts during the years ended December 31, 2012 , 2011 and 2010 . As of December 31, 2012 , the Company did not have any open financial derivative contracts for commodities.
120
2013 Maturity
(In $ millions)
Currency
Euro (222 )
British pound sterling (27 )
Chinese renminbi (258 )
Mexican peso 5 Singapore dollar 45 Canadian dollar 61 Japanese yen (3 )
Brazilian real (14 )
Swedish krona (14 )
Other 5
Total (422 )
As of December 31,
2012 2011 (In $ millions)
Total 902 896
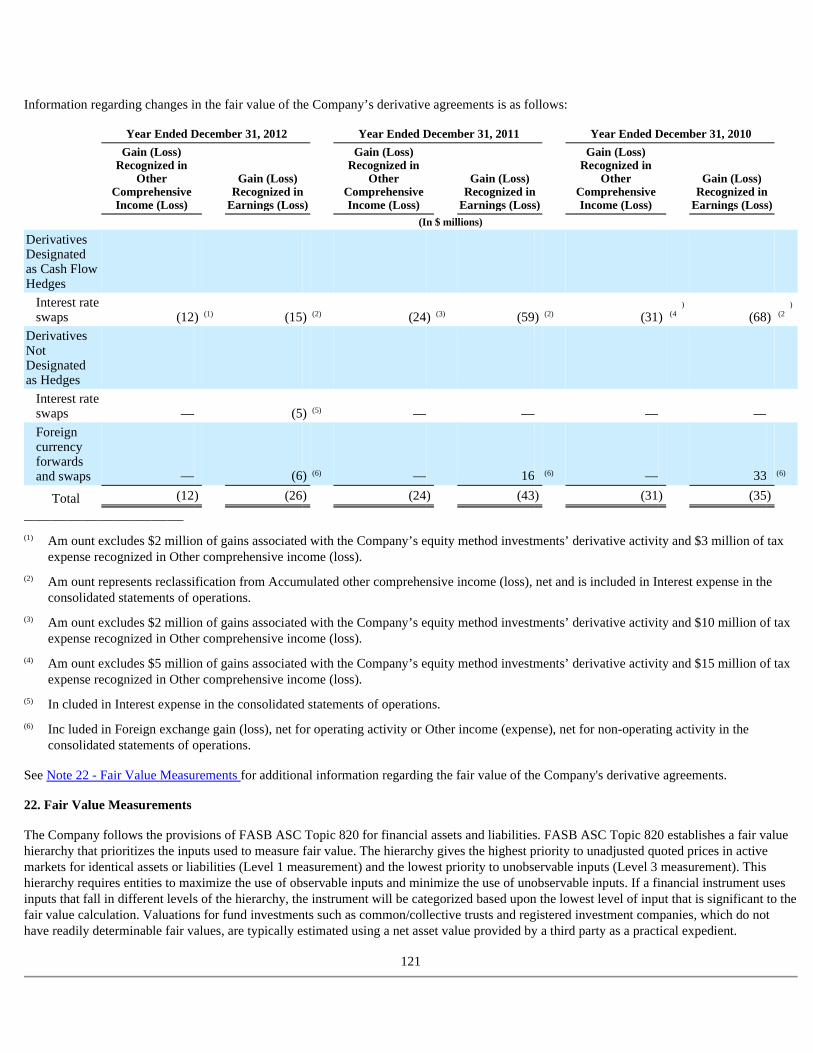
Information regarding changes in the fair value of the Company’s derivative agreements is as follows:
______________________________
See Note 22 - Fair Value Measurements for additional information regarding the fair value of the Company's derivative agreements.
22. Fair Value Measurements
The Company follows the provisions of FASB ASC Topic 820 for financial assets and liabilities. FASB ASC Topic 820 establishes a fair value hierarchy that prioritizes the inputs used to measure fair value. The hierarchy gives the highest priority to unadjusted quoted prices in active markets for identical assets or liabilities (Level 1 measurement) and the lowest priority to unobservable inputs (Level 3 measurement). This hierarchy requires entities to maximize the use of observable inputs and minimize the use of unobservable inputs. If a financial instrument uses inputs that fall in different levels of the hierarchy, the instrument will be categorized based upon the lowest level of input that is significant to the fair value calculation. Valuations for fund investments such as common/collective trusts and registered investment companies, which do not have readily determinable fair values, are typically estimated using a net asset value provided by a third party as a practical expedient.
121
Year Ended December 31, 2012 Year Ended December 31, 2011 Year Ended December 31, 2010
Gain (Loss) Recognized in
Other Comprehensive Income (Loss)
Gain (Loss) Recognized in
Earnings (Loss)
Gain (Loss) Recognized in
Other Comprehensive Income (Loss)
Gain (Loss) Recognized in
Earnings (Loss)
Gain (Loss) Recognized in
Other Comprehensive Income (Loss)
Gain (Loss) Recognized in
Earnings (Loss) (In $ millions)
Derivatives Designated as Cash Flow Hedges
Interest rate swaps (12 ) (1) (15 ) (2) (24 ) (3) (59 ) (2) (31 ) (4
)
(68 ) (2 )
Derivatives Not Designated as Hedges
Interest rate swaps — (5 ) (5) — — — —
Foreign currency forwards and swaps — (6 ) (6) — 16 (6) — 33 (6)
Total (12 ) (26 ) (24 ) (43 ) (31 ) (35 )
(1) Am ount excludes $2 million of gains associated with the Company’s equity method investments’ derivative activity and $3 million of tax expense recognized in Other comprehensive income (loss).
(2) Am ount represents reclassification from Accumulated other comprehensive income (loss), net and is included in Interest expense in the consolidated statements of operations.
(3) Am ount excludes $2 million of gains associated with the Company’s equity method investments’ derivative activity and $10 million of tax expense recognized in Other comprehensive income (loss).
(4) Am ount excludes $5 million of gains associated with the Company’s equity method investments’ derivative activity and $15 million of tax expense recognized in Other comprehensive income (loss).
(5) In cluded in Interest expense in the consolidated statements of operations.
(6) Inc luded in Foreign exchange gain (loss), net for operating activity or Other income (expense), net for non-operating activity in the consolidated statements of operations.
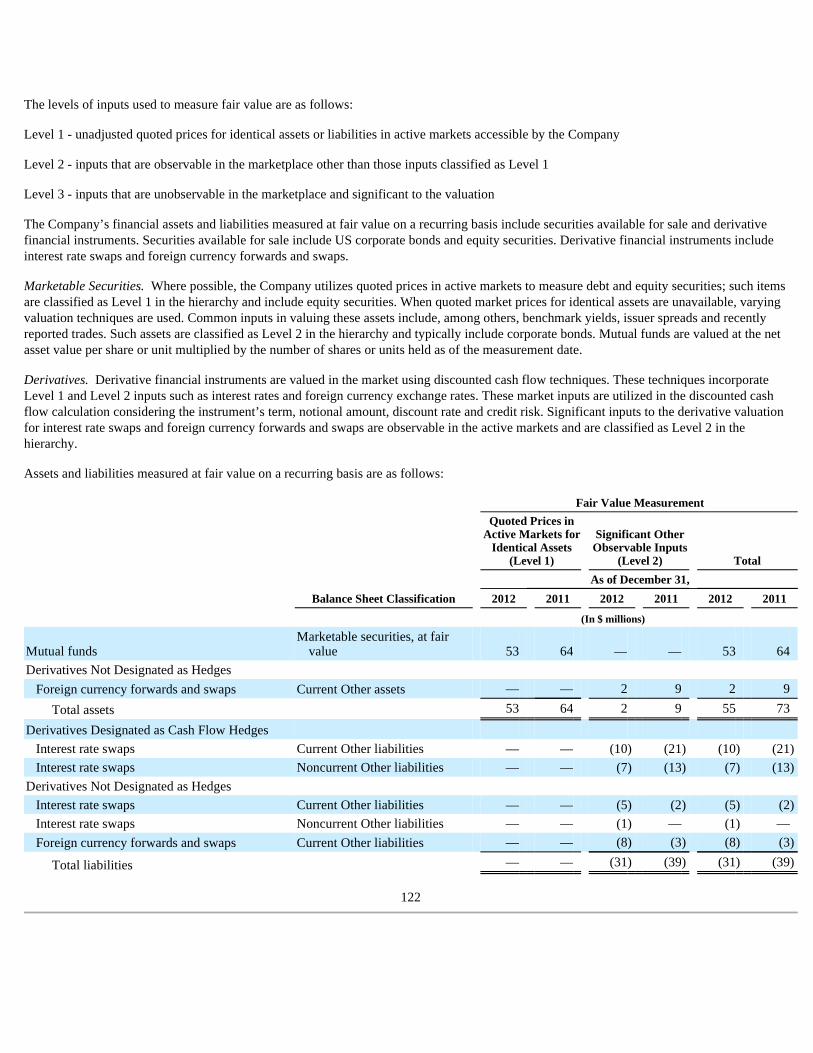
The levels of inputs used to measure fair value are as follows:
Level 1 - unadjusted quoted prices for identical assets or liabilities in active markets accessible by the Company
Level 2 - inputs that are observable in the marketplace other than those inputs classified as Level 1
Level 3 - inputs that are unobservable in the marketplace and significant to the valuation
The Company’s financial assets and liabilities measured at fair value on a recurring basis include securities available for sale and derivative financial instruments. Securities available for sale include US corporate bonds and equity securities. Derivative financial instruments include interest rate swaps and foreign currency forwards and swaps.
Marketable Securities. Where possible, the Company utilizes quoted prices in active markets to measure debt and equity securities; such items are classified as Level 1 in the hierarchy and include equity securities. When quoted market prices for identical assets are unavailable, varying valuation techniques are used. Common inputs in valuing these assets include, among others, benchmark yields, issuer spreads and recently reported trades. Such assets are classified as Level 2 in the hierarchy and typically include corporate bonds. Mutual funds are valued at the net asset value per share or unit multiplied by the number of shares or units held as of the measurement date.
Derivatives. Derivative financial instruments are valued in the market using discounted cash flow techniques. These techniques incorporate Level 1 and Level 2 inputs such as interest rates and foreign currency exchange rates. These market inputs are utilized in the discounted cash flow calculation considering the instrument’s term, notional amount, discount rate and credit risk. Significant inputs to the derivative valuation for interest rate swaps and foreign currency forwards and swaps are observable in the active markets and are classified as Level 2 in the hierarchy.
Assets and liabilities measured at fair value on a recurring basis are as follows:
122
Fair Value Measurement
Quoted Prices in Active Markets for
Identical Assets (Level 1)
Significant Other Observable Inputs
(Level 2) Total
As of December 31,
Balance Sheet Classification 2012 2011 2012 2011 2012 2011
(In $ millions)
Mutual funds Marketable securities, at fair
value 53 64 — — 53 64 Derivatives Not Designated as Hedges
Foreign currency forwards and swaps Current Other assets — — 2 9 2 9
Total assets 53 64 2 9 55 73
Derivatives Designated as Cash Flow Hedges
Interest rate swaps Current Other liabilities — — (10 ) (21 ) (10 ) (21 )
Interest rate swaps Noncurrent Other liabilities — — (7 ) (13 ) (7 ) (13 )
Derivatives Not Designated as Hedges
Interest rate swaps Current Other liabilities — — (5 ) (2 ) (5 ) (2 )
Interest rate swaps Noncurrent Other liabilities — — (1 ) — (1 ) — Foreign currency forwards and swaps Current Other liabilities — — (8 ) (3 ) (8 ) (3 )
Total liabilities — — (31 ) (39 ) (31 ) (39 )
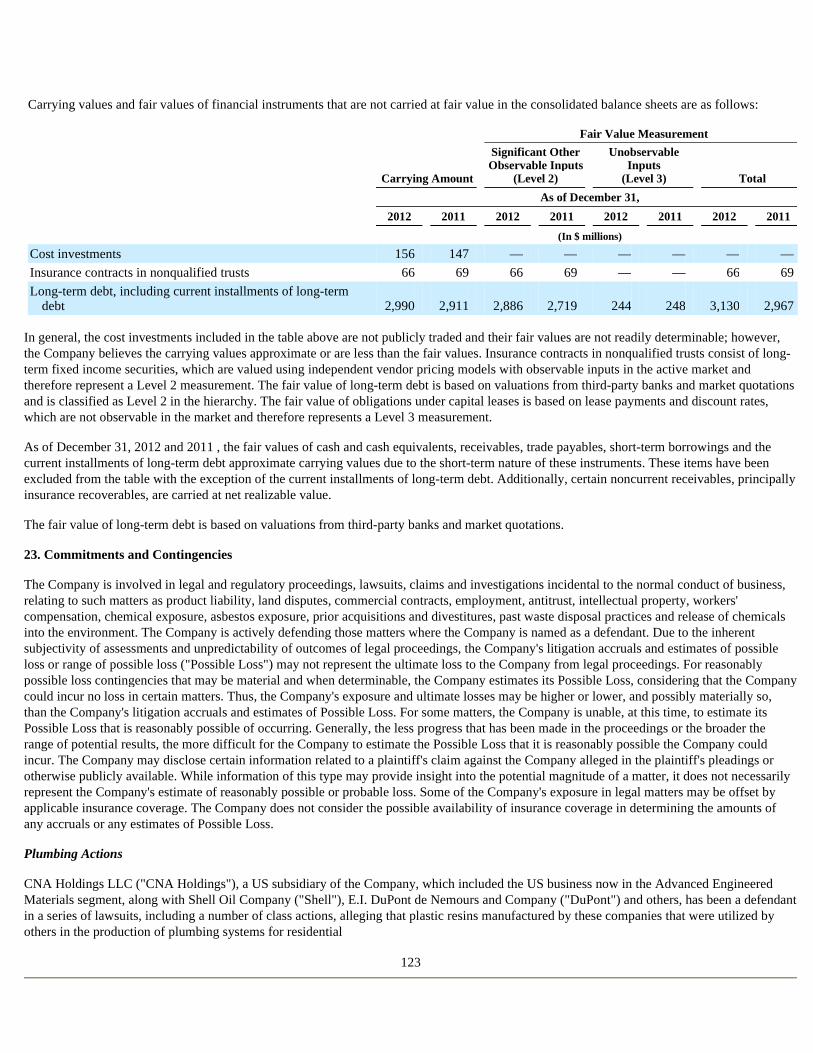
Carrying values and fair values of financial instruments that are not carried at fair value in the consolidated balance sheets are as follows:
In general, the cost investments included in the table above are not publicly traded and their fair values are not readily determinable; however, the Company believes the carrying values approximate or are less than the fair values. Insurance contracts in nonqualified trusts consist of long-term fixed income securities, which are valued using independent vendor pricing models with observable inputs in the active market and therefore represent a Level 2 measurement. The fair value of long-term debt is based on valuations from third-party banks and market quotations and is classified as Level 2 in the hierarchy. The fair value of obligations under capital leases is based on lease payments and discount rates, which are not observable in the market and therefore represents a Level 3 measurement.
As of December 31, 2012 and 2011 , the fair values of cash and cash equivalents, receivables, trade payables, short-term borrowings and the current installments of long-term debt approximate carrying values due to the short-term nature of these instruments. These items have been excluded from the table with the exception of the current installments of long-term debt. Additionally, certain noncurrent receivables, principally insurance recoverables, are carried at net realizable value.
The fair value of long-term debt is based on valuations from third-party banks and market quotations.
23. Commitments and Contingencies
The Company is involved in legal and regulatory proceedings, lawsuits, claims and investigations incidental to the normal conduct of business, relating to such matters as product liability, land disputes, commercial contracts, employment, antitrust, intellectual property, workers' compensation, chemical exposure, asbestos exposure, prior acquisitions and divestitures, past waste disposal practices and release of chemicals into the environment. The Company is actively defending those matters where the Company is named as a defendant. Due to the inherent subjectivity of assessments and unpredictability of outcomes of legal proceedings, the Company's litigation accruals and estimates of possible loss or range of possible loss ("Possible Loss") may not represent the ultimate loss to the Company from legal proceedings. For reasonably possible loss contingencies that may be material and when determinable, the Company estimates its Possible Loss, considering that the Company could incur no loss in certain matters. Thus, the Company's exposure and ultimate losses may be higher or lower, and possibly materially so, than the Company's litigation accruals and estimates of Possible Loss. For some matters, the Company is unable, at this time, to estimate its Possible Loss that is reasonably possible of occurring. Generally, the less progress that has been made in the proceedings or the broader the range of potential results, the more difficult for the Company to estimate the Possible Loss that it is reasonably possible the Company could incur. The Company may disclose certain information related to a plaintiff's claim against the Company alleged in the plaintiff's pleadings or otherwise publicly available. While information of this type may provide insight into the potential magnitude of a matter, it does not necessarily represent the Company's estimate of reasonably possible or probable loss. Some of the Company's exposure in legal matters may be offset by applicable insurance coverage. The Company does not consider the possible availability of insurance coverage in determining the amounts of any accruals or any estimates of Possible Loss.
Plumbing Actions
CNA Holdings LLC ("CNA Holdings"), a US subsidiary of the Company, which included the US business now in the Advanced Engineered Materials segment, along with Shell Oil Company ("Shell"), E.I. DuPont de Nemours and Company ("DuPont") and others, has been a defendant in a series of lawsuits, including a number of class actions, alleging that plastic resins manufactured by these companies that were utilized by others in the production of plumbing systems for residential
123
Fair Value Measurement
Carrying Amount
Significant Other Observable Inputs
(Level 2)
Unobservable Inputs
(Level 3) Total
As of December 31,
2012 2011 2012 2011 2012 2011 2012 2011
(In $ millions)
Cost investments 156 147 — — — — — — Insurance contracts in nonqualified trusts 66 69 66 69 — — 66 69 Long-term debt, including current installments of long-term
debt 2,990 2,911 2,886 2,719 244 248 3,130 2,967
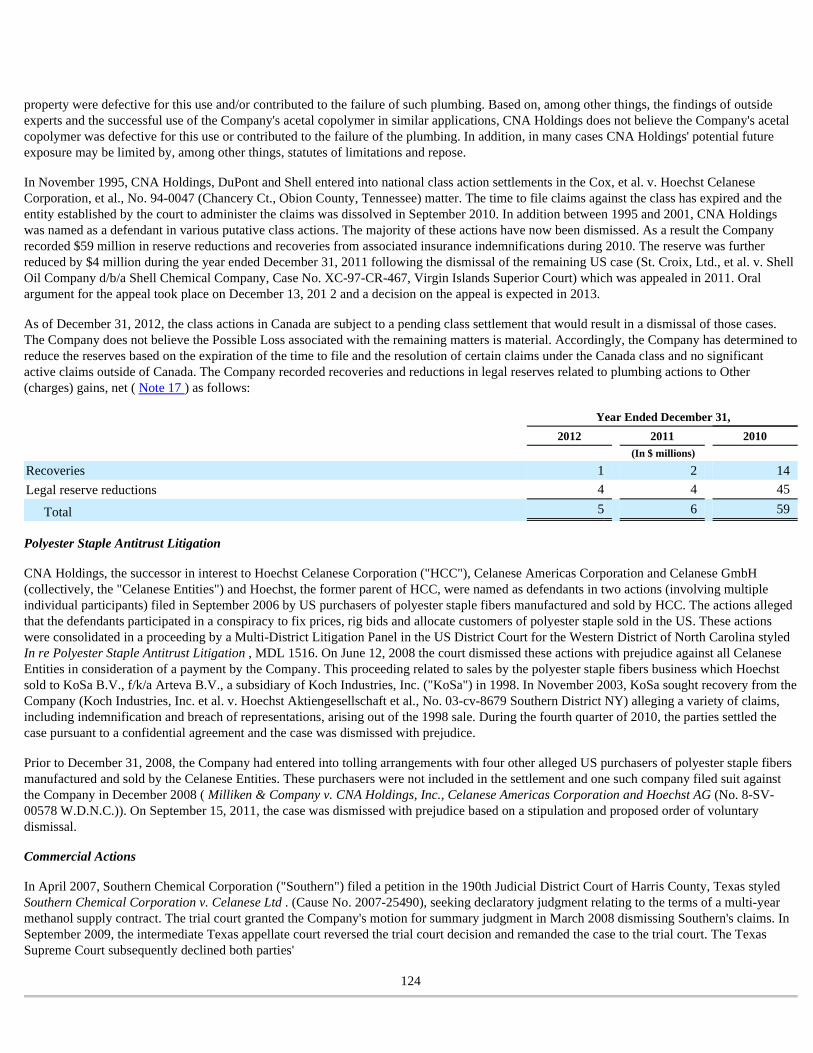
property were defective for this use and/or contributed to the failure of such plumbing. Based on, among other things, the findings of outside experts and the successful use of the Company's acetal copolymer in similar applications, CNA Holdings does not believe the Company's acetal copolymer was defective for this use or contributed to the failure of the plumbing. In addition, in many cases CNA Holdings' potential future exposure may be limited by, among other things, statutes of limitations and repose.
In November 1995, CNA Holdings, DuPont and Shell entered into national class action settlements in the Cox, et al. v. Hoechst Celanese Corporation, et al., No. 94-0047 (Chancery Ct., Obion County, Tennessee) matter. The time to file claims against the class has expired and the entity established by the court to administer the claims was dissolved in September 2010. In addition between 1995 and 2001, CNA Holdings was named as a defendant in various putative class actions. The majority of these actions have now been dismissed. As a result the Company recorded $59 million in reserve reductions and recoveries from associated insurance indemnifications during 2010. The reserve was further reduced by $4 million during the year ended December 31, 2011 following the dismissal of the remaining US case (St. Croix, Ltd., et al. v. Shell Oil Company d/b/a Shell Chemical Company, Case No. XC-97-CR-467, Virgin Islands Superior Court) which was appealed in 2011. Oral argument for the appeal took place on December 13, 201 2 and a decision on the appeal is expected in 2013.
As of December 31, 2012, the class actions in Canada are subject to a pending class settlement that would result in a dismissal of those cases. The Company does not believe the Possible Loss associated with the remaining matters is material. Accordingly, the Company has determined to reduce the reserves based on the expiration of the time to file and the resolution of certain claims under the Canada class and no significant active claims outside of Canada. The Company recorded recoveries and reductions in legal reserves related to plumbing actions to Other (charges) gains, net ( Note 17 ) as follows:
Polyester Staple Antitrust Litigation
CNA Holdings, the successor in interest to Hoechst Celanese Corporation ("HCC"), Celanese Americas Corporation and Celanese GmbH (collectively, the "Celanese Entities") and Hoechst, the former parent of HCC, were named as defendants in two actions (involving multiple individual participants) filed in September 2006 by US purchasers of polyester staple fibers manufactured and sold by HCC. The actions alleged that the defendants participated in a conspiracy to fix prices, rig bids and allocate customers of polyester staple sold in the US. These actions were consolidated in a proceeding by a Multi-District Litigation Panel in the US District Court for the Western District of North Carolina styled In re Polyester Staple Antitrust Litigation , MDL 1516. On June 12, 2008 the court dismissed these actions with prejudice against all Celanese Entities in consideration of a payment by the Company. This proceeding related to sales by the polyester staple fibers business which Hoechst sold to KoSa B.V., f/k/a Arteva B.V., a subsidiary of Koch Industries, Inc. ("KoSa") in 1998. In November 2003, KoSa sought recovery from the Company (Koch Industries, Inc. et al. v. Hoechst Aktiengesellschaft et al., No. 03-cv-8679 Southern District NY) alleging a variety of claims, including indemnification and breach of representations, arising out of the 1998 sale. During the fourth quarter of 2010, the parties settled the case pursuant to a confidential agreement and the case was dismissed with prejudice.
Prior to December 31, 2008, the Company had entered into tolling arrangements with four other alleged US purchasers of polyester staple fibers manufactured and sold by the Celanese Entities. These purchasers were not included in the settlement and one such company filed suit against the Company in December 2008 ( Milliken & Company v. CNA Holdings, Inc., Celanese Americas Corporation and Hoechst AG (No. 8-SV-00578 W.D.N.C.)). On September 15, 2011, the case was dismissed with prejudice based on a stipulation and proposed order of voluntary dismissal.
Commercial Actions
In April 2007, Southern Chemical Corporation ("Southern") filed a petition in the 190th Judicial District Court of Harris County, Texas styled Southern Chemical Corporation v. Celanese Ltd . (Cause No. 2007-25490), seeking declaratory judgment relating to the terms of a multi-year methanol supply contract. The trial court granted the Company's motion for summary judgment in March 2008 dismissing Southern's claims. In September 2009, the intermediate Texas appellate court reversed the trial court decision and remanded the case to the trial court. The Texas Supreme Court subsequently declined both parties'
124
Year Ended December 31,
2012 2011 2010
(In $ millions)
Recoveries 1 2 14 Legal reserve reductions 4 4 45
Total 5 6 59
requests that it hear the case. On August 15, 2010, Southern filed a second amended petition adding a claim for breach of contract and seeking equitable damages in an unspecified amount from the Company. Southern amended its complaint adding new claims for fraud and tortious interference with a third-party contract. More specifically, Southern claimed the Company "materially misrepresented its intended use of the methanol to be supplied by Southern" and "violated the material terms of the contract and failed to correct these breaches after Southern provided notice." These alleged breaches include "selling, transferring, swapping or tolling methanol to or with entities other than the Company and to entities or operations outside the U.S. or Mexico." In the May 2012 complaint, Southern sought compensatory damages of $1.3 billion , as well as pre- and post-judgment interest, attorneys' fees and punitive damages equaling two times its actual damages. Southern also sought rescission or termination of the contract. Trial commenced on July 16, 2012, and on August 10, 2012, the jury returned a verdict of no liability and no damages with respect to all of Southern's claims against the Company. The trial court adopted the jury's verdict and entered final judgment on October 10, 2012. In November 2012, Southern filed a motion for new trial which the trial court denied.
In June 2012, Linde Gas Singapore Pte Ltd ("Linde Gas"), a raw materials supplier based in Singapore, initiated arbitration proceedings in New York against the Company's subsidiary, Celanese Singapore Pte. Ltd. ("Singapore Ltd."), alleging that Singapore Ltd. had breached a certain requirements contract for carbon monoxide by temporarily idling Singapore Ltd.'s acetic acid facility in Jurong Island, Singapore. The Company filed its answer on August 8, 2012. The Company believes that Linde Gas' claims lack merit and that the Company has complied with the contract terms and plans to vigorously defend the matter. Based on the Company's evaluation of currently available information, the Company cannot estimate the Possible Loss, if any, for this matter as discovery is ongoing and Linde Gas' arbitration demand to date does not specify the categories of damages it is seeking for the period that the plant was idled in 2012 and contends that it will incur additional damages if the plant is idled again in the future. The arbitral panel agreed to bifurcate the case into a liability and damages phase and set hearing dates for all liability issues in June 2013 and for all damages issues (if necessary) in December 2013.
Award Proceedings in relation to Domination Agreement and Squeeze-Out
The Company's subsidiary, BCP Holdings GmbH ("BCP Holdings"), a German limited liability company, is a defendant in two special award proceedings initiated by minority stockholders of Celanese GmbH seeking the court's review of the amounts (i) of the fair cash compensation and of the guaranteed dividend offered in the purchaser offer under the 2004 Domination Agreement (the "Domination Agreement") and (ii) the fair cash compensation paid for the 2006 squeeze-out ("Squeeze-Out") of all remaining stockholders of Celanese GmbH.
Pursuant to a settlement agreement between BCP Holdings and certain former Celanese GmbH stockholders, if the court sets a higher value for the fair cash compensation or the guaranteed payment under the Domination Agreement or the Squeeze-Out compensation, former Celanese GmbH stockholders who ceased to be stockholders of Celanese GmbH due to the Squeeze-Out will be entitled to claim for their shares the higher of the compensation amounts determined by the court in these different proceedings related to the Domination Agreement and the Squeeze-Out. If the fair cash compensation determined by the court is higher than the Squeeze-Out compensation of €66.99 , then 1,069,465 shares will be entitled to an adjustment. If the court determines the value of the fair cash compensation under the Domination Agreement to be lower than the original Squeeze-Out compensation, but determines a higher value for the Squeeze-Out compensation, 924,078 shares would be entitled to an adjustment. Payments already received by these stockholders as compensation for their shares will be offset so that persons who ceased to be stockholders of Celanese GmbH due to the Squeeze-Out are not entitled to more than the higher of the amount set in the two court proceedings.
In September 2011, an expert appointed by the court hearing the Domination Agreement stockholders' claims to assist it in determining the value of Celanese GmbH rendered an opinion. The expert opined that the fair cash compensation for these stockholders ( 145,387 shares) should be increased from €41.92 to €51.86 . This non-binding opinion recommends a total increase in share value to €2 million for those claims under the Domination Agreement. The opinion has no effect on the Squeeze-Out proceeding because the share price recommended is lower than the price those stockholders already received in the Squeeze-Out. However, the opinion also advocates that the guaranteed dividend should be increased from €2.89 to €3.79 , aggregating an increase in total guaranteed dividends of €1 million to the Squeeze-Out claimants. The Company evaluated the non-binding opinion of the expert and submitted a written response during the three months ended December 31, 2011. No hearing date has been set. No expert has yet been appointed in the Squeeze-Out proceedings.
For those claims brought under the Domination Agreement, based on the Company's evaluation of currently available information, including the non-binding expert opinion, the fact that the Court has asked the expert to update his opinion, and the fact that the court may adopt this new opinion or apply its own (there are legal questions about the applicable valuation method), which could increase or decrease the Company's potential exposure, the Company does not believe that the Possible Loss is material.
125
For those remaining claims brought by the Squeeze-Out claimants, based on the Company's evaluation of currently available information, including that damages sought are unspecified, unsupported or uncertain, the matter presents meaningful legal uncertainties (including novel issues of law and the applicable valuation method), there are significant facts in dispute and the court has not yet appointed an expert, the Company cannot estimate the Possible Loss, if any, at this time.
Guarantees
The Company has agreed to guarantee or indemnify third parties for environmental and other liabilities pursuant to a variety of agreements, including asset and business divestiture agreements, leases, settlement agreements and various agreements with affiliated companies. Although many of these obligations contain monetary and/or time limitations, others do not provide such limitations.
As indemnification obligations often depend on the occurrence of unpredictable future events, the future costs associated with them cannot be determined at this time.
The Company has accrued for all probable and reasonably estimable losses associated with all known matters or claims that have been brought to its attention. These known obligations include the following:
In connection with the Hoechst demerger, the Company agreed to indemnify Hoechst, and its legal successors, for various liabilities under the demerger agreement, including for environmental liabilities associated with contamination arising either from environmental damage in general ("Category A") or under 19 divestiture agreements entered into by Hoechst prior to the demerger ("Category B") ( Note 15 ).
The Company's obligation to indemnify Hoechst, and its legal successors, is capped under Category B at €250 million . If and to the extent the environmental damage should exceed €750 million in aggregate, the Company's obligation to indemnify Hoechst and its legal successors applies, but is then limited to 33.33% of the remediation cost without further limitations. Cumulative payments under the divestiture agreements as of December 31, 2012 are $61 million . Most of the divestiture agreements have become time barred and/or any notified environmental damage claims have been partially settled.
The Company has also undertaken in the demerger agreement to indemnify Hoechst and its legal successors for (i) 33.33% of any and all Category A liabilities that result from Hoechst being held as the responsible party pursuant to public law or current or future environmental law or by third parties pursuant to private or public law related to contamination and (ii) liabilities that Hoechst is required to discharge, including tax liabilities, which are associated with businesses that were included in the demerger but were not demerged due to legal restrictions on the transfers of such items. These indemnities do not provide for any monetary or time limitations. The Company has not been requested by Hoechst to make any payments in connection with this indemnification. Accordingly, the Company has not made any payments to Hoechst and its legal successors.
Based on the Company's evaluation of currently available information, including the lack of requests for indemnification, the Company cannot estimate the Possible Loss for the remaining demerger obligations, if any, in excess of amounts accrued.
The Company and its predecessor companies agreed to indemnify third-party purchasers of former businesses and assets for various pre-closing conditions, as well as for breaches of representations, warranties and covenants. Such liabilities also include environmental liability, product liability, antitrust and other liabilities. These indemnifications and guarantees represent standard contractual terms associated with typical divestiture agreements and, other than environmental liabilities, the Company does not believe that they expose the Company to any significant risk ( Note 15 ).
The Company has divested numerous businesses, investments and facilities through agreements containing indemnifications or guarantees to the purchasers. Many of the obligations contain monetary and/or time limitations, ranging from one year to thirty years . The aggregate amount of indemnifications and guarantees provided for under these agreements is $195 million as of December 31, 2012 . Other agreements do not provide for any monetary or time limitations.
Based on the Company's evaluation of currently available information, including the number of requests for indemnification or other payment received by the Company, the Company cannot estimate the Possible Loss for the remaining divestiture obligations, if any, in excess of amounts accrued.
126
• Demerger Obligations
• Divestiture Obligations
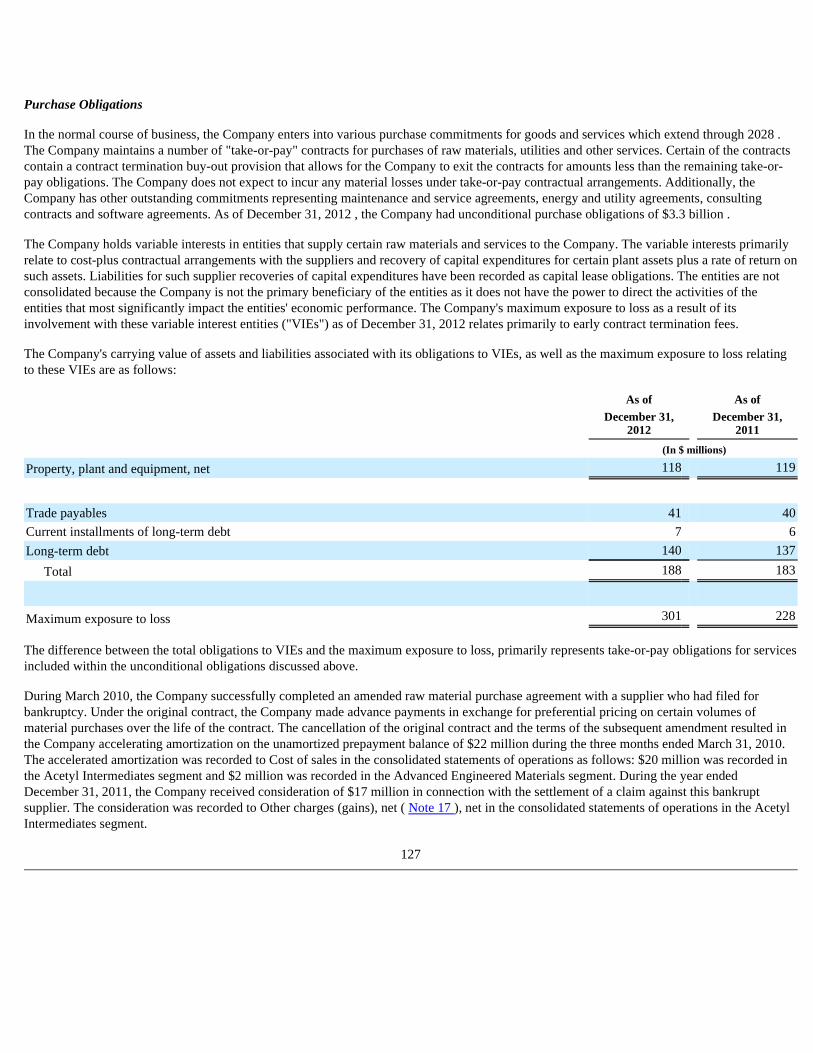
Purchase Obligations
In the normal course of business, the Company enters into various purchase commitments for goods and services which extend through 2028 . The Company maintains a number of "take-or-pay" contracts for purchases of raw materials, utilities and other services. Certain of the contracts contain a contract termination buy-out provision that allows for the Company to exit the contracts for amounts less than the remaining take-or-pay obligations. The Company does not expect to incur any material losses under take-or-pay contractual arrangements. Additionally, the Company has other outstanding commitments representing maintenance and service agreements, energy and utility agreements, consulting contracts and software agreements. As of December 31, 2012 , the Company had unconditional purchase obligations of $3.3 billion .
The Company holds variable interests in entities that supply certain raw materials and services to the Company. The variable interests primarily relate to cost-plus contractual arrangements with the suppliers and recovery of capital expenditures for certain plant assets plus a rate of return on such assets. Liabilities for such supplier recoveries of capital expenditures have been recorded as capital lease obligations. The entities are not consolidated because the Company is not the primary beneficiary of the entities as it does not have the power to direct the activities of the entities that most significantly impact the entities' economic performance. The Company's maximum exposure to loss as a result of its involvement with these variable interest entities ("VIEs") as of December 31, 2012 relates primarily to early contract termination fees.
The Company's carrying value of assets and liabilities associated with its obligations to VIEs, as well as the maximum exposure to loss relating to these VIEs are as follows:
The difference between the total obligations to VIEs and the maximum exposure to loss, primarily represents take-or-pay obligations for services included within the unconditional obligations discussed above.
During March 2010, the Company successfully completed an amended raw material purchase agreement with a supplier who had filed for bankruptcy. Under the original contract, the Company made advance payments in exchange for preferential pricing on certain volumes of material purchases over the life of the contract. The cancellation of the original contract and the terms of the subsequent amendment resulted in the Company accelerating amortization on the unamortized prepayment balance of $22 million during the three months ended March 31, 2010. The accelerated amortization was recorded to Cost of sales in the consolidated statements of operations as follows: $20 million was recorded in the Acetyl Intermediates segment and $2 million was recorded in the Advanced Engineered Materials segment. During the year ended December 31, 2011, the Company received consideration of $17 million in connection with the settlement of a claim against this bankrupt supplier. The consideration was recorded to Other charges (gains), net ( Note 17 ), net in the consolidated statements of operations in the Acetyl Intermediates segment.
127
As of As of
December 31,
2012 December 31,
2011
(In $ millions)
Property, plant and equipment, net 118 119
Trade payables 41 40
Current installments of long-term debt 7 6
Long-term debt 140 137
Total 188 183
Maximum exposure to loss 301 228
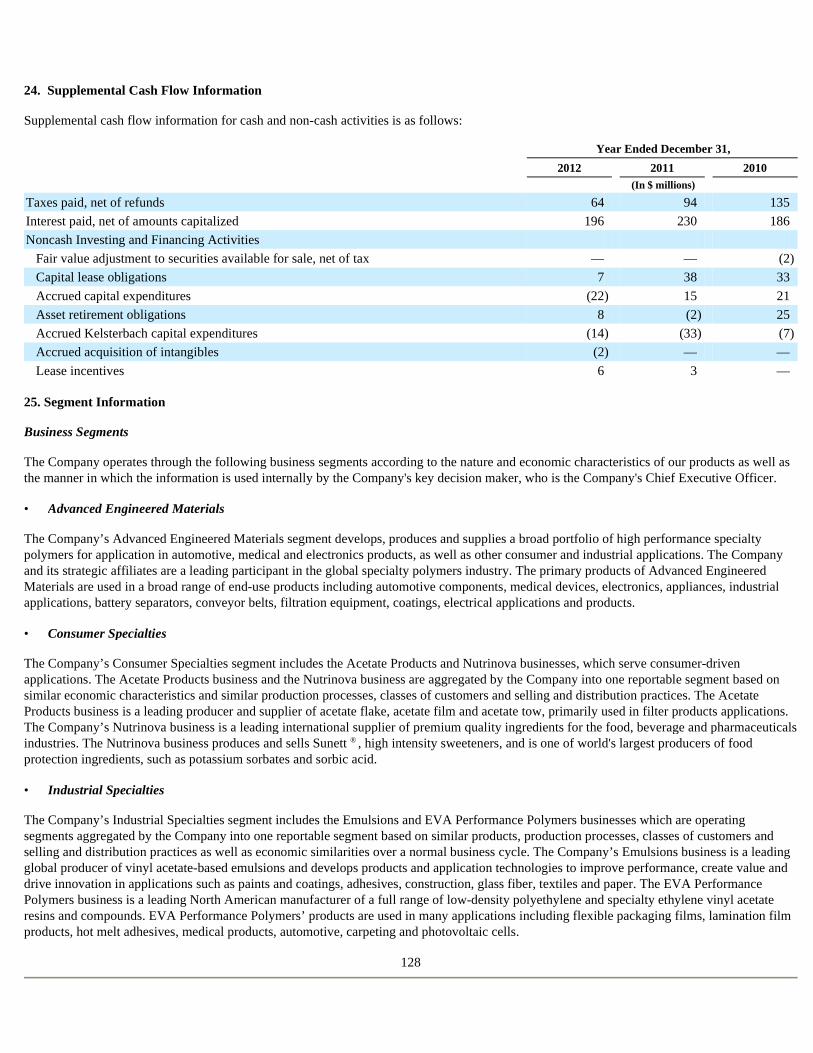
24. Supplemental Cash Flow Information
Supplemental cash flow information for cash and non-cash activities is as follows:
25. Segment Information
Business Segments
The Company operates through the following business segments according to the nature and economic characteristics of our products as well as the manner in which the information is used internally by the Company's key decision maker, who is the Company's Chief Executive Officer.
The Company’s Advanced Engineered Materials segment develops, produces and supplies a broad portfolio of high performance specialty polymers for application in automotive, medical and electronics products, as well as other consumer and industrial applications. The Company and its strategic affiliates are a leading participant in the global specialty polymers industry. The primary products of Advanced Engineered Materials are used in a broad range of end-use products including automotive components, medical devices, electronics, appliances, industrial applications, battery separators, conveyor belts, filtration equipment, coatings, electrical applications and products.
The Company’s Consumer Specialties segment includes the Acetate Products and Nutrinova businesses, which serve consumer-driven applications. The Acetate Products business and the Nutrinova business are aggregated by the Company into one reportable segment based on similar economic characteristics and similar production processes, classes of customers and selling and distribution practices. The Acetate Products business is a leading producer and supplier of acetate flake, acetate film and acetate tow, primarily used in filter products applications. The Company’s Nutrinova business is a leading international supplier of premium quality ingredients for the food, beverage and pharmaceuticals industries. The Nutrinova business produces and sells Sunett ® , high intensity sweeteners, and is one of world's largest producers of food protection ingredients, such as potassium sorbates and sorbic acid.
The Company’s Industrial Specialties segment includes the Emulsions and EVA Performance Polymers businesses which are operating segments aggregated by the Company into one reportable segment based on similar products, production processes, classes of customers and selling and distribution practices as well as economic similarities over a normal business cycle. The Company’s Emulsions business is a leading global producer of vinyl acetate-based emulsions and develops products and application technologies to improve performance, create value and drive innovation in applications such as paints and coatings, adhesives, construction, glass fiber, textiles and paper. The EVA Performance Polymers business is a leading North American manufacturer of a full range of low-density polyethylene and specialty ethylene vinyl acetate resins and compounds. EVA Performance Polymers’ products are used in many applications including flexible packaging films, lamination film products, hot melt adhesives, medical products, automotive, carpeting and photovoltaic cells.
128
Year Ended December 31,
2012 2011 2010 (In $ millions)
Taxes paid, net of refunds 64 94 135 Interest paid, net of amounts capitalized 196 230 186 Noncash Investing and Financing Activities
Fair value adjustment to securities available for sale, net of tax — — (2 )
Capital lease obligations 7 38 33 Accrued capital expenditures (22 ) 15 21 Asset retirement obligations 8 (2 ) 25 Accrued Kelsterbach capital expenditures (14 ) (33 ) (7 )
Accrued acquisition of intangibles (2 ) — — Lease incentives 6 3 —
• Advanced Engineered Materials
• Consumer Specialties
• Industrial Specialties
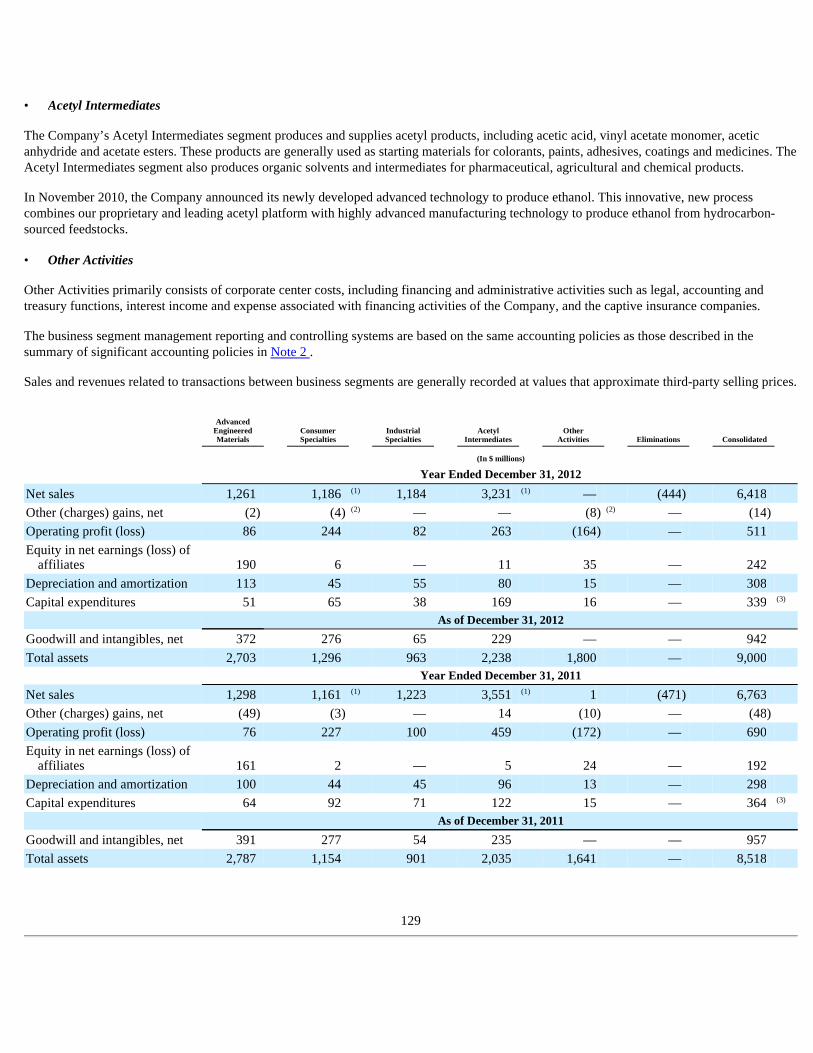
The Company’s Acetyl Intermediates segment produces and supplies acetyl products, including acetic acid, vinyl acetate monomer, acetic anhydride and acetate esters. These products are generally used as starting materials for colorants, paints, adhesives, coatings and medicines. The Acetyl Intermediates segment also produces organic solvents and intermediates for pharmaceutical, agricultural and chemical products.
In November 2010, the Company announced its newly developed advanced technology to produce ethanol. This innovative, new process combines our proprietary and leading acetyl platform with highly advanced manufacturing technology to produce ethanol from hydrocarbon-sourced feedstocks.
Other Activities primarily consists of corporate center costs, including financing and administrative activities such as legal, accounting and treasury functions, interest income and expense associated with financing activities of the Company, and the captive insurance companies.
The business segment management reporting and controlling systems are based on the same accounting policies as those described in the summary of significant accounting policies in Note 2 .
Sales and revenues related to transactions between business segments are generally recorded at values that approximate third-party selling prices.
129
• Acetyl Intermediates
• Other Activities
Advanced
Engineered Materials
Consumer Specialties
Industrial Specialties
Acetyl Intermediates
Other Activities Eliminations Consolidated
(In $ millions)
Year Ended December 31, 2012
Net sales 1,261 1,186 (1) 1,184 3,231 (1) — (444 ) 6,418
Other (charges) gains, net (2 ) (4 ) (2) — — (8 ) (2) — (14 )
Operating profit (loss) 86 244 82 263 (164 ) — 511
Equity in net earnings (loss) of affiliates 190 6 — 11 35 — 242
Depreciation and amortization 113 45 55 80 15 — 308
Capital expenditures 51 65 38 169 16 — 339 (3)
As of December 31, 2012
Goodwill and intangibles, net 372 276 65 229 — — 942
Total assets 2,703 1,296 963 2,238 1,800 — 9,000
Year Ended December 31, 2011
Net sales 1,298 1,161 (1) 1,223 3,551 (1) 1 (471 ) 6,763
Other (charges) gains, net (49 ) (3 ) — 14 (10 ) — (48 )
Operating profit (loss) 76 227 100 459 (172 ) — 690
Equity in net earnings (loss) of affiliates 161 2
— 5 24 — 192
Depreciation and amortization 100 44 45 96 13 — 298
Capital expenditures 64 92 71 122 15 — 364 (3)
As of December 31, 2011
Goodwill and intangibles, net 391 277 54 235 — — 957
Total assets 2,787 1,154 901 2,035 1,641 — 8,518
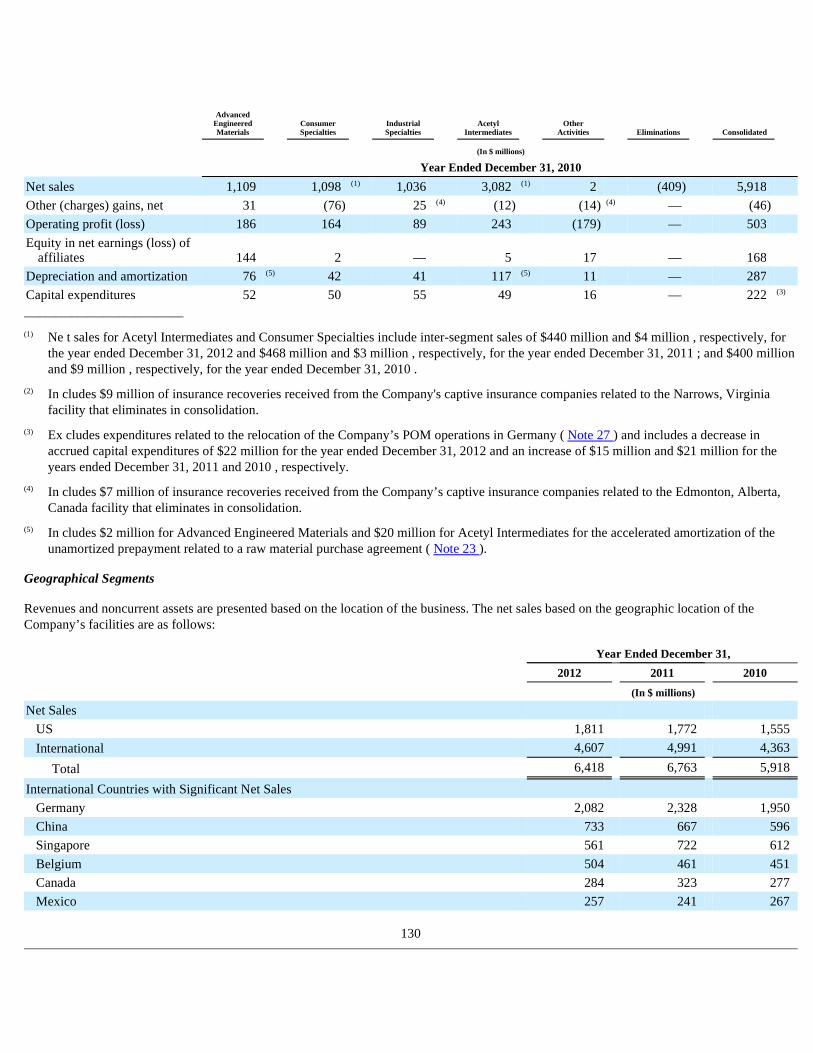
______________________________
Geographical Segments
Revenues and noncurrent assets are presented based on the location of the business. The net sales based on the geographic location of the Company’s facilities are as follows:
130
Advanced
Engineered Materials
Consumer Specialties
Industrial Specialties
Acetyl Intermediates
Other Activities Eliminations Consolidated
(In $ millions)
Year Ended December 31, 2010
Net sales 1,109 1,098 (1) 1,036 3,082 (1) 2 (409 ) 5,918
Other (charges) gains, net 31 (76 ) 25 (4) (12 ) (14 ) (4) — (46 )
Operating profit (loss) 186 164 89 243 (179 ) — 503
Equity in net earnings (loss) of affiliates 144 2 — 5 17 — 168
Depreciation and amortization 76 (5) 42 41 117 (5) 11 — 287
Capital expenditures 52 50 55 49 16 — 222 (3)
(1) Ne t sales for Acetyl Intermediates and Consumer Specialties include inter-segment sales of $440 million and $4 million , respectively, for the year ended December 31, 2012 and $468 million and $3 million , respectively, for the year ended December 31, 2011 ; and $400 million and $9 million , respectively, for the year ended December 31, 2010 .
(2) In cludes $9 million of insurance recoveries received from the Company's captive insurance companies related to the Narrows, Virginia facility that eliminates in consolidation.
(3) Ex cludes expenditures related to the relocation of the Company’s POM operations in Germany ( Note 27 ) and includes a decrease in accrued capital expenditures of $22 million for the year ended December 31, 2012 and an increase of $15 million and $21 million for the years ended December 31, 2011 and 2010 , respectively.
(4) In cludes $7 million of insurance recoveries received from the Company’s captive insurance companies related to the Edmonton, Alberta, Canada facility that eliminates in consolidation.
(5) In cludes $2 million for Advanced Engineered Materials and $20 million for Acetyl Intermediates for the accelerated amortization of the unamortized prepayment related to a raw material purchase agreement ( Note 23 ).
Year Ended December 31,
2012 2011 2010
(In $ millions)
Net Sales
US 1,811 1,772 1,555 International 4,607 4,991 4,363
Total 6,418 6,763 5,918
International Countries with Significant Net Sales
Germany 2,082 2,328 1,950 China 733 667 596 Singapore 561 722 612 Belgium 504 461 451 Canada 284 323 277 Mexico 257 241 267
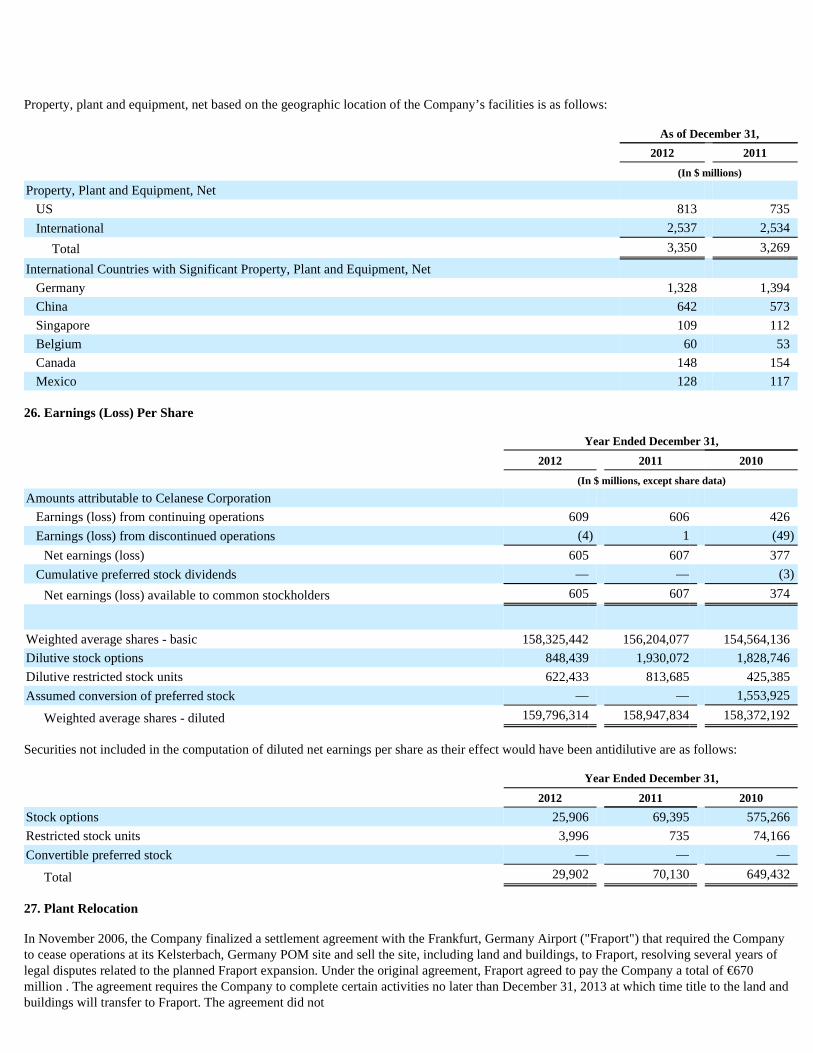
Property, plant and equipment, net based on the geographic location of the Company’s facilities is as follows:
26. Earnings (Loss) Per Share
Securities not included in the computation of diluted net earnings per share as their effect would have been antidilutive are as follows:
27. Plant Relocation
In November 2006, the Company finalized a settlement agreement with the Frankfurt, Germany Airport ("Fraport") that required the Company to cease operations at its Kelsterbach, Germany POM site and sell the site, including land and buildings, to Fraport, resolving several years of legal disputes related to the planned Fraport expansion. Under the original agreement, Fraport agreed to pay the Company a total of €670 million . The agreement requires the Company to complete certain activities no later than December 31, 2013 at which time title to the land and buildings will transfer to Fraport. The agreement did not
As of December 31,
2012 2011
(In $ millions)
Property, Plant and Equipment, Net
US 813 735 International 2,537 2,534
Total 3,350 3,269
International Countries with Significant Property, Plant and Equipment, Net
Germany 1,328 1,394 China 642 573 Singapore 109 112 Belgium 60 53 Canada 148 154 Mexico 128 117
Year Ended December 31,
2012 2011 2010
(In $ millions, except share data)
Amounts attributable to Celanese Corporation
Earnings (loss) from continuing operations 609 606 426 Earnings (loss) from discontinued operations (4 ) 1 (49 )
Net earnings (loss) 605 607 377 Cumulative preferred stock dividends — — (3 )
Net earnings (loss) available to common stockholders 605 607 374
Weighted average shares - basic 158,325,442 156,204,077 154,564,136 Dilutive stock options 848,439 1,930,072 1,828,746 Dilutive restricted stock units 622,433 813,685 425,385 Assumed conversion of preferred stock — — 1,553,925
Weighted average shares - diluted 159,796,314 158,947,834 158,372,192
Year Ended December 31,
2012 2011 2010
Stock options 25,906 69,395 575,266 Restricted stock units 3,996 735 74,166 Convertible preferred stock — — —
Total 29,902 70,130 649,432

131
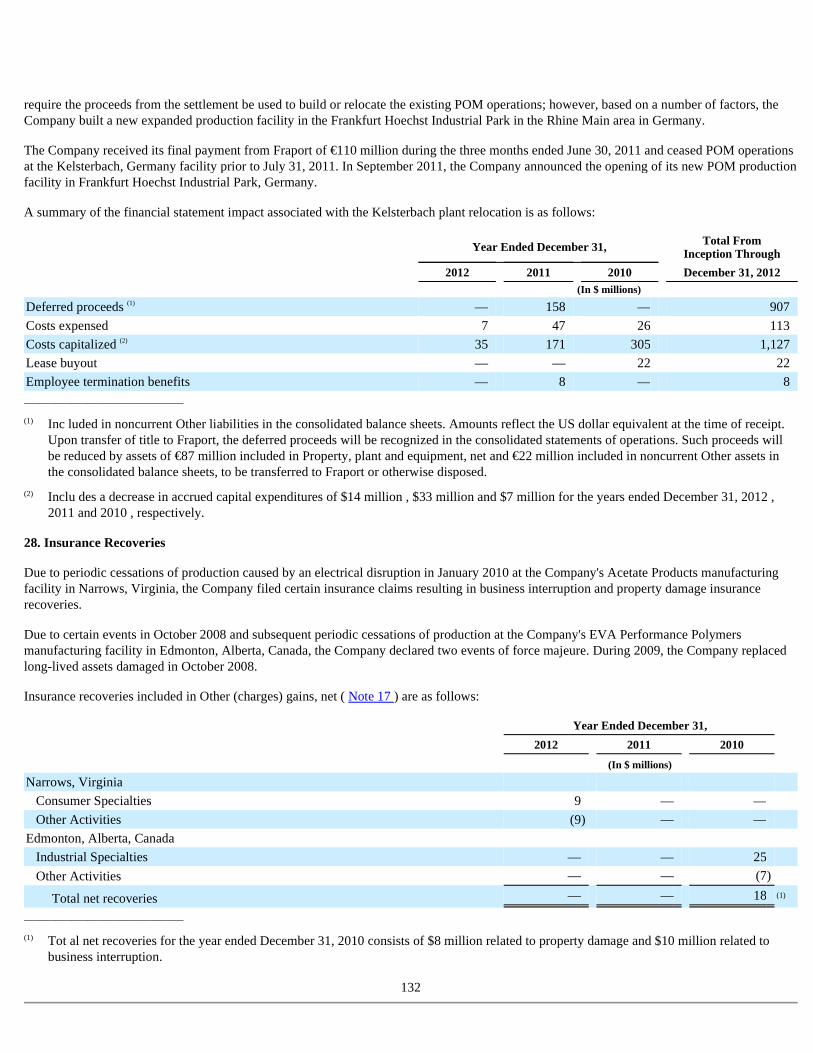
require the proceeds from the settlement be used to build or relocate the existing POM operations; however, based on a number of factors, the Company built a new expanded production facility in the Frankfurt Hoechst Industrial Park in the Rhine Main area in Germany.
The Company received its final payment from Fraport of €110 million during the three months ended June 30, 2011 and ceased POM operations at the Kelsterbach, Germany facility prior to July 31, 2011. In September 2011, the Company announced the opening of its new POM production facility in Frankfurt Hoechst Industrial Park, Germany.
A summary of the financial statement impact associated with the Kelsterbach plant relocation is as follows:
______________________________
28. Insurance Recoveries
Due to periodic cessations of production caused by an electrical disruption in January 2010 at the Company's Acetate Products manufacturing facility in Narrows, Virginia, the Company filed certain insurance claims resulting in business interruption and property damage insurance recoveries.
Due to certain events in October 2008 and subsequent periodic cessations of production at the Company's EVA Performance Polymers manufacturing facility in Edmonton, Alberta, Canada, the Company declared two events of force majeure. During 2009, the Company replaced long-lived assets damaged in October 2008.
Insurance recoveries included in Other (charges) gains, net ( Note 17 ) are as follows:
______________________________
132
Year Ended December 31, Total From
Inception Through
2012 2011 2010 December 31, 2012 (In $ millions)
Deferred proceeds (1) — 158 — 907 Costs expensed 7 47 26 113 Costs capitalized (2) 35 171 305 1,127 Lease buyout — — 22 22 Employee termination benefits — 8 — 8
(1) Inc luded in noncurrent Other liabilities in the consolidated balance sheets. Amounts reflect the US dollar equivalent at the time of receipt. Upon transfer of title to Fraport, the deferred proceeds will be recognized in the consolidated statements of operations. Such proceeds will be reduced by assets of €87 million included in Property, plant and equipment, net and €22 million included in noncurrent Other assets in the consolidated balance sheets, to be transferred to Fraport or otherwise disposed.
(2) Inclu des a decrease in accrued capital expenditures of $14 million , $33 million and $7 million for the years ended December 31, 2012 , 2011 and 2010 , respectively.
Year Ended December 31,
2012 2011 2010
(In $ millions)
Narrows, Virginia
Consumer Specialties 9 — —
Other Activities (9 ) — —
Edmonton, Alberta, Canada
Industrial Specialties — — 25
Other Activities — — (7 )
Total net recoveries — — 18 (1)
(1) Tot al net recoveries for the year ended December 31, 2010 consists of $8 million related to property damage and $10 million related to business interruption.
29. Consolidating Guarantor Financial Information
The 4.625% Notes, the 5.875% Notes and the 6.625% Notes (collectively, the "Notes") were issued by Celanese US (the "Issuer") and are guaranteed by Celanese Corporation (the "Parent Guarantor") and the Subsidiary Guarantors ( Note 13 ). The Issuer and Subsidiary Guarantors are 100% owned subsidiaries of the Parent Guarantor. The Parent Guarantor and Subsidiary Guarantors have guaranteed the Notes fully and unconditionally and jointly and severally.
For cash management purposes, the Company transfers cash between Parent Guarantor, Issuer, Subsidiary Guarantors and non-guarantors through intercompany financing arrangements, contributions or declaration of dividends between the respective parent and its subsidiaries. The transfer of cash under these activities facilitates the ability of the recipient to make specified third-party payments for principal and interest on the Company's outstanding debt, Common Stock dividends and Common Stock repurchases. The consolidating statements of cash flow for the years ended December 31, 2012, 2011 and 2010 present such intercompany financing activities, contributions and dividends consistent with how such activity would be presented in a stand-alone statement of cash flows. Previously, the Company presented such activity within the category where the ultimate use of cash to third parties was presented in the consolidated statements of cash flow. Prior amounts have been revised to conform to the current presentation.
The Company has not presented separate financial information and other disclosures for each of its Subsidiary Guarantors because it believes such financial information and other disclosures would not provide investors with any additional information that would be material in evaluating the sufficiency of the guarantees.
133
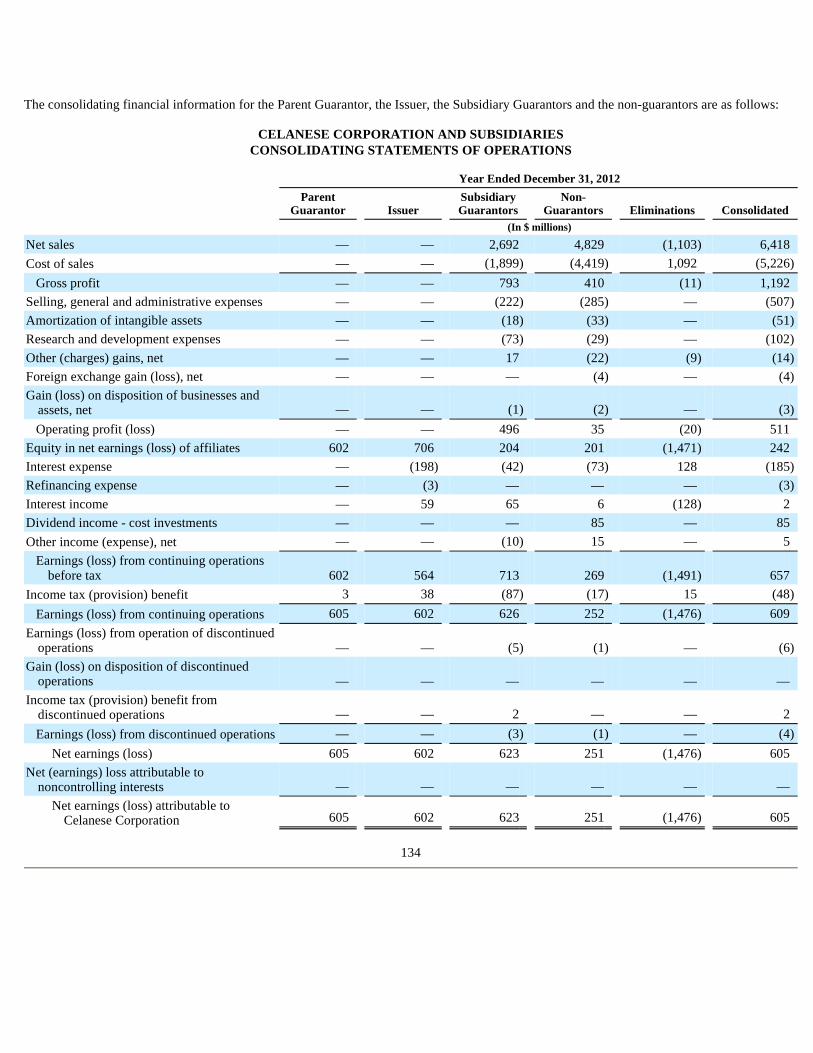
The consolidating financial information for the Parent Guarantor, the Issuer, the Subsidiary Guarantors and the non-guarantors are as follows:
CELANESE CORPORATION AND SUBSIDIARIES CONSOLIDATING STATEMENTS OF OPERATIONS
134
Year Ended December 31, 2012
Parent
Guarantor Issuer Subsidiary Guarantors
Non- Guarantors Eliminations Consolidated
(In $ millions)
Net sales — — 2,692 4,829 (1,103 ) 6,418 Cost of sales — — (1,899 ) (4,419 ) 1,092 (5,226 )
Gross profit — — 793 410 (11 ) 1,192 Selling, general and administrative expenses — — (222 ) (285 ) — (507 )
Amortization of intangible assets — — (18 ) (33 ) — (51 )
Research and development expenses — — (73 ) (29 ) — (102 )
Other (charges) gains, net — — 17 (22 ) (9 ) (14 )
Foreign exchange gain (loss), net — — — (4 ) — (4 )
Gain (loss) on disposition of businesses and assets, net — — (1 ) (2 ) — (3 )
Operating profit (loss) — — 496 35 (20 ) 511 Equity in net earnings (loss) of affiliates 602 706 204 201 (1,471 ) 242 Interest expense — (198 ) (42 ) (73 ) 128 (185 )
Refinancing expense — (3 ) — — — (3 )
Interest income — 59 65 6 (128 ) 2 Dividend income - cost investments — — — 85 — 85 Other income (expense), net — — (10 ) 15 — 5
Earnings (loss) from continuing operations before tax 602 564 713 269 (1,491 ) 657
Income tax (provision) benefit 3 38 (87 ) (17 ) 15 (48 )
Earnings (loss) from continuing operations 605 602 626 252 (1,476 ) 609 Earnings (loss) from operation of discontinued
operations — — (5 ) (1 ) — (6 )
Gain (loss) on disposition of discontinued operations — — — — — —
Income tax (provision) benefit from discontinued operations — — 2 — — 2 Earnings (loss) from discontinued operations — — (3 ) (1 ) — (4 )
Net earnings (loss) 605 602 623 251 (1,476 ) 605 Net (earnings) loss attributable to
noncontrolling interests — — — — — — Net earnings (loss) attributable to
Celanese Corporation 605 602 623 251 (1,476 ) 605
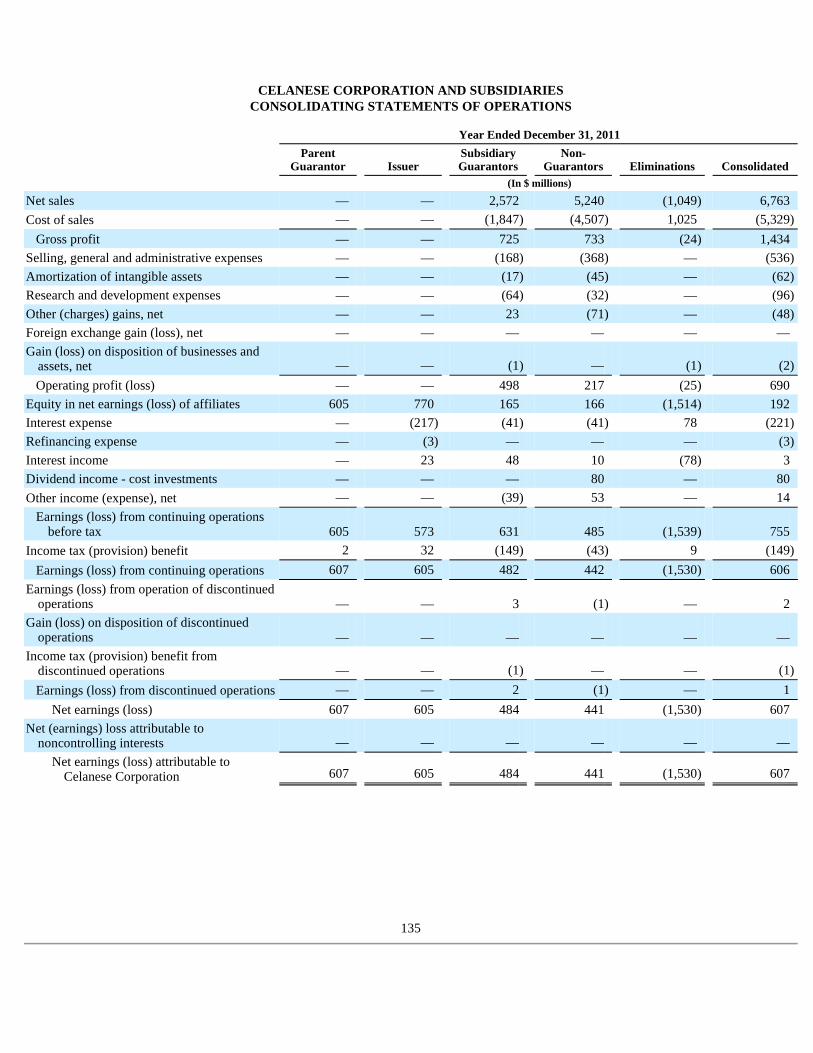
CELANESE CORPORATION AND SUBSIDIARIES CONSOLIDATING STATEMENTS OF OPERATIONS
135
Year Ended December 31, 2011
Parent
Guarantor Issuer Subsidiary Guarantors
Non- Guarantors Eliminations Consolidated
(In $ millions)
Net sales — — 2,572 5,240 (1,049 ) 6,763 Cost of sales — — (1,847 ) (4,507 ) 1,025 (5,329 )
Gross profit — — 725 733 (24 ) 1,434 Selling, general and administrative expenses — — (168 ) (368 ) — (536 )
Amortization of intangible assets — — (17 ) (45 ) — (62 )
Research and development expenses — — (64 ) (32 ) — (96 )
Other (charges) gains, net — — 23 (71 ) — (48 )
Foreign exchange gain (loss), net — — — — — — Gain (loss) on disposition of businesses and
assets, net — — (1 ) — (1 ) (2 )
Operating profit (loss) — — 498 217 (25 ) 690 Equity in net earnings (loss) of affiliates 605 770 165 166 (1,514 ) 192 Interest expense — (217 ) (41 ) (41 ) 78 (221 )
Refinancing expense — (3 ) — — — (3 )
Interest income — 23 48 10 (78 ) 3 Dividend income - cost investments — — — 80 — 80 Other income (expense), net — — (39 ) 53 — 14
Earnings (loss) from continuing operations before tax 605 573 631 485 (1,539 ) 755
Income tax (provision) benefit 2 32 (149 ) (43 ) 9 (149 )
Earnings (loss) from continuing operations 607 605 482 442 (1,530 ) 606 Earnings (loss) from operation of discontinued
operations — — 3 (1 ) — 2 Gain (loss) on disposition of discontinued
operations — — — — — — Income tax (provision) benefit from
discontinued operations — — (1 ) — — (1 )
Earnings (loss) from discontinued operations — — 2 (1 ) — 1 Net earnings (loss) 607 605 484 441 (1,530 ) 607
Net (earnings) loss attributable to noncontrolling interests — — — — — —
Net earnings (loss) attributable to Celanese Corporation 607 605 484 441 (1,530 ) 607

CELANESE CORPORATION AND SUBSIDIARIES CONSOLIDATING STATEMENTS OF OPERATIONS
136
Year Ended December 31, 2010
Parent
Guarantor Issuer Subsidiary Guarantors
Non- Guarantors Eliminations Consolidated
(In $ millions)
Net sales — — 2,277 4,570 (929 ) 5,918 Cost of sales — — (1,704 ) (3,976 ) 942 (4,738 )
Gross profit — — 573 594 13 1,180 Selling, general and administrative expenses — — (183 ) (322 ) — (505 )
Amortization of intangible assets — — (14 ) (47 ) — (61 )
Research and development expenses — — (42 ) (28 ) — (70 )
Other (charges) gains, net — — 68 (114 ) — (46 )
Foreign exchange gain (loss), net — — — (3 ) — (3 )
Gain (loss) on disposition of businesses and assets, net — — 3 5 — 8 Operating profit (loss) — — 405 85 13 503
Equity in net earnings (loss) of affiliates 407 551 153 126 (1,069 ) 168 Interest expense — (173 ) (38 ) (46 ) 53 (204 )
Refinancing expense — (16 ) — — — (16 )
Interest income — 21 30 9 (53 ) 7 Dividend income - cost investments — — — 73 — 73 Other income (expense), net (27 ) 2 (52 ) 84 — 7
Earnings (loss) from continuing operations before tax 380 385 498 331 (1,056 ) 538
Income tax (provision) benefit (3 ) 22 (91 ) (38 ) (2 ) (112 )
Earnings (loss) from continuing operations 377 407 407 293 (1,058 ) 426 Earnings (loss) from operation of discontinued
operations — — (78 ) (2 ) — (80 )
Gain (loss) on disposition of discontinued operations — — 2 — — 2
Income tax (provision) benefit from discontinued operations — — 28 1 — 29 Earnings (loss) from discontinued operations — — (48 ) (1 ) — (49 )
Net earnings (loss) 377 407 359 292 (1,058 ) 377 Net (earnings) loss attributable to
noncontrolling interests — — — — — — Net earnings (loss) attributable to
Celanese Corporation 377 407 359 292 (1,058 ) 377

CELANESE CORPORATION AND SUBSIDIARIES CONSOLIDATING STATEMENTS OF COMPREHENSIVE INCOME (L OSS)
137
Year Ended December 31, 2012
Parent
Guarantor Issuer Subsidiary Guarantors
Non- Guarantors Eliminations Consolidated
(In $ millions)
Net earnings (loss) 605 602 623 251 (1,476 ) 605 Other comprehensive income (loss), net of tax
Unrealized gain (loss) on marketable securities — — — — — —
Foreign currency translation 5 5 (12 ) 1 6 5 Unrealized gain (loss) on interest rate swaps 7 7 (1 ) 3 (9 ) 7 Pension and postretirement benefits (244 ) (244 ) (162 ) (89 ) 495 (244 )
Total other comprehensive income (loss), net of tax (232 ) (232 ) (175 ) (85 ) 492 (232 )
Total comprehensive income (loss), net of tax 373 370 448 166 (984 ) 373
Comprehensive (income) loss attributable to noncontrolling interests — — — — — —
Comprehensive income (loss) attributable to Celanese Corporation 373 370 448 166 (984 ) 373
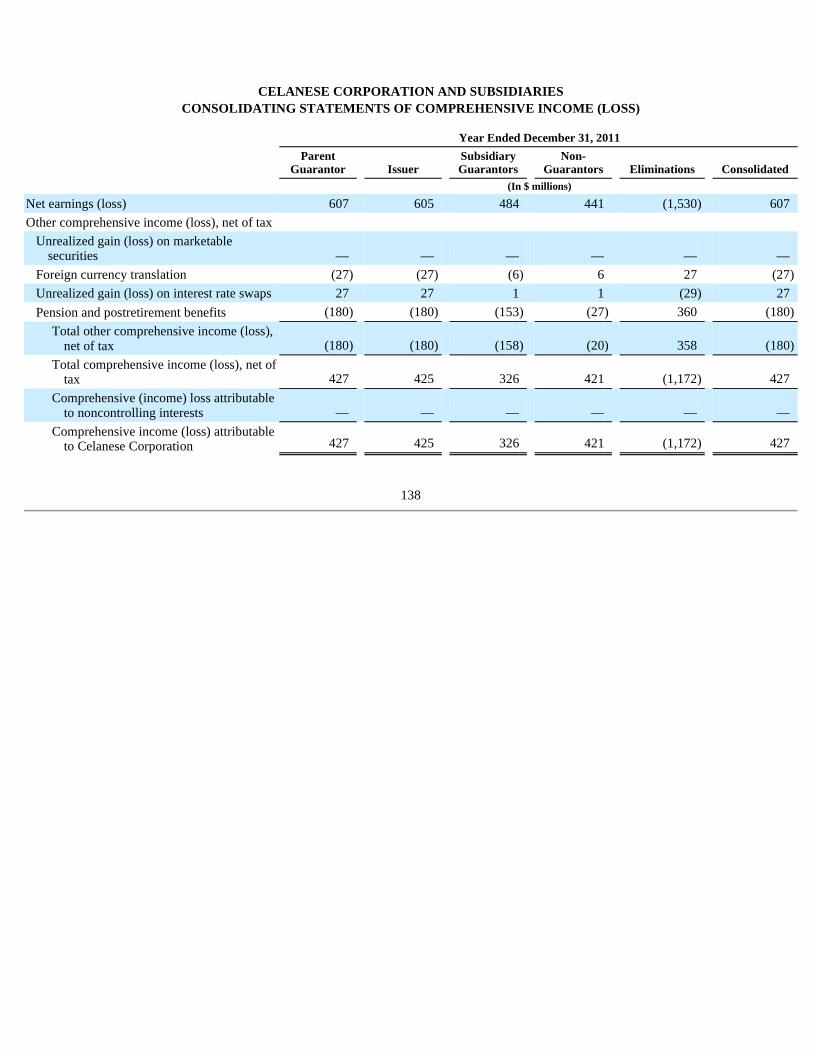
CELANESE CORPORATION AND SUBSIDIARIES CONSOLIDATING STATEMENTS OF COMPREHENSIVE INCOME (L OSS)
138
Year Ended December 31, 2011
Parent
Guarantor Issuer Subsidiary Guarantors
Non- Guarantors Eliminations Consolidated
(In $ millions)
Net earnings (loss) 607 605 484 441 (1,530 ) 607 Other comprehensive income (loss), net of tax
Unrealized gain (loss) on marketable securities — — — — — —
Foreign currency translation (27 ) (27 ) (6 ) 6 27 (27 )
Unrealized gain (loss) on interest rate swaps 27 27 1 1 (29 ) 27 Pension and postretirement benefits (180 ) (180 ) (153 ) (27 ) 360 (180 )
Total other comprehensive income (loss), net of tax (180 ) (180 ) (158 ) (20 ) 358 (180 )
Total comprehensive income (loss), net of tax 427 425 326 421 (1,172 ) 427
Comprehensive (income) loss attributable to noncontrolling interests — — — — — —
Comprehensive income (loss) attributable to Celanese Corporation 427 425 326 421 (1,172 ) 427
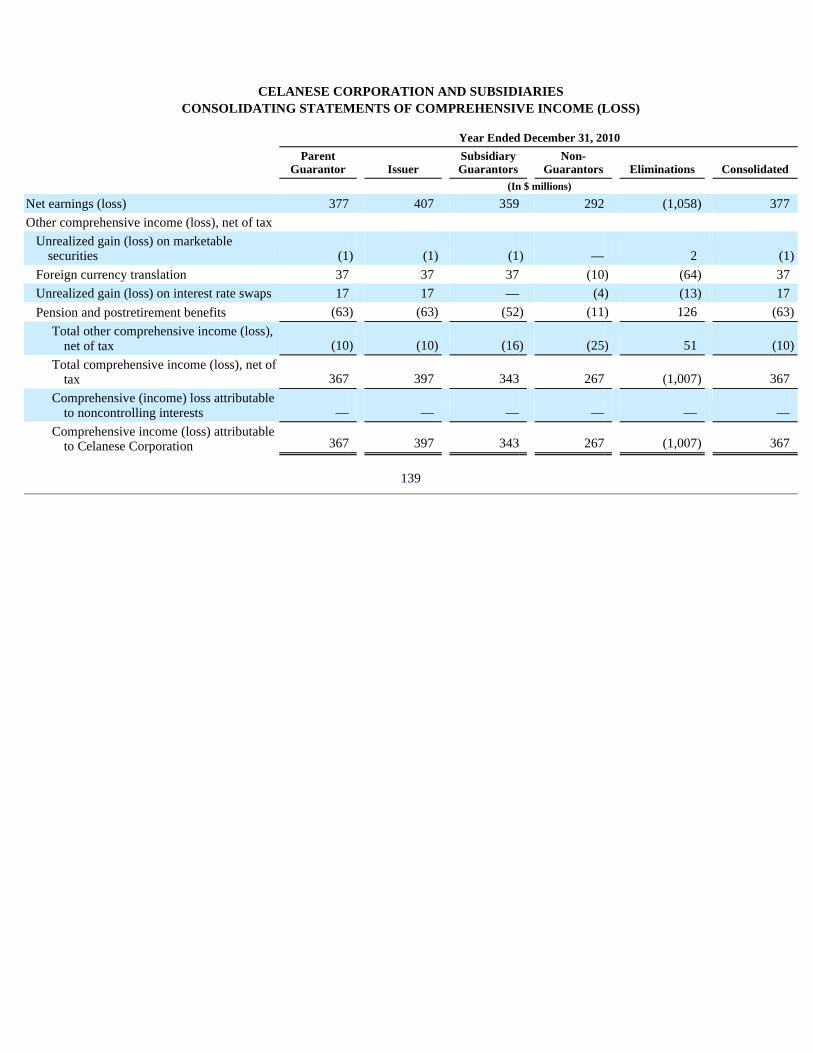
CELANESE CORPORATION AND SUBSIDIARIES CONSOLIDATING STATEMENTS OF COMPREHENSIVE INCOME (L OSS)
139
Year Ended December 31, 2010
Parent
Guarantor Issuer Subsidiary Guarantors
Non- Guarantors Eliminations Consolidated
(In $ millions)
Net earnings (loss) 377 407 359 292 (1,058 ) 377 Other comprehensive income (loss), net of tax
Unrealized gain (loss) on marketable securities (1 ) (1 ) (1 ) — 2 (1 )
Foreign currency translation 37 37 37 (10 ) (64 ) 37 Unrealized gain (loss) on interest rate swaps 17 17 — (4 ) (13 ) 17 Pension and postretirement benefits (63 ) (63 ) (52 ) (11 ) 126 (63 )
Total other comprehensive income (loss), net of tax (10 ) (10 ) (16 ) (25 ) 51 (10 )
Total comprehensive income (loss), net of tax 367 397 343 267 (1,007 ) 367
Comprehensive (income) loss attributable to noncontrolling interests — — — — — —
Comprehensive income (loss) attributable to Celanese Corporation 367 397 343 267 (1,007 ) 367
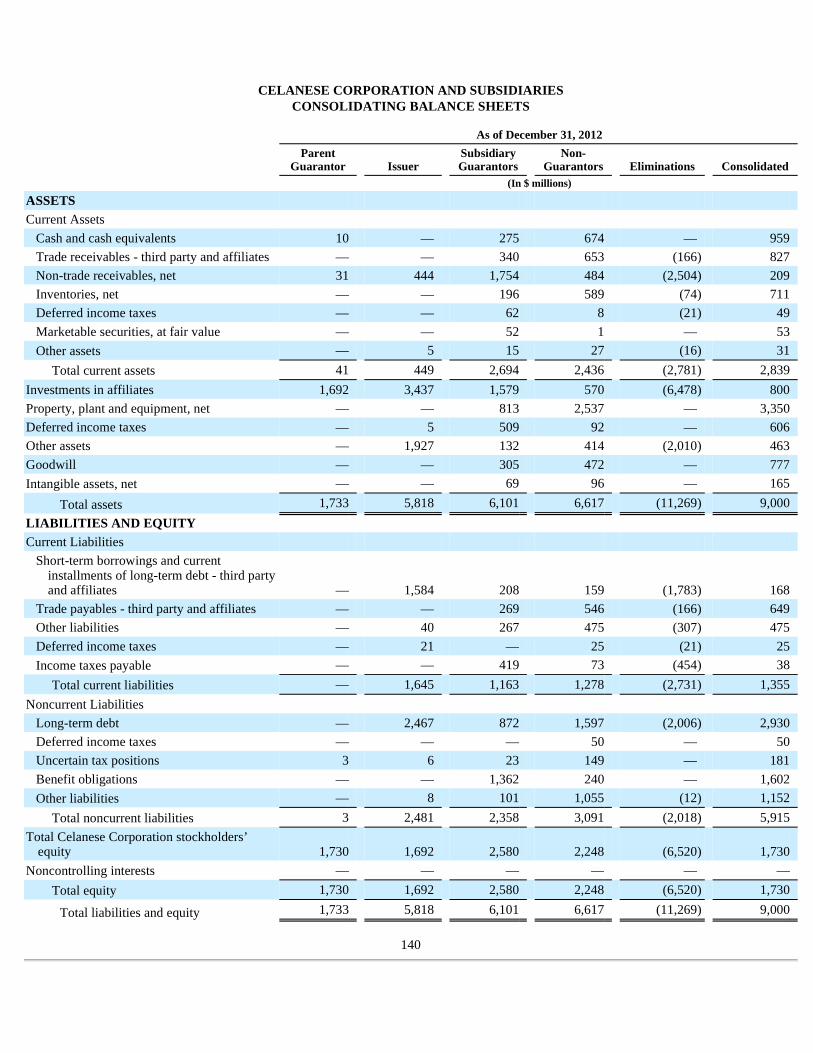
CELANESE CORPORATION AND SUBSIDIARIES CONSOLIDATING BALANCE SHEETS
140
As of December 31, 2012
Parent
Guarantor Issuer Subsidiary Guarantors
Non- Guarantors Eliminations Consolidated
(In $ millions)
ASSETS Current Assets
Cash and cash equivalents 10 — 275 674 — 959 Trade receivables - third party and affiliates — — 340 653 (166 ) 827 Non-trade receivables, net 31 444 1,754 484 (2,504 ) 209 Inventories, net — — 196 589 (74 ) 711 Deferred income taxes — — 62 8 (21 ) 49 Marketable securities, at fair value — — 52 1 — 53 Other assets — 5 15 27 (16 ) 31
Total current assets 41 449 2,694 2,436 (2,781 ) 2,839 Investments in affiliates 1,692 3,437 1,579 570 (6,478 ) 800 Property, plant and equipment, net — — 813 2,537 — 3,350 Deferred income taxes — 5 509 92 — 606 Other assets — 1,927 132 414 (2,010 ) 463 Goodwill — — 305 472 — 777 Intangible assets, net — — 69 96 — 165
Total assets 1,733 5,818 6,101 6,617 (11,269 ) 9,000 LIABILITIES AND EQUITY
Current Liabilities Short-term borrowings and current
installments of long-term debt - third party and affiliates — 1,584 208 159 (1,783 ) 168
Trade payables - third party and affiliates — — 269 546 (166 ) 649 Other liabilities — 40 267 475 (307 ) 475 Deferred income taxes — 21 — 25 (21 ) 25 Income taxes payable — — 419 73 (454 ) 38
Total current liabilities — 1,645 1,163 1,278 (2,731 ) 1,355 Noncurrent Liabilities
Long-term debt — 2,467 872 1,597 (2,006 ) 2,930 Deferred income taxes — — — 50 — 50 Uncertain tax positions 3 6 23 149 — 181 Benefit obligations — — 1,362 240 — 1,602 Other liabilities — 8 101 1,055 (12 ) 1,152
Total noncurrent liabilities 3 2,481 2,358 3,091 (2,018 ) 5,915 Total Celanese Corporation stockholders’
equity 1,730 1,692 2,580 2,248 (6,520 ) 1,730 Noncontrolling interests — — — — — —
Total equity 1,730 1,692 2,580 2,248 (6,520 ) 1,730
Total liabilities and equity 1,733 5,818 6,101 6,617 (11,269 ) 9,000
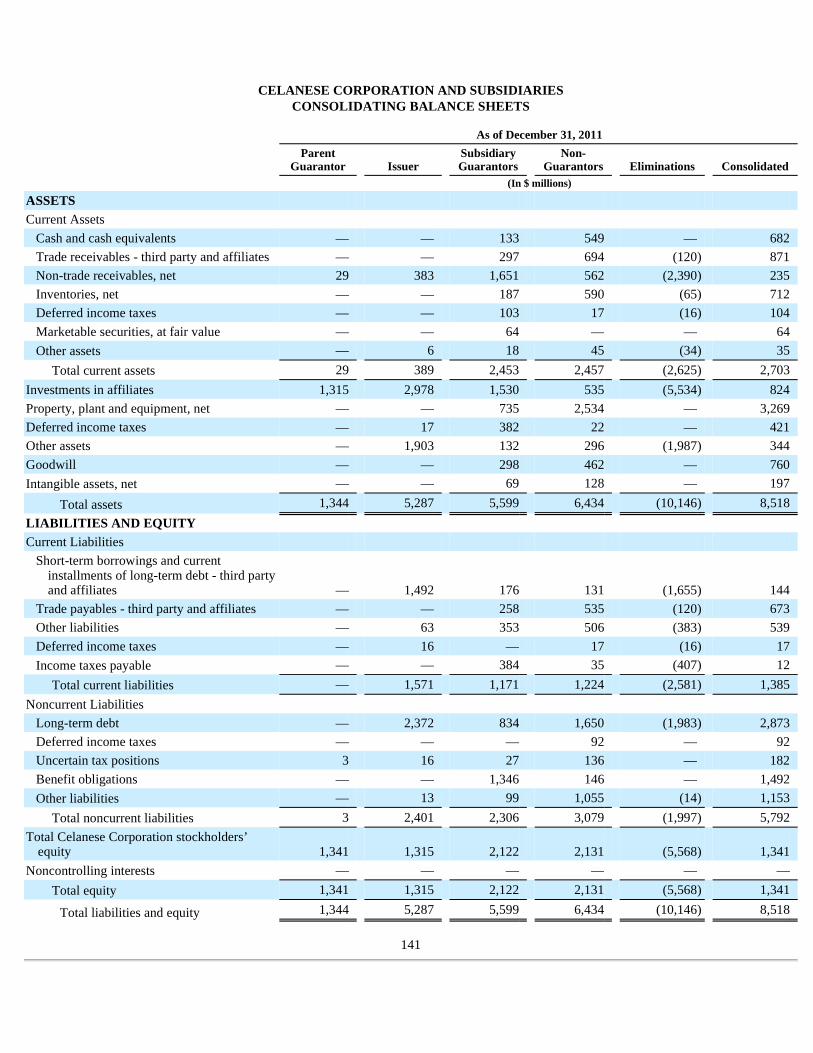
CELANESE CORPORATION AND SUBSIDIARIES CONSOLIDATING BALANCE SHEETS
141
As of December 31, 2011
Parent
Guarantor Issuer Subsidiary Guarantors
Non- Guarantors Eliminations Consolidated
(In $ millions)
ASSETS Current Assets
Cash and cash equivalents — — 133 549 — 682 Trade receivables - third party and affiliates — — 297 694 (120 ) 871 Non-trade receivables, net 29 383 1,651 562 (2,390 ) 235 Inventories, net — — 187 590 (65 ) 712 Deferred income taxes — — 103 17 (16 ) 104 Marketable securities, at fair value — — 64 — — 64 Other assets — 6 18 45 (34 ) 35
Total current assets 29 389 2,453 2,457 (2,625 ) 2,703 Investments in affiliates 1,315 2,978 1,530 535 (5,534 ) 824 Property, plant and equipment, net — — 735 2,534 — 3,269 Deferred income taxes — 17 382 22 — 421 Other assets — 1,903 132 296 (1,987 ) 344 Goodwill — — 298 462 — 760 Intangible assets, net — — 69 128 — 197
Total assets 1,344 5,287 5,599 6,434 (10,146 ) 8,518 LIABILITIES AND EQUITY
Current Liabilities Short-term borrowings and current
installments of long-term debt - third party and affiliates — 1,492 176 131 (1,655 ) 144
Trade payables - third party and affiliates — — 258 535 (120 ) 673 Other liabilities — 63 353 506 (383 ) 539 Deferred income taxes — 16 — 17 (16 ) 17 Income taxes payable — — 384 35 (407 ) 12
Total current liabilities — 1,571 1,171 1,224 (2,581 ) 1,385 Noncurrent Liabilities
Long-term debt — 2,372 834 1,650 (1,983 ) 2,873 Deferred income taxes — — — 92 — 92 Uncertain tax positions 3 16 27 136 — 182 Benefit obligations — — 1,346 146 — 1,492 Other liabilities — 13 99 1,055 (14 ) 1,153
Total noncurrent liabilities 3 2,401 2,306 3,079 (1,997 ) 5,792 Total Celanese Corporation stockholders’
equity 1,341 1,315 2,122 2,131 (5,568 ) 1,341 Noncontrolling interests — — — — — —
Total equity 1,341 1,315 2,122 2,131 (5,568 ) 1,341
Total liabilities and equity 1,344 5,287 5,599 6,434 (10,146 ) 8,518
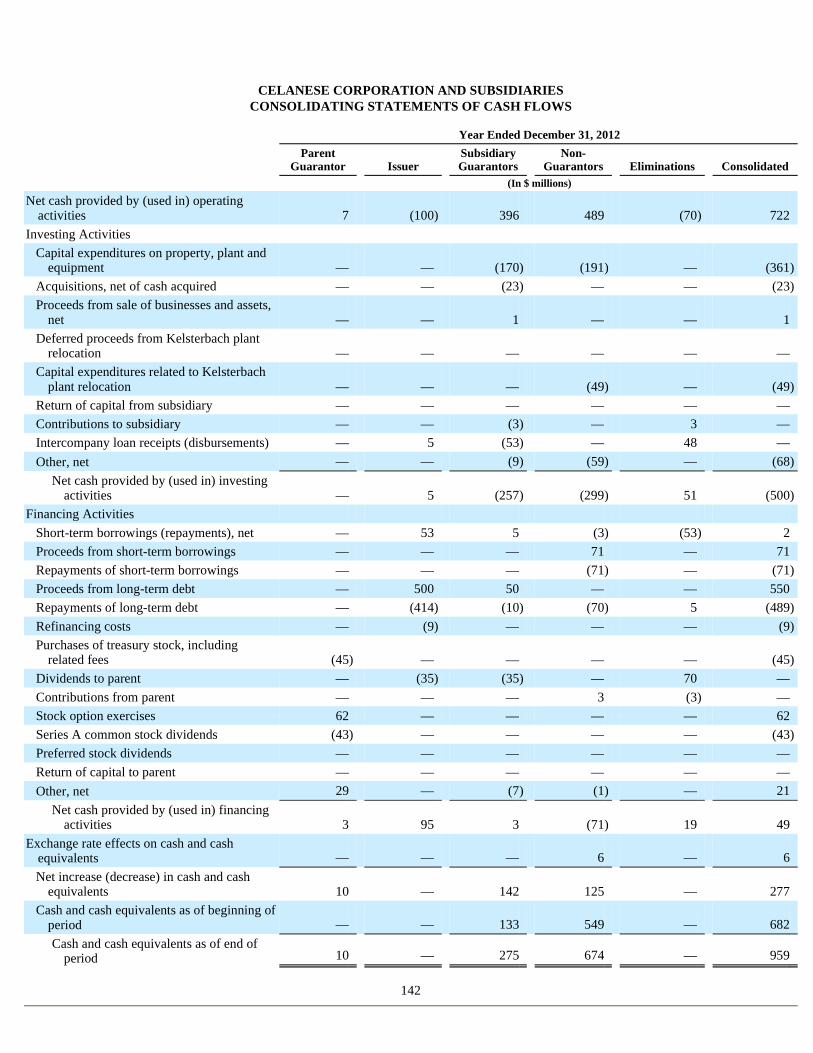
CELANESE CORPORATION AND SUBSIDIARIES CONSOLIDATING STATEMENTS OF CASH FLOWS
142
Year Ended December 31, 2012
Parent
Guarantor Issuer Subsidiary Guarantors
Non- Guarantors Eliminations Consolidated
(In $ millions)
Net cash provided by (used in) operating activities 7 (100 ) 396 489 (70 ) 722
Investing Activities Capital expenditures on property, plant and
equipment — — (170 ) (191 ) — (361 )
Acquisitions, net of cash acquired — — (23 ) — — (23 )
Proceeds from sale of businesses and assets, net — — 1 — — 1
Deferred proceeds from Kelsterbach plant relocation — — — — — —
Capital expenditures related to Kelsterbach plant relocation — — — (49 ) — (49 )
Return of capital from subsidiary — — — — — — Contributions to subsidiary — — (3 ) — 3 — Intercompany loan receipts (disbursements) — 5 (53 ) — 48 — Other, net — — (9 ) (59 ) — (68 )
Net cash provided by (used in) investing activities — 5 (257 ) (299 ) 51 (500 )
Financing Activities Short-term borrowings (repayments), net — 53 5 (3 ) (53 ) 2 Proceeds from short-term borrowings — — — 71 — 71 Repayments of short-term borrowings — — — (71 ) — (71 )
Proceeds from long-term debt — 500 50 — — 550 Repayments of long-term debt — (414 ) (10 ) (70 ) 5 (489 )
Refinancing costs — (9 ) — — — (9 )
Purchases of treasury stock, including related fees (45 ) — — — — (45 )
Dividends to parent — (35 ) (35 ) — 70 — Contributions from parent — — — 3 (3 ) — Stock option exercises 62 — — — — 62 Series A common stock dividends (43 ) — — — — (43 )
Preferred stock dividends — — — — — — Return of capital to parent — — — — — — Other, net 29 — (7 ) (1 ) — 21
Net cash provided by (used in) financing activities 3 95 3 (71 ) 19 49
Exchange rate effects on cash and cash equivalents — — — 6 — 6 Net increase (decrease) in cash and cash
equivalents 10 — 142 125 — 277 Cash and cash equivalents as of beginning of
period — — 133 549 — 682 Cash and cash equivalents as of end of
period 10 — 275 674 — 959
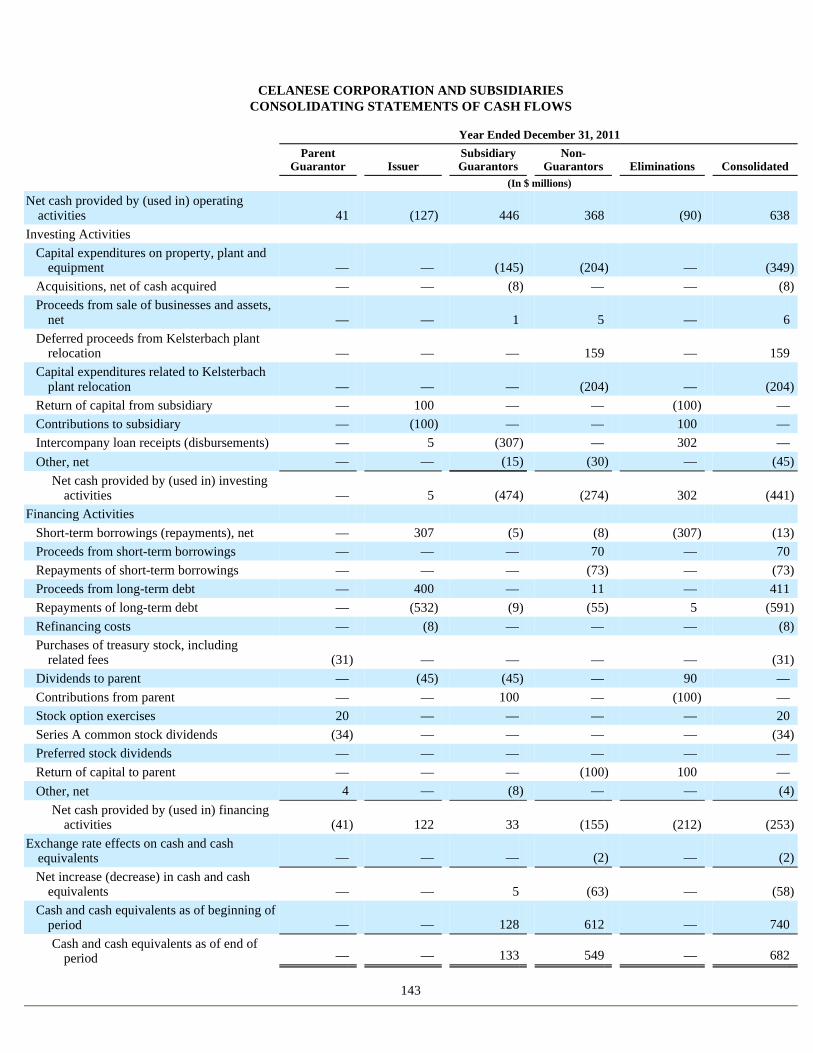
CELANESE CORPORATION AND SUBSIDIARIES CONSOLIDATING STATEMENTS OF CASH FLOWS
143
Year Ended December 31, 2011
Parent
Guarantor Issuer Subsidiary Guarantors
Non- Guarantors Eliminations Consolidated
(In $ millions)
Net cash provided by (used in) operating activities 41 (127 ) 446 368 (90 ) 638
Investing Activities Capital expenditures on property, plant and
equipment — — (145 ) (204 ) — (349 )
Acquisitions, net of cash acquired — — (8 ) — — (8 )
Proceeds from sale of businesses and assets, net — — 1 5 — 6
Deferred proceeds from Kelsterbach plant relocation — — — 159 — 159
Capital expenditures related to Kelsterbach plant relocation — — — (204 ) — (204 )
Return of capital from subsidiary — 100 — — (100 ) — Contributions to subsidiary — (100 ) — — 100 — Intercompany loan receipts (disbursements) — 5 (307 ) — 302 — Other, net — — (15 ) (30 ) — (45 )
Net cash provided by (used in) investing activities — 5 (474 ) (274 ) 302 (441 )
Financing Activities Short-term borrowings (repayments), net — 307 (5 ) (8 ) (307 ) (13 )
Proceeds from short-term borrowings — — — 70 — 70 Repayments of short-term borrowings — — — (73 ) — (73 )
Proceeds from long-term debt — 400 — 11 — 411 Repayments of long-term debt — (532 ) (9 ) (55 ) 5 (591 )
Refinancing costs — (8 ) — — — (8 )
Purchases of treasury stock, including related fees (31 ) — — — — (31 )
Dividends to parent — (45 ) (45 ) — 90 — Contributions from parent — — 100 — (100 ) — Stock option exercises 20 — — — — 20 Series A common stock dividends (34 ) — — — — (34 )
Preferred stock dividends — — — — — — Return of capital to parent — — — (100 ) 100 — Other, net 4 — (8 ) — — (4 )
Net cash provided by (used in) financing activities (41 ) 122 33 (155 ) (212 ) (253 )
Exchange rate effects on cash and cash equivalents — — — (2 ) — (2 )
Net increase (decrease) in cash and cash equivalents — — 5 (63 ) — (58 )
Cash and cash equivalents as of beginning of period — — 128 612 — 740 Cash and cash equivalents as of end of
period — — 133 549 — 682
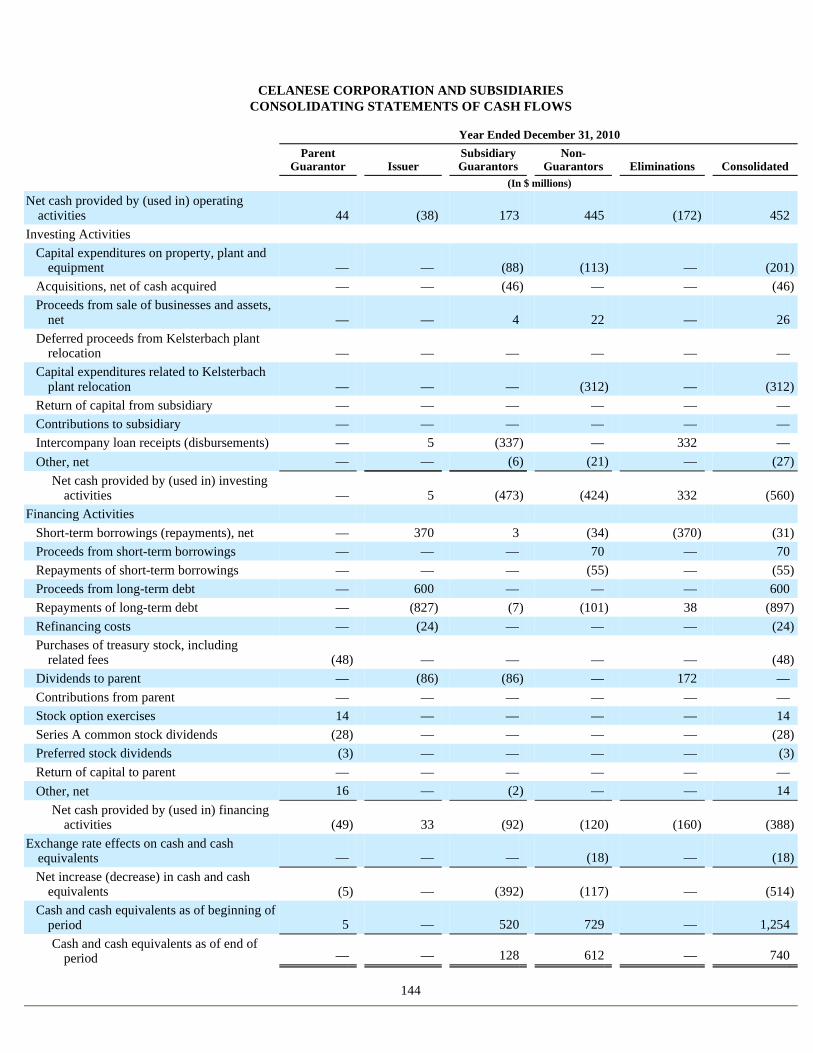
CELANESE CORPORATION AND SUBSIDIARIES CONSOLIDATING STATEMENTS OF CASH FLOWS
144
Year Ended December 31, 2010
Parent
Guarantor Issuer Subsidiary Guarantors
Non- Guarantors Eliminations Consolidated
(In $ millions)
Net cash provided by (used in) operating activities 44 (38 ) 173 445 (172 ) 452
Investing Activities
Capital expenditures on property, plant and equipment — — (88 ) (113 ) — (201 )
Acquisitions, net of cash acquired — — (46 ) — — (46 )
Proceeds from sale of businesses and assets, net — — 4 22 — 26
Deferred proceeds from Kelsterbach plant relocation — — — — — —
Capital expenditures related to Kelsterbach plant relocation — — — (312 ) — (312 )
Return of capital from subsidiary — — — — — — Contributions to subsidiary — — — — — — Intercompany loan receipts (disbursements) — 5 (337 ) — 332 — Other, net — — (6 ) (21 ) — (27 )
Net cash provided by (used in) investing activities — 5 (473 ) (424 ) 332 (560 )
Financing Activities
Short-term borrowings (repayments), net — 370 3 (34 ) (370 ) (31 )
Proceeds from short-term borrowings — — — 70 — 70 Repayments of short-term borrowings — — — (55 ) — (55 )
Proceeds from long-term debt — 600 — — — 600 Repayments of long-term debt — (827 ) (7 ) (101 ) 38 (897 )
Refinancing costs — (24 ) — — — (24 )
Purchases of treasury stock, including related fees (48 ) — — — — (48 )
Dividends to parent — (86 ) (86 ) — 172 — Contributions from parent — — — — — — Stock option exercises 14 — — — — 14 Series A common stock dividends (28 ) — — — — (28 )
Preferred stock dividends (3 ) — — — — (3 )
Return of capital to parent — — — — — — Other, net 16 — (2 ) — — 14
Net cash provided by (used in) financing activities (49 ) 33 (92 ) (120 ) (160 ) (388 )
Exchange rate effects on cash and cash equivalents — — — (18 ) — (18 )
Net increase (decrease) in cash and cash equivalents (5 ) — (392 ) (117 ) — (514 )
Cash and cash equivalents as of beginning of period 5 — 520 729 — 1,254 Cash and cash equivalents as of end of
period — — 128 612 — 740
30. Subsequent Events
On February 6, 2013 , the Company declared a quarterly cash dividend of $0.075 per share on its Common Stock amounting t o $12 million . The cash dividend was for the period from November 1, 2012 to January 31, 2013 and will be paid on February 28, 2013 to holders of record as of February 19, 2013 .
145
INDEX TO EXHIBITS Exhibits will be furnished upon request for a nominal fee, limited to reasonable expenses.
Exhibit Number Description
146
3.1 Second Amended and Restated Certificate of Incorporation (incorporated by reference to Exhibit 3.1 to the Annual Report on Form 10-K filed with the SEC on February 11, 2011).
3.2 Third Amended and Restated By-laws, effective as of October 23, 2008 (incorporated by reference to Exhibit 3.1 to the Current Report on Form 8-K filed with the SEC on October 29, 2008).
4.1 Form of certificate of Series A Common Stock (incorporated by reference to Exhibit 4.1 to the Registration Statement on Form S-1 (File No. 333-120187) filed with the SEC on January 13, 2005).
4.2 Indenture, dated September 24, 2010, by and among Celanese US Holdings LLC, the guarantors party thereto, and Wells Fargo Bank, National Association, as trustee (incorporated by reference to Exhibit 4.1 to the Current Report on Form 8-K filed with the SEC on September 29, 2010).
4.3 Indenture, dated as of May 6, 2011, by and between Celanese US Holdings LLC, Celanese Corporation and Wells Fargo Bank, National Association, as trustee (incorporated by reference to Exhibit 4.2 to the Current Report on Form 8-K filed with the SEC on May 6, 2011).
4.4 First Supplemental Indenture, 5.875% Senior Notes due 2021, dated as of May 6, 2011, by and between Celanese US Holdings LLC, the guarantors party thereto and Wells Fargo Bank, National Association, as trustee (incorporated by reference to Exhibit 4.3 to the Current Report on Form 8-K filed with the SEC on May 6, 2011).
4.5 Second Supplemental Indenture, 4.625% Senior Notes due 2022, dated as of November 13, 2012, by and between Celanese US Holdings LLC, the guarantors party thereto and Wells Fargo Bank, National Association, as trustee (incorporated by reference to Exhibit 4.2 to the Current Report on Form 8-K filed with the SEC on November 13, 2012).
10.1† Credit Agreement, dated April 2, 2007, among Celanese Holdings LLC, Celanese US Holdings LLC, the subsidiaries of Celanese US Holdings LLC from time to time party thereto as borrowers, the Lenders party thereto, Deutsche Bank AG, New York Branch, as administrative agent and as collateral agent, Merrill Lynch Capital Corporation as syndication agent, ABN AMRO Bank N.V., Bank of America, N.A., Citibank NA, and JP Morgan Chase Bank NA, as co-documentation agents (incorporated by reference to Exhibit 10.1 to the Current Report on Form 8-K filed with the SEC on May 28, 2010).
10.1(a) First Amendment to Credit Agreement, dated June 30, 2009, among Celanese US Holdings LLC and the Majority Lenders under the Revolving Facility (incorporated by reference to Exhibit 10.1 to the Current Report on Form 8-K filed with the SEC on July 1, 2009).
10.1(b) Amendment Agreement, dated September 29, 2010 among Celanese Corporation, Celanese US Holdings LLC, certain subsidiaries of Celanese US Holdings LLC, the lenders party thereto, Deutsche Bank AG, New York Branch, as administrative agent and as collateral agent, and Deutsche Bank Securities LLC and Banc of Americas Securities LLC as joint lead arrangers and joint book runners (incorporated by reference to Exhibit 10.2 to the Current Report on Form 8-K filed with the SEC on September 29, 2010).
10.1(c) Amended and Restated Credit Agreement, dated September 29, 2010 among Celanese Corporation, Celanese US Holdings LLC, the subsidiaries of Celanese US Holdings LLC from time to time party thereto as borrowers and guarantors, Deutsche Bank AG, New York Branch, as administrative agent and collateral agent, Deutsche Bank Securities LLC and Banc of Americas Securities LLC as joint lead arrangers and joint book runners, HSBC Securities (USA) Inc., JPMorgan Chase Bank, N.A., and The Royal Bank of Scotland PLC, as Co-Documentation Agents, the other lenders party thereto, and certain other agents for such lenders (incorporated by reference to Exhibit 10.3 to the Current Report on Form 8-K filed with the SEC on September 29, 2010).
Exhibit Number Description
147
10.1(d) Guarantee and Collateral Agreement, dated April 2, 2007, by and among Celanese Holdings LLC, Celanese US Holdings LLC, certain subsidiaries of Celanese US Holdings LLC and Deutsche Bank AG, New York Branch (incorporated by reference to Exhibit 10.2 to the Current Report on Form 8-K filed with the SEC on May 28, 2010).
10.2‡ Celanese Corporation 2004 Deferred Compensation Plan (incorporated by reference to Exhibit 10.21 to the Registration Statement on Form S-1 (File No. 333-120187) filed with the SEC on January 3, 2005).
10.2(a)‡ Amendment to Celanese Corporation 2004 Deferred Compensation Plan (incorporated by reference to Exhibit 10.2 to the Current Report on Form 8-K filed with the SEC on April 3, 2007).
10.2(b)‡ Form of 2007 Deferral Agreement between Celanese Corporation and award recipient, (incorporated by reference to Exhibit 10.1 to the Current Report on Form 8-K filed with the SEC on April 3, 2007).
10.3‡ Celanese Corporation 2004 Stock Incentive Plan (incorporated by reference to Exhibit 10.8 to the Annual Report on Form 10-K filed with the SEC on February 11, 2011).
10.3(a)‡ Form of Nonqualified Stock Option Agreement (for employees) between Celanese Corporation and award recipient (incorporated by reference to Exhibit 10.8(a) to the Annual Report on Form 10-K filed with the SEC on February 11, 2011).
10.3(b)‡ Form of Amendment to Nonqualified Stock Option Agreement (for employees) between Celanese Corporation and award recipient (incorporated by reference to Exhibit 10.5(b) to the Annual Report on Form 10-K filed with the SEC on February 12, 2010).
10.3(c)‡ Form of Amendment Two to Nonqualified Stock Option Agreement (for executive officers) between Celanese Corporation and award recipient (incorporated by reference to Exhibit 10.1 to the Current Report on Form 8-K filed with the SEC on January 26, 2009).
10.3(d)‡ Form of Nonqualified Stock Option Agreement (for non-employee directors) between Celanese Corporation and award recipient (incorporated by reference to Exhibit 10.8(d) to the Annual Report on Form 10-K filed with the SEC on February 11, 2011).
10.3(e)‡ Form of Performance-Based Restricted Stock Unit Agreement between Celanese Corporation and award recipient (incorporated by reference to Exhibit 10.3 to the Current Report on Form 8-K filed with the SEC on May 28, 2010).
10.3(f)‡ Form of Performance-Vesting Restricted Stock Unit Award Agreement between Celanese Corporation and award recipient, together with a schedule identifying substantially identical agreements between Celanese Corporation and each of its executive officers identified thereon (incorporated by reference to Exhibit 10.1 to the Current Report on Form 8-K filed with the SEC on January 26, 2009).
10.3(g)‡ Performance Unit Award Agreement, dated December 11, 2008, between Celanese Corporation and David N. Weidman (incorporated by reference to Exhibit 10.2 to the Current Report on Form 8-K filed with the SEC on January 26, 2009).
10.3(h)‡ Form of Time-Vesting Cash Award Agreement (for employees) between Celanese Corporation and award recipient, together with a schedule identifying substantially identical agreements between the Company and each of its executive officers identified thereon (incorporated by reference to Exhibit 10.3 to the Current Report on Form 8-K filed with the SEC on January 26, 2009).
10.4‡ Celanese Corporation 2008 Deferred Compensation Plan (incorporated by reference to Exhibit 10.6 to the Annual Report on Form 10-K filed on February 29, 2008).
10.4(a)‡ Amendment Number One to Celanese Corporation 2008 Deferred Compensation Plan (incorporated by reference to Exhibit 10.2 to the Registration Statement on Form S-8 filed with the SEC on April 23, 2009).
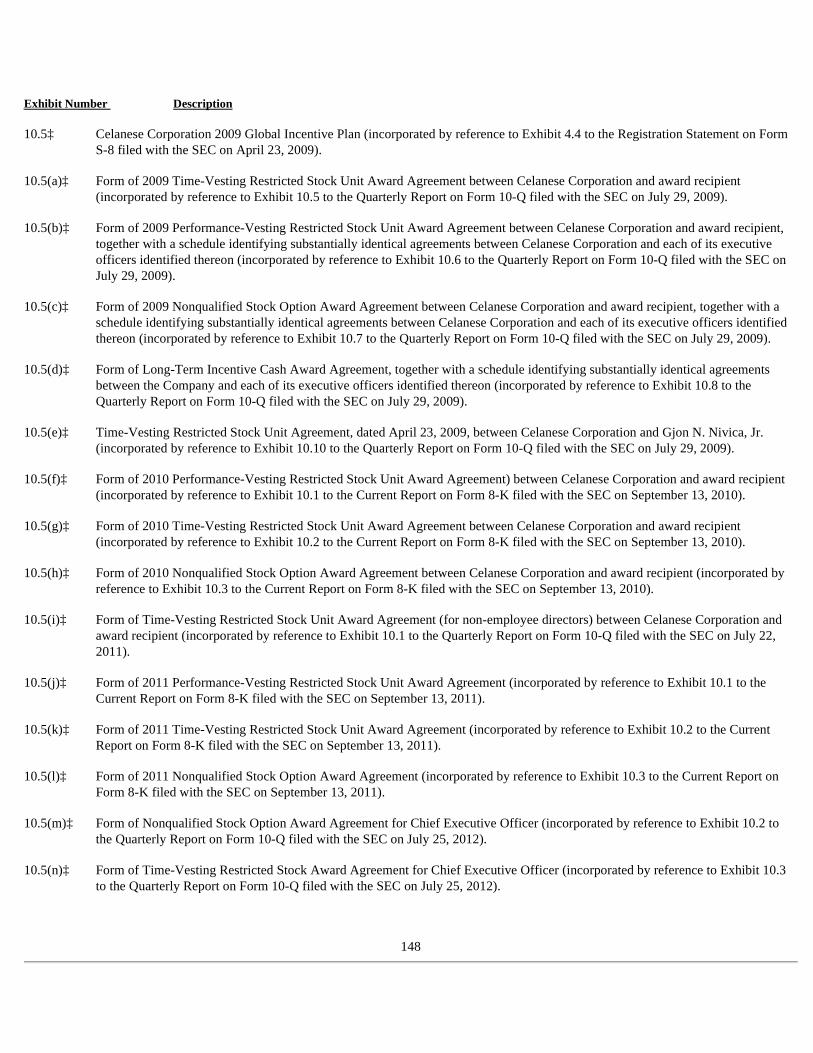
Exhibit Number Description
148
10.5‡ Celanese Corporation 2009 Global Incentive Plan (incorporated by reference to Exhibit 4.4 to the Registration Statement on Form S-8 filed with the SEC on April 23, 2009).
10.5(a)‡ Form of 2009 Time-Vesting Restricted Stock Unit Award Agreement between Celanese Corporation and award recipient (incorporated by reference to Exhibit 10.5 to the Quarterly Report on Form 10-Q filed with the SEC on July 29, 2009).
10.5(b)‡ Form of 2009 Performance-Vesting Restricted Stock Unit Award Agreement between Celanese Corporation and award recipient, together with a schedule identifying substantially identical agreements between Celanese Corporation and each of its executive officers identified thereon (incorporated by reference to Exhibit 10.6 to the Quarterly Report on Form 10-Q filed with the SEC on July 29, 2009).
10.5(c)‡ Form of 2009 Nonqualified Stock Option Award Agreement between Celanese Corporation and award recipient, together with a schedule identifying substantially identical agreements between Celanese Corporation and each of its executive officers identified thereon (incorporated by reference to Exhibit 10.7 to the Quarterly Report on Form 10-Q filed with the SEC on July 29, 2009).
10.5(d)‡ Form of Long-Term Incentive Cash Award Agreement, together with a schedule identifying substantially identical agreements between the Company and each of its executive officers identified thereon (incorporated by reference to Exhibit 10.8 to the Quarterly Report on Form 10-Q filed with the SEC on July 29, 2009).
10.5(e)‡ Time-Vesting Restricted Stock Unit Agreement, dated April 23, 2009, between Celanese Corporation and Gjon N. Nivica, Jr. (incorporated by reference to Exhibit 10.10 to the Quarterly Report on Form 10-Q filed with the SEC on July 29, 2009).
10.5(f)‡ Form of 2010 Performance-Vesting Restricted Stock Unit Award Agreement) between Celanese Corporation and award recipient (incorporated by reference to Exhibit 10.1 to the Current Report on Form 8-K filed with the SEC on September 13, 2010).
10.5(g)‡ Form of 2010 Time-Vesting Restricted Stock Unit Award Agreement between Celanese Corporation and award recipient (incorporated by reference to Exhibit 10.2 to the Current Report on Form 8-K filed with the SEC on September 13, 2010).
10.5(h)‡ Form of 2010 Nonqualified Stock Option Award Agreement between Celanese Corporation and award recipient (incorporated by reference to Exhibit 10.3 to the Current Report on Form 8-K filed with the SEC on September 13, 2010).
10.5(i)‡ Form of Time-Vesting Restricted Stock Unit Award Agreement (for non-employee directors) between Celanese Corporation and award recipient (incorporated by reference to Exhibit 10.1 to the Quarterly Report on Form 10-Q filed with the SEC on July 22, 2011).
10.5(j)‡ Form of 2011 Performance-Vesting Restricted Stock Unit Award Agreement (incorporated by reference to Exhibit 10.1 to the Current Report on Form 8-K filed with the SEC on September 13, 2011).
10.5(k)‡ Form of 2011 Time-Vesting Restricted Stock Unit Award Agreement (incorporated by reference to Exhibit 10.2 to the Current Report on Form 8-K filed with the SEC on September 13, 2011).
10.5(l)‡ Form of 2011 Nonqualified Stock Option Award Agreement (incorporated by reference to Exhibit 10.3 to the Current Report on Form 8-K filed with the SEC on September 13, 2011).
10.5(m)‡ Form of Nonqualified Stock Option Award Agreement for Chief Executive Officer (incorporated by reference to Exhibit 10.2 to the Quarterly Report on Form 10-Q filed with the SEC on July 25, 2012).
10.5(n)‡ Form of Time-Vesting Restricted Stock Award Agreement for Chief Executive Officer (incorporated by reference to Exhibit 10.3 to the Quarterly Report on Form 10-Q filed with the SEC on July 25, 2012).
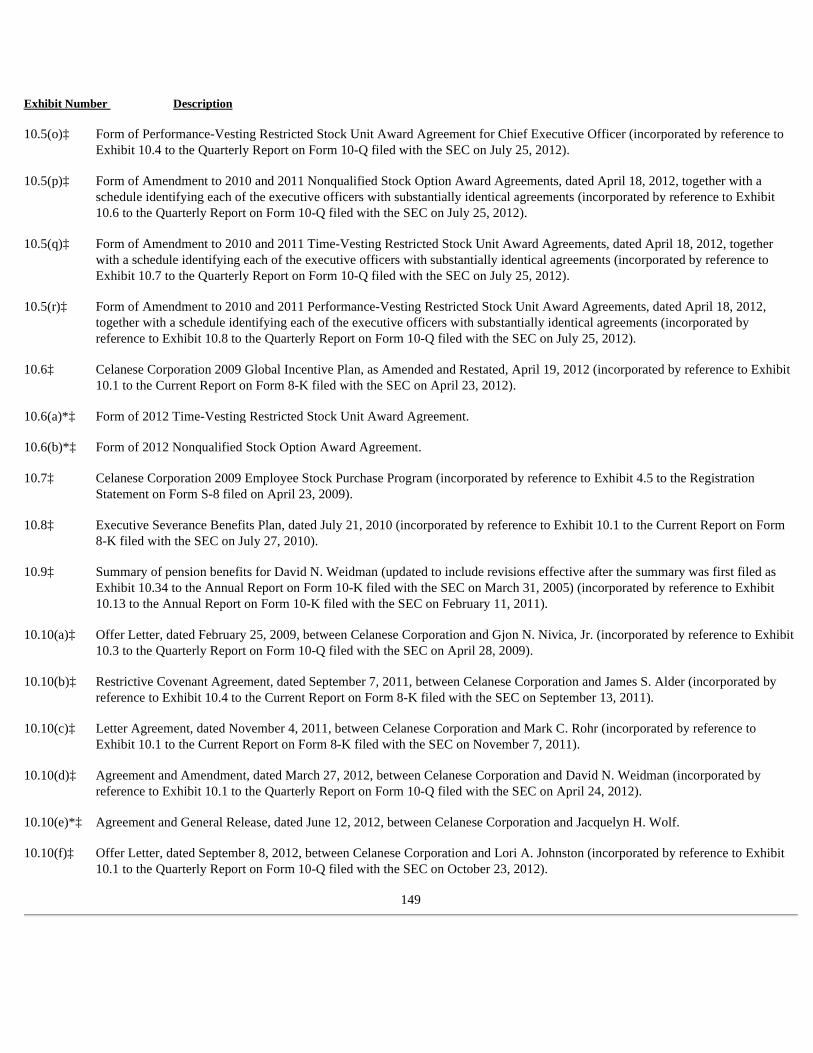
Exhibit Number Description
149
10.5(o)‡ Form of Performance-Vesting Restricted Stock Unit Award Agreement for Chief Executive Officer (incorporated by reference to Exhibit 10.4 to the Quarterly Report on Form 10-Q filed with the SEC on July 25, 2012).
10.5(p)‡ Form of Amendment to 2010 and 2011 Nonqualified Stock Option Award Agreements, dated April 18, 2012, together with a schedule identifying each of the executive officers with substantially identical agreements (incorporated by reference to Exhibit 10.6 to the Quarterly Report on Form 10-Q filed with the SEC on July 25, 2012).
10.5(q)‡ Form of Amendment to 2010 and 2011 Time-Vesting Restricted Stock Unit Award Agreements, dated April 18, 2012, together with a schedule identifying each of the executive officers with substantially identical agreements (incorporated by reference to Exhibit 10.7 to the Quarterly Report on Form 10-Q filed with the SEC on July 25, 2012).
10.5(r)‡ Form of Amendment to 2010 and 2011 Performance-Vesting Restricted Stock Unit Award Agreements, dated April 18, 2012, together with a schedule identifying each of the executive officers with substantially identical agreements (incorporated by reference to Exhibit 10.8 to the Quarterly Report on Form 10-Q filed with the SEC on July 25, 2012).
10.6‡ Celanese Corporation 2009 Global Incentive Plan, as Amended and Restated, April 19, 2012 (incorporated by reference to Exhibit 10.1 to the Current Report on Form 8-K filed with the SEC on April 23, 2012).
10.6(a)*‡ Form of 2012 Time-Vesting Restricted Stock Unit Award Agreement.
10.6(b)*‡ Form of 2012 Nonqualified Stock Option Award Agreement.
10.7‡ Celanese Corporation 2009 Employee Stock Purchase Program (incorporated by reference to Exhibit 4.5 to the Registration Statement on Form S-8 filed on April 23, 2009).
10.8‡ Executive Severance Benefits Plan, dated July 21, 2010 (incorporated by reference to Exhibit 10.1 to the Current Report on Form 8-K filed with the SEC on July 27, 2010).
10.9‡ Summary of pension benefits for David N. Weidman (updated to include revisions effective after the summary was first filed as Exhibit 10.34 to the Annual Report on Form 10-K filed with the SEC on March 31, 2005) (incorporated by reference to Exhibit 10.13 to the Annual Report on Form 10-K filed with the SEC on February 11, 2011).
10.10(a)‡ Offer Letter, dated February 25, 2009, between Celanese Corporation and Gjon N. Nivica, Jr. (incorporated by reference to Exhibit 10.3 to the Quarterly Report on Form 10-Q filed with the SEC on April 28, 2009).
10.10(b)‡ Restrictive Covenant Agreement, dated September 7, 2011, between Celanese Corporation and James S. Alder (incorporated by reference to Exhibit 10.4 to the Current Report on Form 8-K filed with the SEC on September 13, 2011).
10.10(c)‡ Letter Agreement, dated November 4, 2011, between Celanese Corporation and Mark C. Rohr (incorporated by reference to Exhibit 10.1 to the Current Report on Form 8-K filed with the SEC on November 7, 2011).
10.10(d)‡ Agreement and Amendment, dated March 27, 2012, between Celanese Corporation and David N. Weidman (incorporated by reference to Exhibit 10.1 to the Quarterly Report on Form 10-Q filed with the SEC on April 24, 2012).
10.10(e)*‡ Agreement and General Release, dated June 12, 2012, between Celanese Corporation and Jacquelyn H. Wolf.
10.10(f)‡ Offer Letter, dated September 8, 2012, between Celanese Corporation and Lori A. Johnston (incorporated by reference to Exhibit 10.1 to the Quarterly Report on Form 10-Q filed with the SEC on October 23, 2012).
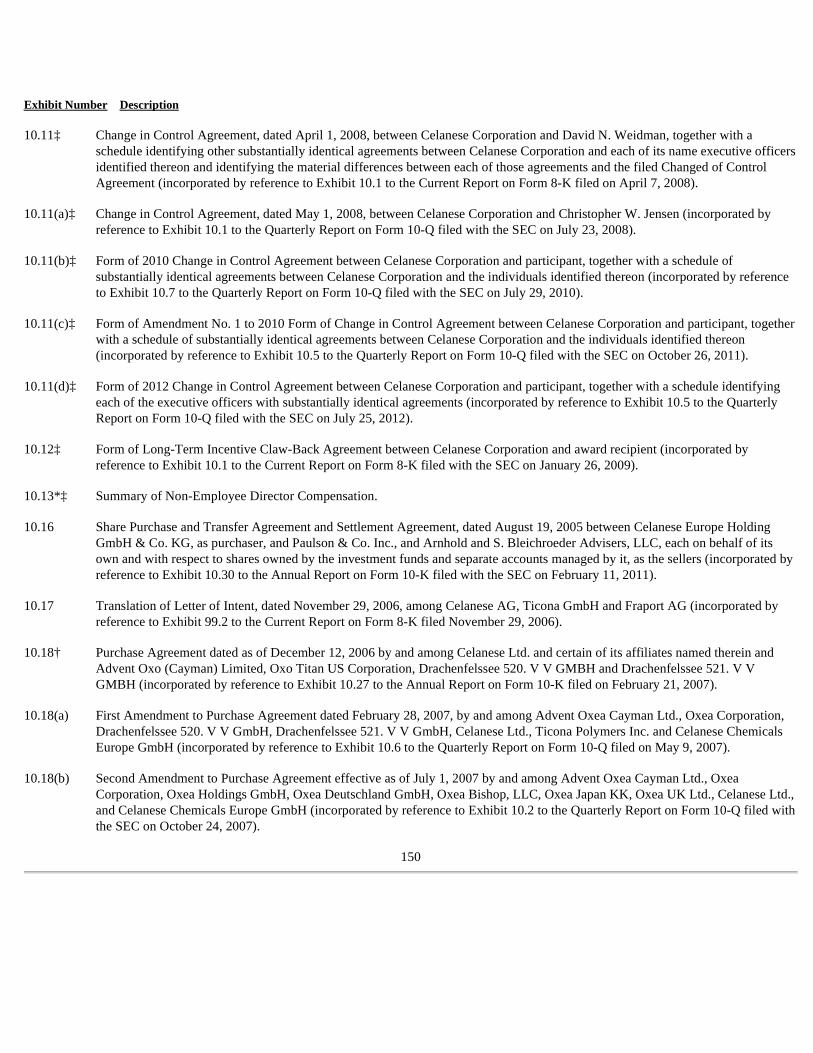
150
Exhibit Number Description
10.11‡ Change in Control Agreement, dated April 1, 2008, between Celanese Corporation and David N. Weidman, together with a schedule identifying other substantially identical agreements between Celanese Corporation and each of its name executive officers identified thereon and identifying the material differences between each of those agreements and the filed Changed of Control Agreement (incorporated by reference to Exhibit 10.1 to the Current Report on Form 8-K filed on April 7, 2008).
10.11(a)‡ Change in Control Agreement, dated May 1, 2008, between Celanese Corporation and Christopher W. Jensen (incorporated by reference to Exhibit 10.1 to the Quarterly Report on Form 10-Q filed with the SEC on July 23, 2008).
10.11(b)‡ Form of 2010 Change in Control Agreement between Celanese Corporation and participant, together with a schedule of substantially identical agreements between Celanese Corporation and the individuals identified thereon (incorporated by reference to Exhibit 10.7 to the Quarterly Report on Form 10-Q filed with the SEC on July 29, 2010).
10.11(c)‡ Form of Amendment No. 1 to 2010 Form of Change in Control Agreement between Celanese Corporation and participant, together with a schedule of substantially identical agreements between Celanese Corporation and the individuals identified thereon (incorporated by reference to Exhibit 10.5 to the Quarterly Report on Form 10-Q filed with the SEC on October 26, 2011).
10.11(d)‡ Form of 2012 Change in Control Agreement between Celanese Corporation and participant, together with a schedule identifying each of the executive officers with substantially identical agreements (incorporated by reference to Exhibit 10.5 to the Quarterly Report on Form 10-Q filed with the SEC on July 25, 2012).
10.12‡ Form of Long-Term Incentive Claw-Back Agreement between Celanese Corporation and award recipient (incorporated by reference to Exhibit 10.1 to the Current Report on Form 8-K filed with the SEC on January 26, 2009).
10.13*‡ Summary of Non-Employee Director Compensation.
10.16 Share Purchase and Transfer Agreement and Settlement Agreement, dated August 19, 2005 between Celanese Europe Holding GmbH & Co. KG, as purchaser, and Paulson & Co. Inc., and Arnhold and S. Bleichroeder Advisers, LLC, each on behalf of its own and with respect to shares owned by the investment funds and separate accounts managed by it, as the sellers (incorporated by reference to Exhibit 10.30 to the Annual Report on Form 10-K filed with the SEC on February 11, 2011).
10.17 Translation of Letter of Intent, dated November 29, 2006, among Celanese AG, Ticona GmbH and Fraport AG (incorporated by reference to Exhibit 99.2 to the Current Report on Form 8-K filed November 29, 2006).
10.18† Purchase Agreement dated as of December 12, 2006 by and among Celanese Ltd. and certain of its affiliates named therein and Advent Oxo (Cayman) Limited, Oxo Titan US Corporation, Drachenfelssee 520. V V GMBH and Drachenfelssee 521. V V GMBH (incorporated by reference to Exhibit 10.27 to the Annual Report on Form 10-K filed on February 21, 2007).
10.18(a) First Amendment to Purchase Agreement dated February 28, 2007, by and among Advent Oxea Cayman Ltd., Oxea Corporation, Drachenfelssee 520. V V GmbH, Drachenfelssee 521. V V GmbH, Celanese Ltd., Ticona Polymers Inc. and Celanese Chemicals Europe GmbH (incorporated by reference to Exhibit 10.6 to the Quarterly Report on Form 10-Q filed on May 9, 2007).
10.18(b) Second Amendment to Purchase Agreement effective as of July 1, 2007 by and among Advent Oxea Cayman Ltd., Oxea Corporation, Oxea Holdings GmbH, Oxea Deutschland GmbH, Oxea Bishop, LLC, Oxea Japan KK, Oxea UK Ltd., Celanese Ltd., and Celanese Chemicals Europe GmbH (incorporated by reference to Exhibit 10.2 to the Quarterly Report on Form 10-Q filed with the SEC on October 24, 2007).
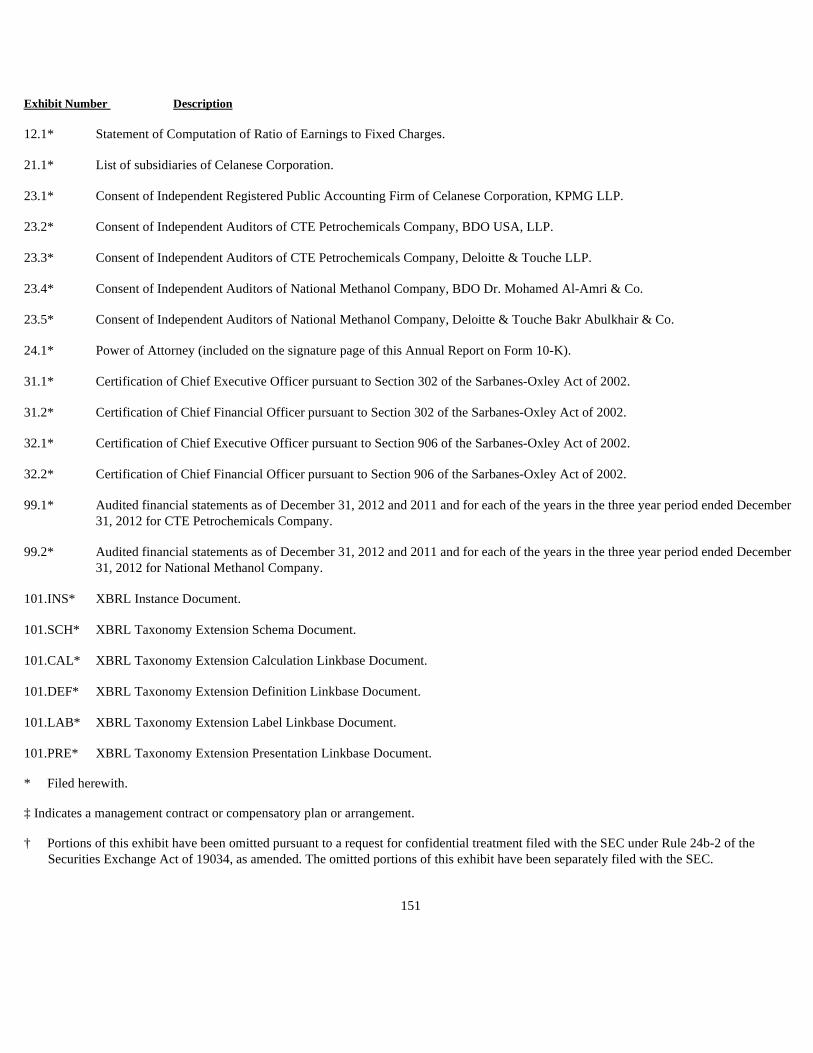
Exhibit Number Description
* Filed herewith.
‡ Indicates a management contract or compensatory plan or arrangement.
† Portions of this exhibit have been omitted pursuant to a request for confidential treatment filed with the SEC under Rule 24b-2 of the Securities Exchange Act of 19034, as amended. The omitted portions of this exhibit have been separately filed with the SEC.
151
12.1* Statement of Computation of Ratio of Earnings to Fixed Charges.
21.1* List of subsidiaries of Celanese Corporation.
23.1* Consent of Independent Registered Public Accounting Firm of Celanese Corporation, KPMG LLP.
23.2* Consent of Independent Auditors of CTE Petrochemicals Company, BDO USA, LLP.
23.3* Consent of Independent Auditors of CTE Petrochemicals Company, Deloitte & Touche LLP.
23.4* Consent of Independent Auditors of National Methanol Company, BDO Dr. Mohamed Al-Amri & Co.
23.5* Consent of Independent Auditors of National Methanol Company, Deloitte & Touche Bakr Abulkhair & Co.
24.1* Power of Attorney (included on the signature page of this Annual Report on Form 10-K).
31.1* Certification of Chief Executive Officer pursuant to Section 302 of the Sarbanes-Oxley Act of 2002.
31.2* Certification of Chief Financial Officer pursuant to Section 302 of the Sarbanes-Oxley Act of 2002.
32.1* Certification of Chief Executive Officer pursuant to Section 906 of the Sarbanes-Oxley Act of 2002.
32.2* Certification of Chief Financial Officer pursuant to Section 906 of the Sarbanes-Oxley Act of 2002.
99.1* Audited financial statements as of December 31, 2012 and 2011 and for each of the years in the three year period ended December 31, 2012 for CTE Petrochemicals Company.
99.2* Audited financial statements as of December 31, 2012 and 2011 and for each of the years in the three year period ended December 31, 2012 for National Methanol Company.
101.INS* XBRL Instance Document.
101.SCH* XBRL Taxonomy Extension Schema Document.
101.CAL* XBRL Taxonomy Extension Calculation Linkbase Document.
101.DEF* XBRL Taxonomy Extension Definition Linkbase Document.
101.LAB* XBRL Taxonomy Extension Label Linkbase Document.
101.PRE* XBRL Taxonomy Extension Presentation Linkbase Document.
Exhibit 10.6(a)
CELANESE CORPORATION 2009 GLOBAL INCENTIVE PLAN
2012 FORM OF TIME-VESTING RESTRICTED STOCK UNIT AWARD AGREEMENT
DATED <<Grant Date>>
<<NAME>>
Pursuant to the terms and conditions of the Celanese Corporation 2009 Global Incentive Plan, you have been awarded Time-Vesting Restricted Stock Units, subject to the restrictions described in this Agreement:
RSU Award
<<Units>> Units
This grant is made pursuant to the Time-Vesting Restricted Stock Unit Award Agreement dated as of <<Grant Date>>, between Celanese and you, which Agreement is attached hereto and made a part hereof.
Page 1
CELANESE CORPORATION 2009 GLOBAL INCENTIVE PLAN
TIME-VESTING RESTRICTED STOCK UNIT AWARD AGREEMENT
This Time-Vesting Restricted Stock Unit Award Agreement (the “Agreement”) is made and entered into as of <<Grant Date>> (the “Grant Date”), by and between Celanese Corporation, a Delaware corporation (the “Company”), and <<NAME>> (the “Participant”). Capitalized terms used, but not otherwise defined, herein shall have the meanings ascribed to such terms in the Celanese Corporation 2009 Global Incentive Plan (as amended from time to time, the “2009 Plan”).
1. Time-Vesting RSU Award : In order to encourage Participant’s contribution to the successful performance of the Company, the Company hereby grants to Participant as of the Grant Date, pursuant to the terms of the 2009 Plan and this Agreement, an award (the “Award”) of time-vesting Restricted Stock Units (“RSUs”) representing the right to receive an equal number of Common Shares upon vesting. The Participant hereby acknowledges and accepts such Award upon the terms and subject to the conditions, restrictions and limitations contained in this Agreement and the 2009 Plan.
2. Time-Based Vesting : Subject to Section 4 and Section 7 of this Agreement, «Number_Units» RSUs shall vest on <<vesting 1>>; «Number_Units» RSUs shall vest on <<vesting 2>>; and «Number_Units» RSUs shall vest on <vesting 3>. Each such date shall be referred to as a “Vesting Date”. Each period between the Grant Date and a Vesting Date shall be referred to as a “Vesting Period”.
3. [Reserved]
4. Effects of Certain Events Prior to Vesting :
(a) Upon the termination of the Participant’s employment by the Company without Cause or due to the Participant’s Retirement, death or Disability, a prorated portion of the RSUs that remain unvested will vest in an amount equal to (i) the unvested RSUs in each Vesting Period multiplied by (ii) a fraction, the numerator of which is the number of complete and partial calendar months from the Grant Date to the date of termination without Cause or due to the Participant’s Retirement, death or Disability, and the denominator of which is the number of complete and partial calendar months in each applicable Vesting Period, such product to be rounded up to the nearest whole number. In any such case , such prorated number of unvested RSUs that vest in accordance with the preceding sentence will be subject to any applicable taxes under Section 8 upon such vesting, , which may be rounded up in each case to avoid fractional shares, and will be settled in accordance with the provisions of Section 5 following the applicable Vesting Date(s).
(b) To the extent permitted by applicable country, state or province law, as consideration for the vesting provisions upon Retirement contained in Section 5(a), upon Retirement, the Participant shall enter into a departure and general release of claims agreement with the Company that includes two-year noncompetition and non-solicitation covenants in a form acceptable to the Company.
(c) The remaining unvested portion of the Award shall be immediately forfeited and cancelled without consideration as of the date of the Participant’s termination of employment without Cause or due to the Participant’s Retirement, death or Disability.
Page 2
(d) Upon the termination of the Participant’s employment for any other reason, the unvested portion of the
Award shall be immediately forfeited and cancelled without consideration as of the date of the Participant’s termination of employment.
5. Settlement of RSUs : Subject to Sections 4, 7 and 8 of this Agreement, the Company shall deliver to the Participant (or to a Company-designated brokerage firm or plan administrator) as soon as administratively practicable following the applicable Vesting Date (but in no event later than 2 ½ months after the applicable Vesting Date), in complete settlement of all RSUs vesting on such Vesting Date, a number of Common Shares equal to the number of RSUs vesting on such Vesting Date.
6. Rights as a Stockholder : The Participant shall have no voting, dividend or other rights as a stockholder with respect to the Award until the RSUs have vested and Common Shares have been delivered pursuant to this Agreement
7. Change in Control; Dissolution :
(a) Notwithstanding any other provision of this Agreement to the contrary, upon the occurrence of a Change in Control with respect to any unvested RSUs granted pursuant to this Agreement that have not previously been forfeited:
(1) If (i) a Participant’s rights to the unvested portion of the Award are not adversely affected in connection with the Change in Control, or, if adversely affected, a substitute award with an equivalent (or greater) economic value and no less favorable vesting conditions is granted to the Participant upon the occurrence of a Change in Control, and (ii) the Participant’s employment is terminated by the Company (or its successor) without Cause within two years following the Change in Control, then the unvested portion of the Award (or, as applicable, the substitute award) shall immediately vest and a number of Common Shares equal to the number of unvested RSUs shall be delivered to the Participant within thirty (30) days following the date of termination, subject to the provisions of Section 8.
(2) If a Participant’s right to the unvested portion of the Award is adversely affected in connection with the Change in Control and a substitute award is not made pursuant to Section 7(a)(1) above, then upon the occurrence of a Change in Control, the unvested portion of the Award shall immediately vest and a number of Common Shares equal to the number of unvested RSUs shall be delivered to the Participant within thirty (30) days following the Change in Control, subject to the provisions of Section 8; and
(b) Notwithstanding any other provision of this Agreement to the contrary, in the event of a corporate dissolution of the Company that is taxed under Section 331 of the Internal Revenue Code of 1986, as amended, then in accordance with Treasury Regulation Section 1.409A-3(j)(4)(ix)(A), this Agreement shall terminate and any RSUs granted pursuant to this Agreement that have not previously been forfeited shall immediately become Common Shares and shall be delivered to the Participant within thirty (30) days following such dissolution.
8. Income and Other Taxes : The Company shall not deliver Common Shares in respect of any RSUs unless and until the Participant has made arrangements satisfactory to the Committee to satisfy applicable withholding tax obligations for US federal, state, and local income taxes (or the foreign counterpart thereof) and applicable employment taxes. Unless otherwise permitted by the Committee, withholding shall be effected at the minimum statutory rates by withholding RSUs in connection with the
Page 3
vesting and/or settlement of RSUs. The Participant acknowledges that the Company shall have the right to deduct any taxes required to be withheld by law in connection with the delivery of Common Shares issued in respect of any vested RSUs from any amounts payable by it to the Participant (including, without limitation, future cash wages). The Participant acknowledges and agrees that amounts withheld by the Company for taxes may be less than amounts actually owed for taxes by the Participant in respect of the Award. Any vested RSUs shall be reflected in the Company’s records as issued on the respective dates of issuance set forth in this Agreement, irrespective of whether delivery of such Common Shares is pending the Participant’s satisfaction of his or her withholding tax obligations.
9. Securities Laws : The Company may impose such restrictions, conditions or limitations as it determines appropriate as to the timing and manner of any resales by the Participant or other subsequent transfers by the Participant of any Common Shares issued as a result of the vesting or settlement of the RSUs, including without limitation (a) restrictions under an insider trading policy, and (b) restrictions as to the use of a specified brokerage firm for such resales or other transfers. Upon the acquisition of any Common Shares pursuant to the vesting or settlement of the RSUs, the Participant will make or enter into such written representations, warranties and agreements as the Company may reasonably request in order to comply with applicable securities laws or with this Agreement and the 2009 Plan. All accounts in which such Common Shares are held or any certificates for Common Shares shall be subject to such stop transfer orders and other restrictions as the Company may deem advisable under the rules, regulations and other requirements of the Securities and Exchange Commission, any stock exchange or quotation system upon which the Common Shares are then listed or quoted, and any applicable federal or state securities law, and the Company may cause a legend or legends to be put on any such certificates (or other appropriate restrictions and/or notations to be associated with any accounts in which such Common Shares are held) to make appropriate reference to such restrictions.
10. Non-Transferability of Award : The RSUs may not be assigned, alienated, pledged, attached, sold or otherwise transferred or encumbered by the Participant other than by will or by the laws of descent and distribution, and any such purported assignment, alienation, pledge, attachment, sale, transfer or encumbrance shall be void and unenforceable against the Company; provided, that the Participant may designate a beneficiary, on a form provided by the Company, to receive any portion of the Award payable hereunder following the Participant’s death.
11. Other Agreements : Subject to Sections 11(a) and 11(b) of this Agreement, this Agreement and the 2009 Plan constitute the entire understanding between the Participant and the Company regarding the Award, and any prior agreements, commitments or negotiations concerning the Award are superseded.
(a) The Participant acknowledges that as a condition to the receipt of the Award, the Participant:
(1) shall have delivered to the Company an executed copy of this Agreement;
(2) shall be subject to the Company’s stock ownership guidelines;
(3) shall be subject to policies and agreements adopted by the Company from time to time, and applicable laws and regulations, requiring the repayment by the Participant of incentive compensation under certain circumstances, without any further act or deed or consent of the Participant; and
(4) shall have delivered to the Company an executed copy of the Long-Term Incentive Claw-Back Agreement (if a current version of such Long-Term Incentive Claw-Back Agreement is not already on file, as determined by the Committee in its sole discretion). For purposes hereof, “Long-Term Incentive Claw-Back Agreement” means
Page 4
an agreement between the Company and the Participant associated with the grant of long-term incentives of the Company, which contains terms, conditions, restrictions and provisions regarding one or more of (i) noncompetition by the Participant with the Company, and its customers and clients; (ii) nonsolicitation and non-hiring by the Participant of the Company’s employees, former employees or consultants; (iii) maintenance of confidentiality of the Company’s and/or clients’ information, including intellectual property; (iv) nondisparagement of the Company; and (v) such other matters deemed necessary, desirable or appropriate by the Company for such an agreement in view of the rights and benefits conveyed in connection with an award.
(b) If the Participant is a non-resident of the U.S., there may be an addendum containing special terms and conditions applicable to awards in the Participant’s country. The issuance of the Award to any such Participant is contingent upon the Participant executing and returning any such addendum in the manner directed by the Company.
12. Not a Contract for Employment; No Acquired Rights; Agreement Changes : Nothing in the 2009 Plan, this Agreement or any other instrument executed in connection with the Award shall confer upon the Participant any right to continue in the Company's employ or service nor limit in any way the Company's right to terminate the Participant's employment at any time for any reason. The grant of RSUs hereunder, and any future grant of awards to the Participant under the 2009 Plan, is entirely voluntary and at the complete and sole discretion of the Company. Neither the grant of these RSUs nor any future grant of awards by the Company shall be deemed to create any obligation to grant any further awards, whether or not such a reservation is expressly stated at the time of such grants. The Company has the right, at any time and for any reason, to amend, suspend or terminate the 2009 Plan; provided, however, that no such amendment, suspension, or termination shall adversely affect the Participant’s rights hereunder.
13. Severability : In the event that any provision of this Agreement is declared to be illegal, invalid or otherwise unenforceable by a court of competent jurisdiction, such provision shall be reformed, if possible, to the extent necessary to render it legal, valid and enforceable, or otherwise deleted, and the remainder of this Agreement shall not be affected except to the extent necessary to reform or delete such illegal, invalid or unenforceable provision.
14. Further Assurances : Each party shall cooperate and take such action as may be reasonably requested by either party hereto in order to carry out the provisions and purposes of this Agreement.
15. Binding Effect : The Award and this Agreement shall inure to the benefit of and be binding upon the parties hereto and their respective permitted heirs, beneficiaries, successors and assigns.
16. Electronic Delivery : By executing this Agreement, the Participant hereby consents to the delivery of any and all information (including, without limitation, information required to be delivered to the Participant pursuant to applicable securities laws), in whole or in part, regarding the Company and its subsidiaries, the 2009 Plan, and the Award via electronic mail, the Company’s or a plan administrator’s web site, or other means of electronic delivery.
17. Personal Data : By accepting the Award under this Agreement, the Participant hereby consents to the Company’s use, dissemination and disclosure of any information pertaining to the Participant that the Company determines to be necessary or desirable for the implementation, administration and management of the 2009 Plan.
Page 5
18. Governing Law : The Award and this Agreement shall be interpreted and construed in accordance with the laws of
the state of Delaware and applicable federal law.
19. Restricted Stock Units Subject to Plan : By entering into this Agreement the Participant agrees and acknowledges that the Participant has received and read a copy of the 2009 Plan and the 2009 Plan's prospectus. The RSUs and the Common Shares issued upon vesting of such RSUs are subject to the 2009 Plan, which is hereby incorporated by reference. In the event of any conflict between any term or provision of this Agreement and a term or provision of the 2009 Plan, the applicable terms and provisions of the 2009 Plan shall govern and prevail.
20. Validity of Agreement : This Agreement shall be valid, binding and effective upon the Company on the Grant Date. However, the RSUs granted pursuant to this Agreement shall be forfeited by the Participant and this Agreement shall have no force and effect if it is not duly executed by the Participant and delivered to the Company on or before <<Validity Date>>.
21. Headings : The headings preceding the text of the sections hereof are inserted solely for convenience of reference, and shall not constitute a part of this Agreement, nor shall they affect its meaning, construction or effect.
22. Compliance with Section 409A of the Internal Revenue Code : Notwithstanding any provision in this Agreement to the contrary, this Agreement will be interpreted and applied so that the Agreement does not fail to meet, and is operated in accordance with, the requirements of Section 409A of the Internal Revenue Code of 1986, as amended, and the regulations thereunder. The Company reserves the right to change the terms of this Agreement and the 2009 Plan without the Participant’s consent to the extent necessary or desirable to comply with the requirements of Internal Revenue Code Section 409A, the Treasury regulations and other guidance thereunder. Further, in accordance with the restrictions provided by Treasury Regulation Section 1.409A-3(j)(2), any subsequent amendments to this Agreement or any other agreement, or the entering into or termination of any other agreement, affecting the RSUs provided by this Agreement shall not modify the time or form of issuance of the RSUs set forth in this Agreement. In addition, if the Participant is a “specified employee” within the meaning of Section 409A, as determined by the Company, any payment made in connection with the Participant’s separation from service shall not be made earlier than six (6) months and one day after the date of such separation from service to the extent required by Section 409A.
23. Definitions : The following terms shall have the following meanings for purposes of this Agreement, notwithstanding any contrary definition in the 2009 Plan:
(a) “ Cause ” means (i) the Participant's willful failure to perform the Participant's duties to the Company (other than as a result of total or partial incapacity due to physical or mental illness) for a period of 30 days following written notice by the Company to Participant of such failure, (ii) conviction of, or a plea of nolo contendere to, (x) a felony under the laws of the United States or any state thereof or any similar criminal act in a jurisdiction outside the United States or (y) a crime involving moral turpitude, (iii) the Participant's willful malfeasance or willful misconduct which is demonstrably injurious to the Company or its affiliates, (iv) any act of fraud by the Participant, (v) any material violation of the Company's business conduct policy, (vi) any material violation of the Company's policies concerning harassment or discrimination, (vii) the Participant's conduct that causes material harm to the business reputation of the Company or its affiliates, or (viii) the Participant's breach of any confidentiality, intellectual property, non-competition or non-solicitation provisions applicable to the Participant under the Long-Term Incentive Claw-Back Agreement or any other agreement between the Participant and the Company.
Page 6
(b) “ Change in Control ” of the Company shall mean, in accordance with Treasury Regulation Section 1.409A-
3(i)(5), any of the following:
(i) any one person, or more than one person acting as a group, acquires ownership of stock of the Company that, together with stock held by such person or group, constitutes more than 50% of the total voting power of the stock of the Company; or
(ii) a majority of members of the Board is replaced during any 12-month period by directors whose appointment or election is not endorsed by a majority of the members of the Board prior to the date of the appointment or election; or
(iii) any one person, or more than one person acting as a group, acquires (or has acquired during the 12-month period ending on the date of the most recent acquisition by such person or persons) assets from the Company that have a total gross fair market value equal to 50% or more of all of the assets of the Company immediately prior to such acquisition or acquisitions.
(c) “ Disability ” has the same meaning as “Disability” in the Celanese Corporation 2008 Deferred Compensation Plan or such other meaning as determined by the Committee in its sole discretion, provided that in all events a “Disability” under this Agreement shall constitute a “disability” within the meaning of Treasury Regulation Section 1.409A-3(i)(4).
(d) “ Retirement ” of the Participant shall mean a voluntary separation from service on or after the date when the Participant is both 55 years of age and has ten years of service with the Company, as determined by the Company in its discretion based on payroll records. Retirement shall not include voluntary separation from service in which the Company could have terminated the Participant’s employment for Cause.
[signature page follows]
Page 7
IN WITNESS WHEREOF, the Company has caused this Agreement to be executed on its behalf by its duly authorized
officer and the Participant has also executed this Agreement in duplicate.
This Agreement has been accepted and agreed to by the undersigned Participant.
Page 8
CELANESE CORPORATION
By:
Chairman and Chief Executive Officer
PARTICIPANT
By:
Name: <<NAME>>
Employee ID: <<Personnel Number>>
Date:
Exhibit 10.6(b)
CELANESE CORPORATION 2009 GLOBAL INCENTIVE PLAN
2012 FORM OF NONQUALIFIED STOCK OPTION AWARD AGREEMENT
DATED <<Grant Date>>
<<NAME>>
Pursuant to the terms and conditions of the Celanese Corporation 2009 Global Incentive Plan, you have been awarded Nonqualified Stock Options with respect to Celanese Common Stock, subject to the restrictions described in this Agreement:
Stock Option Award
<<# Shares>> Shares
This grant is made pursuant to the Nonqualified Stock Option Award Agreement dated as of <<Grant Date>>, between Celanese and you, which Agreement is attached hereto and made a part hereof.
Page 1
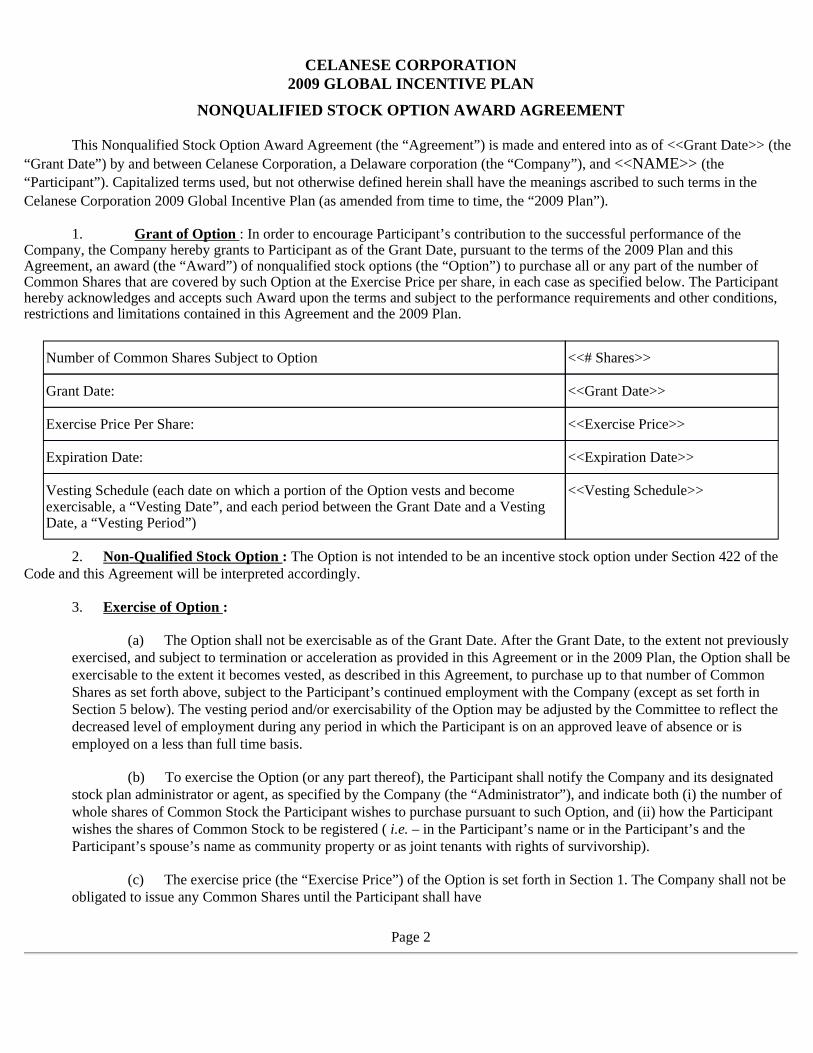
CELANESE CORPORATION 2009 GLOBAL INCENTIVE PLAN
NONQUALIFIED STOCK OPTION AWARD AGREEMENT
This Nonqualified Stock Option Award Agreement (the “Agreement”) is made and entered into as of <<Grant Date>> (the “Grant Date”) by and between Celanese Corporation, a Delaware corporation (the “Company”), and <<NAME>> (the “Participant”). Capitalized terms used, but not otherwise defined herein shall have the meanings ascribed to such terms in the Celanese Corporation 2009 Global Incentive Plan (as amended from time to time, the “2009 Plan”).
1. Grant of Option : In order to encourage Participant’s contribution to the successful performance of the Company, the Company hereby grants to Participant as of the Grant Date, pursuant to the terms of the 2009 Plan and this Agreement, an award (the “Award”) of nonqualified stock options (the “Option”) to purchase all or any part of the number of Common Shares that are covered by such Option at the Exercise Price per share, in each case as specified below. The Participant hereby acknowledges and accepts such Award upon the terms and subject to the performance requirements and other conditions, restrictions and limitations contained in this Agreement and the 2009 Plan.
2. Non-Qualified Stock Option : The Option is not intended to be an incentive stock option under Section 422 of the Code and this Agreement will be interpreted accordingly.
3. Exercise of Option :
(a) The Option shall not be exercisable as of the Grant Date. After the Grant Date, to the extent not previously exercised, and subject to termination or acceleration as provided in this Agreement or in the 2009 Plan, the Option shall be exercisable to the extent it becomes vested, as described in this Agreement, to purchase up to that number of Common Shares as set forth above, subject to the Participant’s continued employment with the Company (except as set forth in Section 5 below). The vesting period and/or exercisability of the Option may be adjusted by the Committee to reflect the decreased level of employment during any period in which the Participant is on an approved leave of absence or is employed on a less than full time basis.
(b) To exercise the Option (or any part thereof), the Participant shall notify the Company and its designated stock plan administrator or agent, as specified by the Company (the “Administrator”), and indicate both (i) the number of whole shares of Common Stock the Participant wishes to purchase pursuant to such Option, and (ii) how the Participant wishes the shares of Common Stock to be registered ( i.e. – in the Participant’s name or in the Participant’s and the Participant’s spouse’s name as community property or as joint tenants with rights of survivorship).
(c) The exercise price (the “Exercise Price”) of the Option is set forth in Section 1. The Company shall not be obligated to issue any Common Shares until the Participant shall have
Page 2
Number of Common Shares Subject to Option <<# Shares>>
Grant Date: <<Grant Date>>
Exercise Price Per Share: <<Exercise Price>>
Expiration Date: <<Expiration Date>>
Vesting Schedule (each date on which a portion of the Option vests and become exercisable, a “Vesting Date”, and each period between the Grant Date and a Vesting Date, a “Vesting Period”)
<<Vesting Schedule>>
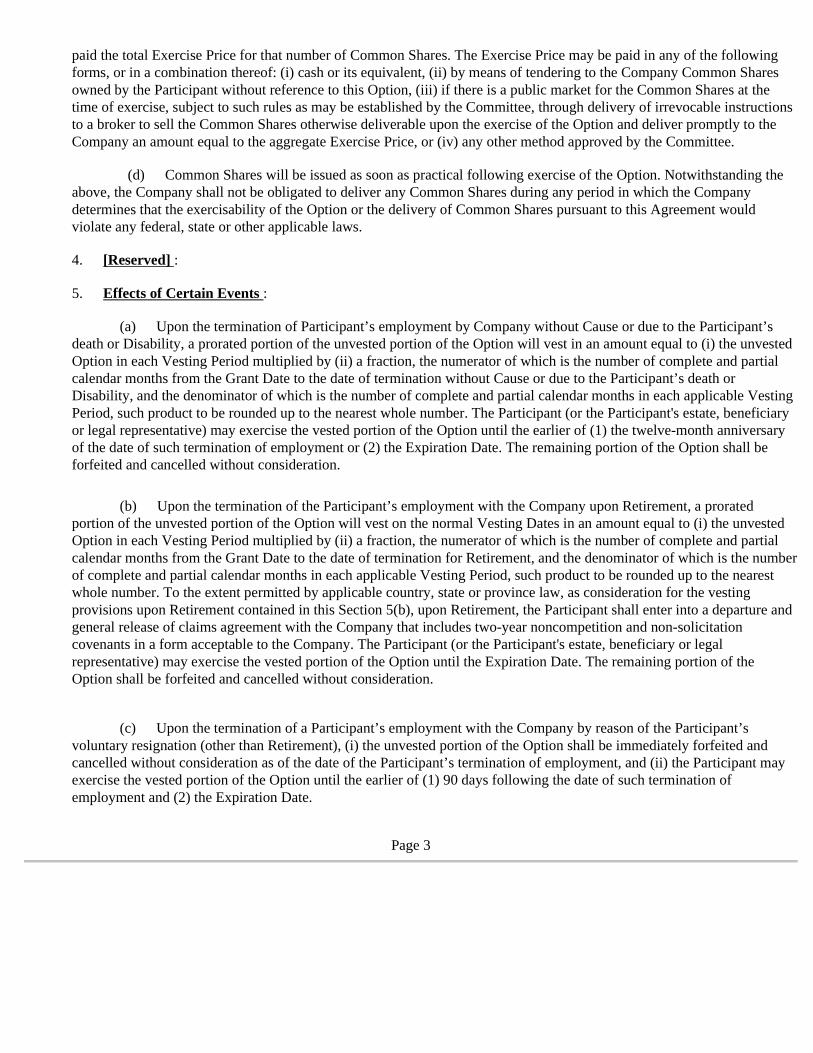
paid the total Exercise Price for that number of Common Shares. The Exercise Price may be paid in any of the following forms, or in a combination thereof: (i) cash or its equivalent, (ii) by means of tendering to the Company Common Shares owned by the Participant without reference to this Option, (iii) if there is a public market for the Common Shares at the time of exercise, subject to such rules as may be established by the Committee, through delivery of irrevocable instructions to a broker to sell the Common Shares otherwise deliverable upon the exercise of the Option and deliver promptly to the Company an amount equal to the aggregate Exercise Price, or (iv) any other method approved by the Committee.
(d) Common Shares will be issued as soon as practical following exercise of the Option. Notwithstanding the above, the Company shall not be obligated to deliver any Common Shares during any period in which the Company determines that the exercisability of the Option or the delivery of Common Shares pursuant to this Agreement would violate any federal, state or other applicable laws.
4. [Reserved] :
5. Effects of Certain Events :
(a) Upon the termination of Participant’s employment by Company without Cause or due to the Participant’s death or Disability, a prorated portion of the unvested portion of the Option will vest in an amount equal to (i) the unvested Option in each Vesting Period multiplied by (ii) a fraction, the numerator of which is the number of complete and partial calendar months from the Grant Date to the date of termination without Cause or due to the Participant’s death or Disability, and the denominator of which is the number of complete and partial calendar months in each applicable Vesting Period, such product to be rounded up to the nearest whole number. The Participant (or the Participant's estate, beneficiary or legal representative) may exercise the vested portion of the Option until the earlier of (1) the twelve-month anniversary of the date of such termination of employment or (2) the Expiration Date. The remaining portion of the Option shall be forfeited and cancelled without consideration.
(b) Upon the termination of the Participant’s employment with the Company upon Retirement, a prorated portion of the unvested portion of the Option will vest on the normal Vesting Dates in an amount equal to (i) the unvested Option in each Vesting Period multiplied by (ii) a fraction, the numerator of which is the number of complete and partial calendar months from the Grant Date to the date of termination for Retirement, and the denominator of which is the number of complete and partial calendar months in each applicable Vesting Period, such product to be rounded up to the nearest whole number. To the extent permitted by applicable country, state or province law, as consideration for the vesting provisions upon Retirement contained in this Section 5(b), upon Retirement, the Participant shall enter into a departure and general release of claims agreement with the Company that includes two-year noncompetition and non-solicitation covenants in a form acceptable to the Company. The Participant (or the Participant's estate, beneficiary or legal representative) may exercise the vested portion of the Option until the Expiration Date. The remaining portion of the Option shall be forfeited and cancelled without consideration.
(c) Upon the termination of a Participant’s employment with the Company by reason of the Participant’s voluntary resignation (other than Retirement), (i) the unvested portion of the Option shall be immediately forfeited and cancelled without consideration as of the date of the Participant’s termination of employment, and (ii) the Participant may exercise the vested portion of the Option until the earlier of (1) 90 days following the date of such termination of employment and (2) the Expiration Date.
Page 3
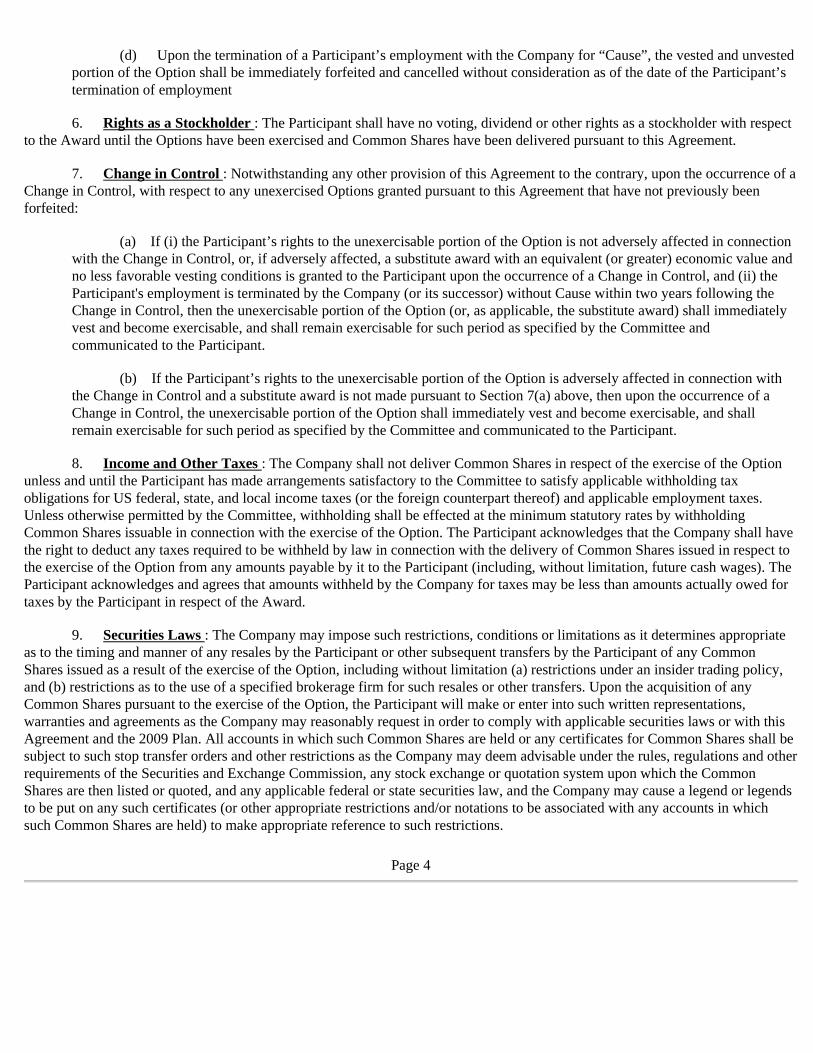
(d) Upon the termination of a Participant’s employment with the Company for “Cause”, the vested and unvested portion of the Option shall be immediately forfeited and cancelled without consideration as of the date of the Participant’s termination of employment
6. Rights as a Stockholder : The Participant shall have no voting, dividend or other rights as a stockholder with respect to the Award until the Options have been exercised and Common Shares have been delivered pursuant to this Agreement.
7. Change in Control : Notwithstanding any other provision of this Agreement to the contrary, upon the occurrence of a Change in Control, with respect to any unexercised Options granted pursuant to this Agreement that have not previously been forfeited:
(a) If (i) the Participant’s rights to the unexercisable portion of the Option is not adversely affected in connection with the Change in Control, or, if adversely affected, a substitute award with an equivalent (or greater) economic value and no less favorable vesting conditions is granted to the Participant upon the occurrence of a Change in Control, and (ii) the Participant's employment is terminated by the Company (or its successor) without Cause within two years following the Change in Control, then the unexercisable portion of the Option (or, as applicable, the substitute award) shall immediately vest and become exercisable, and shall remain exercisable for such period as specified by the Committee and communicated to the Participant.
(b) If the Participant’s rights to the unexercisable portion of the Option is adversely affected in connection with the Change in Control and a substitute award is not made pursuant to Section 7(a) above, then upon the occurrence of a Change in Control, the unexercisable portion of the Option shall immediately vest and become exercisable, and shall remain exercisable for such period as specified by the Committee and communicated to the Participant.
8. Income and Other Taxes : The Company shall not deliver Common Shares in respect of the exercise of the Option unless and until the Participant has made arrangements satisfactory to the Committee to satisfy applicable withholding tax obligations for US federal, state, and local income taxes (or the foreign counterpart thereof) and applicable employment taxes. Unless otherwise permitted by the Committee, withholding shall be effected at the minimum statutory rates by withholding Common Shares issuable in connection with the exercise of the Option. The Participant acknowledges that the Company shall have the right to deduct any taxes required to be withheld by law in connection with the delivery of Common Shares issued in respect to the exercise of the Option from any amounts payable by it to the Participant (including, without limitation, future cash wages). The Participant acknowledges and agrees that amounts withheld by the Company for taxes may be less than amounts actually owed for taxes by the Participant in respect of the Award.
9. Securities Laws : The Company may impose such restrictions, conditions or limitations as it determines appropriate as to the timing and manner of any resales by the Participant or other subsequent transfers by the Participant of any Common Shares issued as a result of the exercise of the Option, including without limitation (a) restrictions under an insider trading policy, and (b) restrictions as to the use of a specified brokerage firm for such resales or other transfers. Upon the acquisition of any Common Shares pursuant to the exercise of the Option, the Participant will make or enter into such written representations, warranties and agreements as the Company may reasonably request in order to comply with applicable securities laws or with this Agreement and the 2009 Plan. All accounts in which such Common Shares are held or any certificates for Common Shares shall be subject to such stop transfer orders and other restrictions as the Company may deem advisable under the rules, regulations and other requirements of the Securities and Exchange Commission, any stock exchange or quotation system upon which the Common Shares are then listed or quoted, and any applicable federal or state securities law, and the Company may cause a legend or legends to be put on any such certificates (or other appropriate restrictions and/or notations to be associated with any accounts in which such Common Shares are held) to make appropriate reference to such restrictions.
Page 4
10. Non-Transferability of Award : The Option may not be assigned, alienated, pledged, attached, sold or otherwise transferred or encumbered by the Participant otherwise than by will or by the laws of descent and distribution, and any such purported assignment, alienation, pledge, attachment, sale, transfer or encumbrance shall be void and unenforceable against the Company; provided, that the Participant may designate a beneficiary, on a form provided by the Company, to receive any portion of the Award payable hereunder following the Participant’s death.
11. Other Agreements : Subject to Sections 11(a) and 11(b) of this Agreement, this Agreement and the 2009 Plan constitute the entire understanding between the Participant and the Company regarding the Award, and any prior agreements, commitments or negotiations concerning the Award are superseded.
(a) The Participant acknowledges that as a condition to the receipt of the Award, the Participant:
(1) shall have delivered to the Company an executed copy of this Agreement;
(2) shall be subject to the Company’s stock ownership guidelines;
(3) shall be subject to policies and agreements adopted by the Company from time to time, and applicable laws and regulations, requiring the repayment by the Participant of incentive compensation under certain circumstances, without any further act or deed or consent of the Participant; and
(4) shall have delivered to the Company an executed copy of the Long-Term Incentive Claw-Back Agreement (if a current version of such Long-Term Incentive Claw-Back Agreement is not already on file, as determined by the Committee in its sole discretion). For purposes hereof, “Long-Term Incentive Claw-Back Agreement” means an agreement between the Company and the Participant associated with the grant of long-term incentives of the Company, which contains terms, conditions, restrictions and provisions regarding one or more of (i) noncompetition by the Participant with the Company, and its customers and clients; (ii) nonsolicitation and non-hiring by the Participant of the Company’s employees, former employees or consultants; (iii) maintenance of confidentiality of the Company’s and/or clients’ information, including intellectual property; (iv) nondisparagement of the Company; and (v) such other matters deemed necessary, desirable or appropriate by the Company for such an agreement in view of the rights and benefits conveyed in connection with an award.
(b) If the Participant is a non-resident of the U.S., there may be an addendum containing special terms and conditions applicable to awards in the Participant’s country. The issuance of the Award to any such Participant is contingent upon the Participant executing and returning any such addendum in the manner directed by the Company.
12. Not a Contract for Employment; No Acquired Rights : Nothing in the 2009 Plan, this Agreement or any other instrument executed in connection with the Award shall confer upon the Participant any right to continue in the Company's employ or service nor limit in any way the Company's right to terminate the Participant's employment at any time for any reason. The grant of Options hereunder, and any future grant of awards to the Participant under the 2009 Plan, is entirely voluntary and at the complete and sole discretion of the Company. Neither the grant of these Options nor any future grant of awards by the Company shall be deemed to create any obligation to grant any further awards, whether or not such a reservation is expressly stated at the time of such grants. The Company has the right, at any time and for any reason, to amend, suspend or terminate the 2009 Plan; provided, however, that no such amendment, suspension, or termination shall adversely affect the Participant’s rights hereunder.
Page 5
13. Severability : In the event that any provision of this Agreement is declared to be illegal, invalid or otherwise unenforceable by a court of competent jurisdiction, such provision shall be reformed, if possible, to the extent necessary to render it legal, valid and enforceable, or otherwise deleted, and the remainder of this Agreement shall not be affected except to the extent necessary to reform or delete such illegal, invalid or unenforceable provision.
14. Further Assurances : Each party shall cooperate and take such action as may be reasonably requested by either party hereto in order to carry out the provisions and purposes of this Agreement.
15. Binding Effect : The Award and this Agreement shall inure to the benefit of and be binding upon the parties hereto and their respective permitted heirs, beneficiaries, successors and assigns.
16. Electronic Delivery : By executing this Agreement, the Participant hereby consents to the delivery of any and all information (including, without limitation, information required to be delivered to the Participant pursuant to applicable securities laws), in whole or in part, regarding the Company and its subsidiaries, the 2009 Plan, and the Award via electronic mail, the Company’s or a plan administrator’s web site, or other means of electronic delivery.
17. Personal Data : By accepting the Award under this Agreement, the Participant hereby consents to the Company’s use, dissemination and disclosure of any information pertaining to the Participant that the Company determines to be necessary or desirable for the implementation, administration and management of the 2009 Plan.
18. Governing Law : The Award and this Agreement shall be interpreted and construed in accordance with the laws of the state of Delaware and applicable federal law.
19. Option Subject to Plan : By entering into this Agreement the Participant agrees and acknowledges that the Participant has received and read a copy of the 2009 Plan and the 2009 Plan's prospectus. The Option and the Common Shares issued upon exercise of such Option are subject to the 2009 Plan, which is hereby incorporated by reference. In the event of any conflict between any term or provision of this Agreement and a term or provision of the 2009 Plan, the applicable terms and provisions of the 2009 Plan shall govern and prevail.
20. Validity of Agreement : This Agreement shall be valid, binding and effective upon the Company on the Grant Date. However, the Option granted pursuant to this Agreement shall be forfeited by the Participant and this Agreement shall have no force and effect if it is not duly executed by the Participant and delivered to the Company on or before <<Validity Date>>.
21. Headings : The headings preceding the text of the sections hereof are inserted solely for convenience of reference, and shall not constitute a part of this Agreement, nor shall they affect its meaning, construction or effect.
22. Definitions : The following terms shall have the following meanings for purposes of this Agreement, notwithstanding any contrary definition in the Plan:
(a) “ Cause ” means (i) the Participant's willful failure to perform the Participant's duties to the Company (other than as a result of total or partial incapacity due to physical or mental illness) for a period of 30 days following written notice by the Company to Participant of such failure, (ii) conviction of, or a plea of nolo contendere to, (x) a felony under the laws of the United States or any state thereof or any similar criminal act in a jurisdiction outside the United States or (y) a crime involving moral turpitude, (iii) the Participant's willful malfeasance or willful misconduct which is demonstrably injurious to the Company or its affiliates, (iv) any act of fraud by the Participant, (v) any material violation of the Company's business conduct policy, (vi) any material violation of the Company's policies concerning harassment or discrimination, (vii) the Participant's conduct that causes material harm to the business reputation of the
Page 6
Company or its affiliates, or (viii) the Participant's breach of any confidentiality, intellectual property, non-competition or non-solicitation applicable to the Participant under the Long-Term Incentive Claw-Back Agreement or any other agreement between the Participant and the Company.
(b) “ Change in Control ” of the Company shall mean, in accordance with Treasury Regulation Section 1.409A-3(i)(5), any of the following:
(i) any one person, or more than one person acting as a group, acquires ownership of stock of the Company that, together with stock held by such person or group, constitutes more than 50% of the total voting power of the stock of the Company; or
(ii) a majority of members of the Board is replaced during any 12-month period by directors whose appointment or election is not endorsed by a majority of the members of the Board prior to the date of the appointment or election; or
(iii) any one person, or more than one person acting as a group, acquires (or has acquired during the 12-month period ending on the date of the most recent acquisition by such person or persons) assets from the Company that have a total gross fair market value equal to 50% or more of all of the assets of the Company immediately prior to such acquisition or acquisitions.
(c) “ Disability ” has the same meaning as “Disability” in the Celanese Corporation 2008 Deferred Compensation Plan or such other meaning as determined by the Committee in its sole discretion.
(d) “ Retirement ” of the Participant shall mean a voluntary separation from service on or after the date when the Participant is both 55 years of age and has ten years of service with the Company, as determined by the Company in its discretion based on payroll records. Retirement shall not include voluntary separation from service in which the Company could have terminated the Participant's employment for Cause.
[signature page follows]
Page 7
IN WITNESS WHEREOF, the Company has caused this Agreement to be executed on its behalf by its duly authorized officer and the Participant has also executed this Agreement in duplicate.
This Agreement has been accepted and agreed to by the undersigned Participant.
Page 8
CELANESE CORPORATION
By:
Chairman and Chief Executive Officer
PARTICIPANT
By:
Name: <<NAME>>
Employee ID: <<Personnel Number>>
Date:
Exhibit 10.10(e)
AGREEMENT AND GENERAL RELEASE
Celanese Corporation, its’ subsidiaries and its affiliates, (“ Company ”), 222 W. Las Colinas Blvd., Irving, Texas
75039 and Jacquelyn H. Wolf , her heirs, executors, administrators, successors, and assigns (“ Employee ”), agree that:
1. Last Day of Employment . The last day of employment with the Company is: November 2, 2012 (Separation Date). Last day in the office is: July 31, 2012. Unless otherwise expressly agreed to by the Company, if
Employee voluntarily resigns before the Separation Date, she shall immediately be removed from the payroll
and forfeit all rights to the Consideration set forth in Paragraph “2” below. In order to remain on the payroll until
the aforementioned date and receive the Consideration set forth in Paragraph “2” below, Employee shall comply
with all Company policies and procedures and perform her duties faithfully, to the best of her ability and to the
satisfaction of the Company while devoting her full business efforts and time to the Company and to the
promotion of its business up to July 31, 2012 and thereafter as needed, including but not limited to: work on
projects assigned to her by the Chairman and CEO and assistance with transition duties.
2. Consideration . Each separate installment under this Agreement shall be treated as a separate payment for
purposes of determining whether such payment is subject to or exempt from compliance with the requirements
of Section 409A of the Internal Revenue Code. In consideration for signing this Agreement and compliance with
the promises made herein, Company and Employee agree:
a. Voluntary Resignation . Employee agrees to voluntarily resign from the Company effective on the
Separation Date. Effective as of the close of business on such Separation Date, Employee will resign from all
positions she holds as a corporate officer of the Company (including without limitation any positions as an
officer, employee and/or director), and from all positions held on behalf of the Company (e.g., external board
memberships, internal committee positions). Employee will execute, in writing a voluntary resignation letter
as a condition of this Agreement using the format set forth at Exhibit A.
b. Separation Pay . The Company will pay an amount equal to her current annual base salary ($415,000.00 ), plus target bonus ($290,500.00), for a total payment of
$705,500.00 , less any lawful deductions. Such amount shall be paid in installments. The first installment in the amount of $352,750.00 (representing 50% of the total payment)
shall be paid on the first available pay period after the Separation Date (November 16, 2012), if the Employee
has previously signed and returned this Agreement and the letter enclosed at Exhibit B. If Employee signs
and returns the Agreement after the Separation Date, payment will be made on the first available pay period,
seven (7) days after Employee signs and returns this Agreement and the letter enclosed at Exhibit B.
The remaining $352,750.00 will be paid in three (3) substantially equal bi-weekly installments that begin on
the second available pay period (November 30, 2012), as long as the Employee has previously signed and
returned this Agreement and the letter enclosed at Exhibit B. Otherwise, the payments will commence in
three (3) substantially equal bi-weekly installments that begin on the second pay period, after the Separation
Date and after Employee signs and returns this Agreement and the letter enclosed at Exhibit B.
– 2 –
c. Bonus . Employee will be eligible to receive a pro-rata bonus payout based on the number of full months of
service completed in 2012, up to the Separation Date. Bonus payout will be based on the annual bonus for
a salary level 2 (SL 2); which is 70% of Employee’s annual base salary times the Employee’s personal
modifier of a 1.0, modified for Company performance. The 2012 bonus payout will be paid to the
Employee during the 2013 calendar year, but in no event later than March 15, 2013.
d. Long-Term Equity and Cash Awards . The Company will fulfill its obligations to Employee pursuant to the
terms of the signed equity award agreements and offer letter dated November 19, 2009. The Company
and Employee agree that the total equity awards, for which the Employee is eligible, are set forth at
Exhibit C.
e. Pension and 401(k) Plan Vesting . If Employee is eligible, the Company will fulfill its obligations according
to the terms of the respective Plans.
f. Unused Vacation . The Company will pay to Employee wages for any unused vacation for 2012 and any
approved vacation carried over from 2011 under the standard procedure for calculating and paying any
unused vacation to separated employees. The gross amount due to Employee, less any lawful deductions,
will be payable within 30 days of the Separation Date ; subject to the Employee providing the details of
any vacation days utilized during 2011 and 2012 through the exit interview process.
g. Company Benefit Plans . Healthcare & dental plan coverage based on Employee’s current health & dental
plan elections will continue until October 31, 2012. All other
normal Company programs (e.g., life insurance, long term disability, 401(k) contributions, etc.) will continue through the Separation Date.
– 3 –
h. COBRA Reimbursement . If Employee applies for COBRA benefits, the Company will pay medical and
dental coverage via COBRA for twelve (12 ) months beyond the month of separation. Thereafter,
Employee shall be entitled to elect to continue such COBRA coverage for an additional six (6) months,
the remainder of the COBRA period, at her expense.
i. Outplacement Services . The Employer will pay for outplacement services by the Company’s preferred
provider for three (3) months , available seven (7) days after signing the Release.
j. Return of Company Property . Employee will surrender to Company, on her last day in the office (July 31,
2012), all Company materials, including, but not limited to her Company laptop computer, phone, credit
card, calling cards, etc. Employee will be responsible for resolving any outstanding balances on the
Company credit card.
k. Withholding . The payments and other benefits provided under this Agreement shall be reduced by
applicable withholding taxes and other lawful deductions.
3. No Consideration Absent Execution of this Agreement . Employee understands and agrees that she would not
receive the monies and/or benefits specified in Paragraph 2 above, unless Employee signs this Agreement on the
signature page without having revoked this Agreement pursuant to Paragraph 13 below and the fulfillment of the
promises contained herein.
4. General Release of Claims . Employee knowingly and voluntarily releases and forever discharges, to the full
extent permitted by law, in all countries, including but not limited to the U.S., the People’s Republic of China
(PRC), U.K. and Germany, the Company, its parent corporation, affiliates, subsidiaries, divisions, predecessors,
successors and assigns and the current and former employees, officers, directors and agents thereof (collectively
referred to throughout the remainder of this Agreement as “ Company ”), of and from any and all claims, known
and unknown, asserted and unasserted, Employee has or may have against Company as of the date of execution
of this Agreement, including, but not limited to, any alleged violation of:
• Title VII of the Civil Rights Act of 1964, as amended; • The Civil Rights Act of 1991; • Sections 1981 through 1988 of Title 42 of the United States Code, as amended; • The Employee Retirement Income Security Act of 1974, as amended;
Affirmations . Employee affirms that she has not filed, caused to be filed, or presently is a party to any claim,
complaint, or action against Company in any forum or form. Provided, however, that the foregoing does not
affect any right to file an administrative charge with the Equal Employment Opportunity Commission
(“EEOC”), or a charge or complaint under the Wall Street Reform Act of 2010, subject to the restriction that if
any such charge or complaint is filed, Employee agrees not to violate the confidentiality provisions of this
Agreement and Employee further agrees and covenants that should she or any other person, organization, or
other entity file, charge, claim, sue or cause or permit to be filed any charge or claim with the EEOC, the
Securities and Exchange Commission (SEC), any other governmental body, civil action, suit or legal proceeding
against the Company involving any matter occurring at any time in the past, Employee will not seek or accept
any personal relief (including, but not limited to, monetary award, recovery, relief or settlement) in such charge,
civil action, suit or proceeding.
Employee further affirms that she has reported all hours worked as of the date of this release and has been paid
and/or has received all leave (paid or unpaid), compensation, wages, bonuses, commissions, and/or benefits to
which she may be entitled and that no other leave (paid or unpaid), compensation, wages, bonuses, commissions
and/or benefits are due to him, except as provided in this Agreement. Employee furthermore affirms that she has
no known workplace injuries or occupational diseases and has been provided and/or has not been denied any
leave requested under the Family Medical Leave Act.
– 4 –
• The Immigration Reform and Control Act, as amended; • The Americans with Disabilities Act of 1990, as amended; • The Age Discrimination in Employment Act of 1967, as amended; • The Workers Adjustment and Retraining Notification Act, as amended; • The Occupational Safety and Health Act, as amended; • The Sarbanes-Oxley Act of 2002; • The Wall Street Reform Act of 2010 (Dodd Frank); • The Family Medical Leave Act of 1993 (FMLA); • The Texas Civil Rights Act, as amended; • The Texas Minimum Wage Law, as amended; • Equal Pay Law for Texas, as amended; • Any other federal, state or local civil or human rights law, or any other local, state or federal law, regulation
or ordinance including but not limited to the State of Texas; or any law, regulation or ordinance of a foreign country, including but not limited to the PRC, Federal Republic of Germany and the UK.
• Any public policy, contract, tort, or common law; • The employment, labor and benefits laws and regulations in all countries in addition to the U.S. including but
not limited to the U.K. and Germany; • Any claim for costs, fees, or other expenses including attorneys’ fees incurred in these matters.
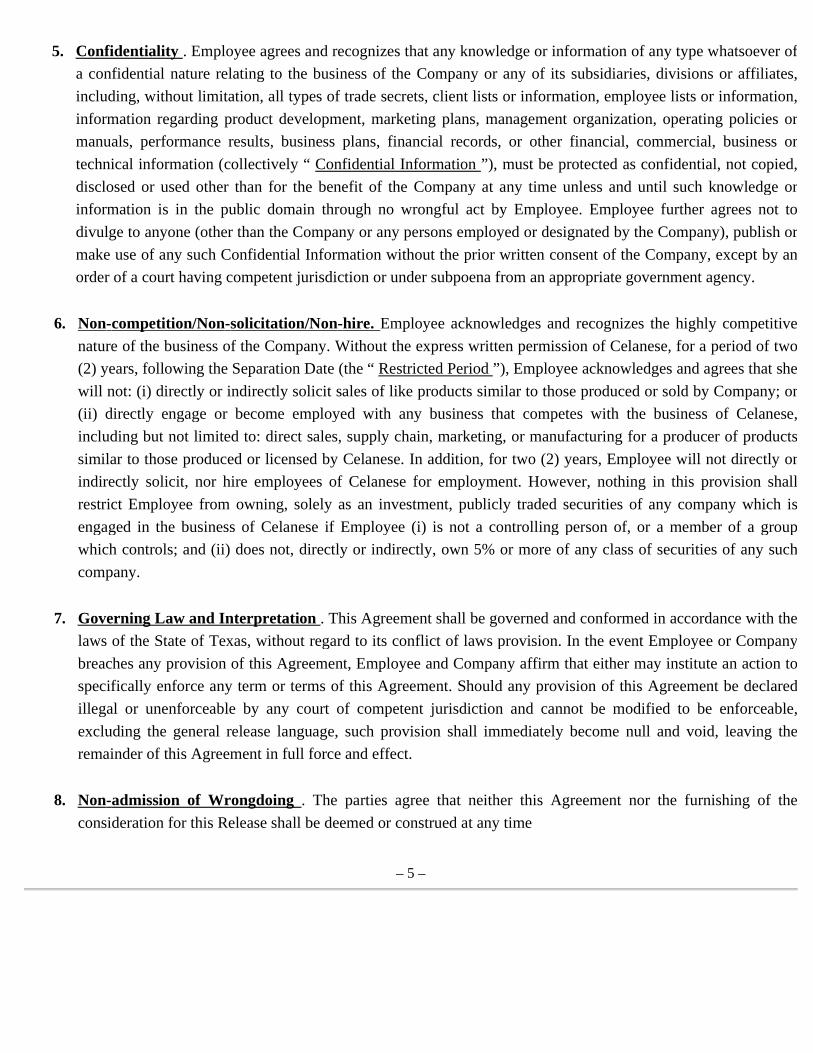
– 5 –
5. Confidentiality . Employee agrees and recognizes that any knowledge or information of any type whatsoever of
a confidential nature relating to the business of the Company or any of its subsidiaries, divisions or affiliates,
including, without limitation, all types of trade secrets, client lists or information, employee lists or information,
information regarding product development, marketing plans, management organization, operating policies or
manuals, performance results, business plans, financial records, or other financial, commercial, business or
technical information (collectively “ Confidential Information ”), must be protected as confidential, not copied,
disclosed or used other than for the benefit of the Company at any time unless and until such knowledge or
information is in the public domain through no wrongful act by Employee. Employee further agrees not to
divulge to anyone (other than the Company or any persons employed or designated by the Company), publish or
make use of any such Confidential Information without the prior written consent of the Company, except by an
order of a court having competent jurisdiction or under subpoena from an appropriate government agency.
6. Non-competition/Non-solicitation/Non-hire. Employee acknowledges and recognizes the highly competitive
nature of the business of the Company. Without the express written permission of Celanese, for a period of two
(2) years, following the Separation Date (the “ Restricted Period ”), Employee acknowledges and agrees that she
will not: (i) directly or indirectly solicit sales of like products similar to those produced or sold by Company; or
(ii) directly engage or become employed with any business that competes with the business of Celanese,
including but not limited to: direct sales, supply chain, marketing, or manufacturing for a producer of products
similar to those produced or licensed by Celanese. In addition, for two (2) years, Employee will not directly or
indirectly solicit, nor hire employees of Celanese for employment. However, nothing in this provision shall
restrict Employee from owning, solely as an investment, publicly traded securities of any company which is
engaged in the business of Celanese if Employee (i) is not a controlling person of, or a member of a group
which controls; and (ii) does not, directly or indirectly, own 5% or more of any class of securities of any such
company.
7. Governing Law and Interpretation . This Agreement shall be governed and conformed in accordance with the
laws of the State of Texas, without regard to its conflict of laws provision. In the event Employee or Company
breaches any provision of this Agreement, Employee and Company affirm that either may institute an action to
specifically enforce any term or terms of this Agreement. Should any provision of this Agreement be declared
illegal or unenforceable by any court of competent jurisdiction and cannot be modified to be enforceable,
excluding the general release language, such provision shall immediately become null and void, leaving the
remainder of this Agreement in full force and effect.
8. Non-admission of Wrongdoing . The parties agree that neither this Agreement nor the furnishing of the
consideration for this Release shall be deemed or construed at any time
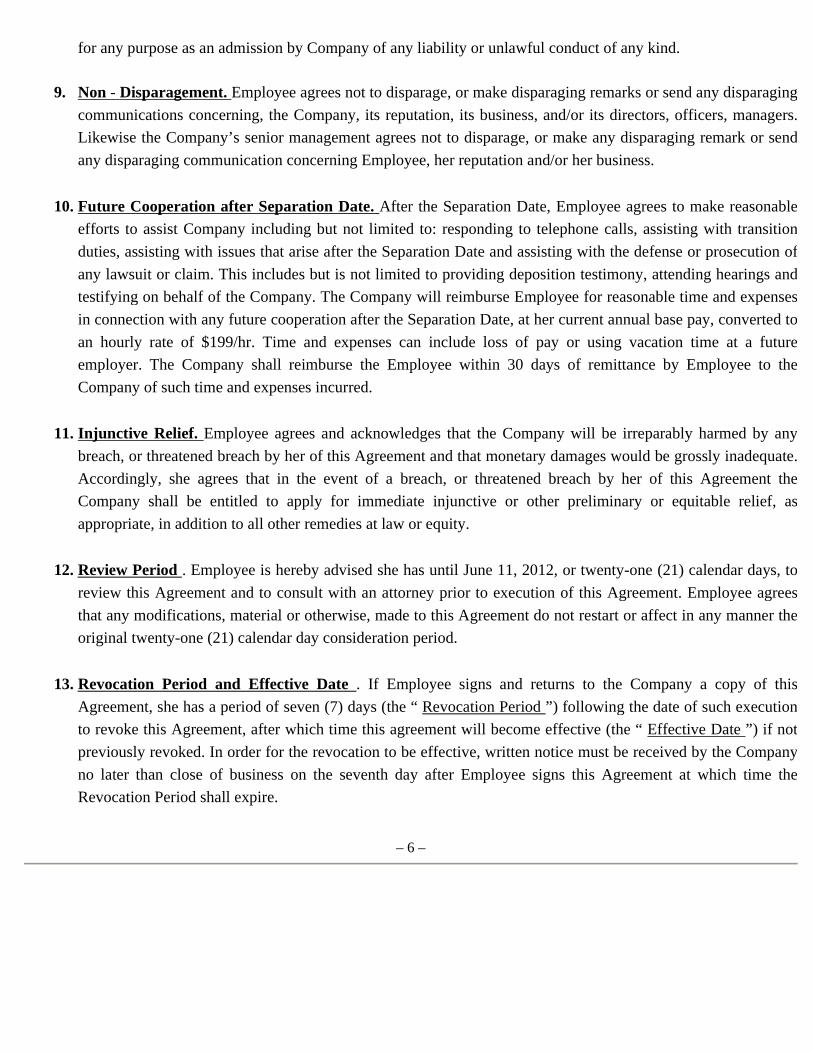
for any purpose as an admission by Company of any liability or unlawful conduct of any kind.
– 6 –
9. Non - Disparagement. Employee agrees not to disparage, or make disparaging remarks or send any disparaging
communications concerning, the Company, its reputation, its business, and/or its directors, officers, managers.
Likewise the Company’s senior management agrees not to disparage, or make any disparaging remark or send
any disparaging communication concerning Employee, her reputation and/or her business.
10. Future Cooperation after Separation Date. After the Separation Date, Employee agrees to make reasonable
efforts to assist Company including but not limited to: responding to telephone calls, assisting with transition
duties, assisting with issues that arise after the Separation Date and assisting with the defense or prosecution of
any lawsuit or claim. This includes but is not limited to providing deposition testimony, attending hearings and
testifying on behalf of the Company. The Company will reimburse Employee for reasonable time and expenses
in connection with any future cooperation after the Separation Date, at her current annual base pay, converted to
an hourly rate of $199/hr. Time and expenses can include loss of pay or using vacation time at a future
employer. The Company shall reimburse the Employee within 30 days of remittance by Employee to the
Company of such time and expenses incurred.
11. Injunctive Relief. Employee agrees and acknowledges that the Company will be irreparably harmed by any
breach, or threatened breach by her of this Agreement and that monetary damages would be grossly inadequate.
Accordingly, she agrees that in the event of a breach, or threatened breach by her of this Agreement the
Company shall be entitled to apply for immediate injunctive or other preliminary or equitable relief, as
appropriate, in addition to all other remedies at law or equity.
12. Review Period . Employee is hereby advised she has until June 11, 2012, or twenty-one (21) calendar days, to
review this Agreement and to consult with an attorney prior to execution of this Agreement. Employee agrees
that any modifications, material or otherwise, made to this Agreement do not restart or affect in any manner the
original twenty-one (21) calendar day consideration period.
13. Revocation Period and Effective Date . If Employee signs and returns to the Company a copy of this
Agreement, she has a period of seven (7) days (the “ Revocation Period ”) following the date of such execution
to revoke this Agreement, after which time this agreement will become effective (the “ Effective Date ”) if not
previously revoked. In order for the revocation to be effective, written notice must be received by the Company
no later than close of business on the seventh day after Employee signs this Agreement at which time the
Revocation Period shall expire.
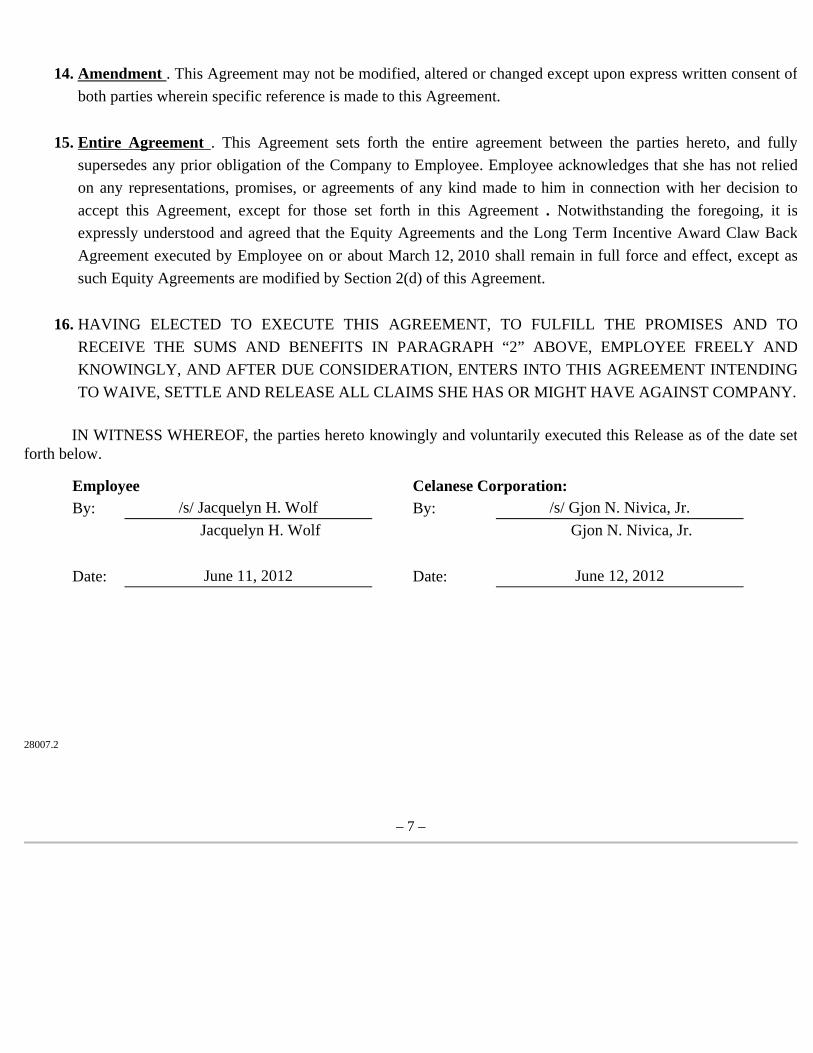
IN WITNESS WHEREOF, the parties hereto knowingly and voluntarily executed this Release as of the date set
forth below.
28007.2
– 7 –
14. Amendment . This Agreement may not be modified, altered or changed except upon express written consent of
both parties wherein specific reference is made to this Agreement.
15. Entire Agreement . This Agreement sets forth the entire agreement between the parties hereto, and fully
supersedes any prior obligation of the Company to Employee. Employee acknowledges that she has not relied
on any representations, promises, or agreements of any kind made to him in connection with her decision to
accept this Agreement, except for those set forth in this Agreement . Notwithstanding the foregoing, it is
expressly understood and agreed that the Equity Agreements and the Long Term Incentive Award Claw Back
Agreement executed by Employee on or about March 12, 2010 shall remain in full force and effect, except as
such Equity Agreements are modified by Section 2(d) of this Agreement.
16. HAVING ELECTED TO EXECUTE THIS AGREEMENT, TO FULFILL THE PROMISES AND TO
RECEIVE THE SUMS AND BENEFITS IN PARAGRAPH “2” ABOVE, EMPLOYEE FREELY AND
KNOWINGLY, AND AFTER DUE CONSIDERATION, ENTERS INTO THIS AGREEMENT INTENDING
TO WAIVE, SETTLE AND RELEASE ALL CLAIMS SHE HAS OR MIGHT HAVE AGAINST COMPANY.
Employee Celanese Corporation:
By: /s/ Jacquelyn H. Wolf By: /s/ Gjon N. Nivica, Jr.
Jacquelyn H. Wolf Gjon N. Nivica, Jr.
Date: June 11, 2012 Date: June 12, 2012

Exhibit C
Summary LTI Awards
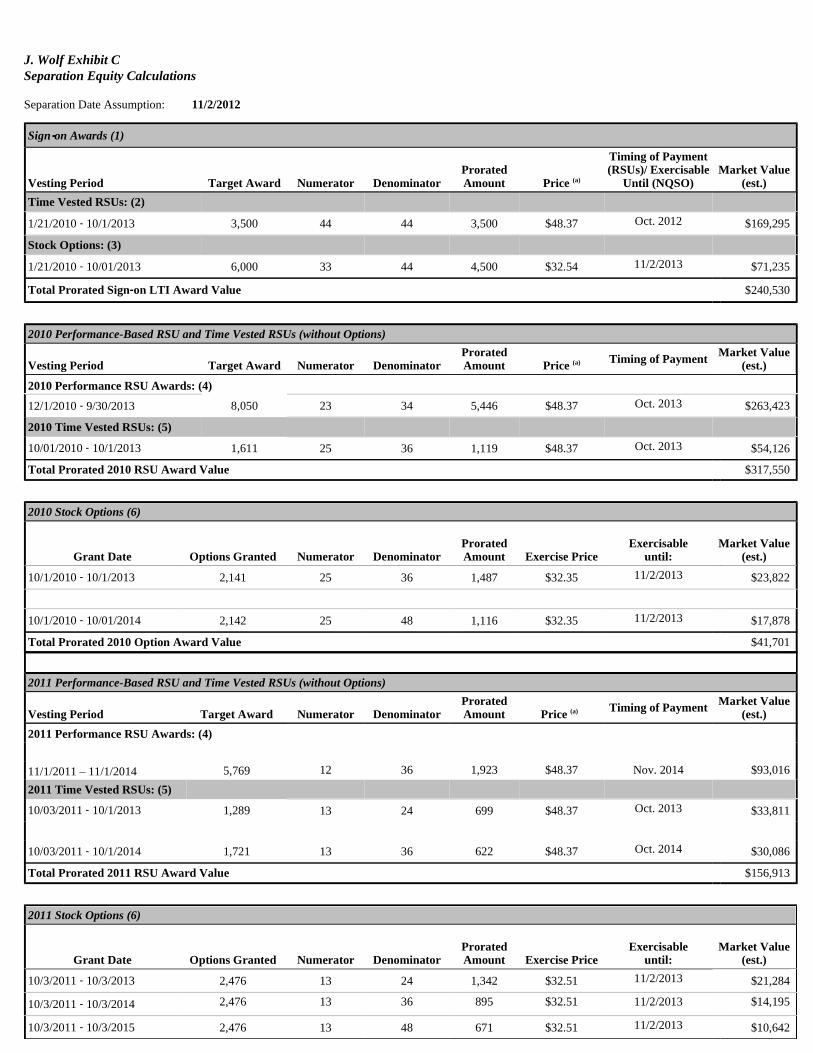
J. Wolf Exhibit C Separation Equity Calculations Separation Date Assumption: 11/2/2012
Sign‐‐‐‐on Awards (1)
Vesting Period Target Award Numerator Denominator Prorated Amount Price (a)
Timing of Payment (RSUs)/ Exercisable
Until (NQSO) Market Value
(est.)
Time Vested RSUs: (2)
1/21/2010 ‐ 10/1/2013 3,500 44 44 3,500 $48.37 Oct. 2012 $169,295 Stock Options: (3)
1/21/2010 ‐ 10/01/2013 6,000 33 44 4,500 $32.54 11/2/2013 $71,235
Total Prorated Sign‐‐‐‐on LTI Award Value $240,530
2010 Performance-Based RSU and Time Vested RSUs (without Options)
Vesting Period Target Award Numerator Denominator Prorated Amount Price (a) Timing of Payment Market Value
(est.)
2010 Performance RSU Awards: (4)
12/1/2010 ‐ 9/30/2013 8,050 23 34 5,446 $48.37 Oct. 2013 $263,423 2010 Time Vested RSUs: (5)
10/01/2010 ‐ 10/1/2013 1,611 25 36 1,119 $48.37 Oct. 2013 $54,126 Total Prorated 2010 RSU Award Value $317,550
2010 Stock Options (6)
Grant Date Options Granted Numerator Denominator
Prorated Amount Exercise Price
Exercisable until:
Market Value (est.)
10/1/2010 ‐ 10/1/2013 2,141 25 36 1,487 $32.35 11/2/2013 $23,822
10/1/2010 ‐ 10/01/2014 2,142 25 48 1,116 $32.35 11/2/2013 $17,878 Total Prorated 2010 Option Award Value $41,701
2011 Performance-Based RSU and Time Vested RSUs (without Options)
Vesting Period Target Award Numerator Denominator Prorated Amount Price (a) Timing of Payment Market Value
(est.)
2011 Performance RSU Awards: (4)
11/1/2011 – 11/1/2014 5,769 12 36 1,923 $48.37 Nov. 2014 $93,016 2011 Time Vested RSUs: (5)
10/03/2011 ‐ 10/1/2013 1,289 13 24 699 $48.37 Oct. 2013 $33,811
10/03/2011 ‐ 10/1/2014 1,721 13 36 622 $48.37 Oct. 2014 $30,086 Total Prorated 2011 RSU Award Value $156,913
2011 Stock Options (6)
Grant Date Options Granted Numerator Denominator
Prorated Amount Exercise Price
Exercisable until:
Market Value (est.)
10/3/2011 ‐ 10/3/2013 2,476 13 24 1,342 $32.51 11/2/2013 $21,284
10/3/2011 ‐ 10/3/2014 2,476 13 36 895 $32.51 11/2/2013 $14,195
10/3/2011 ‐ 10/3/2015 2,476 13 48 671 $32.51 11/2/2013 $10,642

Total Pro-rata Equity Value $802,815 Treatmen t o f outstandin g award s i f terminate d no t fo r cause :
(1) The sign‐on 2009 PRSUs will vest on October 1, 2012 while participant is still employed (2) Sign‐on Time RSUs ‐become immediately vested upon termination date (per offer letter) (3) Sign‐on Stock Options ‐pro rate on termination date; become immediately vested and are exercisable for one‐year following termination; not subject to holding requirement (per agreement) (4) 2010 / 2011 PRSUs ‐pro rate on termination date and pay out on original vesting date subject to performance attainment and holding requirement (per agreement) (5) 2010 / 2011 Time RSUs ‐pro rate on termination date and pay out on original vesting date subject to holding requirement (per agreement) (6) 2010 / 2011 Stock Options ‐pro rate on termination date; become immediately vested and are exercisable for one‐year following termination, Options are subject to holding requirement (per agreement)
(a) Stock price used for separation calculation on 5/1/2012 $48.37
Total Prorated 2011 Option Award Value $46,121
Exhibit 10.13
Summary of Non-Employee Director Compensation
Each non-employee director of Celanese Corporation (the “Company”) is entitled to (i) an annual cash retainer of $85,000, which is paid in quarterly installments, in arrears, and (ii) an annual equity retainer of $95,000 in restricted stock units (awarded at the first regular board meeting following the Annual Meeting of Stockholders). In addition, the chair of the nominating and corporate governance committee and the environmental, health & safety committee receives an annual fee of $10,000, and the chair of the audit committee and the compensation committee receives an annual fee of $20,000. The lead director receives an annual fee of $25,000. These amounts are paid in quarterly installments, in arrears, and prorated for actual service.
Non-employee directors are also entitled to participate in the Company's 2008 Deferred Compensation Plan, which is an unfunded, nonqualified deferred compensation plan that allows directors the opportunity to defer a portion of their compensation in exchange for a future payment amount equal to their deferments plus or minus certain amounts based upon the market performance of specified measurement funds selected by the participant.
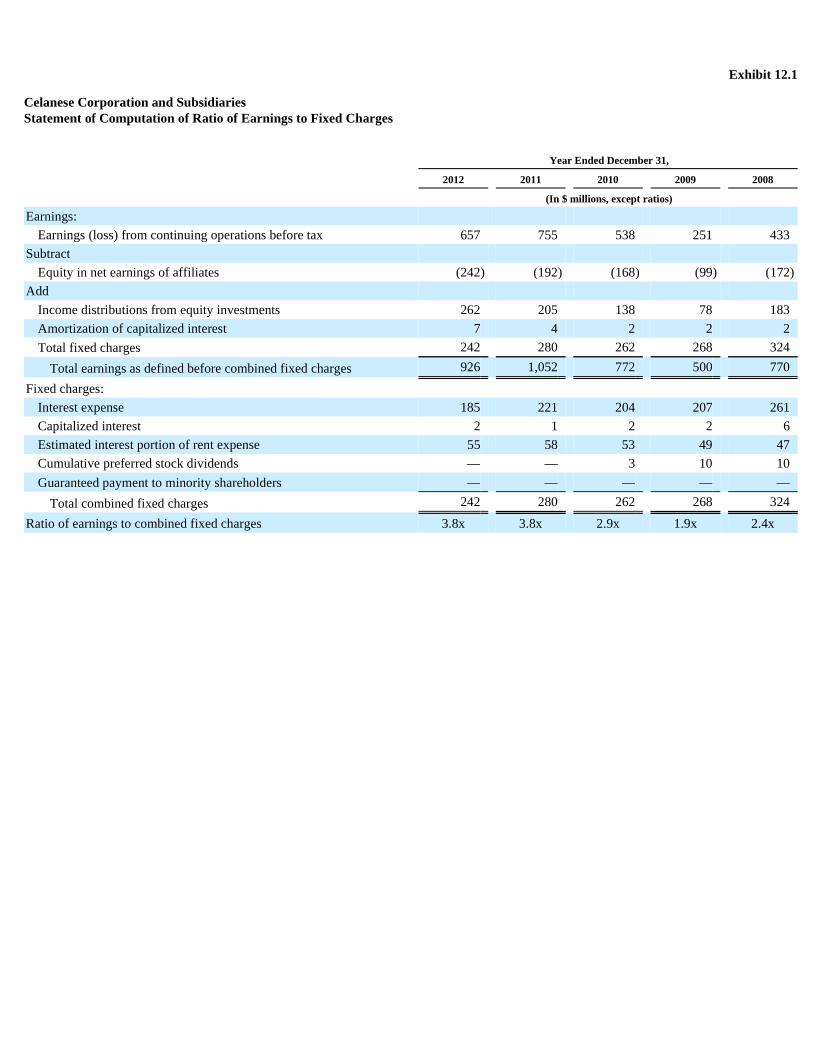
Exhibit 12.1
Celanese Corporation and Subsidiaries Statement of Computation of Ratio of Earnings to Fixed Charges
Year Ended December 31,
2012 2011 2010 2009 2008
(In $ millions, except ratios)
Earnings:
Earnings (loss) from continuing operations before tax 657 755 538 251 433 Subtract
Equity in net earnings of affiliates (242 ) (192 ) (168 ) (99 ) (172 )
Add
Income distributions from equity investments 262 205 138 78 183 Amortization of capitalized interest 7 4 2 2 2 Total fixed charges 242 280 262 268 324
Total earnings as defined before combined fixed charges 926 1,052 772 500 770
Fixed charges:
Interest expense 185 221 204 207 261 Capitalized interest 2 1 2 2 6 Estimated interest portion of rent expense 55 58 53 49 47 Cumulative preferred stock dividends — — 3 10 10 Guaranteed payment to minority shareholders — — — — —
Total combined fixed charges 242 280 262 268 324
Ratio of earnings to combined fixed charges 3.8x 3.8x 2.9x 1.9x 2.4x
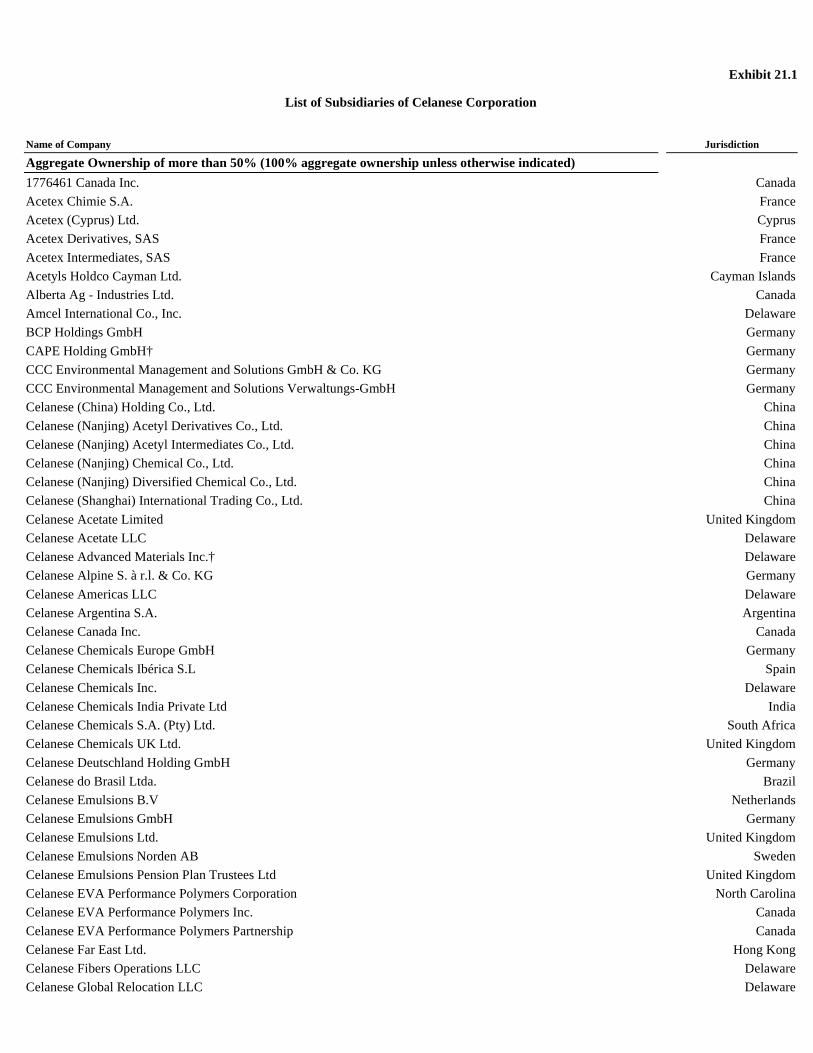
Exhibit 21.1
List of Subsidiaries of Celanese Corporation
Name of Company Jurisdiction
Aggregate Ownership of more than 50% (100% aggregate ownership unless otherwise indicated)
1776461 Canada Inc. Canada
Acetex Chimie S.A. France
Acetex (Cyprus) Ltd. Cyprus
Acetex Derivatives, SAS France
Acetex Intermediates, SAS France
Acetyls Holdco Cayman Ltd. Cayman Islands
Alberta Ag - Industries Ltd. Canada
Amcel International Co., Inc. Delaware
BCP Holdings GmbH Germany
CAPE Holding GmbH† Germany
CCC Environmental Management and Solutions GmbH & Co. KG Germany
CCC Environmental Management and Solutions Verwaltungs-GmbH Germany
Celanese (China) Holding Co., Ltd. China
Celanese (Nanjing) Acetyl Derivatives Co., Ltd. China
Celanese (Nanjing) Acetyl Intermediates Co., Ltd. China
Celanese (Nanjing) Chemical Co., Ltd. China
Celanese (Nanjing) Diversified Chemical Co., Ltd. China
Celanese (Shanghai) International Trading Co., Ltd. China
Celanese Acetate Limited United Kingdom
Celanese Acetate LLC Delaware
Celanese Advanced Materials Inc.† Delaware
Celanese Alpine S. à r.l. & Co. KG Germany
Celanese Americas LLC Delaware
Celanese Argentina S.A. Argentina
Celanese Canada Inc. Canada
Celanese Chemicals Europe GmbH Germany
Celanese Chemicals Ibérica S.L Spain
Celanese Chemicals Inc. Delaware
Celanese Chemicals India Private Ltd India
Celanese Chemicals S.A. (Pty) Ltd. South Africa
Celanese Chemicals UK Ltd. United Kingdom
Celanese Deutschland Holding GmbH Germany
Celanese do Brasil Ltda. Brazil
Celanese Emulsions B.V Netherlands
Celanese Emulsions GmbH Germany
Celanese Emulsions Ltd. United Kingdom
Celanese Emulsions Norden AB Sweden
Celanese Emulsions Pension Plan Trustees Ltd United Kingdom
Celanese EVA Performance Polymers Corporation North Carolina
Celanese EVA Performance Polymers Inc. Canada
Celanese EVA Performance Polymers Partnership Canada
Celanese Far East Ltd. Hong Kong
Celanese Fibers Operations LLC Delaware
Celanese Global Relocation LLC Delaware

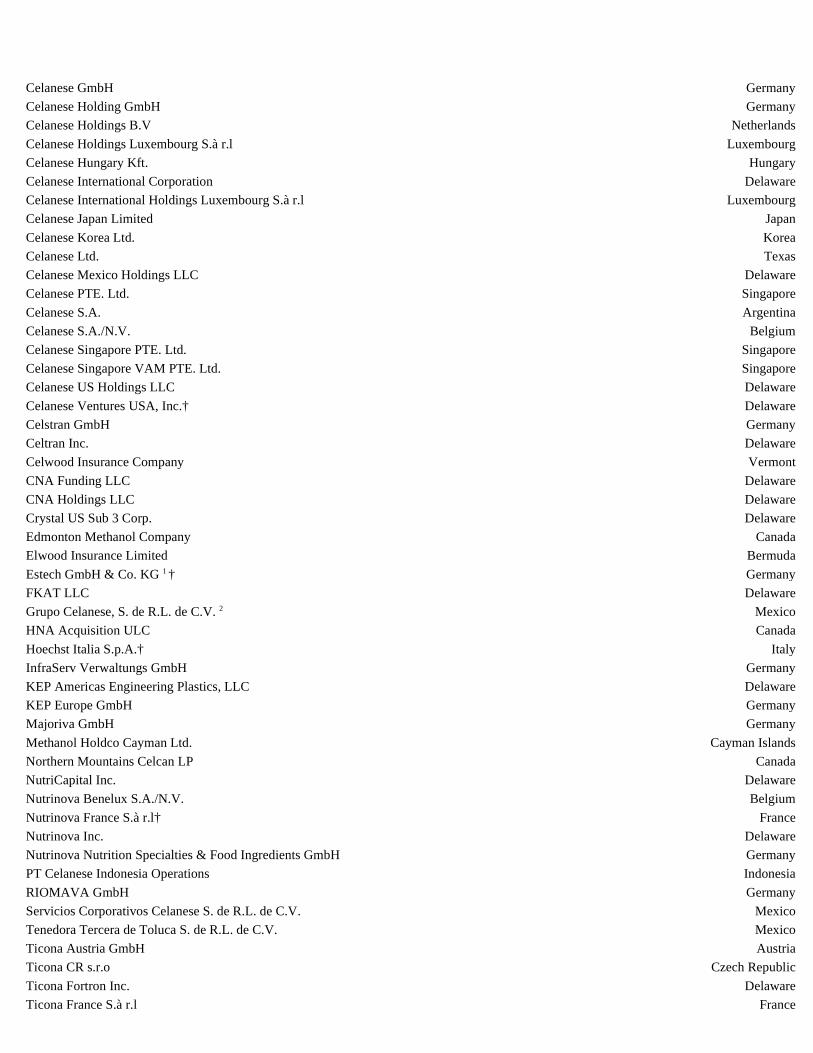
Celanese GmbH Germany
Celanese Holding GmbH Germany
Celanese Holdings B.V Netherlands
Celanese Holdings Luxembourg S.à r.l Luxembourg
Celanese Hungary Kft. Hungary
Celanese International Corporation Delaware
Celanese International Holdings Luxembourg S.à r.l Luxembourg
Celanese Japan Limited Japan
Celanese Korea Ltd. Korea
Celanese Ltd. Texas
Celanese Mexico Holdings LLC Delaware
Celanese PTE. Ltd. Singapore
Celanese S.A. Argentina
Celanese S.A./N.V. Belgium
Celanese Singapore PTE. Ltd. Singapore
Celanese Singapore VAM PTE. Ltd. Singapore
Celanese US Holdings LLC Delaware
Celanese Ventures USA, Inc.† Delaware
Celstran GmbH Germany
Celtran Inc. Delaware
Celwood Insurance Company Vermont
CNA Funding LLC Delaware
CNA Holdings LLC Delaware
Crystal US Sub 3 Corp. Delaware
Edmonton Methanol Company Canada
Elwood Insurance Limited Bermuda
Estech GmbH & Co. KG 1 † Germany
FKAT LLC Delaware
Grupo Celanese, S. de R.L. de C.V. 2 Mexico
HNA Acquisition ULC Canada
Hoechst Italia S.p.A.† Italy
InfraServ Verwaltungs GmbH Germany
KEP Americas Engineering Plastics, LLC Delaware
KEP Europe GmbH Germany
Majoriva GmbH Germany
Methanol Holdco Cayman Ltd. Cayman Islands
Northern Mountains Celcan LP Canada
NutriCapital Inc. Delaware
Nutrinova Benelux S.A./N.V. Belgium
Nutrinova France S.à r.l† France
Nutrinova Inc. Delaware
Nutrinova Nutrition Specialties & Food Ingredients GmbH Germany
PT Celanese Indonesia Operations Indonesia
RIOMAVA GmbH Germany
Servicios Corporativos Celanese S. de R.L. de C.V. Mexico
Tenedora Tercera de Toluca S. de R.L. de C.V. Mexico
Ticona Austria GmbH Austria
Ticona CR s.r.o Czech Republic
Ticona Fortron Inc. Delaware
Ticona France S.à r.l France

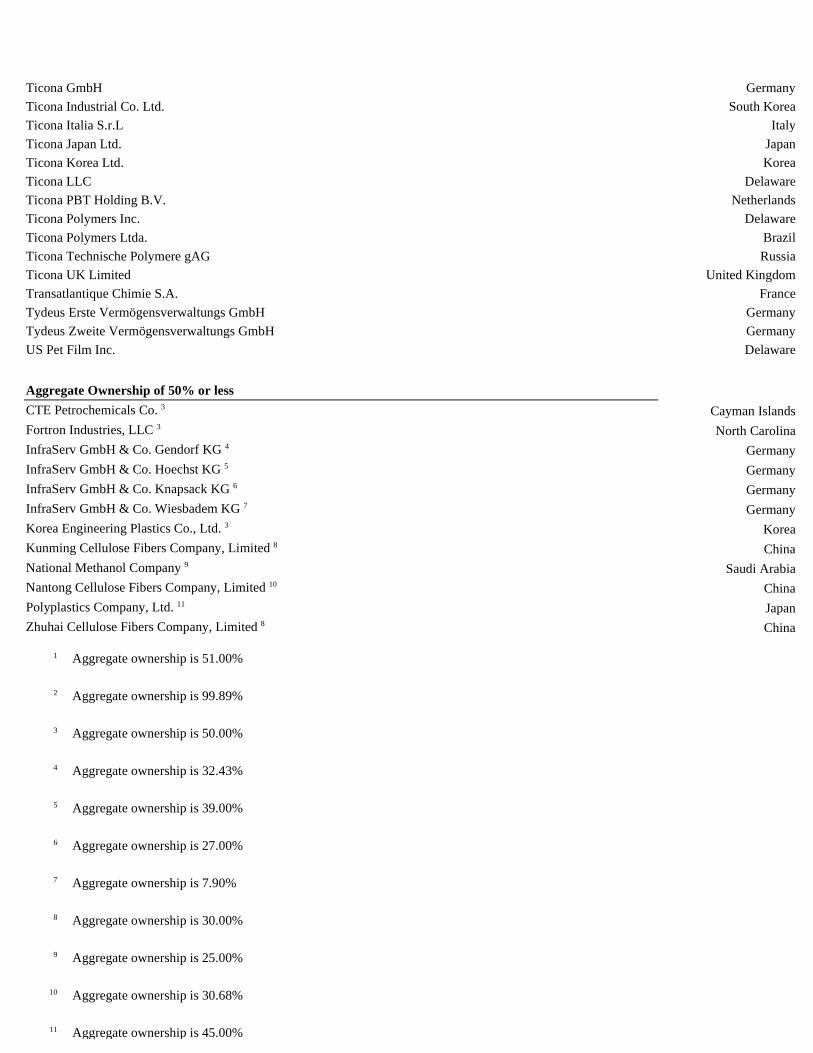
Ticona GmbH Germany
Ticona Industrial Co. Ltd. South Korea
Ticona Italia S.r.L Italy
Ticona Japan Ltd. Japan
Ticona Korea Ltd. Korea
Ticona LLC Delaware
Ticona PBT Holding B.V. Netherlands
Ticona Polymers Inc. Delaware
Ticona Polymers Ltda. Brazil
Ticona Technische Polymere gAG Russia
Ticona UK Limited United Kingdom
Transatlantique Chimie S.A. France
Tydeus Erste Vermögensverwaltungs GmbH Germany
Tydeus Zweite Vermögensverwaltungs GmbH Germany
US Pet Film Inc. Delaware
Aggregate Ownership of 50% or less
CTE Petrochemicals Co. 3 Cayman Islands
Fortron Industries, LLC 3 North Carolina
InfraServ GmbH & Co. Gendorf KG 4 Germany
InfraServ GmbH & Co. Hoechst KG 5 Germany
InfraServ GmbH & Co. Knapsack KG 6 Germany
InfraServ GmbH & Co. Wiesbadem KG 7 Germany
Korea Engineering Plastics Co., Ltd. 3 Korea
Kunming Cellulose Fibers Company, Limited 8 China
National Methanol Company 9 Saudi Arabia
Nantong Cellulose Fibers Company, Limited 10 China
Polyplastics Company, Ltd. 11 Japan
Zhuhai Cellulose Fibers Company, Limited 8 China
1 Aggregate ownership is 51.00%
2 Aggregate ownership is 99.89%
3 Aggregate ownership is 50.00%
4 Aggregate ownership is 32.43%
5 Aggregate ownership is 39.00%
6 Aggregate ownership is 27.00%
7 Aggregate ownership is 7.90%
8 Aggregate ownership is 30.00%
9 Aggregate ownership is 25.00%
10 Aggregate ownership is 30.68%
11 Aggregate ownership is 45.00%

† In liquidation
Exhibit 23.1
Consent of Independent Registered Public Accounting Firm The Board of Directors and Stockholders Celanese Corporation: We consent to the incorporation by reference in the registration statements on Form S-8 (Nos. 333-122789, 333-128048, 333-158734, 333-158736, 333-166358, and 333-180932) and on Form S-3 (No. 333-173822) of Celanese Corporation of our reports dated February 8, 2013 , with respect to the consolidated balance sheets of Celanese Corporation as of December 31, 2012 and 2011 , and the related consolidated statements of operations, comprehensive income (loss), equity, and cash flows for each of the years in the three-year period ended December 31, 2012 , and the effectiveness of internal control over financial reporting as of December 31, 2012 , which reports appear in the December 31, 2012 annual report on Form 10-K of Celanese Corporation. /s/ KPMG LLP Dallas, Texas February 8, 2013
Exhibit 23.2
Consent of Independent Auditors
We hereby consent to the incorporation by reference in the Registration Statements on Form S-3 (No. 333-173822) and Form S-8 (Nos. 333-122789, 333-128048, 333-158734, 333-158736, 333-166358 and 333-180932) of Celanese Corporation of our report dated February 8, 2013 , relating to the financial statements of CTE Petrochemicals Company appearing in this Annual Report on Form 10-K of Celanese Corporation. /s/ BDO USA, LLP Dallas, Texas February 8, 2013
Exhibit 23.3
Consent of Independent Auditors We consent to the incorporation by reference in Registration Statement Nos. 333-122789, 333-128048, 333-158734, 333-158736, 333-166358 and 333-180932 on Form S-8 and Registration Statement No. 333-173822 on Form S-3 of our report dated February 10, 2011, relating to the 2010 financial statements (before retrospective adjustments to the financial statements) of CTE Petrochemicals Company (not presented herein), appearing in this Annual Report on Form 10-K of Celanese Corporation for the year ended December 31, 2012 . /s/ DELOITTE & TOUCHE LLP Houston, Texas February 8, 2013
Exhibit 23.4
Consent of Independent Auditors
We hereby consent to the incorporation by reference in the Registration Statements on Form S-3 (No. 333-173822) and Form S-8 (Nos. 333-122789, 333-128048, 333-158734, 333-158736, 333-166358 and 333-180932) of Celanese Corporation of our report dated February 5, 2013, relating to the financial statements of National Methanol Company (Ibn Sina) (which expresses an unqualified opinion and includes an emphasis of matter paragraph relating to differences between accounting principles generally accepted in Saudi Arabia and accounting principles generally accepted in the United States of America) appearing in this Annual Report on Form 10-K of Celanese Corporation. For BDO DR. MOHAMED AL-AMRI & CO. /s/ Gihad M. Al-Amri Certified Public Accountant Registration No. 362 Dammam, Saudi Arabia February 8, 2013
Exhibit 23.5
Consent of Independent Auditors We consent to the incorporation by reference in Registration Statement Nos. 333-122789, 333-128048, 333-158734, 333-158736, 333-166358 and 333-180932 on Form S-8 and Registration Statement No. 333-173822 on Form S-3 of Celanese Corporation of our report dated February 10, 2011 related to the financial statements of National Methanol Company (Ibn Sina) (which expresses an unqualified opinion and includes an explanatory paragraph relating to differences between accounting principles generally accepted in the Kingdom of Saudi Arabia and accounting principles generally accepted in the United States of America) for the year ended December 31, 2010, appearing in this Annual Report on Form 10-K of Celanese Corporation for the year ended December 31, 2012 . /s/ DELOITTE & TOUCHE BAKR ABULKHAIR & CO. Al Khobar Kingdom of Saudi Arabia February 8, 2013

Exhibit 31.1
CERTIFICATION PURSUANT TO 17 CFR 240.13a-14
PROMULGATED UNDER SECTION 302 OF THE SARBANES-OXLEY ACT OF 2002
I, Mark C. Rohr, certify that:
1. I have reviewed this annual report on Form 10-K of Celanese Corporation;
2. Based on my knowledge, this report does not contain any untrue statement of a material fact or omit to state a material fact necessary to make the statements made, in light of the circumstances under which such statements were made, not misleading with respect to the period covered by this report;
3. Based on my knowledge, the financial statements, and other financial information included in this report, fairly present in all material respects the financial condition, results of operations and cash flows of the registrant as of, and for, the periods presented in this report;
4. The registrant's other certifying officer(s) and I are responsible for establishing and maintaining disclosure controls and procedures (as defined in Exchange Act Rules 13a-15(e) and 15d-15(e)) and internal control over financial reporting (as defined in Exchange Act Rules 13a-15(f) and 15d-15(f)) for the registrant and have:
(a) designed such disclosure controls and procedures, or caused such disclosure controls and procedures to be designed under our supervision, to ensure that material information relating to the registrant, including its consolidated subsidiaries, is made known to us by others within those entities, particularly during the period in which this report is being prepared;
(b) designed such internal control over financial reporting, or caused such internal control over financial reporting to be designed under our supervision, to provide reasonable assurance regarding the reliability of financial reporting and the preparation of financial statements for external purposes in accordance with generally accepted accounting principles;
(c) evaluated the effectiveness of the registrant's disclosure controls and procedures and presented in this report our conclusions about the effectiveness of the disclosure controls and procedures, as of the end of the period covered by this report based on such evaluation; and
(d) disclosed in this report any change in the registrant's internal control over financial reporting that occurred during the registrant's most recent fiscal quarter (the registrant's fourth fiscal quarter in the case of an annual report) that has materially affected, or is reasonably likely to materially affect, the registrant's internal control over financial reporting; and
5. The registrant's other certifying officer(s) and I have disclosed, based on our most recent evaluation of internal control over financial reporting, to the registrant's auditors and the audit committee of the registrant's board of directors (or persons performing the equivalent functions):
(a) all significant deficiencies and material weaknesses in the design or operation of internal control over financial reporting which are reasonably likely to adversely affect the registrant's ability to record, process, summarize and report financial information; and
(b) any fraud, whether or not material, that involves management or other employees who have a significant role in the registrant's internal control over financial reporting.
/s/ MARK C. ROHR
Mark C. Rohr
Chairman of the Board of Directors and
Chief Executive Officer
Date: February 8, 2013
Exhibit 31.2
CERTIFICATION PURSUANT TO 17 CFR 240.13a-14
PROMULGATED UNDER SECTION 302 OF THE SARBANES-OXLEY ACT OF 2002
I, Steven M. Sterin certify that:
1. I have reviewed this annual report on Form 10-K of Celanese Corporation;
2. Based on my knowledge, this report does not contain any untrue statement of a material fact or omit to state a material fact necessary to make the statements made, in light of the circumstances under which such statements were made, not misleading with respect to the period covered by this report;
3. Based on my knowledge, the financial statements, and other financial information included in this report, fairly present in all material respects the financial condition, results of operations and cash flows of the registrant as of, and for, the periods presented in this report;
4. The registrant's other certifying officer(s) and I are responsible for establishing and maintaining disclosure controls and procedures (as defined in Exchange Act Rules 13a-15(e) and 15d-15(e)) and internal control over financial reporting (as defined in Exchange Act Rules 13a-15(f) and 15d-15(f)) for the registrant and have:
(a) designed such disclosure controls and procedures, or caused such disclosure controls and procedures to be designed under our supervision, to ensure that material information relating to the registrant, including its consolidated subsidiaries, is made known to us by others within those entities, particularly during the period in which this report is being prepared;
(b) designed such internal control over financial reporting, or caused such internal control over financial reporting to be designed under our supervision, to provide reasonable assurance regarding the reliability of financial reporting and the preparation of financial statements for external purposes in accordance with generally accepted accounting principles;
(c) evaluated the effectiveness of the registrant's disclosure controls and procedures and presented in this report our conclusions about the effectiveness of the disclosure controls and procedures, as of the end of the period covered by this report based on such evaluation; and
(d) disclosed in this report any change in the registrant's internal control over financial reporting that occurred during the registrant's most recent fiscal quarter (the registrant's fourth fiscal quarter in the case of an annual report) that has materially affected, or is reasonably likely to materially affect, the registrant's internal control over financial reporting; and
5. The registrant's other certifying officer(s) and I have disclosed, based on our most recent evaluation of internal control over financial reporting, to the registrant's auditors and the audit committee of the registrant's board of directors (or persons performing the equivalent functions):
(a) all significant deficiencies and material weaknesses in the design or operation of internal control over financial reporting which are reasonably likely to adversely affect the registrant's ability to record, process, summarize and report financial information; and
(b) any fraud, whether or not material, that involves management or other employees who have a significant role in the registrant's internal control over financial reporting.
/s/ STEVEN M. STERIN
Steven M. Sterin
Senior Vice President and
Chief Financial Officer
Date: February 8, 2013
Exhibit 32.1
CERTIFICATION PURSUANT TO 18 U.S.C. SECTION 1350,
AS ADOPTED PURSUANT TO SECTION 906 OF THE SARBANES-OXLEY ACT OF 2002
In connection with the Annual Report of Celanese Corporation (the “Company”) on Form 10-K for the period ending December 31, 2012 as filed with the Securities and Exchange Commission on the date hereof (the “Report”), I, Mark C. Rohr, Chairman of the Board of Directors and Chief Executive Officer of the Company, hereby certify, pursuant to 18 U.S.C. Section 1350, as adopted pursuant to Section 906 of the Sarbanes-Oxley Act of 2002, that to my knowledge:
1. The Report fully complies with the requirements of section 13(a) or 15(d) of the Securities Exchange Act of 1934; and
2. The information contained in the Report fairly presents, in all material respects, the financial condition and results of operations of the Company.
/s/ MARK C. ROHR
Mark C. Rohr
Chairman of the Board of Directors and
Chief Executive Officer
Date: February 8, 2013
Exhibit 32.2
CERTIFICATION PURSUANT TO 18 U.S.C. SECTION 1350,
AS ADOPTED PURSUANT TO SECTION 906 OF THE SARBANES-OXLEY ACT OF 2002
In connection with the Annual Report of Celanese Corporation (the “Company”) on Form 10-K for the period ending December 31, 2012 as filed with the Securities and Exchange Commission on the date hereof (the “Report”), I, Steven M. Sterin, Senior Vice President and Chief Financial Officer of the Company, hereby certify, pursuant to 18 U.S.C. Section 1350, as adopted pursuant to Section 906 of the Sarbanes-Oxley Act of 2002, that to my knowledge:
1. The Report fully complies with the requirements of section 13(a) or 15(d) of the Securities Exchange Act of 1934; and
2. The information contained in the Report fairly presents, in all material respects, the financial condition and results of operations of the Company.
/s/ STEVEN M. STERIN
Steven M. Sterin
Senior Vice President and
Chief Financial Officer
Date: February 8, 2013
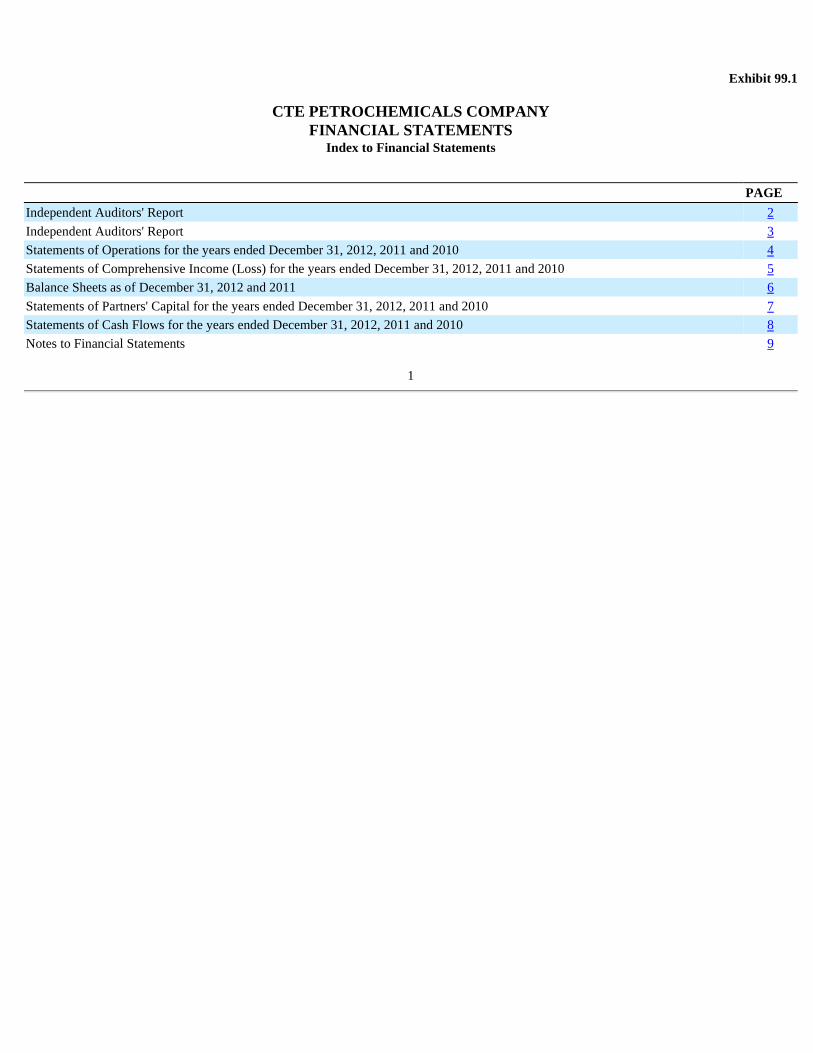
Exhibit 99.1
CTE PETROCHEMICALS COMPANY
FINANCIAL STATEMENTS Index to Financial Statements
1
PAGE
Independent Auditors' Report 2
Independent Auditors' Report 3
Statements of Operations for the years ended December 31, 2012, 2011 and 2010 4
Statements of Comprehensive Income (Loss) for the years ended December 31, 2012, 2011 and 2010 5
Balance Sheets as of December 31, 2012 and 2011 6
Statements of Partners' Capital for the years ended December 31, 2012, 2011 and 2010 7
Statements of Cash Flows for the years ended December 31, 2012, 2011 and 2010 8
Notes to Financial Statements 9
INDEPENDENT AUDITORS' REPORT To the Board of Directors and Partners of CTE Petrochemicals Company We have audited the accompanying financial statements of CTE Petrochemicals Company, which comprise the balance sheets as of December 31, 2012 and 2011, and the related statements of operations, comprehensive income (loss), partners' capital, and cash flows for the years then ended, and the related notes to the financial statements. Management's Responsibility for the Financial Statements Management is responsible for the preparation and fair presentation of these financial statements in accordance with accounting principles generally accepted in the United States of America; this includes the design, implementation, and maintenance of internal control relevant to the preparation and fair presentation of financial statements that are free from material misstatement, whether due to fraud or error. Auditor's Responsibility Our responsibility is to express an opinion on these financial statements based on our audits. We conducted our audits in accordance with auditing standards generally accepted in the United States of America. Those standards require that we plan and perform the audit to obtain reasonable assurance about whether the financial statements are free from material misstatement. An audit involves performing procedures to obtain audit evidence about the amounts and disclosures in the financial statements. The procedures selected depend on the auditor's judgment, including the assessment of the risks of material misstatement of the financial statements, whether due to fraud or error. In making those risk assessments, the auditor considers internal control relevant to the entity's preparation and fair presentation of the financial statements in order to design audit procedures that are appropriate in the circumstances, but not for the purpose of expressing an opinion on the effectiveness of the entity's internal control. Accordingly, we express no such opinion. An audit also includes evaluating the appropriateness of accounting policies used and the reasonableness of significant accounting estimates made by management, as well as evaluating the overall presentation of the financial statements. We believe that the audit evidence we have obtained is sufficient and appropriate to provide a basis for our audit opinion. Opinion In our opinion, the financial statements referred to above present fairly, in all material respects, the financial position of CTE Petrochemicals Company as of December 31, 2012 and 2011, and the results of its operations and its cash flows for the years then ended in accordance with accounting principles generally accepted in the United States of America. Other Matter
As part of our audits of the 2012 and 2011 financial statements, we have also audited the adjustments to the 2010 financial statements to retrospectively apply the change in presentation of the statement of comprehensive income (loss) of all periods presented, as discussed in Note 3 to the financial statements. In our opinion, such retrospective adjustments are appropriate and have been properly applied. However, we were not engaged to audit, review, or apply any procedures to the 2010 financial statements of the Company other than with respect to the retrospective presentation and, accordingly, we do not express an opinion or any other form of assurance on the 2010 financial statements taken as a whole. /s/ BDO USA, LLP Dallas, Texas February 8, 2013
2
INDEPENDENT AUDITORS' REPORT To the Board of Directors and Partners of CTE Petrochemicals Company
We have audited, before the effects of the adjustments to retrospectively apply the change in accounting discussed in Note 3 to the financial statements of CTE Petrochemicals Company (the "Company"), the statements of operations, partners' capital, and cash flows for the year ended December 31, 2010 . These financial statements are the responsibility of the Company's management. Our responsibility is to express an opinion on these financial statements based on our audit.
We conducted our audit in accordance with auditing standards generally accepted in the United States of America. Those standards require that we plan and perform the audit to obtain reasonable assurance about whether the financial statements are free of material misstatement. An audit includes consideration of internal control over financial reporting as a basis for designing audit procedures that are appropriate in the circumstances, but not for the purpose of expressing an opinion on the effectiveness of the Company's internal control over financial reporting. Accordingly, we express no such opinion. An audit also includes examining, on a test basis, evidence supporting the amounts and disclosures in the financial statements, assessing the accounting principles used and significant estimates made by management, as well as evaluating the overall financial statement presentation. We believe that our audit provides a reasonable basis for our opinion.
In our opinion, such financial statements, before the effects of the adjustments to retrospectively apply the change in accounting discussed in Note 3 to the financial statements, present fairly, in all material respects, the results of CTE Petrochemicals Company's operations and cash flows for the year ended December 31, 2010 , in conformity with accounting principles generally accepted in the United States of America.
We were not engaged to audit, review, or apply any procedures to the adjustments to retrospectively apply the change in accounting discussed in Note 3 to the financial statements and, accordingly, we do not express an opinion or any other form of assurance about whether such retrospective adjustments are appropriate and have been properly applied. Those retrospective adjustments were audited by other auditors. /s/ DELOITTE & TOUCHE LLP Houston, Texas February 10, 2011
3
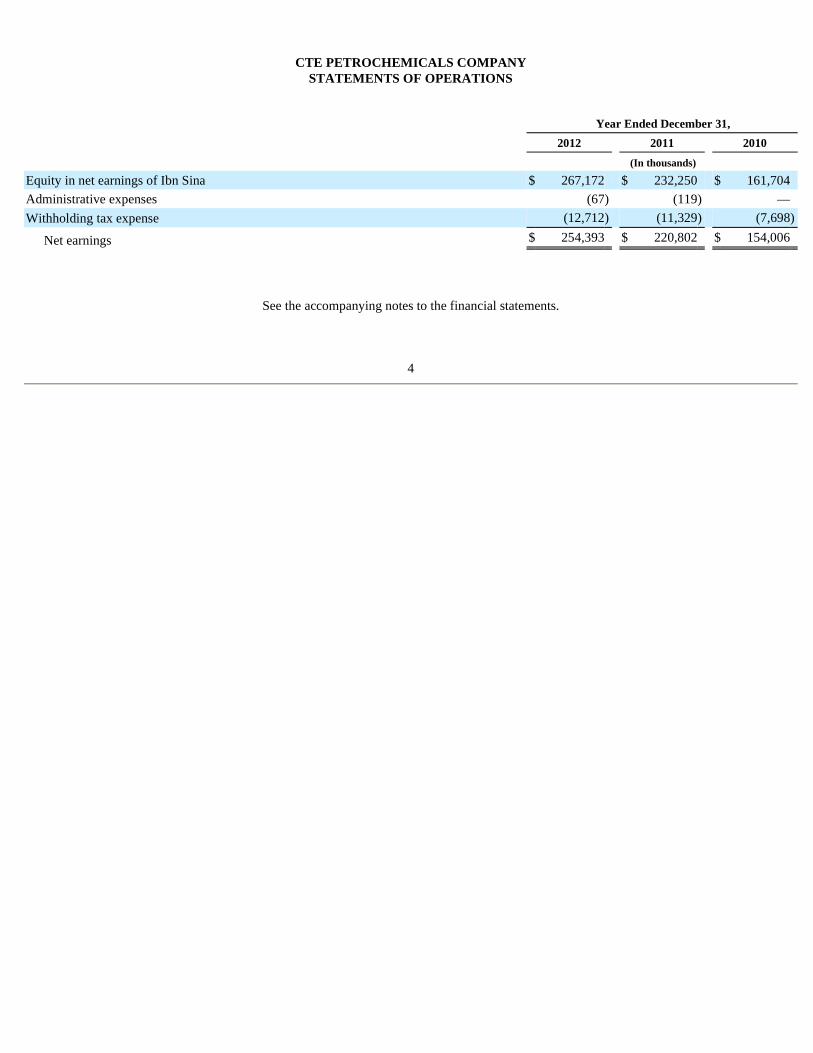
CTE PETROCHEMICALS COMPANY STATEMENTS OF OPERATIONS
See the accompanying notes to the financial statements.
4
Year Ended December 31,
2012 2011 2010
(In thousands)
Equity in net earnings of Ibn Sina $ 267,172 $ 232,250 $ 161,704 Administrative expenses (67 ) (119 ) — Withholding tax expense (12,712 ) (11,329 ) (7,698 )
Net earnings $ 254,393 $ 220,802 $ 154,006
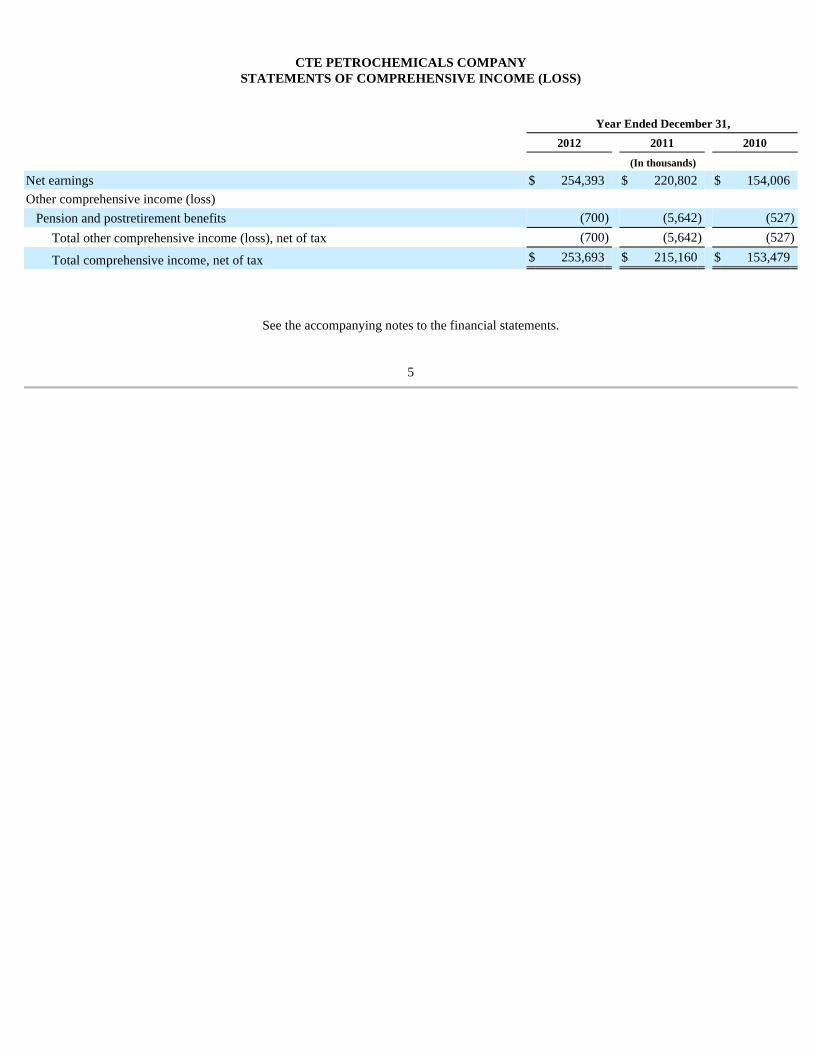
CTE PETROCHEMICALS COMPANY STATEMENTS OF COMPREHENSIVE INCOME (LOSS)
See the accompanying notes to the financial statements.
5
Year Ended December 31,
2012 2011 2010
(In thousands)
Net earnings $ 254,393 $ 220,802 $ 154,006 Other comprehensive income (loss)
Pension and postretirement benefits (700 ) (5,642 ) (527 )
Total other comprehensive income (loss), net of tax (700 ) (5,642 ) (527 )
Total comprehensive income, net of tax $ 253,693 $ 215,160 $ 153,479
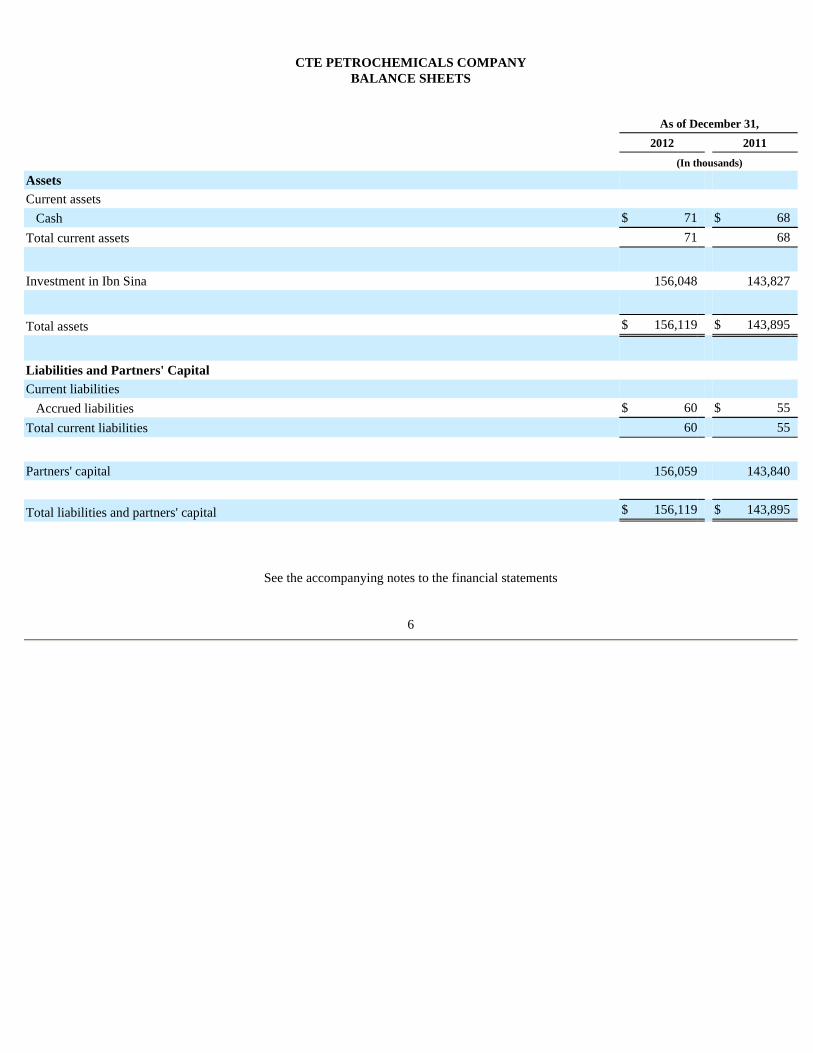
CTE PETROCHEMICALS COMPANY BALANCE SHEETS
See the accompanying notes to the financial statements
6
As of December 31,
2012 2011
(In thousands)
Assets
Current assets
Cash $ 71 $ 68 Total current assets 71 68
Investment in Ibn Sina 156,048 143,827
Total assets $ 156,119 $ 143,895
Liabilities and Partners' Capital
Current liabilities
Accrued liabilities $ 60 $ 55 Total current liabilities 60 55
Partners' capital 156,059 143,840
Total liabilities and partners' capital $ 156,119 $ 143,895
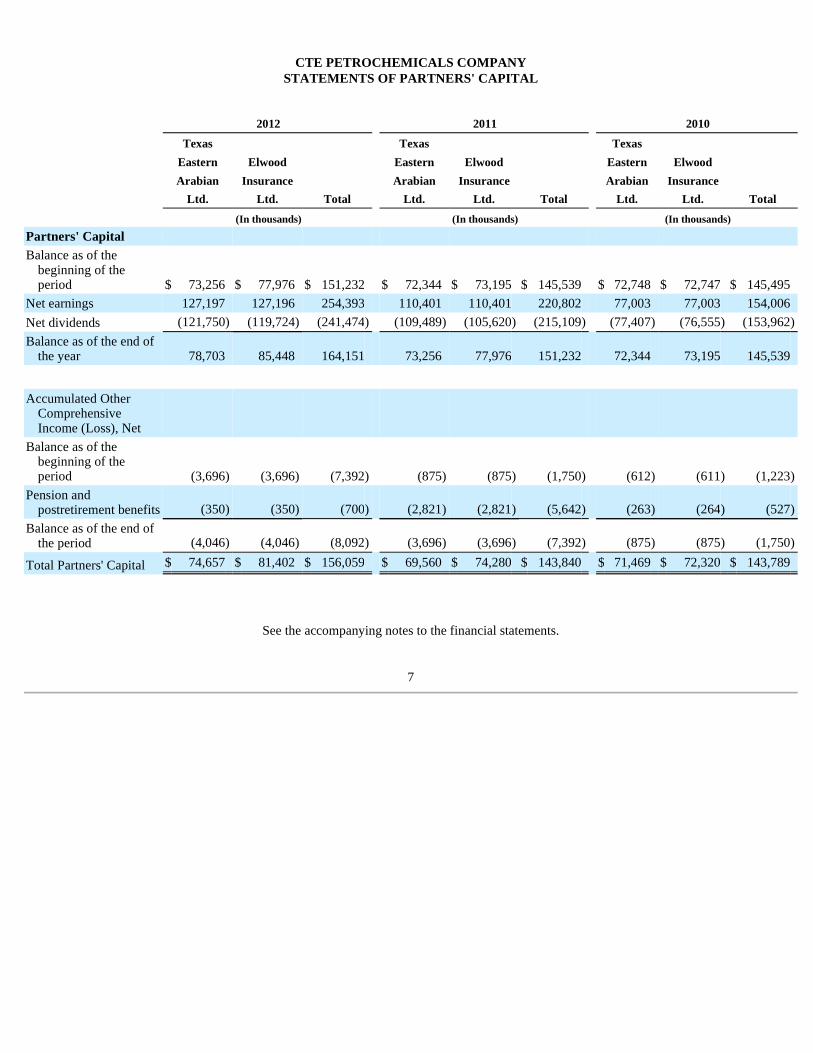
CTE PETROCHEMICALS COMPANY STATEMENTS OF PARTNERS' CAPITAL
See the accompanying notes to the financial statements.
7
2012 2011 2010
Texas Texas Texas
Eastern Elwood Eastern Elwood Eastern Elwood
Arabian Insurance Arabian Insurance Arabian Insurance
Ltd. Ltd. Total Ltd. Ltd. Total Ltd. Ltd. Total
(In thousands) (In thousands) (In thousands)
Partners' Capital
Balance as of the beginning of the period $ 73,256 $ 77,976 $ 151,232 $ 72,344 $ 73,195 $ 145,539 $ 72,748 $ 72,747 $ 145,495
Net earnings 127,197 127,196 254,393 110,401 110,401 220,802 77,003 77,003 154,006 Net dividends (121,750 ) (119,724 ) (241,474 ) (109,489 ) (105,620 ) (215,109 ) (77,407 ) (76,555 ) (153,962 )
Balance as of the end of the year 78,703 85,448 164,151 73,256 77,976 151,232 72,344 73,195 145,539
Accumulated Other Comprehensive Income (Loss), Net
Balance as of the beginning of the period (3,696 ) (3,696 ) (7,392 ) (875 ) (875 ) (1,750 ) (612 ) (611 ) (1,223 )
Pension and postretirement benefits (350 ) (350 ) (700 ) (2,821 ) (2,821 ) (5,642 ) (263 ) (264 ) (527 )
Balance as of the end of the period (4,046 ) (4,046 ) (8,092 ) (3,696 ) (3,696 ) (7,392 ) (875 ) (875 ) (1,750 )
Total Partners' Capital $ 74,657 $ 81,402 $ 156,059 $ 69,560 $ 74,280 $ 143,840 $ 71,469 $ 72,320 $ 143,789
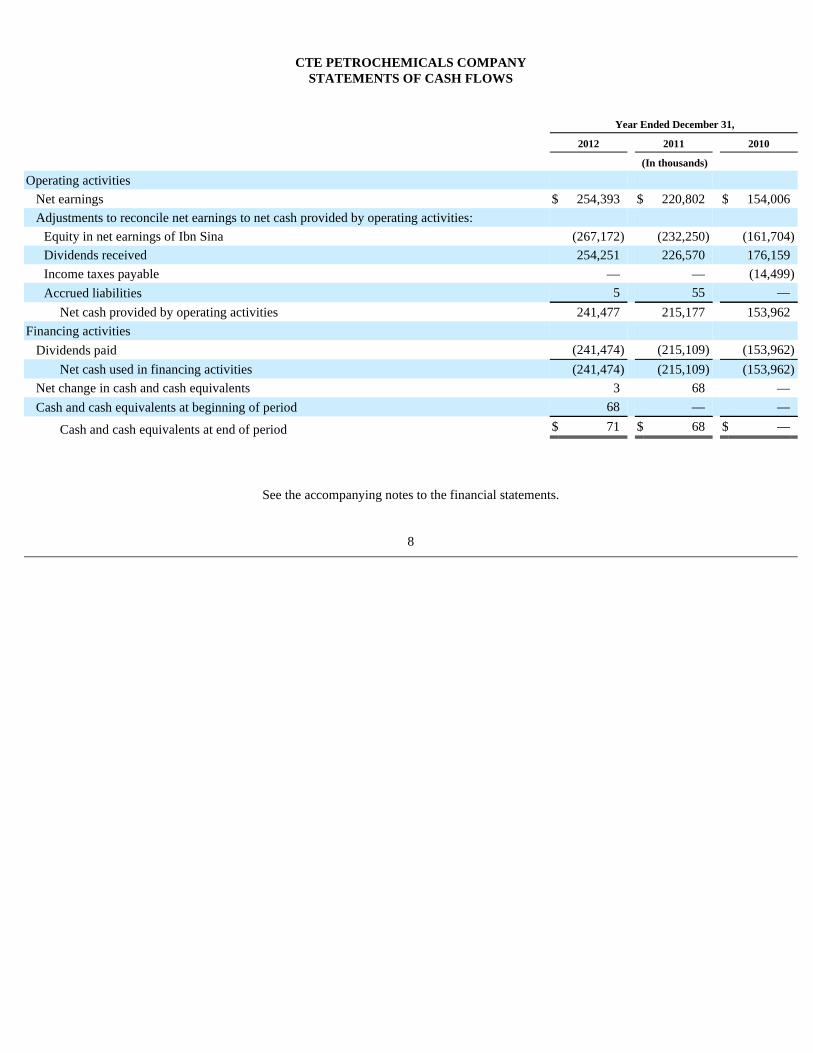
CTE PETROCHEMICALS COMPANY STATEMENTS OF CASH FLOWS
See the accompanying notes to the financial statements.
8
Year Ended December 31,
2012 2011 2010
(In thousands)
Operating activities
Net earnings $ 254,393 $ 220,802 $ 154,006 Adjustments to reconcile net earnings to net cash provided by operating activities:
Equity in net earnings of Ibn Sina (267,172 ) (232,250 ) (161,704 )
Dividends received 254,251 226,570 176,159 Income taxes payable — — (14,499 )
Accrued liabilities 5 55 — Net cash provided by operating activities 241,477 215,177 153,962
Financing activities
Dividends paid (241,474 ) (215,109 ) (153,962 )
Net cash used in financing activities (241,474 ) (215,109 ) (153,962 )
Net change in cash and cash equivalents 3 68 — Cash and cash equivalents at beginning of period 68 — —
Cash and cash equivalents at end of period $ 71 $ 68 $ —
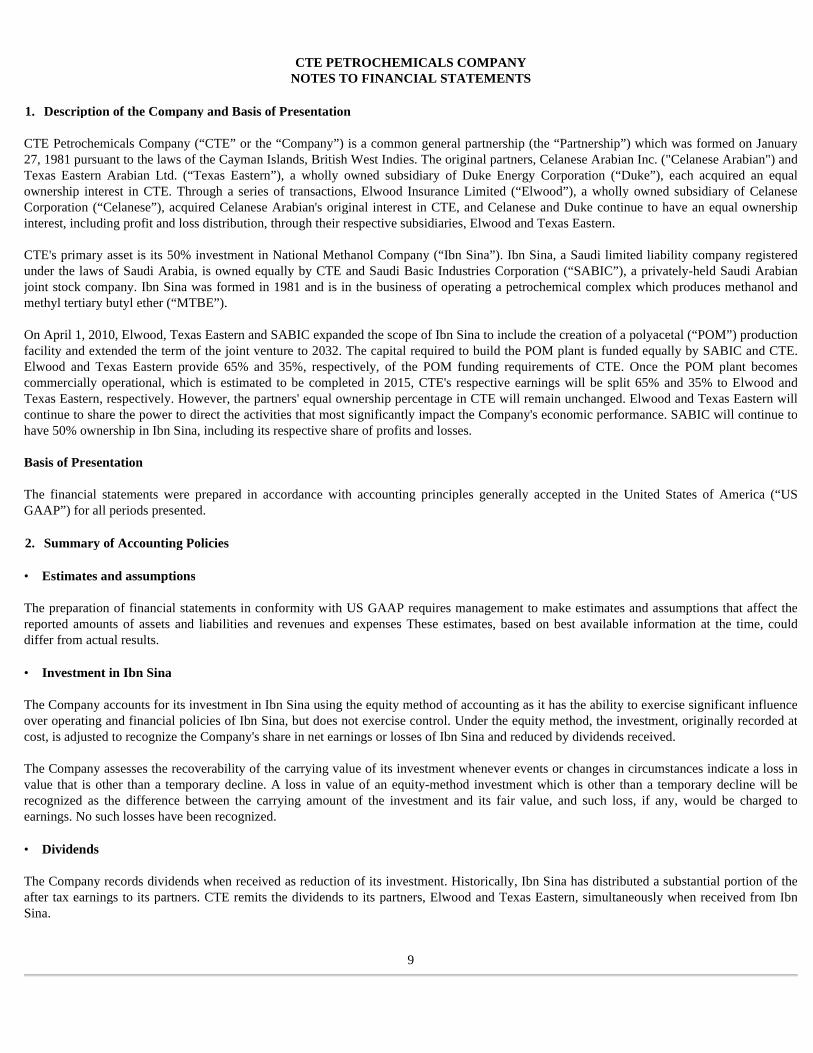
CTE PETROCHEMICALS COMPANY NOTES TO FINANCIAL STATEMENTS
CTE Petrochemicals Company (“CTE” or the “Company”) is a common general partnership (the “Partnership”) which was formed on January 27, 1981 pursuant to the laws of the Cayman Islands, British West Indies. The original partners, Celanese Arabian Inc. ("Celanese Arabian") and Texas Eastern Arabian Ltd. (“Texas Eastern”), a wholly owned subsidiary of Duke Energy Corporation (“Duke”), each acquired an equal ownership interest in CTE. Through a series of transactions, Elwood Insurance Limited (“Elwood”), a wholly owned subsidiary of Celanese Corporation (“Celanese”), acquired Celanese Arabian's original interest in CTE, and Celanese and Duke continue to have an equal ownership interest, including profit and loss distribution, through their respective subsidiaries, Elwood and Texas Eastern. CTE's primary asset is its 50% investment in National Methanol Company (“Ibn Sina”). Ibn Sina, a Saudi limited liability company registered under the laws of Saudi Arabia, is owned equally by CTE and Saudi Basic Industries Corporation (“SABIC”), a privately-held Saudi Arabian joint stock company. Ibn Sina was formed in 1981 and is in the business of operating a petrochemical complex which produces methanol and methyl tertiary butyl ether (“MTBE”). On April 1, 2010, Elwood, Texas Eastern and SABIC expanded the scope of Ibn Sina to include the creation of a polyacetal (“POM”) production facility and extended the term of the joint venture to 2032. The capital required to build the POM plant is funded equally by SABIC and CTE. Elwood and Texas Eastern provide 65% and 35%, respectively, of the POM funding requirements of CTE. Once the POM plant becomes commercially operational, which is estimated to be completed in 2015, CTE's respective earnings will be split 65% and 35% to Elwood and Texas Eastern, respectively. However, the partners' equal ownership percentage in CTE will remain unchanged. Elwood and Texas Eastern will continue to share the power to direct the activities that most significantly impact the Company's economic performance. SABIC will continue to have 50% ownership in Ibn Sina, including its respective share of profits and losses. Basis of Presentation The financial statements were prepared in accordance with accounting principles generally accepted in the United States of America (“US GAAP”) for all periods presented.
The preparation of financial statements in conformity with US GAAP requires management to make estimates and assumptions that affect the reported amounts of assets and liabilities and revenues and expenses These estimates, based on best available information at the time, could differ from actual results.
The Company accounts for its investment in Ibn Sina using the equity method of accounting as it has the ability to exercise significant influence over operating and financial policies of Ibn Sina, but does not exercise control. Under the equity method, the investment, originally recorded at cost, is adjusted to recognize the Company's share in net earnings or losses of Ibn Sina and reduced by dividends received. The Company assesses the recoverability of the carrying value of its investment whenever events or changes in circumstances indicate a loss in value that is other than a temporary decline. A loss in value of an equity-method investment which is other than a temporary decline will be recognized as the difference between the carrying amount of the investment and its fair value, and such loss, if any, would be charged to earnings. No such losses have been recognized.
The Company records dividends when received as reduction of its investment. Historically, Ibn Sina has distributed a substantial portion of the after tax earnings to its partners. CTE remits the dividends to its partners, Elwood and Texas Eastern, simultaneously when received from Ibn Sina.
9
1. Description of the Company and Basis of Presentation
2. Summary of Accounting Policies
• Estimates and assumptions
• Investment in Ibn Sina
• Dividends
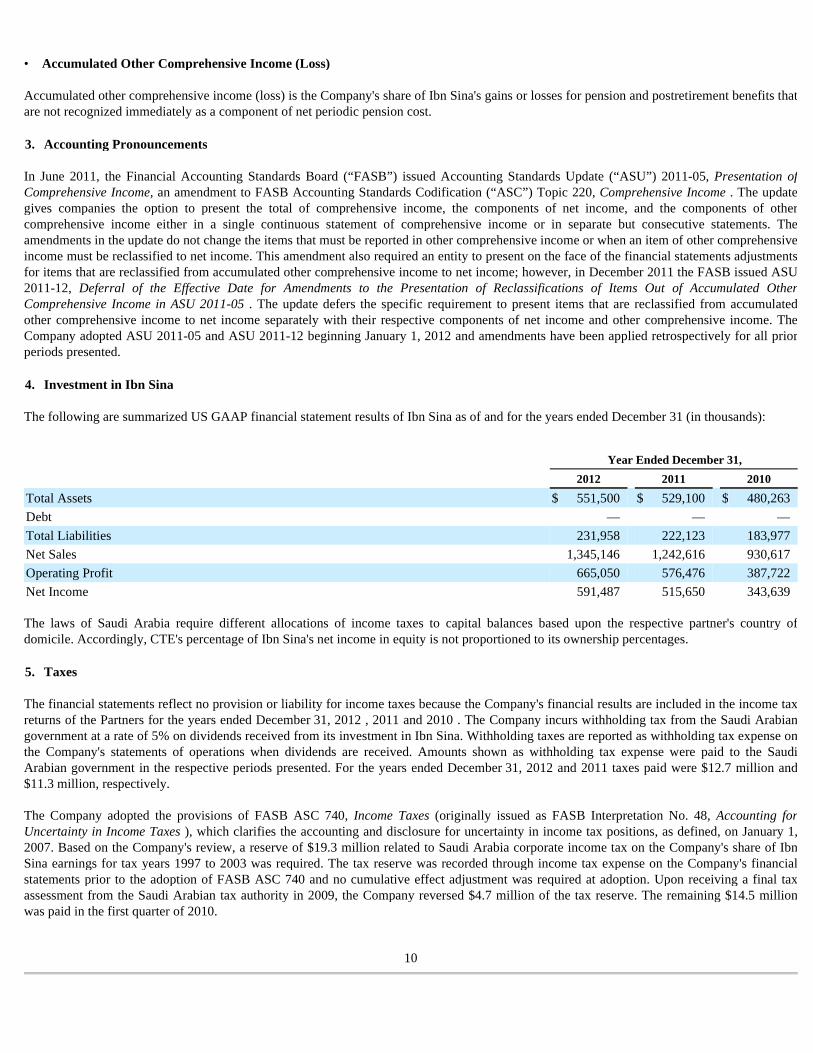
Accumulated other comprehensive income (loss) is the Company's share of Ibn Sina's gains or losses for pension and postretirement benefits that are not recognized immediately as a component of net periodic pension cost.
In June 2011, the Financial Accounting Standards Board (“FASB”) issued Accounting Standards Update (“ASU”) 2011-05, Presentation of Comprehensive Income, an amendment to FASB Accounting Standards Codification (“ASC”) Topic 220, Comprehensive Income . The update gives companies the option to present the total of comprehensive income, the components of net income, and the components of other comprehensive income either in a single continuous statement of comprehensive income or in separate but consecutive statements. The amendments in the update do not change the items that must be reported in other comprehensive income or when an item of other comprehensive income must be reclassified to net income. This amendment also required an entity to present on the face of the financial statements adjustments for items that are reclassified from accumulated other comprehensive income to net income; however, in December 2011 the FASB issued ASU 2011-12, Deferral of the Effective Date for Amendments to the Presentation of Reclassifications of Items Out of Accumulated Other Comprehensive Income in ASU 2011-05 . The update defers the specific requirement to present items that are reclassified from accumulated other comprehensive income to net income separately with their respective components of net income and other comprehensive income. The Company adopted ASU 2011-05 and ASU 2011-12 beginning January 1, 2012 and amendments have been applied retrospectively for all prior periods presented.
The following are summarized US GAAP financial statement results of Ibn Sina as of and for the years ended December 31 (in thousands):
The laws of Saudi Arabia require different allocations of income taxes to capital balances based upon the respective partner's country of domicile. Accordingly, CTE's percentage of Ibn Sina's net income in equity is not proportioned to its ownership percentages.
The financial statements reflect no provision or liability for income taxes because the Company's financial results are included in the income tax returns of the Partners for the years ended December 31, 2012 , 2011 and 2010 . The Company incurs withholding tax from the Saudi Arabian government at a rate of 5% on dividends received from its investment in Ibn Sina. Withholding taxes are reported as withholding tax expense on the Company's statements of operations when dividends are received. Amounts shown as withholding tax expense were paid to the Saudi Arabian government in the respective periods presented. For the years ended December 31, 2012 and 2011 taxes paid were $12.7 million and $11.3 million, respectively. The Company adopted the provisions of FASB ASC 740, Income Taxes (originally issued as FASB Interpretation No. 48, Accounting for Uncertainty in Income Taxes ), which clarifies the accounting and disclosure for uncertainty in income tax positions, as defined, on January 1, 2007. Based on the Company's review, a reserve of $19.3 million related to Saudi Arabia corporate income tax on the Company's share of Ibn Sina earnings for tax years 1997 to 2003 was required. The tax reserve was recorded through income tax expense on the Company's financial statements prior to the adoption of FASB ASC 740 and no cumulative effect adjustment was required at adoption. Upon receiving a final tax assessment from the Saudi Arabian tax authority in 2009, the Company reversed $4.7 million of the tax reserve. The remaining $14.5 million was paid in the first quarter of 2010.
10
• Accumulated Other Comprehensive Income (Loss)
3. Accounting Pronouncements
4. Investment in Ibn Sina
Year Ended December 31,
2012 2011 2010
Total Assets $ 551,500 $ 529,100 $ 480,263 Debt — — — Total Liabilities 231,958 222,123 183,977 Net Sales 1,345,146 1,242,616 930,617 Operating Profit 665,050 576,476 387,722 Net Income 591,487 515,650 343,639
5. Taxes

Subsequent events were updated through February 8, 2013 , the date at which the financial statements were available to be issued.
11
6. Subsequent Events
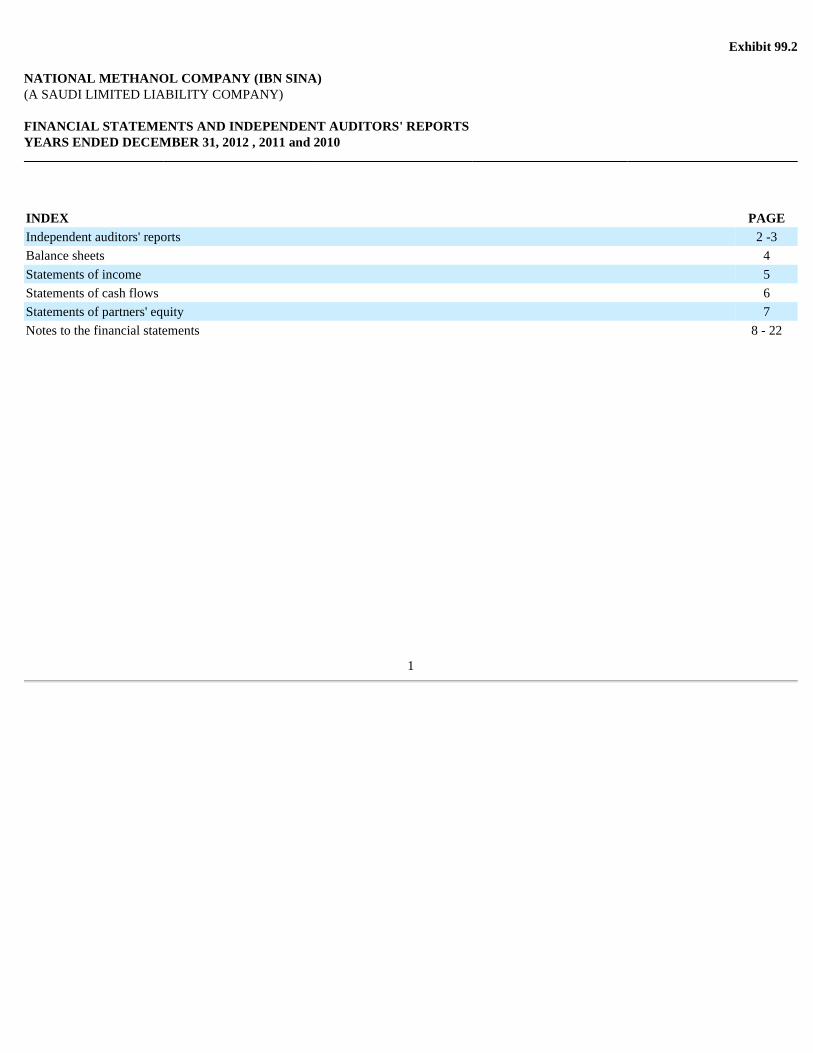
Exhibit 99.2
NATIONAL METHANOL COMPANY (IBN SINA) (A SAUDI LIMITED LIABILITY COMPANY) FINANCIAL STATEMENTS AND INDEPENDENT AUDITORS' REPO RTS YEARS ENDED DECEMBER 31, 2012 , 2011 and 2010
1
INDEX PAGE Independent auditors' reports 2 -3
Balance sheets 4
Statements of income 5
Statements of cash flows 6
Statements of partners' equity 7
Notes to the financial statements 8 - 22
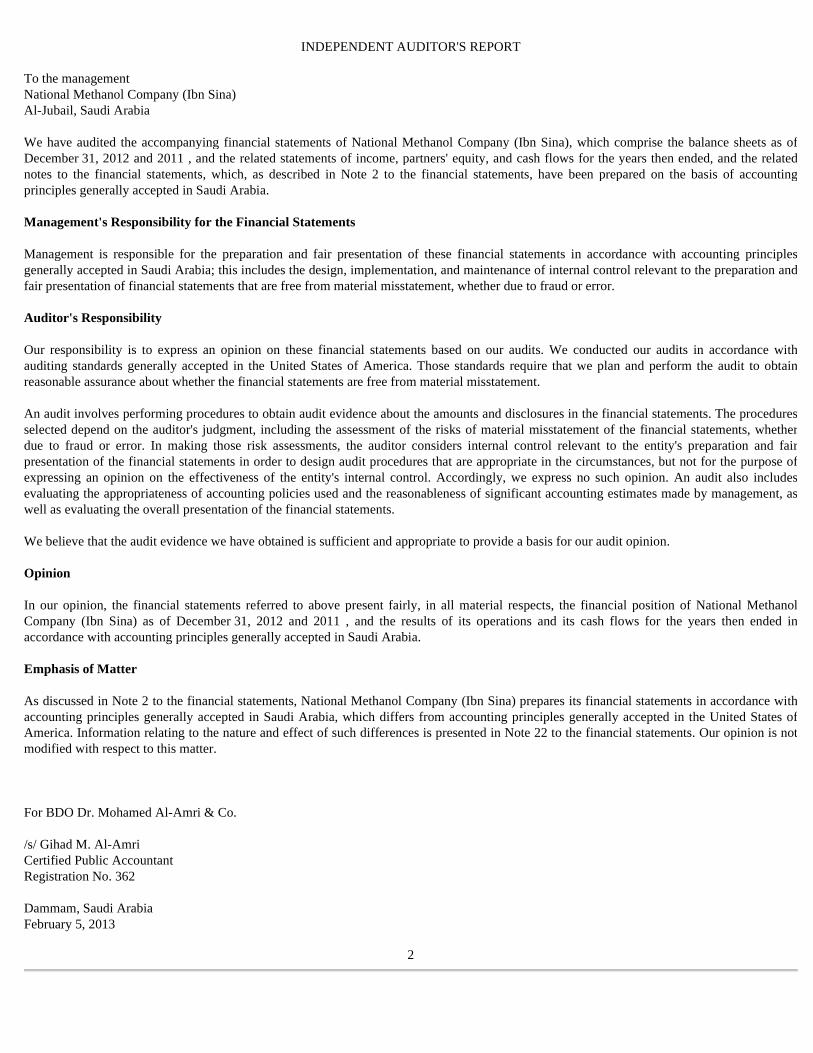
INDEPENDENT AUDITOR'S REPORT
To the management National Methanol Company (Ibn Sina) Al-Jubail, Saudi Arabia We have audited the accompanying financial statements of National Methanol Company (Ibn Sina), which comprise the balance sheets as of December 31, 2012 and 2011 , and the related statements of income, partners' equity, and cash flows for the years then ended, and the related notes to the financial statements, which, as described in Note 2 to the financial statements, have been prepared on the basis of accounting principles generally accepted in Saudi Arabia.
Management's Responsibility for the Financial Statements
Management is responsible for the preparation and fair presentation of these financial statements in accordance with accounting principles generally accepted in Saudi Arabia; this includes the design, implementation, and maintenance of internal control relevant to the preparation and fair presentation of financial statements that are free from material misstatement, whether due to fraud or error. Auditor's Responsibility Our responsibility is to express an opinion on these financial statements based on our audits. We conducted our audits in accordance with auditing standards generally accepted in the United States of America. Those standards require that we plan and perform the audit to obtain reasonable assurance about whether the financial statements are free from material misstatement. An audit involves performing procedures to obtain audit evidence about the amounts and disclosures in the financial statements. The procedures selected depend on the auditor's judgment, including the assessment of the risks of material misstatement of the financial statements, whether due to fraud or error. In making those risk assessments, the auditor considers internal control relevant to the entity's preparation and fair presentation of the financial statements in order to design audit procedures that are appropriate in the circumstances, but not for the purpose of expressing an opinion on the effectiveness of the entity's internal control. Accordingly, we express no such opinion. An audit also includes evaluating the appropriateness of accounting policies used and the reasonableness of significant accounting estimates made by management, as well as evaluating the overall presentation of the financial statements. We believe that the audit evidence we have obtained is sufficient and appropriate to provide a basis for our audit opinion. Opinion In our opinion, the financial statements referred to above present fairly, in all material respects, the financial position of National Methanol Company (Ibn Sina) as of December 31, 2012 and 2011 , and the results of its operations and its cash flows for the years then ended in accordance with accounting principles generally accepted in Saudi Arabia. Emphasis of Matter As discussed in Note 2 to the financial statements, National Methanol Company (Ibn Sina) prepares its financial statements in accordance with accounting principles generally accepted in Saudi Arabia, which differs from accounting principles generally accepted in the United States of America. Information relating to the nature and effect of such differences is presented in Note 22 to the financial statements. Our opinion is not modified with respect to this matter. For BDO Dr. Mohamed Al-Amri & Co. /s/ Gihad M. Al-Amri Certified Public Accountant Registration No. 362 Dammam, Saudi Arabia February 5, 2013
2
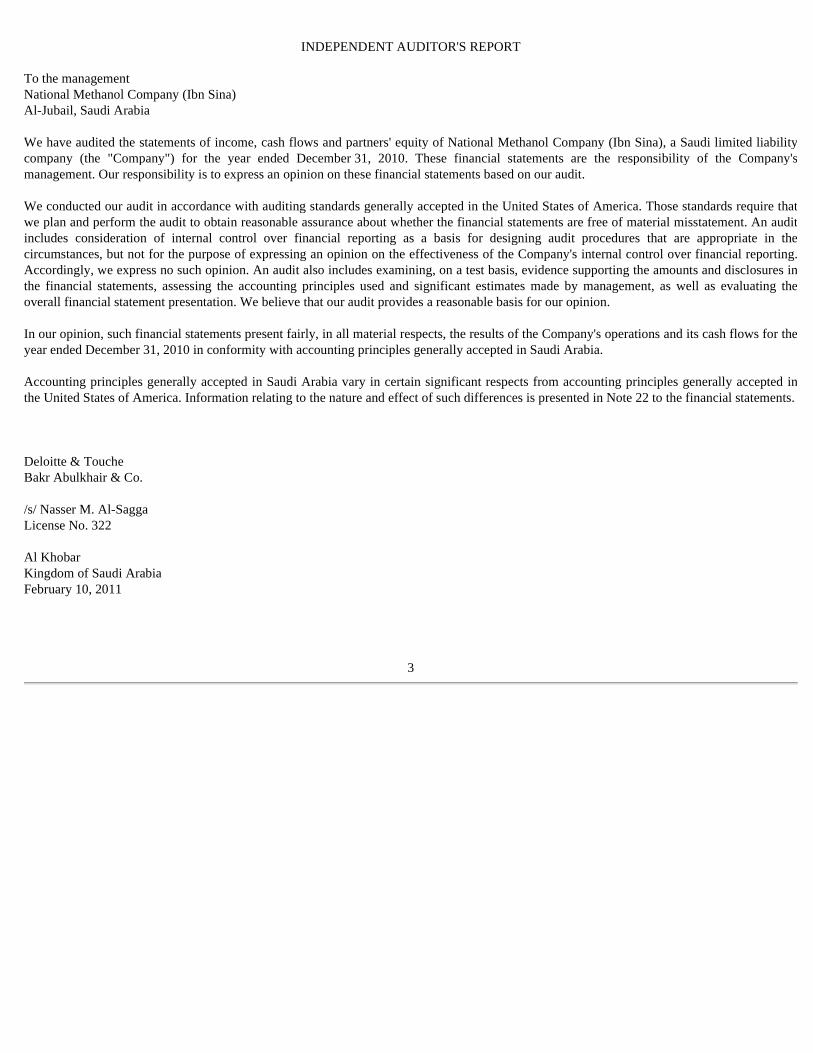
INDEPENDENT AUDITOR'S REPORT
To the management National Methanol Company (Ibn Sina) Al-Jubail, Saudi Arabia We have audited the statements of income, cash flows and partners' equity of National Methanol Company (Ibn Sina), a Saudi limited liability company (the "Company") for the year ended December 31, 2010. These financial statements are the responsibility of the Company's management. Our responsibility is to express an opinion on these financial statements based on our audit. We conducted our audit in accordance with auditing standards generally accepted in the United States of America. Those standards require that we plan and perform the audit to obtain reasonable assurance about whether the financial statements are free of material misstatement. An audit includes consideration of internal control over financial reporting as a basis for designing audit procedures that are appropriate in the circumstances, but not for the purpose of expressing an opinion on the effectiveness of the Company's internal control over financial reporting. Accordingly, we express no such opinion. An audit also includes examining, on a test basis, evidence supporting the amounts and disclosures in the financial statements, assessing the accounting principles used and significant estimates made by management, as well as evaluating the overall financial statement presentation. We believe that our audit provides a reasonable basis for our opinion. In our opinion, such financial statements present fairly, in all material respects, the results of the Company's operations and its cash flows for the year ended December 31, 2010 in conformity with accounting principles generally accepted in Saudi Arabia. Accounting principles generally accepted in Saudi Arabia vary in certain significant respects from accounting principles generally accepted in the United States of America. Information relating to the nature and effect of such differences is presented in Note 22 to the financial statements. Deloitte & Touche Bakr Abulkhair & Co. /s/ Nasser M. Al-Sagga License No. 322 Al Khobar Kingdom of Saudi Arabia February 10, 2011
3
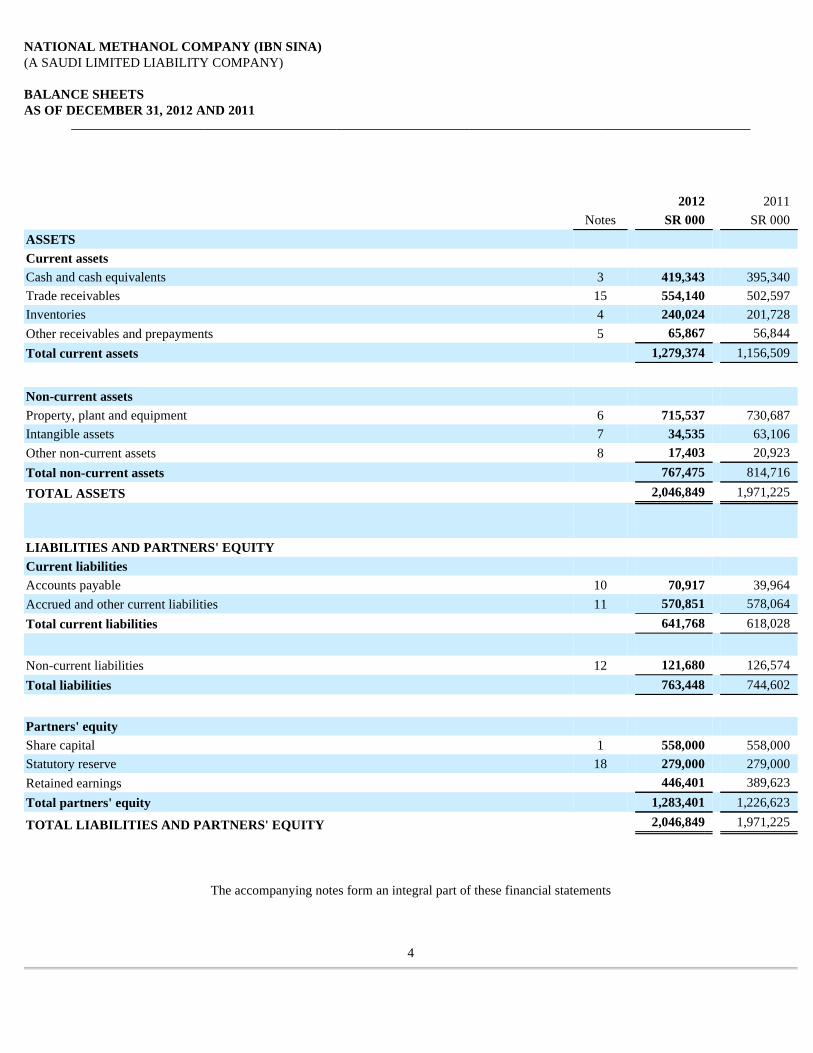
NATIONAL METHANOL COMPANY (IBN SINA) (A SAUDI LIMITED LIABILITY COMPANY) BALANCE SHEETS AS OF DECEMBER 31, 2012 AND 2011
The accompanying notes form an integral part of these financial statements
4
2012 2011 Notes SR 000 SR 000 ASSETS
Current assets
Cash and cash equivalents 3 419,343 395,340 Trade receivables 15 554,140 502,597 Inventories 4 240,024 201,728 Other receivables and prepayments 5 65,867 56,844 Total current assets 1,279,374 1,156,509
Non-current assets
Property, plant and equipment 6 715,537 730,687 Intangible assets 7 34,535 63,106 Other non-current assets 8 17,403 20,923 Total non-current assets 767,475 814,716
TOTAL ASSETS 2,046,849 1,971,225
LIABILITIES AND PARTNERS' EQUITY
Current liabilities
Accounts payable 10 70,917 39,964 Accrued and other current liabilities 11 570,851 578,064 Total current liabilities 641,768 618,028
Non-current liabilities 12 121,680 126,574 Total liabilities 763,448 744,602
Partners' equity
Share capital 1 558,000 558,000 Statutory reserve 18 279,000 279,000 Retained earnings 446,401 389,623 Total partners' equity 1,283,401 1,226,623
TOTAL LIABILITIES AND PARTNERS' EQUITY 2,046,849 1,971,225
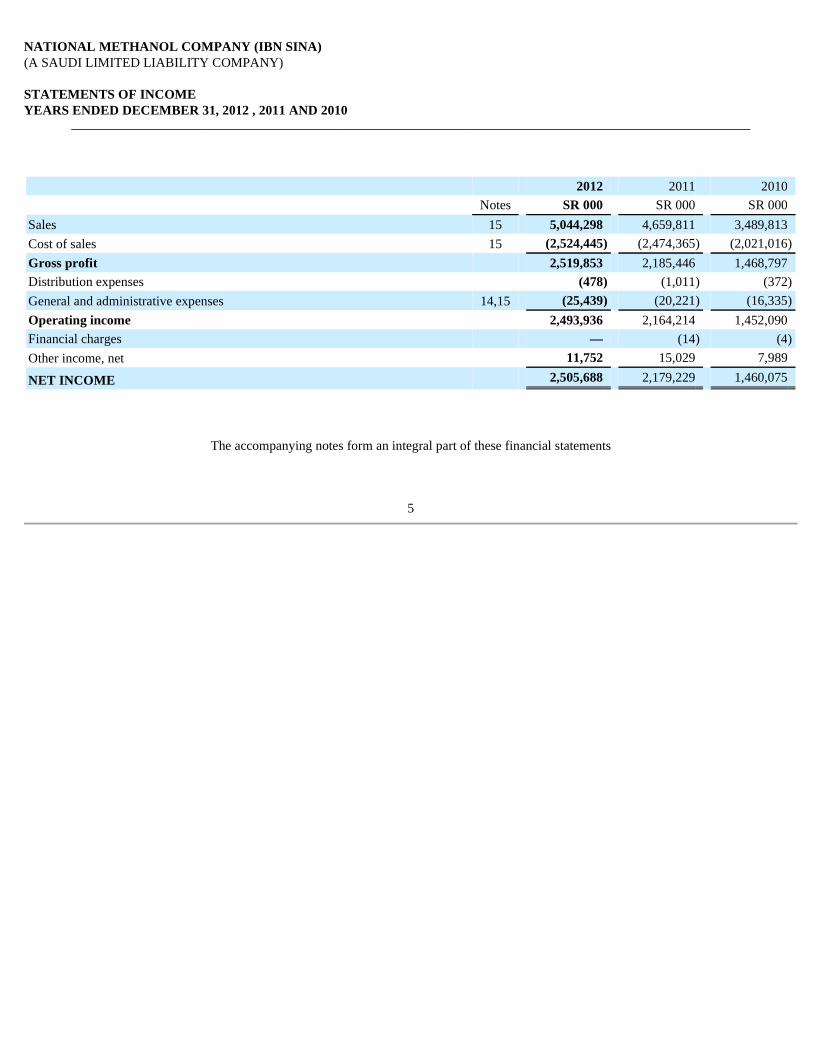
NATIONAL METHANOL COMPANY (IBN SINA) (A SAUDI LIMITED LIABILITY COMPANY) STATEMENTS OF INCOME YEARS ENDED DECEMBER 31, 2012 , 2011 AND 2010
The accompanying notes form an integral part of these financial statements
5
2012 2011 2010 Notes SR 000 SR 000 SR 000 Sales 15 5,044,298 4,659,811 3,489,813 Cost of sales 15 (2,524,445 ) (2,474,365 ) (2,021,016 )
Gross profit 2,519,853 2,185,446 1,468,797 Distribution expenses (478 ) (1,011 ) (372 )
General and administrative expenses 14,15 (25,439 ) (20,221 ) (16,335 )
Operating income 2,493,936 2,164,214 1,452,090 Financial charges — (14 ) (4 )
Other income, net 11,752 15,029 7,989
NET INCOME 2,505,688 2,179,229 1,460,075
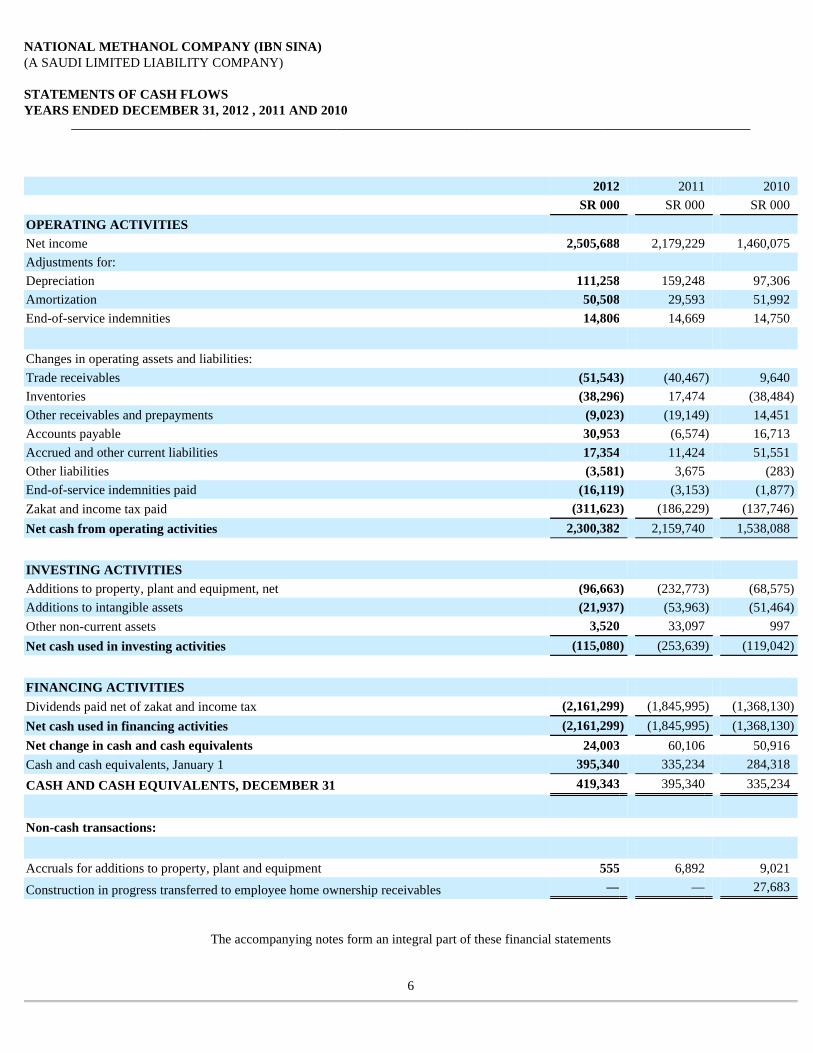
NATIONAL METHANOL COMPANY (IBN SINA) (A SAUDI LIMITED LIABILITY COMPANY) STATEMENTS OF CASH FLOWS YEARS ENDED DECEMBER 31, 2012 , 2011 AND 2010
The accompanying notes form an integral part of these financial statements
6
2012 2011 2010 SR 000 SR 000 SR 000 OPERATING ACTIVITIES
Net income 2,505,688 2,179,229 1,460,075 Adjustments for:
Depreciation 111,258 159,248 97,306 Amortization 50,508 29,593 51,992 End-of-service indemnities 14,806 14,669 14,750
Changes in operating assets and liabilities:
Trade receivables (51,543 ) (40,467 ) 9,640 Inventories (38,296 ) 17,474 (38,484 )
Other receivables and prepayments (9,023 ) (19,149 ) 14,451 Accounts payable 30,953 (6,574 ) 16,713 Accrued and other current liabilities 17,354 11,424 51,551 Other liabilities (3,581 ) 3,675 (283 )
End-of-service indemnities paid (16,119 ) (3,153 ) (1,877 )
Zakat and income tax paid (311,623 ) (186,229 ) (137,746 )
Net cash from operating activities 2,300,382 2,159,740 1,538,088
INVESTING ACTIVITIES
Additions to property, plant and equipment, net (96,663 ) (232,773 ) (68,575 )
Additions to intangible assets (21,937 ) (53,963 ) (51,464 )
Other non-current assets 3,520 33,097 997 Net cash used in investing activities (115,080 ) (253,639 ) (119,042 )
FINANCING ACTIVITIES
Dividends paid net of zakat and income tax (2,161,299 ) (1,845,995 ) (1,368,130 )
Net cash used in financing activities (2,161,299 ) (1,845,995 ) (1,368,130 )
Net change in cash and cash equivalents 24,003 60,106 50,916 Cash and cash equivalents, January 1 395,340 335,234 284,318
CASH AND CASH EQUIVALENTS, DECEMBER 31 419,343 395,340 335,234
Non-cash transactions:
Accruals for additions to property, plant and equipment 555 6,892 9,021
Construction in progress transferred to employee home ownership receivables — — 27,683
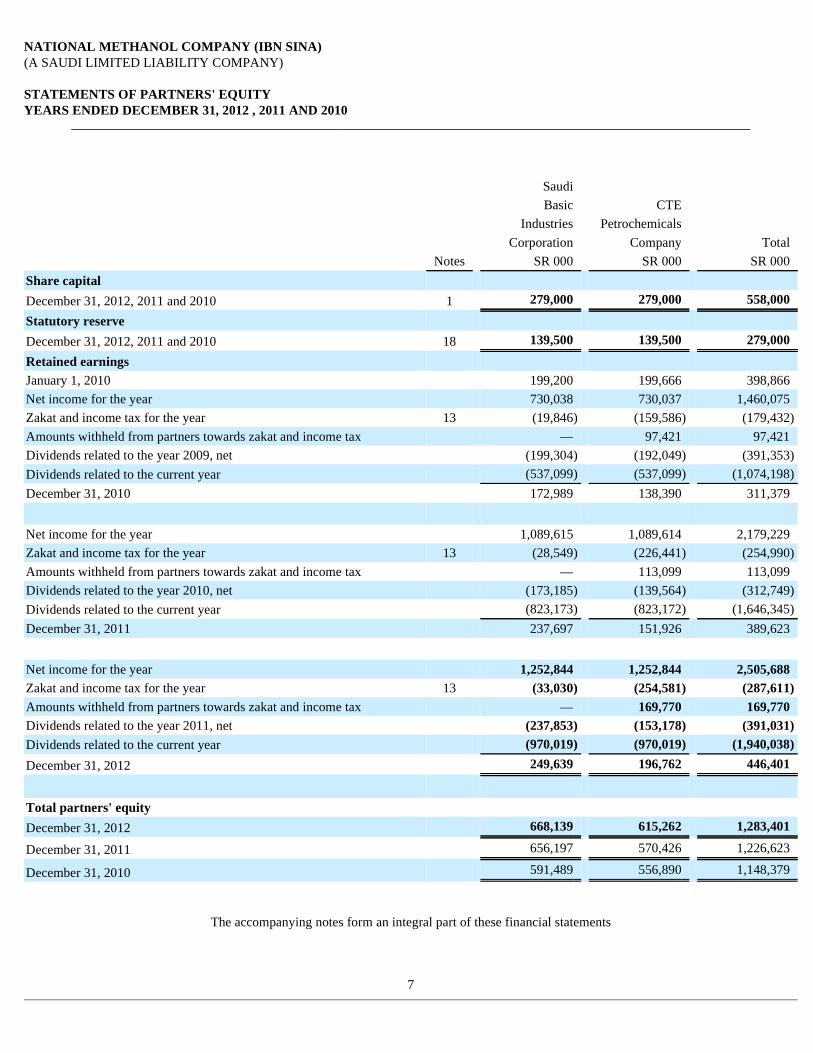
NATIONAL METHANOL COMPANY (IBN SINA) (A SAUDI LIMITED LIABILITY COMPANY) STATEMENTS OF PARTNERS' EQUITY YEARS ENDED DECEMBER 31, 2012 , 2011 AND 2010
The accompanying notes form an integral part of these financial statements
7
Saudi
Basic CTE
Industries Petrochemicals
Corporation Company Total Notes SR 000 SR 000 SR 000 Share capital
December 31, 2012, 2011 and 2010 1 279,000 279,000 558,000
Statutory reserve
December 31, 2012, 2011 and 2010 18 139,500 139,500 279,000
Retained earnings
January 1, 2010 199,200 199,666 398,866 Net income for the year 730,038 730,037 1,460,075 Zakat and income tax for the year 13 (19,846 ) (159,586 ) (179,432 )
Amounts withheld from partners towards zakat and income tax — 97,421 97,421 Dividends related to the year 2009, net (199,304 ) (192,049 ) (391,353 )
Dividends related to the current year (537,099 ) (537,099 ) (1,074,198 )
December 31, 2010 172,989 138,390 311,379
Net income for the year 1,089,615 1,089,614 2,179,229 Zakat and income tax for the year 13 (28,549 ) (226,441 ) (254,990 )
Amounts withheld from partners towards zakat and income tax — 113,099 113,099 Dividends related to the year 2010, net (173,185 ) (139,564 ) (312,749 )
Dividends related to the current year (823,173 ) (823,172 ) (1,646,345 )
December 31, 2011 237,697 151,926 389,623
Net income for the year 1,252,844 1,252,844 2,505,688 Zakat and income tax for the year 13 (33,030 ) (254,581 ) (287,611 ) Amounts withheld from partners towards zakat and income tax — 169,770 169,770 Dividends related to the year 2011, net (237,853 ) (153,178 ) (391,031 )
Dividends related to the current year (970,019 ) (970,019 ) (1,940,038 )
December 31, 2012 249,639 196,762 446,401
Total partners' equity
December 31, 2012 668,139 615,262 1,283,401
December 31, 2011 656,197 570,426 1,226,623
December 31, 2010 591,489 556,890 1,148,379
NATIONAL METHANOL COMPANY (IBN SINA) (A SAUDI LIMITED LIABILITY COMPANY) NOTES TO THE FINANCIAL STATEMENTS YEARS ENDED DECEMBER 31, 2012, 2011 AND 2010
National Methanol Company (“Ibn Sina”) (“the Company”) is a Saudi limited liability company registered under Commercial Registration No. 2055000779 dated 19 Rajab 1401H (May 23, 1981). The Company is owned equally by Saudi Basic Industries Corporation (“SABIC”), a Saudi Arabian joint stock company and CTE Petrochemicals Company (“CTE”), a partnership registered in Cayman Islands, British West Indies. CTE is equally owned by Elwood Insurance Ltd., a Bermuda Corporation and Texas Eastern Arabian Ltd., a Bermuda Corporation (collectively "the Partners"). The authorized share capital of the Company is SR 742 million divided into 7,420 units of SR 100,000 each. The paid up capital at December 31, 2012 and 2011 was SR 558 million comprised of 5,580 units of SR 100,000 each. The Company's principal business activity is to operate a petrochemical complex at Al-Jubail Industrial City which produces Methanol and Methyl Tertiary Butyl Ether (“MTBE”). The Company's Methanol and MTBE plants commenced commercial operations on November 1, 1984 and July 1, 1994, respectively. SABIC distributes and markets the Company's products. During 2010, the partners agreed to expand the Company's activities by establishing a plant for the manufacturing of polyoxymethylene (“POM”). The Company's registered office is in Al-Jubail Industrial City in the Kingdom of Saudi Arabia.
The accompanying financial statements have been prepared in compliance with the accounting standards issued by the Saudi Organization for Certified Public Accountants ("SOCPA"). The following is a summary of significant accounting policies applied by the Company: Accounting convention The financial statements are prepared under the historical cost convention. Revenue recognition Product sales are made to SABIC (“the Marketer”). Upon delivery of products to the Marketer, sales are recorded at provisional selling prices net of marketing expenses paid directly by the Marketer. These selling prices are later adjusted based upon actual selling prices received by the Marketer from third parties. Adjustments are recorded as they become known to the Company. Distribution and general and administrative expenses Distribution expenses principally comprise of costs incurred in the distribution and sale of the Company's products / services. All other expenses are classified as general and administrative expenses. General and administrative expenses include indirect costs not specifically part of production costs as required under the accounting standards issued by SOCPA. Allocations between general and administrative expenses and cost of sales, when required, are made on a consistent basis. Accounts receivable Accounts receivable are stated at the original invoice amount less an allowance for any uncollectible amounts. Adjustments are recorded as they become known to the Company. An estimate for doubtful debts is made when the collection of the accounts receivable amount is considered doubtful. Bad debts are written off as incurred.
8
1. ORGANIZATION AND ACTIVITIES
2. SUMMARY OF SIGNIFICANT ACCOUNTING POLICIES
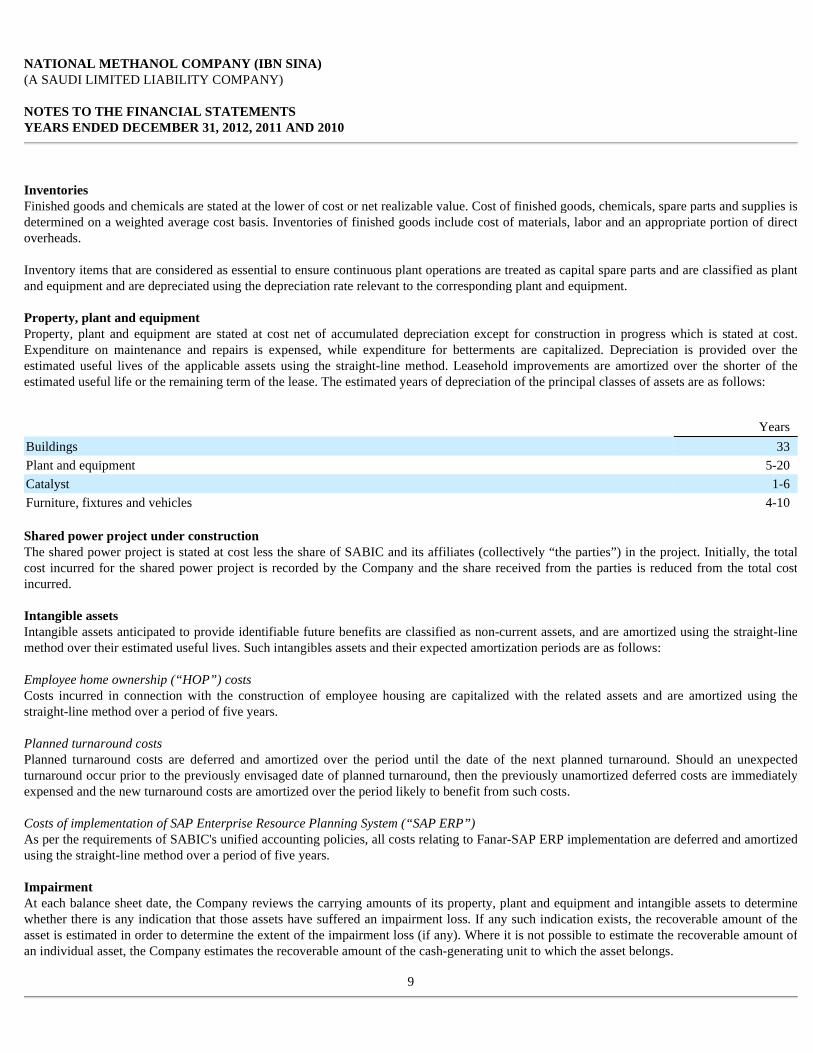
NATIONAL METHANOL COMPANY (IBN SINA) (A SAUDI LIMITED LIABILITY COMPANY) NOTES TO THE FINANCIAL STATEMENTS YEARS ENDED DECEMBER 31, 2012, 2011 AND 2010
Inventories Finished goods and chemicals are stated at the lower of cost or net realizable value. Cost of finished goods, chemicals, spare parts and supplies is determined on a weighted average cost basis. Inventories of finished goods include cost of materials, labor and an appropriate portion of direct overheads. Inventory items that are considered as essential to ensure continuous plant operations are treated as capital spare parts and are classified as plant and equipment and are depreciated using the depreciation rate relevant to the corresponding plant and equipment. Property, plant and equipment Property, plant and equipment are stated at cost net of accumulated depreciation except for construction in progress which is stated at cost. Expenditure on maintenance and repairs is expensed, while expenditure for betterments are capitalized. Depreciation is provided over the estimated useful lives of the applicable assets using the straight-line method. Leasehold improvements are amortized over the shorter of the estimated useful life or the remaining term of the lease. The estimated years of depreciation of the principal classes of assets are as follows:
Shared power project under construction The shared power project is stated at cost less the share of SABIC and its affiliates (collectively “the parties”) in the project. Initially, the total cost incurred for the shared power project is recorded by the Company and the share received from the parties is reduced from the total cost incurred. Intangible assets Intangible assets anticipated to provide identifiable future benefits are classified as non-current assets, and are amortized using the straight-line method over their estimated useful lives. Such intangibles assets and their expected amortization periods are as follows: Employee home ownership (“HOP”) costs Costs incurred in connection with the construction of employee housing are capitalized with the related assets and are amortized using the straight-line method over a period of five years. Planned turnaround costs Planned turnaround costs are deferred and amortized over the period until the date of the next planned turnaround. Should an unexpected turnaround occur prior to the previously envisaged date of planned turnaround, then the previously unamortized deferred costs are immediately expensed and the new turnaround costs are amortized over the period likely to benefit from such costs. Costs of implementation of SAP Enterprise Resource Planning System (“SAP ERP”) As per the requirements of SABIC's unified accounting policies, all costs relating to Fanar-SAP ERP implementation are deferred and amortized using the straight-line method over a period of five years.
Impairment At each balance sheet date, the Company reviews the carrying amounts of its property, plant and equipment and intangible assets to determine whether there is any indication that those assets have suffered an impairment loss. If any such indication exists, the recoverable amount of the asset is estimated in order to determine the extent of the impairment loss (if any). Where it is not possible to estimate the recoverable amount of an individual asset, the Company estimates the recoverable amount of the cash-generating unit to which the asset belongs.
9
Years Buildings 33 Plant and equipment 5-20 Catalyst 1-6 Furniture, fixtures and vehicles 4-10
NATIONAL METHANOL COMPANY (IBN SINA) (A SAUDI LIMITED LIABILITY COMPANY) NOTES TO THE FINANCIAL STATEMENTS YEARS ENDED DECEMBER 31, 2012, 2011 AND 2010
If the recoverable amount of an asset (or cash-generating unit) is estimated to be less than its carrying amount, the carrying amount of the asset (cash-generating unit) is reduced to its recoverable amount. Impairment losses are recognized as an expense immediately. Where an impairment loss subsequently reverses, the carrying amount of the asset (cash-generating unit) is increased to the revised estimate of its recoverable amount, but so that the increased carrying amount does not exceed the carrying amount that would have been determined had no impairment loss been recognized for the asset (cash-generating unit) in prior years. A reversal of an impairment loss is recognized as income immediately. Production advances Amounts received from affiliates in respect of capital advances to finance tangible assets of the Company are included under non-current liabilities and are amortized over the estimated useful lives of the related assets using the straight-line method. End-of-service indemnities End-of-service indemnities, required by the Saudi Arabian labor law, are provided in the financial statements based on the employees' length of service. Employees' home ownership program The Company has a home ownership program that offers eligible Saudi employees home ownership opportunities. Unsold housing units constructed for eventual sale to eligible employees are included under property, plant and equipment and depreciated over 33 years. When the houses are allocated to the employees, the cost of houses constructed and sold to the employees under the program is transferred from property, plant and equipment to other non-current assets. Down payments and installments of purchase price received from employees are set off against the other non-current assets. The cost of the houses and the related purchase price is removed from other non-current assets when the title to the houses is transferred to the employees, at which time, no significant gain or loss is expected to result to the Company.
Employees' savings plan The Company maintains an employee saving plan. The contributions from the participants are deposited in a separate bank account and provision is established for the Company's contribution. Dividends Dividends are recognised as a liability at the time of their approval by the Board of Directors. Interim dividends are recorded as and when approved by the Board of Directors. Foreign currency translation Foreign currency transactions are translated into Saudi Riyals at the rates of exchange prevailing at the time of the transactions. Monetary assets and liabilities denominated in foreign currencies at the balance sheet date are translated to Saudi Riyals at the exchange rates prevailing at that date. Gains and losses from settlement and translation of foreign currency transactions are included in the statement of income. Zakat and income tax The Company is subject to the Regulations of the Department of Zakat and Income Tax ("DZIT") in the Kingdom of Saudi Arabia. Zakat and income tax are provided on an accruals basis and charged to retained earnings. The zakat charge is computed at 2.5% on the zakat base or adjusted net income, whichever is higher. Income tax is computed at 20% of adjusted net income. Any difference in the estimate is recorded when the final assessment is approved, at which time the provision is cleared.
10
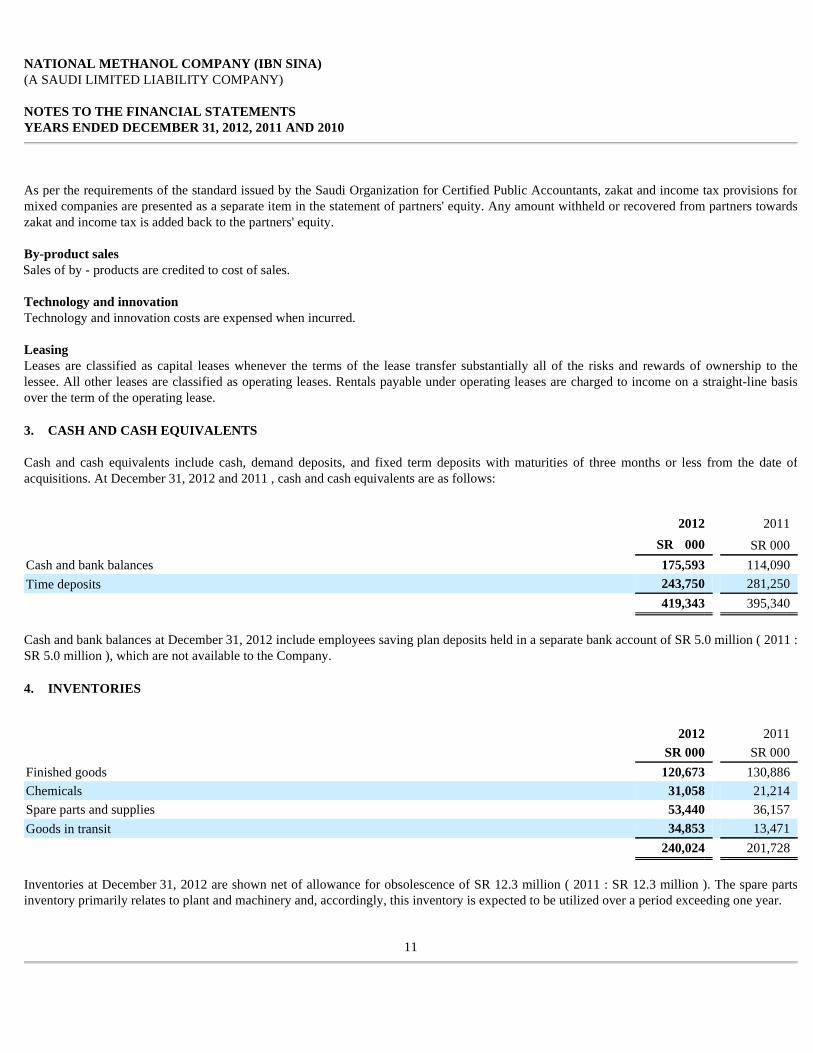
NATIONAL METHANOL COMPANY (IBN SINA) (A SAUDI LIMITED LIABILITY COMPANY) NOTES TO THE FINANCIAL STATEMENTS YEARS ENDED DECEMBER 31, 2012, 2011 AND 2010
As per the requirements of the standard issued by the Saudi Organization for Certified Public Accountants, zakat and income tax provisions for mixed companies are presented as a separate item in the statement of partners' equity. Any amount withheld or recovered from partners towards zakat and income tax is added back to the partners' equity. By-product sales Sales of by - products are credited to cost of sales. Technology and innovation Technology and innovation costs are expensed when incurred. Leasing Leases are classified as capital leases whenever the terms of the lease transfer substantially all of the risks and rewards of ownership to the lessee. All other leases are classified as operating leases. Rentals payable under operating leases are charged to income on a straight-line basis over the term of the operating lease.
Cash and cash equivalents include cash, demand deposits, and fixed term deposits with maturities of three months or less from the date of acquisitions. At December 31, 2012 and 2011 , cash and cash equivalents are as follows:
Cash and bank balances at December 31, 2012 include employees saving plan deposits held in a separate bank account of SR 5.0 million ( 2011 : SR 5.0 million ), which are not available to the Company.
Inventories at December 31, 2012 are shown net of allowance for obsolescence of SR 12.3 million ( 2011 : SR 12.3 million ). The spare parts inventory primarily relates to plant and machinery and, accordingly, this inventory is expected to be utilized over a period exceeding one year.
11
3. CASH AND CASH EQUIVALENTS
2012 2011
SR 000 SR 000 Cash and bank balances 175,593 114,090 Time deposits 243,750 281,250
419,343 395,340
4. INVENTORIES
2012 2011 SR 000 SR 000 Finished goods 120,673 130,886 Chemicals 31,058 21,214 Spare parts and supplies 53,440 36,157 Goods in transit 34,853 13,471
240,024 201,728
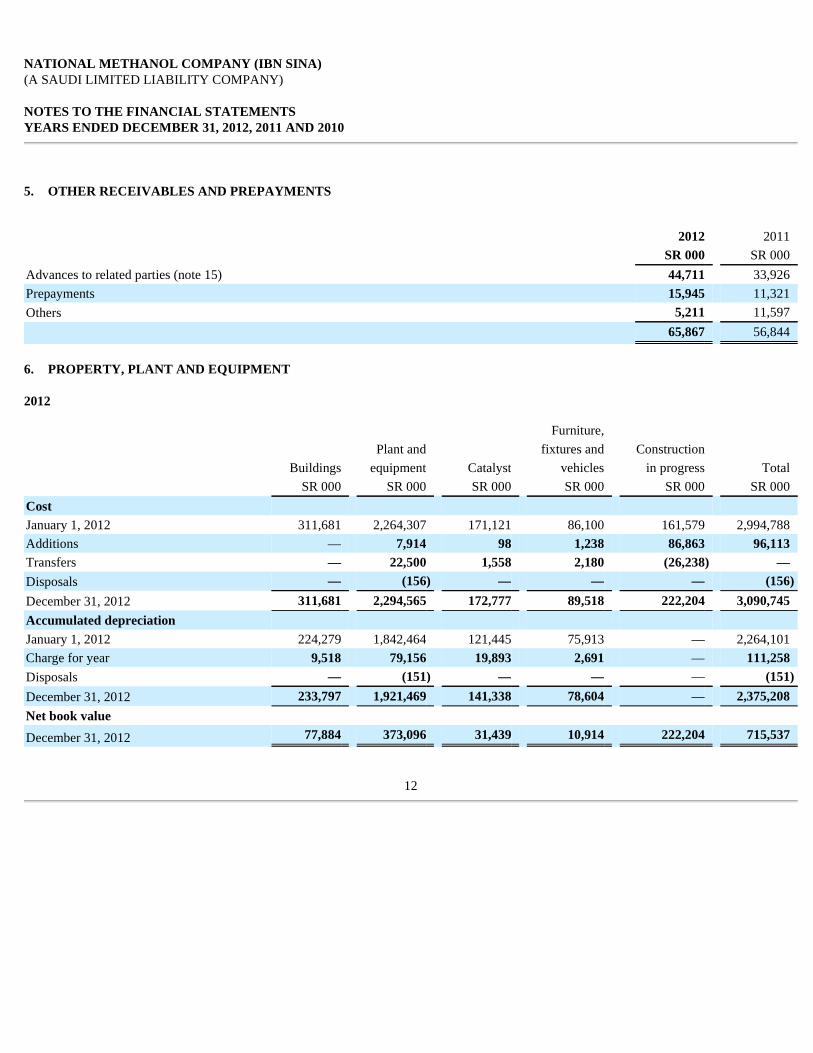
NATIONAL METHANOL COMPANY (IBN SINA) (A SAUDI LIMITED LIABILITY COMPANY) NOTES TO THE FINANCIAL STATEMENTS YEARS ENDED DECEMBER 31, 2012, 2011 AND 2010
2012
12
5. OTHER RECEIVABLES AND PREPAYMENTS
2012 2011 SR 000 SR 000 Advances to related parties (note 15) 44,711 33,926 Prepayments 15,945 11,321 Others 5,211 11,597
65,867 56,844
6. PROPERTY, PLANT AND EQUIPMENT
Furniture,
Plant and fixtures and Construction
Buildings equipment Catalyst vehicles in progress Total SR 000 SR 000 SR 000 SR 000 SR 000 SR 000 Cost
January 1, 2012 311,681 2,264,307 171,121 86,100 161,579 2,994,788 Additions — 7,914 98 1,238 86,863 96,113 Transfers — 22,500 1,558 2,180 (26,238 ) — Disposals — (156 ) — — — (156 )
December 31, 2012 311,681 2,294,565 172,777 89,518 222,204 3,090,745 Accumulated depreciation
January 1, 2012 224,279 1,842,464 121,445 75,913 — 2,264,101 Charge for year 9,518 79,156 19,893 2,691 — 111,258 Disposals — (151 ) — — — (151 )
December 31, 2012 233,797 1,921,469 141,338 78,604 — 2,375,208 Net book value
December 31, 2012 77,884 373,096 31,439 10,914 222,204 715,537
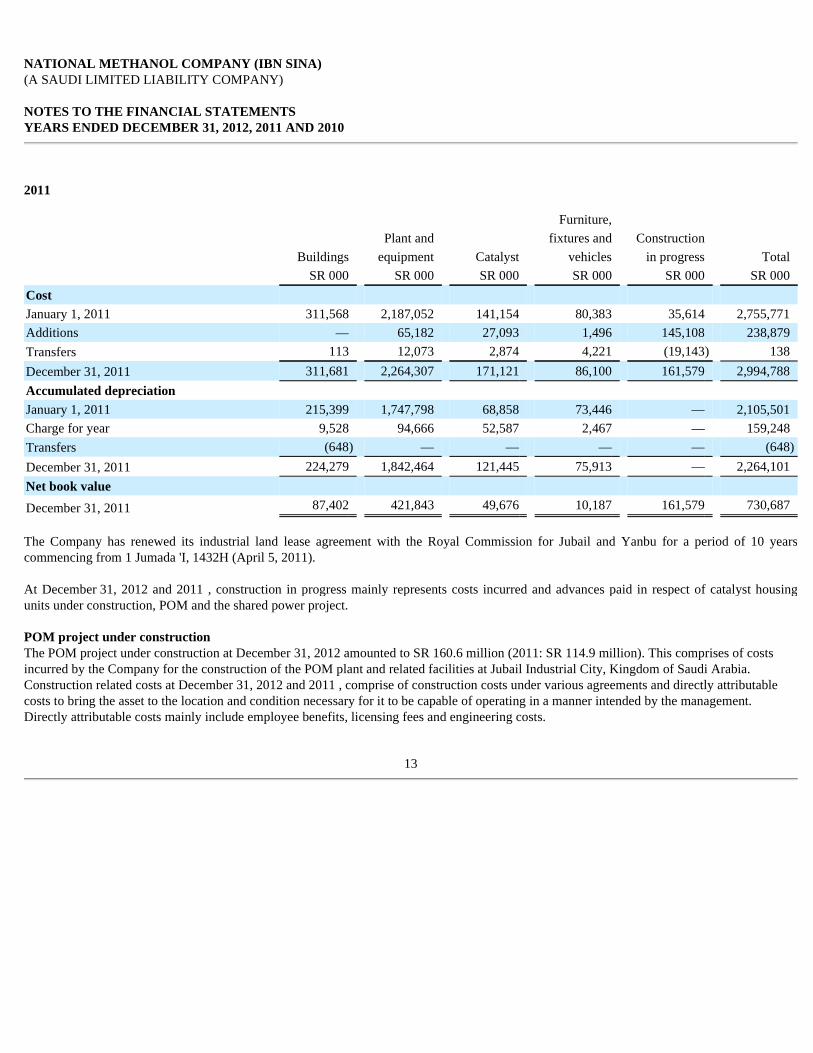
NATIONAL METHANOL COMPANY (IBN SINA) (A SAUDI LIMITED LIABILITY COMPANY) NOTES TO THE FINANCIAL STATEMENTS YEARS ENDED DECEMBER 31, 2012, 2011 AND 2010
2011
The Company has renewed its industrial land lease agreement with the Royal Commission for Jubail and Yanbu for a period of 10 years commencing from 1 Jumada 'I, 1432H (April 5, 2011).
At December 31, 2012 and 2011 , construction in progress mainly represents costs incurred and advances paid in respect of catalyst housing units under construction, POM and the shared power project. POM project under construction The POM project under construction at December 31, 2012 amounted to SR 160.6 million (2011: SR 114.9 million). This comprises of costs incurred by the Company for the construction of the POM plant and related facilities at Jubail Industrial City, Kingdom of Saudi Arabia. Construction related costs at December 31, 2012 and 2011 , comprise of construction costs under various agreements and directly attributable costs to bring the asset to the location and condition necessary for it to be capable of operating in a manner intended by the management. Directly attributable costs mainly include employee benefits, licensing fees and engineering costs.
13
Furniture,
Plant and fixtures and Construction
Buildings equipment Catalyst vehicles in progress Total SR 000 SR 000 SR 000 SR 000 SR 000 SR 000 Cost
January 1, 2011 311,568 2,187,052 141,154 80,383 35,614 2,755,771 Additions — 65,182 27,093 1,496 145,108 238,879 Transfers 113 12,073 2,874 4,221 (19,143 ) 138 December 31, 2011 311,681 2,264,307 171,121 86,100 161,579 2,994,788 Accumulated depreciation
January 1, 2011 215,399 1,747,798 68,858 73,446 — 2,105,501 Charge for year 9,528 94,666 52,587 2,467 — 159,248 Transfers (648 ) — — — — (648 )
December 31, 2011 224,279 1,842,464 121,445 75,913 — 2,264,101 Net book value
December 31, 2011 87,402 421,843 49,676 10,187 161,579 730,687
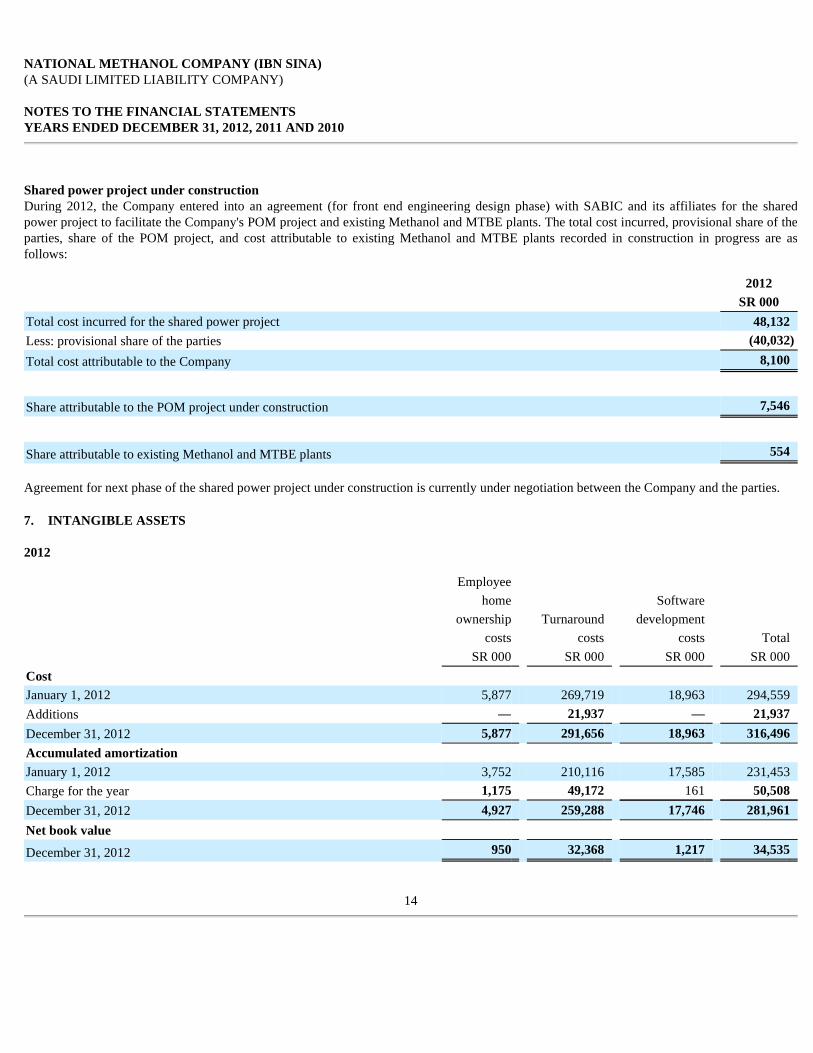
NATIONAL METHANOL COMPANY (IBN SINA) (A SAUDI LIMITED LIABILITY COMPANY) NOTES TO THE FINANCIAL STATEMENTS YEARS ENDED DECEMBER 31, 2012, 2011 AND 2010
Shared power project under construction During 2012, the Company entered into an agreement (for front end engineering design phase) with SABIC and its affiliates for the shared power project to facilitate the Company's POM project and existing Methanol and MTBE plants. The total cost incurred, provisional share of the parties, share of the POM project, and cost attributable to existing Methanol and MTBE plants recorded in construction in progress are as follows:
Agreement for next phase of the shared power project under construction is currently under negotiation between the Company and the parties.
2012
14
2012
SR 000
Total cost incurred for the shared power project 48,132 Less: provisional share of the parties (40,032 )
Total cost attributable to the Company 8,100
Share attributable to the POM project under construction 7,546
Share attributable to existing Methanol and MTBE plants 554
7. INTANGIBLE ASSETS
Employee
home Software
ownership Turnaround development
costs costs costs Total SR 000 SR 000 SR 000 SR 000 Cost
January 1, 2012 5,877 269,719 18,963 294,559 Additions — 21,937 — 21,937 December 31, 2012 5,877 291,656 18,963 316,496 Accumulated amortization
January 1, 2012 3,752 210,116 17,585 231,453 Charge for the year 1,175 49,172 161 50,508 December 31, 2012 4,927 259,288 17,746 281,961 Net book value
December 31, 2012 950 32,368 1,217 34,535
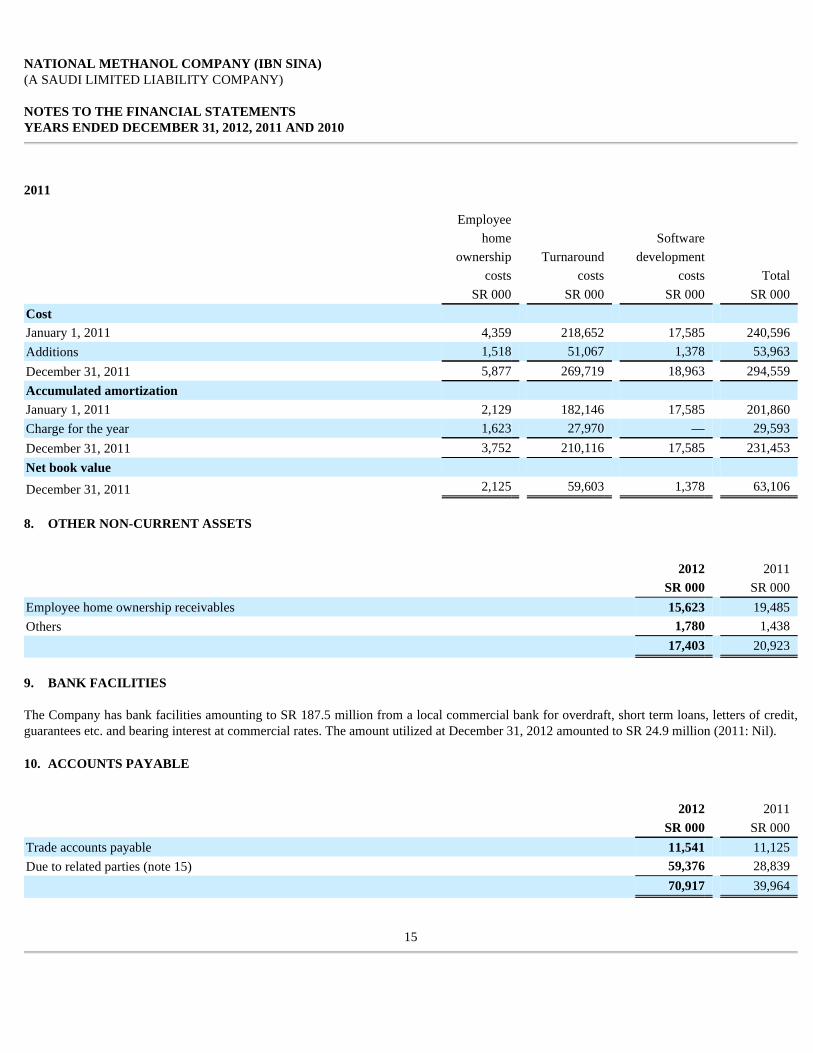
NATIONAL METHANOL COMPANY (IBN SINA) (A SAUDI LIMITED LIABILITY COMPANY) NOTES TO THE FINANCIAL STATEMENTS YEARS ENDED DECEMBER 31, 2012, 2011 AND 2010
2011
The Company has bank facilities amounting to SR 187.5 million from a local commercial bank for overdraft, short term loans, letters of credit, guarantees etc. and bearing interest at commercial rates. The amount utilized at December 31, 2012 amounted to SR 24.9 million (2011: Nil).
15
Employee
home Software
ownership Turnaround development
costs costs costs Total SR 000 SR 000 SR 000 SR 000 Cost
January 1, 2011 4,359 218,652 17,585 240,596 Additions 1,518 51,067 1,378 53,963 December 31, 2011 5,877 269,719 18,963 294,559 Accumulated amortization
January 1, 2011 2,129 182,146 17,585 201,860 Charge for the year 1,623 27,970 — 29,593 December 31, 2011 3,752 210,116 17,585 231,453 Net book value
December 31, 2011 2,125 59,603 1,378 63,106
8. OTHER NON-CURRENT ASSETS
2012 2011 SR 000 SR 000 Employee home ownership receivables 15,623 19,485 Others 1,780 1,438
17,403 20,923
9. BANK FACILITIES
10. ACCOUNTS PAYABLE
2012 2011 SR 000 SR 000 Trade accounts payable 11,541 11,125 Due to related parties (note 15) 59,376 28,839
70,917 39,964
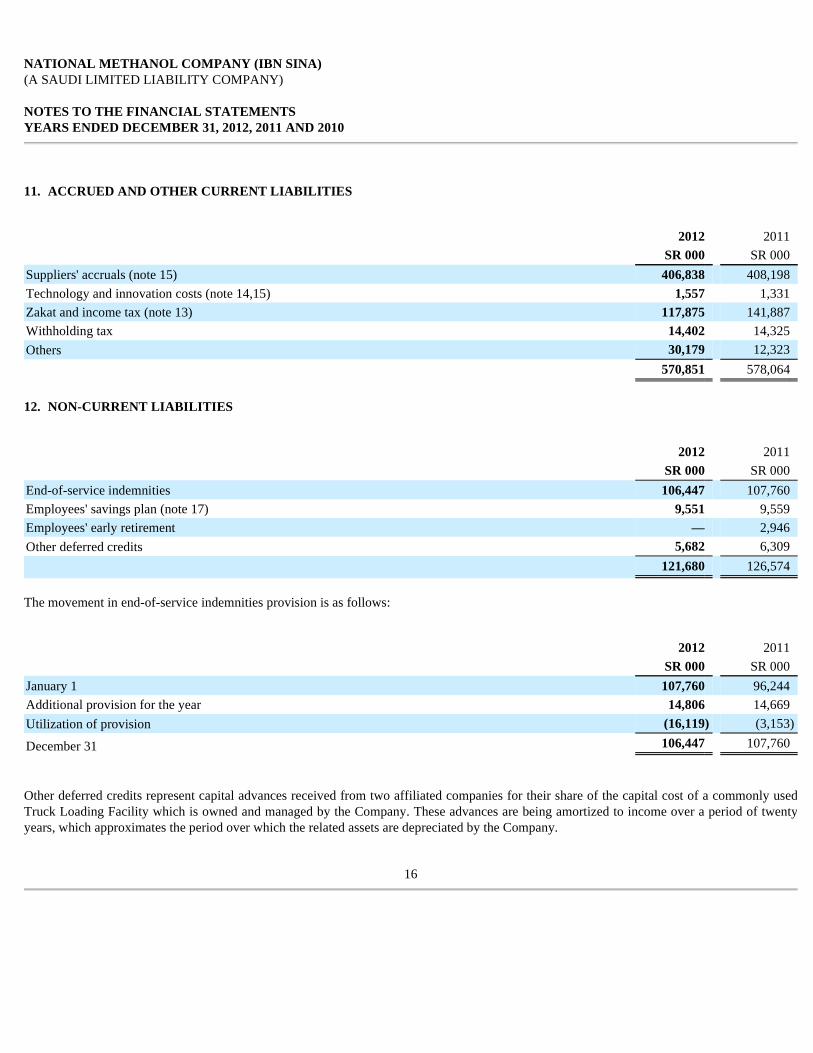
NATIONAL METHANOL COMPANY (IBN SINA) (A SAUDI LIMITED LIABILITY COMPANY) NOTES TO THE FINANCIAL STATEMENTS YEARS ENDED DECEMBER 31, 2012, 2011 AND 2010
The movement in end-of-service indemnities provision is as follows:
Other deferred credits represent capital advances received from two affiliated companies for their share of the capital cost of a commonly used Truck Loading Facility which is owned and managed by the Company. These advances are being amortized to income over a period of twenty years, which approximates the period over which the related assets are depreciated by the Company.
16
11. ACCRUED AND OTHER CURRENT LIABILITIES
2012 2011 SR 000 SR 000 Suppliers' accruals (note 15) 406,838 408,198 Technology and innovation costs (note 14,15) 1,557 1,331 Zakat and income tax (note 13) 117,875 141,887 Withholding tax 14,402 14,325 Others 30,179 12,323
570,851 578,064
12. NON-CURRENT LIABILITIES
2012 2011 SR 000 SR 000 End-of-service indemnities 106,447 107,760 Employees' savings plan (note 17) 9,551 9,559 Employees' early retirement — 2,946 Other deferred credits 5,682 6,309
121,680 126,574
2012 2011 SR 000 SR 000 January 1 107,760 96,244 Additional provision for the year 14,806 14,669 Utilization of provision (16,119 ) (3,153 )
December 31 106,447 107,760
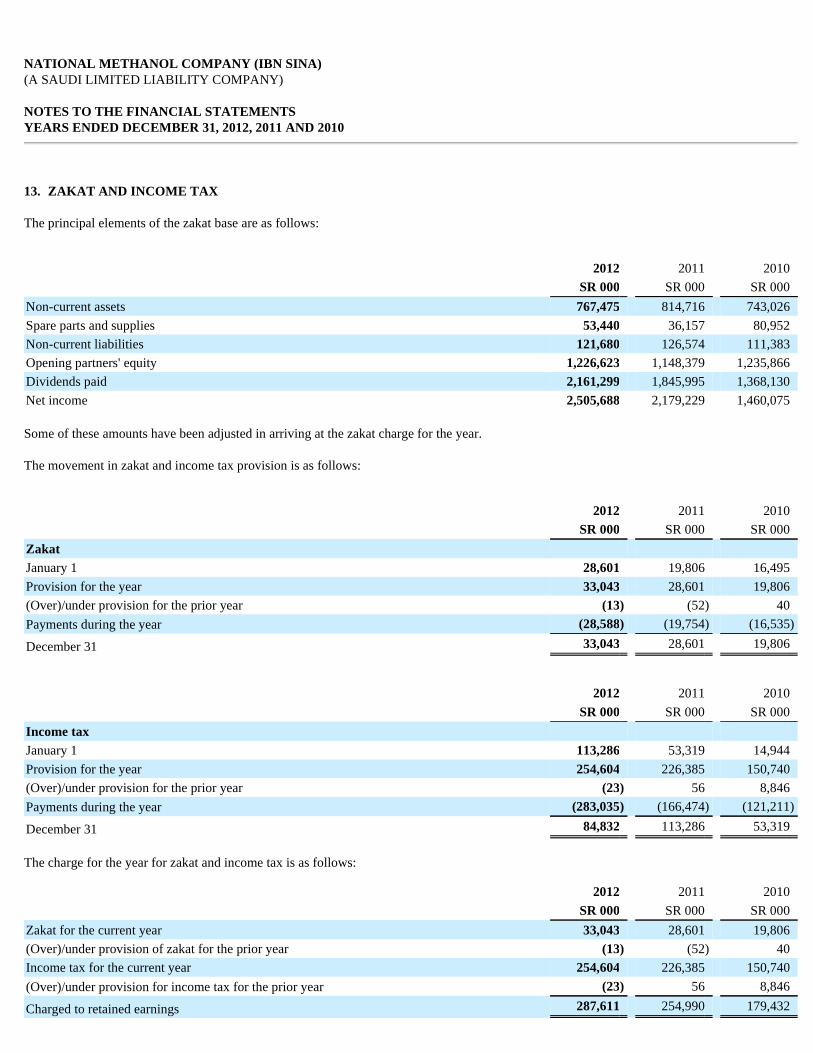
NATIONAL METHANOL COMPANY (IBN SINA) (A SAUDI LIMITED LIABILITY COMPANY) NOTES TO THE FINANCIAL STATEMENTS YEARS ENDED DECEMBER 31, 2012, 2011 AND 2010
The principal elements of the zakat base are as follows:
Some of these amounts have been adjusted in arriving at the zakat charge for the year. The movement in zakat and income tax provision is as follows:
The charge for the year for zakat and income tax is as follows:
13. ZAKAT AND INCOME TAX
2012 2011 2010 SR 000 SR 000 SR 000 Non-current assets 767,475 814,716 743,026 Spare parts and supplies 53,440 36,157 80,952 Non-current liabilities 121,680 126,574 111,383 Opening partners' equity 1,226,623 1,148,379 1,235,866 Dividends paid 2,161,299 1,845,995 1,368,130 Net income 2,505,688 2,179,229 1,460,075
2012 2011 2010 SR 000 SR 000 SR 000 Zakat
January 1 28,601 19,806 16,495 Provision for the year 33,043 28,601 19,806 (Over)/under provision for the prior year (13 ) (52 ) 40 Payments during the year (28,588 ) (19,754 ) (16,535 )
December 31 33,043 28,601 19,806
2012 2011 2010 SR 000 SR 000 SR 000 Income tax
January 1 113,286 53,319 14,944 Provision for the year 254,604 226,385 150,740 (Over)/under provision for the prior year (23 ) 56 8,846 Payments during the year (283,035 ) (166,474 ) (121,211 )
December 31 84,832 113,286 53,319
2012 2011 2010 SR 000 SR 000 SR 000 Zakat for the current year 33,043 28,601 19,806 (Over)/under provision of zakat for the prior year (13 ) (52 ) 40 Income tax for the current year 254,604 226,385 150,740 (Over)/under provision for income tax for the prior year (23 ) 56 8,846
Charged to retained earnings 287,611 254,990 179,432

17
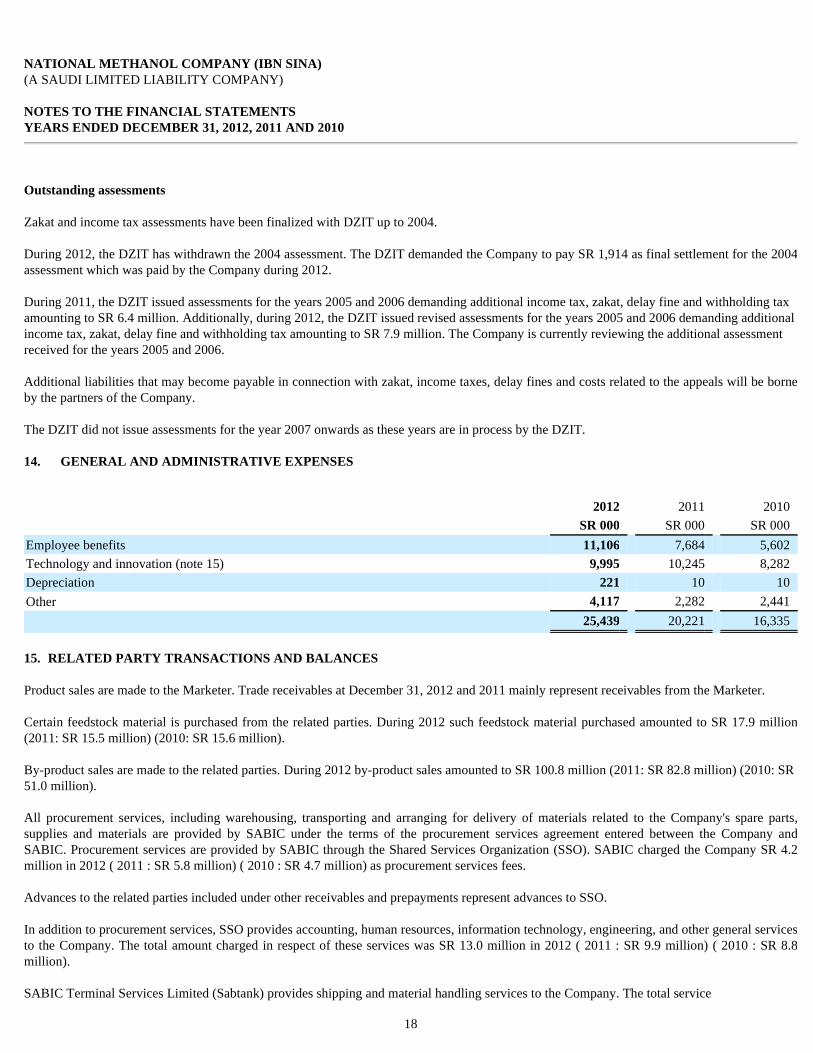
NATIONAL METHANOL COMPANY (IBN SINA) (A SAUDI LIMITED LIABILITY COMPANY) NOTES TO THE FINANCIAL STATEMENTS YEARS ENDED DECEMBER 31, 2012, 2011 AND 2010
Outstanding assessments Zakat and income tax assessments have been finalized with DZIT up to 2004. During 2012, the DZIT has withdrawn the 2004 assessment. The DZIT demanded the Company to pay SR 1,914 as final settlement for the 2004 assessment which was paid by the Company during 2012.
During 2011, the DZIT issued assessments for the years 2005 and 2006 demanding additional income tax, zakat, delay fine and withholding tax amounting to SR 6.4 million. Additionally, during 2012, the DZIT issued revised assessments for the years 2005 and 2006 demanding additional income tax, zakat, delay fine and withholding tax amounting to SR 7.9 million. The Company is currently reviewing the additional assessment received for the years 2005 and 2006. Additional liabilities that may become payable in connection with zakat, income taxes, delay fines and costs related to the appeals will be borne by the partners of the Company.
The DZIT did not issue assessments for the year 2007 onwards as these years are in process by the DZIT.
14. GENERAL AND ADMINISTRATIVE EXPENSES
Product sales are made to the Marketer. Trade receivables at December 31, 2012 and 2011 mainly represent receivables from the Marketer. Certain feedstock material is purchased from the related parties. During 2012 such feedstock material purchased amounted to SR 17.9 million (2011: SR 15.5 million) (2010: SR 15.6 million).
By-product sales are made to the related parties. During 2012 by-product sales amounted to SR 100.8 million (2011: SR 82.8 million) (2010: SR 51.0 million). All procurement services, including warehousing, transporting and arranging for delivery of materials related to the Company's spare parts, supplies and materials are provided by SABIC under the terms of the procurement services agreement entered between the Company and SABIC. Procurement services are provided by SABIC through the Shared Services Organization (SSO). SABIC charged the Company SR 4.2 million in 2012 ( 2011 : SR 5.8 million) ( 2010 : SR 4.7 million) as procurement services fees. Advances to the related parties included under other receivables and prepayments represent advances to SSO. In addition to procurement services, SSO provides accounting, human resources, information technology, engineering, and other general services to the Company. The total amount charged in respect of these services was SR 13.0 million in 2012 ( 2011 : SR 9.9 million) ( 2010 : SR 8.8 million). SABIC Terminal Services Limited (Sabtank) provides shipping and material handling services to the Company. The total service
18
2012 2011 2010 SR 000 SR 000 SR 000 Employee benefits 11,106 7,684 5,602 Technology and innovation (note 15) 9,995 10,245 8,282 Depreciation 221 10 10 Other 4,117 2,282 2,441
25,439 20,221 16,335
15. RELATED PARTY TRANSACTIONS AND BALANCES

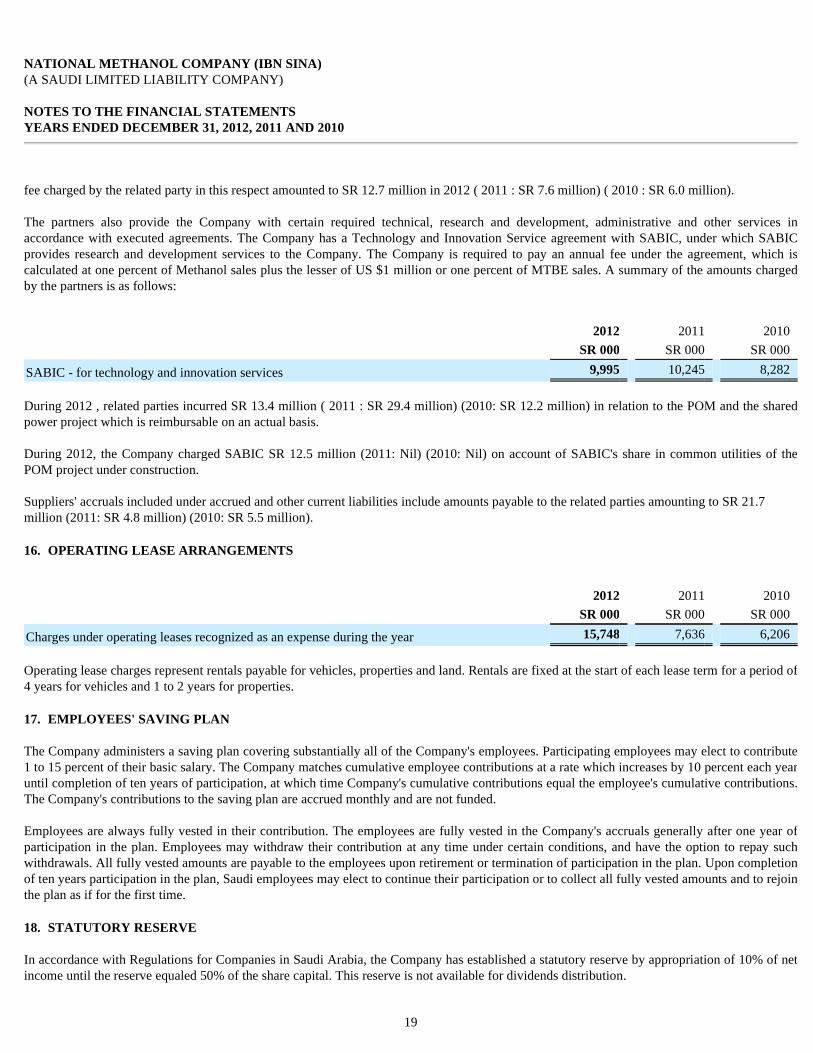
NATIONAL METHANOL COMPANY (IBN SINA) (A SAUDI LIMITED LIABILITY COMPANY) NOTES TO THE FINANCIAL STATEMENTS YEARS ENDED DECEMBER 31, 2012, 2011 AND 2010
fee charged by the related party in this respect amounted to SR 12.7 million in 2012 ( 2011 : SR 7.6 million) ( 2010 : SR 6.0 million). The partners also provide the Company with certain required technical, research and development, administrative and other services in accordance with executed agreements. The Company has a Technology and Innovation Service agreement with SABIC, under which SABIC provides research and development services to the Company. The Company is required to pay an annual fee under the agreement, which is calculated at one percent of Methanol sales plus the lesser of US $1 million or one percent of MTBE sales. A summary of the amounts charged by the partners is as follows:
During 2012 , related parties incurred SR 13.4 million ( 2011 : SR 29.4 million) (2010: SR 12.2 million) in relation to the POM and the shared power project which is reimbursable on an actual basis. During 2012, the Company charged SABIC SR 12.5 million (2011: Nil) (2010: Nil) on account of SABIC's share in common utilities of the POM project under construction.
Suppliers' accruals included under accrued and other current liabilities include amounts payable to the related parties amounting to SR 21.7 million (2011: SR 4.8 million) (2010: SR 5.5 million).
Operating lease charges represent rentals payable for vehicles, properties and land. Rentals are fixed at the start of each lease term for a period of 4 years for vehicles and 1 to 2 years for properties.
The Company administers a saving plan covering substantially all of the Company's employees. Participating employees may elect to contribute 1 to 15 percent of their basic salary. The Company matches cumulative employee contributions at a rate which increases by 10 percent each year until completion of ten years of participation, at which time Company's cumulative contributions equal the employee's cumulative contributions. The Company's contributions to the saving plan are accrued monthly and are not funded. Employees are always fully vested in their contribution. The employees are fully vested in the Company's accruals generally after one year of participation in the plan. Employees may withdraw their contribution at any time under certain conditions, and have the option to repay such withdrawals. All fully vested amounts are payable to the employees upon retirement or termination of participation in the plan. Upon completion of ten years participation in the plan, Saudi employees may elect to continue their participation or to collect all fully vested amounts and to rejoin the plan as if for the first time.
In accordance with Regulations for Companies in Saudi Arabia, the Company has established a statutory reserve by appropriation of 10% of net income until the reserve equaled 50% of the share capital. This reserve is not available for dividends distribution.
19
2012 2011 2010 SR 000 SR 000 SR 000
SABIC - for technology and innovation services 9,995 10,245 8,282
16. OPERATING LEASE ARRANGEMENTS
2012 2011 2010 SR 000 SR 000 SR 000
Charges under operating leases recognized as an expense during the year 15,748 7,636 6,206
17. EMPLOYEES' SAVING PLAN
18. STATUTORY RESERVE

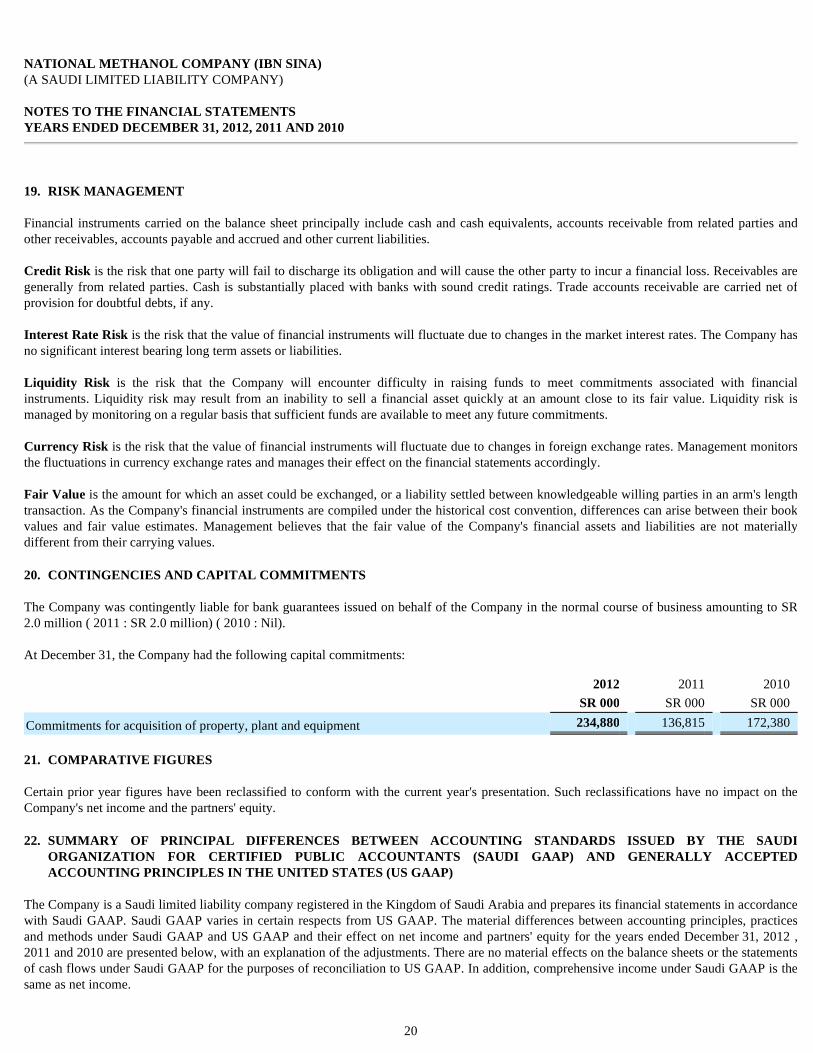
NATIONAL METHANOL COMPANY (IBN SINA) (A SAUDI LIMITED LIABILITY COMPANY) NOTES TO THE FINANCIAL STATEMENTS YEARS ENDED DECEMBER 31, 2012, 2011 AND 2010
Financial instruments carried on the balance sheet principally include cash and cash equivalents, accounts receivable from related parties and other receivables, accounts payable and accrued and other current liabilities. Credit Risk is the risk that one party will fail to discharge its obligation and will cause the other party to incur a financial loss. Receivables are generally from related parties. Cash is substantially placed with banks with sound credit ratings. Trade accounts receivable are carried net of provision for doubtful debts, if any. Interest Rate Risk is the risk that the value of financial instruments will fluctuate due to changes in the market interest rates. The Company has no significant interest bearing long term assets or liabilities. Liquidity Risk is the risk that the Company will encounter difficulty in raising funds to meet commitments associated with financial instruments. Liquidity risk may result from an inability to sell a financial asset quickly at an amount close to its fair value. Liquidity risk is managed by monitoring on a regular basis that sufficient funds are available to meet any future commitments. Currency Risk is the risk that the value of financial instruments will fluctuate due to changes in foreign exchange rates. Management monitors the fluctuations in currency exchange rates and manages their effect on the financial statements accordingly. Fair Value is the amount for which an asset could be exchanged, or a liability settled between knowledgeable willing parties in an arm's length transaction. As the Company's financial instruments are compiled under the historical cost convention, differences can arise between their book values and fair value estimates. Management believes that the fair value of the Company's financial assets and liabilities are not materially different from their carrying values.
The Company was contingently liable for bank guarantees issued on behalf of the Company in the normal course of business amounting to SR 2.0 million ( 2011 : SR 2.0 million) ( 2010 : Nil). At December 31, the Company had the following capital commitments:
Certain prior year figures have been reclassified to conform with the current year's presentation. Such reclassifications have no impact on the Company's net income and the partners' equity.
The Company is a Saudi limited liability company registered in the Kingdom of Saudi Arabia and prepares its financial statements in accordance with Saudi GAAP. Saudi GAAP varies in certain respects from US GAAP. The material differences between accounting principles, practices and methods under Saudi GAAP and US GAAP and their effect on net income and partners' equity for the years ended December 31, 2012 , 2011 and 2010 are presented below, with an explanation of the adjustments. There are no material effects on the balance sheets or the statements of cash flows under Saudi GAAP for the purposes of reconciliation to US GAAP. In addition, comprehensive income under Saudi GAAP is the same as net income.
20
19. RISK MANAGEMENT
20. CONTINGENCIES AND CAPITAL COMMITMENTS
2012 2011 2010 SR 000 SR 000 SR 000
Commitments for acquisition of property, plant and equipment 234,880 136,815 172,380
21. COMPARATIVE FIGURES
22. SUMMARY OF PRINCIPAL DIFFERENCES BETWEEN ACCOUNTING STANDARDS ISSUED BY THE SAUDI ORGANIZATION FOR CERTIFIED PUBLIC ACCOUNTANTS (SAUD I GAAP) AND GENERALLY ACCEPTED ACCOUNTING PRINCIPLES IN THE UNITED STATES (US GAAP )

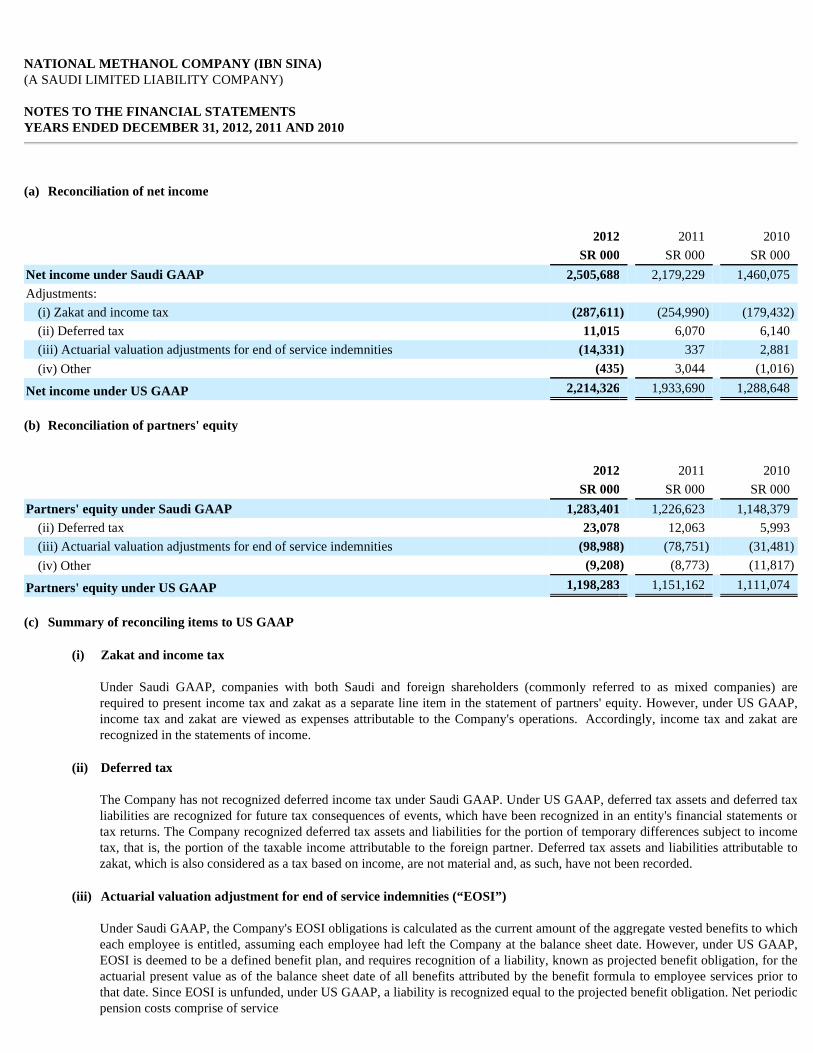
NATIONAL METHANOL COMPANY (IBN SINA) (A SAUDI LIMITED LIABILITY COMPANY) NOTES TO THE FINANCIAL STATEMENTS YEARS ENDED DECEMBER 31, 2012, 2011 AND 2010
Under Saudi GAAP, companies with both Saudi and foreign shareholders (commonly referred to as mixed companies) are required to present income tax and zakat as a separate line item in the statement of partners' equity. However, under US GAAP, income tax and zakat are viewed as expenses attributable to the Company's operations. Accordingly, income tax and zakat are recognized in the statements of income.
The Company has not recognized deferred income tax under Saudi GAAP. Under US GAAP, deferred tax assets and deferred tax liabilities are recognized for future tax consequences of events, which have been recognized in an entity's financial statements or tax returns. The Company recognized deferred tax assets and liabilities for the portion of temporary differences subject to income tax, that is, the portion of the taxable income attributable to the foreign partner. Deferred tax assets and liabilities attributable to zakat, which is also considered as a tax based on income, are not material and, as such, have not been recorded.
Under Saudi GAAP, the Company's EOSI obligations is calculated as the current amount of the aggregate vested benefits to which each employee is entitled, assuming each employee had left the Company at the balance sheet date. However, under US GAAP, EOSI is deemed to be a defined benefit plan, and requires recognition of a liability, known as projected benefit obligation, for the actuarial present value as of the balance sheet date of all benefits attributed by the benefit formula to employee services prior to that date. Since EOSI is unfunded, under US GAAP, a liability is recognized equal to the projected benefit obligation. Net periodic pension costs comprise of service
(a) Reconciliation of net income
2012 2011 2010 SR 000 SR 000 SR 000 Net income under Saudi GAAP 2,505,688 2,179,229 1,460,075 Adjustments:
(i) Zakat and income tax (287,611 ) (254,990 ) (179,432 )
(ii) Deferred tax 11,015 6,070 6,140 (iii) Actuarial valuation adjustments for end of service indemnities (14,331 ) 337 2,881 (iv) Other (435 ) 3,044 (1,016 )
Net income under US GAAP 2,214,326 1,933,690 1,288,648
(b) Reconciliation of partners' equity
2012 2011 2010 SR 000 SR 000 SR 000 Partners' equity under Saudi GAAP 1,283,401 1,226,623 1,148,379
(ii) Deferred tax 23,078 12,063 5,993 (iii) Actuarial valuation adjustments for end of service indemnities (98,988 ) (78,751 ) (31,481 )
(iv) Other (9,208 ) (8,773 ) (11,817 )
Partners' equity under US GAAP 1,198,283 1,151,162 1,111,074
(c) Summary of reconciling items to US GAAP
(i) Zakat and income tax
(ii) Deferred tax
(iii) Actuarial valuation adjustment for end of service indemnities (“EOSI” )

21
NATIONAL METHANOL COMPANY (IBN SINA) (A SAUDI LIMITED LIABILITY COMPANY) NOTES TO THE FINANCIAL STATEMENTS YEARS ENDED DECEMBER 31, 2012, 2011 AND 2010
costs, interest costs, and gains and losses. In addition, gains or losses that are not recognized immediately as a component of net periodic pension cost are recognized as increases or decreases in other comprehensive income/loss as they arise, and subsequently amortized to income using the corridor approach.
Other adjustments include the impact on net income and partners' equity primarily for intangible assets capitalized under Saudi GAAP which should be expensed under US GAAP, interest-free loans to employees recorded at historical cost under Saudi GAAP that are recorded at amortized cost under US GAAP and certain items of property, plant and equipment which are capitalized under Saudi GAAP which should be expensed as incurred under US GAAP.
22
(iv) Other