Embed Size (px)
Citation preview

CeforIMSF 2012 Oslo
Marine Claims Trends in the light of an increasing
exposure to
Major Single Loss Events
Astrid Seltmann Cefor Analyst
The Nordic Association of Marine Insurers (Cefor)

Cefor
Contents
1. Cost and frequency loss trends before and after
the financial crisis – as of December 2011
1. Partial and total losses
2. by type of vessel
3. by type of casualty
2. Major claims impact – as of December 2011
3. ... and then Costa Concordia went down
4. Risk exposure by increasing vessel values
5. Addendum: Data definitions
The Nordic Association of Marine Insurers 2

Cefor
0
20,000
40,000
60,000
80,000
100,000
120,000
1996 1997 1998 1999 2000 2001 2002 2003 2004 2005 2006 2007 2008 2009 2010 2011
Date of loss
Ultimate partial and total claim cost per vessel (USD)by date of loss
Ultimate claim per vessel incl. IBNR Ultimate partial claim per vessel incl. IBNR
The Nordic Association of Marine Insurers 3
1. Claim cost per vessel – as of December 2011
After costly years 2006-08,
Claim cost stabilizes at high level

Cefor
Sources:
Claim index: Cefor NoMIS data as of 31 December 2011; Exchange rates: Norges Bank, Ship operation costs: Moore Stephen’s,
Steel: CRU Steel Price Index (http://www.cruonline.crugroup.com/Steel/CRUspi.aspx)
1. Cost driving factors
75.0%
100.0%
125.0%
150.0%
175.0%
200.0%
225.0%
250.0%
275.0%
2000 2001 2002 2003 2004 2005 2006 2007 2008 2009 2010 2011
Cost driving factors inflation index, 2000 = 100%
USD against EUR Ship operating costs, tank
Claim per vessel, by date of loss (incl. IBNR) Partial claim per vessel, by date of loss (2009 incl. IBNR)
Cru Steel Price Index (CRUspi)
Cefor
0
50,000
100,000
150,000
200,000
250,000
300,000
350,000
400,000
19
96
19
97
19
98
19
99
20
00
20
01
20
02
20
03
20
04
20
05
20
06
20
07
20
08
20
09
20
10
20
11
Date of loss
Average claim amount per individual claim (USD), by date of loss
All claims - ocean hull excl. total losses - ocean hull All claims - coastal hull
The Nordic Association of Marine Insurers 5
1. Average individual claim cost
Cost level post-2006
Cost level pre-2006

Cefor
1. Claim frequency – stable to positive trend
0.00%
0.05%
0.10%
0.15%
0.20%
0.25%
0.30%
0.00%
5.00%
10.00%
15.00%
20.00%
25.00%
30.00%
35.00%
19
96
19
97
19
98
19
99
20
00
20
01
20
02
20
03
20
04
20
05
20
06
20
07
20
08
20
09
20
10
20
11
Claim frequency, by date of loss
partial claims (left axis) partial claims incl. IBNR TLO claims (right axis)
The Nordic Association of Marine Insurers

Cefor
Bulk CargoCont./Car/
RoRoPassenger Tank Supply/Off
2006-2008 96,261 75,099 111,366 207,512 76,836 68,603
2009-2011 67,359 47,287 75,365 187,450 53,656 33,140
2006-2011 84,260 65,032 95,093 196,801 64,446 51,098
0
50,000
100,000
150,000
200,000
250,000
Claim per vessel per vessel type group
1. Claim cost per vessel – by vessel type

Cefor
Bulk CargoCont./Car/
RoRoPassenger Tank Supply/Off
2006-2008 458,316 199,616 284,053 542,207 319,604 296,254
2009-2011 332,713 175,675 231,960 779,434 259,328 231,418
2006-2011 395,716 190,086 263,568 634,747 283,839 294,184
0
100,000
200,000
300,000
400,000
500,000
600,000
700,000
800,000
900,000
Average claim amount per vessel type group
1. Av. single claim cost – by vessel type

Cefor
Bulk CargoCont./Car/
RoRoPassenger Tank Supply/Off
2006-2008 0.21 0.38 0.39 0.38 0.24 0.23
2009-2011 0.20 0.27 0.32 0.24 0.21 0.14
2006-2011 0.21 0.34 0.36 0.31 0.23 0.17
0.0
0.1
0.2
0.3
0.4
0.5
Claim frequency per vessel type group
Notes:
- ”Tank” includes in this and the following slides: Chemical/Product, LNG/LPG, OBO and other tank vessels
- Claims < 10.000 USD account for about half of all claims. Registration of these may vary over time
and in each company and will thus influence the registered frequency.
In addition any increase/decrease of insurance deductibles has impact on the registered frequency
1. Claim frequency – by vessel type

Cefor Claims by Claims type
37.2%
1.9%
12.0%20.3%
9.8%
0.4%3.0%
15.5%
37.2%
1.6%
12.0%
19.6%
9.1%
0.6%1.8%
18.1%
Number of claims
Inner ring: 2006-2010Outer ring: 2011
Engine
Fire/Explosion
Collision
Contact
Grounding
Ice
Heavy weather
Other
1. Claims by type of casualty – Numbers
Totals
2006-10: 17,894
2011: 2,004

Cefor Claims by Claims type
Totals
2006-10: 5,528.1 MUSD
2011: 579.1 MUSD
31.1%
10.4%
14.1%8.8%
20.9%
0.2%2.4%
12.1%33.0%
7.9%
20.4%
9.1%
22.0%
0.3%1.4%5.9%
Cost of claims
Inner ring: 2006-2010Outer ring: 2011
Engine
Fire/Explosion
Collision
Contact
Grounding
Ice
Heavy weather
Other
1. Claims by type of casualty – Cost

Cefor
The Nordic Association of Marine Insurers 13
0
500
1,000
1,500
2,000
2,500
3,000
3,500
4,000
19
96
19
97
19
98
19
99
20
00
20
01
20
02
20
03
20
04
20
05
20
06
20
07
20
08
20
09
20
10
20
11
Date of loss
Average claim amount per type of casualty (USD 1,000) by date of loss
Fire/Explosion
Collision, Contact,Grounding
Engine
Heavy Weather
Ice
Other
1. Cost of claims by type of casualty

Cefor
Claims trends pre- and post-financial crisis
Positive post-financial crisis claims development
(both cost and frequency)
Average claims cost stabilises at high level after
peak years 2006-2008
Some recent costly fire/explosion claims
Trend towards more costly nautical-related
claims
The Nordic Association of Marine Insurers 14

Cefor
1996 1997 1998 1999 2000 2001 2002 2003 2004 2005 2006 2007 2008 2009 2010 2011
> 50 MUSD 0 0 0 0 0 0 0 0 6,612 0 4,853 4,012 4,519 0 13,056 0
30 <= 50 MUSD 6,298 0 4,055 9,711 0 0 9,514 0 0 0 2,869 11,300 2,609 4,036 3,422 4,579
10 <= 30 MUSD 5,713 5,782 5,304 8,953 3,018 7,123 8,668 6,652 17,081 8,811 19,965 19,144 14,968 8,545 4,520 8,297
5 <= 10 MUSD 9,123 9,178 6,411 9,755 11,863 1,716 7,286 3,956 8,894 13,529 7,831 12,858 9,991 5,529 6,863 7,858
1 <= 5 MUSD 24,016 22,078 18,489 18,638 15,160 21,666 17,159 16,834 24,339 19,570 26,834 27,718 29,673 25,062 19,708 18,679
<= 1 MUSD 23,773 20,398 21,876 20,131 19,603 22,160 20,827 21,556 21,667 24,725 27,082 31,931 31,439 25,047 25,735 25,053
IBNR 0 0 0 0 0 0 0 0 0 0 0 0 0 0 0 11,268
0
20,000
40,000
60,000
80,000
100,000
120,000
USD Claim per vessel, by date of loss
Claim bands:
2. Cost per vessel – major claims impact
Before 2004
no claims xs 50 MUSD
2011 free
of claims
xs 50 MUSD
Cefor
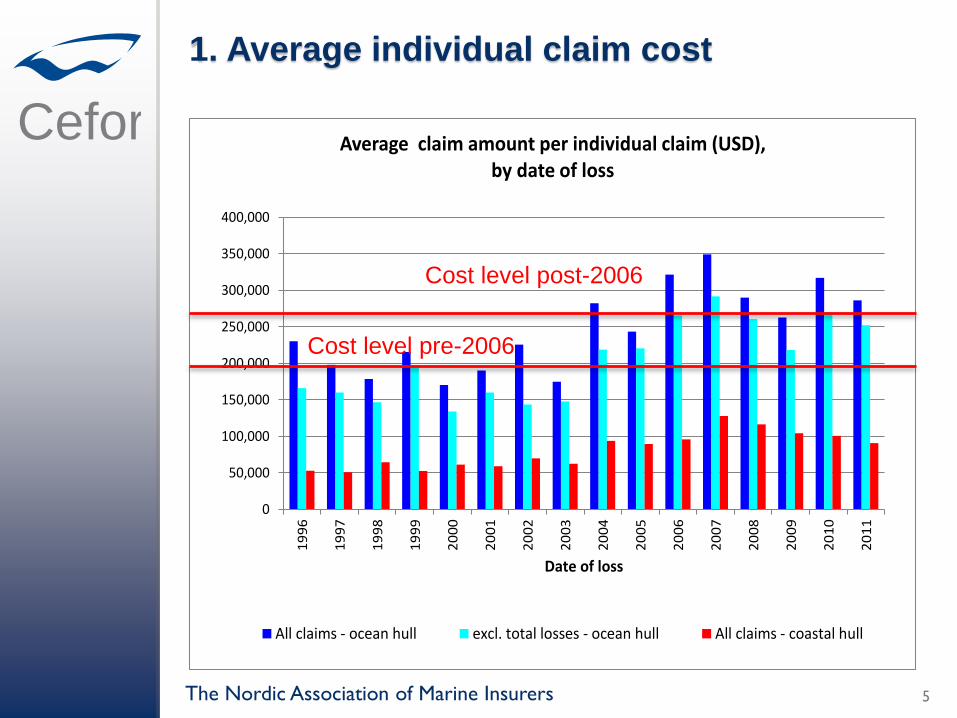
2. Cost of largest claims increasing
– as of December 2011
The Nordic Association of Marine Insurers
0
20 000 000
40 000 000
60 000 000
80 000 000
100 000 000
120 000 000
140 000 000
160 000 000
1995 1996 1997 1998 1999 2000 2001 2002 2003 2004 2005 2006 2007 2008 2009 2010 2011
Cost of the three maximum claims per year (USD) by date of loss

Cefor3. ... and then Costa Concordia went down...
The Nordic Association of Marine Insurers 17

Cefor
3. Cost of largest claims jumping? – as of 2012
The Nordic Association of Marine Insurers 18
0
100 000 000
200 000 000
300 000 000
400 000 000
500 000 000
600 000 000
19
95
19
96
19
97
19
98
19
99
20
00
20
01
20
02
20
03
20
04
20
05
20
06
20
07
20
08
20
09
20
10
20
11
20
12
Estimated cost of three maximum claims per year (USD)by date of loss
From Carnival Corporations website:
«In fiscal 2012 we expect to receive approx.
$515 million of hull and machinery insurance
proceeds for the loss of Costa Concordia.»
?

Cefor
Will it get worse...?
The Nordic Association of Marine Insurers
Increasing vessel size
Increasing value
accumulation
per vessel
Cefor
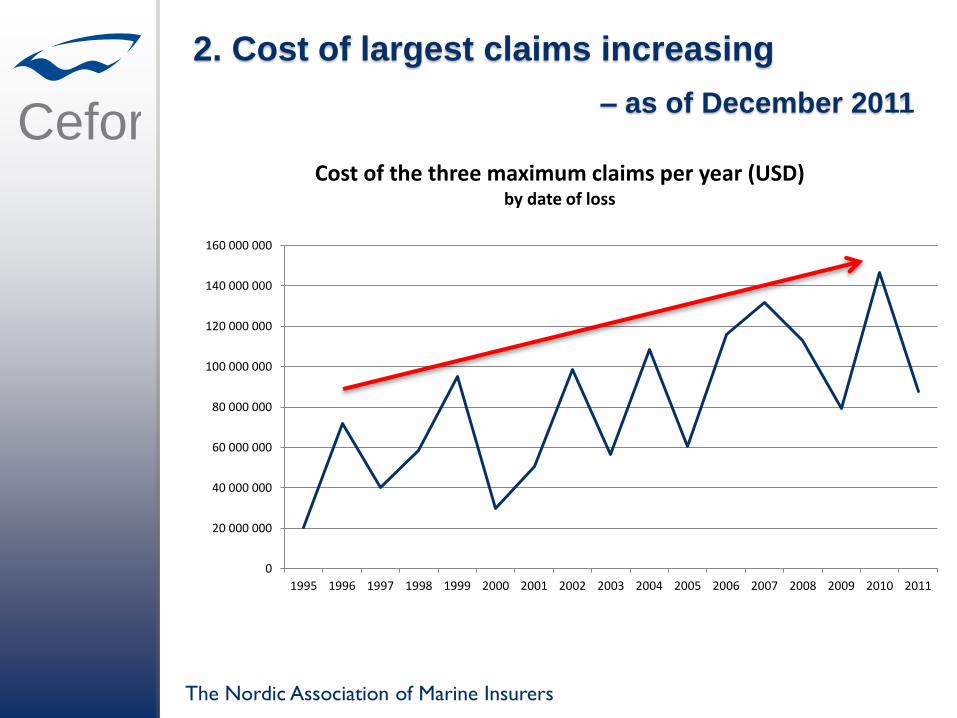
4. Insured values reflect world fleet values increased vessel size, market values
Includes all insured vessels per underwriting year (renewed and new business).
50%
100%
150%
200%
250%
1995
1996
1997
1998
1999
2000
2001
2002
2003
2004
2005
2006
2007
2008
2009
2010
2011
Index of evolution of average Sum insured and gross ton1995=100%
Index Average Sum Insured Index Average gross ton

Cefor
Growing global
trade and fleet
New and bigger
vessels
Increasing
vessel values
5%
10%
15%
20%
25%
30%
35%
40%
Number of vessels per age group in % of all
by underwriting year
0-5 years
5-10 years
10-15 years
15-20 years
20-100 years
0
10 000 000
20 000 000
30 000 000
40 000 000
50 000 000
60 000 000
Average sum insured per vessel age group
0-5 years
5-10 years
10-15 years
15-20 years
20-100 years

Cefor
4. Major claims in % of ship values as of March 2012
0.00%
0.05%
0.10%
0.15%
0.20%1
99
6
19
97
19
98
19
99
20
00
20
01
20
02
20
03
20
04
20
05
20
06
20
07
20
08
20
09
20
10
20
11
20
12
Cost of maximum three claims in % of total insured value

Cefor
4. Outlook
Costa Concordia may be a single event, but:
◦ bigger and newer vessels with higher values
◦ Increased accumulation onboard one vessel
◦ Increased risk for extraordinary single events
(cost)
◦ Increase in global trade, traffic density and
challenge to secure qualified seafarers may
increase accident probability
(frequency)
Cefor Cefor marine insurance statistics publications at http://www.cefor.no :
• Cefor Annual Report 2011
• The 2011 Cefor NoMIS Report &
The 2011 Cefor NoMIS COASTAL Report
• Half-yearly Claims Update Fact Sheet
• All Cefor statistics, including previously published reports, are available
for download from the statistics section of the Cefor website: http://www.cefor.no/statistics/statistics.htm
Other marine insurance statistics:
• IUMI (International Union of Marine Insurance):
Statistics issued by IUMI’s Facts & Figures Committee: http://www.iumi.com/index.cfm?id=7165
For more information, contact Cefor analyst Astrid Seltmann [email protected]
2011 Nordic Marine Insurance Statistics
The Nordic Association of Marine Insurers

Cefor
The Nordic Association of Marine Insurers 25
If not indicated otherwise, data in this report
is on accident year basis (i.e. claims allocated to the calendar year in which the accident occured)
as reported by 31 December 2011 (i.e. without ”IBNR” loading for claims not yet registered or incurred by this date)
includes vessels with a registered IMO-nr.
5. Definitions

Cefor All amounts are presented in USD.
Rate of exchange applicable to convert the figures from the original currencies into USD:
Premiums: average monthly rate of exchange of the month of transaction
Paid claims: average monthly rate of exchange of the month of transaction
Outstanding claims: average monthly rate of exchange of December 2011
Underwriting year = year in which the insurance policy attaches
All claims are net of any deductibles applicable.
Total Claims = Paid claims + Outstanding claims
TLO (or Total Losses) = claims in excess of 75% of the Sum Insured
Partial Losses = losses <= 75% of the Sum Insured
IBNR (”Incurred but not reported”) = reserve for claims adjustments and registration backlog
Claim frequency = Number of claims / number of vessels
Claim per vessel = Total claim cost / number of vessels
Average individual claim cost = Total claim cost / number of claims
5. Definitions
The Nordic Association of Marine Insurers

Cefor The Nordic Marine Insurance Statistics (NoMIS) is a joint database project of Cefor members
active on the Hull & Machinery market to compile insurance data and vessel characteristics
for statistical purposes and administered by Cefor.
Since its foundation in 1985 until 1997, the data was compiled by appointing Cefor a
facultative reinsurer to which members of the Norwegian Hull Agreement ceded 0.1% of their
H&M insurance. Premium and claims information was exchanged via Borderaux, the lead
insurer providing details of each claim. While the Hull Agreement was discontinued in 1996,
the statistics cooperation continued.
In 1998 steps were taken to update the NoMIS’ database electronically. Thus from December
1999, Cefor could produce up-to-date hull figures on a monthly basis and extend the database
substantially by including non-lead business. From 2000, also business back to underwriting
year 1995 was updated electronically. In the following years, several new major Cefor
members joined the NoMIS cooperation, reporting retrospective data from1995 underwriting
year.
In 2009, data from Gjensidige and Tryg was integrated, including retrospective data back to
underwriting years 2000 and 2003 respectively.
By 31st December 2011, in all 166,673 vessel years (vessels with IMO-number) and 51,201
claims were registered on underwriting years 1985 through 2011.
The NoMIS statistics in this report comprise data from the following marine insurers:
Bluewater (until 2008), Codan Group (Codan, Denmark and Norway; Trygg-Hansa, Sweden),
Gjensidige (coastal), If, Gard, NEMI (until 2009), Norwegian Hull Club, Swedish Club, Tryg
(until 2009), Zurich (until 2002).
5. Nordic Marine Insurance Statistics