Embed Size (px)
Citation preview

CEE Real Estate Investment market| Mark Robinson February 2018
Colliers International 20175
13
10.1
2.9
3.8
6.5
3.9
5.6
7.4
1.6 1.6
2.81.1
3
2.62.5
2.12.2
3.6
5.45.3
2007 2008 2009 2010 2011 2012 2013 2014 2015 2016 2017
CEE Investment flows in a healthy state – Q4 2017 EUR 5.3bn2017 flows at a cyclical high, almost overhauling the 2007 record
Historical CEE investment volume (EUR bn)
Source: Real Capital Analytics, Colliers International
8.8
12.212.9

Colliers International 20176
Flows into retail and hotels grew fastest in 2017 Polish volumes made a strong comeback in H2 after a weak H1
Split of investment flows by destination
Source: Colliers International
Split of investment flows by sector
5,129
3,730
1,828
957
916 366
Poland
Czech R
Hungary
Bulgaria
Romania
Slovakia
EUR mn
3,549
2,280
5,015
988 1,096
Office
Industrial
Retail
Hotel
Other
EUR mn

Colliers International 20177
Can CEE-6 defy the downturn in EMEA volume?CEE’s momentum lagged EMEA in time historically – is it different this time?
EMEA and CEE investment volume (EUR bn)
Source: Real Capital Analytics, Colliers International
0
2
4
6
8
10
12
14
0
50
100
150
200
250
300
350
2007 2008 2009 2010 2011 2012 2013 2014 2015 2016 2017
EMEA flow (EURbn) CEE-6 flow (EURbn, right hand side scale)
Colliers International 20178
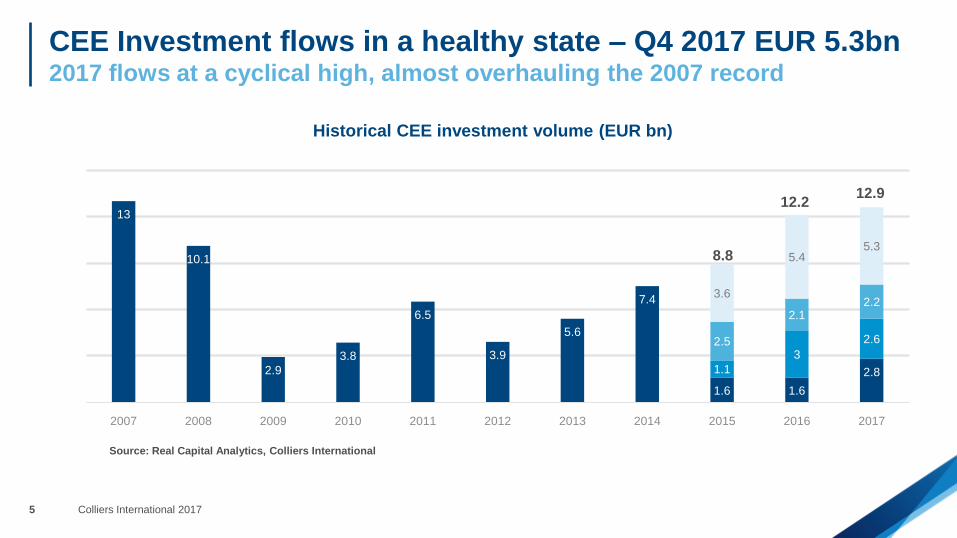
CEE-6 consumer sentiment a leading indicator for volumeConsumer sentiment suggests a further EUR 1-2bn volume growth in 2018
CEE-6 investment flows and EU ESI consumer
sentiment (lagged 18 months, rhs)
Source: Eurostat, Colliers International
-48
-36
-24
-12
0
0
2
4
6
8
Jun-09 Jun-10 Jun-11 Jun-12 Jun-13 Jun-14 Jun-15 Jun-16 Jun-17 Jun-18 Jun-19
Investment into CEE6 real estate (EURbn)
EC composite consumer confidence for CE6 (18-month lagged)
Colliers International 20179
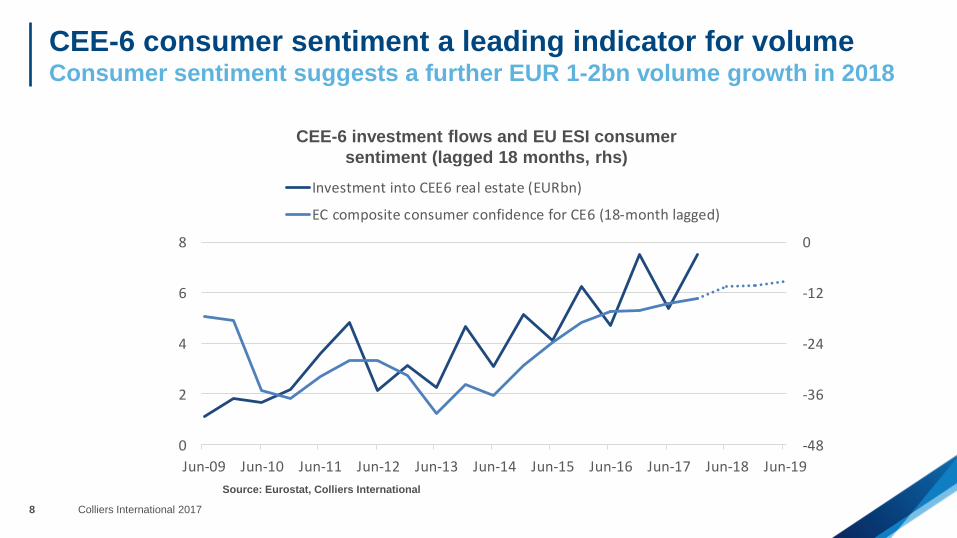
CEE Q3 2017: GDP growth escalator is accelerating Faster expansions in 5 out of 6 CEE countries in 3Q. Romania is very strong
CEE Q1, Q2 and Q3 2017 GDP growth rates (% yoy, annualised)
Source: Investing.com, National Statistics Agencies, Colliers International
• Consumption, investment and external demand (including from Europe) the most likely drivers
4.0%
3.0%
4.2%
3.1%
5.7%
3.4%4.1%
4.7%
3.3% 3.4%
6.1%
3.7%
4.9% 5.0%
3.9%3.4%
8.8%
3.9%
0.0%
3.0%
6.0%
9.0%
Poland Czech Rep. Hungary Slovakia Romania Bulgaria
Q1 2017 Q2 2017 Q3 2017

Colliers International 201710
Will CEE GDP growth drive rents? Example: Prime BUD office sector rents finally following GDP growth up
Hungary GDP growth (yoy) vs. Prime Budapest CBD office rent lagged 30 mths (per sqm, rhs)
Source: investing.com, Colliers International
• GDP growth predicts rent levels 30 months ahead. Will supply react?
17
18
19
20
21
22
23
24
-6.0
-4.0
-2.0
0.0
2.0
4.0
6.0
8.0
GDP growth (yoy) Prime CBD office rent (EUR/sqm/mth, 30-month lag, rhs)
Colliers International 201711
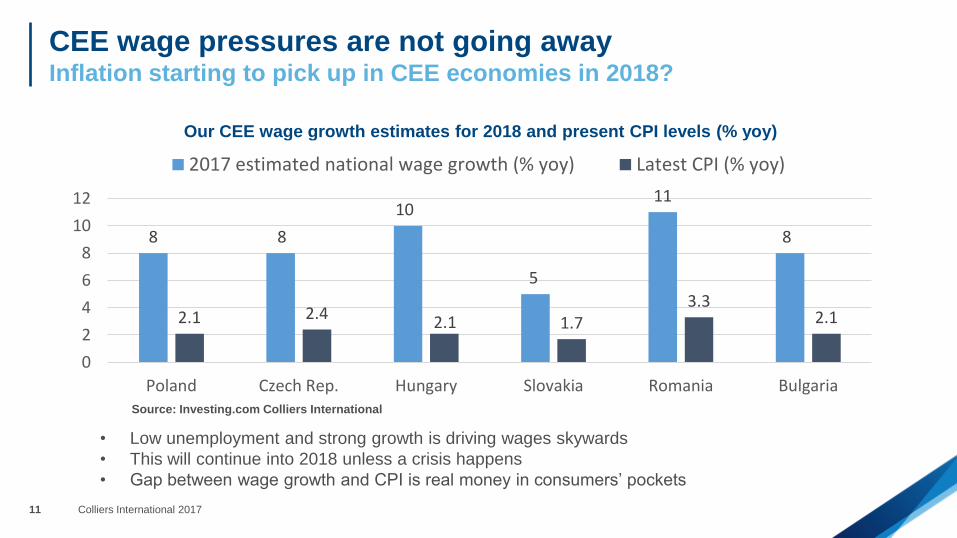
CEE wage pressures are not going awayInflation starting to pick up in CEE economies in 2018?
Our CEE wage growth estimates for 2018 and present CPI levels (% yoy)
Source: Investing.com Colliers International
• Low unemployment and strong growth is driving wages skywards
• This will continue into 2018 unless a crisis happens
• Gap between wage growth and CPI is real money in consumers’ pockets
8 8
10
5
11
8
2.1 2.4 2.1 1.73.3
2.1
0
2
4
6
8
10
12
Poland Czech Rep. Hungary Slovakia Romania Bulgaria
2017 estimated national wage growth (% yoy) Latest CPI (% yoy)
Colliers International 201712
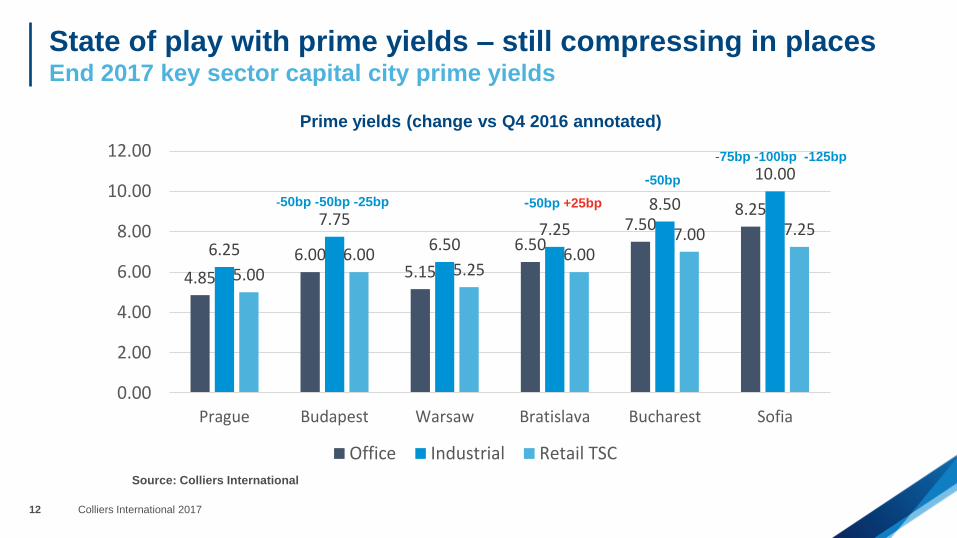
State of play with prime yields – still compressing in placesEnd 2017 key sector capital city prime yields
Prime yields (change vs Q4 2016 annotated)
4.85
6.005.15
6.507.50
8.25
6.25
7.75
6.507.25
8.50
10.00
5.006.00
5.256.00
7.00 7.25
0.00
2.00
4.00
6.00
8.00
10.00
12.00
Prague Budapest Warsaw Bratislava Bucharest Sofia
Office Industrial Retail TSC
Source: Colliers International
-50bp +25bp
-75bp -100bp -125bp
-50bp -50bp -25bp
-50bp
Colliers International 201713
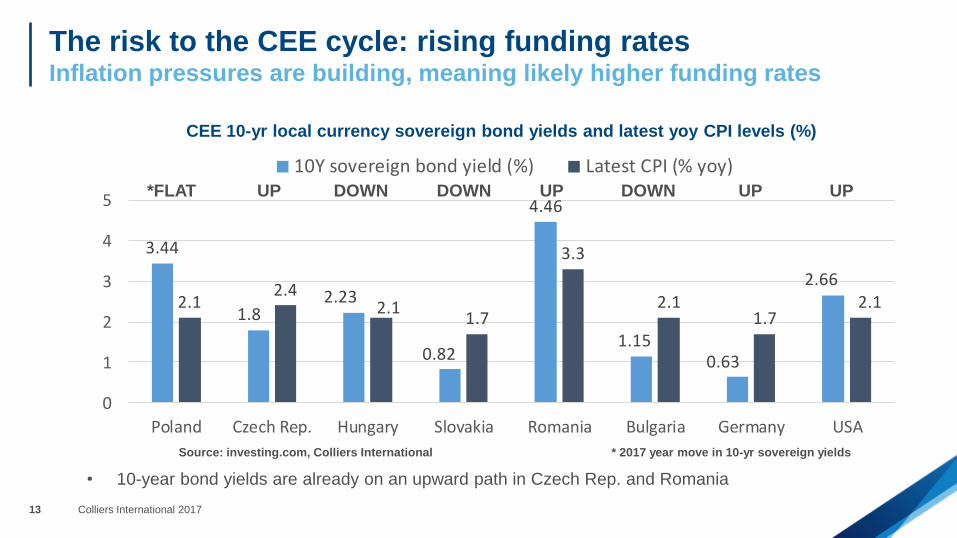
The risk to the CEE cycle: rising funding ratesInflation pressures are building, meaning likely higher funding rates
CEE 10-yr local currency sovereign bond yields and latest yoy CPI levels (%)
Source: investing.com, Colliers International * 2017 year move in 10-yr sovereign yields
• 10-year bond yields are already on an upward path in Czech Rep. and Romania
3.44
1.82.23
0.82
4.46
1.150.63
2.662.1
2.42.1
1.7
3.3
2.11.7
2.1
0
1
2
3
4
5
Poland Czech Rep. Hungary Slovakia Romania Bulgaria Germany USA
10Y sovereign bond yield (%) Latest CPI (% yoy)*FLAT UP DOWN DOWN UP DOWN UP UP
Colliers International 201714
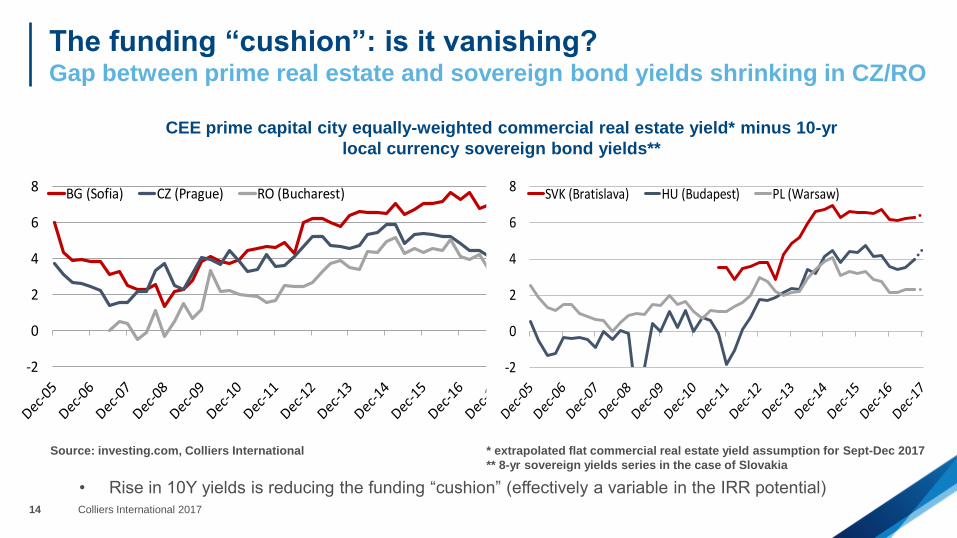
The funding “cushion”: is it vanishing?Gap between prime real estate and sovereign bond yields shrinking in CZ/RO
CEE prime capital city equally-weighted commercial real estate yield* minus 10-yr
local currency sovereign bond yields**
Source: investing.com, Colliers International * extrapolated flat commercial real estate yield assumption for Sept-Dec 2017
** 8-yr sovereign yields series in the case of Slovakia
• Rise in 10Y yields is reducing the funding “cushion” (effectively a variable in the IRR potential)
-2
0
2
4
6
8 BG (Sofia) CZ (Prague) RO (Bucharest)
-2
0
2
4
6
8 SVK (Bratislava) HU (Budapest) PL (Warsaw)
Colliers International 201715
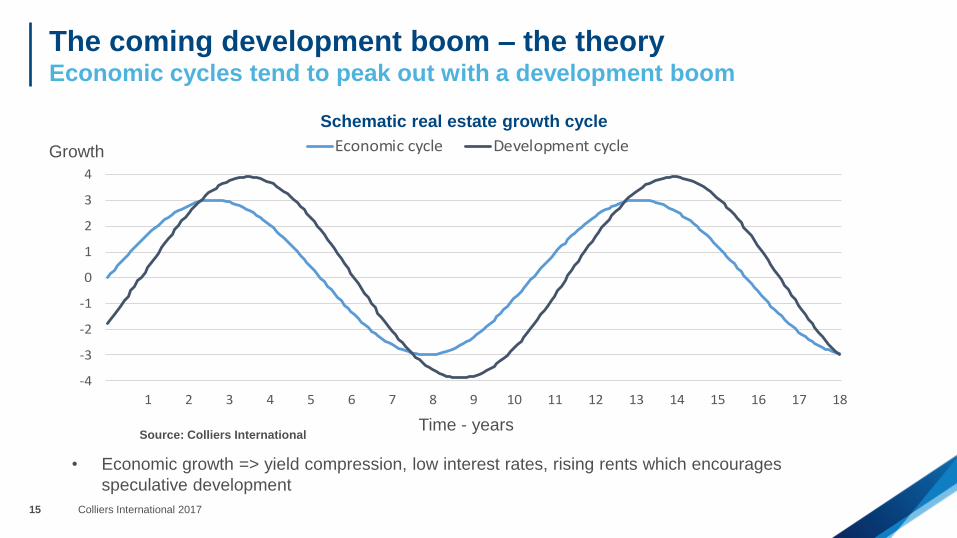
The coming development boom – the theoryEconomic cycles tend to peak out with a development boom
Source: Colliers International
• Economic growth => yield compression, low interest rates, rising rents which encourages
speculative development
Time - years
-4
-3
-2
-1
0
1
2
3
4
1 2 3 4 5 6 7 8 9 10 11 12 13 14 15 16 17 18
Economic cycle Development cycleGrowth
Schematic real estate growth cycle
Colliers International 201716
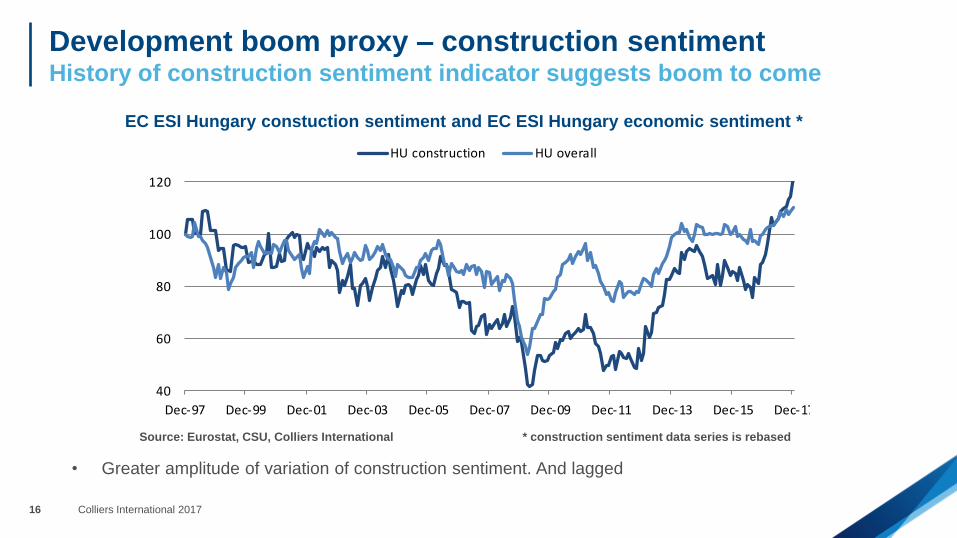
Development boom proxy – construction sentimentHistory of construction sentiment indicator suggests boom to come
EC ESI Hungary constuction sentiment and EC ESI Hungary economic sentiment *
Source: Eurostat, CSU, Colliers International * construction sentiment data series is rebased
• Greater amplitude of variation of construction sentiment. And lagged
40
60
80
100
120
Dec-97 Dec-99 Dec-01 Dec-03 Dec-05 Dec-07 Dec-09 Dec-11 Dec-13 Dec-15 Dec-17
HU construction HU overall
Colliers International 201717
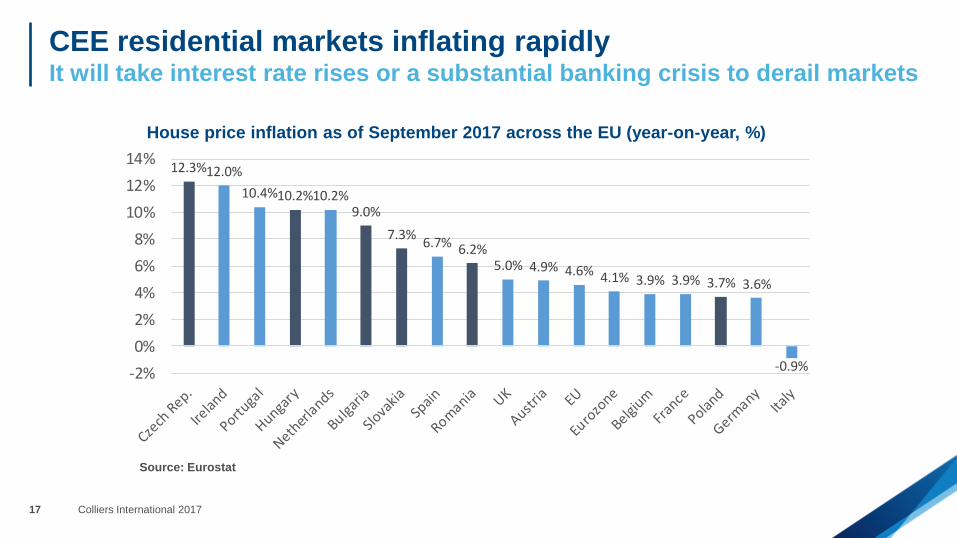
CEE residential markets inflating rapidlyIt will take interest rate rises or a substantial banking crisis to derail markets
House price inflation as of September 2017 across the EU (year-on-year, %)
Source: Eurostat
12.3%12.0%
10.4%10.2%10.2%9.0%
7.3%6.7% 6.2%
5.0% 4.9% 4.6% 4.1% 3.9% 3.9% 3.7% 3.6%
-0.9%-2%
0%
2%
4%
6%
8%
10%
12%
14%
Colliers International 201718
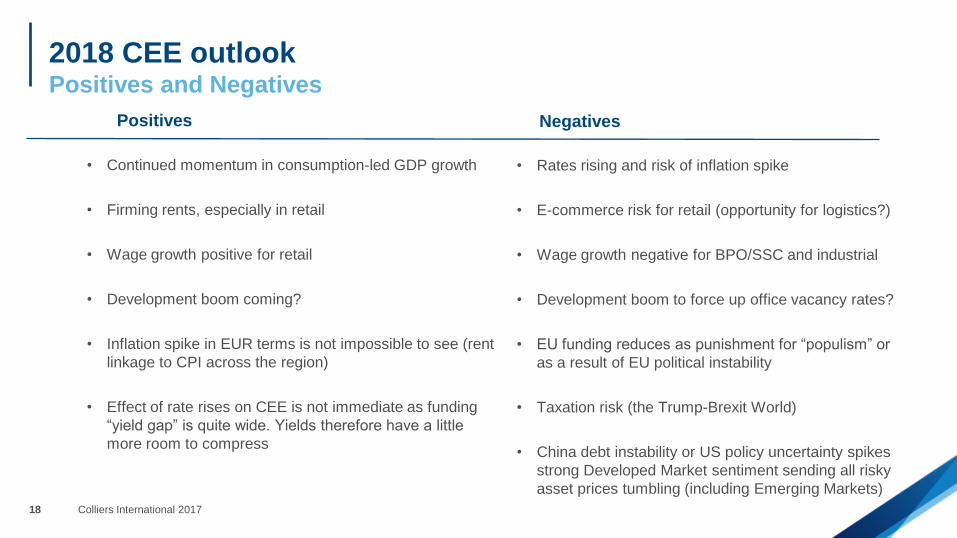
2018 CEE outlookPositives and Negatives
Negatives
• Continued momentum in consumption-led GDP growth
• Firming rents, especially in retail
• Wage growth positive for retail
• Development boom coming?
• Inflation spike in EUR terms is not impossible to see (rent
linkage to CPI across the region)
• Effect of rate rises on CEE is not immediate as funding
“yield gap” is quite wide. Yields therefore have a little
more room to compress
Positives
• Rates rising and risk of inflation spike
• E-commerce risk for retail (opportunity for logistics?)
• Wage growth negative for BPO/SSC and industrial
• Development boom to force up office vacancy rates?
• EU funding reduces as punishment for “populism” or
as a result of EU political instability
• Taxation risk (the Trump-Brexit World)
• China debt instability or US policy uncertainty spikes
strong Developed Market sentiment sending all risky
asset prices tumbling (including Emerging Markets)

Colliers International 201719
Colliers International | PragueSlovansky DumNa Prikope 859/22Prague 1 11000Czech Republic TEL +420 226 536 618
Mark Robinson
CEE Research Specialist | Prague
+420 226 537 646
1
9