Embed Size (px)
Citation preview

CECL – Using a Reasonable and Supportable Forecast
July 2019
CECL – Using a Reasonable and Supportable Forecast 2
Speakers
Chris HenkelSenior Director, Enterprise Risk SolutionsMoody’s Analytics
Robby HolditchDirector, Regulatory and Accounting SolutionsMoody’s Analytics
Sohini ChowdhuryDirector, Regulatory and Accounting SolutionsMoody’s Analytics
CECL – Using a Reasonable and Supportable Forecast 3
Today’s Discussion Points
» CECL Overview: What’s Changing?
» Recent Updates: Real-life Impact
» Estimating Expected Credit Losses (“ECL”): A Refresher
» Understanding and Defending Your Reasonable and Supportable Forecast
» Concluding Remarks and Q&A

CECL Overview1
CECL – Using a Reasonable and Supportable Forecast 5
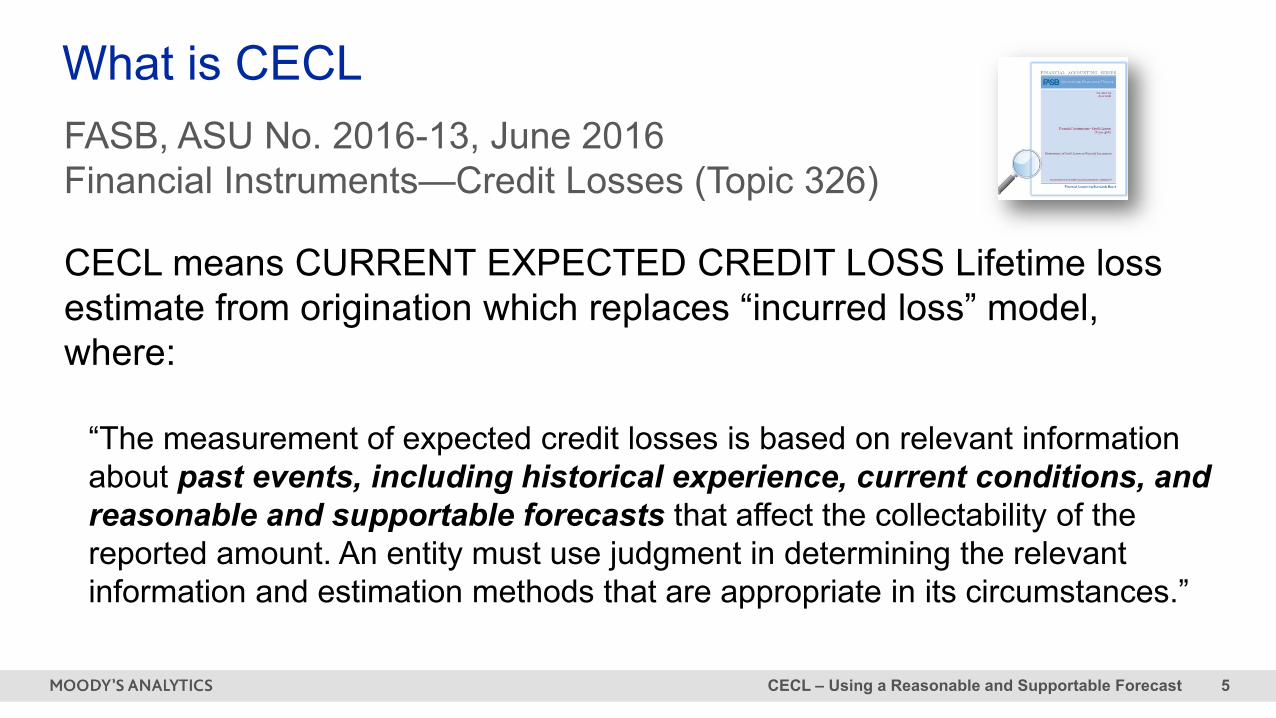
CECL means CURRENT EXPECTED CREDIT LOSS Lifetime loss estimate from origination which replaces “incurred loss” model, where:
“The measurement of expected credit losses is based on relevant information about past events, including historical experience, current conditions, and reasonable and supportable forecasts that affect the collectability of the reported amount. An entity must use judgment in determining the relevant information and estimation methods that are appropriate in its circumstances.”
What is CECLFASB, ASU No. 2016-13, June 2016Financial Instruments—Credit Losses (Topic 326)
CECL – Using a Reasonable and Supportable Forecast 6
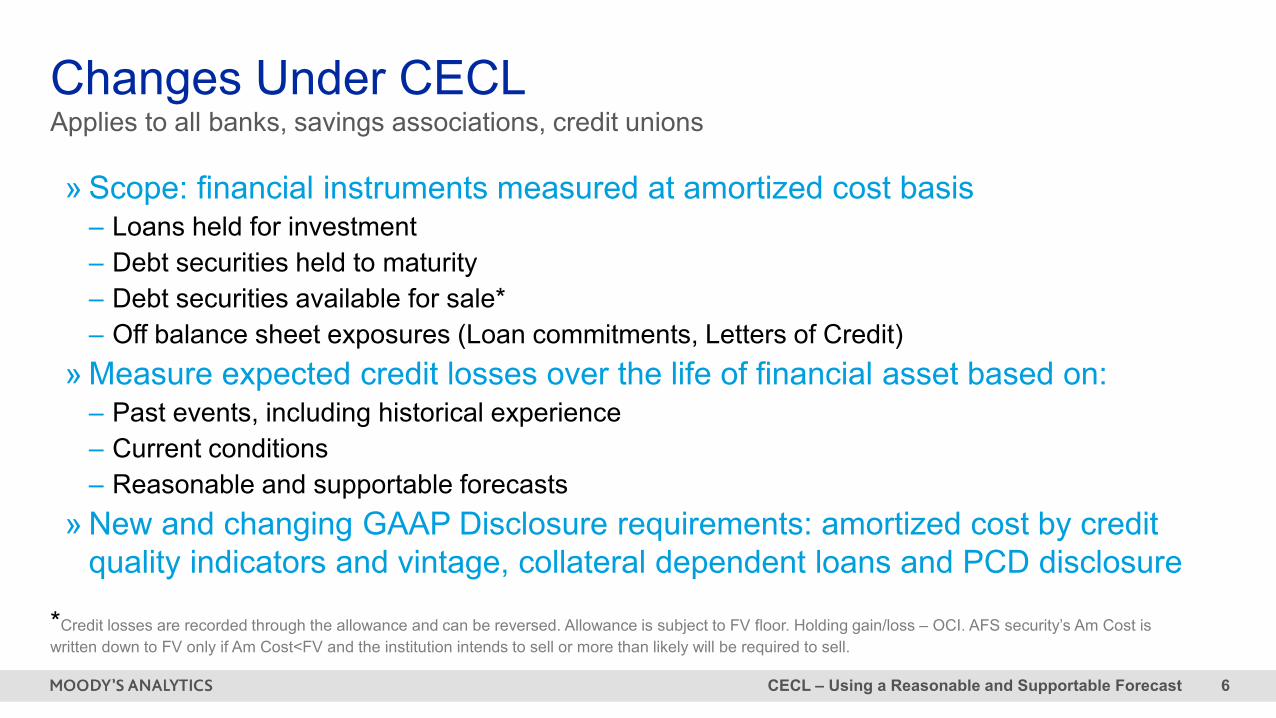
Changes Under CECLApplies to all banks, savings associations, credit unions
» Scope: financial instruments measured at amortized cost basis– Loans held for investment– Debt securities held to maturity– Debt securities available for sale*– Off balance sheet exposures (Loan commitments, Letters of Credit)
» Measure expected credit losses over the life of financial asset based on: – Past events, including historical experience– Current conditions– Reasonable and supportable forecasts
» New and changing GAAP Disclosure requirements: amortized cost by credit quality indicators and vintage, collateral dependent loans and PCD disclosure
*Credit losses are recorded through the allowance and can be reversed. Allowance is subject to FV floor. Holding gain/loss – OCI. AFS security’s Am Cost is written down to FV only if Am Cost<FV and the institution intends to sell or more than likely will be required to sell.
CECL – Using a Reasonable and Supportable Forecast 7
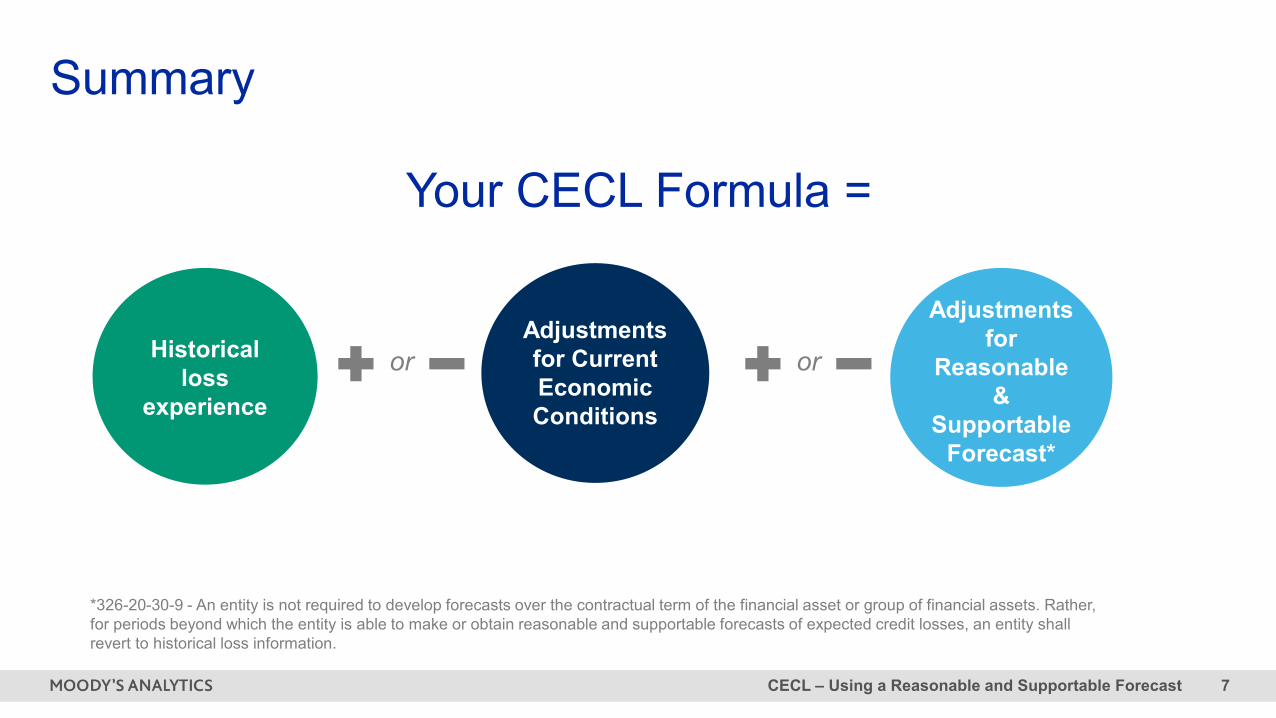
Historical loss
experience
Adjustments for Current Economic Conditions
Adjustments for
Reasonable &
Supportable Forecast*
Your CECL Formula =
Summary
*326-20-30-9 - An entity is not required to develop forecasts over the contractual term of the financial asset or group of financial assets. Rather, for periods beyond which the entity is able to make or obtain reasonable and supportable forecasts of expected credit losses, an entity shall revert to historical loss information.
or or
CECL – Using a Reasonable and Supportable Forecast 8
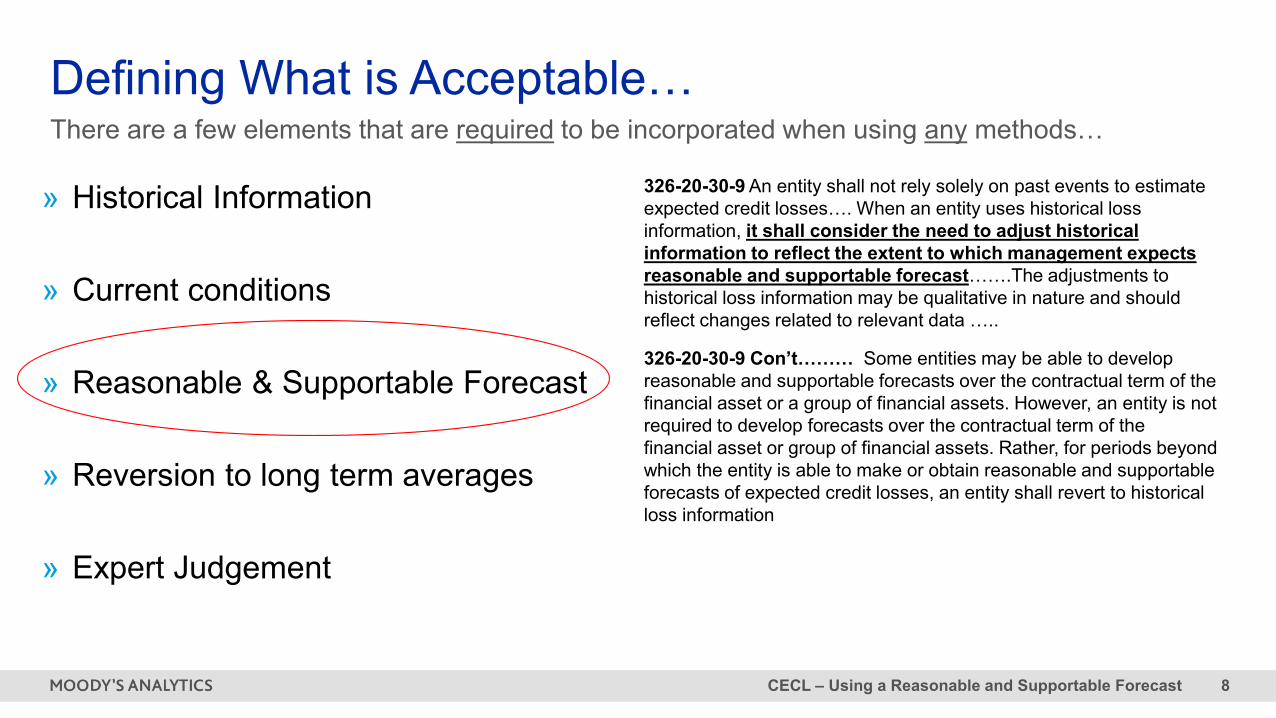
Defining What is Acceptable…There are a few elements that are required to be incorporated when using any methods…
» Historical Information
» Current conditions
» Reasonable & Supportable Forecast
» Reversion to long term averages
» Expert Judgement
326-20-30-9 An entity shall not rely solely on past events to estimate expected credit losses…. When an entity uses historical loss information, it shall consider the need to adjust historical information to reflect the extent to which management expects reasonable and supportable forecast…….The adjustments to historical loss information may be qualitative in nature and should reflect changes related to relevant data …..
326-20-30-9 Con’t……… Some entities may be able to develop reasonable and supportable forecasts over the contractual term of the financial asset or a group of financial assets. However, an entity is not required to develop forecasts over the contractual term of the financial asset or group of financial assets. Rather, for periods beyond which the entity is able to make or obtain reasonable and supportable forecasts of expected credit losses, an entity shall revert to historical loss information
CECL – Using a Reasonable and Supportable Forecast 9
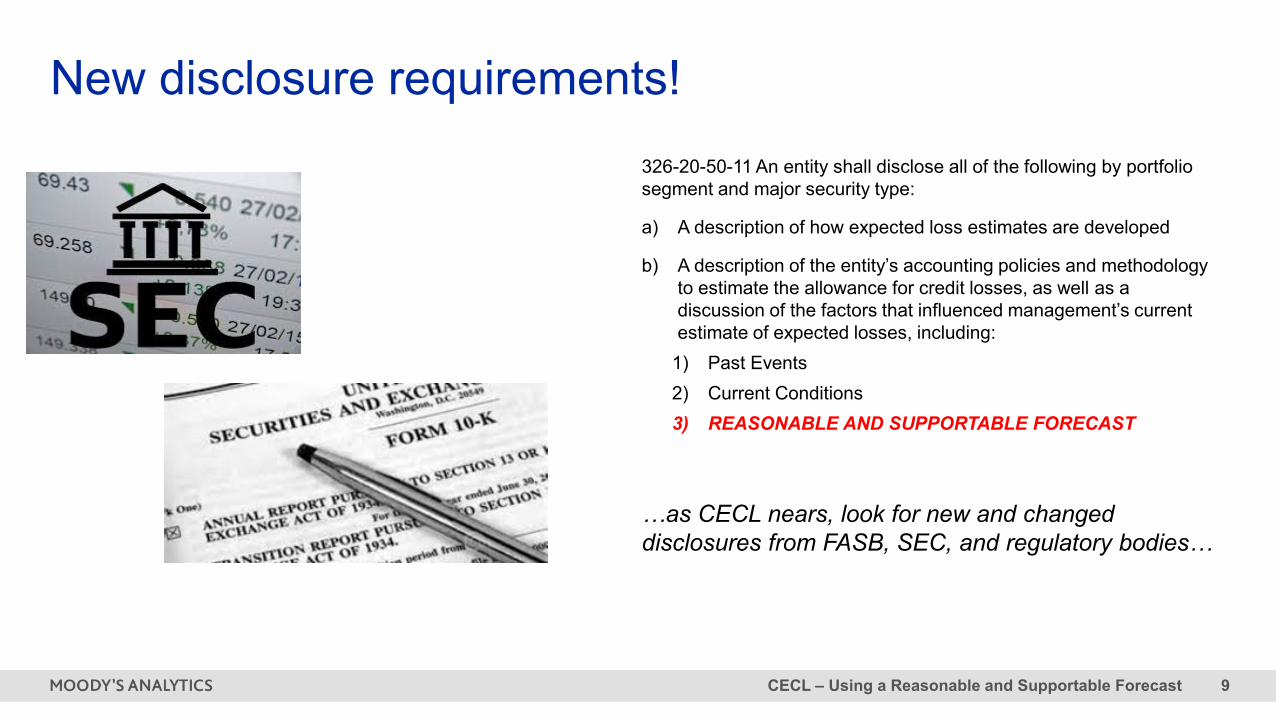
New disclosure requirements!326-20-50-11 An entity shall disclose all of the following by portfolio segment and major security type:
a) A description of how expected loss estimates are developed
b) A description of the entity’s accounting policies and methodology to estimate the allowance for credit losses, as well as a discussion of the factors that influenced management’s current estimate of expected losses, including:
1) Past Events2) Current Conditions3) REASONABLE AND SUPPORTABLE FORECAST
…as CECL nears, look for new and changed disclosures from FASB, SEC, and regulatory bodies…
CECL – Using a Reasonable and Supportable Forecast 10
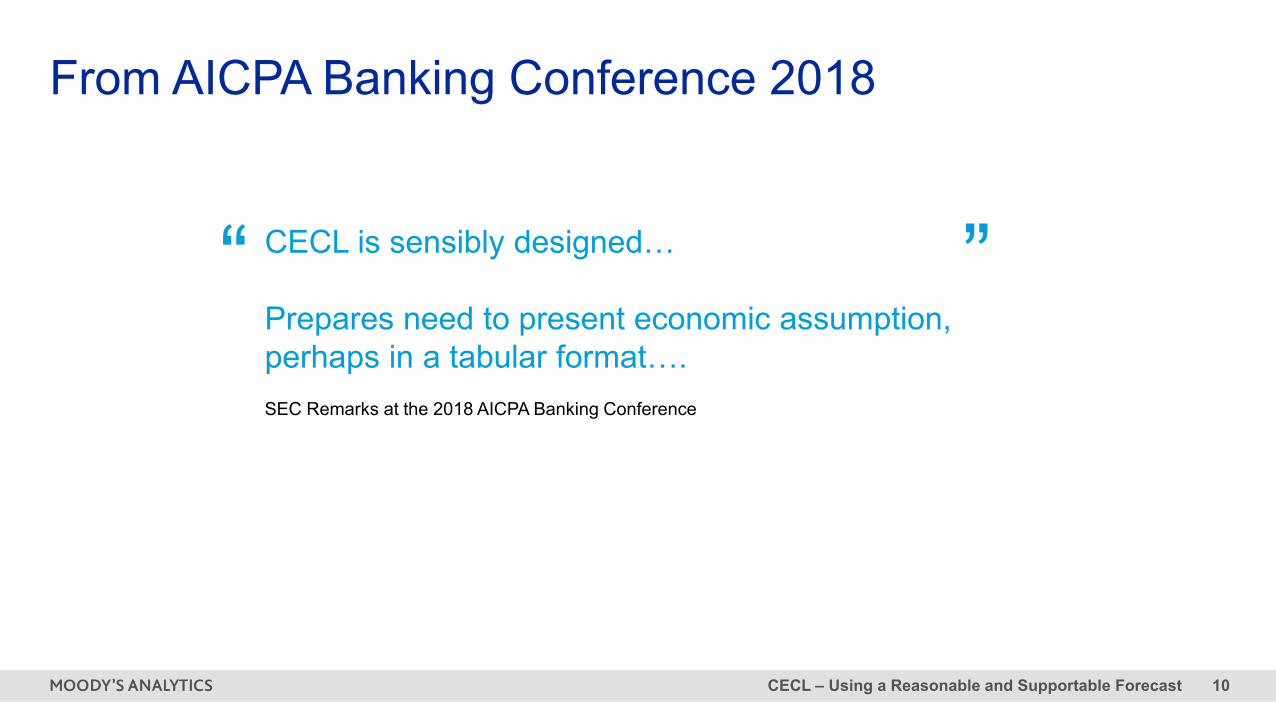
From AICPA Banking Conference 2018
CECL is sensibly designed…
Prepares need to present economic assumption, perhaps in a tabular format….SEC Remarks at the 2018 AICPA Banking Conference
“ ”
CECL – Using a Reasonable and Supportable Forecast 11
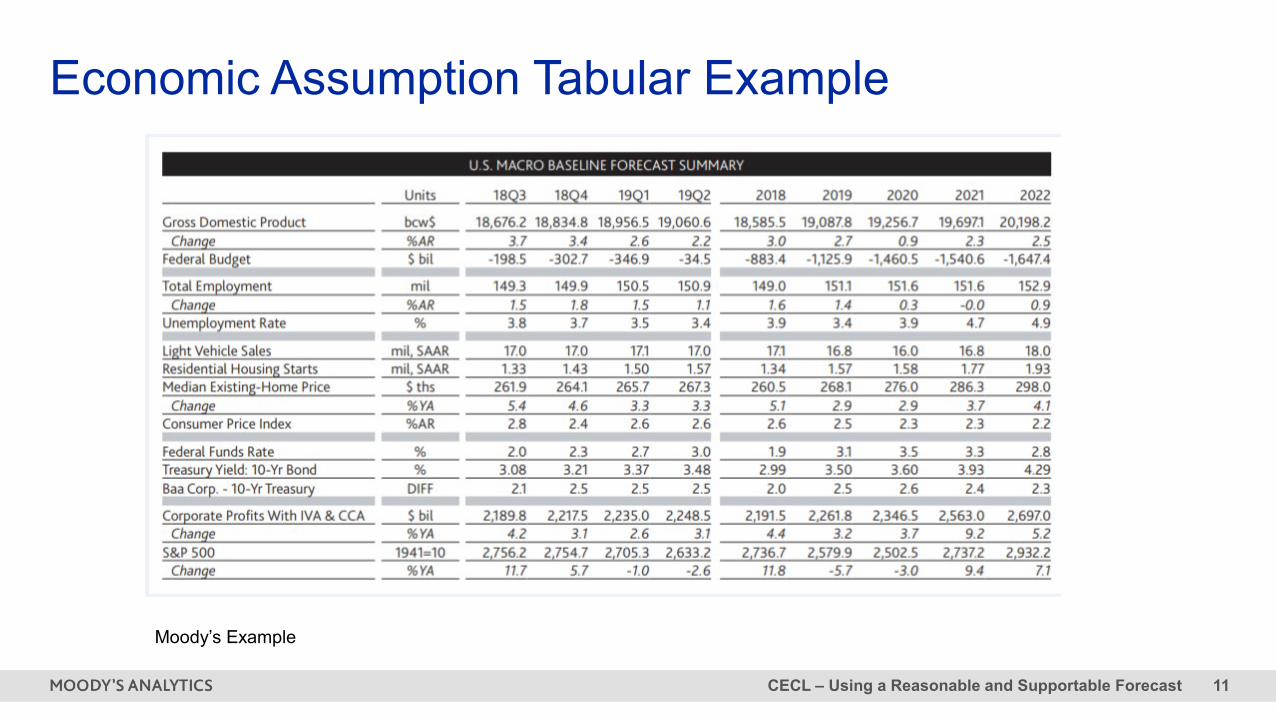
Economic Assumption Tabular Example
Moody’s Example

Recent Updates2
CECL – Using a Reasonable and Supportable Forecast 13
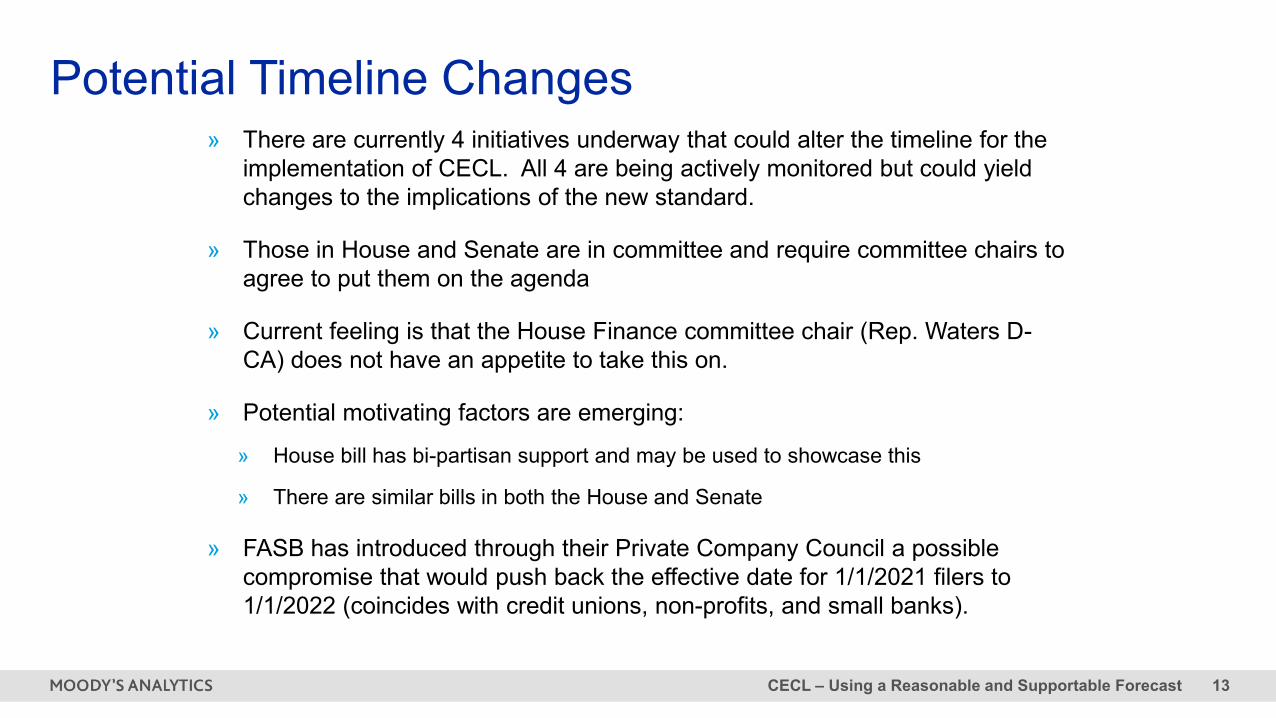
Potential Timeline Changes» There are currently 4 initiatives underway that could alter the timeline for the
implementation of CECL. All 4 are being actively monitored but could yield changes to the implications of the new standard.
» Those in House and Senate are in committee and require committee chairs to agree to put them on the agenda
» Current feeling is that the House Finance committee chair (Rep. Waters D-CA) does not have an appetite to take this on.
» Potential motivating factors are emerging:
» House bill has bi-partisan support and may be used to showcase this
» There are similar bills in both the House and Senate
» FASB has introduced through their Private Company Council a possible compromise that would push back the effective date for 1/1/2021 filers to 1/1/2022 (coincides with credit unions, non-profits, and small banks).
CECL – Using a Reasonable and Supportable Forecast 14
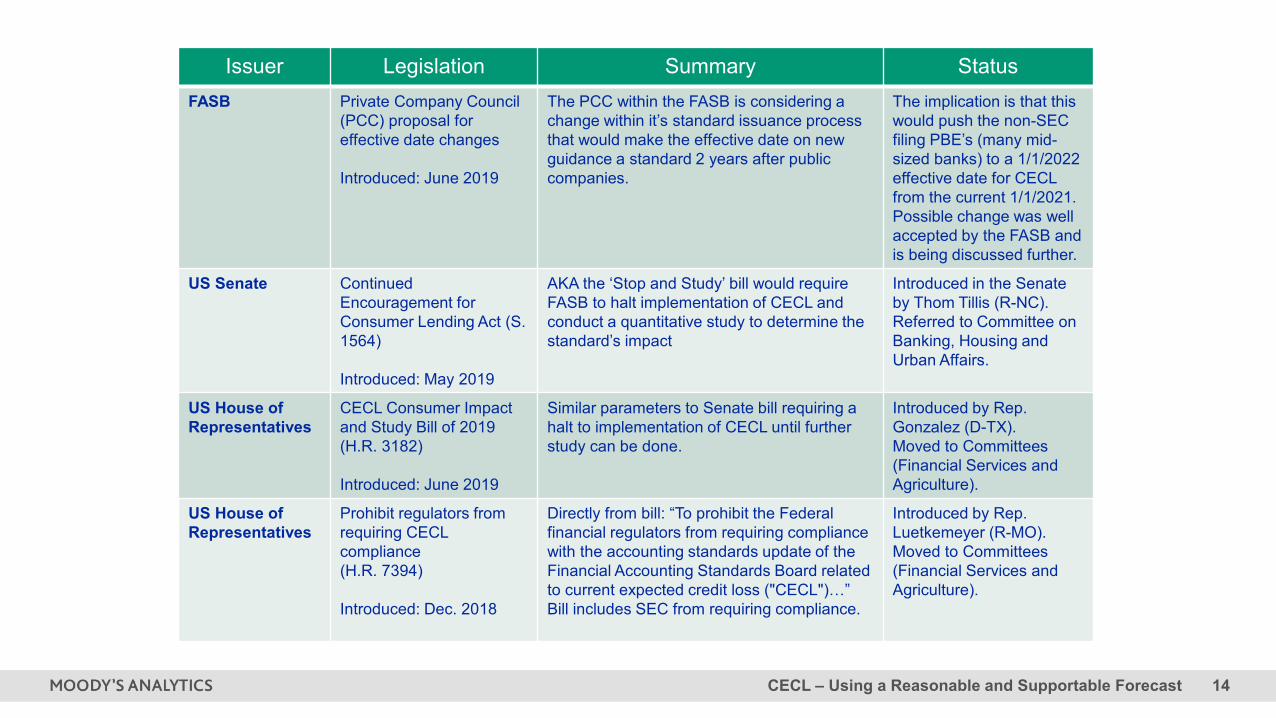
Issuer Legislation Summary StatusFASB Private Company Council
(PCC) proposal for effective date changes
Introduced: June 2019
The PCC within the FASB is considering a change within it’s standard issuance process that would make the effective date on new guidance a standard 2 years after public companies.
The implication is that this would push the non-SEC filing PBE’s (many mid-sized banks) to a 1/1/2022 effective date for CECL from the current 1/1/2021. Possible change was well accepted by the FASB and is being discussed further.
US Senate Continued Encouragement for Consumer Lending Act (S. 1564)
Introduced: May 2019
AKA the ‘Stop and Study’ bill would require FASB to halt implementation of CECL and conduct a quantitative study to determine the standard’s impact
Introduced in the Senate by Thom Tillis (R-NC). Referred to Committee on Banking, Housing and Urban Affairs.
US House of Representatives
CECL Consumer Impact and Study Bill of 2019 (H.R. 3182)
Introduced: June 2019
Similar parameters to Senate bill requiring a halt to implementation of CECL until further study can be done.
Introduced by Rep. Gonzalez (D-TX).Moved to Committees (Financial Services and Agriculture).
US House of Representatives
Prohibit regulators from requiring CECL compliance(H.R. 7394)
Introduced: Dec. 2018
Directly from bill: “To prohibit the Federal financial regulators from requiring compliance with the accounting standards update of the Financial Accounting Standards Board related to current expected credit loss ("CECL")…”Bill includes SEC from requiring compliance.
Introduced by Rep. Luetkemeyer (R-MO).Moved to Committees (Financial Services and Agriculture).
CECL – Using a Reasonable and Supportable Forecast 15
NR 2018-142FOR IMMEDIATE RELEASEDecember 21, 2018
Agencies Allow Three-Year Regulatory Capital Phase In for New Current Expected Credit Losses (CECL) Accounting Standard
The federal bank regulatory agencies approved a final rule modifying their regulatory capital rules and providing an option to phase in over a period of three years the day-one regulatory capital effects of the update to the accounting standard known as the “Current Expected Credit Losses” (CECL) methodology. The final rule also revises the agencies’ other rules to reflect the update to the accounting standards.
Regulatory Capital Changes
CECL – Using a Reasonable and Supportable Forecast 16
Draft Reporting Form Call Report Revisions Proposed
This draft reporting form reflects revisions addressing the revised accounting for credit losses under the Financial Accounting Standards Board’s Accounting Standards Update No. 2016-13, “Financial Instruments –Credit Losses (Topic 326): Measurement of Credit Losses on Financial Instruments”
1) April 2019 Proposed Call Report Revisions for the Community Bank Leverage Ratio to RC-R2) September 2018 Proposed Call Report Revisions to RI-B & RI-C
Proposed Changes to Call Report FFIEC 031, 041 & 051
Estimating Expected Credit Losses (“ECL”): A Refresher3
CECL – Using a Reasonable and Supportable Forecast 18
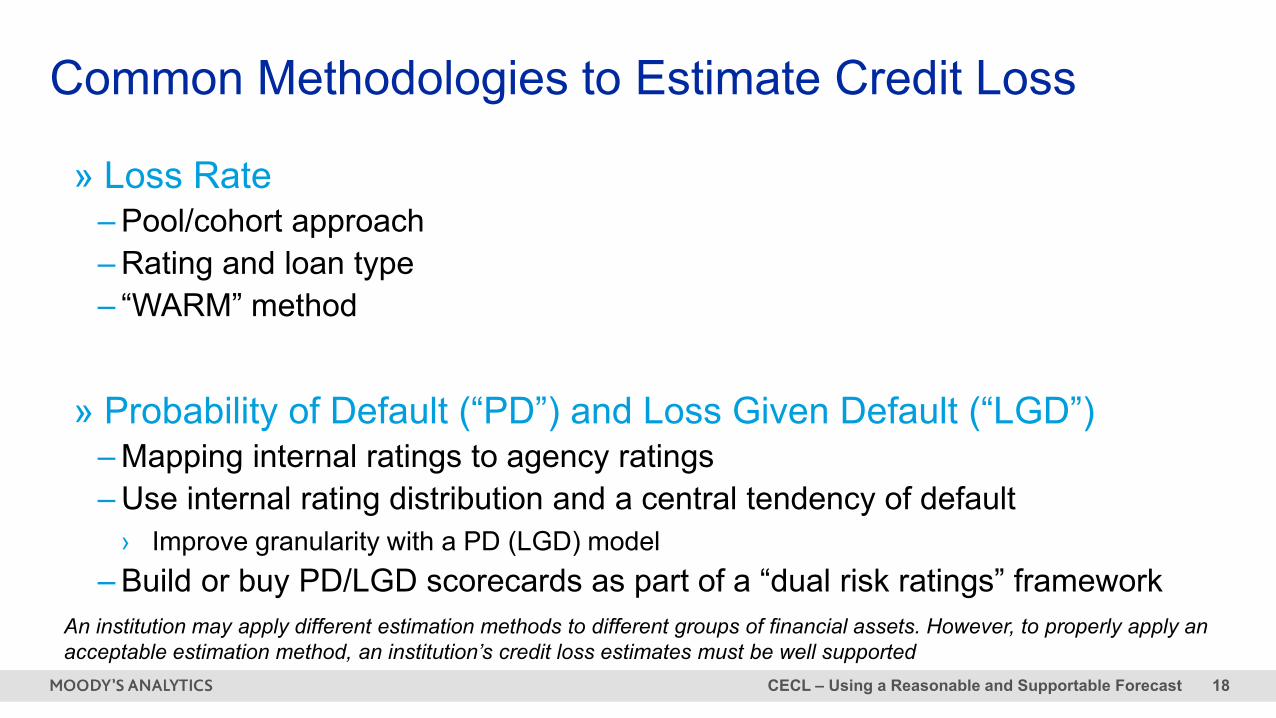
Common Methodologies to Estimate Credit Loss
» Loss Rate– Pool/cohort approach– Rating and loan type– “WARM” method
» Probability of Default (“PD”) and Loss Given Default (“LGD”) – Mapping internal ratings to agency ratings– Use internal rating distribution and a central tendency of default
› Improve granularity with a PD (LGD) model– Build or buy PD/LGD scorecards as part of a “dual risk ratings” framework
An institution may apply different estimation methods to different groups of financial assets. However, to properly apply an acceptable estimation method, an institution’s credit loss estimates must be well supported
CECL – Using a Reasonable and Supportable Forecast 19
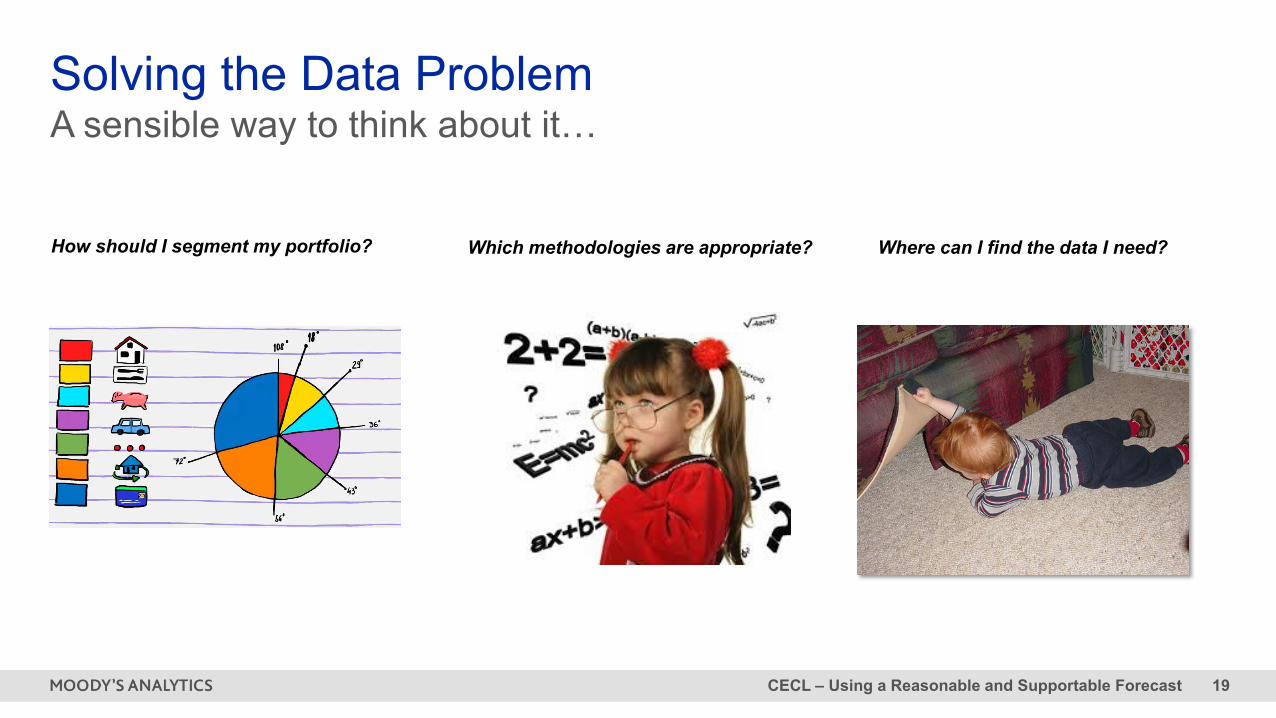
Solving the Data ProblemA sensible way to think about it…
How should I segment my portfolio? Which methodologies are appropriate? Where can I find the data I need?
CECL – Using a Reasonable and Supportable Forecast 20
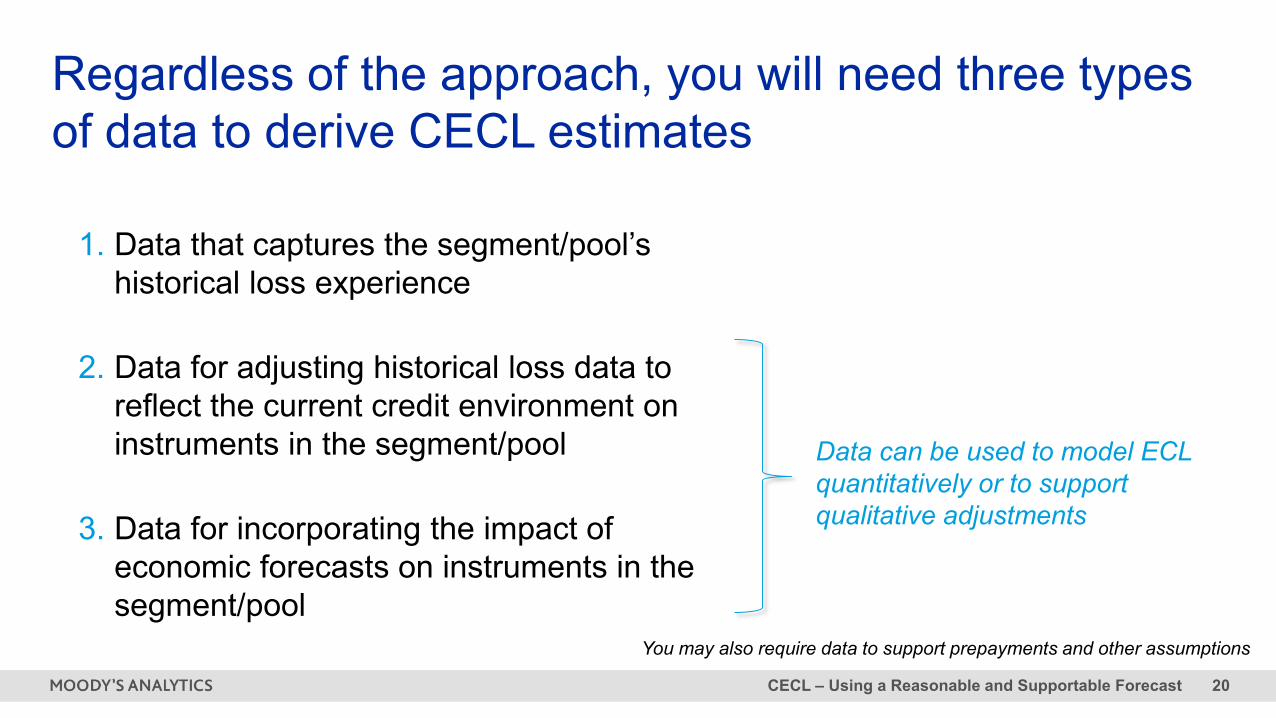
Regardless of the approach, you will need three types of data to derive CECL estimates
1. Data that captures the segment/pool’s historical loss experience
2. Data for adjusting historical loss data to reflect the current credit environment on instruments in the segment/pool
3. Data for incorporating the impact of economic forecasts on instruments in the segment/pool
Data can be used to model ECL quantitatively or to support qualitative adjustments
You may also require data to support prepayments and other assumptions
CECL – Using a Reasonable and Supportable Forecast 21
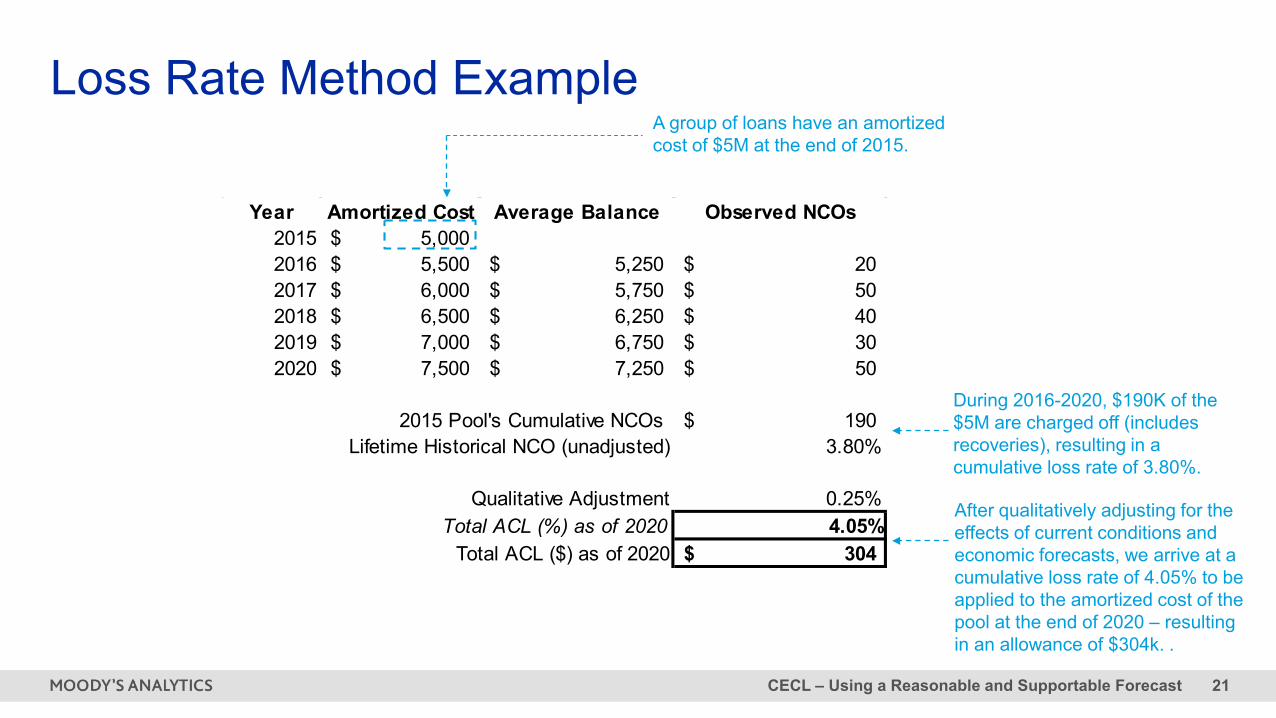
Year Amortized Cost Average Balance Observed NCOs 2015 5,000$ 2016 5,500$ 5,250$ 20$ 2017 6,000$ 5,750$ 50$ 2018 6,500$ 6,250$ 40$ 2019 7,000$ 6,750$ 30$ 2020 7,500$ 7,250$ 50$
2015 Pool's Cumulative NCOs 190$ Lifetime Historical NCO (unadjusted) 3.80%
Qualitative Adjustment 0.25%Total ACL (%) as of 2020 4.05%
Total ACL ($) as of 2020 304$
Loss Rate Method ExampleA group of loans have an amortized cost of $5M at the end of 2015.
During 2016-2020, $190K of the $5M are charged off (includes recoveries), resulting in a cumulative loss rate of 3.80%.
After qualitatively adjusting for the effects of current conditions and economic forecasts, we arrive at a cumulative loss rate of 4.05% to be applied to the amortized cost of the pool at the end of 2020 – resulting in an allowance of $304k. .
CECL – Using a Reasonable and Supportable Forecast 22
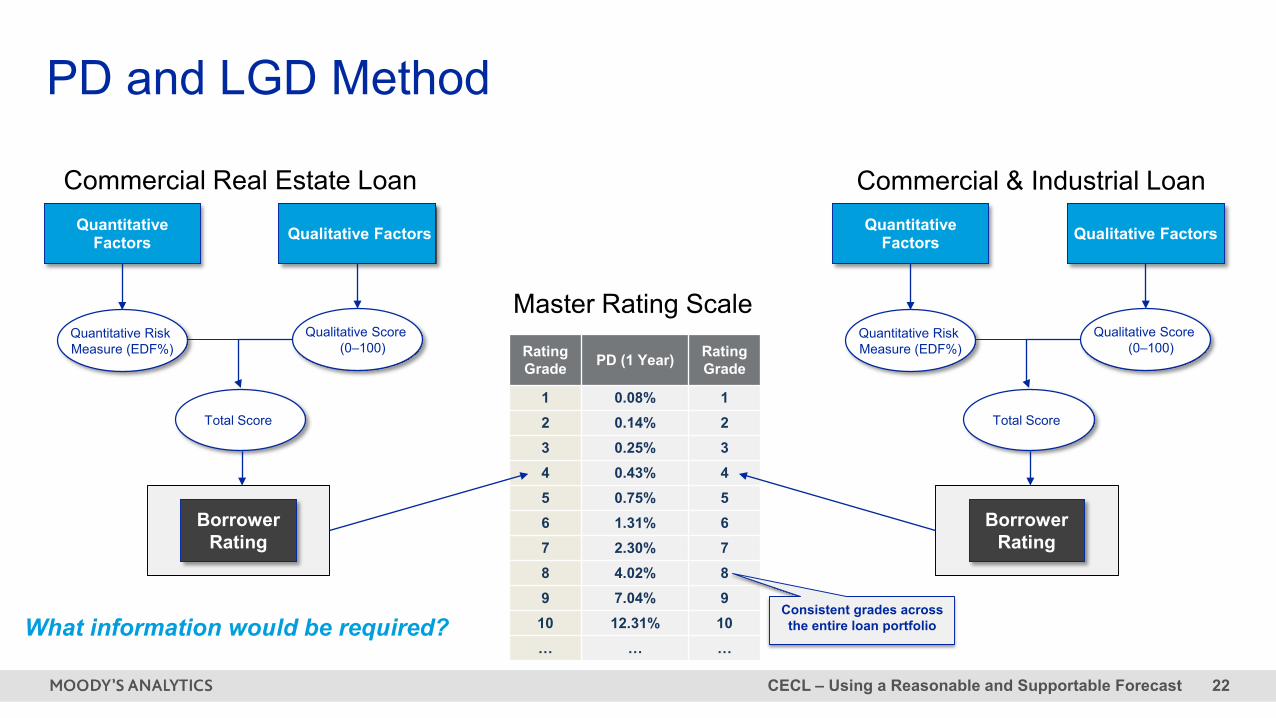
PD and LGD Method
Rating Grade PD (1 Year) Rating
Grade
1 0.08% 12 0.14% 23 0.25% 34 0.43% 45 0.75% 56 1.31% 67 2.30% 78 4.02% 89 7.04% 9
10 12.31% 10… … …
Qualitative Factors
Quantitative Risk Measure (EDF%)
Quantitative Factors
Qualitative Score (0–100)
Borrower Rating
Total Score
Qualitative Factors
Quantitative Risk Measure (EDF%)
Quantitative Factors
Qualitative Score (0–100)
Borrower Rating
Total Score
Commercial Real Estate Loan Commercial & Industrial Loan
Master Rating Scale
Consistent grades across the entire loan portfolioWhat information would be required?
CECL – Using a Reasonable and Supportable Forecast 23
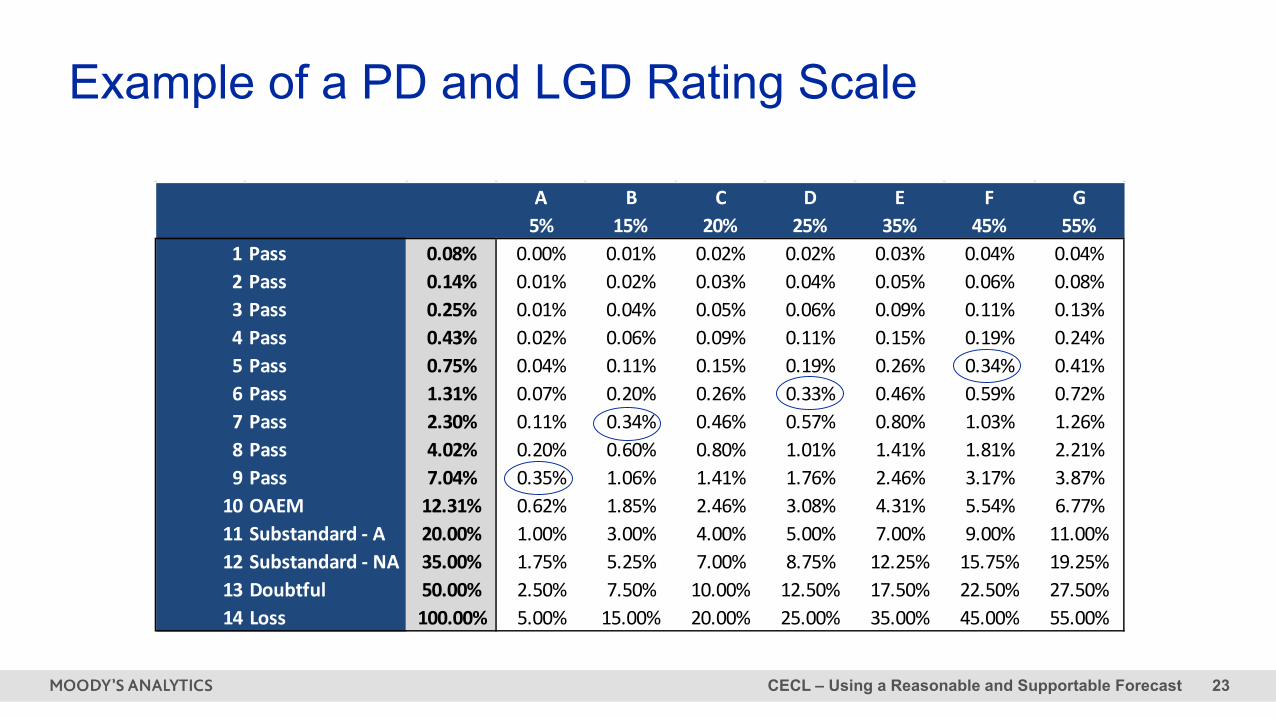
Example of a PD and LGD Rating Scale
A B C D E F G5% 15% 20% 25% 35% 45% 55%
1 Pass 0.08% 0.00% 0.01% 0.02% 0.02% 0.03% 0.04% 0.04%2 Pass 0.14% 0.01% 0.02% 0.03% 0.04% 0.05% 0.06% 0.08%3 Pass 0.25% 0.01% 0.04% 0.05% 0.06% 0.09% 0.11% 0.13%4 Pass 0.43% 0.02% 0.06% 0.09% 0.11% 0.15% 0.19% 0.24%5 Pass 0.75% 0.04% 0.11% 0.15% 0.19% 0.26% 0.34% 0.41%6 Pass 1.31% 0.07% 0.20% 0.26% 0.33% 0.46% 0.59% 0.72%7 Pass 2.30% 0.11% 0.34% 0.46% 0.57% 0.80% 1.03% 1.26%8 Pass 4.02% 0.20% 0.60% 0.80% 1.01% 1.41% 1.81% 2.21%9 Pass 7.04% 0.35% 1.06% 1.41% 1.76% 2.46% 3.17% 3.87%
10 OAEM 12.31% 0.62% 1.85% 2.46% 3.08% 4.31% 5.54% 6.77%11 Substandard - A 20.00% 1.00% 3.00% 4.00% 5.00% 7.00% 9.00% 11.00%12 Substandard - NA 35.00% 1.75% 5.25% 7.00% 8.75% 12.25% 15.75% 19.25%13 Doubtful 50.00% 2.50% 7.50% 10.00% 12.50% 17.50% 22.50% 27.50%14 Loss 100.00% 5.00% 15.00% 20.00% 25.00% 35.00% 45.00% 55.00%
CECL – Using a Reasonable and Supportable Forecast 24
0.00%
0.50%
1.00%
1.50%
2.00%
2.50%Annual Net Charge-Off Rate
0.00%0.50%1.00%1.50%2.00%2.50%3.00%3.50%4.00%4.50%5.00%
Noncurrent Loan Rate
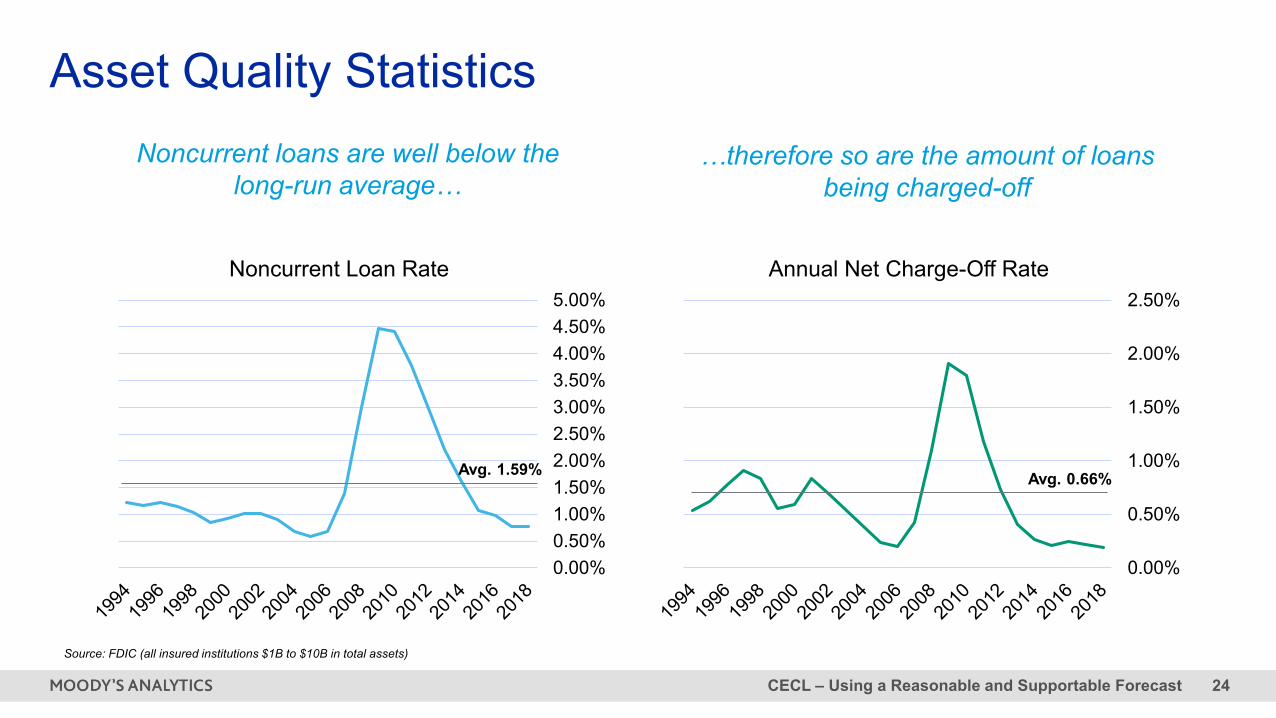
Asset Quality Statistics…therefore so are the amount of loans
being charged-off
Avg. 0.66%
Source: FDIC (all insured institutions $1B to $10B in total assets)
Noncurrent loans are well below the long-run average…
Avg. 1.59%
CECL – Using a Reasonable and Supportable Forecast 25
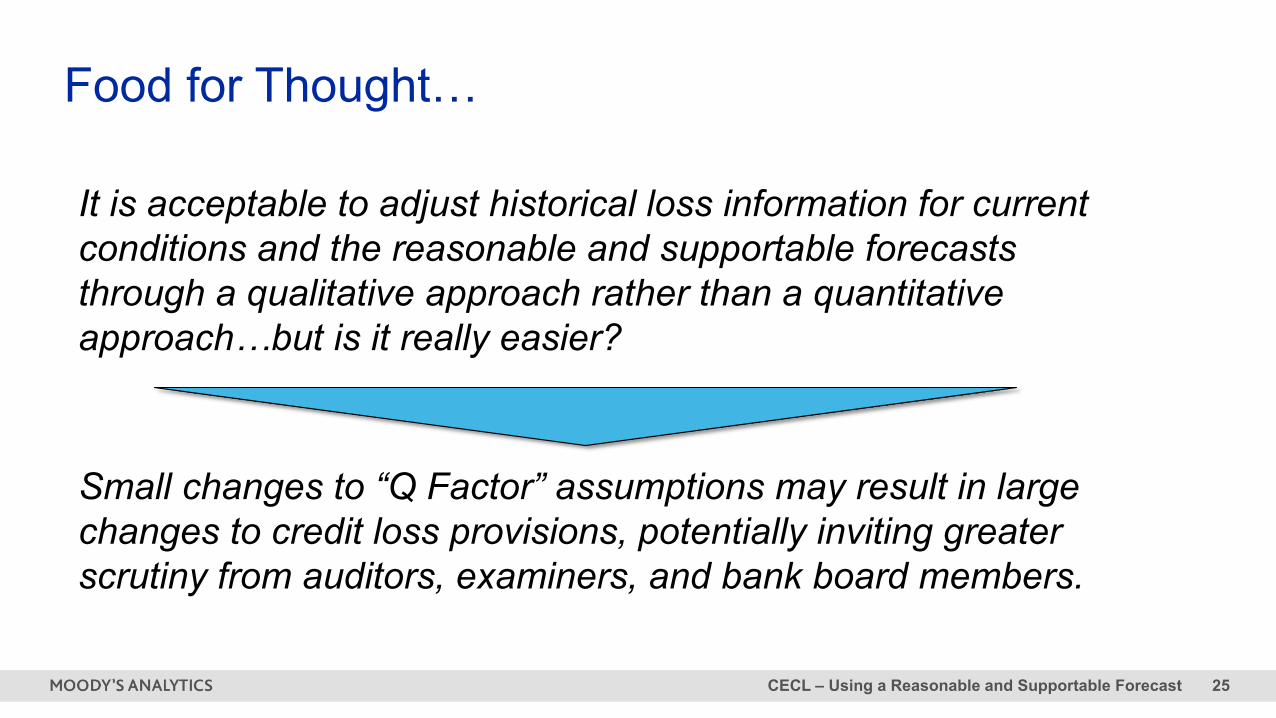
Food for Thought…
It is acceptable to adjust historical loss information for current conditions and the reasonable and supportable forecasts through a qualitative approach rather than a quantitative approach…but is it really easier?
Small changes to “Q Factor” assumptions may result in large changes to credit loss provisions, potentially inviting greater scrutiny from auditors, examiners, and bank board members.
Understanding and Defending “Reasonable and Supportable” (R&S) Forecasts4
CECL – Using a Reasonable and Supportable Forecast 27
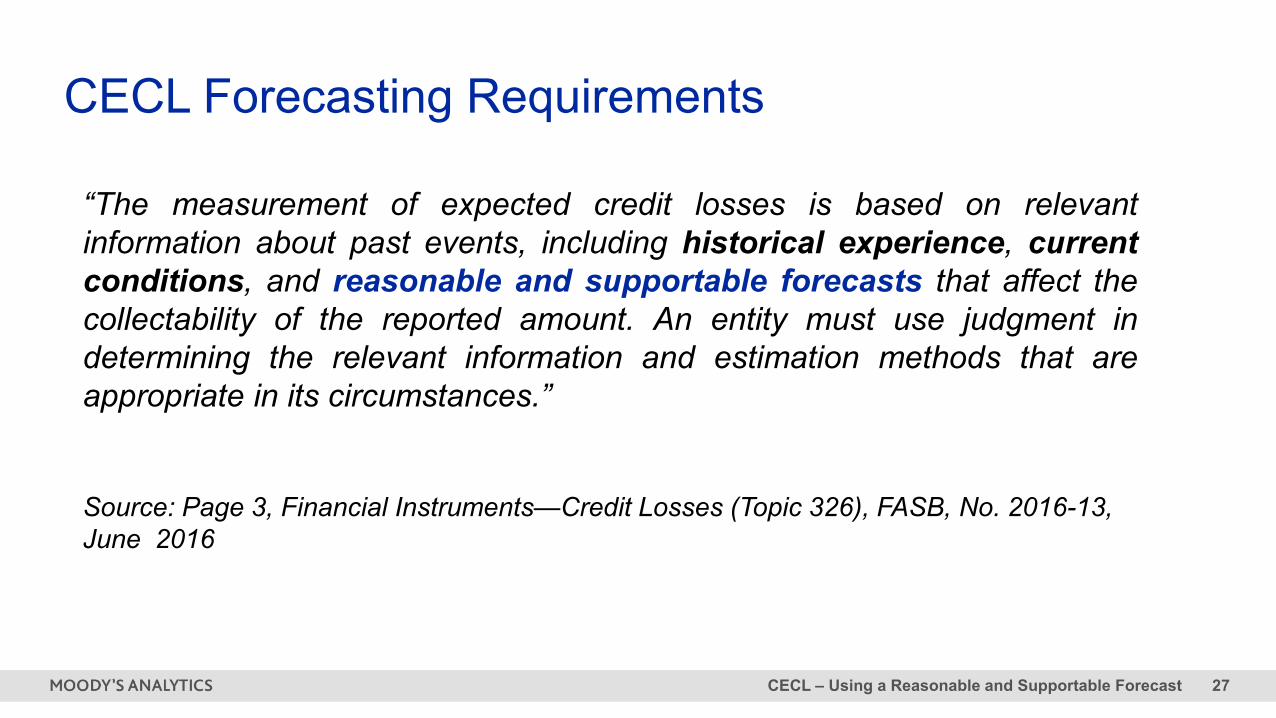
“The measurement of expected credit losses is based on relevantinformation about past events, including historical experience, currentconditions, and reasonable and supportable forecasts that affect thecollectability of the reported amount. An entity must use judgment indetermining the relevant information and estimation methods that areappropriate in its circumstances.”
Source: Page 3, Financial Instruments—Credit Losses (Topic 326), FASB, No. 2016-13, June 2016
CECL Forecasting RequirementsTopic 326 guidance
CECL – Using a Reasonable and Supportable Forecast 28
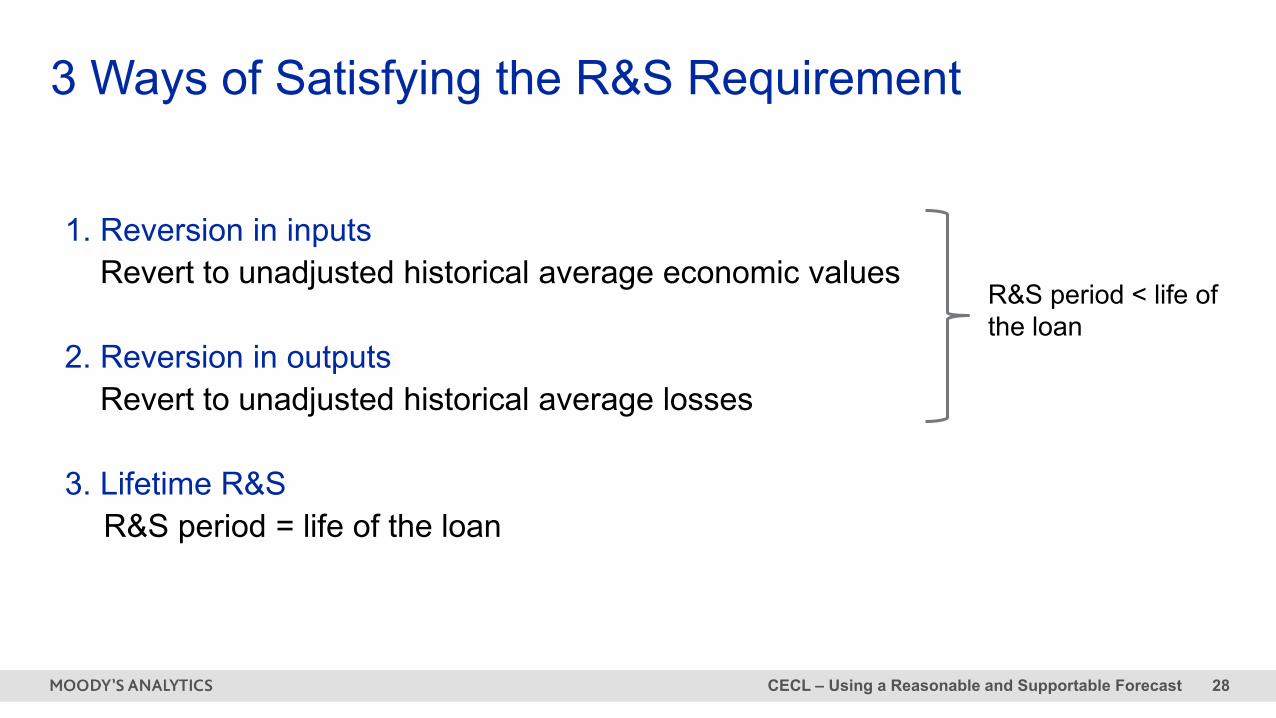
3 Ways of Satisfying the R&S Requirement
1. Reversion in inputsRevert to unadjusted historical average economic values
2. Reversion in outputs Revert to unadjusted historical average losses
3. Lifetime R&SR&S period = life of the loan
R&S period < life of the loan
CECL – Using a Reasonable and Supportable Forecast 29
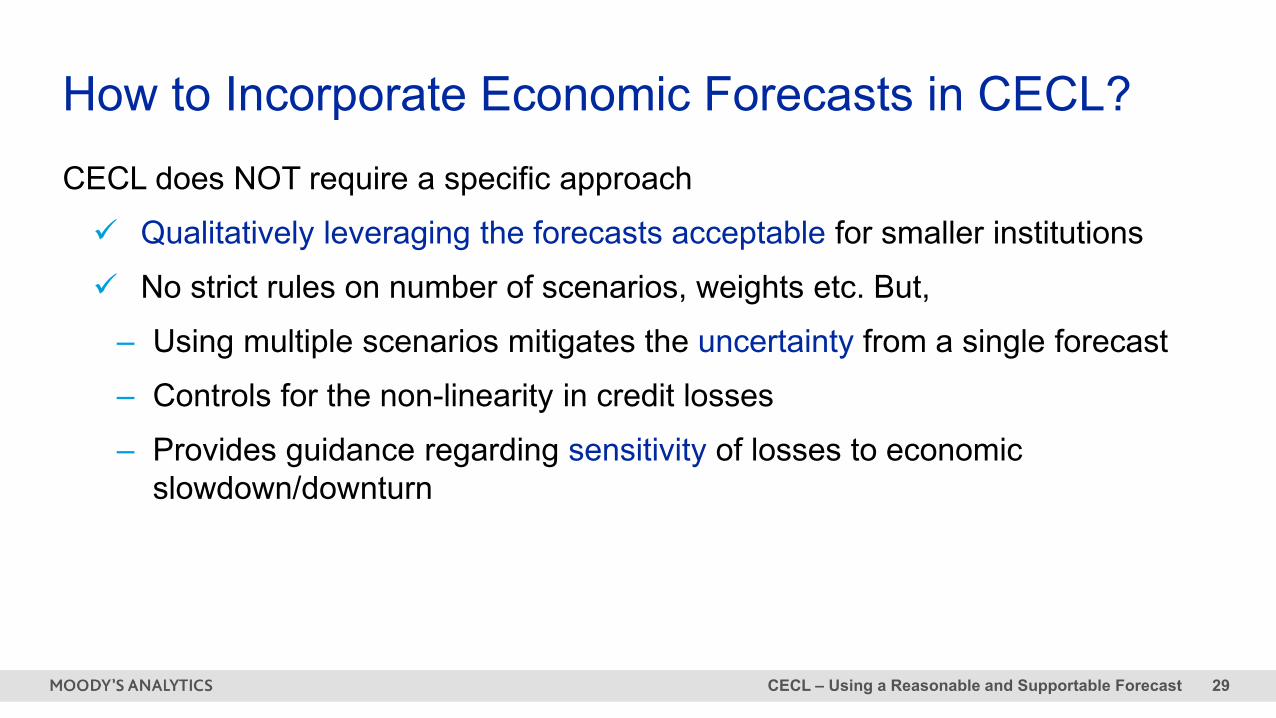
CECL does NOT require a specific approach Qualitatively leveraging the forecasts acceptable for smaller institutions No strict rules on number of scenarios, weights etc. But,
– Using multiple scenarios mitigates the uncertainty from a single forecast– Controls for the non-linearity in credit losses– Provides guidance regarding sensitivity of losses to economic
slowdown/downturn
How to Incorporate Economic Forecasts in CECL?
CECL – Using a Reasonable and Supportable Forecast 30
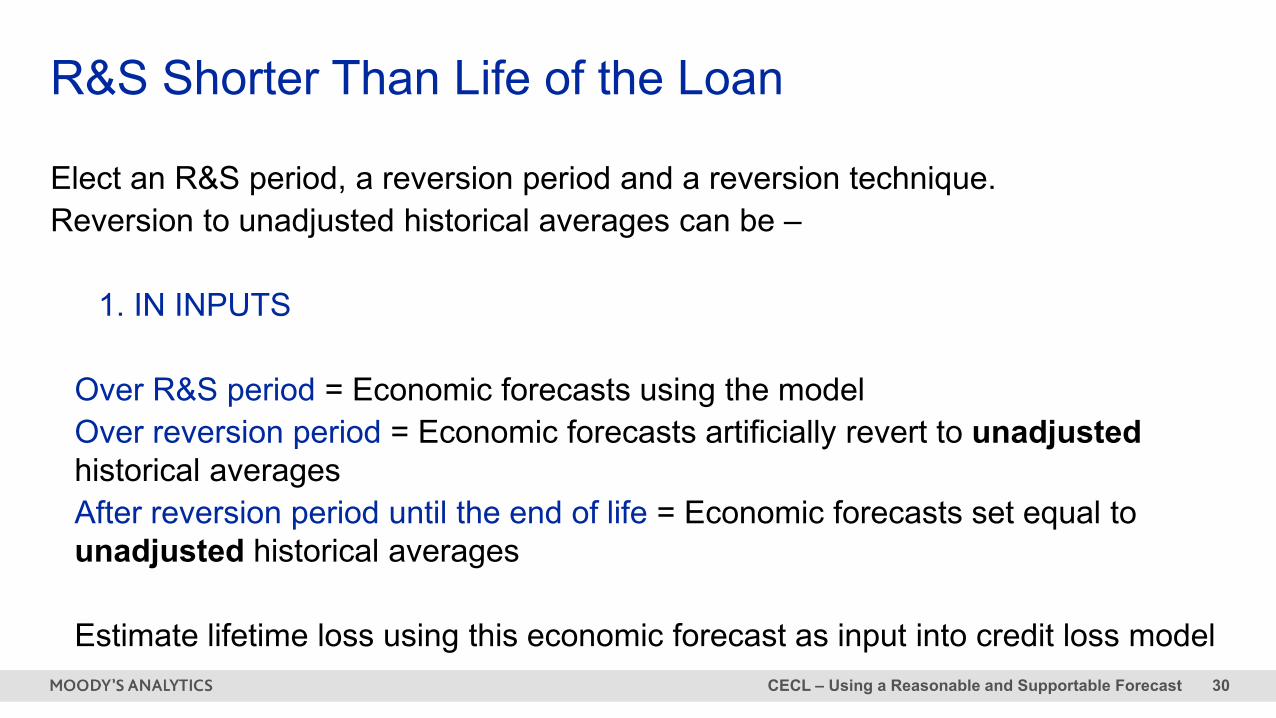
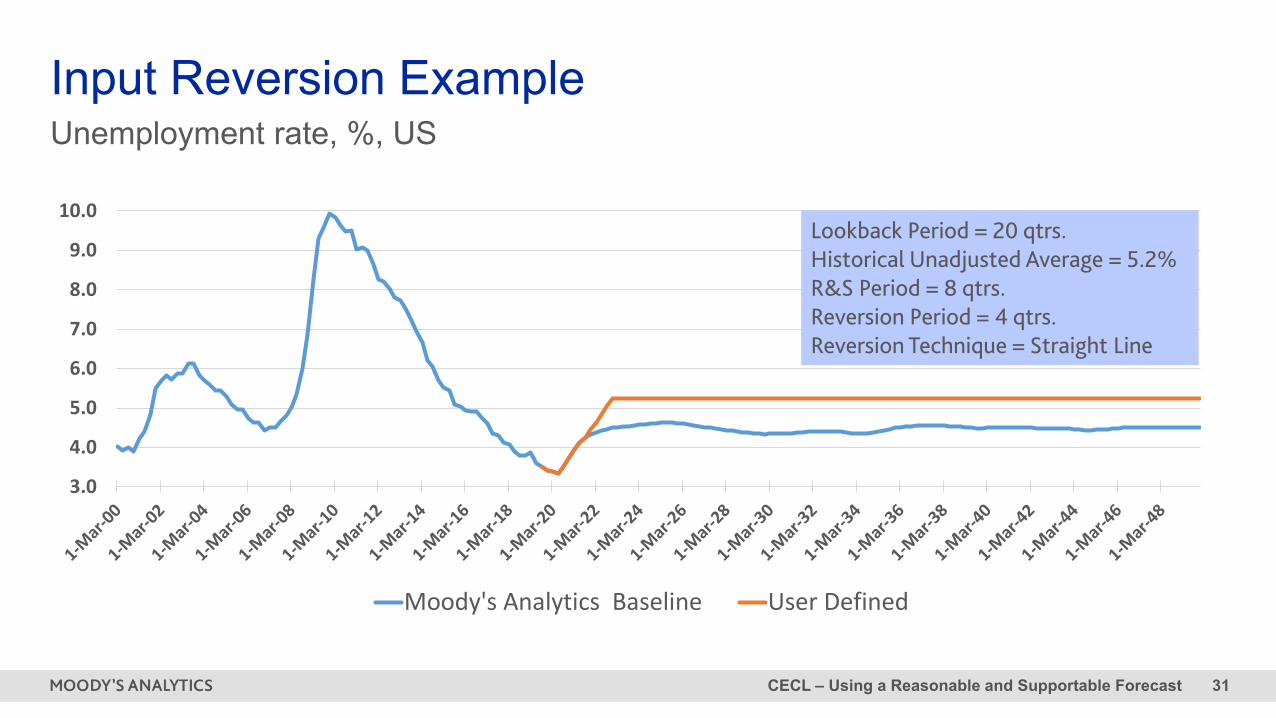
R&S Shorter Than Life of the Loan
Elect an R&S period, a reversion period and a reversion technique. Reversion to unadjusted historical averages can be –
1. IN INPUTS
Over R&S period = Economic forecasts using the modelOver reversion period = Economic forecasts artificially revert to unadjusted historical averagesAfter reversion period until the end of life = Economic forecasts set equal to unadjusted historical averages
Estimate lifetime loss using this economic forecast as input into credit loss model
CECL – Using a Reasonable and Supportable Forecast 31
Unemployment rate, %, USInput Reversion Example
3.0
4.0
5.0
6.0
7.0
8.0
9.0
10.0
Moody's Analytics Baseline User Defined
Lookback Period = 20 qtrs.Historical Unadjusted Average = 5.2%R&S Period = 8 qtrs.Reversion Period = 4 qtrs.Reversion Technique = Straight Line
CECL – Using a Reasonable and Supportable Forecast 32
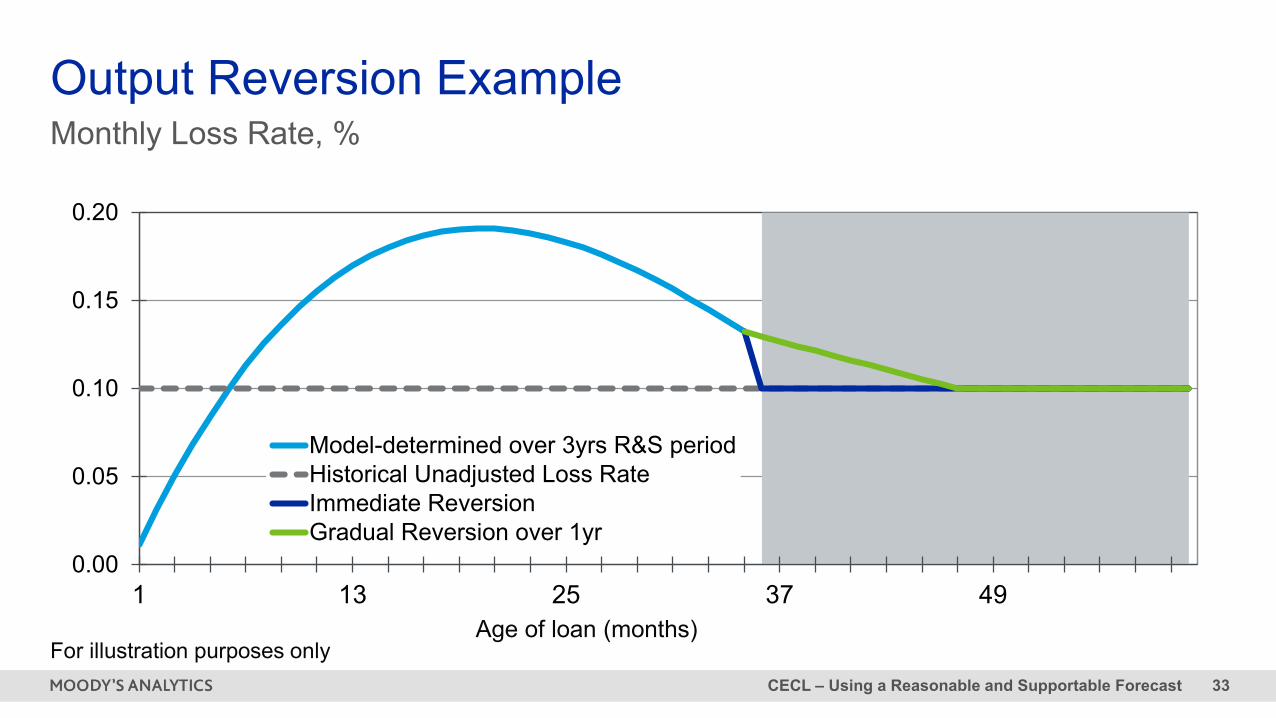
R&S Shorter Than Life of the Loan
2. IN OUTPUTS
Over R&S period = Credit loss and economic forecasts using the modelOver reversion period = Credit losses artificially revert to some unadjustedhistorical averageAfter reversion period until the end of life = Credit losses set equal to unadjusted historical averages
CECL – Using a Reasonable and Supportable Forecast 33
Monthly Loss Rate, %Output Reversion Example
0.00
0.05
0.10
0.15
0.20
1 13 25 37 49
Model-determined over 3yrs R&S periodHistorical Unadjusted Loss RateImmediate ReversionGradual Reversion over 1yr
For illustration purposes onlyAge of loan (months)
CECL – Using a Reasonable and Supportable Forecast 34
R&S = Life of the Loan
3. LIFETIME R&S
Possible only if BOTH a) and b) are satisfieda) Economic forecasts are R&S over the life of the loanb) Credit loss models produce reasonable estimates of losses over the life of the loan
CECL – Using a Reasonable and Supportable Forecast 35
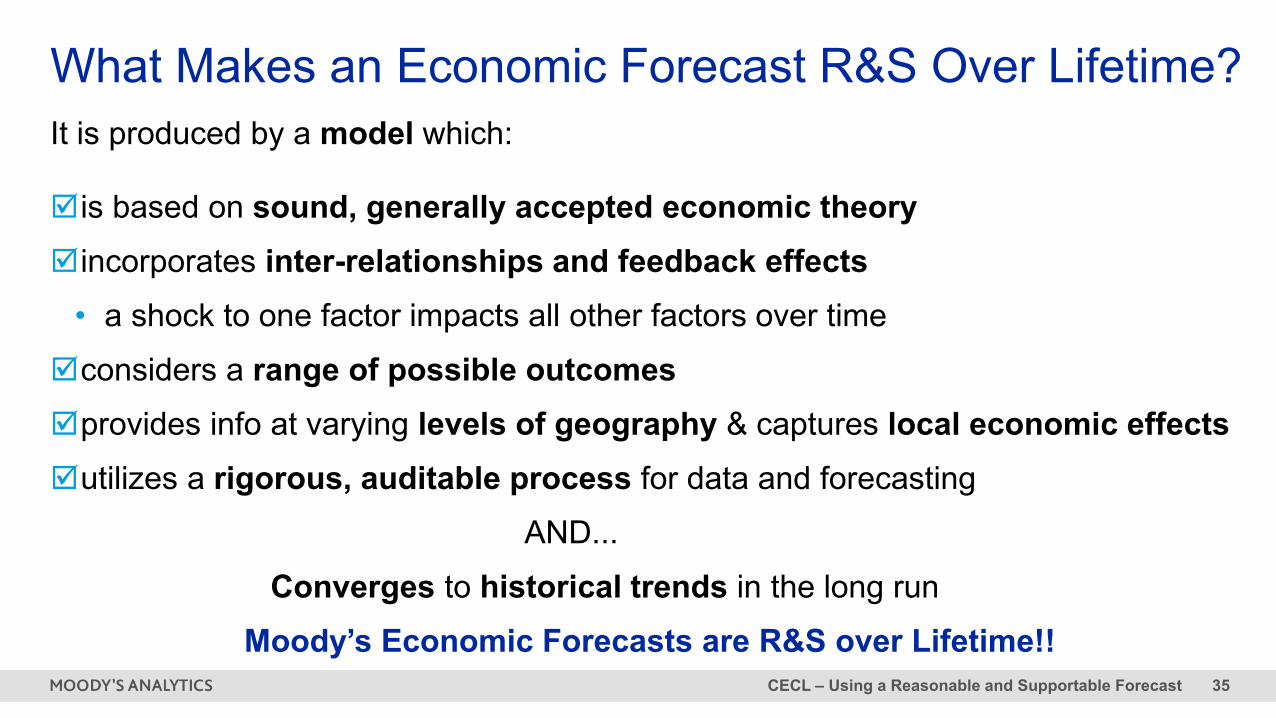
It is produced by a model which:
What Makes an Economic Forecast R&S Over Lifetime?
is based on sound, generally accepted economic theoryincorporates inter-relationships and feedback effects
• a shock to one factor impacts all other factors over timeconsiders a range of possible outcomesprovides info at varying levels of geography & captures local economic effectsutilizes a rigorous, auditable process for data and forecasting
AND...Converges to historical trends in the long run
Moody’s Economic Forecasts are R&S over Lifetime!!
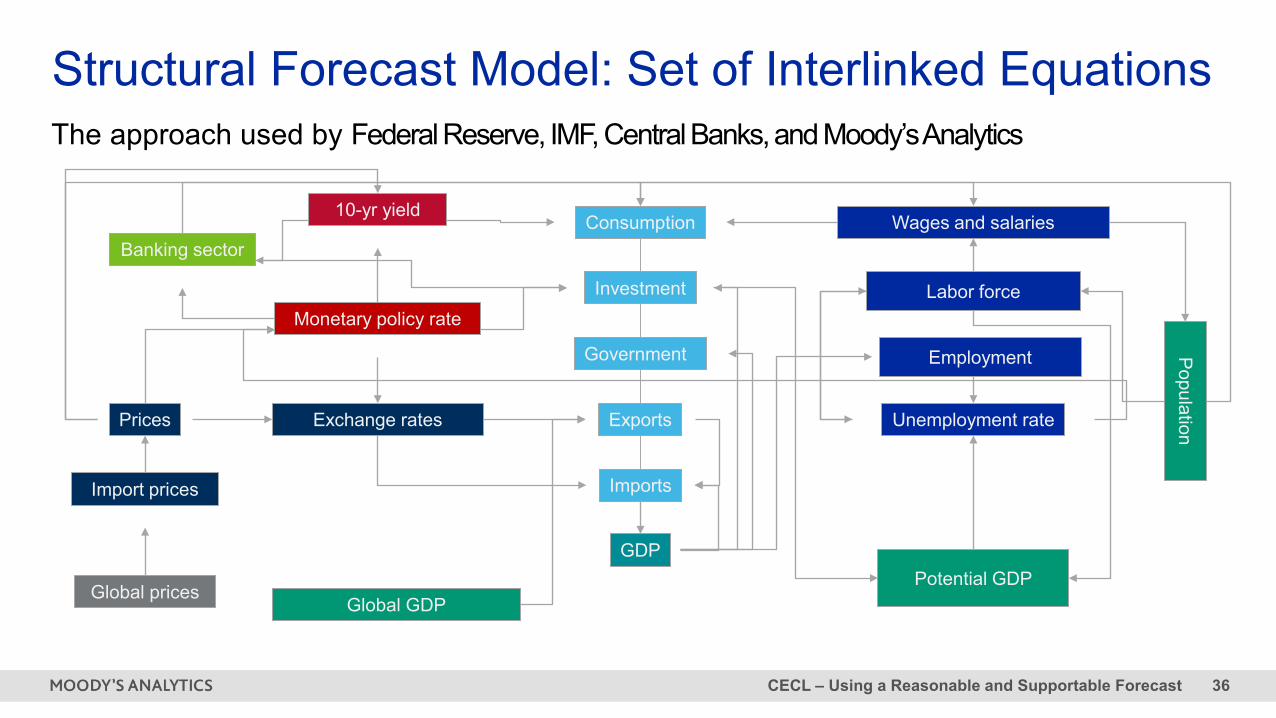
CECL – Using a Reasonable and Supportable Forecast 36
Structural Forecast Model: Set of Interlinked EquationsThe approach used by Federal Reserve, IMF, Central Banks, and Moody’s Analytics
Exchange rates
Investment
Wages and salaries
PopulationPrices
GDP
Monetary policy rate
Imports
Government
Exports
Global GDP
Unemployment rate
Consumption
Labor force
Potential GDP
Banking sector
Import prices
10-yr yield
Global prices
Employment
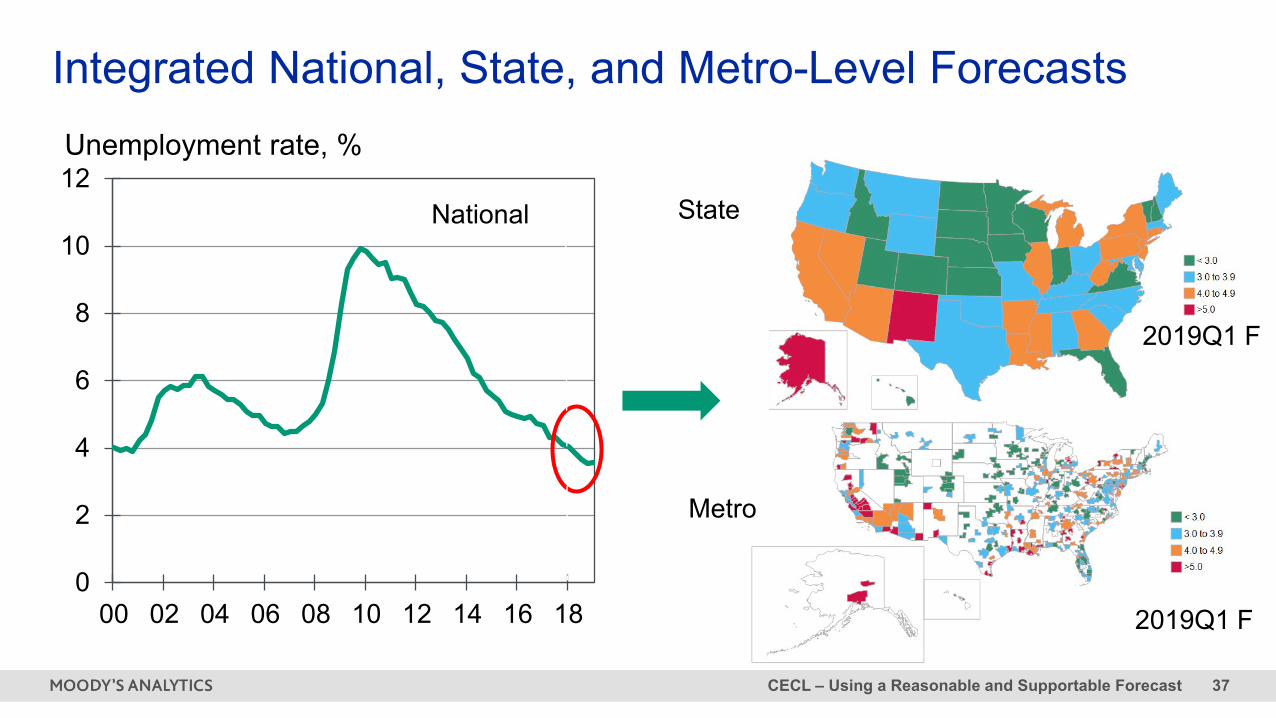
CECL – Using a Reasonable and Supportable Forecast 37
Integrated National, State, and Metro-Level Forecasts
0
2
4
6
8
10
12
00 02 04 06 08 10 12 14 16 18
Unemployment rate, %
National State
Metro
2019Q1 F
2019Q1 F
CECL – Using a Reasonable and Supportable Forecast 38
-6-5-4-3-2-1012345678
18 19 20 21 22 23 24 25 26 27 28 29 30
S0 BaselineS1 S3S4
US Real GDP, % change annualized
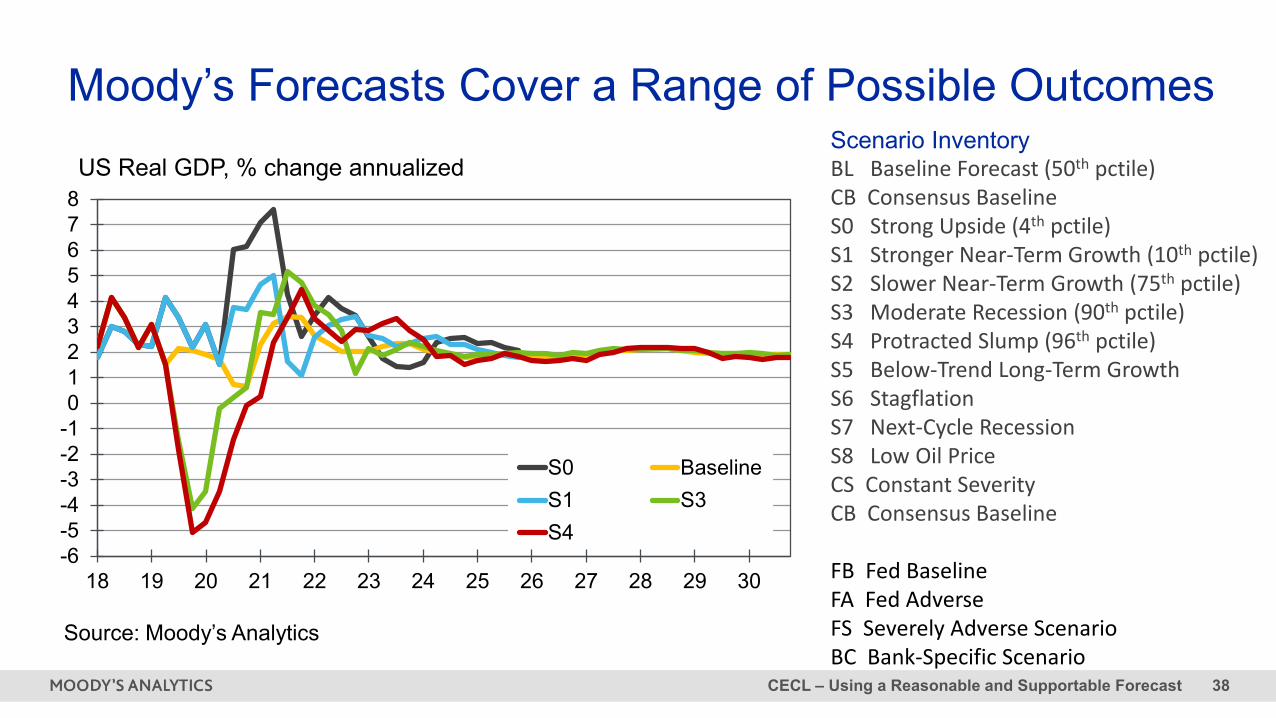
Moody’s Forecasts Cover a Range of Possible Outcomes
Source: Moody’s Analytics
Scenario InventoryBL Baseline Forecast (50th pctile)CB Consensus Baseline S0 Strong Upside (4th pctile)S1 Stronger Near-Term Growth (10th pctile)S2 Slower Near-Term Growth (75th pctile)S3 Moderate Recession (90th pctile)S4 Protracted Slump (96th pctile)S5 Below-Trend Long-Term GrowthS6 StagflationS7 Next-Cycle Recession S8 Low Oil PriceCS Constant Severity CB Consensus Baseline
FB Fed BaselineFA Fed AdverseFS Severely Adverse ScenarioBC Bank-Specific Scenario
CECL – Using a Reasonable and Supportable Forecast 39
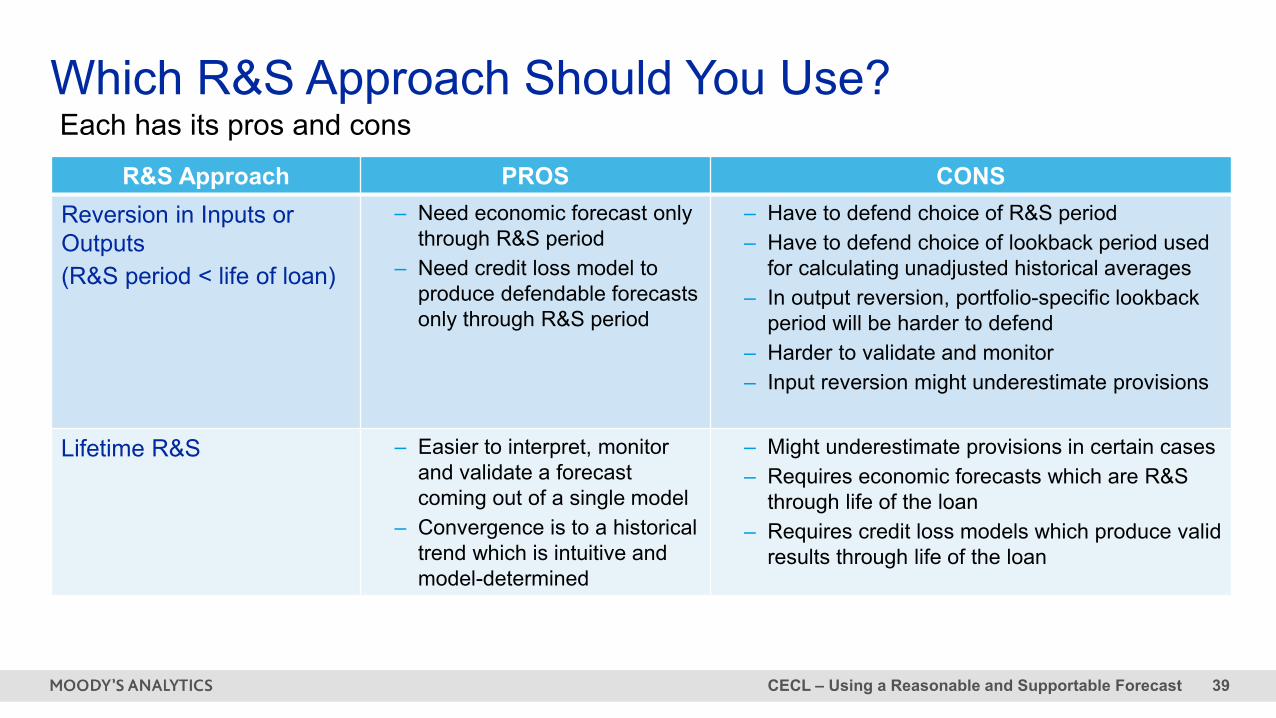
Which R&S Approach Should You Use?Each has its pros and cons
R&S Approach PROS CONSReversion in Inputs or Outputs (R&S period < life of loan)
– Need economic forecast only through R&S period
– Need credit loss model to produce defendable forecasts only through R&S period
– Have to defend choice of R&S period– Have to defend choice of lookback period used
for calculating unadjusted historical averages – In output reversion, portfolio-specific lookback
period will be harder to defend– Harder to validate and monitor– Input reversion might underestimate provisions
Lifetime R&S – Easier to interpret, monitor and validate a forecast coming out of a single model
– Convergence is to a historical trend which is intuitive and model-determined
– Might underestimate provisions in certain cases– Requires economic forecasts which are R&S
through life of the loan– Requires credit loss models which produce valid
results through life of the loan

Concluding Remarks and Q&A5

CECL – Using a Reasonable and Supportable Forecast 41

For more info on Moody’s Analytics solution, visit our CECL site:http://MoodysAnalytics.com/CECL-implementation
Robby HolditchDirector+1 (212) [email protected]
Chris HenkelSenior Director+1 (212) [email protected]
CECL – Using a Reasonable and Supportable Forecast 44
© 2019 Moody’s Corporation, Moody’s Investors Service, Inc., Moody’s Analytics, Inc. and/or their licensors and affiliates (collectively, “MOODY’S”). All rights reserved.
CREDIT RATINGS ISSUED BY MOODY'S INVESTORS SERVICE, INC. AND ITS RATINGS AFFILIATES (“MIS”) ARE MOODY’S CURRENT OPINIONS OF THE RELATIVE FUTURE CREDIT RISK OF ENTITIES, CREDIT COMMITMENTS, OR DEBT OR DEBT-LIKE SECURITIES, AND MOODY’S PUBLICATIONS MAY INCLUDE MOODY’S CURRENT OPINIONS OF THE RELATIVE FUTURE CREDIT RISK OF ENTITIES, CREDIT COMMITMENTS, OR DEBT OR DEBT-LIKE SECURITIES. MOODY’S DEFINES CREDIT RISK AS THE RISK THAT AN ENTITY MAY NOT MEET ITS CONTRACTUAL, FINANCIAL OBLIGATIONS AS THEY COME DUE AND ANY ESTIMATED FINANCIAL LOSS IN THE EVENT OF DEFAULT. CREDIT RATINGS DO NOT ADDRESS ANY OTHER RISK, INCLUDING BUT NOT LIMITED TO: LIQUIDITY RISK, MARKET VALUE RISK, OR PRICE VOLATILITY. CREDIT RATINGS AND MOODY’S OPINIONS INCLUDED IN MOODY’S PUBLICATIONS ARE NOT STATEMENTS OF CURRENT OR HISTORICAL FACT. MOODY’S PUBLICATIONS MAY ALSO INCLUDE QUANTITATIVE MODEL-BASED ESTIMATES OF CREDIT RISK AND RELATED OPINIONS OR COMMENTARY PUBLISHED BY MOODY’S ANALYTICS, INC. CREDIT RATINGS AND MOODY’S PUBLICATIONS DO NOT CONSTITUTE OR PROVIDE INVESTMENT OR FINANCIAL ADVICE, AND CREDIT RATINGS AND MOODY’S PUBLICATIONS ARE NOT AND DO NOT PROVIDE RECOMMENDATIONS TO PURCHASE, SELL, OR HOLD PARTICULAR SECURITIES. NEITHER CREDIT RATINGS NOR MOODY’S PUBLICATIONS COMMENT ON THE SUITABILITY OF AN INVESTMENT FOR ANY PARTICULAR INVESTOR. MOODY’S ISSUES ITS CREDIT RATINGS AND PUBLISHES MOODY’S PUBLICATIONS WITH THE EXPECTATION AND UNDERSTANDING THAT EACH INVESTOR WILL, WITH DUE CARE, MAKE ITS OWN STUDY AND EVALUATION OF EACH SECURITY THAT IS UNDER CONSIDERATION FOR PURCHASE, HOLDING, OR SALE.
MOODY’S CREDIT RATINGS AND MOODY’S PUBLICATIONS ARE NOT INTENDED FOR USE BY RETAIL INVESTORS AND IT WOULD BE RECKLESS AND INAPPROPRIATE FOR RETAIL INVESTORS TO USE MOODY’S CREDIT RATINGS OR MOODY’S PUBLICATIONS WHEN MAKING AN INVESTMENT DECISION. IF IN DOUBT YOU SHOULD CONTACT YOUR FINANCIAL OR OTHER PROFESSIONAL ADVISER.
ALL INFORMATION CONTAINED HEREIN IS PROTECTED BY LAW, INCLUDING BUT NOT LIMITED TO, COPYRIGHT LAW, AND NONE OF SUCH INFORMATION MAY BE COPIED OR OTHERWISE REPRODUCED, REPACKAGED, FURTHER TRANSMITTED, TRANSFERRED, DISSEMINATED, REDISTRIBUTED OR RESOLD, OR STORED FOR SUBSEQUENT USE FOR ANY SUCH PURPOSE, IN WHOLE OR IN PART, IN ANY FORM OR MANNER OR BY ANY MEANS WHATSOEVER, BY ANY PERSON WITHOUT MOODY’S PRIOR WRITTEN CONSENT.
CREDIT RATINGS AND MOODY’S PUBLICATIONS ARE NOT INTENDED FOR USE BY ANY PERSON AS A BENCHMARK AS THAT TERM IS DEFINED FOR REGULATORY PURPOSES AND MUST NOT BE USED IN ANY WAY THAT COULD RESULT IN THEM BEING CONSIDERED A BENCHMARK.
All information contained herein is obtained by MOODY’S from sources believed by it to be accurate and reliable. Because of the possibility of human or mechanical error as well as other factors, however, all information contained herein is provided “AS IS” without warranty of any kind. MOODY'S adopts all necessary measures so that the information it uses in assigning a credit rating is of sufficient quality and from sources MOODY'S considers to be reliable including, when appropriate, independent third-party sources. However, MOODY’S is not an auditor and cannot in every instance independently verify or validate information received in the rating process or in preparing the Moody’s publications.
To the extent permitted by law, MOODY’S and its directors, officers, employees, agents, representatives, licensors and suppliers disclaim liability to any person or entity for any indirect, special, consequential, or incidental losses or damages whatsoever arising from or in connection with the information contained herein or the use of or inability to use any such information, even if MOODY’S or any of its directors, officers, employees, agents, representatives, licensors or suppliers is advised in advance of the possibility of such losses or damages, including but not limited to: (a) any loss of present or prospective profits or (b) any loss or damage arising where the relevant financial instrument is not the subject of a particular credit rating assigned by MOODY’S.
To the extent permitted by law, MOODY’S and its directors, officers, employees, agents, representatives, licensors and suppliers disclaim liability for any direct or compensatory losses or damages caused to any person or entity, including but not limited to by any negligence (but excluding fraud, willful misconduct or any other type of liability that, for the avoidance of doubt, by law cannot be excluded) on the part of, or any contingency within or beyond the control of, MOODY’S or any of its directors, officers, employees, agents, representatives, licensors or suppliers, arising from or in connection with the information contained herein or the use of or inability to use any such information.
NO WARRANTY, EXPRESS OR IMPLIED, AS TO THE ACCURACY, TIMELINESS, COMPLETENESS, MERCHANTABILITY OR FITNESS FOR ANY PARTICULAR PURPOSE OF ANY SUCH RATING OR OTHER OPINION OR INFORMATION IS GIVEN OR MADE BY MOODY’S IN ANY FORM OR MANNER WHATSOEVER.
Moody’s Investors Service, Inc., a wholly-owned credit rating agency subsidiary of Moody’s Corporation (“MCO”), hereby discloses that most issuers of debt securities (including corporate and municipal bonds, debentures, notes and commercial paper) and preferred stock rated by Moody’s Investors Service, Inc. have, prior to assignment of any rating, agreed to pay to Moody’s Investors Service, Inc. for appraisal and rating services rendered by it fees ranging from $1,500 to approximately $2,500,000. MCO and MIS also maintain policies and procedures to address the independence of MIS’s ratings and rating processes. Information regarding certain affiliations that may exist between directors of MCO and rated entities, and between entities who hold ratings from MIS and have also publicly reported to the SEC an ownership interest in MCO of more than 5%, is posted annually at www.moodys.com under the heading “Investor Relations — Corporate Governance — Director and Shareholder Affiliation Policy.”
Additional terms for Australia only: Any publication into Australia of this document is pursuant to the Australian Financial Services License of MOODY’S affiliate, Moody’s Investors Service Pty Limited ABN 61 003 399 657AFSL 336969 and/or Moody’s Analytics Australia Pty Ltd ABN 94 105 136 972 AFSL 383569 (as applicable). This document is intended to be provided only to “wholesale clients” within the meaning of section 761G of the Corporations Act 2001. By continuing to access this document from within Australia, you represent to MOODY’S that you are, or are accessing the document as a representative of, a “wholesale client” and that neither you nor the entity you represent will directly or indirectly disseminate this document or its contents to “retail clients” within the meaning of section 761G of the Corporations Act 2001. MOODY’S credit rating is an opinion as to the creditworthiness of a debt obligation of the issuer, not on the equity securities of the issuer or any form of security that is available to retail investors. It would be reckless and inappropriate for retail investors to use MOODY’S credit ratings or publications when making an investment decision. If in doubt you should contact your financial or other professional adviser.
Additional terms for Japan only: Moody's Japan K.K. (“MJKK”) is a wholly-owned credit rating agency subsidiary of Moody's Group Japan G.K., which is wholly-owned by Moody’s Overseas Holdings Inc., a wholly-owned subsidiary of MCO. Moody’s SF Japan K.K. (“MSFJ”) is a wholly-owned credit rating agency subsidiary of MJKK. MSFJ is not a Nationally Recognized Statistical Rating Organization (“NRSRO”). Therefore, credit ratings assigned by MSFJ are Non-NRSRO Credit Ratings. Non-NRSRO Credit Ratings are assigned by an entity that is not a NRSRO and, consequently, the rated obligation will not qualify for certain types of treatment under U.S. laws. MJKK and MSFJ are credit rating agencies registered with the Japan Financial Services Agency and their registration numbers are FSA Commissioner (Ratings) No. 2 and 3 respectively.
MJKK or MSFJ (as applicable) hereby disclose that most issuers of debt securities (including corporate and municipal bonds, debentures, notes and commercial paper) and preferred stock rated by MJKK or MSFJ (as applicable) have, prior to assignment of any rating, agreed to pay to MJKK or MSFJ (as applicable) for appraisal and rating services rendered by it fees ranging from JPY200,000 to approximately JPY350,000,000.
MJKK and MSFJ also maintain policies and procedures to address Japanese regulatory requirements.