Embed Size (px)
Citation preview
1
CE573 – Structural Dynamics Homework #12
1.

2
3
4
5
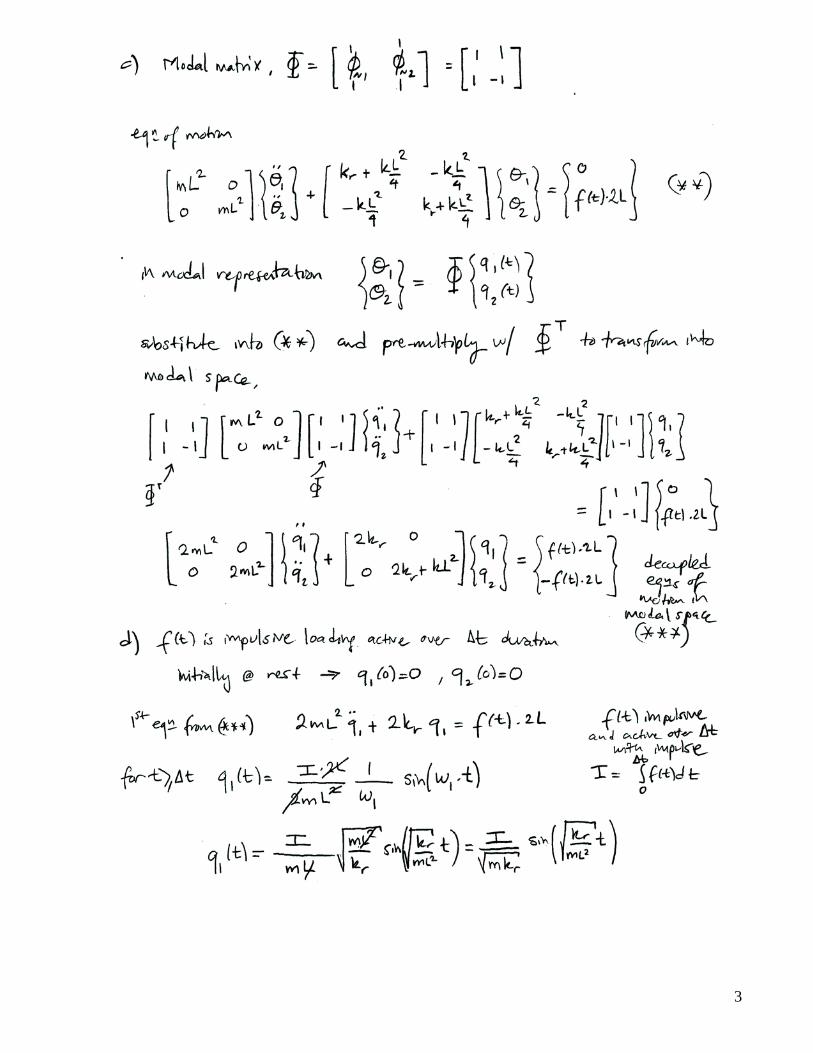
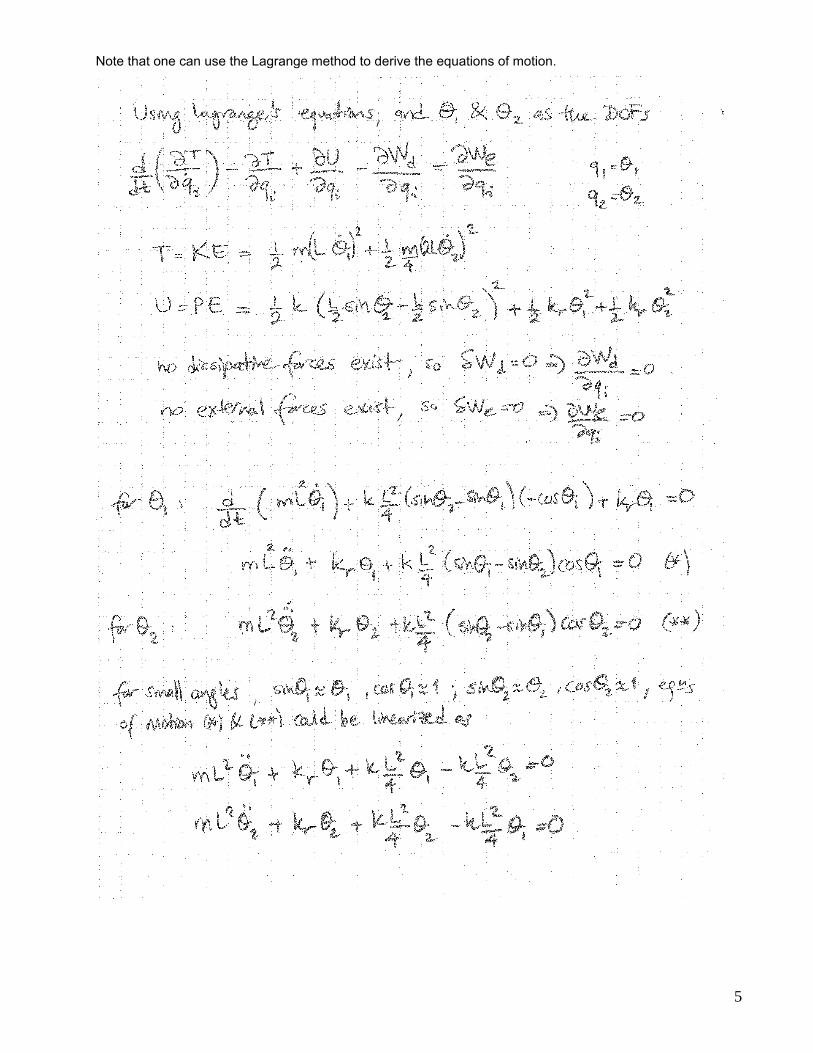
Note that one can use the Lagrange method to derive the equations of motion.
6
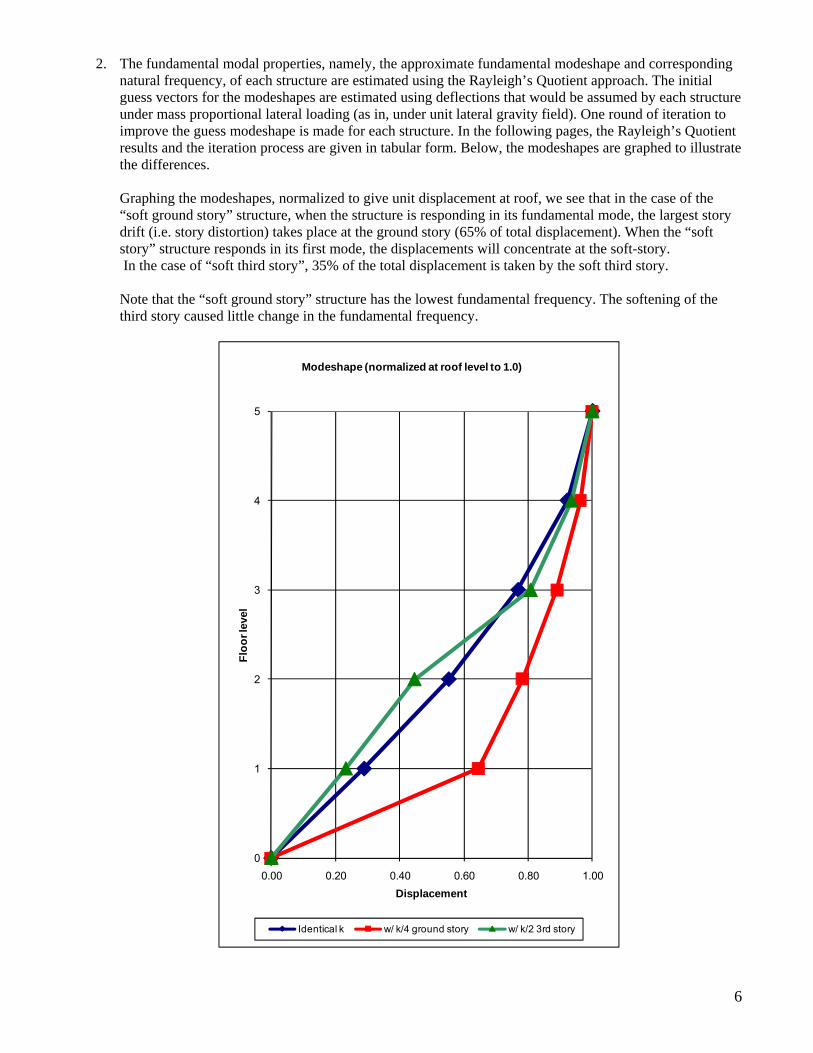
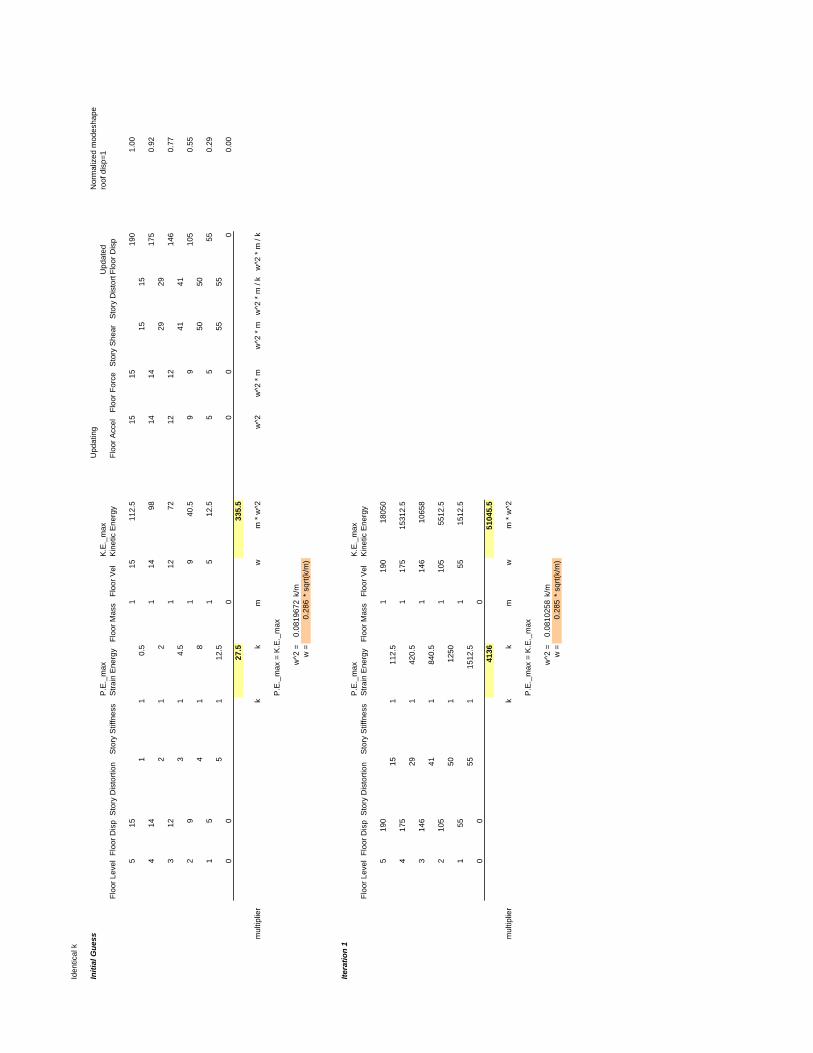
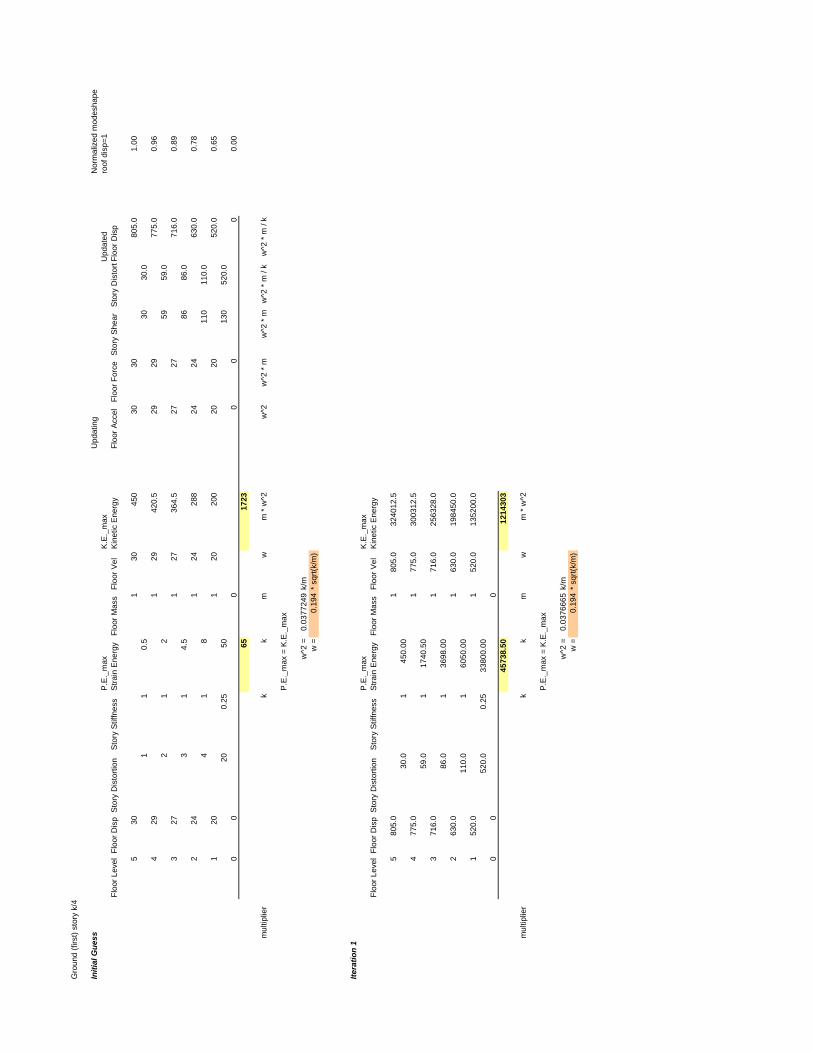
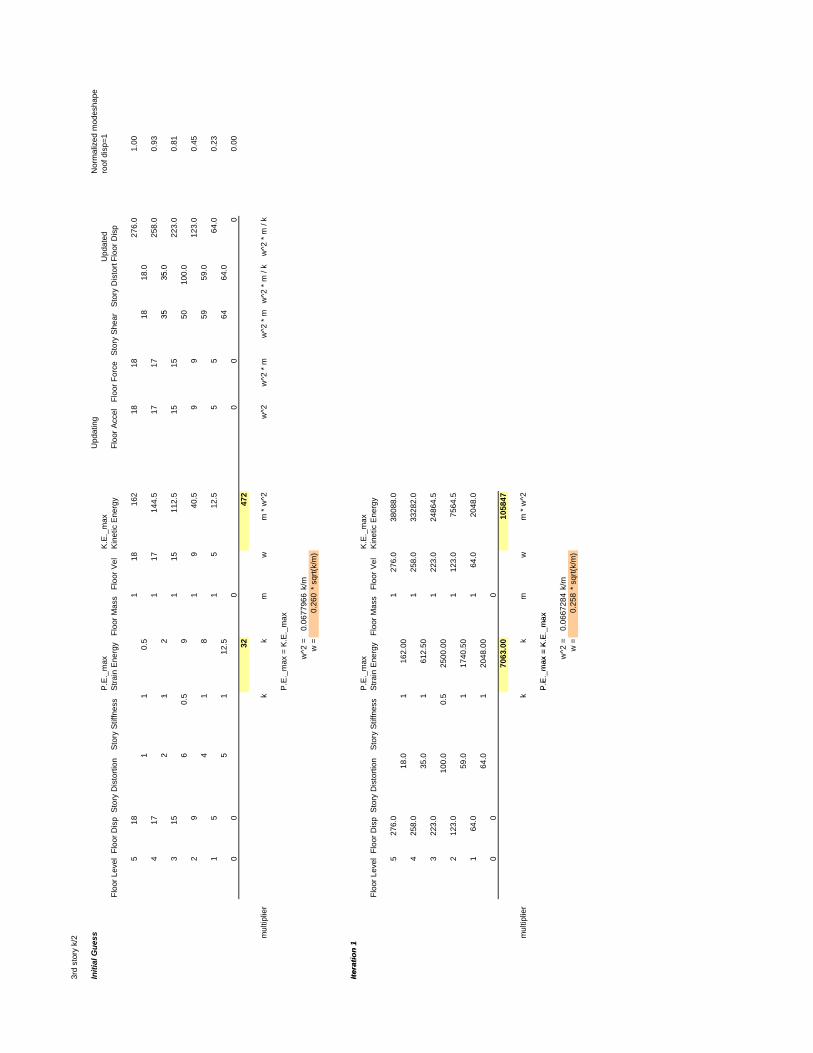
2. The fundamental modal properties, namely, the approximate fundamental modeshape and corresponding
natural frequency, of each structure are estimated using the Rayleigh’s Quotient approach. The initial guess vectors for the modeshapes are estimated using deflections that would be assumed by each structure under mass proportional lateral loading (as in, under unit lateral gravity field). One round of iteration to improve the guess modeshape is made for each structure. In the following pages, the Rayleigh’s Quotient results and the iteration process are given in tabular form. Below, the modeshapes are graphed to illustrate the differences.
Graphing the modeshapes, normalized to give unit displacement at roof, we see that in the case of the “soft ground story” structure, when the structure is responding in its fundamental mode, the largest story drift (i.e. story distortion) takes place at the ground story (65% of total displacement). When the “soft story” structure responds in its first mode, the displacements will concentrate at the soft-story. In the case of “soft third story”, 35% of the total displacement is taken by the soft third story.
Note that the “soft ground story” structure has the lowest fundamental frequency. The softening of the third story caused little change in the fundamental frequency.
0
1
2
3
4
5
0.00 0.20 0.40 0.60 0.80 1.00
Flo
or l
evel
Displacement
Modeshape (normalized at roof level to 1.0)
Identical k w/ k/4 ground story w/ k/2 3rd story
Iden
tical
k
Initi
al G
uess
Upd
atin
gN
orm
aliz
ed m
odes
hape
P.E
._m
axK
.E._
max
Upd
ated
roof
dis
p=1
Floo
r Lev
elFl
oor D
isp
Sto
ry D
isto
rtion
Sto
ry S
tiffn
ess
Stra
in E
nerg
yFl
oor M
ass
Floo
r Vel
Kin
etic
Ene
rgy
Floo
r Acc
elFl
oor F
orce
Sto
ry S
hear
Sto
ry D
isto
rtFl
oor D
isp
515
115
112.
515
1519
01.
001
10.
515
154
141
1498
1414
175
0.92
21
229
293
121
1272
1212
146
0.77
31
4.5
4141
29
19
40.5
99
105
0.55
41
850
501
51
512
.55
555
0.29
51
12.5
5555
00
00
00
0.00
27.5
335.
5
mul
tiplie
rk
km
wm
* w
^2w
^2w
^2 *
mw
^2 *
mw
^2 *
m /
kw
^2 *
m /
k
P.E
._m
ax =
K.E
._m
ax
w^2
=0.
0819
672
k/m
w =
0.28
6*
sqrt(
k/m
)
Itera
tion
1N
orm
aliz
ed m
odes
hape
P.E
._m
axK
.E._
max
Upd
ated
roof
dis
p=1
Floo
r Lev
elFl
oor D
isp
Sto
ry D
isto
rtion
Sto
ry S
tiffn
ess
Stra
in E
nerg
yFl
oor M
ass
Floo
r Vel
Kin
etic
Ene
rgy
Floo
r Acc
elFl
oor F
orce
Sto
ry S
hear
Sto
ry D
isto
rtFl
oor D
isp
519
01
190
1805
019
019
023
531.
0015
111
2.5
190
190
417
51
175
1531
2.5
175
175
2163
0.92
291
420.
536
536
53
146
114
610
658
146
146
1798
0.76
411
840.
551
151
12
105
110
555
12.5
105
105
1287
0.55
501
1250
616
616
155
155
1512
.555
5567
10.
2955
115
12.5
671
671
00
00
00
0.00
4136
5104
5.5
mul
tiplie
rk
km
wm
* w
^2w
^2w
^2 *
mw
^2 *
mw
^2 *
m /
kw
^2 *
m /
k
P.E
._m
ax =
K.E
._m
ax
w^2
=0.
0810
258
k/m
w =
0.28
5*
sqrt(
k/m
)
Gro
und
(firs
t) st
ory
k/4
Initi
al G
uess
Upd
atin
gN
orm
aliz
ed m
odes
hape
P.E
._m
axK
.E._
max
Upd
ated
roof
dis
p=1
Floo
r Lev
elFl
oor D
isp
Sto
ry D
isto
rtion
Sto
ry S
tiffn
ess
Stra
in E
nerg
yFl
oor M
ass
Floo
r Vel
Kin
etic
Ene
rgy
Floo
r Acc
elFl
oor F
orce
Sto
ry S
hear
Sto
ry D
isto
rtFl
oor D
isp
530
130
450
3030
805.
01.
001
10.
530
30.0
429
129
420.
529
2977
5.0
0.96
21
259
59.0
327
127
364.
527
2771
6.0
0.89
31
4.5
8686
.02
241
2428
824
2463
0.0
0.78
41
811
011
0.0
120
120
200
2020
520.
00.
6520
0.25
5013
052
0.0
00
00
00
0.00
6517
23
mul
tiplie
rk
km
wm
* w
^2w
^2w
^2 *
mw
^2 *
mw
^2 *
m /
kw
^2 *
m /
k
P.E
._m
ax =
K.E
._m
ax
w^2
=0.
0377
249
k/m
w =
0.19
4*
sqrt(
k/m
)
Itera
tion
1N
orm
aliz
ed m
odes
hape
P.E
._m
axK
.E._
max
Upd
ated
roof
dis
p=1
Floo
r Lev
elFl
oor D
isp
Sto
ry D
isto
rtion
Sto
ry S
tiffn
ess
Stra
in E
nerg
yFl
oor M
ass
Floo
r Vel
Kin
etic
Ene
rgy
Floo
r Acc
elFl
oor F
orce
Sto
ry S
hear
Sto
ry D
isto
rtFl
oor D
isp
580
5.0
180
5.0
3240
12.5
805
805
2139
11
30.0
145
0.00
805
805
477
5.0
177
5.0
3003
12.5
775
775
2058
60.
9623
6759
.01
1740
.50
1580
1580
371
6.0
171
6.0
2563
28.0
716
716
1900
60.
8885
0586
.01
3698
.00
2296
2296
263
0.0
163
0.0
1984
50.0
630
630
1671
00.
7811
711
0.0
160
50.0
029
2629
261
520.
01
520.
013
5200
.052
052
013
784
0.64
4383
520.
00.
2533
800.
0034
4613
784
00
00
00
045
738.
5012
1430
3
mul
tiplie
rk
km
wm
* w
^2w
^2w
^2 *
mw
^2 *
mw
^2 *
m /
kw
^2 *
m /
k
P.E
._m
ax =
K.E
._m
ax
w^2
=0.
0376
665
k/m
w =
0.19
4*
sqrt(
k/m
)
3rd
stor
y k/
2
Initi
al G
uess
Upd
atin
gN
orm
aliz
ed m
odes
hape
P.E
._m
axK
.E._
max
Upd
ated
roof
dis
p=1
Floo
r Lev
elFl
oor D
isp
Sto
ry D
isto
rtion
Sto
ry S
tiffn
ess
Stra
in E
nerg
yFl
oor M
ass
Floo
r Vel
Kin
etic
Ene
rgy
Floo
r Acc
elFl
oor F
orce
Sto
ry S
hear
Sto
ry D
isto
rtFl
oor D
isp
518
118
162
1818
276.
01.
001
10.
518
18.0
417
117
144.
517
1725
8.0
0.93
21
235
350
21
235
35.0
315
115
112.
515
1522
3.0
0.81
60.
59
5010
0.0
29
19
40.5
99
123.
00.
454
18
5959
.01
51
512
.55
564
.00.
235
112
.564
64.0
00
00
00
0.00
3247
2
mul
tiplie
rk
km
wm
* w
^2w
^2w
^2 *
mw
^2 *
mw
^2 *
m /
kw
^2 *
m /
k
P.E
._m
ax =
K.E
._m
ax
w^2
=0.
0677
966
k/m
w =
0.26
0*
sqrt(
k/m
)
Itera
tion
1N
orm
aliz
edm
odes
hape
Itera
tion
1N
orm
aliz
ed m
odes
hape
P.E
._m
axK
.E._
max
Upd
ated
roof
dis
p=1
Floo
r Lev
elFl
oor D
isp
Sto
ry D
isto
rtion
Sto
ry S
tiffn
ess
Stra
in E
nerg
yFl
oor M
ass
Floo
r Vel
Kin
etic
Ene
rgy
Floo
r Acc
elFl
oor F
orce
Sto
ry S
hear
Sto
ry D
isto
rtFl
oor D
isp
527
6.0
127
6.0
3808
8.0
276
276
4148
118
.01
162.
0027
627
64
258.
01
258.
033
282.
025
825
838
720.
9334
6235
.01
612.
5053
453
43
223.
01
223.
024
864.
522
322
333
380.
8047
2510
0.0
0.5
2500
.00
757
1514
212
3.0
112
3.0
7564
.512
312
318
240.
4397
359
.01
1740
.50
880
880
164
.01
64.0
2048
.064
6494
40.
2275
864
.01
2048
.00
944
944
00
00
00
070
63.0
010
5847
mul
tiplie
rk
km
wm
* w
^2w
^2w
^2 *
mw
^2 *
mw
^2 *
m /
kw
^2 *
m /
k
PE
max
=K
Em
axP
.E._
max
= K
.E._
max
w^2
=0.
0667
284
k/m
w =
0.25
8*
sqrt(
k/m
)
10
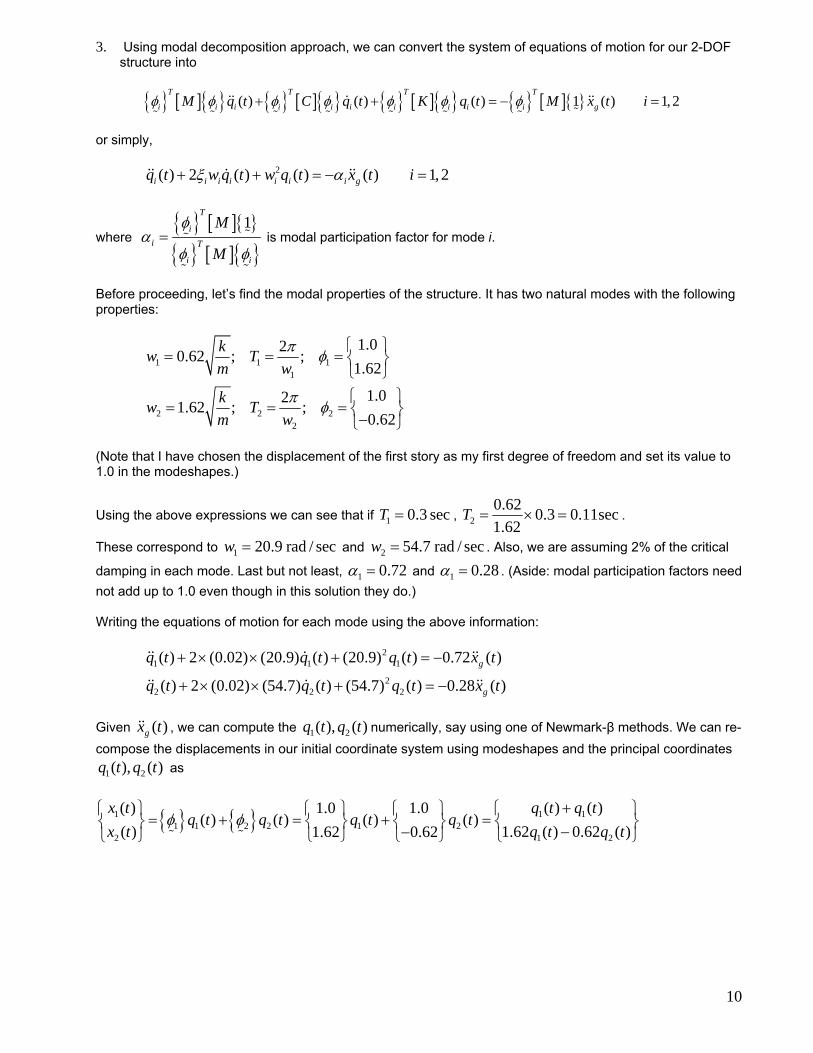
3. Using modal decomposition approach, we can convert the system of equations of motion for our 2-DOF structure into
( ) ( ) ( ) 1 ( ) 1,2T T T T
i i i i i i i i i i gM q t C q t K q t M x t i
or simply,
2( ) 2 ( ) ( ) ( ) 1, 2i i i i i i i gq t w q t w q t x t i
where
1
T
i
i T
i i
M
M
is modal participation factor for mode i.
Before proceeding, let’s find the modal properties of the structure. It has two natural modes with the following properties:
1 1 11
2 2 22
1.020.62 ; ;
1.62
1.021.62 ; ;
0.62
kw T
m w
kw T
m w
(Note that I have chosen the displacement of the first story as my first degree of freedom and set its value to 1.0 in the modeshapes.)
Using the above expressions we can see that if 1 0.3 secT , 2
0.620.3 0.11sec
1.62T .
These correspond to 1 20.9 rad / secw and 2 54.7 rad / secw . Also, we are assuming 2% of the critical
damping in each mode. Last but not least, 1 0.72 and 1 0.28 . (Aside: modal participation factors need
not add up to 1.0 even though in this solution they do.) Writing the equations of motion for each mode using the above information:
21 1 1
22 2 2
( ) 2 (0.02) (20.9) ( ) (20.9) ( ) 0.72 ( )
( ) 2 (0.02) (54.7) ( ) (54.7) ( ) 0.28 ( )
g
g
q t q t q t x t
q t q t q t x t
Given ( )gx t , we can compute the 1 2( ), ( )q t q t numerically, say using one of Newmark-β methods. We can re-
compose the displacements in our initial coordinate system using modeshapes and the principal coordinates
1 2( ), ( )q t q t as
1 1 11 1 2 2 1 2
2 1 2
( ) ( ) ( )1.0 1.0( ) ( ) ( ) ( )
( ) 1.62 ( ) 0.62 ( )1.62 0.62
x t q t q tq t q t q t q t
x t q t q t
11
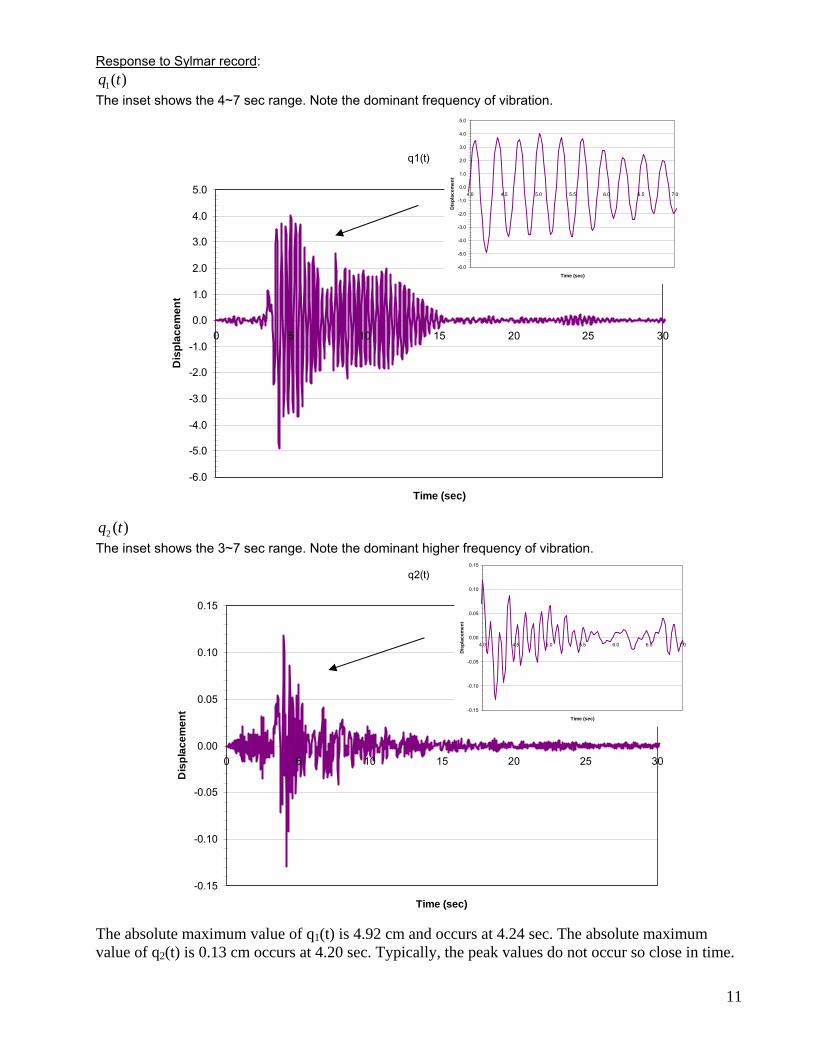
Response to Sylmar record:
1( )q t
The inset shows the 4~7 sec range. Note the dominant frequency of vibration.
q1(t)
-6.0
-5.0
-4.0
-3.0
-2.0
-1.0
0.0
1.0
2.0
3.0
4.0
5.0
0 5 10 15 20 25 30
Time (sec)
Dis
pla
ce
me
nt
2 ( )q t
The inset shows the 3~7 sec range. Note the dominant higher frequency of vibration.
q2(t)
-0.15
-0.10
-0.05
0.00
0.05
0.10
0.15
0 5 10 15 20 25 30
Time (sec)
Dis
pla
ce
me
nt
The absolute maximum value of q1(t) is 4.92 cm and occurs at 4.24 sec. The absolute maximum value of q2(t) is 0.13 cm occurs at 4.20 sec. Typically, the peak values do not occur so close in time.
-6.0
-5.0
-4.0
-3.0
-2.0
-1.0
0.0
1.0
2.0
3.0
4.0
5.0
4.0 4.5 5.0 5.5 6.0 6.5 7.0
Time (sec)
Dis
pla
ce
me
nt
-0.15
-0.10
-0.05
0.00
0.05
0.10
0.15
4.0 4.5 5.0 5.5 6.0 6.5 7.0
Time (sec)
Dis
pla
cem
ent
12
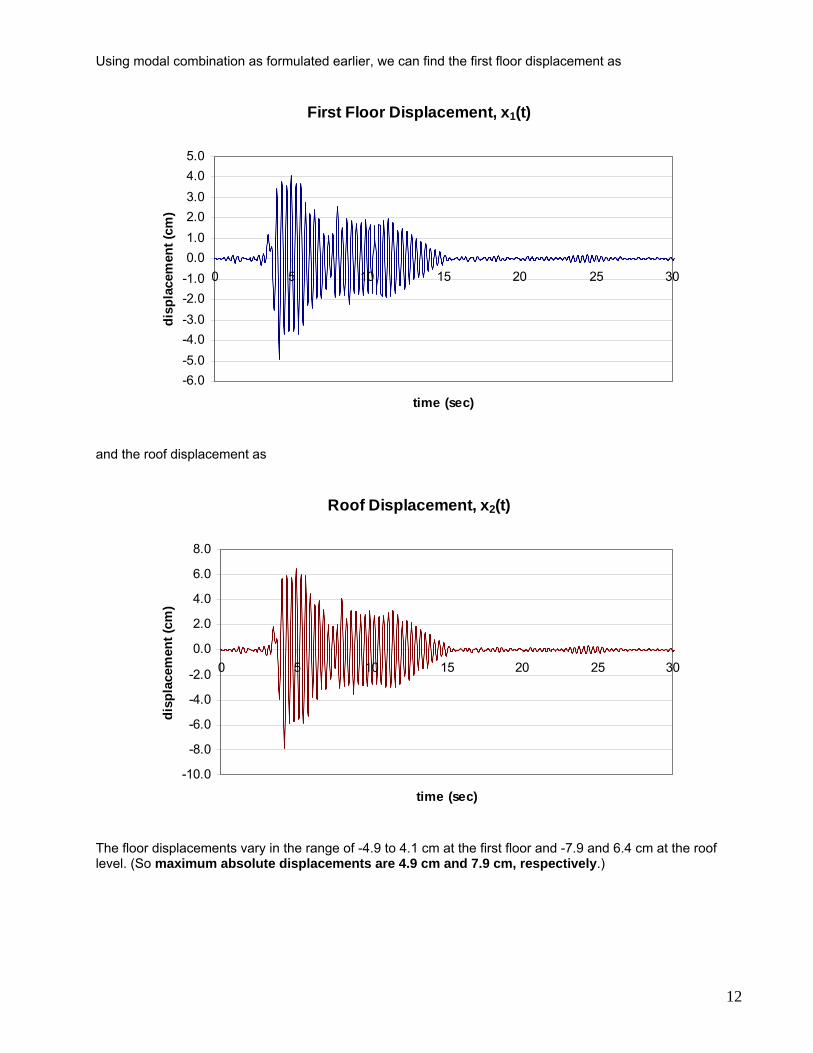
Using modal combination as formulated earlier, we can find the first floor displacement as
First Floor Displacement, x1(t)
-6.0
-5.0
-4.0
-3.0
-2.0
-1.0
0.0
1.0
2.0
3.0
4.0
5.0
0 5 10 15 20 25 30
time (sec)
dis
pla
cem
ent
(cm
)
and the roof displacement as
Roof Displacement, x2(t)
-10.0
-8.0
-6.0
-4.0
-2.0
0.0
2.0
4.0
6.0
8.0
0 5 10 15 20 25 30
time (sec)
dis
pla
cem
ent
(cm
)
The floor displacements vary in the range of -4.9 to 4.1 cm at the first floor and -7.9 and 6.4 cm at the roof level. (So maximum absolute displacements are 4.9 cm and 7.9 cm, respectively.)
13
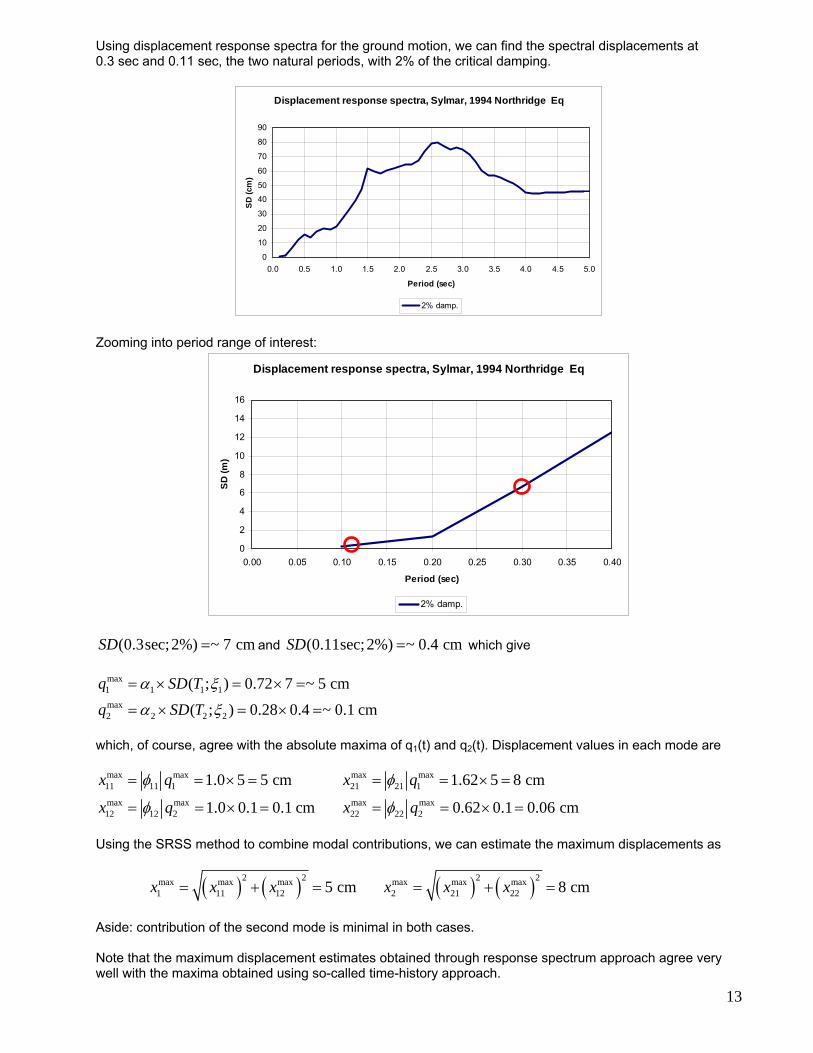
Using displacement response spectra for the ground motion, we can find the spectral displacements at 0.3 sec and 0.11 sec, the two natural periods, with 2% of the critical damping.
Displacement response spectra, Sylmar, 1994 Northridge Eq
0
10
20
30
40
50
60
70
80
90
0.0 0.5 1.0 1.5 2.0 2.5 3.0 3.5 4.0 4.5 5.0
Period (sec)
SD
(cm
)
2% damp.
Zooming into period range of interest:
Displacement response spectra, Sylmar, 1994 Northridge Eq
0
2
4
6
8
10
12
14
16
0.00 0.05 0.10 0.15 0.20 0.25 0.30 0.35 0.40
Period (sec)
SD
(m
)
2% damp.
(0.3sec;2%) ~ 7 cmSD and (0.11sec;2%) ~ 0.4 cmSD which give
max1 1 1 1
max2 2 2 2
( ; ) 0.72 7 ~ 5 cm
( ; ) 0.28 0.4 ~ 0.1 cm
q SD T
q SD T
which, of course, agree with the absolute maxima of q1(t) and q2(t). Displacement values in each mode are
max max11 11 1
max max12 12 2
1.0 5 5 cm
1.0 0.1 0.1 cm
x q
x q
max max21 21 1
max max22 22 2
1.62 5 8 cm
0.62 0.1 0.06 cm
x q
x q
Using the SRSS method to combine modal contributions, we can estimate the maximum displacements as
2 2max max max1 11 12 5 cmx x x 2 2max max max
2 21 22 8 cmx x x
Aside: contribution of the second mode is minimal in both cases. Note that the maximum displacement estimates obtained through response spectrum approach agree very well with the maxima obtained using so-called time-history approach.


![241 AN INVESTIGATION INTO THE THEORY OF …ce573/Documents/Bishop and Gladwell...[ 241 ] AN INVESTIGATION INTO THE THEORY OF ... THE DAMPED FORCED VIBRATION OF 8. ... techniques are](https://img.pdfslide.us/doc/110x75/5ad89a0a7f8b9a6b668e7e6c/241-an-investigation-into-the-theory-of-ce573documentsbishop-and-gladwell.jpg)