Embed Size (px)
Citation preview
PSuD P
CE
Ap
erforupplyData B
art II
EPT Univ
pril 2011
mancy and Book (
: City
versity
1
ce Ben Sanit(2008
Profi
nchmtation809)
iles (C
arkinn in Ma
Class A
ng of Uahara
A Citie
Urbanashtra
es)
n Watea:
er
Performance Benchmarking of Urban Water Supply
and Sanitation in Maharashtra: Data Book (2008‐09)
PART II: City Profiles (Class A Cities)
CEPT University
April 2011
PART II: City Profiles (Class A)
Page No.
Abbreviations i
Measurement Units & Symbols ii
Introduction: City Profiles iii
List of Class A Cities
Achalpur 1
Ambarnath 3
Barshi 5
Beed 7
Bhusawal 9
Chandrapur 11
Gondiya 13
Ichalkaranji 15
Jalna 17
Latur 19
Panvel 21
Parbhani 23
Satara 25
Wardha 27
Yavatmal 29
i
Abbreviations
Colln. Effi. Collection efficiency
Comm. Community
HH Household
Indiv. Individual
MSW Municipal solid waste
NRW Non‐revenue Water
Nos. Numbers
SW Solid waste
WS Water supply
WW Waste water
ii
Measurement Units & Symbols
km kilometer
km2 square kilometer
l/c/d or lpcd liters per capita per day
M meter
m3 cubic meter
m3/d cubic meter per day
m3/d/c cubic meter per day per capita
mm millimeter
n.a. not applicable
% percent
ʹʹ inch
Sq mi square mile
Sq km square kilometer
Rs/Kl Rupees per kilolitre
iii
Introduction: City Profiles
The urban local bodies (ULBs) in India have a huge databank about various day to day activities and
responsibilities that they carry out. Though, it is not always available in a way, which could effectively
communicate to city managers about service levels and its quality. Hence, quantification of services is not
done and fund allocations are made in an ad hoc manner.
As part of the initial activities under Performance Measurement, PAS Project has collected detailed
information from ULBs in two Gujarat and Maharashtra. All key indicators for assessment of urban water
supply and sanitation services in these two states have been compiled. Also compiled are the local action
indicators.
The following ‘City Reports’ have been designed to provide a snapshot of all the key performance indicators
on the four sectors of water supply, wastewater, solid waste management and storm water drainage. It also
captures certain context information to provide a better understanding and to set a background.
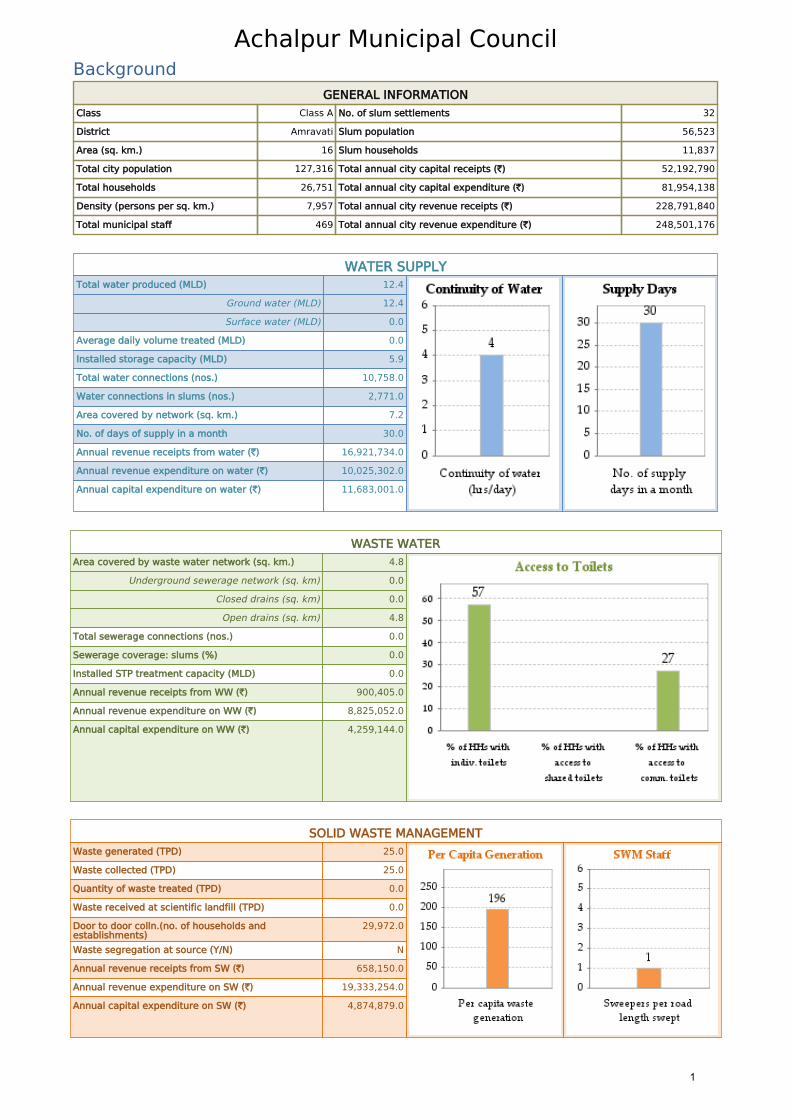
Achalpur Municipal Council Background
GENERAL INFORMATIONClass Class A No. of slum settlements 32
District Amravati Slum population 56,523
Area (sq. km.) 16 Slum households 11,837
Total city population 127,316 Total annual city capital receipts (`) 52,192,790
Total households 26,751 Total annual city capital expenditure (`) 81,954,138
Density (persons per sq. km.) 7,957 Total annual city revenue receipts (`) 228,791,840
Total municipal staff 469 Total annual city revenue expenditure (`) 248,501,176
WATER SUPPLYTotal water produced (MLD) 12.4
Ground water (MLD) 12.4
Surface water (MLD) 0.0
Average daily volume treated (MLD) 0.0
Installed storage capacity (MLD) 5.9
Total water connections (nos.) 10,758.0
Water connections in slums (nos.) 2,771.0
Area covered by network (sq. km.) 7.2
No. of days of supply in a month 30.0
Annual revenue receipts from water (`) 16,921,734.0
Annual revenue expenditure on water (`) 10,025,302.0
Annual capital expenditure on water (`) 11,683,001.0
WASTE WATERArea covered by waste water network (sq. km.) 4.8
Underground sewerage network (sq. km) 0.0
Closed drains (sq. km) 0.0
Open drains (sq. km) 4.8
Total sewerage connections (nos.) 0.0
Sewerage coverage: slums (%) 0.0
Installed STP treatment capacity (MLD) 0.0
Annual revenue receipts from WW (`) 900,405.0
Annual revenue expenditure on WW (`) 8,825,052.0
Annual capital expenditure on WW (`) 4,259,144.0
SOLID WASTE MANAGEMENTWaste generated (TPD) 25.0
Waste collected (TPD) 25.0
Quantity of waste treated (TPD) 0.0
Waste received at scientific landfill (TPD) 0.0
Door to door colln.(no. of households andestablishments)
29,972.0
Waste segregation at source (Y/N) N
Annual revenue receipts from SW (`) 658,150.0
Annual revenue expenditure on SW (`) 19,333,254.0
Annual capital expenditure on SW (`) 4,874,879.0
1
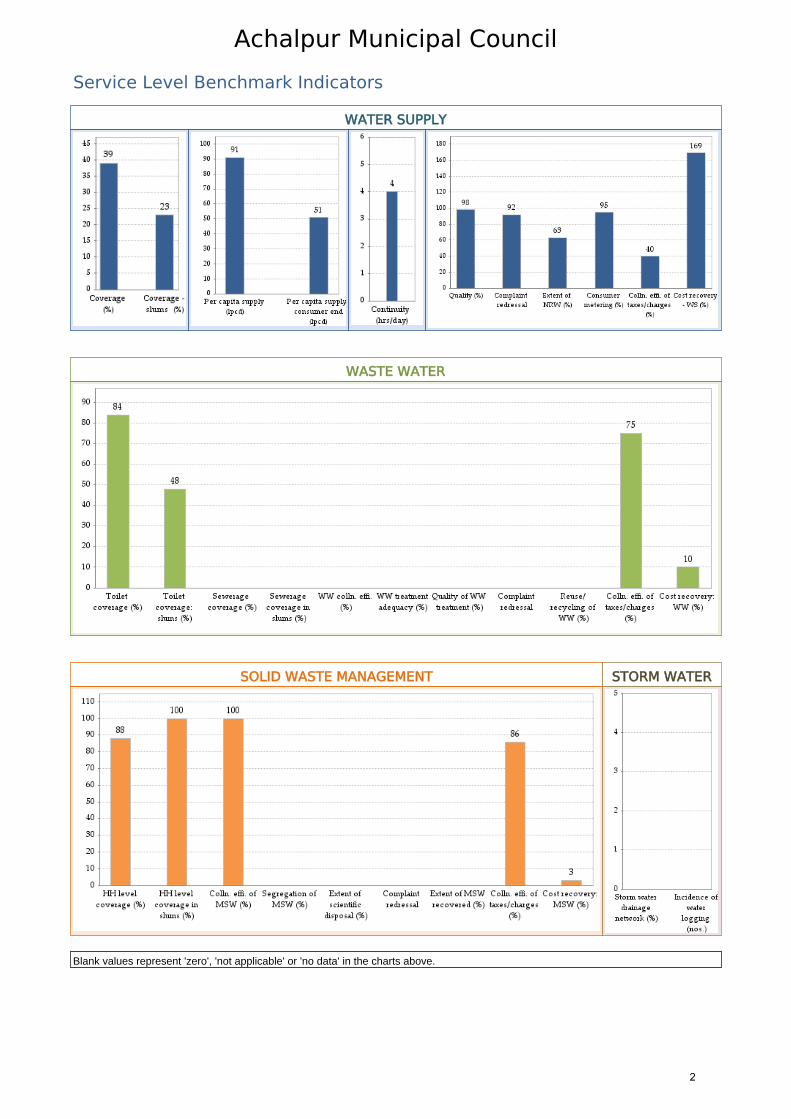
Achalpur Municipal Council
Service Level Benchmark Indicators
WATER SUPPLY
WASTE WATER
SOLID WASTE MANAGEMENT STORM WATER
Blank values represent 'zero', 'not applicable' or 'no data' in the charts above.
2

Ambarnath Municipal Council Background
GENERAL INFORMATIONClass Class A No. of slum settlements 52
District Thane Slum population 130,373
Area (sq. km.) 38 Slum households 26,504
Total city population 229,072 Total annual city capital receipts (`) 0
Total households 60,583 Total annual city capital expenditure (`) 214,691,000
Density (persons per sq. km.) 6,028 Total annual city revenue receipts (`) 462,290,000
Total municipal staff 976 Total annual city revenue expenditure (`) 225,334,000
WATER SUPPLYTotal water produced (MLD) 45.0
Ground water (MLD) 0.0
Surface water (MLD) 45.0
Average daily volume treated (MLD) 13.0
Installed storage capacity (MLD) 30.7
Total water connections (nos.) 22,157.0
Water connections in slums (nos.) 0.0
Area covered by network (sq. km.) 9.5
No. of days of supply in a month 30.0
Annual revenue receipts from water (`) 20,530,000.0
Annual revenue expenditure on water (`) 4,415,000.0
Annual capital expenditure on water (`) 0.0
WASTE WATERArea covered by waste water network (sq. km.) 54.0
Underground sewerage network (sq. km) 28.0
Closed drains (sq. km) 0.0
Open drains (sq. km) 26.0
Total sewerage connections (nos.) 1,578.0
Sewerage coverage: slums (%) 155.0
Installed STP treatment capacity (MLD) 28.0
Annual revenue receipts from WW (`) 0.0
Annual revenue expenditure on WW (`) 0.0
Annual capital expenditure on WW (`) 0.0
SOLID WASTE MANAGEMENTWaste generated (TPD) 98.0
Waste collected (TPD) 85.0
Quantity of waste treated (TPD) 0.0
Waste received at scientific landfill (TPD) 0.0
Door to door colln.(no. of households andestablishments)
67,080.0
Waste segregation at source (Y/N) N
Annual revenue receipts from SW (`) 3,717,000.0
Annual revenue expenditure on SW (`) 0.0
Annual capital expenditure on SW (`) 0.0
3
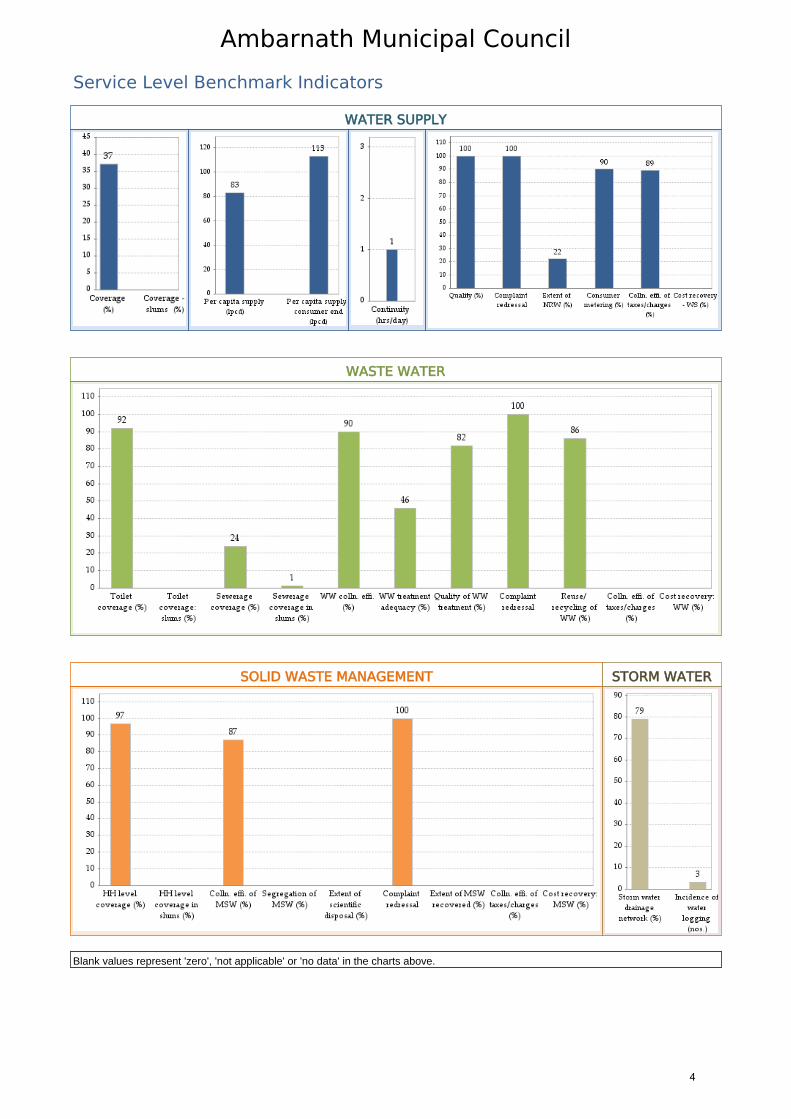
Ambarnath Municipal Council
Service Level Benchmark Indicators
WATER SUPPLY
WASTE WATER
SOLID WASTE MANAGEMENT STORM WATER
Blank values represent 'zero', 'not applicable' or 'no data' in the charts above.
4

Barshi Municipal Council Background
GENERAL INFORMATIONClass Class A No. of slum settlements 32
District Solapur Slum population 54,049
Area (sq. km.) 36 Slum households 9,523
Total city population 125,742 Total annual city capital receipts (`) 36,514,799
Total households 24,469 Total annual city capital expenditure (`) 35,945,941
Density (persons per sq. km.) 3,464 Total annual city revenue receipts (`) 158,841,419
Total municipal staff 404 Total annual city revenue expenditure (`) 139,240,692
WATER SUPPLYTotal water produced (MLD) 12.9
Ground water (MLD) 0.7
Surface water (MLD) 12.2
Average daily volume treated (MLD) 14.1
Installed storage capacity (MLD) 5.3
Total water connections (nos.) 12,384.0
Water connections in slums (nos.) 0.0
Area covered by network (sq. km.) 15.0
No. of days of supply in a month 25.0
Annual revenue receipts from water (`) 26,612,211.0
Annual revenue expenditure on water (`) 57,110,404.0
Annual capital expenditure on water (`) 13,989,200.0
WASTE WATERArea covered by waste water network (sq. km.) 36.0
Underground sewerage network (sq. km) 0.0
Closed drains (sq. km) 0.0
Open drains (sq. km) 36.0
Total sewerage connections (nos.) 0.0
Sewerage coverage: slums (%) 0.0
Installed STP treatment capacity (MLD) 0.0
Annual revenue receipts from WW (`) 0.0
Annual revenue expenditure on WW (`) 3,887,818.0
Annual capital expenditure on WW (`) 812,178.0
SOLID WASTE MANAGEMENTWaste generated (TPD) 47.0
Waste collected (TPD) 47.0
Quantity of waste treated (TPD) 0.0
Waste received at scientific landfill (TPD) 0.0
Door to door colln.(no. of households andestablishments)
9,478.0
Waste segregation at source (Y/N) Y
Annual revenue receipts from SW (`) 200,000.0
Annual revenue expenditure on SW (`) 29,321,074.0
Annual capital expenditure on SW (`) 0.0
5
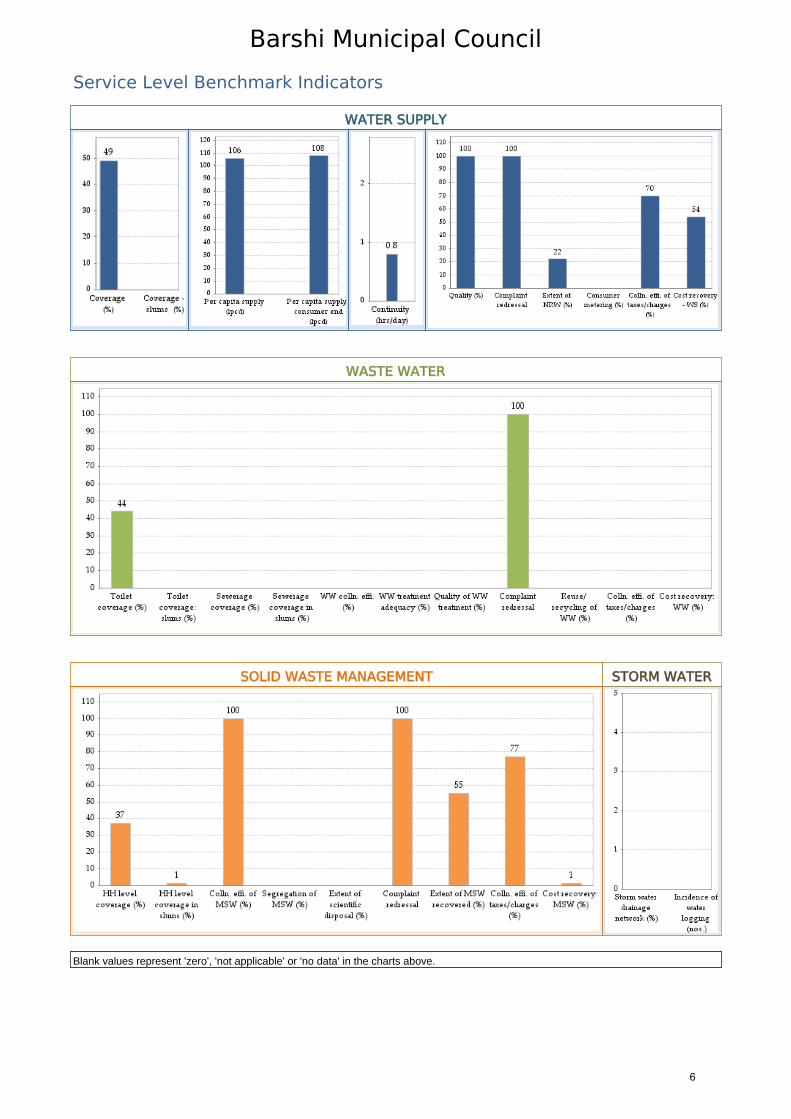
Barshi Municipal Council
Service Level Benchmark Indicators
WATER SUPPLY
WASTE WATER
SOLID WASTE MANAGEMENT STORM WATER
Blank values represent 'zero', 'not applicable' or 'no data' in the charts above.
6

Beed Municipal Council Background
GENERAL INFORMATIONClass Class A No. of slum settlements 20
District Beed Slum population 65,000
Area (sq. km.) 8 Slum households 12,302
Total city population 186,444 Total annual city capital receipts (`) 55,364,934
Total households 33,116 Total annual city capital expenditure (`) 181,847,425
Density (persons per sq. km.) 22,463 Total annual city revenue receipts (`) 131,419,446
Total municipal staff 602 Total annual city revenue expenditure (`) 332,341,849
WATER SUPPLYTotal water produced (MLD) 25.0
Ground water (MLD) 2.0
Surface water (MLD) 23.0
Average daily volume treated (MLD) 23.0
Installed storage capacity (MLD) 13.5
Total water connections (nos.) 14,075.0
Water connections in slums (nos.) 0.0
Area covered by network (sq. km.) 24.0
No. of days of supply in a month 14.0
Annual revenue receipts from water (`) 15,194,686.0
Annual revenue expenditure on water (`) 16,301,428.0
Annual capital expenditure on water (`) 104,930,707.0
WASTE WATERArea covered by waste water network (sq. km.) 8.3
Underground sewerage network (sq. km) 0.0
Closed drains (sq. km) 0.0
Open drains (sq. km) 8.3
Total sewerage connections (nos.) 0.0
Sewerage coverage: slums (%) 0.0
Installed STP treatment capacity (MLD) 0.0
Annual revenue receipts from WW (`) 0.0
Annual revenue expenditure on WW (`) 0.0
Annual capital expenditure on WW (`) 0.0
SOLID WASTE MANAGEMENTWaste generated (TPD) 29.0
Waste collected (TPD) 29.0
Quantity of waste treated (TPD) 0.0
Waste received at scientific landfill (TPD) 0.0
Door to door colln.(no. of households andestablishments)
19,700.0
Waste segregation at source (Y/N) N
Annual revenue receipts from SW (`) 0.0
Annual revenue expenditure on SW (`) 0.0
Annual capital expenditure on SW (`) 4,034,452.0
7
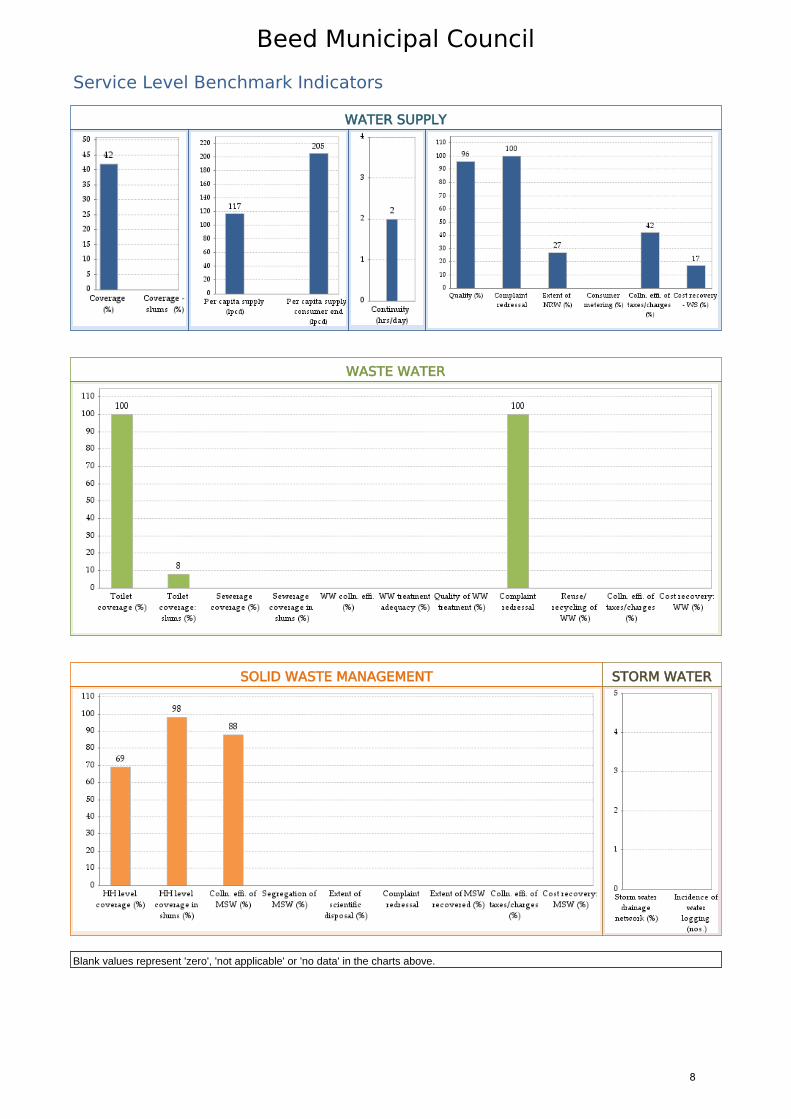
Beed Municipal Council
Service Level Benchmark Indicators
WATER SUPPLY
WASTE WATER
SOLID WASTE MANAGEMENT STORM WATER
Blank values represent 'zero', 'not applicable' or 'no data' in the charts above.
8
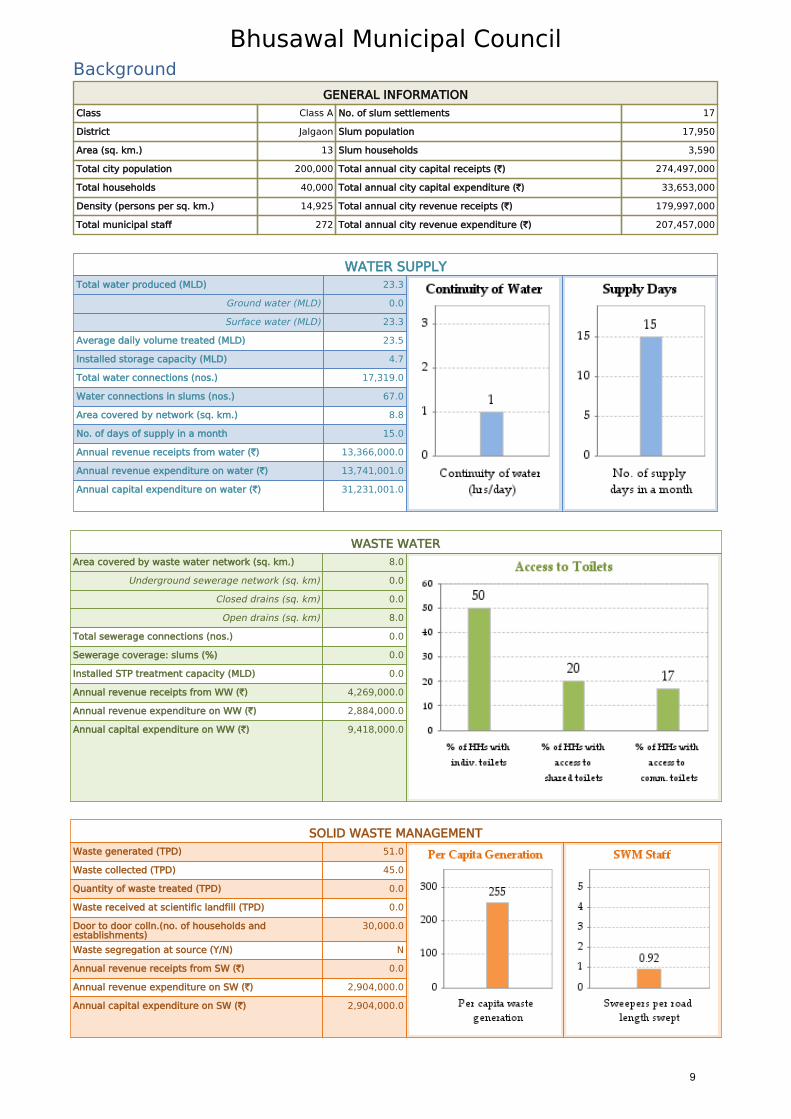
Bhusawal Municipal Council Background
GENERAL INFORMATIONClass Class A No. of slum settlements 17
District Jalgaon Slum population 17,950
Area (sq. km.) 13 Slum households 3,590
Total city population 200,000 Total annual city capital receipts (`) 274,497,000
Total households 40,000 Total annual city capital expenditure (`) 33,653,000
Density (persons per sq. km.) 14,925 Total annual city revenue receipts (`) 179,997,000
Total municipal staff 272 Total annual city revenue expenditure (`) 207,457,000
WATER SUPPLYTotal water produced (MLD) 23.3
Ground water (MLD) 0.0
Surface water (MLD) 23.3
Average daily volume treated (MLD) 23.5
Installed storage capacity (MLD) 4.7
Total water connections (nos.) 17,319.0
Water connections in slums (nos.) 67.0
Area covered by network (sq. km.) 8.8
No. of days of supply in a month 15.0
Annual revenue receipts from water (`) 13,366,000.0
Annual revenue expenditure on water (`) 13,741,001.0
Annual capital expenditure on water (`) 31,231,001.0
WASTE WATERArea covered by waste water network (sq. km.) 8.0
Underground sewerage network (sq. km) 0.0
Closed drains (sq. km) 0.0
Open drains (sq. km) 8.0
Total sewerage connections (nos.) 0.0
Sewerage coverage: slums (%) 0.0
Installed STP treatment capacity (MLD) 0.0
Annual revenue receipts from WW (`) 4,269,000.0
Annual revenue expenditure on WW (`) 2,884,000.0
Annual capital expenditure on WW (`) 9,418,000.0
SOLID WASTE MANAGEMENTWaste generated (TPD) 51.0
Waste collected (TPD) 45.0
Quantity of waste treated (TPD) 0.0
Waste received at scientific landfill (TPD) 0.0
Door to door colln.(no. of households andestablishments)
30,000.0
Waste segregation at source (Y/N) N
Annual revenue receipts from SW (`) 0.0
Annual revenue expenditure on SW (`) 2,904,000.0
Annual capital expenditure on SW (`) 2,904,000.0
9
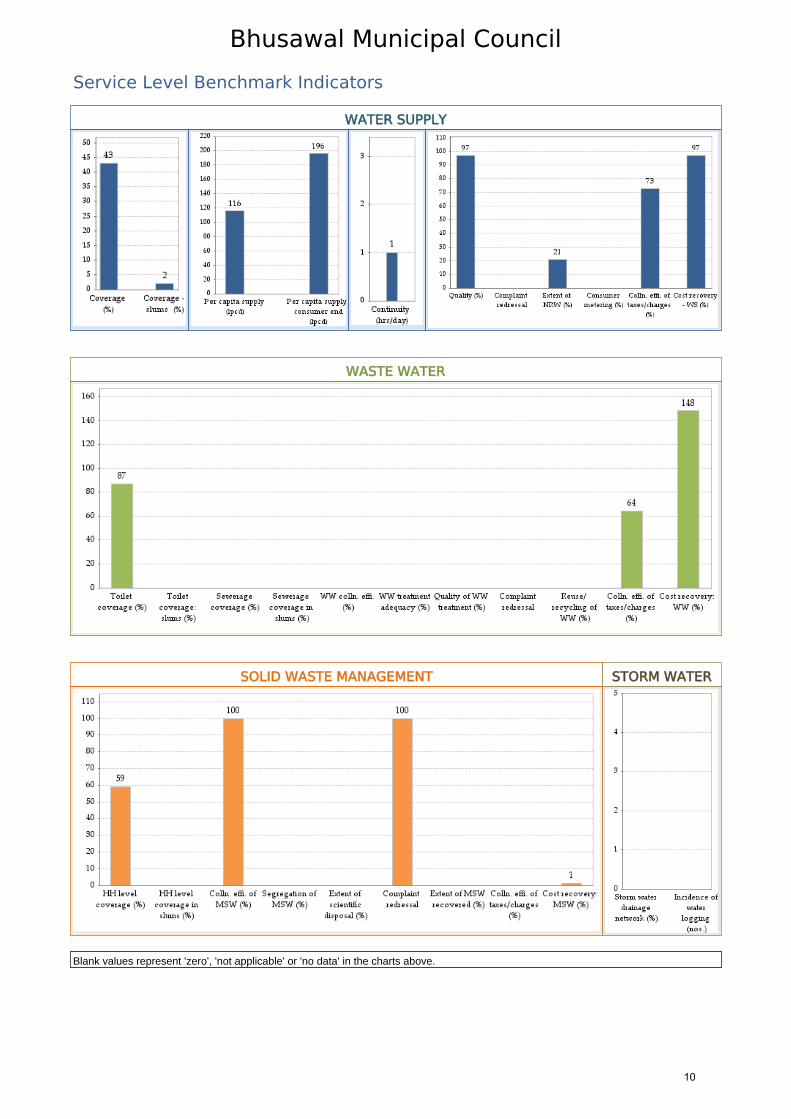
Bhusawal Municipal Council
Service Level Benchmark Indicators
WATER SUPPLY
WASTE WATER
SOLID WASTE MANAGEMENT STORM WATER
Blank values represent 'zero', 'not applicable' or 'no data' in the charts above.
10

Chandrapur Municipal Council Background
GENERAL INFORMATIONClass Class A No. of slum settlements 80
District Chandrapur Slum population 106,973
Area (sq. km.) 56 Slum households 15,890
Total city population 375,629 Total annual city capital receipts (`) 117,002,044
Total households 57,830 Total annual city capital expenditure (`) 111,960,131
Density (persons per sq. km.) 6,672 Total annual city revenue receipts (`) 384,661,857
Total municipal staff 725 Total annual city revenue expenditure (`) 256,015,390
WATER SUPPLYTotal water produced (MLD) 52.9
Ground water (MLD) 1.0
Surface water (MLD) 51.9
Average daily volume treated (MLD) 51.9
Installed storage capacity (MLD) 10.4
Total water connections (nos.) 21,613.0
Water connections in slums (nos.) 4,500.0
Area covered by network (sq. km.) 32.0
No. of days of supply in a month 30.0
Annual revenue receipts from water (`) 418,608.0
Annual revenue expenditure on water (`) 2,459,479.0
Annual capital expenditure on water (`) 1,344,646.0
WASTE WATERArea covered by waste water network (sq. km.) 29.5
Underground sewerage network (sq. km) 0.0
Closed drains (sq. km) 2.5
Open drains (sq. km) 27.0
Total sewerage connections (nos.) 0.0
Sewerage coverage: slums (%) 0.0
Installed STP treatment capacity (MLD) 0.0
Annual revenue receipts from WW (`) 0.0
Annual revenue expenditure on WW (`) 0.0
Annual capital expenditure on WW (`) 0.0
SOLID WASTE MANAGEMENTWaste generated (TPD) 130.0
Waste collected (TPD) 130.0
Quantity of waste treated (TPD) 0.0
Waste received at scientific landfill (TPD) 0.0
Door to door colln.(no. of households andestablishments)
46,300.0
Waste segregation at source (Y/N) N
Annual revenue receipts from SW (`) 5,182,768.0
Annual revenue expenditure on SW (`) 11,744,540.0
Annual capital expenditure on SW (`) 11,744,540.0
11
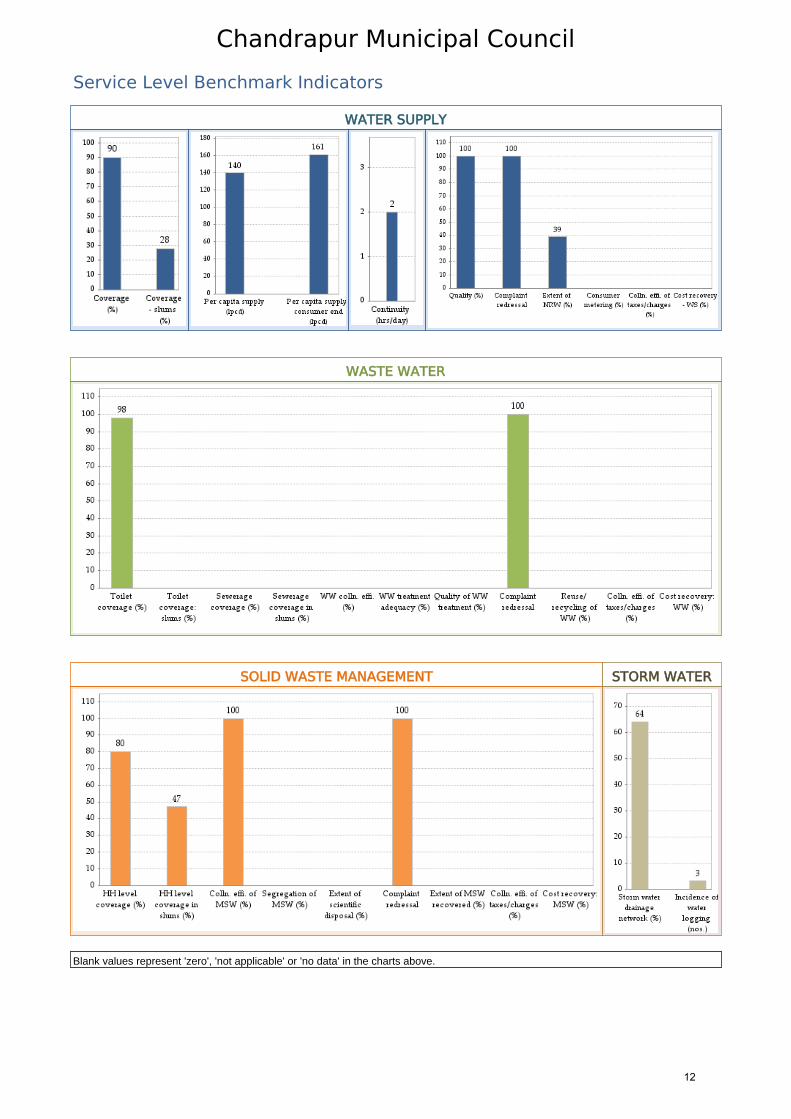
Chandrapur Municipal Council
Service Level Benchmark Indicators
WATER SUPPLY
WASTE WATER
SOLID WASTE MANAGEMENT STORM WATER
Blank values represent 'zero', 'not applicable' or 'no data' in the charts above.
12

Gondiya Municipal Council Background
GENERAL INFORMATIONClass Class A No. of slum settlements 58
District Gondia Slum population 38,343
Area (sq. km.) 18 Slum households 7,672
Total city population 132,992 Total annual city capital receipts (`) 91,963,000
Total households 33,248 Total annual city capital expenditure (`) 80,345,000
Density (persons per sq. km.) 7,348 Total annual city revenue receipts (`) 195,242,000
Total municipal staff 911 Total annual city revenue expenditure (`) 196,683,000
WATER SUPPLYTotal water produced (MLD) 11.0
Ground water (MLD) 0.0
Surface water (MLD) 11.0
Average daily volume treated (MLD) 10.0
Installed storage capacity (MLD) 36.0
Total water connections (nos.) 10,570.0
Water connections in slums (nos.) 0.0
Area covered by network (sq. km.) 10.0
No. of days of supply in a month 30.0
Annual revenue receipts from water (`) 4,336,000.0
Annual revenue expenditure on water (`) 9,141,000.0
Annual capital expenditure on water (`) 0.0
WASTE WATERArea covered by waste water network (sq. km.) 0.0
Underground sewerage network (sq. km) 0.0
Closed drains (sq. km) 0.0
Open drains (sq. km) 0.0
Total sewerage connections (nos.) 0.0
Sewerage coverage: slums (%) 0.0
Installed STP treatment capacity (MLD) 0.0
Annual revenue receipts from WW (`) 0.0
Annual revenue expenditure on WW (`) 5,347,000.0
Annual capital expenditure on WW (`) 26,744,000.0
SOLID WASTE MANAGEMENTWaste generated (TPD) 36.0
Waste collected (TPD) 3.0
Quantity of waste treated (TPD) 0.0
Waste received at scientific landfill (TPD) 3.0
Door to door colln.(no. of households andestablishments)
0.0
Waste segregation at source (Y/N) N
Annual revenue receipts from SW (`) 10,825,000.0
Annual revenue expenditure on SW (`) 38,795,000.0
Annual capital expenditure on SW (`) 3,863,000.0
13
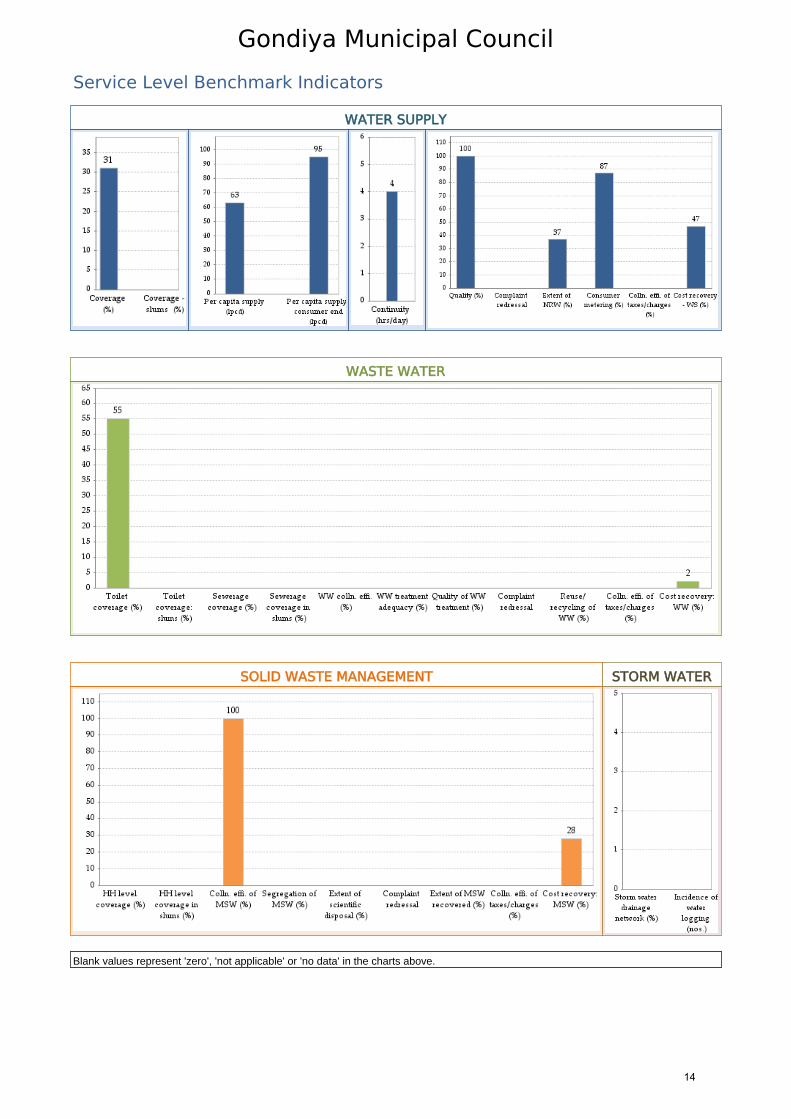
Gondiya Municipal Council
Service Level Benchmark Indicators
WATER SUPPLY
WASTE WATER
SOLID WASTE MANAGEMENT STORM WATER
Blank values represent 'zero', 'not applicable' or 'no data' in the charts above.
14
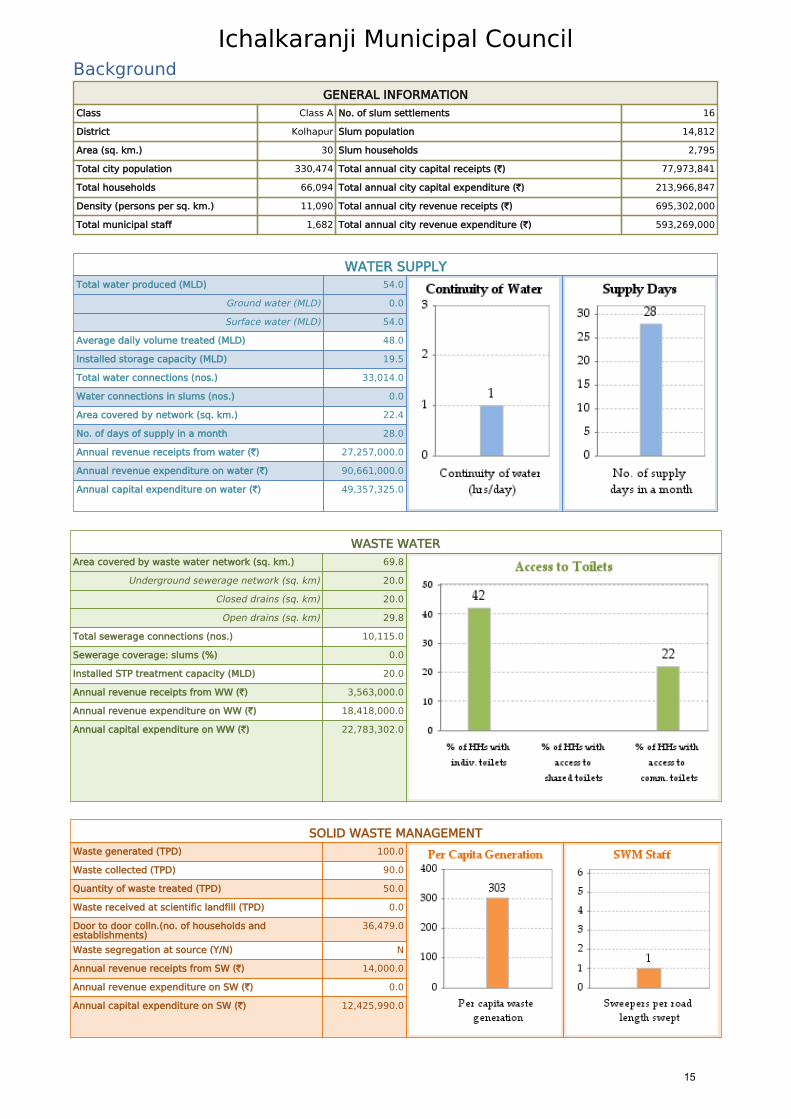
Ichalkaranji Municipal Council Background
GENERAL INFORMATIONClass Class A No. of slum settlements 16
District Kolhapur Slum population 14,812
Area (sq. km.) 30 Slum households 2,795
Total city population 330,474 Total annual city capital receipts (`) 77,973,841
Total households 66,094 Total annual city capital expenditure (`) 213,966,847
Density (persons per sq. km.) 11,090 Total annual city revenue receipts (`) 695,302,000
Total municipal staff 1,682 Total annual city revenue expenditure (`) 593,269,000
WATER SUPPLYTotal water produced (MLD) 54.0
Ground water (MLD) 0.0
Surface water (MLD) 54.0
Average daily volume treated (MLD) 48.0
Installed storage capacity (MLD) 19.5
Total water connections (nos.) 33,014.0
Water connections in slums (nos.) 0.0
Area covered by network (sq. km.) 22.4
No. of days of supply in a month 28.0
Annual revenue receipts from water (`) 27,257,000.0
Annual revenue expenditure on water (`) 90,661,000.0
Annual capital expenditure on water (`) 49,357,325.0
WASTE WATERArea covered by waste water network (sq. km.) 69.8
Underground sewerage network (sq. km) 20.0
Closed drains (sq. km) 20.0
Open drains (sq. km) 29.8
Total sewerage connections (nos.) 10,115.0
Sewerage coverage: slums (%) 0.0
Installed STP treatment capacity (MLD) 20.0
Annual revenue receipts from WW (`) 3,563,000.0
Annual revenue expenditure on WW (`) 18,418,000.0
Annual capital expenditure on WW (`) 22,783,302.0
SOLID WASTE MANAGEMENTWaste generated (TPD) 100.0
Waste collected (TPD) 90.0
Quantity of waste treated (TPD) 50.0
Waste received at scientific landfill (TPD) 0.0
Door to door colln.(no. of households andestablishments)
36,479.0
Waste segregation at source (Y/N) N
Annual revenue receipts from SW (`) 14,000.0
Annual revenue expenditure on SW (`) 0.0
Annual capital expenditure on SW (`) 12,425,990.0
15
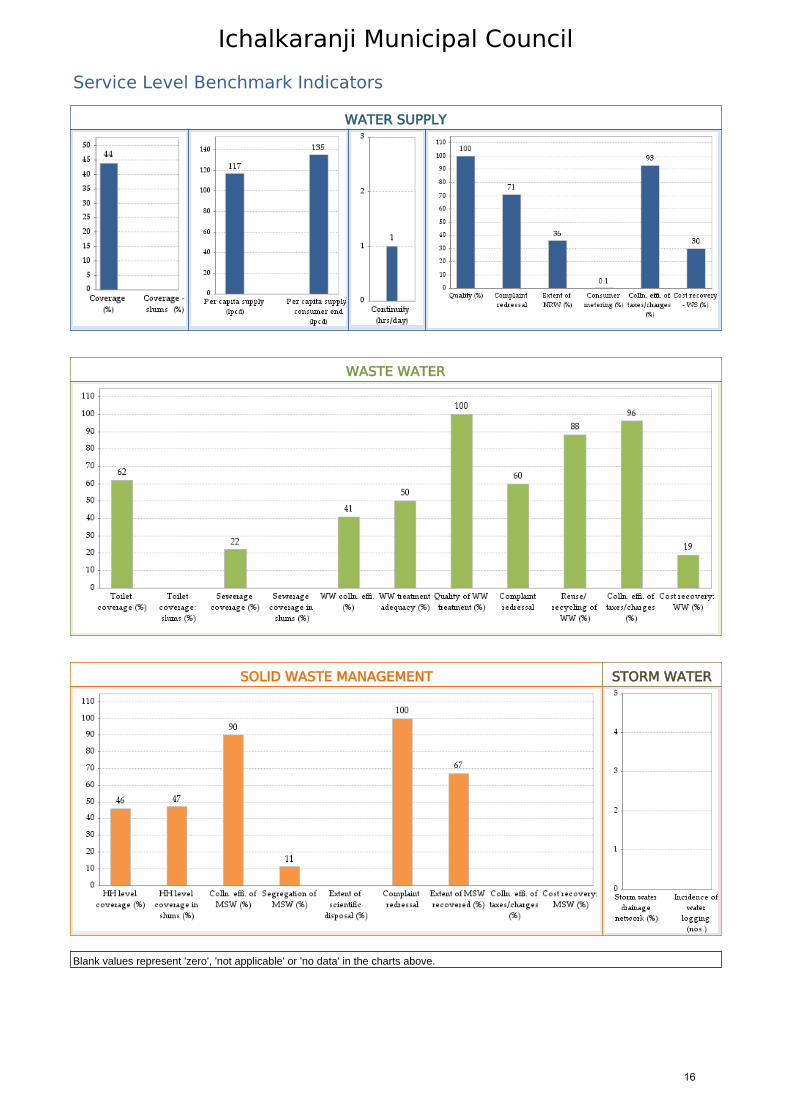
Ichalkaranji Municipal Council
Service Level Benchmark Indicators
WATER SUPPLY
WASTE WATER
SOLID WASTE MANAGEMENT STORM WATER
Blank values represent 'zero', 'not applicable' or 'no data' in the charts above.
16
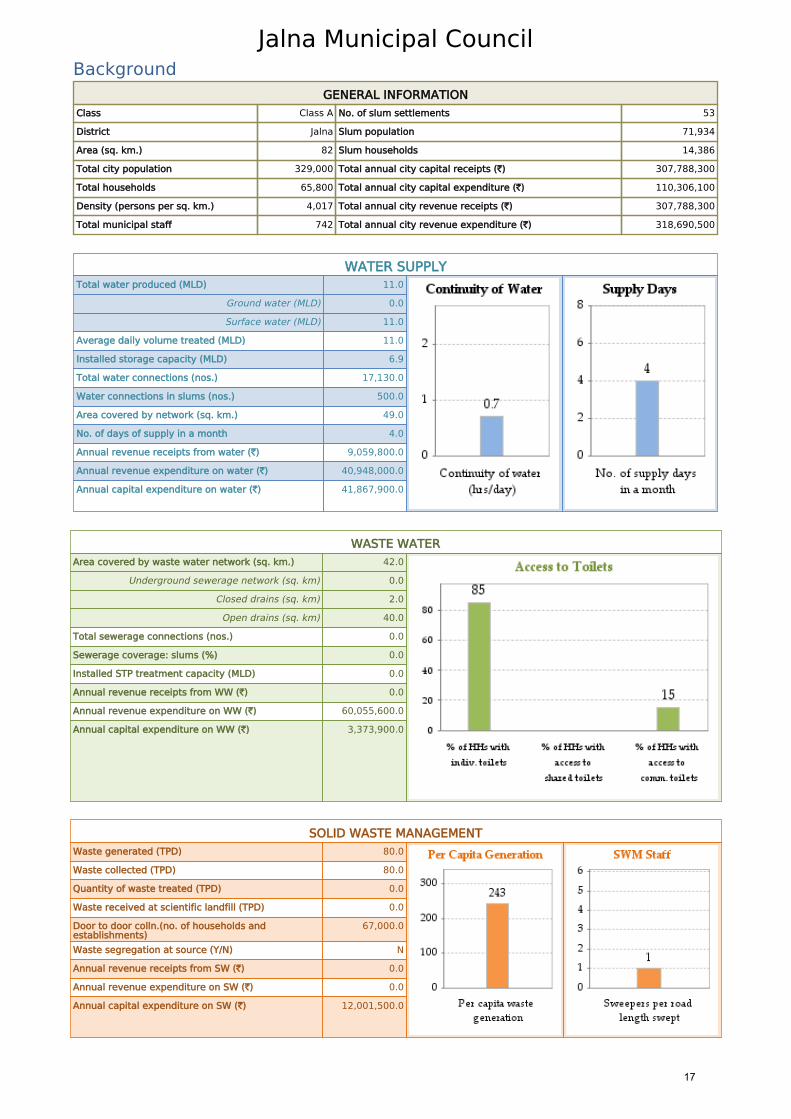
Jalna Municipal Council Background
GENERAL INFORMATIONClass Class A No. of slum settlements 53
District Jalna Slum population 71,934
Area (sq. km.) 82 Slum households 14,386
Total city population 329,000 Total annual city capital receipts (`) 307,788,300
Total households 65,800 Total annual city capital expenditure (`) 110,306,100
Density (persons per sq. km.) 4,017 Total annual city revenue receipts (`) 307,788,300
Total municipal staff 742 Total annual city revenue expenditure (`) 318,690,500
WATER SUPPLYTotal water produced (MLD) 11.0
Ground water (MLD) 0.0
Surface water (MLD) 11.0
Average daily volume treated (MLD) 11.0
Installed storage capacity (MLD) 6.9
Total water connections (nos.) 17,130.0
Water connections in slums (nos.) 500.0
Area covered by network (sq. km.) 49.0
No. of days of supply in a month 4.0
Annual revenue receipts from water (`) 9,059,800.0
Annual revenue expenditure on water (`) 40,948,000.0
Annual capital expenditure on water (`) 41,867,900.0
WASTE WATERArea covered by waste water network (sq. km.) 42.0
Underground sewerage network (sq. km) 0.0
Closed drains (sq. km) 2.0
Open drains (sq. km) 40.0
Total sewerage connections (nos.) 0.0
Sewerage coverage: slums (%) 0.0
Installed STP treatment capacity (MLD) 0.0
Annual revenue receipts from WW (`) 0.0
Annual revenue expenditure on WW (`) 60,055,600.0
Annual capital expenditure on WW (`) 3,373,900.0
SOLID WASTE MANAGEMENTWaste generated (TPD) 80.0
Waste collected (TPD) 80.0
Quantity of waste treated (TPD) 0.0
Waste received at scientific landfill (TPD) 0.0
Door to door colln.(no. of households andestablishments)
67,000.0
Waste segregation at source (Y/N) N
Annual revenue receipts from SW (`) 0.0
Annual revenue expenditure on SW (`) 0.0
Annual capital expenditure on SW (`) 12,001,500.0
17
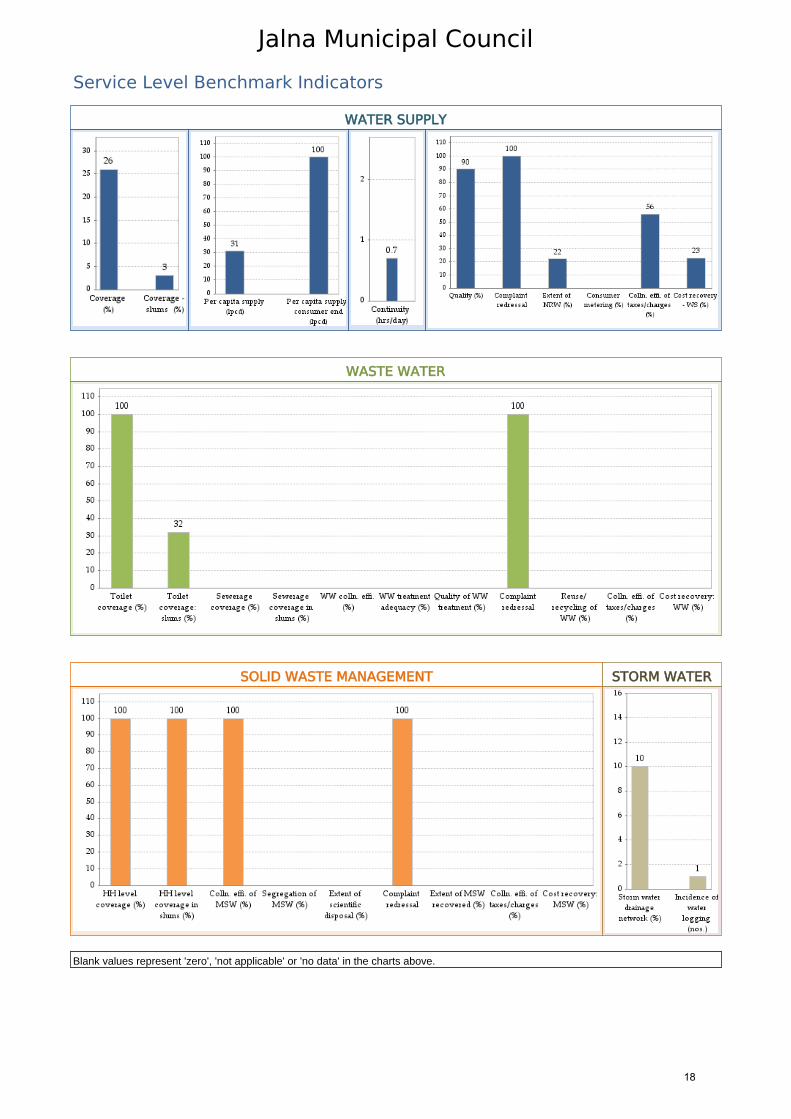
Jalna Municipal Council
Service Level Benchmark Indicators
WATER SUPPLY
WASTE WATER
SOLID WASTE MANAGEMENT STORM WATER
Blank values represent 'zero', 'not applicable' or 'no data' in the charts above.
18
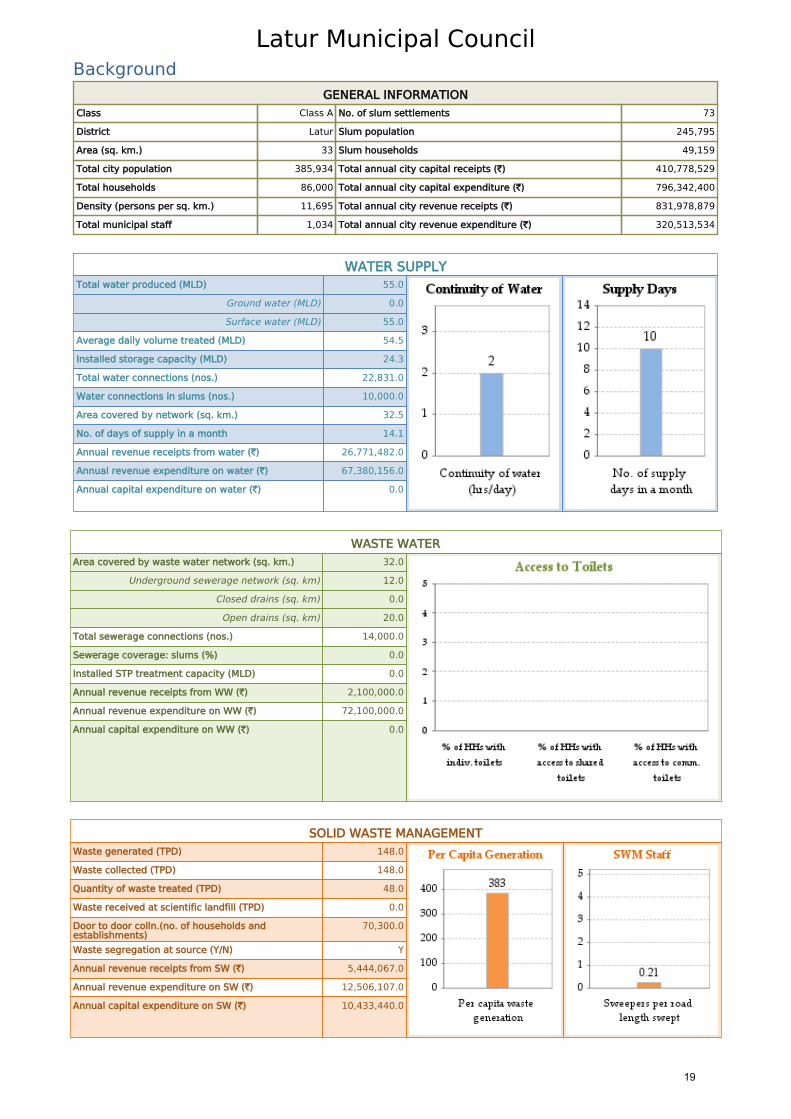
Latur Municipal Council Background
GENERAL INFORMATIONClass Class A No. of slum settlements 73
District Latur Slum population 245,795
Area (sq. km.) 33 Slum households 49,159
Total city population 385,934 Total annual city capital receipts (`) 410,778,529
Total households 86,000 Total annual city capital expenditure (`) 796,342,400
Density (persons per sq. km.) 11,695 Total annual city revenue receipts (`) 831,978,879
Total municipal staff 1,034 Total annual city revenue expenditure (`) 320,513,534
WATER SUPPLYTotal water produced (MLD) 55.0
Ground water (MLD) 0.0
Surface water (MLD) 55.0
Average daily volume treated (MLD) 54.5
Installed storage capacity (MLD) 24.3
Total water connections (nos.) 22,831.0
Water connections in slums (nos.) 10,000.0
Area covered by network (sq. km.) 32.5
No. of days of supply in a month 14.1
Annual revenue receipts from water (`) 26,771,482.0
Annual revenue expenditure on water (`) 67,380,156.0
Annual capital expenditure on water (`) 0.0
WASTE WATERArea covered by waste water network (sq. km.) 32.0
Underground sewerage network (sq. km) 12.0
Closed drains (sq. km) 0.0
Open drains (sq. km) 20.0
Total sewerage connections (nos.) 14,000.0
Sewerage coverage: slums (%) 0.0
Installed STP treatment capacity (MLD) 0.0
Annual revenue receipts from WW (`) 2,100,000.0
Annual revenue expenditure on WW (`) 72,100,000.0
Annual capital expenditure on WW (`) 0.0
SOLID WASTE MANAGEMENTWaste generated (TPD) 148.0
Waste collected (TPD) 148.0
Quantity of waste treated (TPD) 48.0
Waste received at scientific landfill (TPD) 0.0
Door to door colln.(no. of households andestablishments)
70,300.0
Waste segregation at source (Y/N) Y
Annual revenue receipts from SW (`) 5,444,067.0
Annual revenue expenditure on SW (`) 12,506,107.0
Annual capital expenditure on SW (`) 10,433,440.0
19
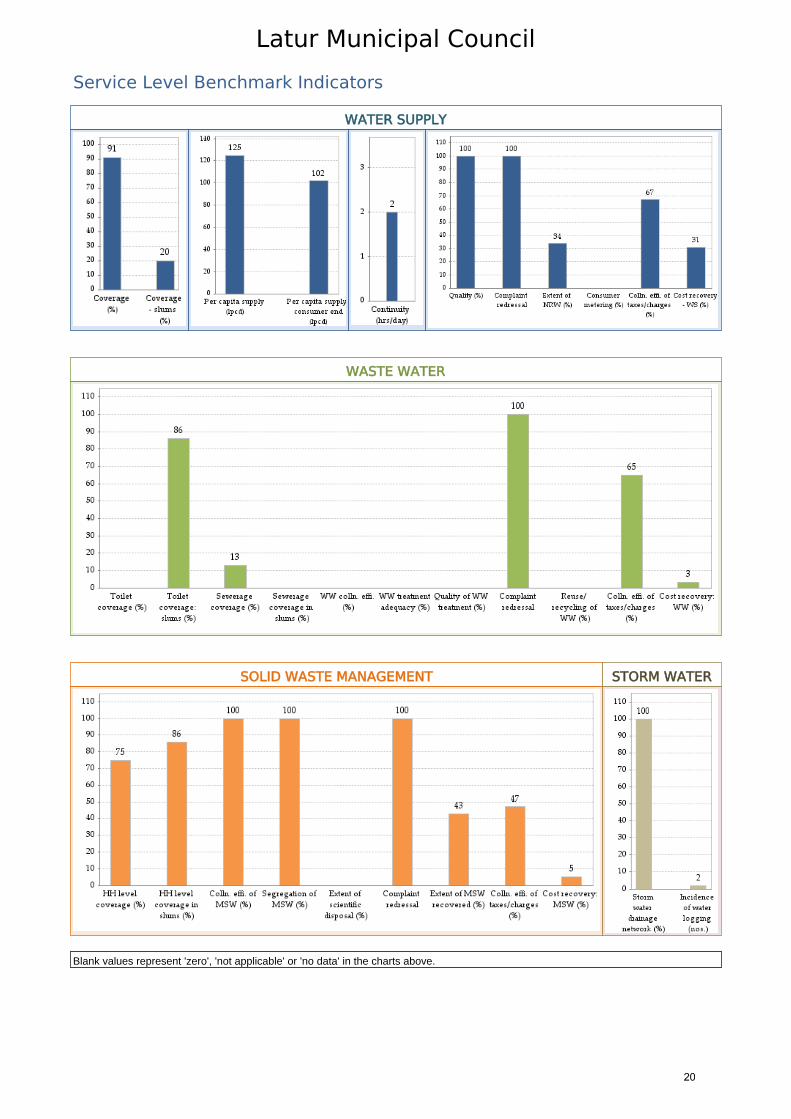
Latur Municipal Council
Service Level Benchmark Indicators
WATER SUPPLY
WASTE WATER
SOLID WASTE MANAGEMENT STORM WATER
Blank values represent 'zero', 'not applicable' or 'no data' in the charts above.
20
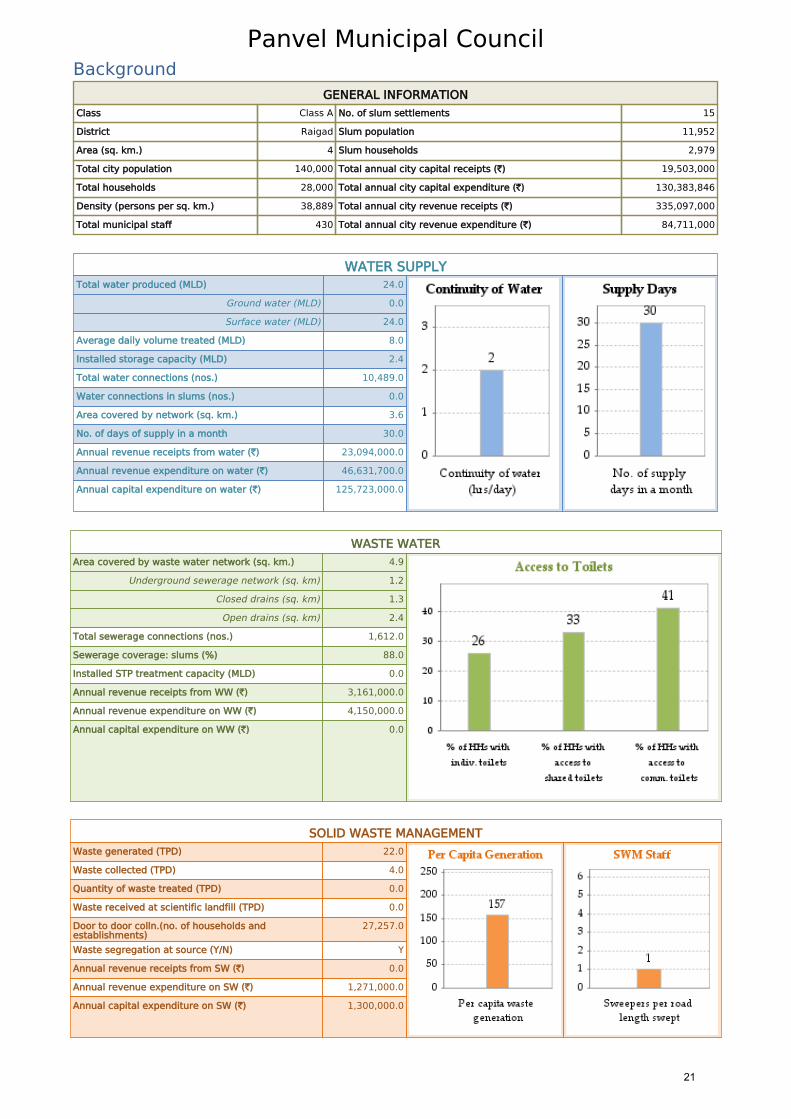
Panvel Municipal Council Background
GENERAL INFORMATIONClass Class A No. of slum settlements 15
District Raigad Slum population 11,952
Area (sq. km.) 4 Slum households 2,979
Total city population 140,000 Total annual city capital receipts (`) 19,503,000
Total households 28,000 Total annual city capital expenditure (`) 130,383,846
Density (persons per sq. km.) 38,889 Total annual city revenue receipts (`) 335,097,000
Total municipal staff 430 Total annual city revenue expenditure (`) 84,711,000
WATER SUPPLYTotal water produced (MLD) 24.0
Ground water (MLD) 0.0
Surface water (MLD) 24.0
Average daily volume treated (MLD) 8.0
Installed storage capacity (MLD) 2.4
Total water connections (nos.) 10,489.0
Water connections in slums (nos.) 0.0
Area covered by network (sq. km.) 3.6
No. of days of supply in a month 30.0
Annual revenue receipts from water (`) 23,094,000.0
Annual revenue expenditure on water (`) 46,631,700.0
Annual capital expenditure on water (`) 125,723,000.0
WASTE WATERArea covered by waste water network (sq. km.) 4.9
Underground sewerage network (sq. km) 1.2
Closed drains (sq. km) 1.3
Open drains (sq. km) 2.4
Total sewerage connections (nos.) 1,612.0
Sewerage coverage: slums (%) 88.0
Installed STP treatment capacity (MLD) 0.0
Annual revenue receipts from WW (`) 3,161,000.0
Annual revenue expenditure on WW (`) 4,150,000.0
Annual capital expenditure on WW (`) 0.0
SOLID WASTE MANAGEMENTWaste generated (TPD) 22.0
Waste collected (TPD) 4.0
Quantity of waste treated (TPD) 0.0
Waste received at scientific landfill (TPD) 0.0
Door to door colln.(no. of households andestablishments)
27,257.0
Waste segregation at source (Y/N) Y
Annual revenue receipts from SW (`) 0.0
Annual revenue expenditure on SW (`) 1,271,000.0
Annual capital expenditure on SW (`) 1,300,000.0
21
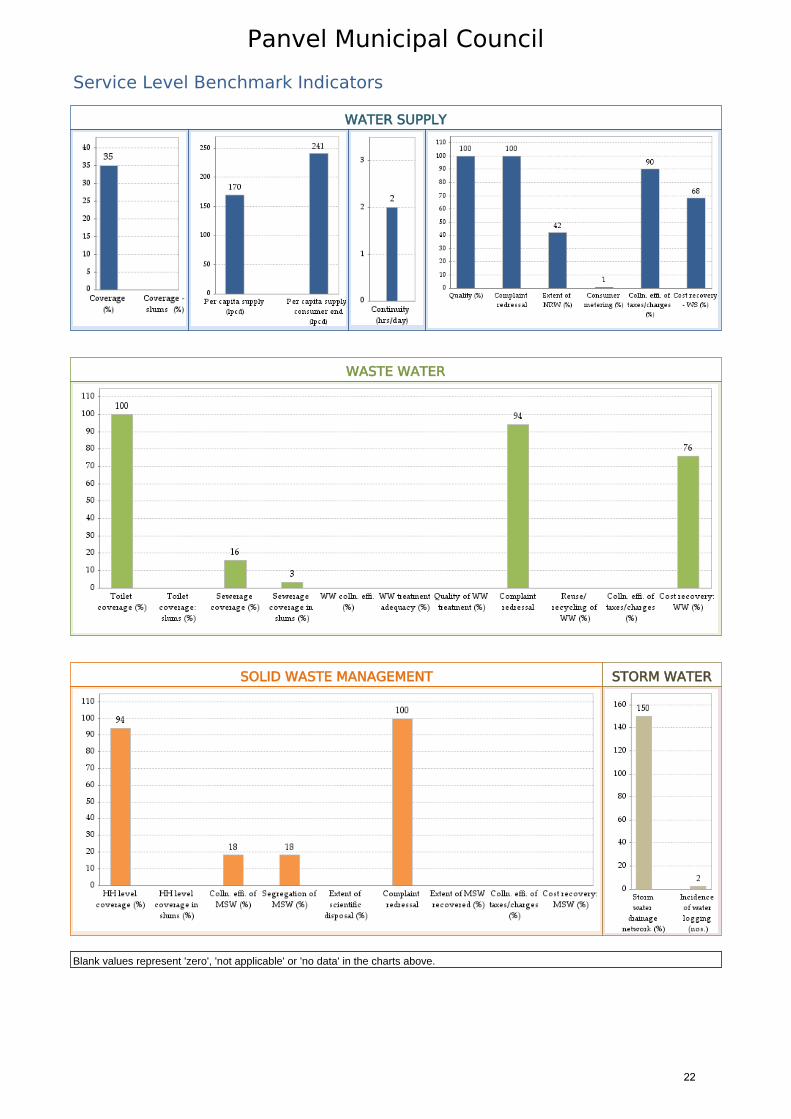
Panvel Municipal Council
Service Level Benchmark Indicators
WATER SUPPLY
WASTE WATER
SOLID WASTE MANAGEMENT STORM WATER
Blank values represent 'zero', 'not applicable' or 'no data' in the charts above.
22

Parbhani Municipal Council Background
GENERAL INFORMATIONClass Class A No. of slum settlements 71
District Parbhani Slum population 110,000
Area (sq. km.) 58 Slum households 22,000
Total city population 313,263 Total annual city capital receipts (`) 214,952,000
Total households 60,168 Total annual city capital expenditure (`) 8,506,000
Density (persons per sq. km.) 5,439 Total annual city revenue receipts (`) 268,455,000
Total municipal staff 910 Total annual city revenue expenditure (`) 283,410,000
WATER SUPPLYTotal water produced (MLD) 13.2
Ground water (MLD) 0.2
Surface water (MLD) 13.0
Average daily volume treated (MLD) 13.0
Installed storage capacity (MLD) 12.4
Total water connections (nos.) 21,977.0
Water connections in slums (nos.) 3,500.0
Area covered by network (sq. km.) 39.8
No. of days of supply in a month 8.0
Annual revenue receipts from water (`) 7,342,000.0
Annual revenue expenditure on water (`) 20,008,000.0
Annual capital expenditure on water (`) 0.0
WASTE WATERArea covered by waste water network (sq. km.) 47.6
Underground sewerage network (sq. km) 0.0
Closed drains (sq. km) 0.0
Open drains (sq. km) 47.6
Total sewerage connections (nos.) 0.0
Sewerage coverage: slums (%) 0.0
Installed STP treatment capacity (MLD) 0.0
Annual revenue receipts from WW (`) 0.0
Annual revenue expenditure on WW (`) 0.0
Annual capital expenditure on WW (`) 0.0
SOLID WASTE MANAGEMENTWaste generated (TPD) 65.0
Waste collected (TPD) 45.0
Quantity of waste treated (TPD) 0.0
Waste received at scientific landfill (TPD) 0.0
Door to door colln.(no. of households andestablishments)
15,600.0
Waste segregation at source (Y/N) N
Annual revenue receipts from SW (`) 0.0
Annual revenue expenditure on SW (`) 0.0
Annual capital expenditure on SW (`) 0.0
23
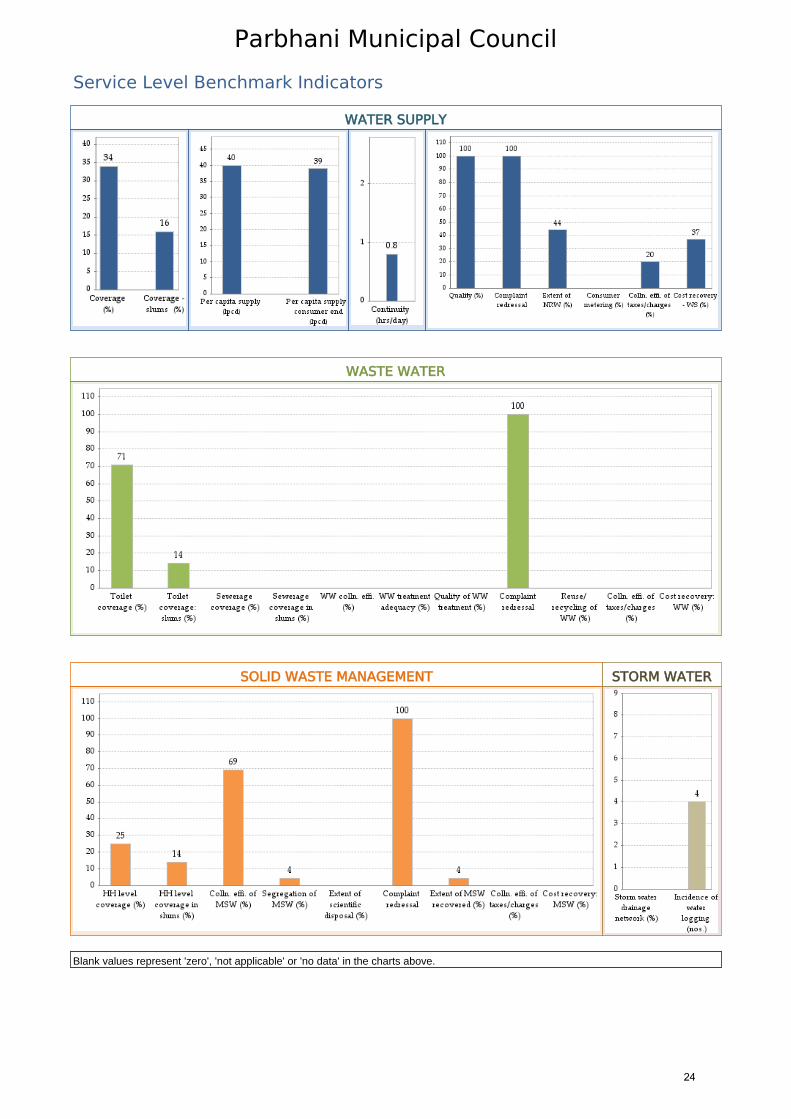
Parbhani Municipal Council
Service Level Benchmark Indicators
WATER SUPPLY
WASTE WATER
SOLID WASTE MANAGEMENT STORM WATER
Blank values represent 'zero', 'not applicable' or 'no data' in the charts above.
24

Satara Municipal Council Background
GENERAL INFORMATIONClass Class A No. of slum settlements 21
District Satara Slum population 11,000
Area (sq. km.) 8 Slum households 1,736
Total city population 123,447 Total annual city capital receipts (`) 100,319,000
Total households 28,399 Total annual city capital expenditure (`) 106,135,000
Density (persons per sq. km.) 15,054 Total annual city revenue receipts (`) 248,454,000
Total municipal staff 612 Total annual city revenue expenditure (`) 159,881,000
WATER SUPPLYTotal water produced (MLD) 12.1
Ground water (MLD) 0.4
Surface water (MLD) 11.7
Average daily volume treated (MLD) 11.0
Installed storage capacity (MLD) 6.5
Total water connections (nos.) 12,308.0
Water connections in slums (nos.) 0.0
Area covered by network (sq. km.) 115.0
No. of days of supply in a month 30.0
Annual revenue receipts from water (`) 12,624,000.0
Annual revenue expenditure on water (`) 25,064,000.0
Annual capital expenditure on water (`) 4,203,000.0
WASTE WATERArea covered by waste water network (sq. km.) 8.2
Underground sewerage network (sq. km) 0.0
Closed drains (sq. km) 0.0
Open drains (sq. km) 8.2
Total sewerage connections (nos.) 0.0
Sewerage coverage: slums (%) 0.0
Installed STP treatment capacity (MLD) 0.0
Annual revenue receipts from WW (`) 0.0
Annual revenue expenditure on WW (`) 13,108,000.0
Annual capital expenditure on WW (`) 8,856,000.0
SOLID WASTE MANAGEMENTWaste generated (TPD) 40.0
Waste collected (TPD) 0.0
Quantity of waste treated (TPD) 0.0
Waste received at scientific landfill (TPD) 0.0
Door to door colln.(no. of households andestablishments)
31,530.0
Waste segregation at source (Y/N) Y
Annual revenue receipts from SW (`) 1,902,000.0
Annual revenue expenditure on SW (`) 19,818,000.0
Annual capital expenditure on SW (`) 10,552,000.0
25
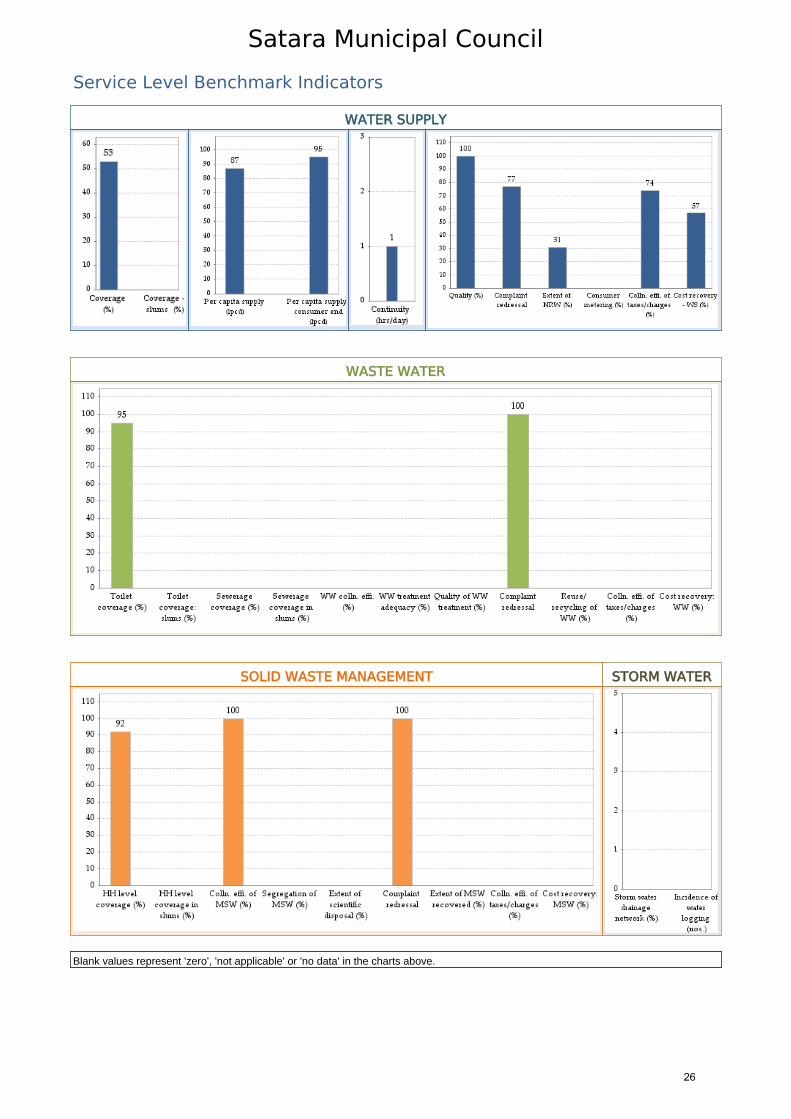
Satara Municipal Council
Service Level Benchmark Indicators
WATER SUPPLY
WASTE WATER
SOLID WASTE MANAGEMENT STORM WATER
Blank values represent 'zero', 'not applicable' or 'no data' in the charts above.
26

Wardha Municipal Council Background
GENERAL INFORMATIONClass Class A No. of slum settlements 15
District Wardha Slum population 14,072
Area (sq. km.) 7 Slum households 2,478
Total city population 118,464 Total annual city capital receipts (`) 743,002,411
Total households 22,013 Total annual city capital expenditure (`) 45,758,501
Density (persons per sq. km.) 16,009 Total annual city revenue receipts (`) 225,667,014
Total municipal staff 404 Total annual city revenue expenditure (`) 11,190,078
WATER SUPPLYTotal water produced (MLD) 11.6
Ground water (MLD) 0.0
Surface water (MLD) 11.6
Average daily volume treated (MLD) 16.0
Installed storage capacity (MLD) 10.1
Total water connections (nos.) 13,113.0
Water connections in slums (nos.) 1,500.0
Area covered by network (sq. km.) 7.4
No. of days of supply in a month 30.0
Annual revenue receipts from water (`) 22,057,175.0
Annual revenue expenditure on water (`) 38,840,000.0
Annual capital expenditure on water (`) 38,700,000.0
WASTE WATERArea covered by waste water network (sq. km.) 7.7
Underground sewerage network (sq. km) 0.0
Closed drains (sq. km) 0.0
Open drains (sq. km) 7.7
Total sewerage connections (nos.) 0.0
Sewerage coverage: slums (%) 0.0
Installed STP treatment capacity (MLD) 0.0
Annual revenue receipts from WW (`) 0.0
Annual revenue expenditure on WW (`) 0.0
Annual capital expenditure on WW (`) 0.0
SOLID WASTE MANAGEMENTWaste generated (TPD) 30.0
Waste collected (TPD) 28.0
Quantity of waste treated (TPD) 0.0
Waste received at scientific landfill (TPD) 0.0
Door to door colln.(no. of households andestablishments)
11,033.0
Waste segregation at source (Y/N) N
Annual revenue receipts from SW (`) 650,139.0
Annual revenue expenditure on SW (`) 0.0
Annual capital expenditure on SW (`) 0.0
27
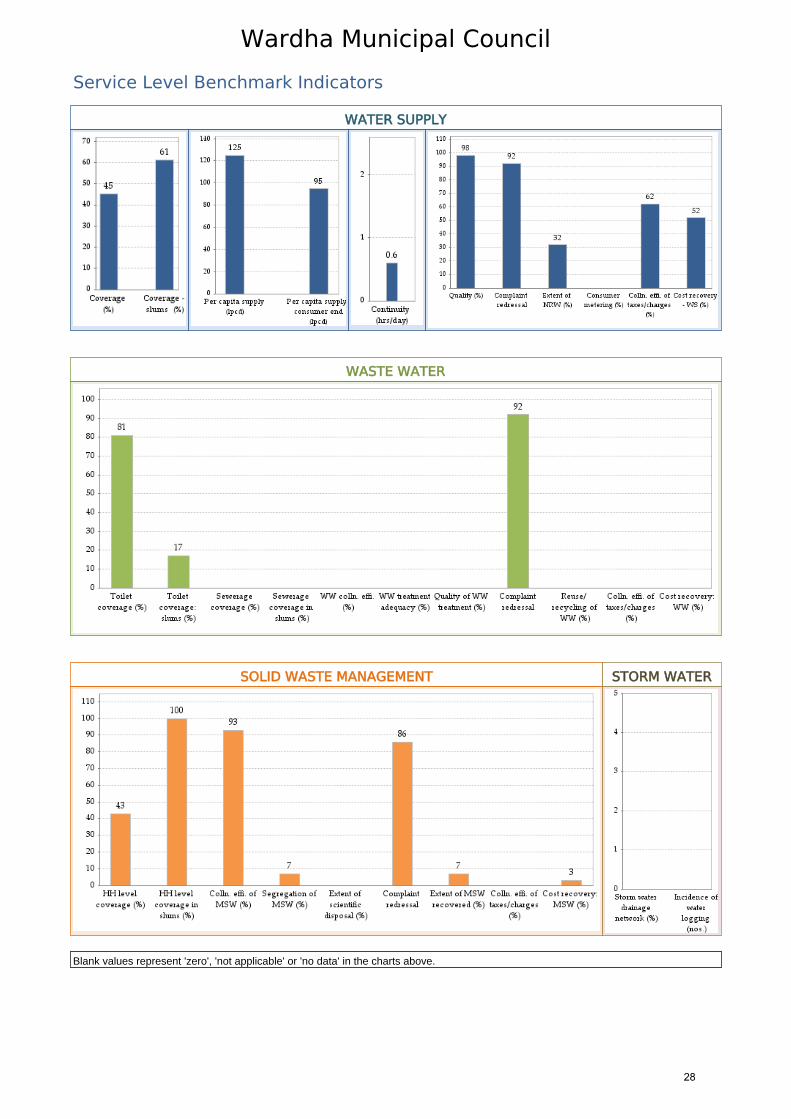
Wardha Municipal Council
Service Level Benchmark Indicators
WATER SUPPLY
WASTE WATER
SOLID WASTE MANAGEMENT STORM WATER
Blank values represent 'zero', 'not applicable' or 'no data' in the charts above.
28
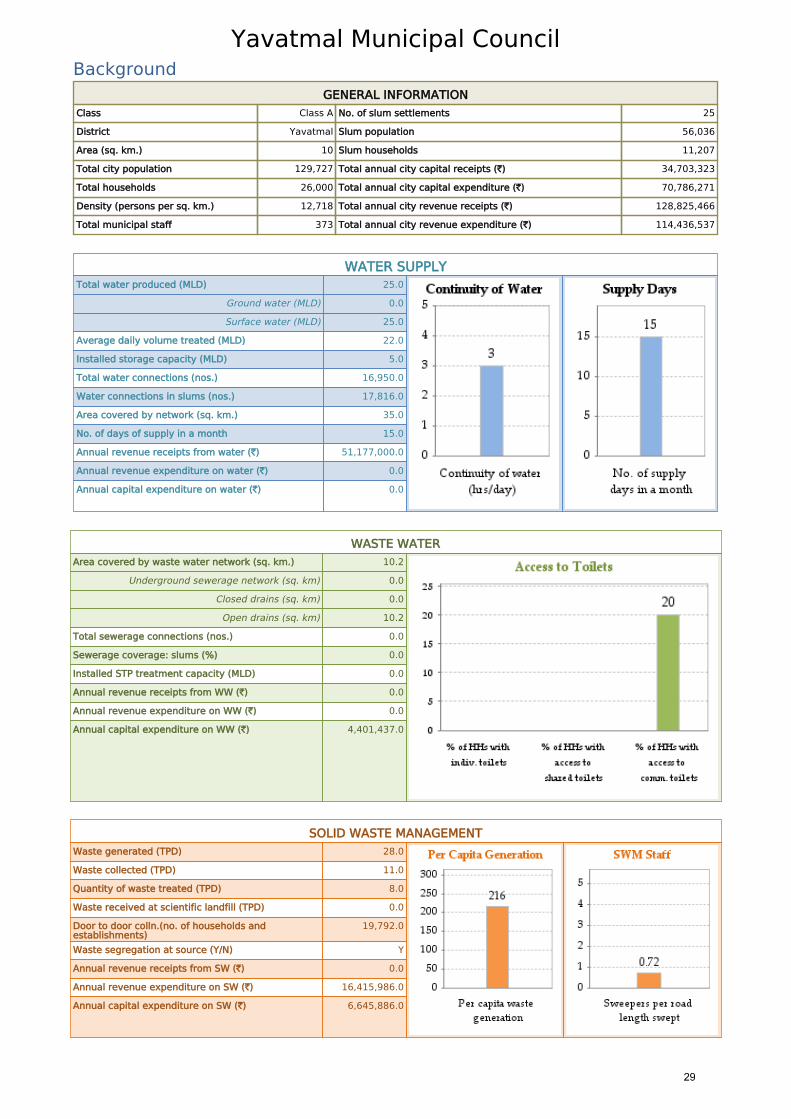
Yavatmal Municipal Council Background
GENERAL INFORMATIONClass Class A No. of slum settlements 25
District Yavatmal Slum population 56,036
Area (sq. km.) 10 Slum households 11,207
Total city population 129,727 Total annual city capital receipts (`) 34,703,323
Total households 26,000 Total annual city capital expenditure (`) 70,786,271
Density (persons per sq. km.) 12,718 Total annual city revenue receipts (`) 128,825,466
Total municipal staff 373 Total annual city revenue expenditure (`) 114,436,537
WATER SUPPLYTotal water produced (MLD) 25.0
Ground water (MLD) 0.0
Surface water (MLD) 25.0
Average daily volume treated (MLD) 22.0
Installed storage capacity (MLD) 5.0
Total water connections (nos.) 16,950.0
Water connections in slums (nos.) 17,816.0
Area covered by network (sq. km.) 35.0
No. of days of supply in a month 15.0
Annual revenue receipts from water (`) 51,177,000.0
Annual revenue expenditure on water (`) 0.0
Annual capital expenditure on water (`) 0.0
WASTE WATERArea covered by waste water network (sq. km.) 10.2
Underground sewerage network (sq. km) 0.0
Closed drains (sq. km) 0.0
Open drains (sq. km) 10.2
Total sewerage connections (nos.) 0.0
Sewerage coverage: slums (%) 0.0
Installed STP treatment capacity (MLD) 0.0
Annual revenue receipts from WW (`) 0.0
Annual revenue expenditure on WW (`) 0.0
Annual capital expenditure on WW (`) 4,401,437.0
SOLID WASTE MANAGEMENTWaste generated (TPD) 28.0
Waste collected (TPD) 11.0
Quantity of waste treated (TPD) 8.0
Waste received at scientific landfill (TPD) 0.0
Door to door colln.(no. of households andestablishments)
19,792.0
Waste segregation at source (Y/N) Y
Annual revenue receipts from SW (`) 0.0
Annual revenue expenditure on SW (`) 16,415,986.0
Annual capital expenditure on SW (`) 6,645,886.0
29
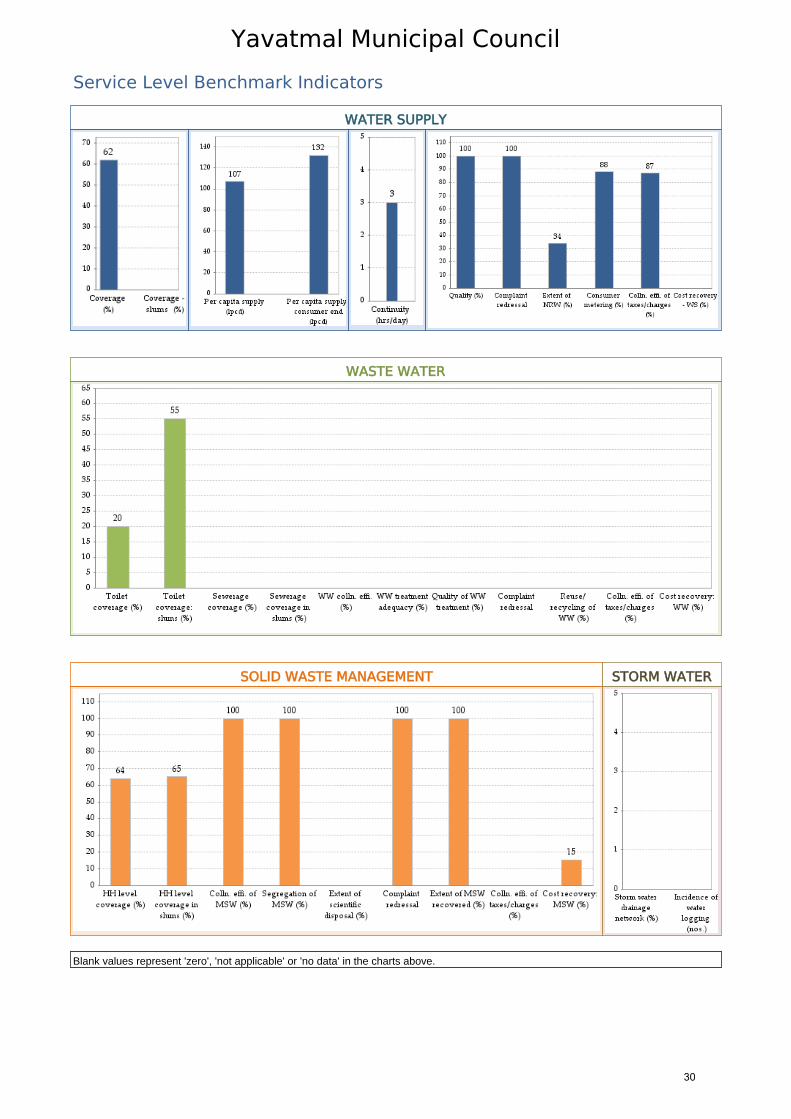
Yavatmal Municipal Council
Service Level Benchmark Indicators
WATER SUPPLY
WASTE WATER
SOLID WASTE MANAGEMENT STORM WATER
Blank values represent 'zero', 'not applicable' or 'no data' in the charts above.
30
Th
Th
im
thr
pe
M
CE
Pr
Ce
M
PA
CE
Ka
In
Te
Fa
ww
he Perfor
he PAS Pr
mprove del
ree majo
erformance
aharashtra
EPT Unive
roject. It i
entre (UM
aharashtra
AS Proje
EPT Unive
asturbhai
ndia
el: +91‐79‐2
ax: 91‐79‐26
ww.pas.or
rmance A
roject aim
livery of w
or compo
e improve
a.
ersity has
is being i
MC) in Gu
a.
ect
ersity
Lalbhai C
26302470
6302075
rg.in
Assessme
ms to deve
water and s
nents of
ement. It
received a
mplement
ujarat and
Campus, U
ent System
elop appr
sanitation
perform
covers all
a grant fro
ted by CE
d All Ind
University
m (PAS)
opriate m
in cities a
mance me
l the 400+
m the Bill
EPT Unive
dia Institu
Road, Na
Project
methods an
and towns
asuremen
+ urban l
l and Meli
ersity wit
ute of Lo
avrangpura
nd tools t
in India. T
t, perform
ocal gove
inda Gates
th support
ocal Self‐G
a, Ahmed
to measur
The PAS P
mance m
rnments i
s Foundati
t of Urba
Governme
abad 380
e, monito
Project inc
monitoring
in Gujara
ion for the
n Manage
ent (AIILSG
009 Gujar
r and
cludes
and
at and
e PAS
ement
G) in
rat,


![Untitled-1 [images1.loopnet.com]...2010 Households 2019 Total Households 2024 Total Households 2000-2010 Annual Rate 2010-2019 Annual Rate 2019-2024 Annual Rate 2019 Average Household](https://img.pdfslide.us/doc/110x75/5f35bf22568c8b527b6d5173/untitled-1-2010-households-2019-total-households-2024-total-households-2000-2010.jpg)