Embed Size (px)
Citation preview
CE 7670: Advanced Traffic Signal Systems
Tapan K. Datta, Ph.D., P.E.
Winter 2003

Probability of Failure Method If (x-1) vehicles cross the stop bar
during a time equal to G – (K1 + K2) then the average minimum headway between the vehicle is given by: Avg. Min. headway = time/volume, or G – K x-1
Where K = K1 + K2
K1 = starting delay of the platoon K2 = time required for last vehicle to cross G = green plus amber time D = constant departure headway x = number of departures G = (x-1) D + K, or, G = x D + K - D

Probability of Failure Method to Calculate Cycle Length

Probability of Failure Method to Calculate Cycle Length

Assume critical lane volume = V
Sum of hourly critical lane volume (V) for all phases = total critical lane volume per hour
V = 3600
C* X =
3600
C
G - (K-D)*
D
Where: C = G = number of phases
= 3600 CCD
3600 (K-D)
CD-
K = lost time = K1 + K2
G = green plus amber time D = constant departure headway x = number of departures
V = 3600
C* X X =
[ G – (K – D)]
DWhere:
V = 3600
C*
C - (K-D)
D[ ]

V (for = 3) = 3600* 3(6-2)
C* 2
Say K = K1+ K2 = 6 sec D = 2 sec
1800 -
21600
C1800 - =
V (for = 4) = 3600* 4(6-2)
C* 21800 -
28800
C1800 - =
As V approaches 1800 vph, C approaches infinity
C = 3600 (K-D)
3600 – D V Based on uniform arrival

Poisson Arrival
Based on random arrivals
P (x+1) =x+1
m(x+1) e-m
(x + 1)!
Where:m = average arrival per cycle = V
3600/C
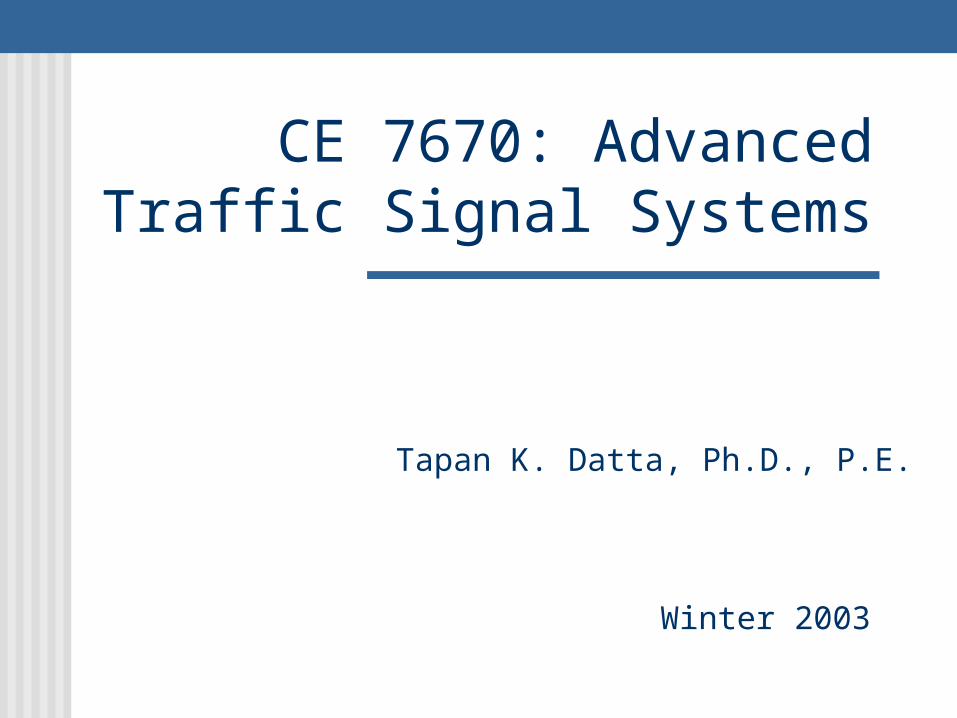
Signal Phasing Design
Through traffic shared with right-turn traffic Solid green followed by yellow and red
Left-turn traffic: Lead left-turn Protected
• Green left arrow followed by yellow and red Protected/Permissive
• Green left arrow followed by solid green • Then yellow and red

Left-turn traffic: Lag left-turn Permissive/Protected
• Solid green followed by green left arrow• Then yellow and red
Split Phasing• When one approach has much higher volume than
the opposing approach, only one direction traffic (including left-turn) is allowed to proceed in a protected manner, and then the opposing traffic

The Texas Approach
Trap Problem: Using protected-permitted and lead-lag phasing at the same time leads a vehicle to be trapped
Solution: Waiting left-turner is able to see the ball indications which clear at the same time as opposing through traffic, and thus drivers do not make false assumptions

The Texas Concept Having at least two signal heads for through traffic in addition to five-section protected-
permitted left-turn signal Reducing the visibility of circular indications of five-section left-turn signal so that they
are readily visible by left-turners Modifying the restricted-visibility indications so that they continue to display a circular
green to left-turners through the opposing left-turn movement’s lagging protected phase, and displaying the amber for the permitted left-turn only when the amber is on for opposing through traffic also

The Florida Recommendations
Protected/Permissive left-turn phasing should be provided in all intersection approaches
Protected only left-turn should be provided if: Double left-turn only lanes are operating Intersection geometric compels to do so Poor sight distance to opposing traffic Speed limit of opposing traffic is higher than
45mph Number of left-turn head-on crashes exceeds 6
per year

The Florida Recommendations
Permissive/Protected left-turn phasing should be limited and restricted to the following situations: T-intersections where U-turns are prohibited 4-way intersections where the opposing approach
has prohibited left-turns or protected only left-turn phasing
4-way intersections where the left-turn volumes from opposing approaches do not substantially differ throughout the various time periods of a normal day

The Florida Recommendations
Split phasing can be effectively used when: Opposing approaches are offset to an extent that
simultaneous left-turns from opposing directions would be impossible or hazardous
Left-turn volumes are extremely heavy on opposing approaches and both are nearly equal to the adjacent through movement critical lane volume
Left-turn volume is extremely heavy on an approach that does not include a separate left-turn lane
Drivers are permitted to turn left from more than one lane and also to use right-most left-turn lane as a through lane.

The Kentucky Recommendation
Protected/Permissive is the preferable method because of savings in time compared to protected only phasing
Protected/Permissive should not be used if the following conditions exist:
• Approach speed > 45mph• Protected only is currently in use and speed limit is over 35
mph• Left-turn movement must cross three or more opposing
through lanes• Intersection geometrics force the left-turn lane to have a
separate signal head• Double left-turn only lanes on the approach• Left-turn head-on crashes is 4 or more per year• Potential left-turn problem exists documented by a traffic
conflict study• A sight distance problem exists

Lane Configuration for the Intersection of Gratiot Avenue and 23 Mile Road
23 Mile RoadG
rati
ot
N

Future AM Peak Hour Traffic Volumes for Gratiot Avenue and 23 Mile Road
Approach Volume = 1,295vph
Approach Volume = 651vph
N
23 MILE ROAD
GR
AT
IOT
AV
EN
UE
340+11=351 726
Approach Volume = 1,257vph
Approach Volume = 558vph
Total Intersection Volume
= 3,761 vph
498+6=504
47
298 156+5=161
728+5=733
180
99
100361+4= 365
187+10=197

Phasing Plan for Gratiot and 23 Mile Road
1 2 3 4 5 6

Example
470
100 300
N
25
270 30500100
475100 300
N
25
270 30500100
475760
940
380
100
100
200180
140 100
280
180
5 x 5 lane roadFour phase signal timing plan
1 2 3 41 2 3 4
Critical lane volumesV1 = Max [(760+200)/2, (380+140)/2] = 480V2 = Max [180,100] = 180V3 = Max [(940+180)/2, (470+100)/2] = 560V4 = Max [280,100] = 280

Start by assuming a cycle lengthSay 90 seconds
Calculate ‘m’ for each phase
V3600/Cm=
m1= 4803600/90
= 12
m2= 1803600/90
= 4.5
m3= 5603600/90
= 14
m4= 2803600/90
= 7

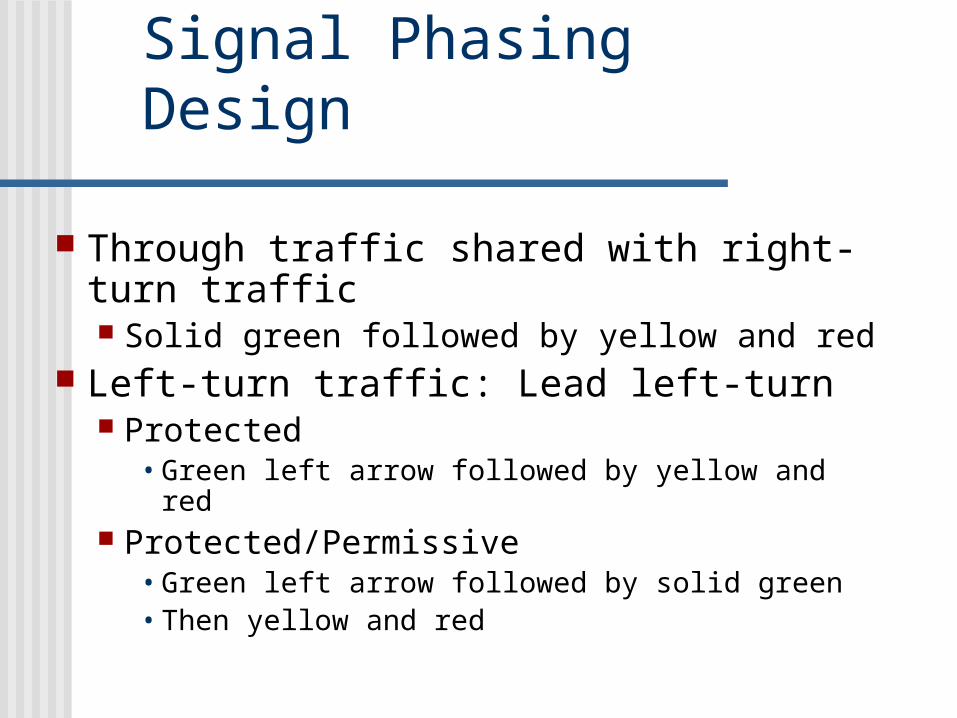
Use Figure 7-3 to find the phase length ‘G’ for various percentages of failure
mPhase length ‘G’ for various % of failure
2 5 20 30 40
1 12 42 39 33 30 28
2 4.5 21 19 15 14 13
3 14 47 44 37 35 33
4 7 29 26 21 19 18
TOTAL CL 139 128 106 98 92


If the arrivals of cars are random Cycle length of 98 seconds has 30% of
failure Cycle length of 92 seconds has 40%
failure

Now assume a 100-second cycle length Calculate ‘m’ for each phase
V3600/Cm=
m1= 4803600/100
= 13.3
m2= 1803600/100
= 5.0
m3= 5603600/100
= 15.6
m4= 2803600/100
= 7.8
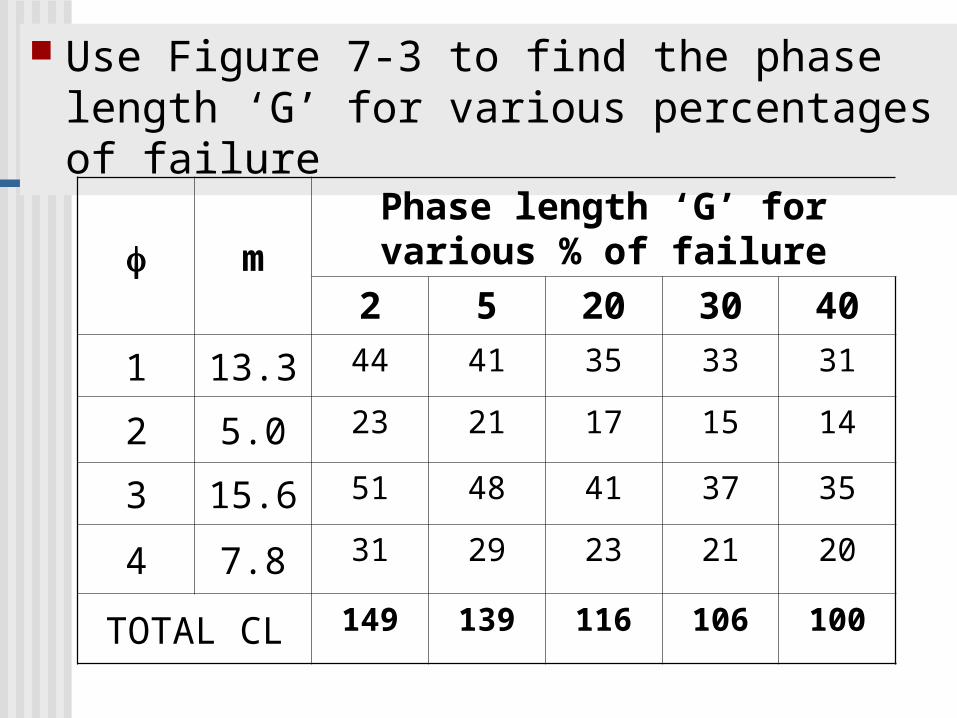
Use Figure 7-3 to find the phase length ‘G’ for various percentages of failure
mPhase length ‘G’ for various % of failure
2 5 20 30 40
1 13.3 44 41 35 33 31
2 5.0 23 21 17 15 14
3 15.6 51 48 41 37 35
4 7.8 31 29 23 21 20
TOTAL CL 149 139 116 106 100


If the arrivals of cars are random Cycle length of 106 seconds has 30% of
failure Cycle length of 100 seconds has 40%
failure

Comprehensive Example:Intersection of Rochester Road and E. Wattles Road,
Troy Michigan

N
RO
CH
ES
TE
R R
OA
D
Comerica Bank
Wendy’s Restaurant
Accent Florist
Kinko’sCopy Center
Merchant of Vino Beverage
Outlet
BlockbusterVideo Store
PapaRomano’s
Pizza
Ridley’sBakery
Cafe
E. WATTLES ROAD
Shell Gasoline
Station
Condition Diagram for Rochester Road and E. Wattles Road - Troy, Michigan
RIGHT LANE MUST TURN RIGHT Sign
NO TURN ON RED Sign
Street Name Signs
NO TURN ON RED Sign
SPEED LIMIT 45 Sign
SPEED LIMIT 45 Sign
ON
LY
ON
LY
SPEED LIMIT 40 Sign
SPEED LIMIT 40 Sign
ONLY
ONLY
ONLY
ONLY
43’
41’
7’ 8’ 34’
3’
9’ 6’
12’ 12’ 12’ 12’ 13’ 13’
13’ 11’ 13’13’ 14’
176’
24’ 65’ 138’ 22’
8’
108’
20’
173’
38’
RIGHT LANE MUST TURN RIGHT Sign
NO TURN ON RED Sign
ON
LY
ON
LY
ON
LY
ON
LY
NO TURN ON RED Sign
RIGHT LANE MUST TURN RIGHT Sign
TO I-75 Sign
13’12’
19’
12’
12’
14’
11’
17’
ON
LY
ON
LY
ONLY
ONLY
Pavement markingsvery faded
75’

WESTBOUND E. WATTLES ROAD
SOUTHBOUND ROCHESTER ROAD
EASTBOUND E. WATTLES ROAD
NORTHBOUND ROCHESTER ROAD
N
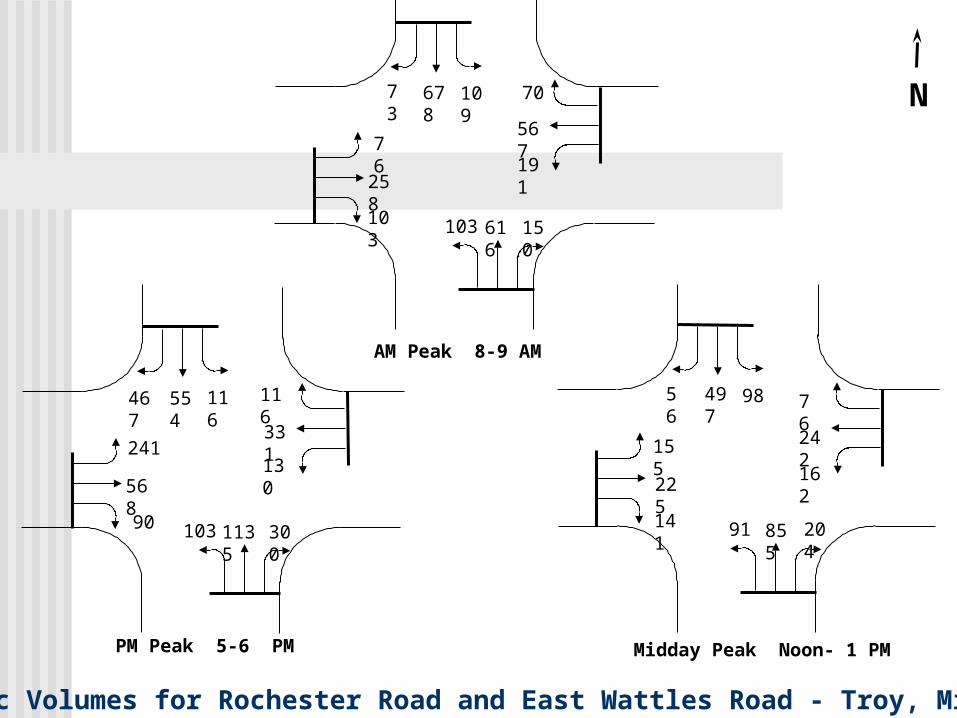
Traffic Volumes for Rochester Road and East Wattles Road - Troy, Michigan
PM Peak 5-6 PM
467 554 116
103 1135 300
241
568
90
116
331
130
Midday Peak Noon- 1 PM
56 497 98
91 855 204
155
225
141
76
242
162
AM Peak 8-9 AM
73 678 109
103 616 150
76
258
103
70
567
191

Phasing Diagram for Existing Condition Phasing Diagram for Existing Condition
E-WThrough/Right
Phase
1
E-WLeft-Turn
Phase
2
N-SThrough/Right
Phase
34
N-SLeft-Turn
Phase

Capacity Analysis For Existing Traffic Conditions
CYCLELENGTH
(SEC)
APPROACH APPROACHLOS
INTERSECTIONLOS
INTERSECTIONDELAY
(SEC/VEH)Northbound ESouthbound DEastbound F
100
Westbound C
E 48.8
Northbound ESouthbound DEastbound F
90
Westbound C
E 48.3
Northbound ESouthbound DEastbound F
80
Westbound C
E 48.4

Crash Data
TYPE OFCRASH AVERAGE NUMBER OF
CRASH 1997 1998 CRASHES PER YEAR
Rear-End 46 33 39.5Angle Intersection 1 2 1.5
Left-Turn Head-On Inter.26 33 29.5
Sideswipe
2 3 2.52 4 3
Other7 6 6.5
INJURIES 15 12 13.5TOTAL PER YEAR 87 82 84.5
YEAR
Angle Driveway
Left-Turn Head-On Dway.
3 1 2

Collision Diagrams for 1997 and 1998
LEGEND FOR COLLISION DIAGRAMS
Rear-End
Backed Into
Head On
Angle
Left-TurnHead-On
Sideswipe
Fixed Object
Parked Vehicle
Pedestrian
Other
Injury
Fatality
*

Collision Diagram for Rochester Road and E. Wattles Road for 1997
N
E. Wattles Road
Ro
ches
ter
Ro
ad
5/21
5/25 10/163/15
3/6
5/17
1/29
4/3
9/8
8/2
8/15
9/3
5/30
11/11
5/27
6/23
7/15
8/20
7/1
4/9
12/9
9/12
9/18
10/23
2/1211/1
12/30
8/13
1/30
4/21
4/29
10/16 1/8
10/11
3/9
7/28
4/163/29
2/14
4/12
5/24
7/29
1/16
10/22 6/10
9/10
4/7
2/24
5/5
3/28
5/15
6/3
9/41/29
7/8
* 8/24
6/25 6/6
7/14
5/5
11/181/17
10/19
12/22
6/20
5/2
4/7
12/24/23
7/17/19
2/2812/20
5/23
6/177/14
10/6
3/14
4/16
11/1212/81/19
9/2012/30
6/28
8/292/28
12/19
10/29

E. Wattles Road
N
Ro
ches
ter
Ro
ad
Collision Diagram for Rochester Road and E. Wattles Road for 1998
5/27
6/11
3/297/17
6/1
12/29
12/20 10/9
4/30 10/157/158/17
7/30
4/10
12/9
10/37/158/30
2/112/14
9/29
3/6
11/26
7/10
8/10
7/9
4/14
7/22
12/21
3/17
5/22
8/9
7/7
5/13
5/11
12/10
6/11
1/7
6/1
7/29
6/25
1/17
2/23
3/10
6/29
9/30
9/26
6/20
6/30
1/73/3
10/8 10/30
9/2 3/19
8/3
6/22
1/30
6/30
10/211/20
9/203/20
3/271/4
2/1710/1
2/27
6/9
1/19
4/22
9/156/24
12/23
6/30
11/9
10/1711/20
11/20
1/2 11/9 3/27

Phasing Diagram for Modified Signal Timing
E-WThrough/Right
Phase
1
E-WLeft-Turn and SB Right Turn
Phase
2
N-SThrough/Right
Phase
3 4
N-SLeft-Turn and
E-W Right Turn Phase
Signal Timing Modifications to Existing Traffic Conditions
Include right turn phase with exclusive left turn phase for:
Southbound approach
Eastbound approach
Westbound approach

Capacity Analysis For Existing Traffic Conditions with Signal Timing
Modifications
CYCLELENGTH
(SEC)
APPROACH APPROACHLOS
INTERSECTIONLOS
INTERSECTIONDELAY
(SEC/VEH)Northbound ESouthbound DEastbound F
100
Westbound C
E 47.1
Northbound ESouthbound DEastbound F
90
Westbound C
E 44.6
Northbound ESouthbound DEastbound F
80
Westbound C
E 46.9

Cycle length using Webster’s Equation
Existing Condition
C = 1.5 L + 51.0 - y
y1 = (568 + 90)/ (1800 * 2) = 0.188 or = (331 + 116)/ (1800 * 2) = 0.124
y2 = 241/1000 = 0.241 or = 130/1000 = 0.130
y3 = (1135 + 300)/(1800 * 2) = 0.40 or = (554 + 467)/(1800 * 3) = 0.189
y4 = 103/1000 = 0.103 or = 116/1000 = 0.116
Y = 0.188 + 0.241 + 0.40 + 0.116 = 0.945
C = 1.5 * (2 * 4) + 5 / ( 1-0.945) = 309 second cycle length

Calculate Splits
Assume Cycle Length = 90 seconds Split = Green interval + Yellow interval + All-red
interval
1 split = 0.188 * 90/ 0.945 = 18 sec
2 split = 0.241 * 90/ 0.945 = 23 sec
3 split = 0.40 * 90/ 0.945 = 38 sec
4 split = 0.116 * 90/ 0.945 = 11 sec

Calculate Clearance IntervalCI = t + v
2(a ± Gg)
w + L v+
Speed Limit on Rochester Road = 45 mph = 66 fpst = 1 sec, a = 10 ft/sec/sec
CINS = 1 + 66/(2 * 10) + (110 + 20)/ 66 = 4.3 sec + 2.0 sec = 6.3 seconds
Speed Limit on E. Wattles Road = 40 mph = 58.67 fpst = 1 sec, a = 10 ft/sec/sec
CIEW = 1 + 58.67/(2 * 10) + (116 + 20)/ 58.67 = 3.9 sec + 2.3 sec = 6.2 seconds

Signal Timing Plan
G = 12 sec G =18 sec G = 32 sec G = 6 secA = 4 sec A = 3 sec A = 4 sec A = 3 secR = 74 sec R = 69 sec R = 54 sec R = 81 sec AR = 2 sec AR = 2 sec AR = 2 sec AR = 2 sec
E-WThrough/Right
Phase
1
E-WLeft-Turn
Phase
2
N-SThrough/Right
Phase
34
N-SLeft-Turn
Phase

Proposed Improvements High right turn volume for
Northbound Rochester Road Include exclusive right turn lane using
existing pavement width

N
RO
CH
ES
TE
R R
OA
D
Comerica Bank
Wendy’s Restaurant
Accent Florist
Kinko’sCopy Center
Merchant of Vino Beverage
Outlet
BlockbusterVideo Store
PapaRomano’s
Pizza
Ridley’sBakery
Cafe
E. WATTLES ROAD
Shell Gasoline
Station
Proposed Intersection Diagram for Rochester Road and E. Wattles Road - Troy, Michigan
RIGHT LANE MUST TURN RIGHT Sign
NO TURN ON RED Sign
Street Name Signs
NO TURN ON RED Sign
SPEED LIMIT 45 Sign
SPEED LIMIT 45 Sign
ON
LY
ON
LY
SPEED LIMIT 40 Sign
SPEED LIMIT 40 Sign
ONLY
ONLY
ONLY
ONLY
43’
41’
7’ 8’ 34’
3’
9’ 6’
11’ 11’ 11’ 11’ 15’ 15’
11’ 10’ 10’12’ 10’
176’
24’ 65’ 138’ 22’
8’
108’
20’
173’
38’
RIGHT LANE MUST TURN RIGHT Sign
NO TURN ON RED Sign
ON
LY
ON
LY
ON
LY
ON
LY
NO TURN ON RED Sign
RIGHT LANE MUST TURN RIGHT Sign
TO I-75 Sign
12’11’
11’
11’
11’
11’
10’
11’
ONLY
ONLY
ON
LY
ON
LY
ONLY
ONLY
11’
11’
11’
RIGHT LANE MUST TURN RIGHT Sign
75’

Phasing Diagram for Proposed Improvements with Laneage Modification
E-WThrough/Right
Phase
1
E-WLeft-Turn and
N-S Right Turn Phase
2
N-SThrough/Right
Phase
3 4
N-SLeft-Turn and
E-W Right Turn Phase

Capacity Analysis With Proposed Improvements- Laneage Modifications
CYCLELENGTH
(SEC)
APPROACH APPROACHLOS
INTERSECTIONLOS
INTERSECTIONDELAY
(SEC/VEH)Northbound DSouthbound CEastbound E
100
Westbound C
D 32.9
Northbound ESouthbound CEastbound E
90
Westbound C
D 38.0
Northbound ESouthbound CEastbound E
80
Westbound C
D 39.4

Traffic Signal Warrants

Traffic signals should not be installed unless one or more of the warrants are met
Engineering studies should be performed and compared with warrants analysis should consider effects of right turn
volumes• proportion subtracted from volumes should be
based on engineering judgement

Warrants for Signalized Intersections
Warrant 1: Minimum Vehicular Volume
Number of lanes for movingtraffic at each approach
Vehicles per hour onmajor street
(total of both approaches)
Vehicles per hour on highervolume minor street approach
(one direction only)
Major Street Minor Street
1 1 500 150
2 or more 1 600 150
1 2 or more 500 200
2 or more 2 or more 600 200

satisfied when the volumes given in the table exits
• on major street and
• on the higher volume minor street
• for any 8 hours of an average day
when 85th percentile speed of major street exceeds 40 mph
• 70 % of the requirements may be used

Warrant 2: Interruption of Continuous Traffic
Number of lanes for movingtraffic at each approach
Vehicles per hour onmajor street
(total of both approaches)
Vehicles per hour on highervolume minor street approach
(one direction only)
Major Street Minor Street
1 1 750 752 or more 1 900 75
1 2 or more 750 100
2 or more 2 or more 900 100
Warrant Applies where traffic volume on major street is so high that traffic on minor intersecting street experiences excessive delay.

satisfied when, the volumes given in the table exists on the major street
on the higher-volume minor street
the signal installation will not seriously disrupt progressive traffic
flow for each of any 8 hours of an average day
when 85th percentile speed of major street exceeds 40 mph
• 70 % of the requirements may be used

Warrant 3: Minimum Pedestrian Volume
Warranted where the pedestrian volume crossing the major intersection or mid-block location during an average day is: 100 or more for each of any four hours, or 190 or more in any one hour
The pedestrian volume of the major street may be reduced as much as 50% of the values given above when predominant pedestrian crossing speed is below 3.5 fps

Warrant 4: School Crossing warranted at an established school crossing when a
traffic engineering study of the frequency and adequacy of gaps in a traffic stream shows that the number of adequate gaps in the traffic stream during the period when the children are using the crossing is less than the number of minutes in the same period.
T = 3 + + Fwidth of street
4
Where F = Number of children per group - 1 (2)
5 ( )
A minimum of 50 children should be utilizing the crossing before applying this warrant

Warrant 5: Progressive Movement
Warranted in order to maintain proper grouping of vehicles and effectively regulate group speed
The warrant is satisfied when: on a one-way street or a street which has predominantly unidirectional traffic on a two-way street
• adjacent signals do not provide the necessary degree of platooning and speed control,and the proposed and adjacent signals could constitute a progressive signal system
Should be based on the 85% speed unless study indicate other speed is more desirable

Warrant 6: Accident Experience
This warrant is satisfied when: Adequate trial of less restrictive remedies with
satisfactory observance and enforcement has failed to reduce the accident frequency; and
Five or more reported accidents, of types susceptible to correction by traffic signal control, have occurred within a 12-month period,and
There exists a volume of vehicular and pedestrian traffic not less than 80 percent of the requirements specified in the warrants
Any signal installation will not seriously disrupt progressive traffic now.

N
LEGENDRear-End
Backed Into
Head On
Angle
Left-TurnHead-On
Sideswipe
Fixed Object
Parked Vehicle
Pedestrian
Other
Injury
Fatality
**
Collision Diagram for Five Mile Road and Middlebelt Road for 1999
Five Mile Road Mid
dleb
elt
Roa
d
1
2
3
4
5
6
7
8
9
10
11
12
13
14
15
16
17
18
19
20 21
22
23
24
25
26
2728
29
30
31
32
33
34
35
36
37
38
39
40
41

N
LEGENDRear-End
Backed Into
Head On
Angle
Left-TurnHead-On
Sideswipe
Fixed Object
Parked Vehicle
Pedestrian
Other
Injury
Fatality
**
Wyo
min
g A
ven
ue
McNichols Road
Collision Diagram for Wyoming Avenue and McNichols Road for 1997
01/0301/0301/0401/04
01/0601/06
01/12
01/13
01/13
01/16
01/21
01/23
01/2601/26
01/2701/27
02/01
02/14
02/14
02/17
02/20
03/06
03/8
03/21
04/03
04/04
04/09
04/24
04/27
05/05
05/06
05/22
05/22
05/23
06/06
06/09
06/15
06/15
06/18
06/19
06/20
06/20
07/0307/0607/08
07/14
07/14
07/14
07/15
07/27
08/12
08/17
08/17
08/27
08/31
09/03
09/09
09/10
09/13
09/20
09/25
09/27
09/29
10/01
10/12
10/21
10/30
10/31
11/05
11/05
11/0711/1011/10
11/14
11/16
11/17
11/20
11/23
11/25
*11/28
**11/28 12/04
**12/04
12/08
12/19
12/2212/2412/31

Warrant 7: Systems Warrant
A major route has one or more of the following characteristics: It is part of the street or highway system that
serves as the principal network for through traffic flow;
It includes rural or suburban highways outside of, entering, or traversing a city;
It appears as a major route on an official plan, such as a major street in a transportation study

Warrant 8: Combination of Warrants
Signals may be justified where no single warrant is satisfied but where Warrants 1 and 2 are satisfied to the extent of 80 percent or more of the stated values

Warrant 9: Four Hour Volumes
Satisfied when, each of any four hours of an average day the plotted points representing the vehicles per hour on the major street (total of both approaches) and the corresponding vehicle per hour on the higher volume minor street approach (one direction only) all fall above the curve in Figure 4-3 for the existing combination of approach lanes


85 percentile speed exceeds 40 mph, the four hour volume requirement is satisfied when the plotted points referred to fall above the curve in figure 4-4 for the existing combination of approaches.


Warrant 10: Peak Hour Delay Satisfied when these conditions exist for
one hour of an average weekday Total delay experienced by traffic on a side street
controlled by STOP sign equals or exceeds four vehicle-hours for a one-lane approach and five vehicle-hours for a two-lane approach, and
The volume on the side street approach equals or exceeds 100 vph for one moving lane of traffic or 150 vph for two moving lanes, and
The total entering volume services during the hour equals or exceeds 800 vph for intersection with four (or more) approaches or 650 for intersections with three approaches

Warrant 11: Peak Hour Volume
Satisfied when, the plotted point representing the vph the major street (total of both approaches) and the corresponding vehicles per hour of the higher volume minor street approach (one direction only) for one hour of an average day falls above the curve in Figure 4-5 for the existing combination of approach lanes
When the 85th percentile speed exceeds 40mph, peak hour volume requirement is satisfied when the plotted point falls above the curve in figure 4-6 for the existing combination of approach lanes


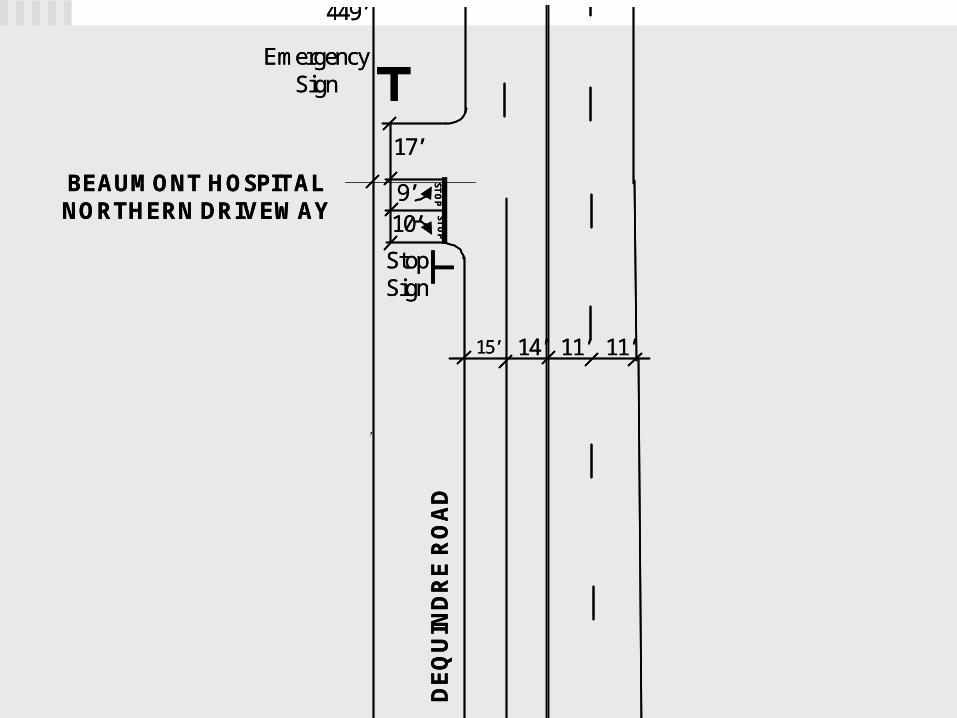
Example: Main Road with existing driveway
12-hour traffic counts Major Street is Dequindre Road (N-S)
Has 2 NB lanes and 2 SB lanes Speed limit = 45 mph 85th percentile speed = 47 mph
Minor Street is Beaumont Hospital driveway approach One right turn lane and one left turn lane
N
Figure 3b. Existing Condition Diagram of Study Area
B B
68’
335’
168’
EmergencySign
449’
96’
10’ 12’ 4’12’ 13’
KeepRight
280’
10’ 12’ 11’ 13’ 12’
Overhead Sign
Junction 59 and
VFW MemorialHighway Sign
Speed Limit45 Sign
121’
A A
DE
QU
IND
RE
RO
AD
15’ 14’ 11’ 11’
BEAUMONT HOSPITALNORTHERN DRIVEWAY
ST
OP
ST
OP
StopSign
10’9’
17’
Right Lane Ends Sign
Do Not Pass Sign

On Dequindre Road South of driveway
Beaumont Hospital and the proposed signal
location at the driveway

12-hour Traffic Volumes
TIME
DEQUINDRE ROAD (TOTAL OF NB AND SB
DIRECTIONS OF TRAFFIC) VPH
MINOR STREET APPROACH VPH
7:00-8:00 AM 615 + 821 = 1,436 127
8:00-9:00 AM 501 + 743 = 1,244 51
9:00-10:00 AM 423 + 596 = 1,019 43
10:00-11:00 AM 452 + 529 = 981 71
11:00-12:00 PM 604 + 639 = 1,243 67
12-00-1:00 PM 539 + 778 = 1,317 116
1:00-2:00 PM 658 + 683 = 1,341 79
2:00-3:00 PM 713 + 632 = 1,345 127
3:00-4:00 PM 1,058 + 742 = 1,800 325
4:00-5:00 PM 1,272 + 586 = 1,858 275
5:00-6:00 PM 1,245 + 601 = 1,846 158
6:00-7:00 PM 694 + 481 = 1,175 121

Warrant #1 Requirements (for 8 hours): Can use the 70% reduction, since
85th percentile speed > 40 mph Major Street (total of both approaches)
with 2 or more lanes • 600* 0.70 = 420 vph
Minor Street (one approach) with 2 or more lanes• 200 * 0.70 = 140 vph

TIME
DEQUINDRE ROAD (TOTAL OF NB AND SB
DIRECTIONS OF TRAFFIC) VPH
MINOR STREET APPROACH VPH
Warrant Met = Warrant No.1
Volume Criteria (Major Street = 420, Minor Street = 140)
7:00-8:00 AM 615 + 821 = 1,436 127
8:00-9:00 AM 501 + 743 = 1,244 51
9:00-10:00 AM 423 + 596 = 1,019 43
10:00-11:00 AM 452 + 529 = 981 71
11:00-12:00 PM 604 + 639 = 1,243 67
12-00-1:00 PM 539 + 778 = 1,317 116
1:00-2:00 PM 658 + 683 = 1,341 79
2:00-3:00 PM 713 + 632 = 1,345 127
3:00-4:00 PM 1,058 + 742 = 1,800 325
4:00-5:00 PM 1,272 + 586 = 1,858 275
5:00-6:00 PM 1,245 + 601 = 1,846 158
6:00-7:00 PM 694 + 481 = 1,175 121
Warrant No. 1 is not met

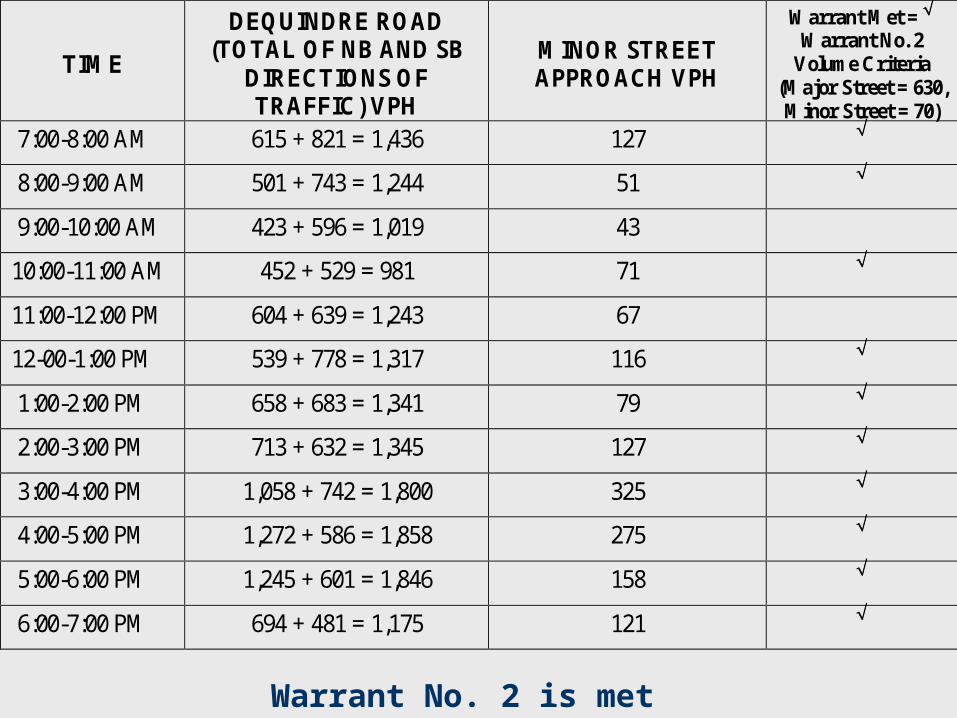
Warrant #2 Requirements (for 8 hours): Can use the 70% reduction, since
85th percentile speed > 40 mph Major Street (total of both approaches)
with 2 or more lanes • 900* 0.70 = 630 vph
Minor Street (one approach) with 2 or more lanes• 100 * 0.70 = 70 vph
TIME
DEQUINDRE ROAD (TOTAL OF NB AND SB
DIRECTIONS OF TRAFFIC) VPH
MINOR STREET APPROACH VPH
Warrant Met = Warrant No. 2
Volume Criteria (Major Street = 630, Minor Street = 70)
7:00-8:00 AM 615 + 821 = 1,436 127
8:00-9:00 AM 501 + 743 = 1,244 51
9:00-10:00 AM 423 + 596 = 1,019 43
10:00-11:00 AM 452 + 529 = 981 71
11:00-12:00 PM 604 + 639 = 1,243 67
12-00-1:00 PM 539 + 778 = 1,317 116
1:00-2:00 PM 658 + 683 = 1,341 79
2:00-3:00 PM 713 + 632 = 1,345 127
3:00-4:00 PM 1,058 + 742 = 1,800 325
4:00-5:00 PM 1,272 + 586 = 1,858 275
5:00-6:00 PM 1,245 + 601 = 1,846 158
6:00-7:00 PM 694 + 481 = 1,175 121
Warrant No. 2 is met

Warrant # 9 Requirement (4 hours) Use Figure 4-4 since 85th percentile
speed exceeds 40 mph lower threshold volume for a minor
street approach with two or more lanes is 80 vph, when the traffic volumes on the major street exceed 875 vph.

TIME
DEQUINDRE ROAD (TOTAL OF NB AND SB
DIRECTIONS OF TRAFFIC) VPH
MINOR STREET APPROACH VPH
Warrant Met = Warrant No.9
Volume Criteria (Major Street = 875, Minor Street = 80)
7:00-8:00 AM 615 + 821 = 1,436 127
8:00-9:00 AM 501 + 743 = 1,244 51
9:00-10:00 AM 423 + 596 = 1,019 43
10:00-11:00 AM 452 + 529 = 981 71
11:00-12:00 PM 604 + 639 = 1,243 67
12-00-1:00 PM 539 + 778 = 1,317 116
1:00-2:00 PM 658 + 683 = 1,341 79
2:00-3:00 PM 713 + 632 = 1,345 127
3:00-4:00 PM 1,058 + 742 = 1,800 325
4:00-5:00 PM 1,272 + 586 = 1,858 275
5:00-6:00 PM 1,245 + 601 = 1,846 158
6:00-7:00 PM 694 + 481 = 1,175 121
Warrant No. 9 is met

Warrant # 11 Requirement (one hour): Use Figure 4-6 since 85th percentile
speed of the major street exceeds 40 mph lower threshold volume for a major
street approach with two lanes is 100 vph when the major street volume is greater than 1200 vph.

Warrant No. 11 is met
TIME
DEQUINDRE ROAD (TOTAL OF NB AND SB
DIRECTIONS OF TRAFFIC) VPH
MINOR STREET APPROACH VPH
Warrant Met = Warrant No.11
Volume Criteria (Major Street = 1200, Minor Street = 100)
7:00-8:00 AM 615 + 821 = 1,436 127
8:00-9:00 AM 501 + 743 = 1,244 51
9:00-10:00 AM 423 + 596 = 1,019 43
10:00-11:00 AM 452 + 529 = 981 71
11:00-12:00 PM 604 + 639 = 1,243 67
12-00-1:00 PM 539 + 778 = 1,317 116
1:00-2:00 PM 658 + 683 = 1,341 79
2:00-3:00 PM 713 + 632 = 1,345 127
3:00-4:00 PM 1,058 + 742 = 1,800 325
4:00-5:00 PM 1,272 + 586 = 1,858 275
5:00-6:00 PM 1,245 + 601 = 1,846 158
6:00-7:00 PM 694 + 481 = 1,175 121

Example: Existing Road with Proposed Driveway
Proposed developments may want a traffic signal installed at a driveway location
Traffic impact analysis using ITE “Trip Generation” manual Provides rates to predict number of trips generated
by development Provides rates only for peak hours On this basis, only Warrant No. 11 (Peak Hour
Volumes) is applicable

However, for Shopping Center Developments ITE published hourly percentages (12 hours) for
variation in traffic throughout:• Typical weekday• Typical weekend days
The rates can be used to predict traffic for a twelve hour period Can perform a warrant study based on other
warrants, instead of only Warrant No. 11


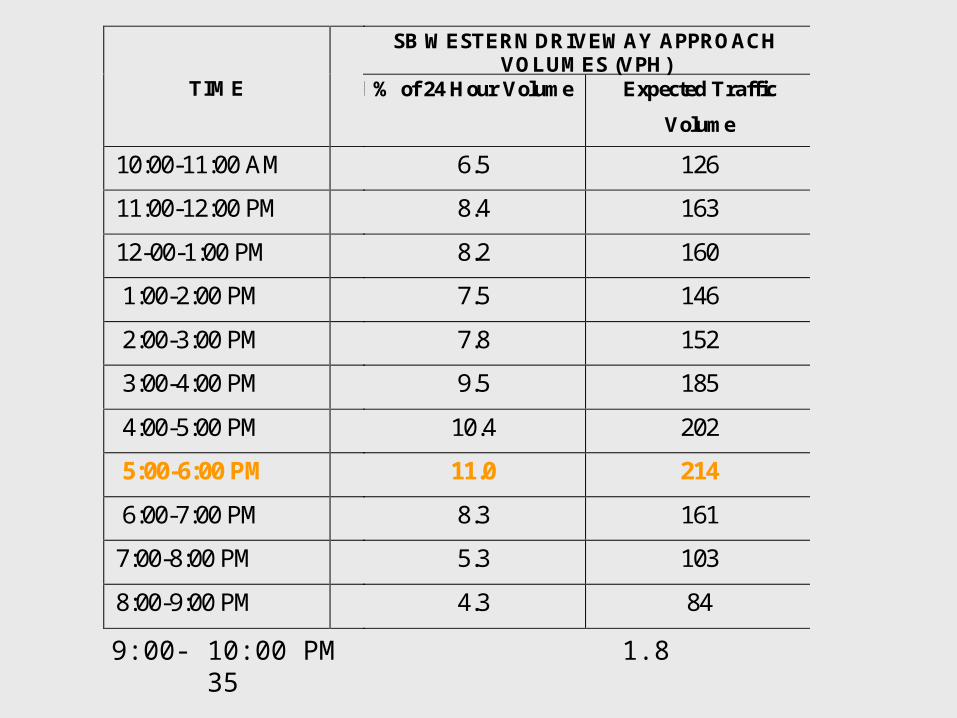
For example: Number of trips predicted exiting the driveway
approach during the PM peak hour (5-6 PM) = 214 vph
Table 1 shows that from 5-6 PM The % of exiting traffic = 11%
Use this proportion, along with the percent exiting trips for the remaining hours of the day To calculate the predicted # of exiting trips for the
rest of the day

The percent of exiting trips at 10-11 AM is 6.5% Average weekday < 100,000 sq. ft. of GLA
Thus, the predicted # of exiting trips (x10-11) will be
21411
Thus, X10-11 = 126 vph6.5
=X10-11
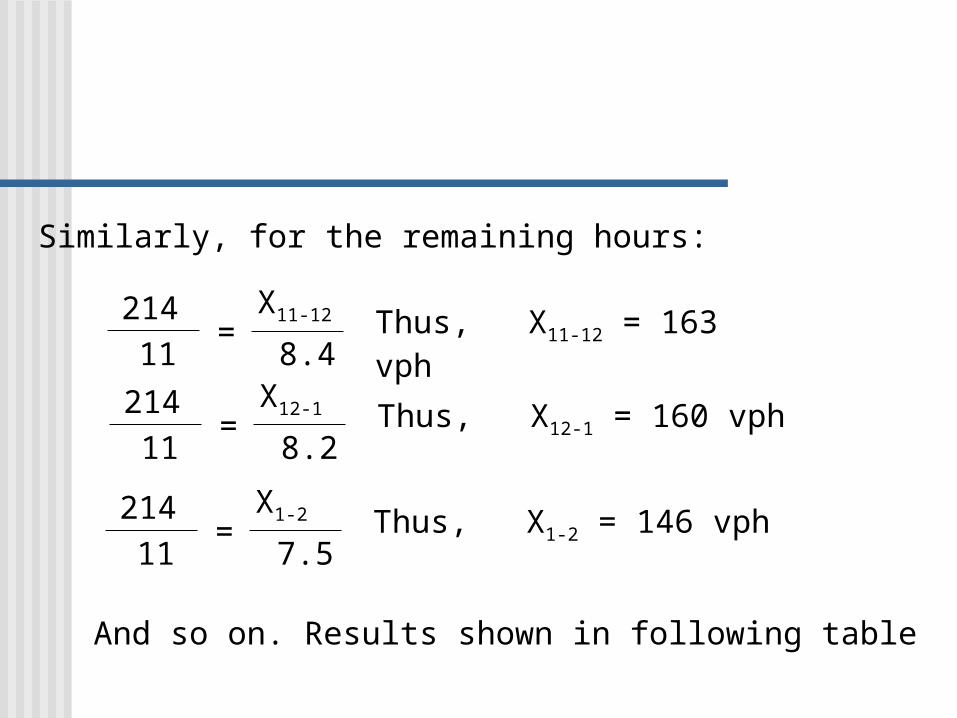
21411
Thus, X11-12 = 163 vph8.4
=X11-12
Similarly, for the remaining hours:
21411
Thus, X12-1 = 160 vph8.2
=X12-1
21411
Thus, X1-2 = 146 vph7.5
=X1-2
And so on. Results shown in following table
SB WESTERN DRIVEWAY APPROACH VOLUMES (VPH)
% of 24 Hour Volume Expected Traffic
Volume
6.5 126
8.4 163
8.2 160
7.5 146
7.8 152
9.5 185
10.4 202
11.0 214
8.3 161
5.3 103
4.3 84
TIME
M-29 TRAFFIC VOLUMES (TOTAL OF EB AND WB
DIRECTIONS OF TRAFFIC) VPH
(Source- 1999 MDOT Count)
10:00-11:00 AM 597
11:00-12:00 PM 642
12-00-1:00 PM 900
1:00-2:00 PM 910
2:00-3:00 PM 831
3:00-4:00 PM 878
4:00-5:00 PM 958
5:00-6:00 PM 994
6:00-7:00 PM 983
7:00-8:00 PM 889
8:00-9:00 PM 684
9:00- 10:00 PM 1.8 35

Now, perform a warrant analysis
12-hour traffic counts on major road and predicted 12-hour volumes for driveway approach
Major Street is M-29 Road (E-W) Has 1EB lane and 1 WB lane with proposed
center lane for left turns Speed limit = 45 mph
Minor Street is proposed retail center driveway approach Two lanes

Proposed signal location for commercial development ,
across from existing driveway
Existing driveway and M-29

12-hour traffic volumes (Existing volumes on major street and predicted
volumes on minor street)SB WESTERN DRIVEWAY APPROACH
VOLUMES (VPH) TIME
M-29 TRAFFIC VOLUMES (TOTAL OF EB AND WB
DIRECTIONS OF TRAFFIC) VPH
(Source- 1999 MDOT Count)
% of 24 Hour Volume Expected Traffic
Volume
10:00-11:00 AM 597 6.5 126
11:00-12:00 PM 642 8.4 163
12-00-1:00 PM 900 8.2 160
1:00-2:00 PM 910 7.5 146
2:00-3:00 PM 831 7.8 152
3:00-4:00 PM 878 9.5 185
4:00-5:00 PM 958 10.4 202
5:00-6:00 PM 994 11.0 214
6:00-7:00 PM 983 8.3 161
7:00-8:00 PM 889 5.3 103
8:00-9:00 PM 684 4.3 84
9:00-10:00 PM 488 1.8 35
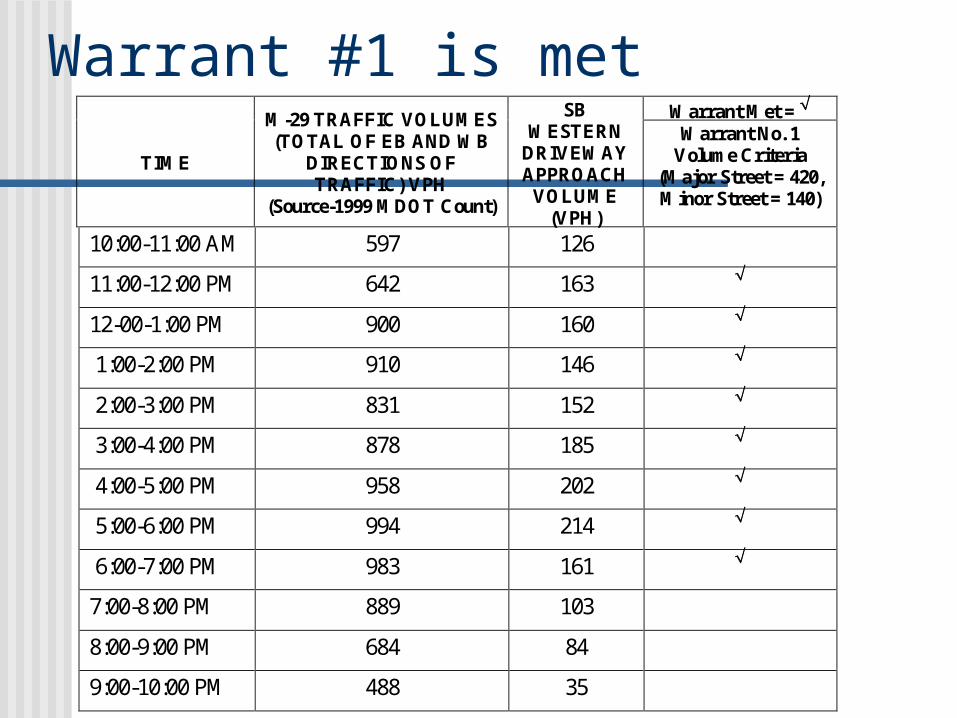
Warrant #1 is metWarrant Met =
TIME
M-29 TRAFFIC VOLUMES (TOTAL OF EB AND WB
DIRECTIONS OF TRAFFIC) VPH
(Source-1999 MDOT Count)
SB WESTERN
DRIVEWAY APPROACH
VOLUME (VPH)
Warrant No. 1 Volume Criteria
(Major Street = 420, Minor Street = 140)
10:00-11:00 AM 597 126
11:00-12:00 PM 642 163
12-00-1:00 PM 900 160
1:00-2:00 PM 910 146
2:00-3:00 PM 831 152
3:00-4:00 PM 878 185
4:00-5:00 PM 958 202
5:00-6:00 PM 994 214
6:00-7:00 PM 983 161
7:00-8:00 PM 889 103
8:00-9:00 PM 684 84
9:00-10:00 PM 488 35

Warrant #2 is metWarrant Met =
TIME
M-29 TRAFFIC VOLUMES (TOTAL OF EB AND WB
DIRECTIONS OF TRAFFIC) VPH
(Source- 1999 MDOT Count)
SB WESTERN DRIVEWAY APPROACH
VOLUME (VPH)
Warrant No. 2 Volume Criteria
(Major Street = 630, Minor Street = 70)
10:00-11:00 AM 597 126
11:00-12:00 PM 642 163
12-00-1:00 PM 900 160
1:00-2:00 PM 910 146
2:00-3:00 PM 831 152
3:00-4:00 PM 878 185
4:00-5:00 PM 958 202
5:00-6:00 PM 994 214
6:00-7:00 PM 983 161
7:00-8:00 PM 889 103
8:00-9:00 PM 684 84
9:00-10:00 PM 488 35

Warrant #9 is metWarrant Met =
TIME
M-29 TRAFFIC VOLUMES (TOTAL OF EB AND WB
DIRECTIONS OF TRAFFIC) VPH
(Source- 1999 MDOT Count)
SB WESTERN DRIVEWAY APPROACH
VOLUME (VPH)
Warrant No. 9 Volume Criteria
(Major Street = 875, Minor Street = 80)
10:00-11:00 AM 597 126
11:00-12:00 PM 642 163
12-00-1:00 PM 900 160
1:00-2:00 PM 910 146
2:00-3:00 PM 831 152
3:00-4:00 PM 878 185
4:00-5:00 PM 958 202
5:00-6:00 PM 994 214
6:00-7:00 PM 983 161
7:00-8:00 PM 889 103
8:00-9:00 PM 684 84
9:00-10:00 PM 488 35

Warrant # 11is not met Volumes on the major street do not meet requirements
Warrant Met =
TIME
M-29 TRAFFIC VOLUMES (TOTAL OF EB AND WB
DIRECTIONS OF TRAFFIC) VPH
(Source- 1999 MDOT Count)
SB WESTERN DRIVEWAY APPROACH
VOLUME (VPH)
Warrant No. 11 Volume Criteria
(Major Street = 1200, Minor Street = 100)
10:00-11:00 AM 597 126
11:00-12:00 PM 642 163
12-00-1:00 PM 900 160
1:00-2:00 PM 910 146
2:00-3:00 PM 831 152
3:00-4:00 PM 878 185
4:00-5:00 PM 958 202
5:00-6:00 PM 994 214
6:00-7:00 PM 983 161
7:00-8:00 PM 889 103
8:00-9:00 PM 684 84
9:00-10:00 PM 488 35

Left-Turn Phasing Warrants at Signalized Intersections
Warrants based on accidents 3-5 left-turn crashes/year N
LEGENDRear-End
Backed Into
Head On
Angle
Left-TurnHead-On
Sideswipe
Fixed Object
Parked Vehicle
Pedestrian
Other
Injury
Fatality
*
Kal
amaz
oo
Ave
nu
e
Burton street
Collision Diagram for Burton Street and Kalamazoo Avenue from April 1997- March 1998(12 months) before data
1
2
3
*4
5
6
7
8
9
10
11
12
13
14
15
16
17
18
19
20
21
22
23
24
*25
26
27
28
29
30
31
32
33
34
35
36
37
38
39
40
4142
N
LEGENDRear-End
Backed Into
Head On
Angle
Left-TurnHead-On
Sideswipe
Fixed Object
Parked Vehicle
Pedestrian
Other
Injury
Fatality
**
Kal
amaz
oo
Ave
nu
e
Burton street
Collision Diagram for Burton Street and Kalamazoo Avenue from April 1997- March 1998(12 months) before data
1
2
3
**4
5
6
7
8
9
10
11
12
13
14
15
16
17
18
19
20
21
22
23
24
**25
26
27
28
29
30
31
32
33
34
35
36
37
38
39
40
4142
Correctable LTHO crashes/year ≥ 4 LTHO crashes/ 2 years ≥ 6

Left-Turn Phasing Warrants at Signalized Intersections (ITE Journal April 1986)
Warrants based on volumes product of left turn and opposing volume
• 2 lane exceeds 30,000-50,0000• 4 lane exceeds 50,000-100,000
NUMBER OF OPPOSING
LANES
PRODUCT
1 ≥ 45,000
2 ≥ 90,000
3 ≥ 135,000

Warrants based on volumes sum of left turn and opposing volume
NUMBER OF OPPOSING
LANES
PRODUCT
1 ≥ 500
2 ≥ 900
3 ≥ 1000

Example
180 vph
590 vph
Product Rule:180 * 590 = 106,200For 2 opposing lanes, yes the left-turn phase is warranted (≥ 90,000)
Sum Rule:180 + 590 = 770For 2 opposing lanes, the left-turn phase is not warranted (< 900)

minimum left-turn hourly volumes- • exceeds 125 vph
minimum left-turn volume per cycle• exceeds 2 vehicles/cycle

Delay Analysis Maximum Allowable delay = 96 sec/veh
OR minimum total delay = 1.5 vehicle-hours

Other warrants geometric design- sight distance
inadequate signal system- progressive
movement/adjacent intersection phasing traffic conflict- exceeds 10-14/hour approach speed- of opposing traffic
exceeds 45 mph