Embed Size (px)
Citation preview
CE 466 Project Report Tunç Kulaksız – Alpay Burak Demiryürek
1
Content
1. Determination of Dam Axis Location
2. Calculation of Reservoir Area and Volume
3. Fetch Calculation
a. Freeboard
i. U.S Bureau of Reclamations Formulae
ii. Stefenson Formulae
b. Wave Run-up
c. Wave Set-up
4. Dam and Foundation’s Maximum Cross Section, Longitudinal Section and Plan View
5. Approximate Dam Material Amounts
a. Approximate Clay Amount
b. Approximate Earth Amount
6. Soil Classification
a. First Layer
b. Second Layer
7. Spillway Design
8. Derivation Tunnel Design
9. Total Cost of Dam
a. Diaphram Wall
b. Slurry Cut-off Wall
c. Transportation
10. References
CE 466 Project Report Tunç Kulaksız – Alpay Burak Demiryürek
2
Determination of Dam Axis Location
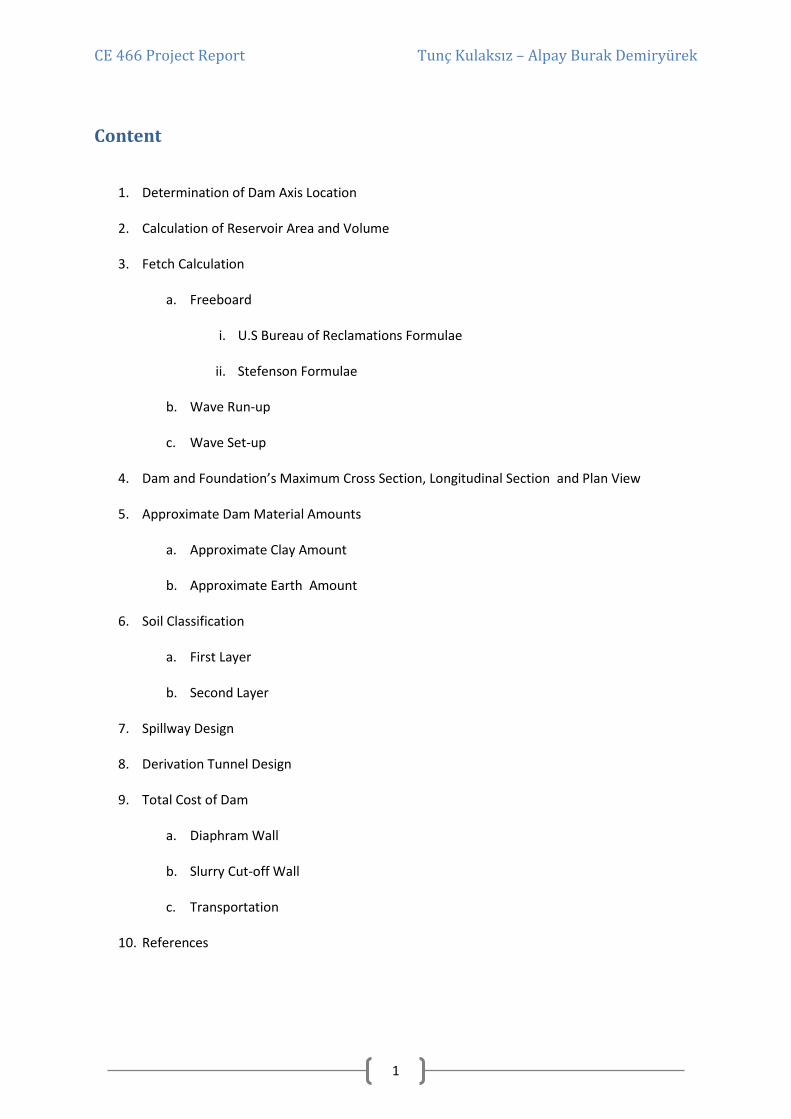
The map of area is given to us. According to this map, we tried to locate our dam axis
in order to achieve water retention at 1058.00 m. Also, we consider some other factors during
determination of dam axis location. First of all, we tried to place dam axis at the narrowest
section of river. Secondly, we tried to locate it as being perpendicular to the contour lines as
much as possible. Thirdly, we considered the following steps like constructions of diversion
tunnel and spillway.
Figure 1 : Dam Axis
The above map indicates the dam axis of project. It was drawn with yellow layer.
Length of this axis is 579 m. We have a chance to draw short diversion tunnel and place
spillway at appropriate place by selecting this axis location. Also, the water level is 1060.00
m because the edges of this axis touch the 1060.00 m contours.
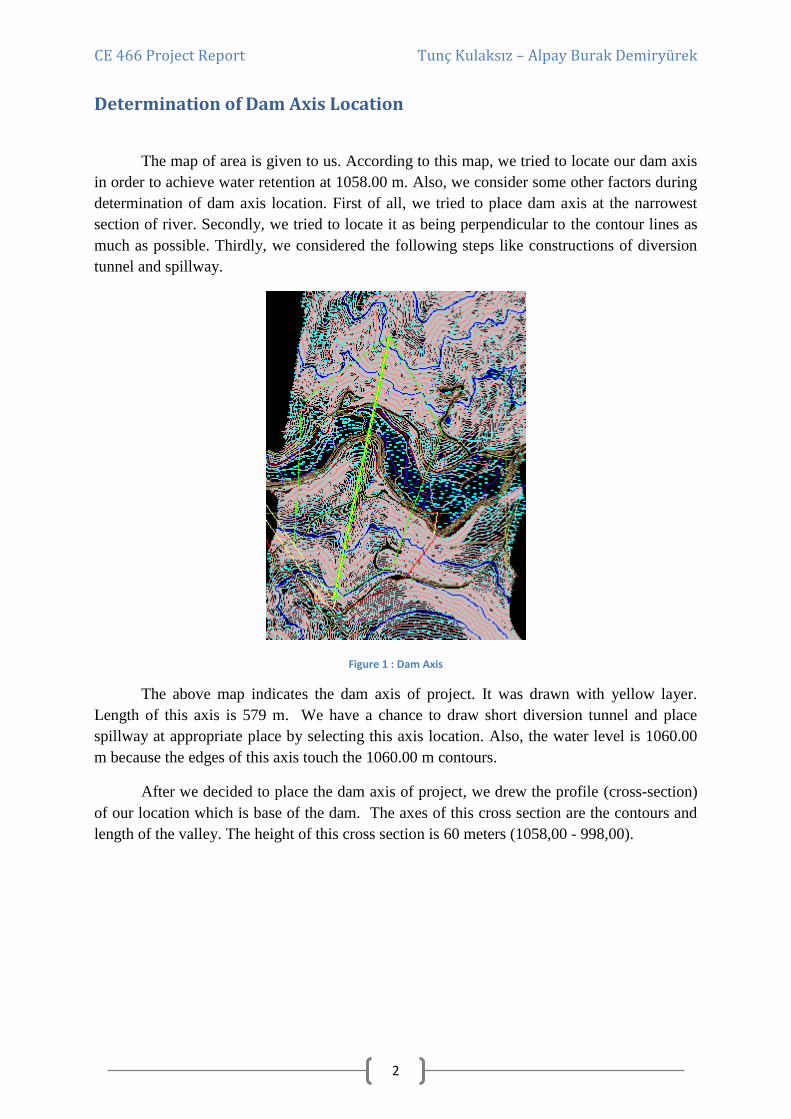
After we decided to place the dam axis of project, we drew the profile (cross-section)
of our location which is base of the dam. The axes of this cross section are the contours and
length of the valley. The height of this cross section is 60 meters (1058,00 - 998,00).
CE 466 Project Report Tunç Kulaksız – Alpay Burak Demiryürek
3
Figure 2 : Profile View
Calculation of Reservoir Area and Volume
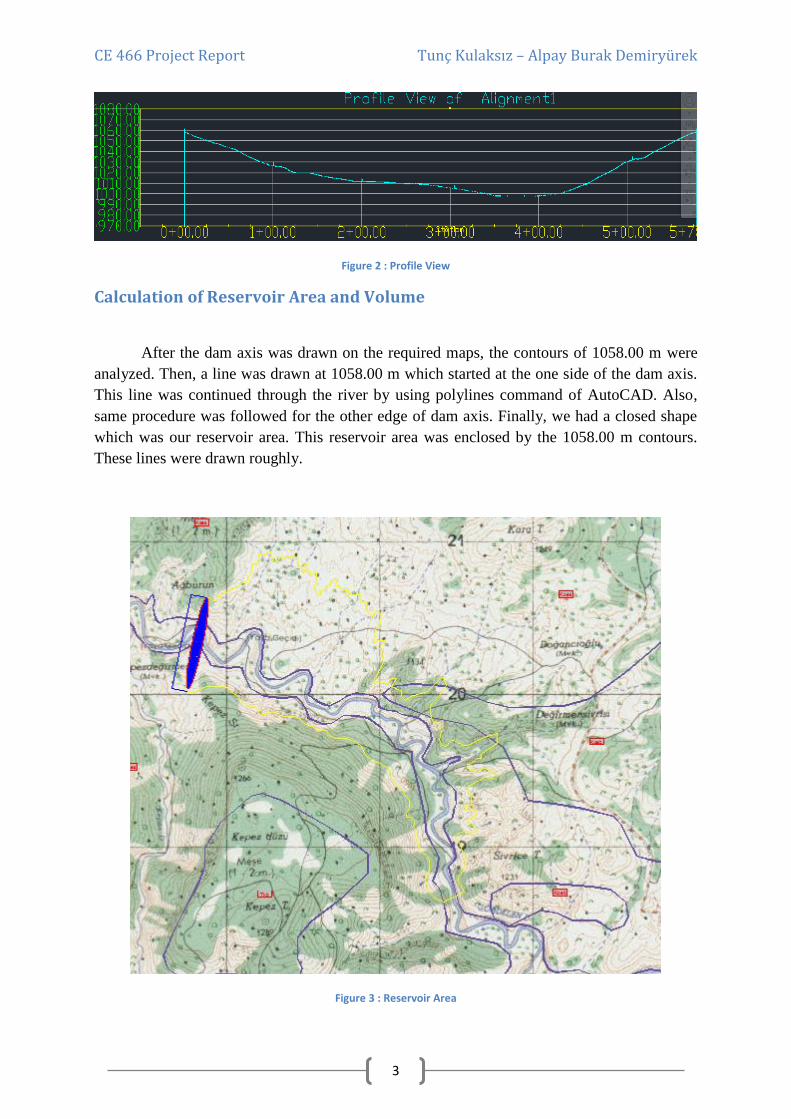
After the dam axis was drawn on the required maps, the contours of 1058.00 m were
analyzed. Then, a line was drawn at 1058.00 m which started at the one side of the dam axis.
This line was continued through the river by using polylines command of AutoCAD. Also,
same procedure was followed for the other edge of dam axis. Finally, we had a closed shape
which was our reservoir area. This reservoir area was enclosed by the 1058.00 m contours.
These lines were drawn roughly.
Figure 3 : Reservoir Area
CE 466 Project Report Tunç Kulaksız – Alpay Burak Demiryürek
4
At the figure, the purple area represents our dam body and the yellow line
represents the limits of reservoir area. Reservoir area is the area which is inside these yellow
lines. The area of this reservoir area was calculated by using command of AutoCAD.
Area of Reservoir= 1.37 km^2
Then, the volume was calculated with basic mathematics.
Volume= (Area*Height)/2
Volume= 41.2 e6 m^3
Fetch Calculation
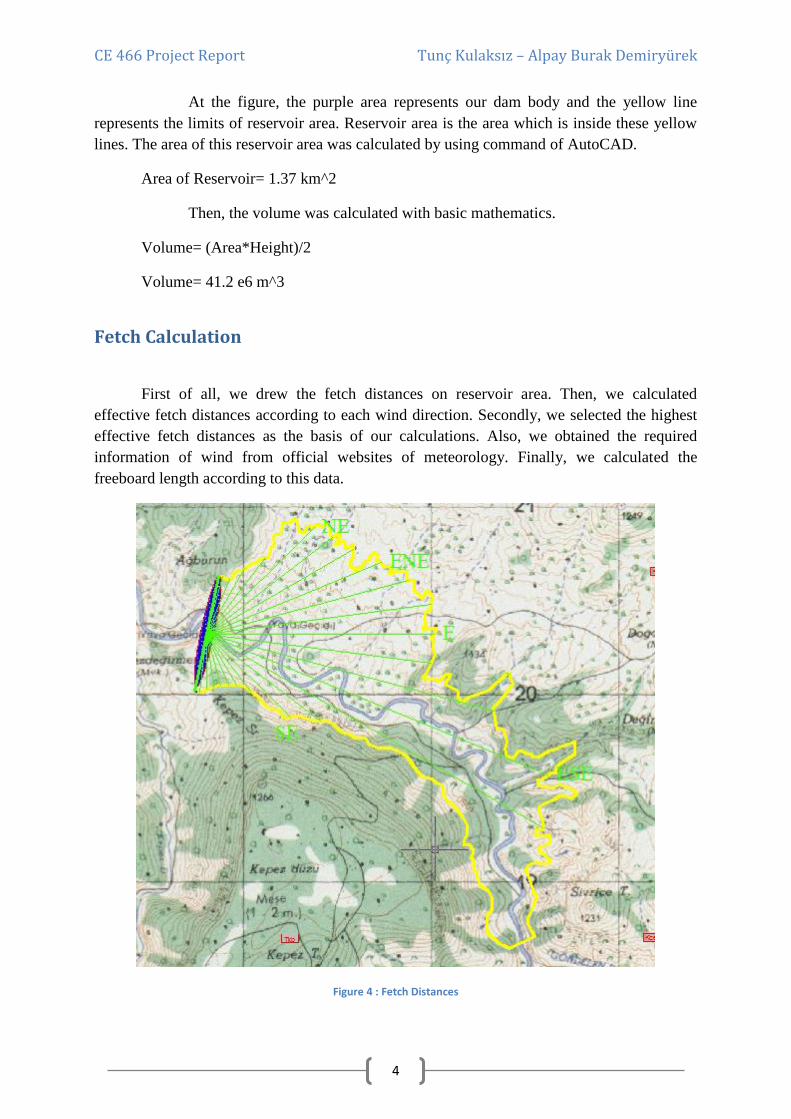
First of all, we drew the fetch distances on reservoir area. Then, we calculated
effective fetch distances according to each wind direction. Secondly, we selected the highest
effective fetch distances as the basis of our calculations. Also, we obtained the required
information of wind from official websites of meteorology. Finally, we calculated the
freeboard length according to this data.
Figure 4 : Fetch Distances
CE 466 Project Report Tunç Kulaksız – Alpay Burak Demiryürek
5
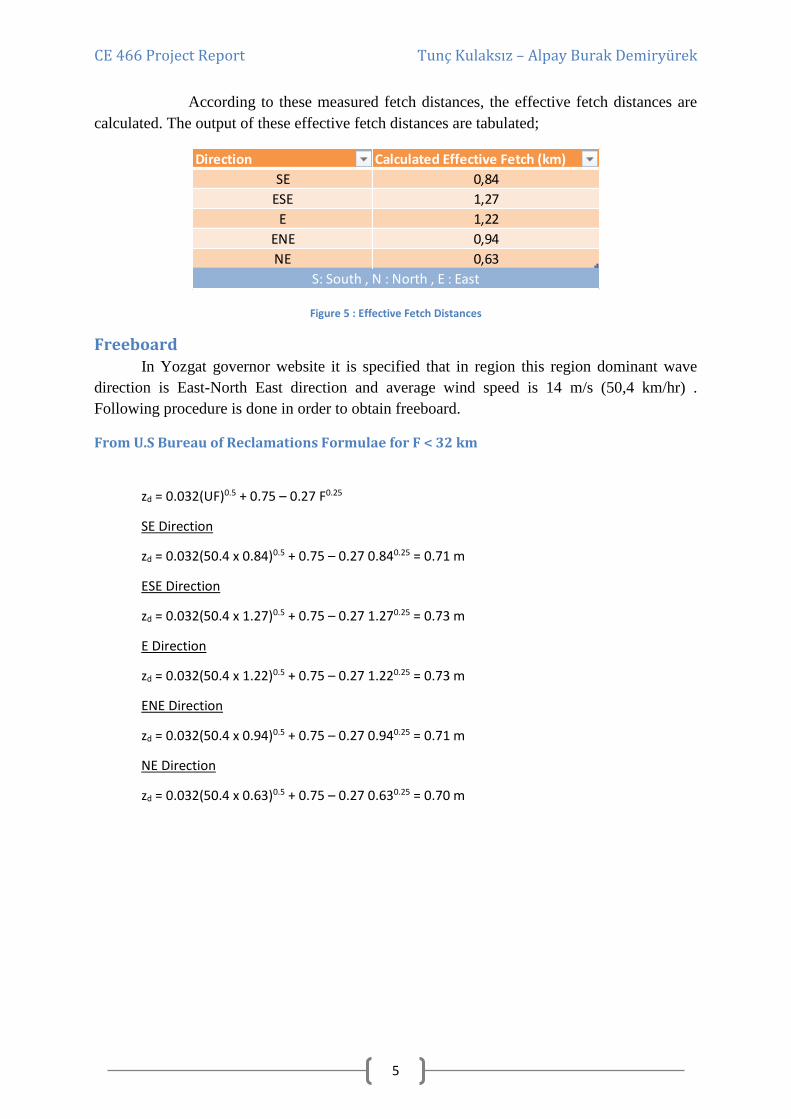
According to these measured fetch distances, the effective fetch distances are
calculated. The output of these effective fetch distances are tabulated;
Figure 5 : Effective Fetch Distances
Freeboard In Yozgat governor website it is specified that in region this region dominant wave
direction is East-North East direction and average wind speed is 14 m/s (50,4 km/hr) .
Following procedure is done in order to obtain freeboard.
From U.S Bureau of Reclamations Formulae for F < 32 km
zd = 0.032(UF)0.5 + 0.75 – 0.27 F0.25
SE Direction
zd = 0.032(50.4 x 0.84)0.5 + 0.75 – 0.27 0.840.25 = 0.71 m
ESE Direction
zd = 0.032(50.4 x 1.27)0.5 + 0.75 – 0.27 1.270.25 = 0.73 m
E Direction
zd = 0.032(50.4 x 1.22)0.5 + 0.75 – 0.27 1.220.25 = 0.73 m
ENE Direction
zd = 0.032(50.4 x 0.94)0.5 + 0.75 – 0.27 0.940.25 = 0.71 m
NE Direction
zd = 0.032(50.4 x 0.63)0.5 + 0.75 – 0.27 0.630.25 = 0.70 m
Direction Calculated Effective Fetch (km)
SE 0,84
ESE 1,27
E 1,22
ENE 0,94
NE 0,63
S: South , N : North , E : East
CE 466 Project Report Tunç Kulaksız – Alpay Burak Demiryürek
6
From STEFENSON FORMULAE, which is most commonly used relationship for F < 18 km
zd = 0.75 + 0.34 F0.5 – 0.26 F0.25
SE Direction
zd = 0.75 + 0.34 x 0.840.5 – 0.26 x 0.840.25 = 0.8127 m
ESE Direction
zd = 0.75 + 0.34 x 1.270.5 – 0.26 x 1.270.25 = 0.8572 m
E Direction
zd = 0.75 + 0.34 x 1.220.5 – 0.26 x 1.220.25 = 0.8523 m
ENE Direction
zd = 0.75 + 0.34 x 0.940.5 – 0.26 x 0.940.25 = 0.8236 m
NE Direction
zd = 0.75 + 0.34 x 0.630.5 – 0.26 x 0.630.25 = 0.7882 m
It can be concluded from above computations, since stefenson formulae takes wind
velocity as approximately 100 km/hr in computations, we’ve taken maximum wave height is
85.72 cm approximately 86 cm to be on safe side.
Wave Run-Up
Since the wave characteristics for the region is unknown. Wave run-up is taken as half
of the wave height. That is
𝑧𝑟 = 0.5 𝑥 0.86 = 0.43 𝑚
Wave Set-Up
𝑧𝑠 =𝑈2 ∗ 𝐹
63000 ∗ 58= 8.82 𝑥 10−4 𝑚
Wave set up is neglected since it is very small comparing to wave height and and wave
run-up.
Thus total freeboard required is = 0.43 + 0.86 = 1.3 meters.
CE 466 Project Report Tunç Kulaksız – Alpay Burak Demiryürek
7
Dam and Foundation’s Maximum Cross Section, Longitudinal Section
and Plan View
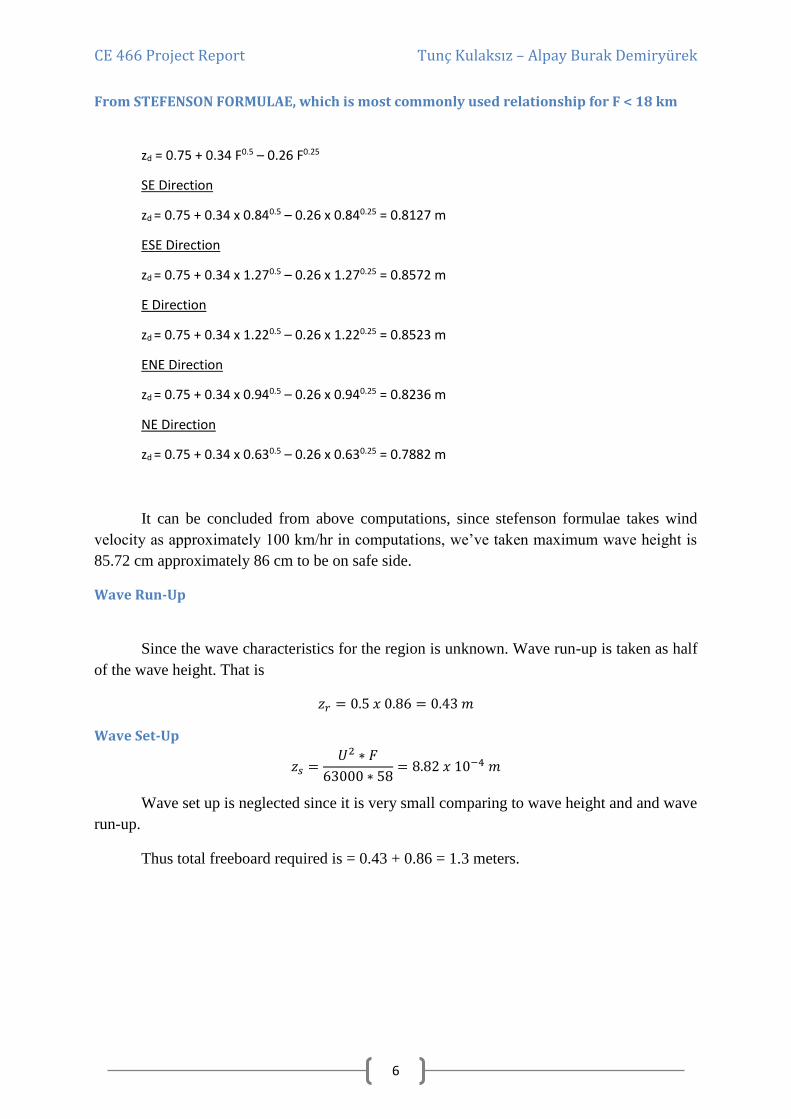
In order to visualize the design and make correct calculation, the cross section,
longitudinal section and plan view of dam were drawn. Also, the cross section of foundation
was drawn. These drawings can be found here;
Figure 6 : Cross Section of Dam and Foundation
Yellow line represents the dam body. The white line represents the eater
elevation. Moreover, the red and blue lines represent the soil layers.
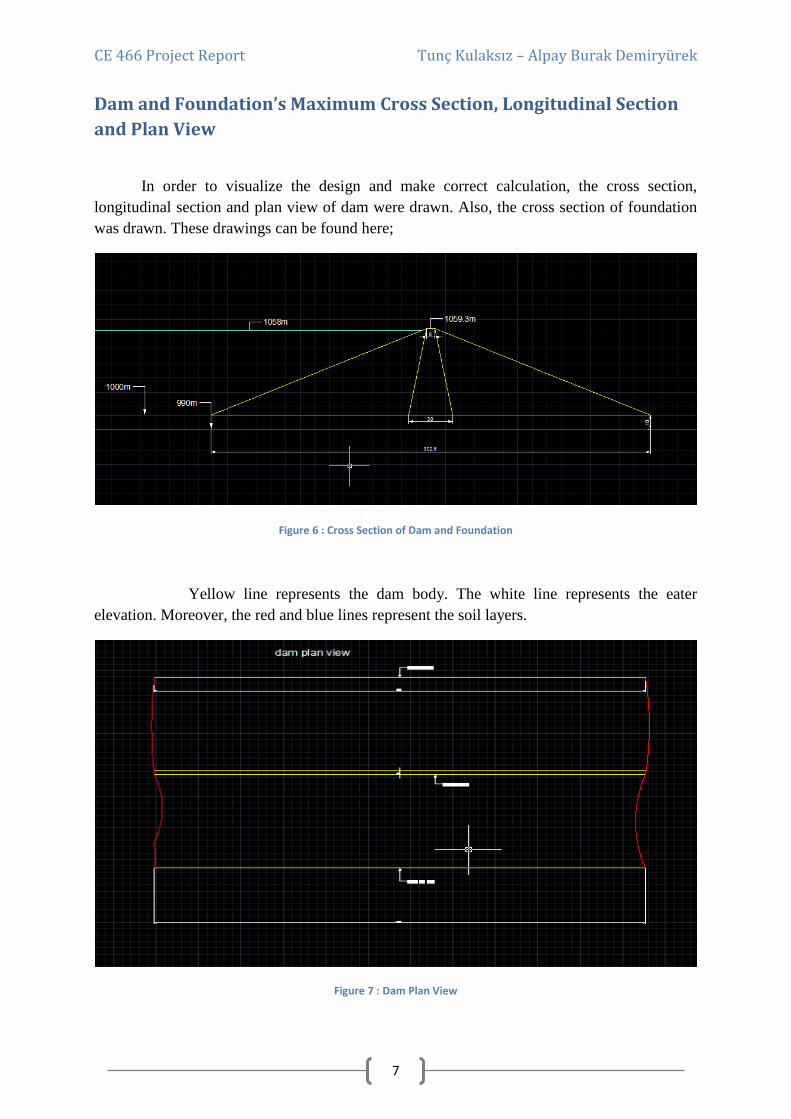
Figure 7 : Dam Plan View
CE 466 Project Report Tunç Kulaksız – Alpay Burak Demiryürek
8
The yellow lines represent the dam body and the red lines represent the adjacent hills.
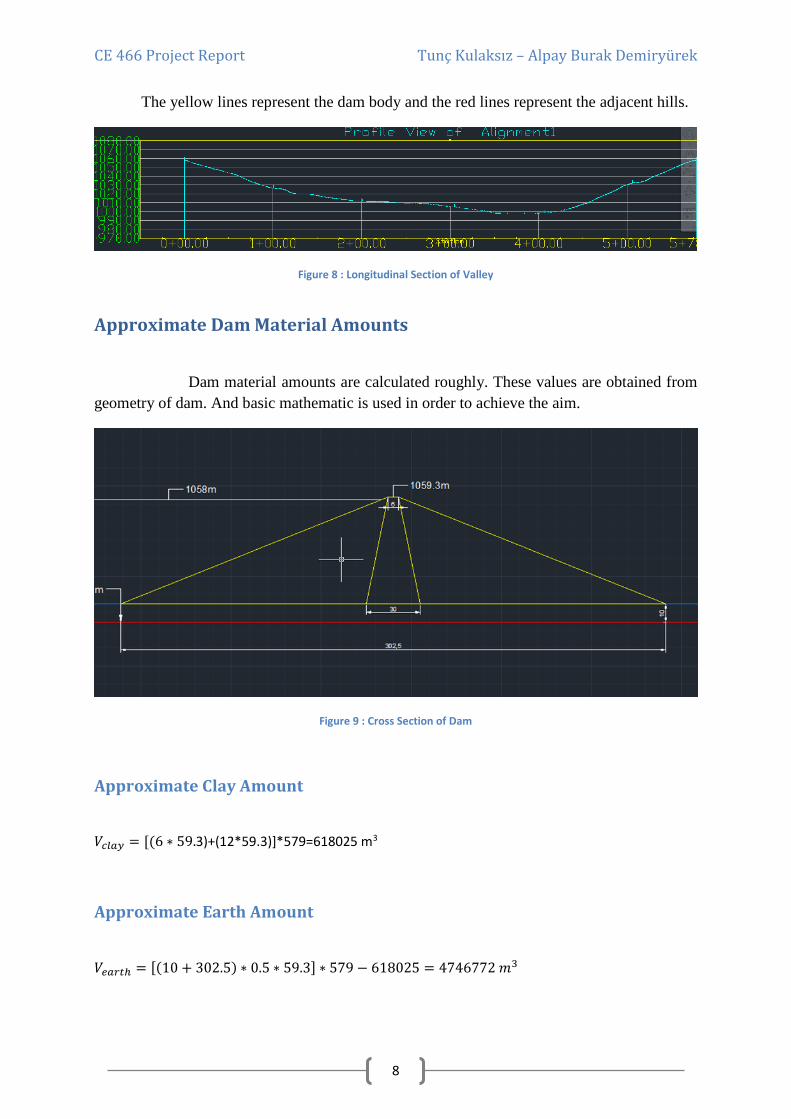
Figure 8 : Longitudinal Section of Valley
Approximate Dam Material Amounts
Dam material amounts are calculated roughly. These values are obtained from
geometry of dam. And basic mathematic is used in order to achieve the aim.
Figure 9 : Cross Section of Dam
Approximate Clay Amount
𝑉𝑐𝑙𝑎𝑦 = [(6 ∗ 59.3)+(12*59.3)]*579=618025 m3
Approximate Earth Amount
𝑉𝑒𝑎𝑟𝑡ℎ = [(10 + 302.5) ∗ 0.5 ∗ 59.3] ∗ 579 − 618025 = 4746772 𝑚3
CE 466 Project Report Tunç Kulaksız – Alpay Burak Demiryürek
9
We think that we should obtain some portion of these materials from the
excavation works of dam construction. However, these values are huge and we cannot obtain
all of them from excavation work of construction field. Therefore, the remaining parts of
these materials are obtained from the nearest places. We think that we should select the
nearest places for obtaining these materials because transportation cost can be huge. In order
to decrease the transportation cost, we should look nearest place for materials.
Soil Classification
The given tables and seismic method results were used in order to obtain soil types.
According to these analyses;
First Layer
According to seismic test results
Vp = 700 m/sec = 0.7 km/sec
Vs = 250 m/sec = 0.25 km/sec Indicates that the soil is “SAND”.
In Table – I: Vs = 250 m/sec is in between 180 and 360. Thus, soil can be
classified as Hard/Dense Soil (Class D). Sand is a cohesionless soil type, thus from Table – II
Vs in layer - I corresponds “loose” soil.
Second Layer
Vp = 700 m/sec = 0.7 km/sec
In Table – I: Vs = 470 m/sec is in between 360 and 760. Thus, soil can be
classified as Very Dense/Stiff Soil or Soft Rock (Class C). From Table – II Vs in layer - II
corresponds “medium - dense” soil.
Since, the densities of the soil layers are not given, classification of layers according to
Table – III cannot be done.
CE 466 Project Report Tunç Kulaksız – Alpay Burak Demiryürek
10
Note: Although, there are conflicts between soil types indicated in Table – I and Table
– II, soil classification is done in each layers according to both. If the statement Vs30 values
are required to use in Table – I, then;
For Layer – I Soil Type “Loose Sand”
For Layer – II Soil Type “Medium-Dense Sand”
Spillway Design
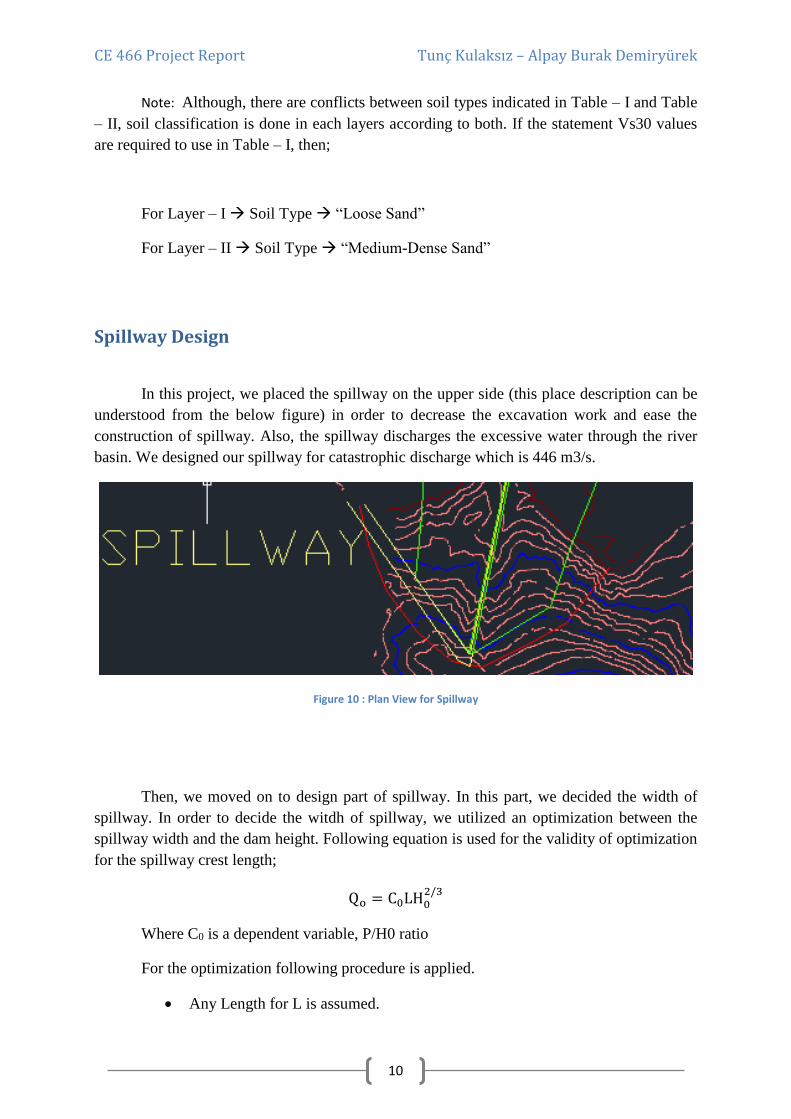
In this project, we placed the spillway on the upper side (this place description can be
understood from the below figure) in order to decrease the excavation work and ease the
construction of spillway. Also, the spillway discharges the excessive water through the river
basin. We designed our spillway for catastrophic discharge which is 446 m3/s.
Figure 10 : Plan View for Spillway
Then, we moved on to design part of spillway. In this part, we decided the width of
spillway. In order to decide the witdh of spillway, we utilized an optimization between the
spillway width and the dam height. Following equation is used for the validity of optimization
for the spillway crest length;
Qo = C0LH02/3
Where C0 is a dependent variable, P/H0 ratio
For the optimization following procedure is applied.
Any Length for L is assumed.
CE 466 Project Report Tunç Kulaksız – Alpay Burak Demiryürek
11
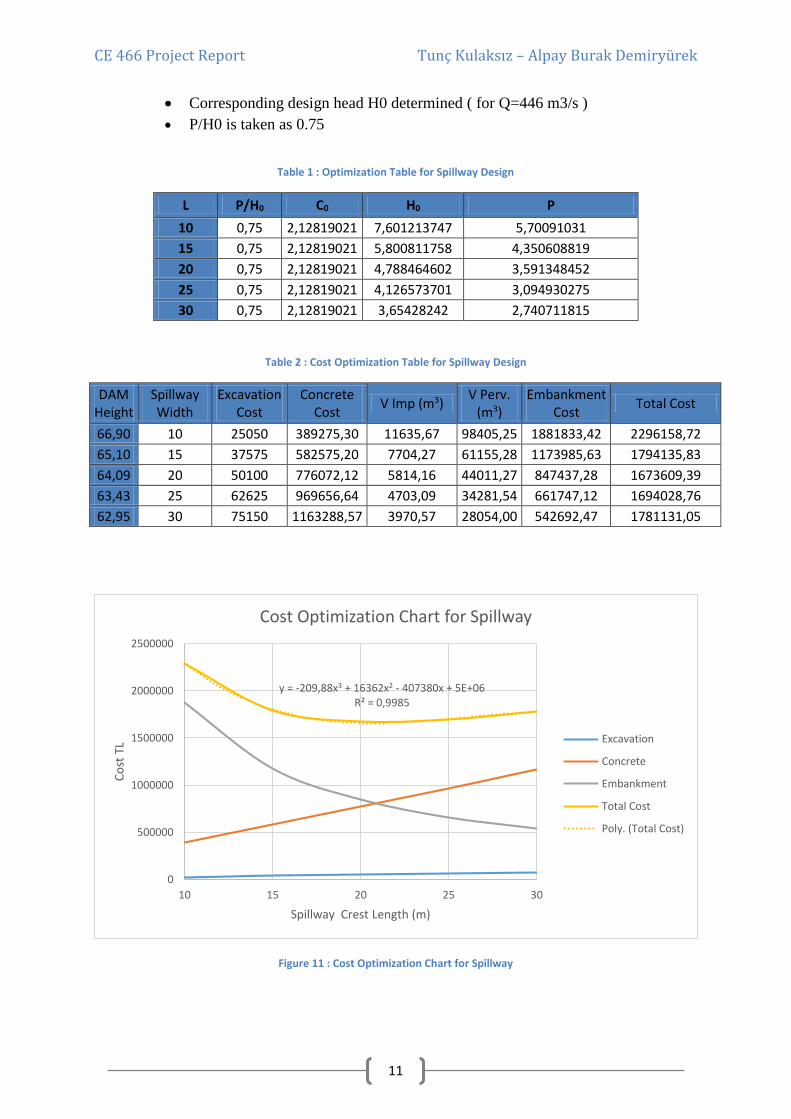
Corresponding design head H0 determined ( for Q=446 m3/s )
P/H0 is taken as 0.75
Table 1 : Optimization Table for Spillway Design
L P/H0 C0 H0 P
10 0,75 2,12819021 7,601213747 5,70091031
15 0,75 2,12819021 5,800811758 4,350608819
20 0,75 2,12819021 4,788464602 3,591348452
25 0,75 2,12819021 4,126573701 3,094930275
30 0,75 2,12819021 3,65428242 2,740711815
Table 2 : Cost Optimization Table for Spillway Design
DAM Height
Spillway Width
Excavation Cost
Concrete Cost
V Imp (m3) V Perv.
(m3) Embankment
Cost Total Cost
66,90 10 25050 389275,30 11635,67 98405,25 1881833,42 2296158,72
65,10 15 37575 582575,20 7704,27 61155,28 1173985,63 1794135,83
64,09 20 50100 776072,12 5814,16 44011,27 847437,28 1673609,39
63,43 25 62625 969656,64 4703,09 34281,54 661747,12 1694028,76
62,95 30 75150 1163288,57 3970,57 28054,00 542692,47 1781131,05
Figure 11 : Cost Optimization Chart for Spillway
y = -209,88x3 + 16362x2 - 407380x + 5E+06R² = 0,9985
0
500000
1000000
1500000
2000000
2500000
10 15 20 25 30
Co
st T
L
Spillway Crest Length (m)
Cost Optimization Chart for Spillway
Excavation
Concrete
Embankment
Total Cost
Poly. (Total Cost)
CE 466 Project Report Tunç Kulaksız – Alpay Burak Demiryürek
12
A third order polynomial is fit to total cost curve as a trend line. Taking derivative of
the trendline and setting it equal to 0, it can be found that the optimum length for the spillway
crest is equal to 20,66 meters. For the sake of simplicity in construction, L is taken as 21
meters.
Design of Derivation Tunnel
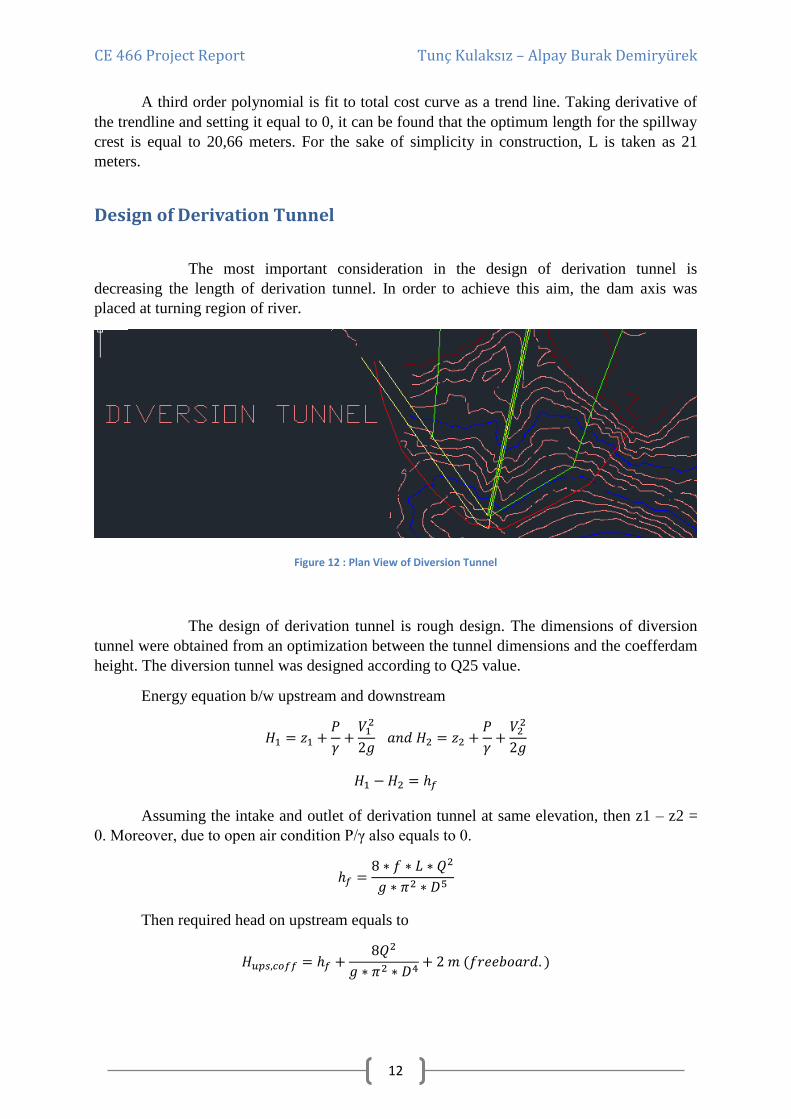
The most important consideration in the design of derivation tunnel is
decreasing the length of derivation tunnel. In order to achieve this aim, the dam axis was
placed at turning region of river.
Figure 12 : Plan View of Diversion Tunnel
The design of derivation tunnel is rough design. The dimensions of diversion
tunnel were obtained from an optimization between the tunnel dimensions and the coefferdam
height. The diversion tunnel was designed according to Q25 value.
Energy equation b/w upstream and downstream
𝐻1 = 𝑧1 +𝑃
𝛾+
𝑉12
2𝑔 𝑎𝑛𝑑 𝐻2 = 𝑧2 +
𝑃
𝛾+
𝑉22
2𝑔
𝐻1 − 𝐻2 = ℎ𝑓
Assuming the intake and outlet of derivation tunnel at same elevation, then z1 – z2 =
0. Moreover, due to open air condition P/γ also equals to 0.
ℎ𝑓 =8 ∗ 𝑓 ∗ 𝐿 ∗ 𝑄2
𝑔 ∗ 𝜋2 ∗ 𝐷5
Then required head on upstream equals to
𝐻𝑢𝑝𝑠,𝑐𝑜𝑓𝑓 = ℎ𝑓 +8𝑄2
𝑔 ∗ 𝜋2 ∗ 𝐷4+ 2 𝑚 (𝑓𝑟𝑒𝑒𝑏𝑜𝑎𝑟𝑑. )
CE 466 Project Report Tunç Kulaksız – Alpay Burak Demiryürek
13
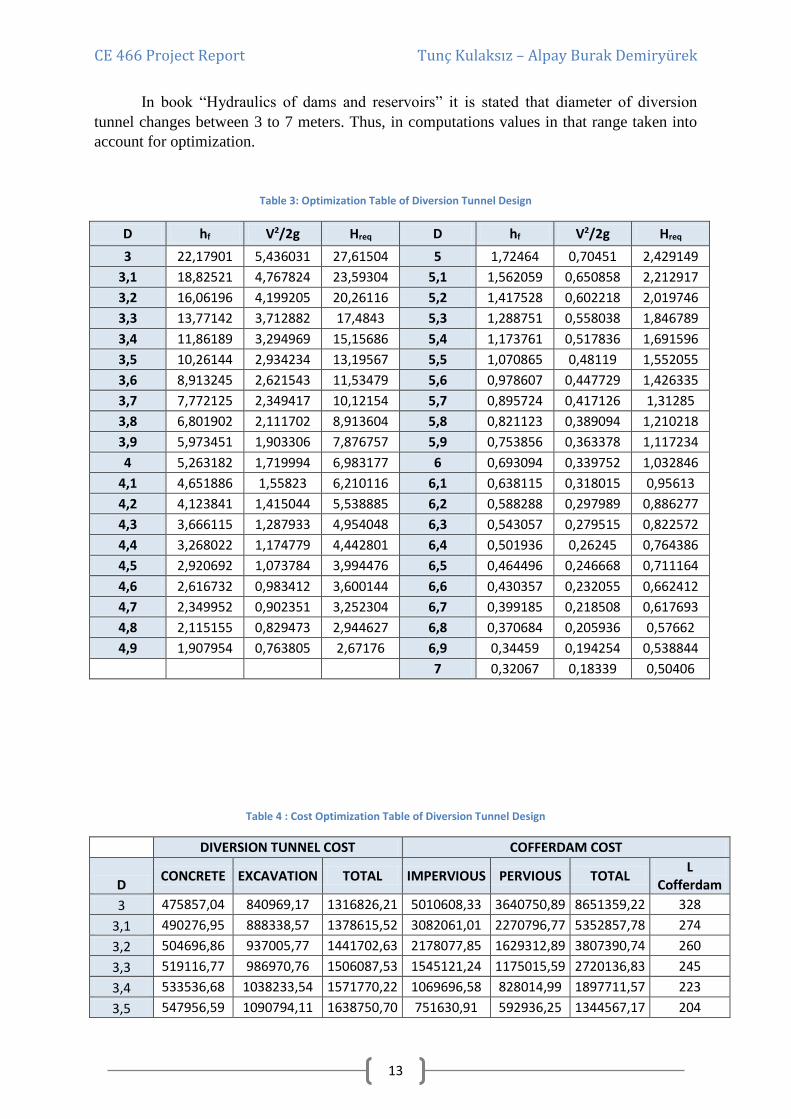
In book “Hydraulics of dams and reservoirs” it is stated that diameter of diversion
tunnel changes between 3 to 7 meters. Thus, in computations values in that range taken into
account for optimization.
Table 3: Optimization Table of Diversion Tunnel Design
D hf V2/2g Hreq D hf V2/2g Hreq
3 22,17901 5,436031 27,61504 5 1,72464 0,70451 2,429149
3,1 18,82521 4,767824 23,59304 5,1 1,562059 0,650858 2,212917
3,2 16,06196 4,199205 20,26116 5,2 1,417528 0,602218 2,019746
3,3 13,77142 3,712882 17,4843 5,3 1,288751 0,558038 1,846789
3,4 11,86189 3,294969 15,15686 5,4 1,173761 0,517836 1,691596
3,5 10,26144 2,934234 13,19567 5,5 1,070865 0,48119 1,552055
3,6 8,913245 2,621543 11,53479 5,6 0,978607 0,447729 1,426335
3,7 7,772125 2,349417 10,12154 5,7 0,895724 0,417126 1,31285
3,8 6,801902 2,111702 8,913604 5,8 0,821123 0,389094 1,210218
3,9 5,973451 1,903306 7,876757 5,9 0,753856 0,363378 1,117234
4 5,263182 1,719994 6,983177 6 0,693094 0,339752 1,032846
4,1 4,651886 1,55823 6,210116 6,1 0,638115 0,318015 0,95613
4,2 4,123841 1,415044 5,538885 6,2 0,588288 0,297989 0,886277
4,3 3,666115 1,287933 4,954048 6,3 0,543057 0,279515 0,822572
4,4 3,268022 1,174779 4,442801 6,4 0,501936 0,26245 0,764386
4,5 2,920692 1,073784 3,994476 6,5 0,464496 0,246668 0,711164
4,6 2,616732 0,983412 3,600144 6,6 0,430357 0,232055 0,662412
4,7 2,349952 0,902351 3,252304 6,7 0,399185 0,218508 0,617693
4,8 2,115155 0,829473 2,944627 6,8 0,370684 0,205936 0,57662
4,9 1,907954 0,763805 2,67176 6,9 0,34459 0,194254 0,538844
7 0,32067 0,18339 0,50406
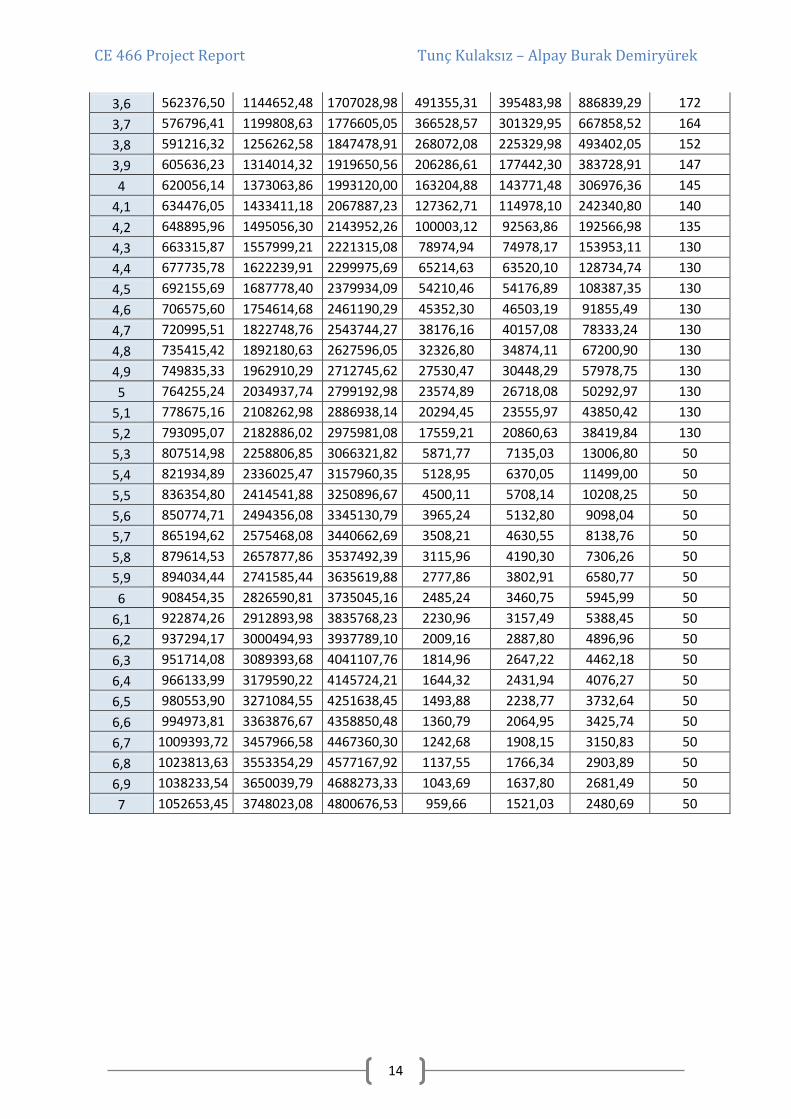
Table 4 : Cost Optimization Table of Diversion Tunnel Design
DIVERSION TUNNEL COST COFFERDAM COST
D CONCRETE EXCAVATION TOTAL IMPERVIOUS PERVIOUS TOTAL
L Cofferdam
3 475857,04 840969,17 1316826,21 5010608,33 3640750,89 8651359,22 328
3,1 490276,95 888338,57 1378615,52 3082061,01 2270796,77 5352857,78 274
3,2 504696,86 937005,77 1441702,63 2178077,85 1629312,89 3807390,74 260
3,3 519116,77 986970,76 1506087,53 1545121,24 1175015,59 2720136,83 245
3,4 533536,68 1038233,54 1571770,22 1069696,58 828014,99 1897711,57 223
3,5 547956,59 1090794,11 1638750,70 751630,91 592936,25 1344567,17 204
CE 466 Project Report Tunç Kulaksız – Alpay Burak Demiryürek
14
3,6 562376,50 1144652,48 1707028,98 491355,31 395483,98 886839,29 172
3,7 576796,41 1199808,63 1776605,05 366528,57 301329,95 667858,52 164
3,8 591216,32 1256262,58 1847478,91 268072,08 225329,98 493402,05 152
3,9 605636,23 1314014,32 1919650,56 206286,61 177442,30 383728,91 147
4 620056,14 1373063,86 1993120,00 163204,88 143771,48 306976,36 145
4,1 634476,05 1433411,18 2067887,23 127362,71 114978,10 242340,80 140
4,2 648895,96 1495056,30 2143952,26 100003,12 92563,86 192566,98 135
4,3 663315,87 1557999,21 2221315,08 78974,94 74978,17 153953,11 130
4,4 677735,78 1622239,91 2299975,69 65214,63 63520,10 128734,74 130
4,5 692155,69 1687778,40 2379934,09 54210,46 54176,89 108387,35 130
4,6 706575,60 1754614,68 2461190,29 45352,30 46503,19 91855,49 130
4,7 720995,51 1822748,76 2543744,27 38176,16 40157,08 78333,24 130
4,8 735415,42 1892180,63 2627596,05 32326,80 34874,11 67200,90 130
4,9 749835,33 1962910,29 2712745,62 27530,47 30448,29 57978,75 130
5 764255,24 2034937,74 2799192,98 23574,89 26718,08 50292,97 130
5,1 778675,16 2108262,98 2886938,14 20294,45 23555,97 43850,42 130
5,2 793095,07 2182886,02 2975981,08 17559,21 20860,63 38419,84 130
5,3 807514,98 2258806,85 3066321,82 5871,77 7135,03 13006,80 50
5,4 821934,89 2336025,47 3157960,35 5128,95 6370,05 11499,00 50
5,5 836354,80 2414541,88 3250896,67 4500,11 5708,14 10208,25 50
5,6 850774,71 2494356,08 3345130,79 3965,24 5132,80 9098,04 50
5,7 865194,62 2575468,08 3440662,69 3508,21 4630,55 8138,76 50
5,8 879614,53 2657877,86 3537492,39 3115,96 4190,30 7306,26 50
5,9 894034,44 2741585,44 3635619,88 2777,86 3802,91 6580,77 50
6 908454,35 2826590,81 3735045,16 2485,24 3460,75 5945,99 50
6,1 922874,26 2912893,98 3835768,23 2230,96 3157,49 5388,45 50
6,2 937294,17 3000494,93 3937789,10 2009,16 2887,80 4896,96 50
6,3 951714,08 3089393,68 4041107,76 1814,96 2647,22 4462,18 50
6,4 966133,99 3179590,22 4145724,21 1644,32 2431,94 4076,27 50
6,5 980553,90 3271084,55 4251638,45 1493,88 2238,77 3732,64 50
6,6 994973,81 3363876,67 4358850,48 1360,79 2064,95 3425,74 50
6,7 1009393,72 3457966,58 4467360,30 1242,68 1908,15 3150,83 50
6,8 1023813,63 3553354,29 4577167,92 1137,55 1766,34 2903,89 50
6,9 1038233,54 3650039,79 4688273,33 1043,69 1637,80 2681,49 50
7 1052653,45 3748023,08 4800676,53 959,66 1521,03 2480,69 50
CE 466 Project Report Tunç Kulaksız – Alpay Burak Demiryürek
15
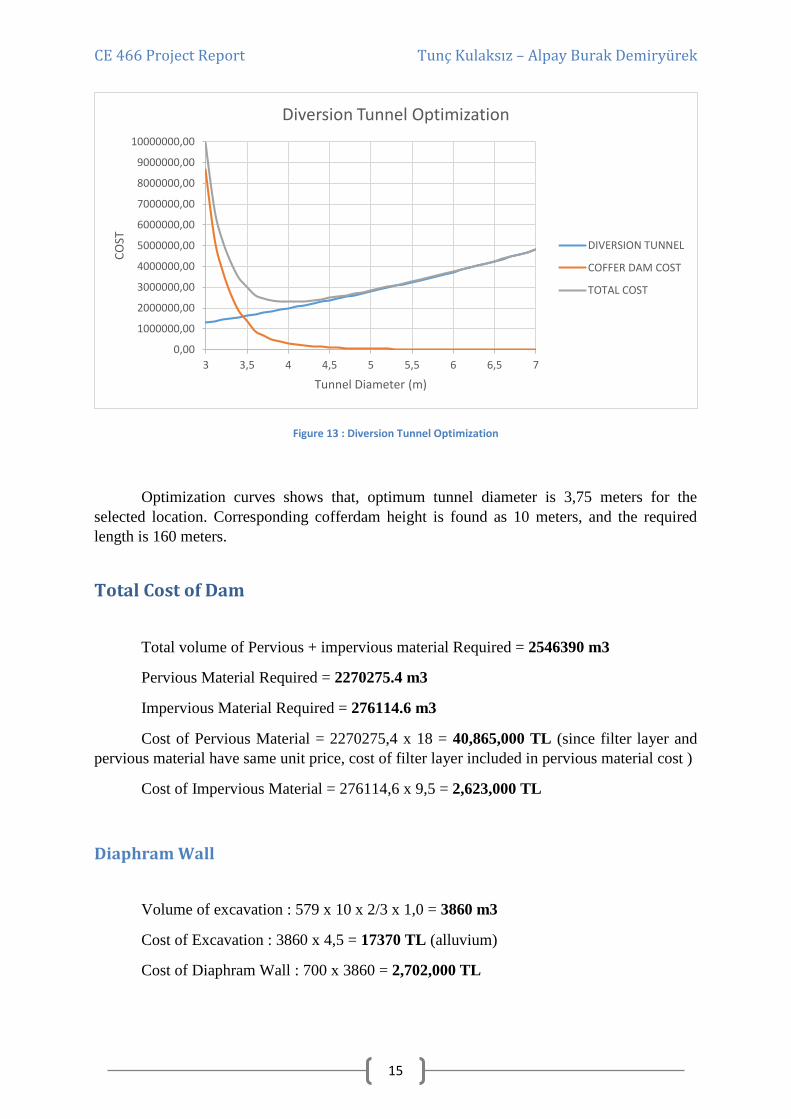
Figure 13 : Diversion Tunnel Optimization
Optimization curves shows that, optimum tunnel diameter is 3,75 meters for the
selected location. Corresponding cofferdam height is found as 10 meters, and the required
length is 160 meters.
Total Cost of Dam
Total volume of Pervious + impervious material Required = 2546390 m3
Pervious Material Required = 2270275.4 m3
Impervious Material Required = 276114.6 m3
Cost of Pervious Material = 2270275,4 x 18 = 40,865,000 TL (since filter layer and
pervious material have same unit price, cost of filter layer included in pervious material cost )
Cost of Impervious Material = 276114,6 x 9,5 = 2,623,000 TL
Diaphram Wall
Volume of excavation : 579 x 10 x 2/3 x 1,0 = 3860 m3
Cost of Excavation : 3860 x 4,5 = 17370 TL (alluvium)
Cost of Diaphram Wall : 700 x 3860 = 2,702,000 TL
0,00
1000000,00
2000000,00
3000000,00
4000000,00
5000000,00
6000000,00
7000000,00
8000000,00
9000000,00
10000000,00
3 3,5 4 4,5 5 5,5 6 6,5 7
CO
ST
Tunnel Diameter (m)
Diversion Tunnel Optimization
DIVERSION TUNNEL
COFFER DAM COST
TOTAL COST
CE 466 Project Report Tunç Kulaksız – Alpay Burak Demiryürek
16
Slurry Cut-off Wall
Same amount of excavation required.
Cost of Excavation : 3860 x 4,5 = 17370 TL (alluvium)
Cost of Diaphram Wall : 570 x 3860 = 2,200,200 TL
Note:
According to our cost analyses, the diaphram wall is cheaper than slurry cut-off wall.
The cost difference between them is 500 000 TL. Therefore, we decided to construct
diaphram wall on our project.
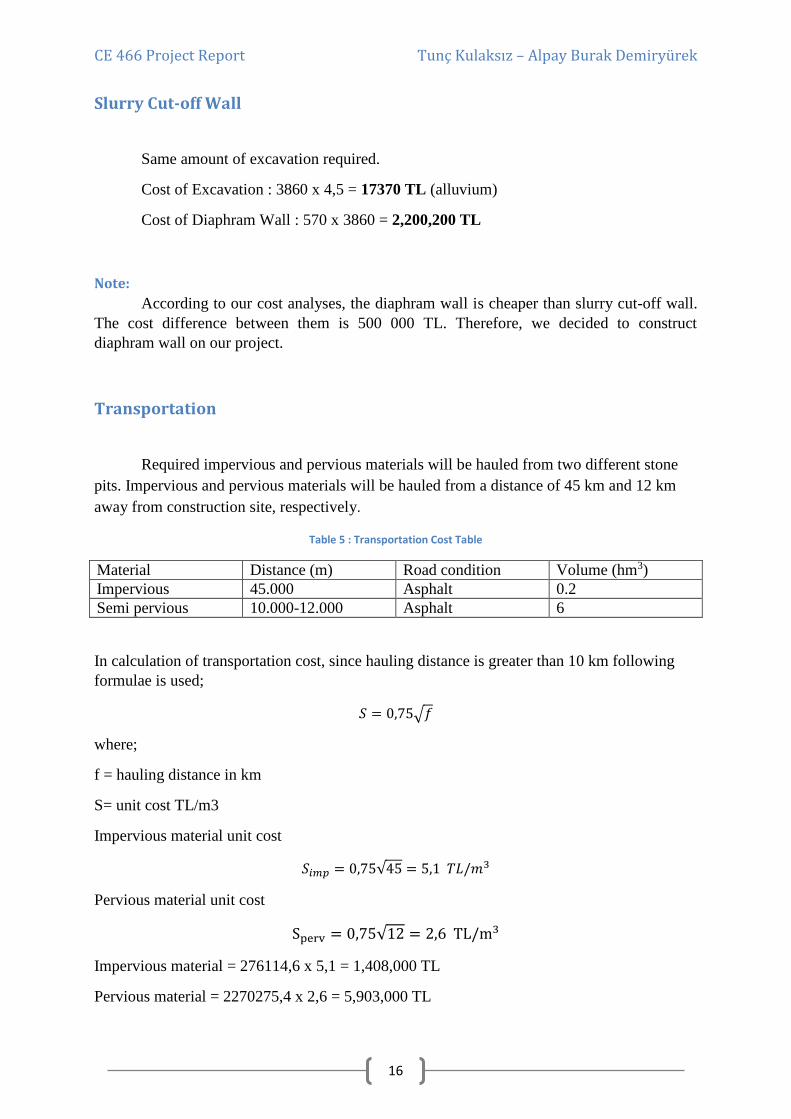
Transportation
Required impervious and pervious materials will be hauled from two different stone
pits. Impervious and pervious materials will be hauled from a distance of 45 km and 12 km
away from construction site, respectively.
Table 5 : Transportation Cost Table
Material Distance (m) Road condition Volume (hm3)
Impervious 45.000 Asphalt 0.2
Semi pervious 10.000-12.000 Asphalt 6
In calculation of transportation cost, since hauling distance is greater than 10 km following
formulae is used;
𝑆 = 0,75√𝑓
where;
f = hauling distance in km
S= unit cost TL/m3
Impervious material unit cost
𝑆𝑖𝑚𝑝 = 0,75√45 = 5,1 𝑇𝐿/𝑚3
Pervious material unit cost
Sperv = 0,75√12 = 2,6 TL/m3
Impervious material = 276114,6 x 5,1 = 1,408,000 TL
Pervious material = 2270275,4 x 2,6 = 5,903,000 TL
CE 466 Project Report Tunç Kulaksız – Alpay Burak Demiryürek
17
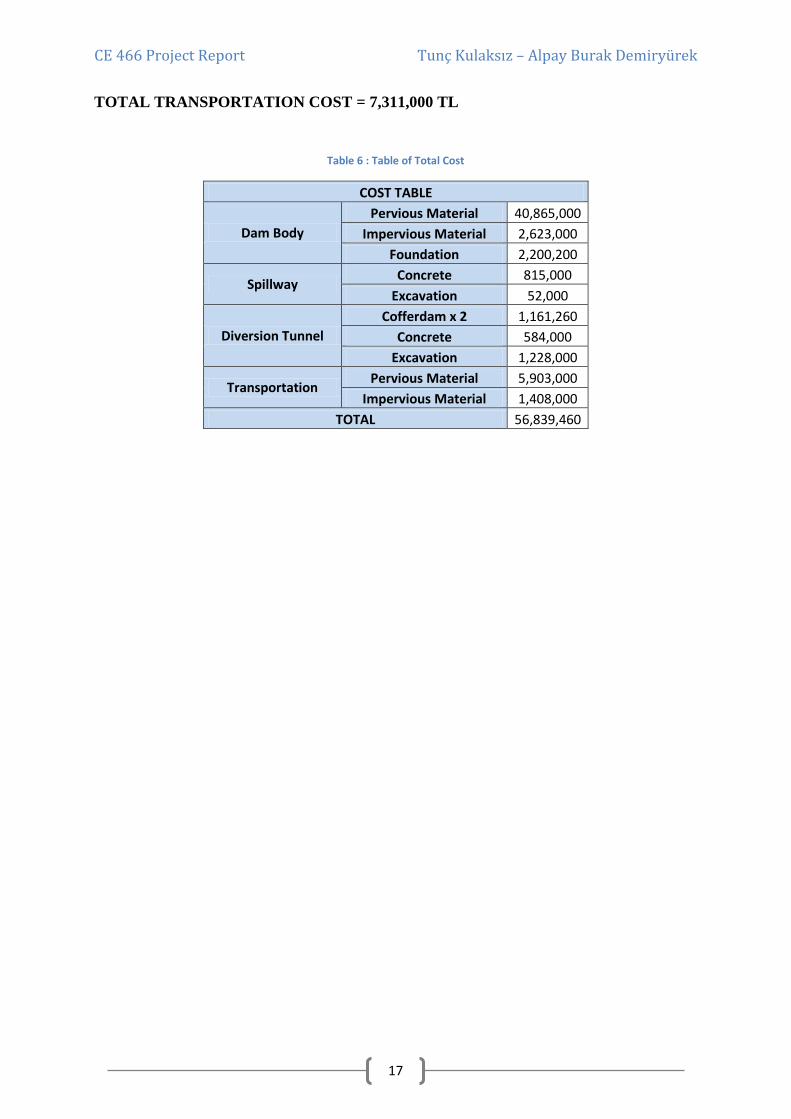
TOTAL TRANSPORTATION COST = 7,311,000 TL
Table 6 : Table of Total Cost
COST TABLE
Dam Body
Pervious Material 40,865,000
Impervious Material 2,623,000
Foundation 2,200,200
Spillway Concrete 815,000
Excavation 52,000
Diversion Tunnel
Cofferdam x 2 1,161,260
Concrete 584,000
Excavation 1,228,000
Transportation Pervious Material 5,903,000
Impervious Material 1,408,000
TOTAL 56,839,460
CE 466 Project Report Tunç Kulaksız – Alpay Burak Demiryürek
18
References 1. http://www2.ce.metu.edu.tr/~ce466/
2. Lecure Notes
3. https://npdp.stanford.edu/sites/default/files/other_materials/the_design_and_construction
_of_dams.pdf
4. http://community.dur.ac.uk/~des0www4/cal/dams/
5. http://en.wikipedia.org/wiki/Dam
6. http://www.dec.ny.gov/docs/water_pdf/damguideli.pdf
7. http://www.hydroworld.com/dams-and-civil-structures/dam-design-and-construction.html


![[Shinobi] Bleach 466](https://img.pdfslide.us/doc/110x75/568c4a721a28ab4916982d2e/shinobi-bleach-466.jpg)

![CASE OF MUSTAFA TUNÇ AND FECİRE TUNÇ v. TURKEY · such (see, for example, Dalban v. Romania [GC], no. 28114/95, ECHR 1999-VI). 3. The applicants were represented on behalf of the](https://img.pdfslide.us/doc/110x75/5e27849db6b9ce03dc64bbd5/case-of-mustafa-tun-and-fecre-tun-v-turkey-such-see-for-example-dalban.jpg)