Embed Size (px)
Citation preview

CE 212
Mechanics of Solids Sessional
Lab Manual
DEPARTMENT OF CIVIL ENGINEERING AHSANULLAH UNIVERSITY OF SCIENCE AND TECHNOLOGY
DECEMBER, 2017

AHSANULLAH UNIVERSITY OF SCIENCE AND TECHNOLOGY DEPARTMENT OF CIVIL ENGINEERING
CE 212: Mechanics of Solids Sessional Page | 2
PREFACE
The Mechanics of Solids Sessional Lab Manual describes the experiments in the
Mechanics of Solids Sessional course (CE 212). Each experiment is explained thoroughly
along with related theory and background. The experiments are selected to apply some
concepts from strength of materials such as analysis of material properties based on tension,
compression, hardness, bending, buckling, direct shear, impact, torsion, behavior of spring
etc. This is one of the vital laboratory course in the course curriculum of the Bachelor of Civil
Engineering program. Students can learn variety of engineering and structural materials and
their mechanical and engineering properties, different testing procedure and testing standards,
testing equipment, materials stress-strain behavior and failure patterns, types of materials
based on characterization, report writing process and evaluation of the experimental results
and so on. In civil engineering profession, the use of structural behavior and understanding
the quality of product will be discussed in this course. Some complementary topics are also
presented such as using of measuring tools like digital slide calipers. The use of these tools
will help the students to understand how to measure objects precisely, which is a crucial skill
in lab. Experimental data analysis techniques and graph formation in MS Excel are also
discussed to help the students to prepare graphs.
The manual is prepared mostly by gathering the information and contents from
Mechanics of Solids Sessional Manual, Department of Civil Engineering, Bangladesh
University of Engineering and Technology (BUET) prepared by Professor Dr. Ishtiaque
Ahmed, Department of Civil Engineering, BUET and another Mechanics of Solids Sessional
Manual, Department of Civil Engineering, Bangladesh University of Engineering and
Technology (BUET) prepared by Md. Ruhul Amin, Assistant professor, Department of Civil
Engineering, BUET. Many figures are taken from different web pages of internet. Also the
relevant ASTM codes are used as reference to prepare the manual.
Md. Mashfiqul Islam
Assistant Professor
Department of Civil Engineering
Ahsanullah University of Science and Technology (AUST)

TABLE OF CONTENT
Experiment
No.
Name of the Experiment Page
No.
1 HARDNESS TEST OF METAL SPECIMENS………………...... 4
2 COMPRESSION TEST OF TIMBER SPECIMEN……………… 14
3 IMPACT TEST OF METAL SPECIMEN……………………...... 22
4 TENSION TEST OF MILD STEEL SPECIMEN……………….. 33
5 STATIC BENDING TEST OF STEEL AND TIMBER BEAM… 46
6 BASICS OF SHEAR FORCE AND BENDING MOMENT…….. 53
7 TEST OF SLENDER COLUMN………………………………….. 57
8 DIRECT SHEAR TEST OF METAL SPECIMENS…………….. 64
9 TEST OF HELICAL SPRING…………………………………….. 68
10 BASICS OF SHEAR CENTRE………………………………….... 79
- ACKNOWLEDGEMENT………………………………………..... 84
- REFERENCES……………………………………………………… 84
- APPENDIX………………………………………………………….. 85

AHSANULLAH UNIVERSITY OF SCIENCE AND TECHNOLOGY DEPARTMENT OF CIVIL ENGINEERING
CE 212: Mechanics of Solids Sessional Page | 4
EXPERIMENT NO.: 1
HARDNESS TEST OF METAL SPECIMENS

AHSANULLAH UNIVERSITY OF SCIENCE AND TECHNOLOGY DEPARTMENT OF CIVIL ENGINEERING
CE 212: Mechanics of Solids Sessional Page | 5
Experiment No.: 1
Hardness test of Metal Specimens
1. OBJECTIVES
-To study the Rockwell Hardness testing machine
-To determine the Hardness of the given specimens using Rockwell Hardness Testing
Machine.
-To observe the failure pattern of different metals tested in different scale.
2. ASTM REFERENCE
ASTM E 8 Standard Test Methods for Tension Testing of Metallic Materials
ASTM E 370 Standard Test Methods and Definitions for Mechanical Testing of Steel
Products
ASTM A 48 Standard Specification for Gray Iron Castings
ASTM E 18 Standard Test Methods for Rockwell Hardness of Metallic Materials
3. SIGNIFICANCE
This experiment provides fundamental knowledge on hardness of materials, hardness
test procedure, hardness testing types, hardness testing machine, hardness of different metal
specimens, failure patterns etc.
4. APPARATUS
Rockwell Hardness Testing Machine
5. SPECIMEN
Specimen of mild steel (MS), brass, cast iron, aluminum and high strength steel
(HSS).
6. THEORY
Hardness is a measure of the resistance of material to permanent deformation.
Hardness represents the resistance of material surface to abrasion, scratching and cutting
above all resistance to permanent deformation. Hardness gives clear indication of strength. In
all hardness tests, a defined force is mechanically applied on the test piece, varies in size and

AHSANULLAH UNIVERSITY OF SCIENCE AND TECHNOLOGY DEPARTMENT OF CIVIL ENGINEERING
CE 212: Mechanics of Solids Sessional Page | 6
shape for different tests. Common indenters are made of hardened steel or diamond. Hardness
test is used to give a guide to the overall strength of a material.
Hardness is a measure of a material plastic flow resistance, and especially useful for
this purpose when comparative assessments are made. Moreover, since hardness test are more
convenient to carry out than other tensile tests, the hardness test has found widespread use in
industrial applications and research studies.
Depending on the particular deformation type (or for that matter particular of stressing),
hardness may be of the following types:
(1) Indentation hardness test (by indenting)
(2) Scratch hardness test (by scratching, Moh’s Scale)
(3) Dynamic hardness test (by impact)
(4) Rebound hardness test (by the rebound of a falling ball)
(5) Wear hardness (by abrasion)
(6) Machinability (by cutting or drilling)
Figure 1: Various method of hardness test
Four indentation hardness tests are customarily used:
(1) Brinell
(2) Vickers
(3) Rockwell
(4) Shore scleroscope
The first three is known as static indentation hardness test and the last one is called
dynamic indentation hardness test. Hardness number depends on (i) the applied load, (ii) the
shape of the indentation and (iii) the depth to which the indenter penetrates the specimen.
Rockwell B scale: For softer materials, a 1/16 inch diameter steel ball is used, the major load
is 90 kg and minor load is 10 kg (100 kg load in total) and the hardness is
002.0130
dHRB

AHSANULLAH UNIVERSITY OF SCIENCE AND TECHNOLOGY DEPARTMENT OF CIVIL ENGINEERING
CE 212: Mechanics of Solids Sessional Page | 7
where, d=depth of the indenter in mm, relative to the zero position.
Rockwell C scale :For harder materials , a conical – shaped diamond of 120 apex angel is
used , the major load is 140 kg and minor load is 10 kg (150kg load in total), and the
hardness is
002.0100
dHRC
Rockwell hardness tester presents direct reading of hardness number on a dial
provided with the machine. Principally this testing is similar to Brinell hardness testing. It
differs only in diameter and material of the indenter and the applied force. Although there are
many scales having different combinations of load and size of indenter but commonly ‘C’
scale is used and hardness is presented as HRC. Here the indenter has a diamond cone at the
tip and applied force is of 150 kgf. Soft materials are often tested in ‘B’ scale with a 1.58mm
dia. steel indenter at 100 kgf.
Figure 2: Rockwell Hardness testing machine
7. SPECIFICATION OF HARDNESS TESTING MACHINE AND INDENTERS
A hardness test can be conducted on Brinell hardness testing machine, Rockwell
hardness machine or Vicker hardness testing machine. The specimen may be a cylinder, cube,
thick or thin metallic sheet. A Rockwell hardness testing machine along with the specimen is
shown in Figure 2.

AHSANULLAH UNIVERSITY OF SCIENCE AND TECHNOLOGY DEPARTMENT OF CIVIL ENGINEERING
CE 212: Mechanics of Solids Sessional Page | 8
Table 1: Various scales in Rockwell hardness test
Scale
Type of
indenter
(Dimension)
Initial/Minor
load (kgf)
Major load
(kgf)
Kind of material
may
be tested
HRA Cone, 120o 10 50 Much harder such as carburized
steel, cemented carbides,
plastics & polymers
HRB Ball, 1.58mm 10 90 Soft steels, copper, aluminum,
brass, grey cast iron.
HRC Cone, 120o 10 140 Hard steels, HSS, Ti, W, Va, etc
Figure 3: Major and minor load

AHSANULLAH UNIVERSITY OF SCIENCE AND TECHNOLOGY DEPARTMENT OF CIVIL ENGINEERING
CE 212: Mechanics of Solids Sessional Page | 9
Rockwell Method
(a) Cone Indenter (b) Ball Indenter
(c) Vicker’s method (d) Brinell Method
Figure 4: Typical Indenters of Hardness testing
Figure 5: Typical specimens of Hardness test

AHSANULLAH UNIVERSITY OF SCIENCE AND TECHNOLOGY DEPARTMENT OF CIVIL ENGINEERING
CE 212: Mechanics of Solids Sessional Page | 10
Table 2: Approximate hardness conversion numbers for non austenitic steels (ASTM A370)
HRC Appx.Tensile Strength (ksi) HRB Appx.Tensile Strength (ksi) 68 - 100 116 67 - 99 114 66 - 98 109 65 - 97 104 64 - 96 102 63 - 95 100 62 - 94 98 61 - 93 94 60 - 92 92 59 351 91 90 58 338 90 89 57 325 89 88 56 313 88 86 55 301 87 84 54 292 86 83 53 283 85 82 52 273 84 81 51 264 83 80 50 255 82 77 49 246 81 73 48 238 80 72 47 229 79 70 46 221 78 69 45 215 77 68 44 208 76 67 43 201 75 66 42 194 74 65 41 188 73 64 40 182 72 63 39 177 71 62 38 171 70 61 37 166 69 60 36 161 68 59 35 156 67 58 34 152 66 57 33 149 65 56 32 146 64 - 31 141 63 - 30 138 62 - 29 135 61 - 28 131 60 - 27 128 59 - 26 125 58 - 25 123 57 - 24 119 56 - 23 117 55 - 22 115 21 112 20 110
Note: Table 2 gives the approximate relationships of hardness values and approximate tensile strength of steels. It is possible that steels of
various compositions and processing histories will deviate in hardness-tensile strength relationship from the data presented in these Tables.

AHSANULLAH UNIVERSITY OF SCIENCE AND TECHNOLOGY DEPARTMENT OF CIVIL ENGINEERING
CE 212: Mechanics of Solids Sessional Page | 11
Figure 6: Relation among different hardness scale
8. PROCEDURE
1. Examine the machine and make sure that the correct scale (A, B or C) is set for testing.
2. Place the specimen upon the anvil of the machine.
3. Raise the anvil and the test piece by elevating screw until the specimen comes in contact
with the indenter.
4. Firstly apply minor load on the specimen by touching the pointer to the specimen.
5. Then apply the major load on the same specimen by pressing upward.
6. After few seconds of the application of load, a beep sound would be heard.
7. Read carefully and record the hardness number from the display of the machine.

AHSANULLAH UNIVERSITY OF SCIENCE AND TECHNOLOGY DEPARTMENT OF CIVIL ENGINEERING
CE 212: Mechanics of Solids Sessional Page | 12
9. SAMPLE CALCULATIONS
(Students will fill up this section with their individual observation and calculation about the
test, as par teacher’s direction.)
For HRB 35 to HRB 100
HRBBHN
130
7300 ………. (1)
For HRC 20 to HRC 40
HRCBHN
100
20000 ………. (2)
For HRC 41 and above
HRCBHN
100
25000 ………. (3)
10. GRAPHS
1. Tensile strength vs. HRC using Table 2.
2. Tensile strength vs. HRB using Table 2.
Also show the corresponding tensile strengths of tested specimens in the graphs.
11. DATA TABLE
Sl. No. Specimen Name of the metal
Type of indenter
Applied load (kg)
HRB HRC
1 2 3 4 5 6 7 8 9
10 11 12 13 14 15

AHSANULLAH UNIVERSITY OF SCIENCE AND TECHNOLOGY DEPARTMENT OF CIVIL ENGINEERING
CE 212: Mechanics of Solids Sessional Page | 13
12. RESULT
(Students will fill up this section with their individual outcome/result about the test.)
Sl.
No.
Specimen Name
of the
metal
Applied
load
(kg)
HRB
(Ball
indenter)
HRC
(Cone
indenter)
BHN Tensile
strength
(ksi)
Moh’s
scale
Hardness
Depth of
indentation,
d (mm)
13. DISCUSSION
Point out the discussion
1.
2.
3. ….
(Discuss on the results found, graphs, and failure patterns and also compare the results found,
graphs and failure patterns.)
14. ASSIGNMENT
1. What is the importance of minor load in Hardness test?
2. Write down the names of materials you can find hardness in the all three scales.
3. What result have you obtained in your laboratory test? Do you think the result is justified
by the test method?
4. Describe the hardness testing machine being operated at your laboratory; also describe its
working procedure.
5. Calculate the hardness of the tested materials in Moh’s scale using Figure 6 and also
calculate the depth of penetration for all specimens.

AHSANULLAH UNIVERSITY OF SCIENCE AND TECHNOLOGY DEPARTMENT OF CIVIL ENGINEERING
CE 212: Mechanics of Solids Sessional Page | 14
EXPERIMENT NO.: 2
COMPRESSION TEST OF TIMBER BLOCK

AHSANULLAH UNIVERSITY OF SCIENCE AND TECHNOLOGY DEPARTMENT OF CIVIL ENGINEERING
CE 212: Mechanics of Solids Sessional Page | 15
Experiment No.: 2
Compression test of Timber Block
1. OBJECTIVE
-To perform compression test of timber block on UTM.
-To observe the effect of slenderness ratio.
-To study the effects of parallel and perpendicular loading.
-To evaluate the failure patterns based on slenderness ratio and loading direction
2. ASTM REFERENCE
ASTM D 143 Standard Test Methods for Small Clear Specimens of Timber
3. SIGNIFICANCE
This experiment provides fundamental knowledge on compression behaviour of
materials specially wood/timber, test procedure, universal testing machine and its working
principal, compression specimens, failure pattern etc.
4. APPARATUS AND MACHINE
Digital Universal testing machine (UTM), digital slide calipers, steel tape, stop watch
and computer.
5. SPECIMEN
2”x2”x8” (parallel loading) and 2”x2”x6” (perpendicular loading) wooden blocks.
(a) (b)
Figure 1: (a) Universal Testing Machine (UTM) (b) Schematic diagram of UTM
AHSANULLAH UNIVERSITY OF SCIENCE AND TECHNOLOGY DEPARTMENT OF CIVIL ENGINEERING
CE 212: Mechanics of Solids Sessional Page | 16
(a) (b)
Figure 3: (a) Compression-Parallel-to-Grain Test Assembly, (b) Compression-Perpendicular-
to-Grain Test Assembly (image from ASTM D 143)
6. THEORY
Stress – strain relationship for timber is exceedingly complex, resulting from the facts that,
(a) Timber does not behave in a truly elastic mode; rather is behavior is time dependent.
(b) The magnitude of strain is influenced by a wide range of factors; some of those are
property dependent, such as density of the timber, angle of grain relative to direction of
load application, angle of the micro-fibrils within the cell wall; others are
environmentally dependent, such as temperature and relative humidity.
There are several limitations to the compression test to which attention should be
directed:
(1) The difficulty of applying a truly concentric or axial load.
(2) The relatively unstable character of this type of loading as contrasted to the tensile
loading. There is always a tendency for bending stresses to be set up and for the effect of
accidental irregularities in alignment with the specimen to be accentuated as loading
proceeds.
(3) Friction between the heads of the testing machine or bearing plates and the end surface of
the specimen due to lateral expansion of the specimen. This may alter considerably the
results that would be obtained if such a condition of test were not present.
(4)The relatively larger cross – sectional areas of the compression test specimen, in order to
obtain a proper degree of stability of the piece. This results in the necessity for a
relatively large –capacity testing machine or a specimen so small and therefore so short

AHSANULLAH UNIVERSITY OF SCIENCE AND TECHNOLOGY DEPARTMENT OF CIVIL ENGINEERING
CE 212: Mechanics of Solids Sessional Page | 17
that is difficult to obtain from them strain measurements of suitable precision . It is
presumed that the simple compression characteristics of materials are desired and not the
column action of structural members, so that attention here confined to the short
compression block.
Wood is commonly used engineering material showing different mechanical behavior
under tension and compression loading. However, contrary to gray cast Iron or concrete, it
does not show brittle characteristics under tensile loading and surprisingly, it is considerably
stronger in tension than compression. The fact that the cell structures in the material are
stronger in the longitudinal than transverse direction is the major factor leading to this
unusual mechanical behavior of wood.
Wood exhibits, under compressive loading, a behavior peculiar to itself. it is anything but
an isotropic material, being composed of cell formed by organic growth which align
themselves to from a series of tubes or columns in the direction to the grain. As a result of
this structure, the elastic limit is relatively low, there is no definite yield point, and
considerable set takes place before failure. These properties vary with the orientation of the
load with respect to the direction of the grain. For loads normal to grain, the load that causes
lateral collapse of the tubes or fibers is the significant load. For load parallel to grain, not
only the elastic strength important but also the strength at rupture. Rupture often occurs
because of collapse of the tubular fibers as column.
Compression load parallel to grain can be carried by the strongest fibers, whereas
compression loads perpendicular to the grain are carried by both weak and strong fibers.
Wood in compression parallel to the grain can carry three to four times the load that wood in
compression perpendicular to the grain can carry.
Compression failure of wood perpendicular to the grain involves the complete crushing of
the wood fiber (the cell with the thinnest walls collapse first, and the action proceeds
gradually). Compression failure of wood parallel to the grain involves the bending or
buckling of the wood fibers.
Several materials, which are good in tension, are poor in compression. Contrary to this,
many materials poor which are in tension but very strong in compression. Several machine
and structure components such as columns and struts are subjected to compressive load in
applications. These components are made of high compressive strength materials. Not all the
materials are strong in compression. That is why determination of ultimate compressive
strength is essential before using a material.

AHSANULLAH UNIVERSITY OF SCIENCE AND TECHNOLOGY DEPARTMENT OF CIVIL ENGINEERING
CE 212: Mechanics of Solids Sessional Page | 18
Compression test is just opposite in nature to tensile test. Nature of deformation and
fracture is quite different from that in tensile test. Compressive load tends to squeeze the
specimen. Brittle materials are generally weak in tension but strong in compression. Hence
this test is normally performed on cast iron, cement concrete, wood etc. But ductile materials
like aluminum and mild steel which are strong in tension are also tested in compression.
A compression test can be performed on UTM by keeping the test-piece on base block
and moving down the central grip to apply load. It can also be performed on a compression
testing machine. A compression testing machine has two compression plates/heads. The
upper head moveable while the lower head is stationary. One of the two heads is equipped
with a hemispherical bearing to obtain uniform distribution of load over the test- piece ends.
A load gauge is fitted for recording the applied load.
In cylindrical specimen, it is essential to keep h/d < 2 to avoid lateral instability due to
bucking action. In cubic specimen, d is the minimum width.
7. PROCEDURE
i) Measure the size of the specimen with a slide calipers.
ii) Place the block on the proper position of the testing machine.
iii) Apply load continuously on the specimen until failure.
iv) Record the maximum load at failure.
v) Note the characteristics of the fractured surfaces and show the failure plane.
8. SAMPLE CALCULATIONS
Strain rate =
Initial length or height of specimen, hi =
Final length or height of specimen,hf =
Initial minimum width of specimen, di=
Final minimum width of specimen,df=
Initial cross-sectional area, Ai =
Final cross-sectional area, Af=

AHSANULLAH UNIVERSITY OF SCIENCE AND TECHNOLOGY DEPARTMENT OF CIVIL ENGINEERING
CE 212: Mechanics of Solids Sessional Page | 19
9. FAILURE PATTERNS
Figure 2: Schematic diagram of failure pattern of wooden specimens.
Parallel Loading:
a = crushing,
b = wedge split,
c = shearing,
d = splitting,
e = compression and shearing parallel to plane,
f = brooming or end rolling,
g = bending or buckling,
Perpendicular Loading
h = barreling or bulging

AHSANULLAH UNIVERSITY OF SCIENCE AND TECHNOLOGY DEPARTMENT OF CIVIL ENGINEERING
CE 212: Mechanics of Solids Sessional Page | 20
10. SAMPLE CALCULATIONS
1. Draw stress-strain curve in compression.
2. Determine Modulus of Elasticity in compression,
Strain
StressE
3. Determine proportional limit, PL, ultimate (max.) compressive strength, ult, and strain at
PL, ultimate strain ult from graph.
4. Determine percentage reduction in length (or height) to the specimen
%100Re%
i
fi
h
hhlengthofduction
5. Determine Poisson’s ratio,
i
if
i
if
h
hhd
dd
strainAxial
strainLateral
6. Observe failure patterns and failure location w.r.t. loading direction.
11. GRAPH
1. Compressive stress vs. Strain for parallel loading.
2. Compressive stress vs. Strain for perpendicular loading.
3. Combined Compressive stress vs. Strain for all specimens.
12. RESULT
(Students will fill up this section with their individual outcome/result about the test.)
Case 1 (Parallel loading)
Case 2 (Perpendicular loading)
P (N) E (MPa)
ult (MPa)
% Reduction in length Poisson’s ratio, ν
ult
G=0.5 PLPL (MPa)
Failure pattern Failure location

AHSANULLAH UNIVERSITY OF SCIENCE AND TECHNOLOGY DEPARTMENT OF CIVIL ENGINEERING
CE 212: Mechanics of Solids Sessional Page | 21
13. DISCUSSION
(Discuss on the results found, graphs, and failure patterns and also compare the results
found, graphs and failure patterns.)
Point out the discussion
1.
2.
3. ….
14. ASSIGNMENT
1. Compression tests are generally performed on brittles materials, why? Justify your answer.
2. Which will have a higher strength: a small specimen or a full size member made of the
same material?
3. What is column action? How does the h/d ratioof specimen affect the test result?
4. How do ductile and brittle materials differ in their behavior in compression test?
AHSANULLAH UNIVERSITY OF SCIENCE AND TECHNOLOGY DEPARTMENT OF CIVIL ENGINEERING
CE 212: Mechanics of Solids Sessional Page | 22
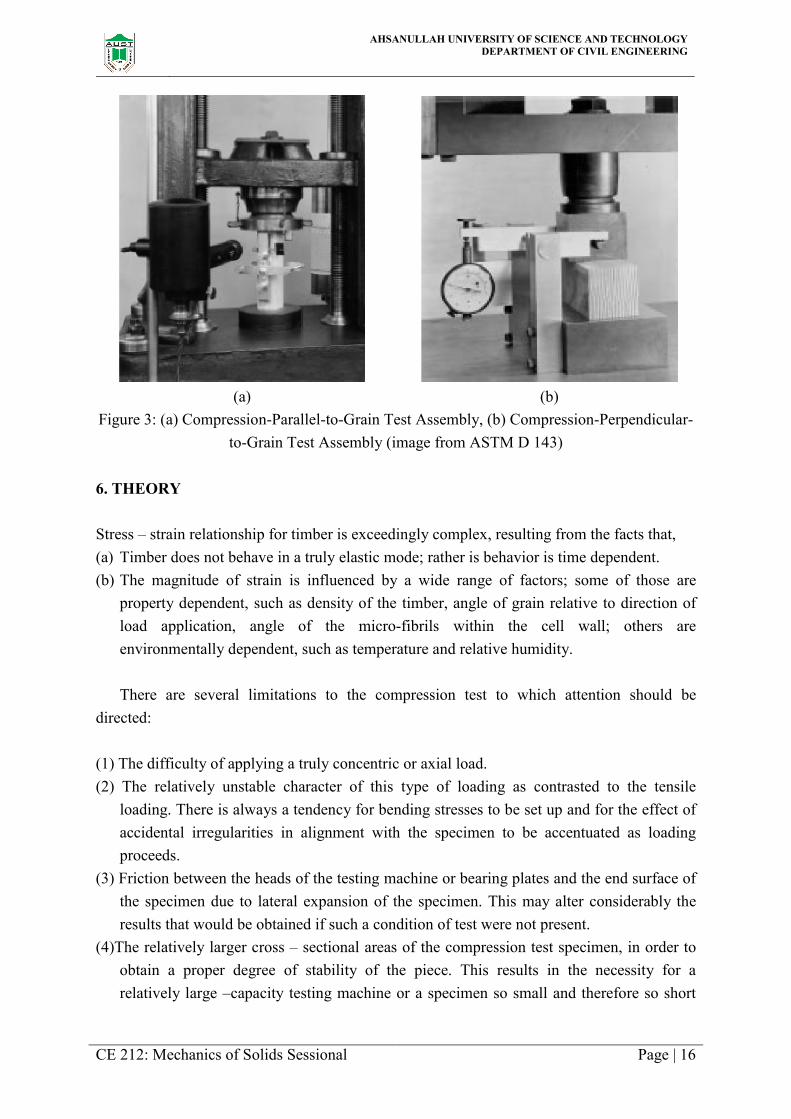
EXPERIMENT NO.: 3
IMPACT TEST OF METAL SPECIMEN

AHSANULLAH UNIVERSITY OF SCIENCE AND TECHNOLOGY DEPARTMENT OF CIVIL ENGINEERING
CE 212: Mechanics of Solids Sessional Page | 23
Experiment No.: 3
Impact test of Metal Specimen
1. OBJECTIVE
-To study the Impact testing machine
-To evaluate the energy absorbing characteristics of metal materials at room temperature
using the Charpy, Izod, and tension impact methods.
-To observe the failure patterns and failure surface
2. ASTM REFERENCE
ASTM E 23 Standard Test Methods for Notched Bar Impact Testing of Metallic Materials
3. SIGNIFICANCE
This experiment provides fundamental knowledge on impact behaviour of materials,
test procedure, impact testing machine and its working principal, impact specimens, failure
patterns etc.
4. APPARATUS AND MACHINE
Digital pendulum impact testing machine
5. SPECIMENS
Charpy (simple beam specimens), Izod (cantilever specimens), Tension Impact
specimens made of different metals.
6. THEORY
An impact test normally determines the energy absorb in fracturing a test piece under
high speed loading. Toughness is often measured by impact testing rather than by load –
deformation (stress vs. strain) curves.
An impact test is a dynamic test in which a selected specimen which is usually
notched, is struck and broken by a single blow in a specially designed machine. Using an
impact. Machine, the energy absorbed while breaking the specimen is measured.

AHSANULLAH UNIVERSITY OF SCIENCE AND TECHNOLOGY DEPARTMENT OF CIVIL ENGINEERING
CE 212: Mechanics of Solids Sessional Page | 24
Figure 1: (a) Impact test mechanism
(Image source: Internet)
(b) Impact testing machine
(Image source: Internet)
Dynamic Load is that load which varies with respect to time.
Types of dynamic Load:
(1) Harmonic Load (machine)
(2) Periodic Load (dancing)
(3) Transient Load (walking)
(4) Impact Load (jumping)
Impact or shock loading differs from static and cyclic loads in two respects:
(i) Load is applied rapidly, that is with appreciable speed, and
(ii) Loading is seldom repeated, since failure often occurs on the first application, if it occurs
at all.
Types of impact test are as follows:
(a)Bending impact test
(1) Charpy simple beam
(2) Izod cantilever beam
(b) Tensile impact test
In both methods the tested pieces are notched. The intention of the notch is to
approximate end use conditions; the notch serves as a stress concentrator. These tests give a

AHSANULLAH UNIVERSITY OF SCIENCE AND TECHNOLOGY DEPARTMENT OF CIVIL ENGINEERING
CE 212: Mechanics of Solids Sessional Page | 25
value for toughness, yet their respective values are not directly comparable. This is due to the
differences in how they are tested.
The major factors that affect the results of an impact test are:
(a)Velocity (b)Specimen (c)Temperature
Table 1: Features of different types of fracture
Ductile fracture Brittle fracture
A mode of fracture characterized by the slow
creak propagation which usually follows a
zigzag path alone planes where a maximum
resolved shear stress has occurred.
A mode of fracture characterized by the
nucleation and rapid propagation of a crack, with
little accompanying plastic deformation.
A surface experiencing ductile fracture generally
has a dull, fibrous appearance.
Brittle fracture surfaces in crystalline materials
can be identified by the shiny, granular
appearance.
Example: Fracture of mild steel , aluminum, Example: Fracture of cast iron, high carbon steel.
Table 2: Effect of angle of notch on energy of rupture of mild steel
Angle of notch (degree) Sketch of specimen Charpy impact value
0
22.1
30
24.4
45
23.1
90
25.9
120
41.8
150
66.2
180
63.1
In manufacturing locomotive wheels, coins, connecting rods etc. the components are
subjected to impact (shock) loads. These loads are applied suddenly. The stresses induced in
these components are many times more than the stress produced by gradual loading.
Therefore, impact tests are performed to assess shock absorbing capacity of materials
subjected to suddenly applied loads.

AHSANULLAH UNIVERSITY OF SCIENCE AND TECHNOLOGY DEPARTMENT OF CIVIL ENGINEERING
CE 212: Mechanics of Solids Sessional Page | 26
Impact tests provide information on the resistance of a material to sudden fracture
where a sharp stress rise or flaw is present. In addition to providing information not available
from any other simple mechanical test, these tests are quick and inexpensive. The data
obtained from such impact test is frequently employed for engineering purposes.
Various standard impact tests are widely employed in which notched specimens are
broken by a swinging pendulum. The most common tests of this type are the Charpy V-notch
test and the Izod test which are described in ASTM E23, Standard test Methods for notched
bar impact testing of metallic materials. Another test method, although not a standard test
method, is the tension impact test.
These types of impact tests have given way to testing methods that make use of
fracture mechanics. Fracture mechanics allow more sophisticated analysis of materials
containing cracks and sharp notches. However, the advantages of fracture mechanics are
achieved at the sacrifice of simplicity and economy. Impact tests such as the Charpy, Izod,
and tension impact have thus remained popular despite their shortcomings, as they serve a
useful purpose in quickly comparing materials and obtaining general information on their
behavior.
Many materials, including metals, exhibit marked changes in impact energy with
temperature. It is known that there tends to be a region of temperatures over which the
impact energy increases rapidly from a lower level that may be relatively constant to an upper
level that may also be relatively constant. Such temperature transition behavior is common
for metal materials. This temperature dependence for various steel alloys with the same
hardness but different carbon contents is graphically shown in Figure 2. This figure shows the
impact energy obtained from Charpy V-notch impact specimens as a function of temperature.
The temperature transition behavior is of engineering significance since it aids in comparing
materials for use at various temperatures. In general, a material should not be severely loaded
at temperatures where it has low impact energy.
In charpy test, the specimen is placed as ‘Simply supported beam’ and In Izod test,
the specimen is placed as ‘cantilever beam’ (Figure 3). The specimens have V-shaped notch
of 45°. U-shaped notch is also common. The notch is located on tension side of specimen
during impact loading. Depth of notch is generally taken as t/5 to t/3 where ‘t’ is thickness of
the specimen. Table 2 represents typical response of angle of notch on charpy impact strength

AHSANULLAH UNIVERSITY OF SCIENCE AND TECHNOLOGY DEPARTMENT OF CIVIL ENGINEERING
CE 212: Mechanics of Solids Sessional Page | 27
Figure 2: Temperature Dependence of Charpy V-Notch Impact Resistance for Different
Alloys Hardened to HRC 34 (N.E. Dowling). (Image source: Internet)
Figure 3: (a) Charpy setup (b) Izod setup (Image source: Internet)

AHSANULLAH UNIVERSITY OF SCIENCE AND TECHNOLOGY DEPARTMENT OF CIVIL ENGINEERING
CE 212: Mechanics of Solids Sessional Page | 28
Figure 4: Impact test specimen with specification (Image source: Internet)
7. SPECIFICATION OF MACHINE AND SPECIMEN
Impact testing machine:
Impact capacity = 407.74 joule
Weight of striking hammer = 27.22 kg (60 lb)
Swing radius of hammer = 900.1 mm (35.437 inch)
Angle of hammer before striking = 160°
Striking velocity of hammer = 5.47 m/sec. (17.9 ft/sec.)
Specimen:
Specimen size = (Figure 4)
Type of notch = (Figure 4)

AHSANULLAH UNIVERSITY OF SCIENCE AND TECHNOLOGY DEPARTMENT OF CIVIL ENGINEERING
CE 212: Mechanics of Solids Sessional Page | 29
Angle of notch = (Figure 4)
Depth of notch = (Figure 4)
8. PROCEDURE
i) Measure the lateral dimensions of the specimen at full section and at the notch.
ii) Place the specimen in proper position. Set the hammer block at a certain height and then
release it.
iii) When the hammer block stops swinging, record the value of absorbed energy displayed
on the screen.
9. DATA
Obs.
No.
Type of
test
Name
of
metal
Specimen
type
Specimen
depth
Specimen
width
Depth
of
notch
Depth
at
notch
Absorbed
Energy,
E (J)
1 Charpy
2 Izod
3 Tension
Depth at notch = Specimen depth - Depth of notch
Cross sectional area at notch, ANotch = Depth at notch × Specimen width
Energy required to break the specimen = Absorbed Energy, E
Notch impact strength / Impact toughness, U = Absorb energy / Effective cross section area at
notch = E/ANotch
10. FAILURE PATTERNS
Figure 5: Fractured pieces of Charpy Impact specimens

AHSANULLAH UNIVERSITY OF SCIENCE AND TECHNOLOGY DEPARTMENT OF CIVIL ENGINEERING
CE 212: Mechanics of Solids Sessional Page | 30
Figure 6: Fractured piece of Charpy tension Impact specimens
Figure 7: Fractured piece of Izod(top) and Charpy(bottom) specimens
11. PRECAUTIONS
1. The specimen should be prepared in proper dimensions.
2. Do not stand in front of swinging hammer or releasing hammer.
3. Place the specimen in proper position.
12. GRAPHS
1. Charpy Impact Strength vs. HRB
2. Izod Impact Strength vs. HRB
3. Tension Impact Strength vs. HRB

AHSANULLAH UNIVERSITY OF SCIENCE AND TECHNOLOGY DEPARTMENT OF CIVIL ENGINEERING
CE 212: Mechanics of Solids Sessional Page | 31
13. RESULT
Table 1: Charpy simple beam
Obs.
No.
Name
of
metal
Group Area at
notch,
ANotch
(mm)
HRB Absorbed
Energy,
E (J)
Impact
toughness,
U=E/
ANotch
(J/mm2)
Failure
Pattern
Failure
Surface
1
2
3
4
5
6
Table 2: Izod cantilever beam
Obs.
No.
Name
of
metal
Group Area at
notch,
ANotch
(mm)
HRB Absorbed
Energy,
E (J)
Impact
toughness,
U=E/
ANotch
(J/mm2)
Failure
Pattern
Failure
Surface
1
2
3
4
5
6
Table 3: Tension Impact Specimen
Obs.
No.
Name
of
metal
Group Area at
notch,
ANotch
(mm)
HRB Absorbed
Energy,
E (J)
Impact
toughness,
U=E/
ANotch
(J/mm2)
Failure
Pattern
Failure
Surface
1
2
3
4
5
6

AHSANULLAH UNIVERSITY OF SCIENCE AND TECHNOLOGY DEPARTMENT OF CIVIL ENGINEERING
CE 212: Mechanics of Solids Sessional Page | 32
14. DISCUSSION
(Discuss on the results found, graphs, and failure patterns and also compare the results
found, graphs and failure patterns.)
Point out the discussion
1.
2.
3. ….
15. ASSIGNMENT
1) Discuss the relative toughness and hardness values obtained for all materials tested.
2) What is the necessity of making a notch in impact test specimen?
3) Describe the fracture surface of the different materials tested.
4) If the sharpness of V-notch is more in one specimen than the other, what will be its effect
on the test result?
5) What is the effect of temperature on the values of rupture energy and notch impact
strength?

AHSANULLAH UNIVERSITY OF SCIENCE AND TECHNOLOGY DEPARTMENT OF CIVIL ENGINEERING
CE 212: Mechanics of Solids Sessional Page | 33
EXPERIMENT NO.: 4
TENSION TEST OF MILD STEEL SPECIMEN

AHSANULLAH UNIVERSITY OF SCIENCE AND TECHNOLOGY DEPARTMENT OF CIVIL ENGINEERING
CE 212: Mechanics of Solids Sessional Page | 34
Experiment No.: 4
Tension test of Mild Steel Specimen
1. OBJECTIVE
-To determine the mechanical properties of steel specimen.
-To perform the tensile test of mild steel.
-To observe the tensile strength of different steel grades.
-To study the failure pattern of different steel grades.
-To compare the performances different steel grades.
2. ASTM REFERENCE
ASTM E 8 Standard Test Methods for Tension Testing of Metallic Materials
3. SIGNIFICANCE
This experiment provides fundamental knowledge on tension behaviour of materials
specially mild steel, test procedure, universal testing machine and its working principal,
tension specimens, failure patterns etc.
4. APPARATUS AND MACHINE
UTM, stop watch, digital slide calipers and computer.
5. SPECIMEN
Mild steel specimens (40, 60, and 72.5 grades) of 25mm diameter.
6. THEORY
Elasticity & Plasticity: When external forces are applied on a body, made of engineering
materials, the external forces tend to deform the body while the molecular forces acting
between the molecules offer resistance against deformation or displacement of the particles
continues till full resistance to the external forces is setup. If the forces are now gradually
diminished, the body will return, wholly or partly to its original shape. Elasticity is the
property by virtue of which a material deformed under the load is enabled to return to its
original dimension when the load is removed. If a body regains completely its original shape,
it is said to perfectly elastic.

AHSANULLAH UNIVERSITY OF SCIENCE AND TECHNOLOGY DEPARTMENT OF CIVIL ENGINEERING
CE 212: Mechanics of Solids Sessional Page | 35
Plasticity is the converse of elasticity. A material in plastic state is permanently
deformed by the application of load, and it has no tendency to recover. Every elastic material
possesses the property of plasticity. Under the action of large forces, most engineering
materials become plastic and behave in a manner similar to a viscous liquid. The
characteristic of the material by which it undergoes inelastic strains beyond those at the
elastic limit is known as plasticity. When large deformations occur in a ductile material
loaded in the plastic region, the material is aid to undergo plastic flow.
Figure 1: Stress-strain diagram of Mild Steel in tension
Proportional Limit (Point A): It is the limitingvalue of the stress upto which stress is
proportional to strain.
Elastic Limit (Point B): This is the limiting value of stress upto which if the material is
stressed and then released (unloaded), strain disappears completely the original length is
regained. Its determination, experimentally, is extremely difficult, and therefore its exact
location on the stress-strain diagram is usually not known, even though it is generally higher
than the proportional limit.
Permanent set/permanent deformation: If the load exceeds the elastic limit before it is
removed, the material does not fully regain its initial dimensions. In such a case the material
is said to experience a permanent deformation.
Elastic Recovery: The recovered deformation after removal of load.

AHSANULLAH UNIVERSITY OF SCIENCE AND TECHNOLOGY DEPARTMENT OF CIVIL ENGINEERING
CE 212: Mechanics of Solids Sessional Page | 36
Yield stress (Point C and D): Soon after the stress the elastic limit, low carbon steel attains
it yield point stress. The yield point of a material is defined as that unit stress that will cause
an increase in deformation without an increase in load. Upon the arrival of yield point, a
ductile material such as low carbon steel stretches an almost unbelievable amount, frequently
10%of the original length. When the yield stress is reached elongation takes place more
rapidly as plastic flow takes place over and atoms move into new positions and a return to the
original shape of the test piece is impossible.
Upper Yield Point (Point C): This is the stress at which the load starts reducing and the
extension.
Lower Yield Point (Point D): At this stage the stress remains same but strain increases for
some time.
The upper yield point is influenced considerably by the shape of the test specimen, speed of
testing, accuracy of alignment , the condition of the test piece (especially the presence of
residual stresses in a test on the full cross section) and by the testing machines itself and is
sometimes completely suppressed. The lower yield points much less sensitive and is
considered to be more representative.
Yield Strength by Offset Method: For materials having a stress-strain diagram such as
shown in figure (those that do not exhibit a well-defined yield point) a value of stress, known
as the yield strength for the material, is defined as one producing a certain amount of
permanent strain.
Ultimate Strength/Tensile Strength (Point E): This is the maximum stress the material can
resist. The ultimate strength represents the ordinate to the highest point in the stress-strain
diagram and is equal to the maximum load carried by the specimen divided by the original
cross-sectional area.
Breaking Strength/Fracture Strength/Rupture Strength (Point F): The stress at which
finally the specimen fails is called breaking point. It is the engineering stress at which
specimen fracture and complete separation of the specimen parts occurs.
Strain Hardening/Work Hardening: If a ductile material can be stressed considerable
beyond the yield point without failure, it is said to strain harden (When a material deformed
plasticity, it work hardens, that is, the stress has to be increased to give further deformation).
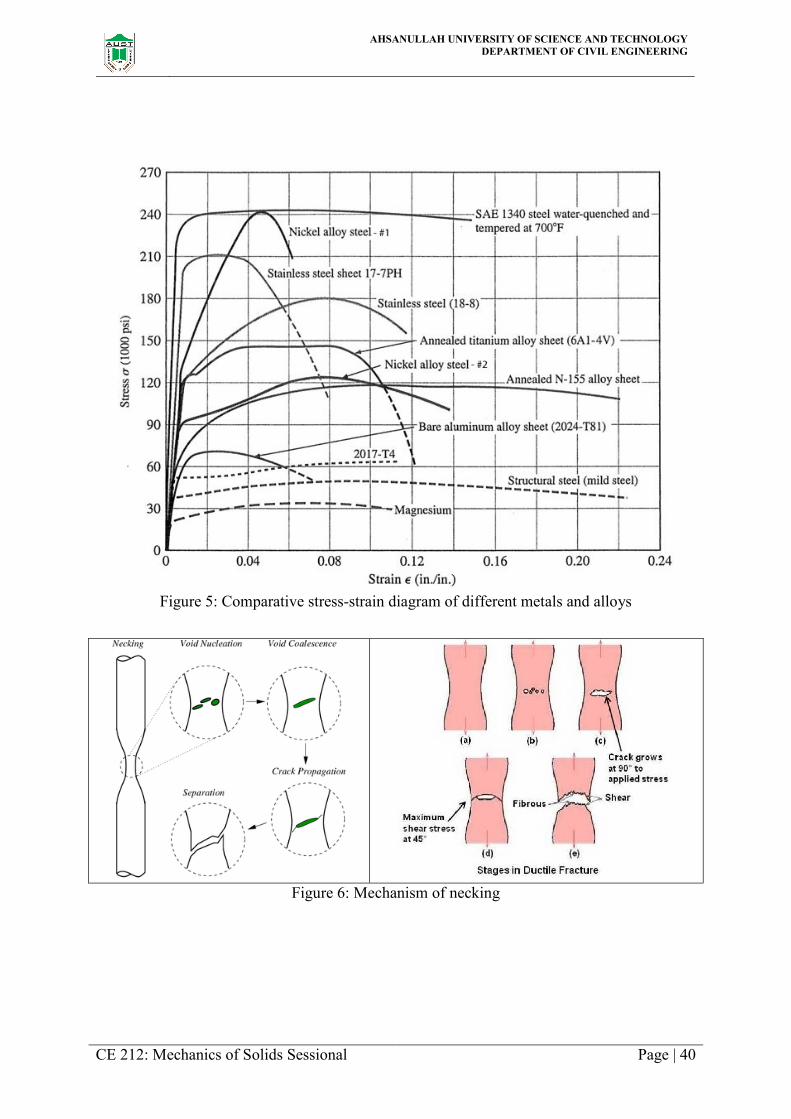
Necking: After reducing the maximum stress, a localized reduction in area, called necking,
begins, and elongation continues with diminishing load until the specimen breaks.

AHSANULLAH UNIVERSITY OF SCIENCE AND TECHNOLOGY DEPARTMENT OF CIVIL ENGINEERING
CE 212: Mechanics of Solids Sessional Page | 37
Modulus of Rigidity (G): It is defined as the ratio of shearing stress to shearing strain within
elastic limit.
Modulus of Resilience: The work done on a unit volume of material, as a simple tensile
force is gradually increased from zero to such a value that the proportional limit of the
material is reached, is defined as the modulus of resilience.
Modulus of Rupture/ Modulus of Toughness: The work done on a unit volume of material
as a simple tensile force is gradually increased from zero to the value causing rupture is
defined as the modulus of toughness.
Various machine and structure components are subjected to tensile loading in
numerous applications. For safe design of these components, their ultimate tensile strength
and ductilityto be determined before actual use. A material when subjected to a tensile load
resists the applied load by developing internal resisting force. These resistances come due to
atomic bonding between atoms of the material. The resisting force for unit normal cross-
section area is known as stress.
The value of stress in material goes on increasing with an increase in applied tensile
load, but it has a certain maximum (finite) limit too. The minimum stress, at which a material
fails, is called ultimate tensile strength.
The end of elastic limit is indicated by the yield point (load). This can be seen during
experiment as explained later in procedure with increase in loading beyond elastic limit,
initial cross-section area (Ai) goes on decreasing and finally reduces to its minimum value
when the specimen breaks. Some typical mechanical properties of mild steel are as follows:
Proportional Limit, p = 30~65 ksi (larger for stronger specimens)
Yield Strength, y = 35~75 ksi (larger for stronger specimens)
Ultimate Strength, ult = 60~100 ksi (larger for stronger specimens)
Modulus of Elasticity, E = 29000~30000 ksi (almost uniform for all types of specimens)
Poisson’s Ratio, ν = 0.20~0.30 ksi (larger for stronger specimens)
Modulus of Resilience = 0.02~0.07 ksi (larger for stronger specimens)
Modulus of Toughness = 7~15 ksi (smaller for stronger specimens)
Ductility = 10~35% (smaller for stronger specimens)
Reduction of Area = 20~60% (smaller for stronger specimens)

AHSANULLAH UNIVERSITY OF SCIENCE AND TECHNOLOGY DEPARTMENT OF CIVIL ENGINEERING
CE 212: Mechanics of Solids Sessional Page | 38
Figure 2: Typical stress-strain curve of Mild Steel in Tension done in the lab.
Figure 3: Specimen condition in the stress-strain curve of Mild Steel in Tension.
AHSANULLAH UNIVERSITY OF SCIENCE AND TECHNOLOGY DEPARTMENT OF CIVIL ENGINEERING
CE 212: Mechanics of Solids Sessional Page | 39
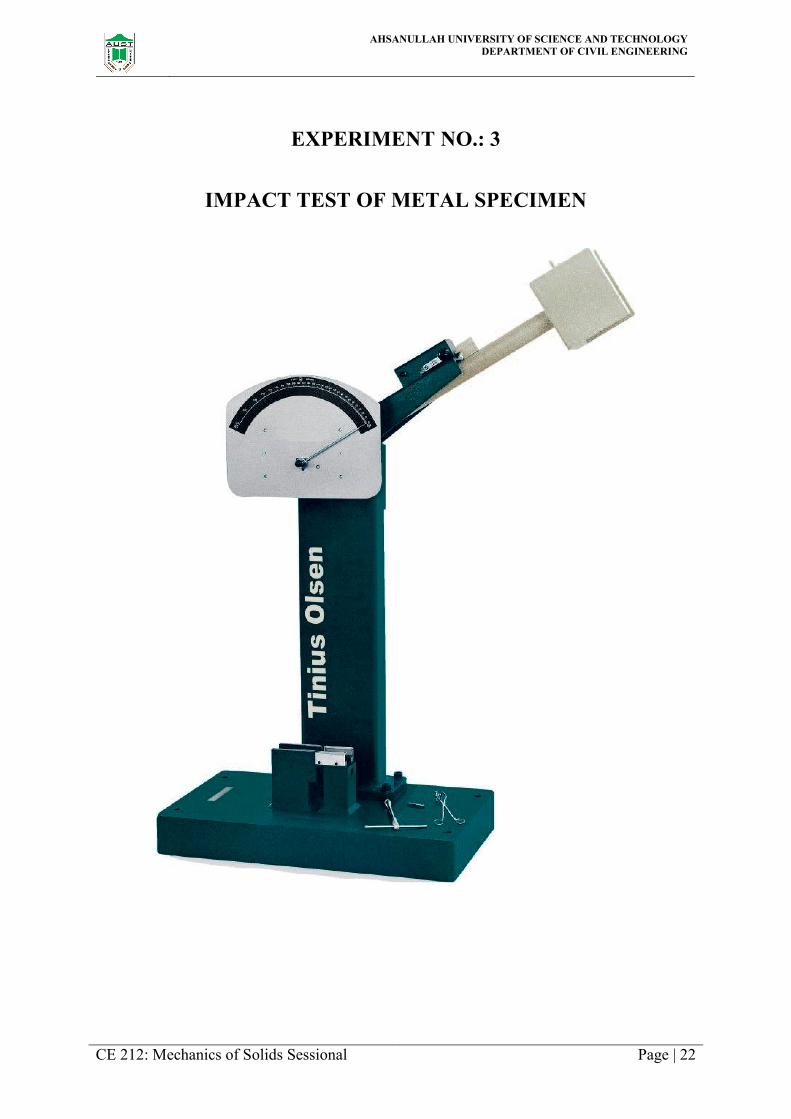
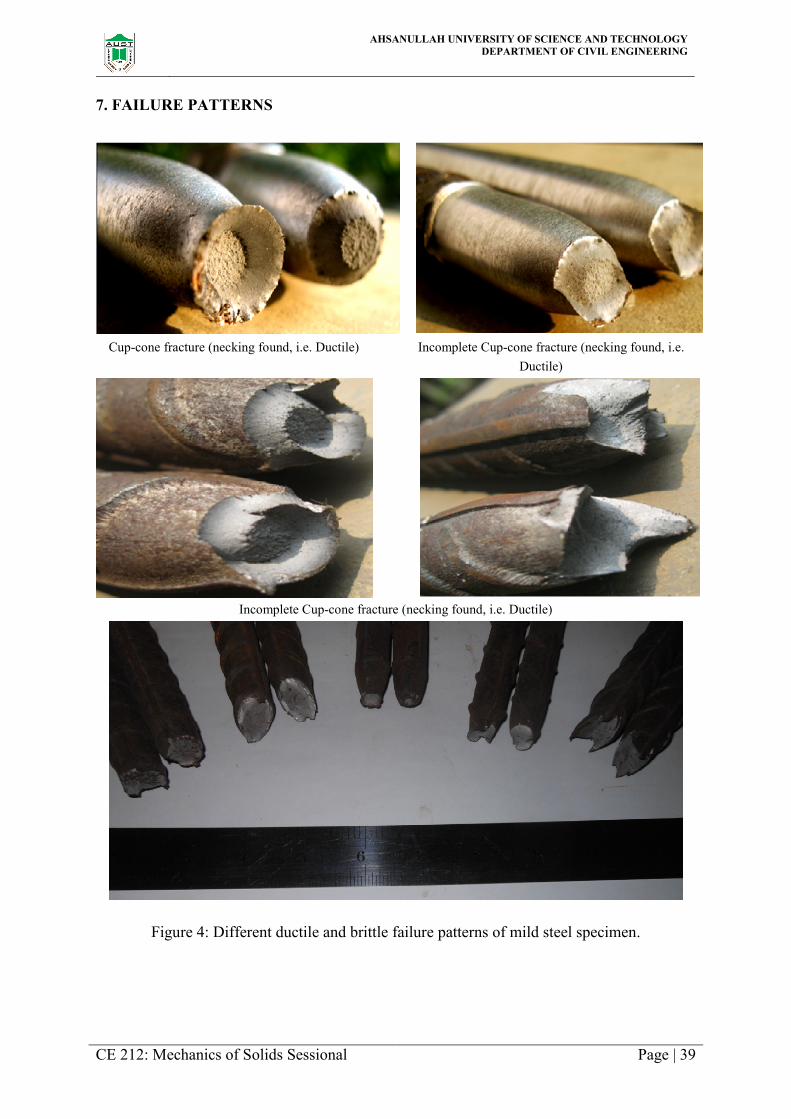
7. FAILURE PATTERNS
Cup-cone fracture (necking found, i.e. Ductile) Incomplete Cup-cone fracture (necking found, i.e.
Ductile)
Incomplete Cup-cone fracture (necking found, i.e. Ductile)
Figure 4: Different ductile and brittle failure patterns of mild steel specimen.
AHSANULLAH UNIVERSITY OF SCIENCE AND TECHNOLOGY DEPARTMENT OF CIVIL ENGINEERING
CE 212: Mechanics of Solids Sessional Page | 40
Figure 5: Comparative stress-strain diagram of different metals and alloys
Figure 6: Mechanism of necking

AHSANULLAH UNIVERSITY OF SCIENCE AND TECHNOLOGY DEPARTMENT OF CIVIL ENGINEERING
CE 212: Mechanics of Solids Sessional Page | 41
Typ
ical
ten
sion
tes
t re
sult
fro
m B
UE
T
AHSANULLAH UNIVERSITY OF SCIENCE AND TECHNOLOGY DEPARTMENT OF CIVIL ENGINEERING
CE 212: Mechanics of Solids Sessional Page | 42
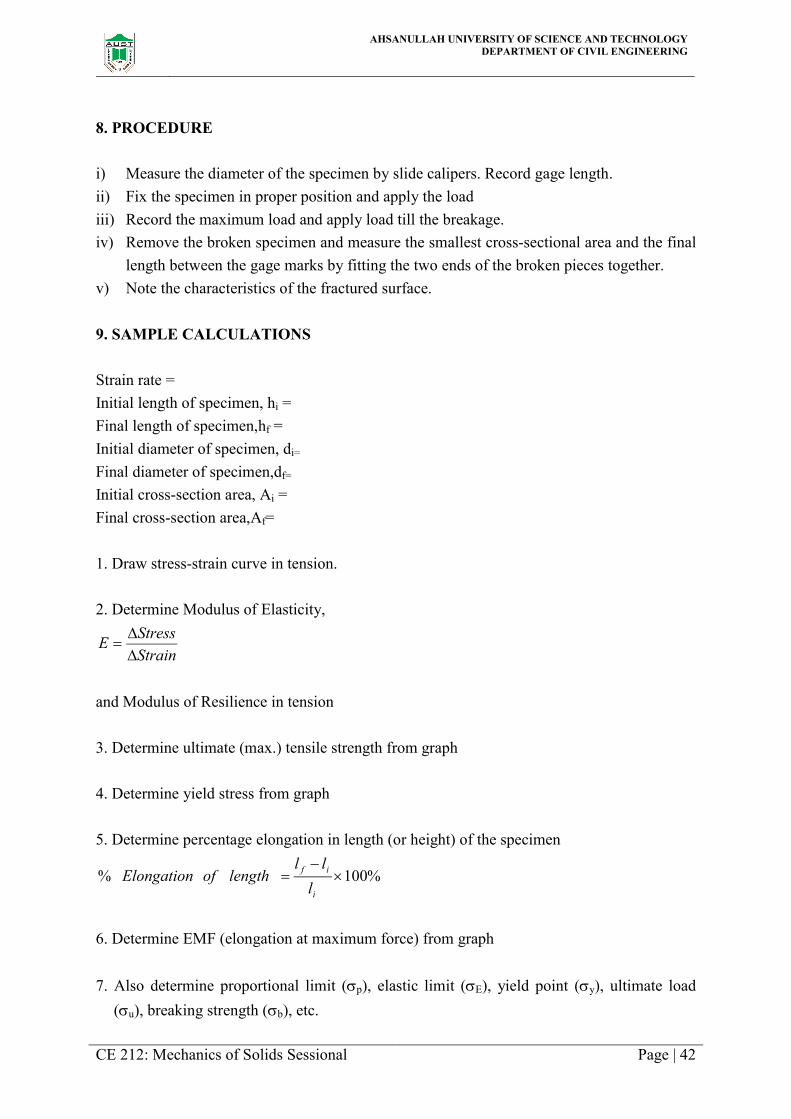
8. PROCEDURE
i) Measure the diameter of the specimen by slide calipers. Record gage length.
ii) Fix the specimen in proper position and apply the load
iii) Record the maximum load and apply load till the breakage.
iv) Remove the broken specimen and measure the smallest cross-sectional area and the final
length between the gage marks by fitting the two ends of the broken pieces together.
v) Note the characteristics of the fractured surface.
9. SAMPLE CALCULATIONS
Strain rate =
Initial length of specimen, hi =
Final length of specimen,hf =
Initial diameter of specimen, di=
Final diameter of specimen,df=
Initial cross-section area, Ai =
Final cross-section area,Af=
1. Draw stress-strain curve in tension.
2. Determine Modulus of Elasticity,
Strain
StressE
and Modulus of Resilience in tension
3. Determine ultimate (max.) tensile strength from graph
4. Determine yield stress from graph
5. Determine percentage elongation in length (or height) of the specimen
%100%
i
if
l
lllengthofElongation
6. Determine EMF (elongation at maximum force) from graph
7. Also determine proportional limit (p), elastic limit (E), yield point (y), ultimate load
(u), breaking strength (b), etc.

AHSANULLAH UNIVERSITY OF SCIENCE AND TECHNOLOGY DEPARTMENT OF CIVIL ENGINEERING
CE 212: Mechanics of Solids Sessional Page | 43
10. DATA TABLE
Deformation rate= mm/min, Grade= ksi, Brand=
Time (s) Load (N) Time (s) Load (N) Time (s) Load (N) Time (s) Load (N)
0 470 560 740
10 480 570 750
20 490 580 760
30 500 590 770
40 510 600 780
50 520 610 790
60 530 620 800
70 540 630 810
80 550 640 820
90 560 650 830
100 570 660 840
110 580 670 850
120 590 680 860
130 600 690 870
140 610 700 880
150 620 710 890
160 630 720 900
170 640 730 910
180 650 740 920
190 660 750 930
200 670 760 940
210 680 770 950
220 690 780 960
230 700 790 970
240 710 800 980
250 720 810 990
260 730 820 740
270 740 830 750
280 750 840 760
290 760 560 770
300 770 570 780
310 780 580 790
320 790 590 800
330 800 600 810
340 810 610 820
350 820 620 830
360 830 630 840
370 840 640 850
380 470 650 860
390 480 660 870
400 490 670 880
410 500 680 890
420 510 690 900
430 520 700 910
440 530 710 920
450 540 720 930
460 550 730 940

AHSANULLAH UNIVERSITY OF SCIENCE AND TECHNOLOGY DEPARTMENT OF CIVIL ENGINEERING
CE 212: Mechanics of Solids Sessional Page | 44
11. GRAPH
1. Tensile stress vs. strain curve of 40 Grade bar.
2. Tensile stress vs. strain curve of 60 Grade bar.
3. Tensile stress vs. strain curve of 72.5 Grade bar.
4. Combined Tensile stress vs. strain curve of 40, 60 and 72.5 grade bar.
5. Show all the points on the graphs 1, 2, and 3.
12. RESULT
(Students will fill up this section with their individual outcome/result about the test. Write the
stress values in psi and MPa as shown in Table)
Properties 40 grade steel 60 grade steel 72.5 grade steel
(500W grade)
E, psi (MPa)
p, psi (MPa)
p, in/in (mm/mm)
E, psi(MPa)
E, in/in (mm/mm)
y, psi(MPa)
y, in/in (mm/mm)
u, psi(MPa)
u, in/in (mm/mm)
b, psi(MPa)
b, in/in (mm/mm)
Ductility ratio, u /y
% Elongation
TS/YS
EMF, in/in (mm/mm)
Failure pattern
Failure type
13. DISCUSSION
(Discuss on the results found, graphs, and failure patterns and also compare the results found,
graphs and failure patterns.) Point out the discussion

AHSANULLAH UNIVERSITY OF SCIENCE AND TECHNOLOGY DEPARTMENT OF CIVIL ENGINEERING
CE 212: Mechanics of Solids Sessional Page | 45
14. ASSIGNMENT
1. Which type of steel have you tested? What is its carbon content?
2. What general information is obtained from tensile test regarding the properties of a
material?
3. Which stress have you calculated: nominal/engineering stress or true stress?
4. What kind of fracture has occurred in the tensile specimen and why?
5. Which is the most ductile metal? How much is its elongation?

AHSANULLAH UNIVERSITY OF SCIENCE AND TECHNOLOGY DEPARTMENT OF CIVIL ENGINEERING
CE 212: Mechanics of Solids Sessional Page | 46
EXPERIMENT NO.: 5
STATIC BENDING TEST OF STEEL AND TIMBER BEAM

AHSANULLAH UNIVERSITY OF SCIENCE AND TECHNOLOGY DEPARTMENT OF CIVIL ENGINEERING
CE 212: Mechanics of Solids Sessional Page | 47
Experiment No.: 5
Static Bending Test of Steel and Timber Beam
1. OBJECTIVE
-To observe the bending behavior of beams with different moment of inertia (I).
-To determine the Modulus of Elasticity (E) of wood by conducting bending test.
- To evaluate the deflection of beam w.r.t. load increament.
-To evaluate the failure patterns due to bending.
2. ASTM REFERENCE
ASTM D143 Standard Test Methods for Small Clear Specimens of Timber
3. SIGNIFICANCE
This experiment provides fundamental knowledge on bending behaviour of materials
specially timber beam, test procedure, universal testing machine and its working principal,
bending specimens, failure patterns etc.
4. APPARATUS
Universal Testing Machine (UTM), strain gauge or deflectometer, Support attaching
system, steel tape, stop watch and computer.
5. SPECIMENS
Timber beams
6. THEORY
Beam: A bar subject to forces or couples that lie in a plane containing the longitudinal axis of
the bar is called a beam. The forces are understood to act perpendicular to the longitudinal
axis.
The most economical beam is the one with least cross-sectional area and consequently
the least weigh per foot of length. In general, for a given area, a deeper beam is stronger than
a shallower one.

AHSANULLAH UNIVERSITY OF SCIENCE AND TECHNOLOGY DEPARTMENT OF CIVIL ENGINEERING
CE 212: Mechanics of Solids Sessional Page | 48
Bending Moment: The algebraic sum of the moments of the external forces to one side of
any cross-section of the beam about an axis through that section is called the bending
moment at that section.
Type of Bending: If couples are applied to the ends of the beam and on forces acts on the
bar, then the bending is termed pure bending. For example, in Figure 2 the portion of the
beam between the two downward forces is subjected to pure bending. Bending produced by
forces that do not form couples is called ordinary bending. A beam subject to pure bending
has only normal stresses with no shearing stresses set up in it; a beam subject to ordinary
bending has both normal and shearing stresses acting within it.
Neutral Surface: There always exists one surface in the beam containing fibers that do not
undergo any extension or compression, and thus are not subject any tensile or compressive
stress. This surface is called the neutral surface of the beam.
Neutral Axis: The intersection of the neutral surface with any cross-section of the beam
perpendicular to its longitudinal axis is called the neutral axis.
Navier’s Assumption: States that “plane section (normal to neutral axis) before bending
remains plane after bending”.
Theory of Simple Bending: Bending is usually associated with shear. However, for
simplicity we neglect the effect of shear and consider moment alone to find the stresses due
to bending (i.e. bending stress). Such a theory which deals with finding stresses at a section
due to pure moment is called simple bending theory.
Assumptions in theory of Simple Bending: The following assumptions are made in simple
theory of bending:
(1) The beam is initially straight and every layer of it is free to extend or contract & bends
into a circular arc
(2) The material is a homogeneous, isotropic & elastic continuum
(3) Young’s Modulus is same in tension and compression.
(4) The beam material obeys Hooke’s law and stresses are within elastic limits.
(5) Plane section remains plane even after bending
(6) The radius of curvature is large compared to depth of beam
(7) Beam deformation due to shear effects is neglected
(8) Effects of localized (concentrated) loads are neglected
(9) The beams bends about one of its principal axes
(10) Stresses are induced only in the longitudinal direction of the beam

AHSANULLAH UNIVERSITY OF SCIENCE AND TECHNOLOGY DEPARTMENT OF CIVIL ENGINEERING
CE 212: Mechanics of Solids Sessional Page | 49
For a simply supported beam with central loading, deflection under the load is given by
Figure 1: Simply supported beam with one-point load
)int(48
3
loadingpooneforEI
PL
where,
P = Applied load.
L = Effective span of the beam.
E = Modulus of Elasticity of wood.
I = Moment of inertia
δ = Mid-span deflection under the load.
Figure 2: Simply supported beam with two-point load
)int(1296
23 3
loadingpotwoforEI
PL

AHSANULLAH UNIVERSITY OF SCIENCE AND TECHNOLOGY DEPARTMENT OF CIVIL ENGINEERING
CE 212: Mechanics of Solids Sessional Page | 50
7. PROCEDURE
i) Measure all dimensions of the beam.
ii) Place the beam in proper position and apply load.
iii) Record the load at certain interval.
iv) Record the peak load from the load cell display of UTM machine.
v) Note the characteristics of the fractured surface.
8. OBSERVATIONS AND CALCULATIONS
Strain rate = 5mm/min
Calculation of Modulus of Elasticity (E),
Bending Stress (max),
I
cM maxmax
Mmax= Bending moment, c= distance of N.A. from tension/ compression face, I= moment of
inertia
Now, for one-point load,
EI
PL
48
3
I
LP
I
LP
E4848
33
Take
P from the load-deflection graph from the tangent at maximum slope.
For two-point load,
EI
PL
1296
23 3
I
LP
I
LP
E1296
23
1296
23 33
Take
P from the load-deflection graph from the tangent at maximum slope.
AHSANULLAH UNIVERSITY OF SCIENCE AND TECHNOLOGY DEPARTMENT OF CIVIL ENGINEERING
CE 212: Mechanics of Solids Sessional Page | 51
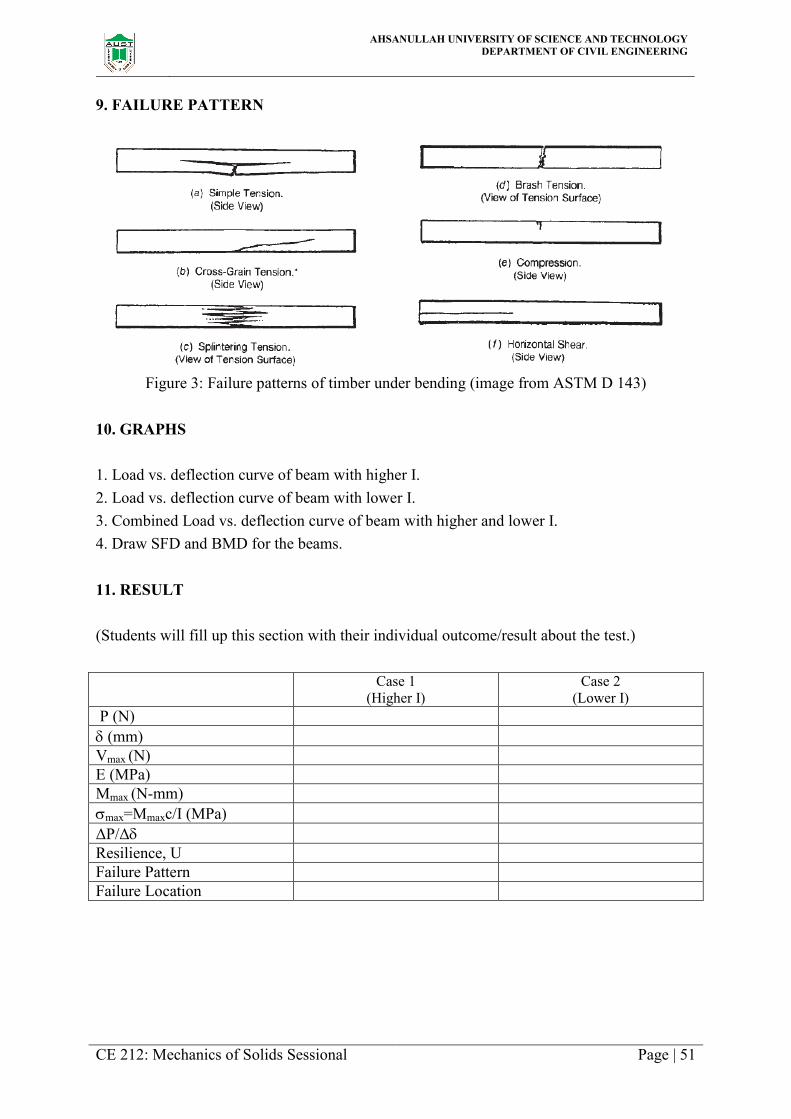
9. FAILURE PATTERN
Figure 3: Failure patterns of timber under bending (image from ASTM D 143)
10. GRAPHS
1. Load vs. deflection curve of beam with higher I.
2. Load vs. deflection curve of beam with lower I.
3. Combined Load vs. deflection curve of beam with higher and lower I.
4. Draw SFD and BMD for the beams.
11. RESULT
(Students will fill up this section with their individual outcome/result about the test.)
Case 1 (Higher I)
Case 2 (Lower I)
P (N)
(mm)
Vmax (N)
E (MPa)
Mmax (N-mm)
max=Mmaxc/I (MPa)
ΔP/Δ
Resilience, U
Failure Pattern
Failure Location

AHSANULLAH UNIVERSITY OF SCIENCE AND TECHNOLOGY DEPARTMENT OF CIVIL ENGINEERING
CE 212: Mechanics of Solids Sessional Page | 52
12. DISCUSSION
(Discuss on the results found, graphs, and failure patterns and also compare the results found,
graphs and failure patterns.) Point out the discussion
1.
2.
3. ….
13. ASSIGNMENT
1. What is the central deflection of a simply supported beam under concentrated load?
2. Why beam are provided with depth lager than width?
3. What is strain controlled test? Describe the advantages of strain controlled test over stress
controlled test.
4. Your Laboratory test setup was one-point loading setup. Compare one-point loading setup
with two-point loading setup. Which loading setup would you adopt if given choice and
explain why?
5. Describe the Universal Testing Machine (UTM) being operated at your laboratory; also
describe its working procedure.
6. Explain why timber being stronger in tension than compression, always fails at the tension
face?
AHSANULLAH UNIVERSITY OF SCIENCE AND TECHNOLOGY DEPARTMENT OF CIVIL ENGINEERING
CE 212: Mechanics of Solids Sessional Page | 53
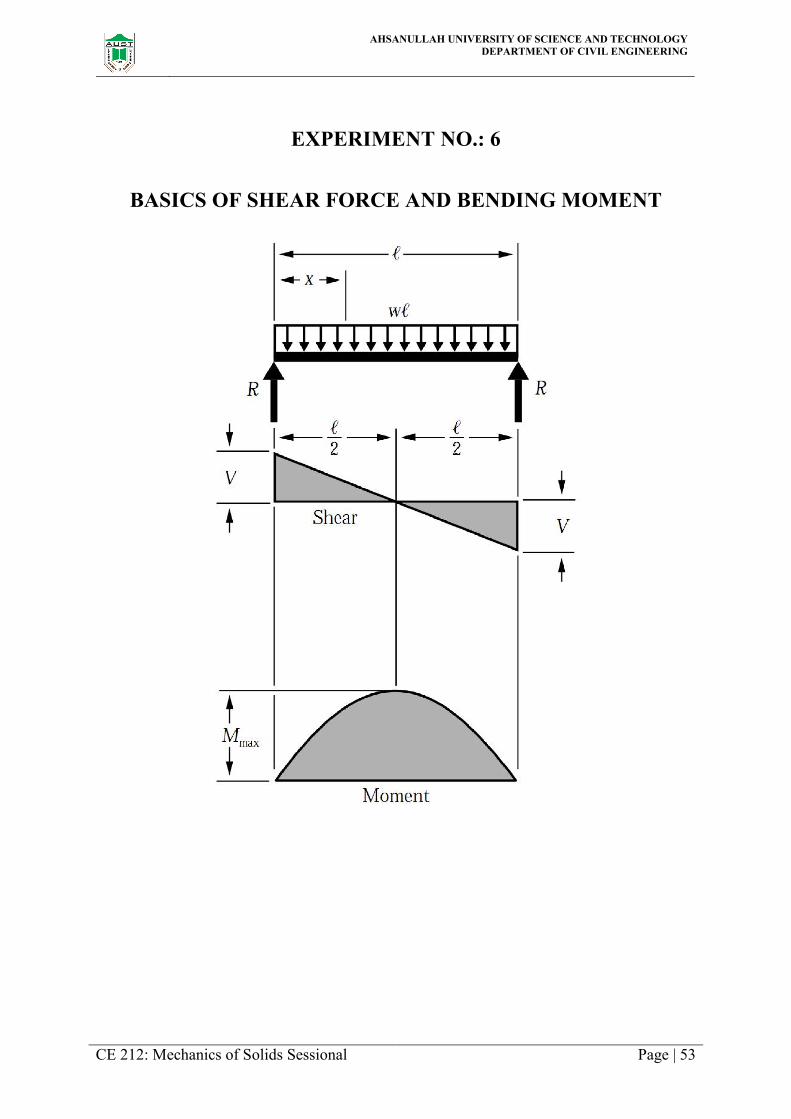
EXPERIMENT NO.: 6
BASICS OF SHEAR FORCE AND BENDING MOMENT

AHSANULLAH UNIVERSITY OF SCIENCE AND TECHNOLOGY DEPARTMENT OF CIVIL ENGINEERING
CE 212: Mechanics of Solids Sessional Page | 54
Experiment No.: 6
Basics of Shear Force and Bending Moment
1. OBJECTIVE
To draw shear force and bending moment diagram for a simply supported beam under
point and distributed loads.
2. SIGNIFICANCE
This experiment provides fundamental knowledge on Shear Force and Bending
Moment calculation, SFD and BMD construction etc.
3. THEORY
Beam: It is a structural member on which the load acts perpendicular to axis. It is that
whenever a horizontal beam is loaded with vertical loads, sometimes it bends due to the
action of the loads. The amounts by which a beam bends, depends upon the amount and types
of loads, length of beam, elasticity of the beam and the type of beam. In general beams are
classified as under:
i. Cantilever beam: - It is a beam whose one end is fixed to a rigid support and the other end
is free to move.
ii. Simply supported beam: - A beam supported or resting freely on the walls or columns at
its both ends is known as simply supported beam.
iii. Rigidly fixed or built-in beam: - A beam whose both the ends are rigidly fixed or built in
walls is called a fixed beam.
iv. Continuous beam: - A beam support having more than two supports is known as a
continuous beam.
Types of loading
i. Concentrated or point load: - load acting at a point on a beam is known as concentrated
or a point load.

AHSANULLAH UNIVERSITY OF SCIENCE AND TECHNOLOGY DEPARTMENT OF CIVIL ENGINEERING
CE 212: Mechanics of Solids Sessional Page | 55
ii. Uniformly distributed load: - A load, which is spread over a beam in such a manner that
each unit length is loaded to the same extent.
iii. Uniformly varying load: - A load, which is spread over a beam, in such a manner that its
extent varies uniformly on each unit length.
Shear force: The shear force at the cross-section of a beam may be defined as the unbalanced
forces acted parallel of the plane to the right or left of the section.
Bending moment: The bending moment at the cross-section of a beam may be defined as the
algebraic sum of the moment of forces, to the section.
4. IMPORTANT NOTES
1. If loading is uniformly distributed then shear force diagram will be a curve of first degree
and B.M. diagram will be a curve of second degree.
2. If the loading is point load then its corresponding S.F. diagram would be a curve of zero
degree and the B.M. diagram would be a curve of first degree.
3. If the loading is uniformly varying load its S.F. diagram would be curve of second degree
and BMD will be of third degree.
4. Bending moment is maximum where shear force is zero.
5. The first step is to calculate the reactions at the support, and then we proceed in usual
manner.
6. Point of contra flexure is the point where BM changes its sign.
7. B.M. at the support is zero for simply supported beam and at pinned support.
5. ASSIGNMENT
1. What is the point of contra-flexure?
2. What are sagging & hogging moments?
3. Define a beam, a cantilever beam, a fixed beam, and an overhang beam.
4. Define S.F. & B.M.
5. When bending moment will be maximum?
6. Solve the following problems:
i. A simply supported beam 4m. long is subjected to two point loads of 2kN & 4kN
each at a distance of 1.5m and 3m from the left end. Draw the S.F & B.M diagram
for the beam.
ii. Draw the S.F & B.M diagram for the beam of Example-1 for uniformly distributed
load of 0.5kN/m throughout the span.

AHSANULLAH UNIVERSITY OF SCIENCE AND TECHNOLOGY DEPARTMENT OF CIVIL ENGINEERING
CE 212: Mechanics of Solids Sessional Page | 56
iii. Draw the S.F & B.M diagram for the test setup of wooden beam bending test, use all
necessary data from the said test.
iv. All the problems discussed in the class.

AHSANULLAH UNIVERSITY OF SCIENCE AND TECHNOLOGY DEPARTMENT OF CIVIL ENGINEERING
CE 212: Mechanics of Solids Sessional Page | 57
EXPERIMENT NO.: 7
TEST OF SLENDER COLUMN

AHSANULLAH UNIVERSITY OF SCIENCE AND TECHNOLOGY DEPARTMENT OF CIVIL ENGINEERING
CE 212: Mechanics of Solids Sessional Page | 58
Experiment No.: 7
Test of Slender Column
1. OBJECTIVE
-To determine Euler load /critical load /buckling load of slender columns through experiment.
-To determine Euler crippling load /critical load /buckling load of slender columns
theoretically from Euler formula for slender columns.
-To compare the experimental critical load and theoretical critical load.
-To draw column strength curves (both experimental plot & theoretical plot).
2. APPARATUS
Digital slide calipers, Column testing apparatus, Steel scale, electronic balance, support
system and computer.
3. SIGNIFICANCE
This experiment provides fundamental knowledge on slender column and its
behaviour, test procedure, testing machine, Euler’s critical load for pined and fixed ended
columns etc.
4. SPECIMENS
Steel column.
5. THEORY
The term column is frequently used to describe a vertical member, whereas the word
strut is occasionally used in regard to inclined bars. The vertical members of a building frame
or any structural system which carry mainly compressive loads are called as columns. The
compression member of a truss is called strut. The common feature of the columns and struts
is such that they are subjected to compressive forces. A compression member is generally
considered to be column when its unsupported length is more than 10 times its least lateral
dimension.

AHSANULLAH UNIVERSITY OF SCIENCE AND TECHNOLOGY DEPARTMENT OF CIVIL ENGINEERING
CE 212: Mechanics of Solids Sessional Page | 59
The design of columns presents a problem; some of the reasons are:
1. There is no definite demarcation point between a column that is relatively short and a
compression block that is relatively tall.
2. Although a column is, for practical purpose, a straight, homogeneous compression
member, it is never made theoretically perfect. Any deviation in its alignment, lack of
homogeneity, or presence of internal stresses will act as a source of bending and possible
ultimate collapse.
3. The inability to apply perfectly axial load causes slight eccentricities to be imposed upon
the column that may contribute markedly on its bending tendency and possible ultimate
collapse.
4. The character and magnitude of the end restraint of ordinary columns may vary greatly.
6. CLASSIFICATION OF COLUMNS
The classification of structural column may be classified in three categories, they are as
follows:
(a) Long column
(b) Intermediate column
(c) Short column
The distinction between these three is determined by their failure behavior. Long columns
fail by buckling or excessive lateral bending; intermediate columns, by a combination of
crushing and buckling; Short compression blocks, by crushing/plastic squashing.
Ideal Column & Real Column: Columns that are perfectly straight, loaded exactly through
their centroid, free of any residual stress, and manufactured from a perfectly isotropic
material are termed as ideal columns .Such columns do not exist. However, ideal column
theory contributes greatly to our knowledge of column behavior, as will see.
Because steel column is manufactured by man, it contains certain human flaws.
Residual stresses due cooling after rolling, straightening, welding &initial crookedness are
always present. Perfectly straight columns do not exist and initial imperfections are to be
expected. Further, axial loads are rarely axial. Accidental eccentricity is inevitable. Finally,
no construction material is perfectly isotropic. This type of column is termed as a real
column. They truly exist.

AHSANULLAH UNIVERSITY OF SCIENCE AND TECHNOLOGY DEPARTMENT OF CIVIL ENGINEERING
CE 212: Mechanics of Solids Sessional Page | 60
Type of Failure of a Column: Failure of a column occurs by buckling, i.e. by lateral
deflection of the bar. In compression it is to be noted that failure of a short compression
member occurs by yielding of the material. Buckling, and hence failure, of a column may
occur even though the maximum stress in the bar is less than the yield point of the material.
Crushing failure/Compression
failure of column
Buckling failure of column
(1) Occurs in short column
(slenderness ratio is small)
(1) Occurs in long slender column
(slenderness ratio is high)
(2) Failure occurs due to yielding of material
(2) Failure occurs due to excessive lateral
displacement
(3) It crushes/ yields/squashes before buckling
(i.e. crushing stress/ yield stress> buckling
stress)
(3) It buckles before crushing / yielding
(i.e. buckling Stress> crushing stress/ yield
stress)
(4) Formula for critical load
(direct compression): =f x A
(4) Formula for critical load
(Euler’s crippling load): =
(5) In crushing / yielding, normal compressive
stress developed
(5) In buckling, bending stress developed
7. EULER’S THEORY FOR AXIALLY LOADED ELASTIC LONG COLUMN
The type of failure of columns due to excessive displacement is called buckling
failure. The buckling load depends upon the slenderness ratio of the column, length of the
column and also on the end conditions. Leonard Euler (1707-1783), a Swiss mathematician
was first to derive theoretical expression for buckling load.
The assumptions made in this theory are:
(a) The material of the column is homogeneous, isotropic and elastic; and thus obeys
Hooke’s law.
(b) The cross-section of the column is uniform throughout its length.
(c) The column is initially straight and is loaded axially.
(d) The column fails by buckling alone.
(e) The self weight of the column is negligible.
(f) The formula is applicable for only long slender column (the length of the column is very
large as compared its cross-sectional dimension) (i.e. it is not applicable for short and
intermediate column).
(g) The shortening of the column, due to direct compression (being very small), is neglected.

AHSANULLAH UNIVERSITY OF SCIENCE AND TECHNOLOGY DEPARTMENT OF CIVIL ENGINEERING
CE 212: Mechanics of Solids Sessional Page | 61
Figure 1: Effective length factor, K for different support condition
8. LIMITATIONS OF THE EULER FORMULA
Limitation (1)
Euler’s formula is applicable for concentrically (i.e. axially) loaded column, not
applicable for eccentrically loaded column.
Limitation (2)
Euler’s formula is applicable for long slender column only not for short column
because a longs column buckles before yielding (i.e. crushing) and short column crush /
yields before buckling.
Limitation (3)
Euler’s formula is related to stiffness (i.e. modulus of elasticity), not related to
strength: Euler’s formula shows that the critical load which causes buckling depends not
upon the strength of the material but only upon its dimensions and modulus of elasticity.
Limitation (4)
Euler’s formula is applicable upto elastic limit only, hence there is limiting value of
slenderness ratio, i.e. limiting value of critical stress, limiting value of buckling load.
Limitation (5)
Euler’s formula determines critical loads, not working loads. It is therefore necessary
to divide the right side of Euler’s formula by a suitable factor of safety – usually 2 to 3,
depending on the material – in order to obtain practical allowable value.

AHSANULLAH UNIVERSITY OF SCIENCE AND TECHNOLOGY DEPARTMENT OF CIVIL ENGINEERING
CE 212: Mechanics of Solids Sessional Page | 62
9. PROCEDURE
i) At first, measure the geometric dimensions of the column.
ii) Then place the column in the testing apparatus between the end supports.
iii) Apply the compressive load axially.
iv) Record the critical buckling load from the display.
v) Perform the test for all support conditions (as seen in Fig.1)
10. SAMPLECALCULATIONS
Calculate slenderness ratio, critical loads, and critical stresses for different support
conditions.
11. GRAPH
1. Combined graphs of experimental Pcr vs. K and theoretical Pcr vs. K.
2. Combined graphs of experimental Pcr vs. KL and theoretical Pcr vs. KL.
3. Combined graphs of experimental critical stress σcr vs. slenderness ratio, KL/r and
theoretical critical stress σcr vs. slenderness ratio, KL/r.
12. RESULT
Support
Condition
Effective
Length
Factor, K
Length,
L
(mm)
Radius
of
gyration,
r (mm)
Slenderness
ratio, KL/r
Analytical
Critical
Load, Pcr
(N)
Experimental
Critical Load,
Pcr
(N)
Critical
Stress,
σcr
(Analyt.)
Critical
Stress,
σcr
(Exp.)
F-F 0.5
H-F 0.7
H-H 1.0
H-Free 2
F-Free 2
*H= Hinge, F= Fixed.

AHSANULLAH UNIVERSITY OF SCIENCE AND TECHNOLOGY DEPARTMENT OF CIVIL ENGINEERING
CE 212: Mechanics of Solids Sessional Page | 63
13. DISCUSSION
(Discuss on the results found, graphs, and failure patterns and also compare the results
found, graphs and failure patterns.)
Point out the discussion
1.
2.
3. ….
14. ASSIGNMENT
1. Derive the equation of Euler critical load for pin ended column.
2. Derive the equation of Euler critical load for fixed ended column.
3. Define the Euler critical buckling load.

AHSANULLAH UNIVERSITY OF SCIENCE AND TECHNOLOGY DEPARTMENT OF CIVIL ENGINEERING
CE 212: Mechanics of Solids Sessional Page | 64
EXPERIMENT NO.: 8
DIRECT SHEAR TEST OF METAL SPECIMENS

AHSANULLAH UNIVERSITY OF SCIENCE AND TECHNOLOGY DEPARTMENT OF CIVIL ENGINEERING
CE 212: Mechanics of Solids Sessional Page | 65
Experiment No.: 8
Direct Shear Test of Metal Specimens
1. OBJECTIVE
-To make a shear of metal specimens approximating the conditions of shear existing in rivets,
pins, and bolts
-To determine the strength in single and double shear
-To observe the shape and texture of the fractured surface.
2. APPARATUS AND MACHINE
UTM, shear tool, Slide calipers, stop watch and computer.
3. SIGNIFICANCE
This experiment provides fundamental knowledge on direct shear behaviour of
materials, test procedure, universal testing machine and its working principal, specimens,
failure patterns etc.
4. SPECIMENS
Steel screws.
5. THEORY
Shearing stress is one that acts parallel or tangential to stressed surface. It is different
from normal stress that acts perpendicular to the stressed surface, e.g. tension, compression or
bending stresses. It resists the tendency of a part of the body on one side of the plane to slide
against the other side of the same plane.
(a) (b)
Figure 1: (a) Johnson Shear Tool, (b) Customized Shear Tool

AHSANULLAH UNIVERSITY OF SCIENCE AND TECHNOLOGY DEPARTMENT OF CIVIL ENGINEERING
CE 212: Mechanics of Solids Sessional Page | 66
The direct shear test (also called transverse shear test) gives an approximation to the
correct values of shearing strength. This test is usually done in a Johnson type shear (Figure
1) of shear tool by clamping a portion of a material so that bending stress are minimized
across the plane along which the shearing load is applied. Because of inevitable bending and
friction between part of tool, it gives an indication of the shearing resistance of materials. The
direct shear test has further limitation for the determination of elastic strength or of the
modulus of rigidity or shear rigidity, because of difficulty to measure shearing strain.
Figure 2: Shear force acted upon the specimens in single and double shear
6. PROCEDURE
i) Measure the diameter of the specimen with the slide calipers.
ii) Fix the specimen in the shear tool such that it is in single shear and apply load until
rupture takes place.
iii) In the same way test the specimen for double shear.

AHSANULLAH UNIVERSITY OF SCIENCE AND TECHNOLOGY DEPARTMENT OF CIVIL ENGINEERING
CE 212: Mechanics of Solids Sessional Page | 67
7. SAMPLE CALCULATIONS
Calculate double, unit double and single shear stresses from maximum shear force data.
8. GRAPH
1. Combined Double Shear, Unit Double Shear and Single Shear force vs. displacement
graph.
9. RESULT
Type of
Shear
Dia
(mm)
Shear
Area
(mm2)
MaximumShear
force
(N)
Maximum
Shear stress or
Shear strength
(MPa)
Failure
pattern
Fracture
surface
Double
Shear
Unit
Double
Shear
Single
Shear
10. DISCUSSION
(Discuss on the results found, graphs, and failure patterns and also compare the results found,
graphs and failure patterns.)
Point out the discussion
1.
2.
3. ….
11. ASSIGNMENT
1. Why single shear strength is greater than unit double shear?
2. How we can measure shear rigidity?

AHSANULLAH UNIVERSITY OF SCIENCE AND TECHNOLOGY DEPARTMENT OF CIVIL ENGINEERING
CE 212: Mechanics of Solids Sessional Page | 68
EXPERIMENT NO.: 9
TEST OF HELICAL SPRING

AHSANULLAH UNIVERSITY OF SCIENCE AND TECHNOLOGY DEPARTMENT OF CIVIL ENGINEERING
CE 212: Mechanics of Solids Sessional Page | 69
Experiment No.: 9
Test of Helical Spring
1. OBJECTIVE
- To observe the load deflection relationship (stiffness) of the helical spring
- To determine some of its physical properties.
2. APPARATUS
Universal Testing Machine (UTM), digital slide calipers, steel scale and computer.
3. SIGNIFICANCE
This experiment will provide fundamental knowledge on behaviour of helical spring,
test procedure, universal testing machine and its working principal, type of spring tested etc.
4. SPECIMENS
Closely-coiled helical spring.
Figure 1: Different types of spring

AHSANULLAH UNIVERSITY OF SCIENCE AND TECHNOLOGY DEPARTMENT OF CIVIL ENGINEERING
CE 212: Mechanics of Solids Sessional Page | 70
Figure 2: Various lengths associated with a spring.
5. THEORY
A spring is a resilient member capable of providing large elastic deformation, and
basically defined as an elastic body whose function is to distort when loaded and to recover
its original shape when the load is removed. Mechanical springs are used in machines to exert
force, to provide flexibility and to store or absorb energy.
Helical springs (Figure 1, 2, 3) of round or square wire that are cylindrical or conical
in shape and are made to resist tensile, compressive, or torsional loads.
6. FEW DEFINITIONS
Free length: Length of spring at unloaded condition
Solid/Block height: Length of compression spring while loading make all coils touch
adjacent coil.
Block force: Force at which spring is detected being block.
Active coli: Those coils which are free to deflect
Total no. of coil: Number of active coils plus coils forming the ends.
Pitch: Centre to centre distance of coil/wire.
Mean coil dia: outer dia – one wire/coil dia
Slenderness ratio: Ratio of spring length to mean coil dia

AHSANULLAH UNIVERSITY OF SCIENCE AND TECHNOLOGY DEPARTMENT OF CIVIL ENGINEERING
CE 212: Mechanics of Solids Sessional Page | 71
(a)
(c)
(b) (d)
Figure 3: (a) close coil helical spring, (b) open coil helical spring, (c) bending spring (leaf
spring) (d) plate/flat spiral spring
7. ASSUMPTION OF SPRING
Any one coil of a closely coiled helical spring is assumed to lie in the plane which is
nearly perpendicular to the axis of the spring. Thus a section taken perpendicular to the
spring rod may be taken to be vertical.

AHSANULLAH UNIVERSITY OF SCIENCE AND TECHNOLOGY DEPARTMENT OF CIVIL ENGINEERING
CE 212: Mechanics of Solids Sessional Page | 72
8. TYPES OF SPRING
Depending on arrangement of coils
1. Close coiled helical spring
In a close-coiled helical spring, the coils are close together. The angle of helix is small
and the spring wire is subjected predominantly to torsional shear stress.
2. Open coiled helical spring
In an open-coiled helical spring, the coils are not close together hence the angle of
helix cannot be considered as small. The spring wire is subjected predominantly to bending
stress.
3. Plate/flat springs
Flat spiral springs, which release slowly over a period of time, are used to store
energy in clock.
4. Close-coiled conical spiral spring
The spring is conical in shape.
Depending on the load to be carried
1. Bending spring
A bending spring is the one which is subjected to a bending moment only. The
resilience of such a spring is mainly due to bending.
2. Torsion spring
A torsion spring is the one which is subjected to a twisting moment. The resilience of
such a spring is mainly due to torsion.

AHSANULLAH UNIVERSITY OF SCIENCE AND TECHNOLOGY DEPARTMENT OF CIVIL ENGINEERING
CE 212: Mechanics of Solids Sessional Page | 73
Depending on the Stiffness of spring
Stiffness of a spring can be defined as the load required to produce unit axial
deformation.
Figure 4 demonstrates three types of curves between load (P) and deflection (δ)
corresponding to three types of springs,
1. Linear spring
A linear spring is one in which deflection is proportional to the applied load.
2. Hard spring
A hard spring is one in which the rate of deflection decreases with the increase in the load.
3. Soft spring
A soft spring is one in which the rate of deflection increases with the increase in the load.
Figure 4: Load-deflection curve for three types of spring

AHSANULLAH UNIVERSITY OF SCIENCE AND TECHNOLOGY DEPARTMENT OF CIVIL ENGINEERING
CE 212: Mechanics of Solids Sessional Page | 74
Ordinary helical springs are linear spring. Hard spring and soft springs are the two
categories of non-linear springs.
9. RESILIENCE OF THE SPRING/ AND STRAIN ENERGY (U)
Resilience of the spring is the energy stored during extension/compression. It is
calculated as under the area of the load-deflection (P-δ) curve which is actually work done
by the applied force (Figure 5).
Figure 5: Strain energy of the spring
10. STRESSES IN THE SPRING
When an axial load P is applied to helical spring stresses on cross section of wire may come
from
1. Direct shear
2. Torsional shear due to twisting moment
3. Bending moment
The stresses due to direct shear and bending are very small and may be neglected in
comparison to torsion. So closely coiled helical spring is a torsion spring.

AHSANULLAH UNIVERSITY OF SCIENCE AND TECHNOLOGY DEPARTMENT OF CIVIL ENGINEERING
CE 212: Mechanics of Solids Sessional Page | 75
Shear Stresses
Consider a helical spring of circular cross section is loaded with a axial force P (Figure 6).
One important assumption need to be made here is that any one coil lies nearly in a plane
perpendicular to the axis of the helix (spring).
Figure 6: Closely-coiled helical spring
Considering the equilibrium of the upper portion of the spring bounded by an axial
section mn (parallel to the plane contain spring axis) it can be concluded from the equations
of statics that the stresses over the cross section mn of the coil reduce to a shearing force P
through the center of cross section and a torsion acting in a clockwise direction in the plane
of the cross section of magnitude,
T=PR
The torsion twists the coil which develops shear stress.
r
R
A
PstressshearMaximum
21, max
2
,r
P
A
PstressshearDirect DS
2
,4r
PRr
J
TrstressshearTorsional TS
r
R
A
P
r
PRr
r
PstressshearMaximum
21
2
,42max

AHSANULLAH UNIVERSITY OF SCIENCE AND TECHNOLOGY DEPARTMENT OF CIVIL ENGINEERING
CE 212: Mechanics of Solids Sessional Page | 76
***Torsional shear stress varies over the section and maximum at the outer surface.
where, P= Axial force applied on the spring
R= mean radius of the coil (i.e. distance from the axis of the spring to the centroid of the
rod’s cross section
D = outer diameter of spring
d = diameter of spring’s wire or rod
r = d/2= radius of spring’s wire or rod
N = Number of turns of the spring
L = Total length of spring’s rod=2πrN
J = Polar moment of inertia of the spring’s rod
12. DEFLECTION
An equation for the axial deflection of a helical spring in terms of the axial load,
spring dimensions, and materials constant may be conveniently determined by equating the
work required to deflect the spring to the strain energy in the twisted wire.
4
322 64)2*(,
Gd
NPR
GJ
RNPR
GJ
LPRDeflection
4
3
4
3 6464,
d
NKR
d
NPRGrigidityofModulus
13. DATA
Spring
No.
Spring type No. of
active coil
Radius of
wire, r
(mm)
Diameter of
wire, d
(mm)
Outer diameter,
D
(mm)
1 Closely coiled helical
spring
8 10.025 20.05 120.23
14. PROCEDURE
i) Measure the diameter of the spring wire at several locations to find the mean diameter.
ii) Record the number of turn of the spring as N.
iii) Measure the outer and inner diameter of the helical spring and hence find the mean
radius of the spring.
iv) Place the spring in proper position in UTM machine.

AHSANULLAH UNIVERSITY OF SCIENCE AND TECHNOLOGY DEPARTMENT OF CIVIL ENGINEERING
CE 212: Mechanics of Solids Sessional Page | 77
v) Apply load at a certain interval and record the corresponding displacement from the load
cell display.
vi) Continue applying load upto 3500N.
vii) After reaching 3500N load, unload the spring and then record the displacement value at
the same interval.
15. SAMPLE CALCULATION
2, rAwiretheofArea
r
R
A
PstressshearMaximum
21, max
100%max
DSstresssheardirectof
100%max
TSstresssheartorsionalof
4
322 64)2*(,
Gd
NPR
GJ
RNPR
GJ
LPRDeflection
4
3
4
3 6464,
d
NKR
d
NPRGrigidityofModulus
K
PPUspringtheofsilience
22
1,Re
2
16. GRAPHS
1. Load vs. displacement graph for spring.
17. RESULT
Spring
No.
A
(mm2)
P
(N)
DS
(N/mm2)
TS
(N/mm2)
max
(N/mm2)
(mm)
K
(N/mm)
U
(N-mm)
G
(N/mm2)
Type
of
spring
1
18. DISCUSSION
(Discuss on the results found, graphs, and failure patterns and also compare the results found,
graphs and failure patterns.) Point out the discussion
1.
2.
3. ….

AHSANULLAH UNIVERSITY OF SCIENCE AND TECHNOLOGY DEPARTMENT OF CIVIL ENGINEERING
CE 212: Mechanics of Solids Sessional Page | 78
19. ASSIGNMENT
1. Define stiffness, modulus of rigidity, shear stress.
2. Classify the spring from the shape of the P-δ curve.
3. Give some practical applications of helical spring.

AHSANULLAH UNIVERSITY OF SCIENCE AND TECHNOLOGY DEPARTMENT OF CIVIL ENGINEERING
CE 212: Mechanics of Solids Sessional Page | 79
EXPERIMENT NO.: 10
BASICS OF SHEAR CENTRE

AHSANULLAH UNIVERSITY OF SCIENCE AND TECHNOLOGY DEPARTMENT OF CIVIL ENGINEERING
CE 212: Mechanics of Solids Sessional Page | 80
Experiment No.: 10
Basics of Shear Centre
1. SHEAR CENTRE
The point where a shear force can act without producing any twist in the section. In
general not the centroid, but a point through which a force transverse to the axis of a beam
section can act and not cause any twisting of the beam section.
At shear center, resultant of internal forces passes. On symmetrical sections, shear
center is the center of gravity of that section.
In unsymmetrical sections, if the external applied forces act through the centroid of
the section, then in addition to bending, twisting is also produced. To avoid twisting, and
cause only bending, it is necessary for the forces to act through the particular point, which
may not coincide with the centroid. The position of this point is a function only of the
geometry of the beam section. It is termed as shear center.
The shear centre is always located on the axis of symmetry; therefore, if a member
has two axes of symmetry, the shear centre will be the intersection of the two axes. Channels
have a shear centre that is not located on the member
Figure 1: (a) and (b) Shear Centres on different sections
2. LOCATION OF SHEAR CENTRE IN CHANNEL SECTION
Consider a channel section as shown in figure 2. Now we shall find the position of the
plane through which the vertical loads must act so as to produce simple bending, with the x-
axis as neutral axis.

AHSANULLAH UNIVERSITY OF SCIENCE AND TECHNOLOGY DEPARTMENT OF CIVIL ENGINEERING
CE 212: Mechanics of Solids Sessional Page | 81
It may be assumed that the vertical shearing force, F at the section is taken up by the
web alone. In the flanges, there will be horizontal shear stresses which will be denoted by q.
Figure 2: Shear Centre in Channel Section
Let us consider an element ‘abcd’ cut from the lower flange by two adjacent cross-
sections apart and by a vertical plane parallel to the web and at distance ’u’ (which is
variable) from the free end of the lower flange. The difference in tensile forces T
and must be equal to the shear force on the side ‘ad’ of the element. Assuming a
uniform distribution of shear stress (since the thickness is small) over the thickness, we have,
The integration being carried out over the portion ‘ab’ of the flange.
The stress per unit length of the centre line of the section,
Therefore, it is seen that q is proportional to u.

AHSANULLAH UNIVERSITY OF SCIENCE AND TECHNOLOGY DEPARTMENT OF CIVIL ENGINEERING
CE 212: Mechanics of Solids Sessional Page | 82
The maximum value of
.
At the junction of the flange and web, the distribution of the shear stress is
complicated, so we may assume that the equation
holds good for u = 0 and u = b.
The average shear stress =
The longitudinal shear force in the top and bottom of the flange =
The couple about the z-axis of these shear forces =
Let us assume that the vertical shear force F acts through point ‘o’, the shear centre at
a distance c from O on the centre line of the web.
The twisting of this section is avoided if
which gives the position of the shear centre.
3. ASSIGNMENTS
1. What is the significance of shear centre of a structural component?
2. Determine the Shear centre for the following sections shown in figures below.

AHSANULLAH UNIVERSITY OF SCIENCE AND TECHNOLOGY DEPARTMENT OF CIVIL ENGINEERING
CE 212: Mechanics of Solids Sessional Page | 83
(a)
(b)
Figure 5: (a) and (b) typical section for shear centre calculation.

AHSANULLAH UNIVERSITY OF SCIENCE AND TECHNOLOGY DEPARTMENT OF CIVIL ENGINEERING
CE 212: Mechanics of Solids Sessional Page | 84
ACKNOWLEDGEMENT
The preparer would like to acknowledge the support of Ms. Zasiah Tafheem, Assistant
Professor, Mr. Md. Golam Rashed, Assistant Professor and Mr. Debasish Sen, Assistant
Professor, for their contribution in successful completion of the lab manual. The editor also
expresses his thanks to Mr. Rasel Reza, Lab in Charge, Strength of Materials Lab, for his
contribution in typing of different parts of the manual.
REFERENCES
1. Dr. Ishtiaque Ahmed, Mechanics of Solids Sessional Manual, Department of Civil
Engineering, Bangladesh University of Engineering and Technology (BUET).
2. Md. Ruhul Amin, Mechanics of Solids Sessional Manual, Department of Civil
Engineering, Bangladesh University of Engineering and Technology (BUET).
3. ASTM E8 / E8M, Standard Test Methods for Tension Testing of Metallic Materials,
ASTM International, West Conshohocken, PA, 2016, www.astm.org
4. ASTM A370-17, Standard Test Methods and Definitions for Mechanical Testing of Steel
Products, ASTM International, West Conshohocken, PA, 2017, www.astm.org
5. ASTM A48 / A48M, Standard Specification for Gray Iron Castings, ASTM International,
West Conshohocken, PA, 2016, www.astm.org
6. ASTM E18, Standard Test Methods for Rockwell Hardness of Metallic Materials, ASTM
International, West Conshohocken, PA, 2017, www.astm.org
7. ASTM D143, Standard Test Methods for Small Clear Specimens of Timber, ASTM
International, West Conshohocken, PA, 2000, www.astm.org
8. ASTM A370, Standard Test Methods and Definitions for Mechanical Testing of Steel
Products, ASTM International, West Conshohocken, PA, 2017, www.astm.org
9. ASTM E 23, Standard Test Methods for Notched Bar Impact Testing of Metallic
Materials, ASTM International, West Conshohocken, PA, 2017, www.astm.org

AHSANULLAH UNIVERSITY OF SCIENCE AND TECHNOLOGY DEPARTMENT OF CIVIL ENGINEERING
CE 212: Mechanics of Solids Sessional Page | 85
APPENDIX Lab Report Format
AHSANULLAH UNIVERSITY OF SCIENCE AND TECHNOLOGY
DEPARTMENT OF CIVIL ENGINEERING
COURSE NO: CE 212
COURSE TITLE: MECHANICS OF SOLIDS SESSIONAL
SPRING 2016
NAME:
ROLL: (IN BOLD)
YEAR/SEMESTER:
SECTION: (IN BOLD)
GROUP:
Figure A1: Sample of Cover Page

AHSANULLAH UNIVERSITY OF SCIENCE AND TECHNOLOGY DEPARTMENT OF CIVIL ENGINEERING
CE 212: Mechanics of Solids Sessional Page | 86
INDEX
NAME:
ROLL:
GROUP:
EXP.
NO.
EXPERIMENT NAME DATE
OF
PERF.
DATE
OF SUB.
REMARKS SIGNATURE
Figure A2: Sample of Index Page

AHSANULLAH UNIVERSITY OF SCIENCE AND TECHNOLOGY DEPARTMENT OF CIVIL ENGINEERING
CE 212: Mechanics of Solids Sessional Page | 87
COURSE NO:
CE 212
COURSE TITLE:
MECHANICS OF SOLIDS SESSIONAL
SECTION:
GROUP:
EXPERIMENT NO.:
EXPERIMENT NAME:
DATE OF PERFORFANCE:
DATE OF SUBMISSION:
NAME:
ROLL:
YEAR/SEMESTER:
DEPARTMENT:
Figure A3: Sample of Front Page of Experiments