Embed Size (px)
Citation preview

CDs Have Fingerprints Too
Ghaith Hammouri1, Aykutlu Dana2, and Berk Sunar1
1 CRIS Lab, Worcester Polytechnic Institute100 Institute Road, Worcester, MA 01609-2280
{hammouri,sunar}@wpi.edu2 UNAM, Institute of Materials Science and Nanotechnology
Bilkent University, Ankara, [email protected]
Abstract. We introduce a new technique for extracting unique finger-prints from identical CDs. The proposed technique takes advantage ofmanufacturing variability found in the length of the CD lands and pits.Although the variability measured is on the order of 20 nm, the techniquedoes not require the use of microscopes or any advanced equipment. In-stead, we show that the electrical signal produced by the photodetectorinside the CD reader is sufficient to measure the desired variability. Weinvestigate the new technique by analyzing data collected from 100 iden-tical CDs and show how to extract a unique fingerprint for each CD.Furthermore, we introduce a technique for utilizing fuzzy extractors overthe Lee metric without much change to the standard code offset construc-tion. Finally, we identify specific parameters and a code construction torealize the proposed fuzzy extractor and convert the derived fingerprintsinto 128-bit cryptographic keys.
Key words: Optical discs, fingerprinting, device identification, fuzzyextractor.
1 Introduction
According to the Business Software Alliance about 35% of the global softwaremarket, worth $141 Billion, is counterfeit. Most of the counterfeit software is dis-tributed in the form of a compact disc (CD) or a digital video disc (DVD) whichis easily copied and sold in street corners all around the world but mostly in de-veloping countries. Given the severity of the problem at hand, a comprehensivesolution taking into account the manufacturing process, economical implications,ease of enforcement, and the owner’s rights, needs to be developed. While thisis an enourmous undertaking requiring new schemes at all levels of implemen-tation, in this work, we focus only on a small part of the problem, i.e. securefingerprinting techniques for optical media.
To address this problem the SecuRom technology was introduced by SonyDADC. The technology links the identifiers produced to executable files whichmay only be accessed when the CD is placed in the reader. The main advantage ofthis technology is that it can be used with existing CD readers and writers. While
2 Ghaith Hammouri, Aykutlu Dana, and Berk Sunar
the specifics of the scheme are not disclosed, in practice, the technology seems tobe too fragile, i.e. slightly overused CDs become unidentifiable. Another problemis at the protocol level. The digital rights management (DRM) is enforced tooharshly, therefore significantly curtailing the rights of the CD owner.
In this paper we take advantage of CD manufacturing variability in order togenerate unique CD fingerprints. The approach of using manufacturing variabil-ity to fingerprint a device or to build cryptographic primitives has been applied inseveral contextes. A popular example is a new hardware primitives called Phys-
ical Unclonable Functions (PUFs). These primitives were proposed for tamper-detection at the physical level by exploiting deep-submicron and nano-scale phys-ical phenomena to build low-cost tamper-evident key storage devices [7, 8, 6, 12].PUFs are based on the subtleties of the operating conditions as well as randomvariations that are imprinted into an integrated circuit during the manufacturingprocess. This phenomenon, i.e., manufacturing variability, creates minute differ-ences in circuit parameters, e.g., capacitances, line delays, threshold voltages etc.,in chips which otherwise were manufactured to be logically identical. Therefore,it becomes possible to use manufacturing variability to uniquely fingerprint cir-cuits. More recently, another circuit fingerprinting technique was introduced.The technique exploits manufacturing variability in integrated chips to detectTrojan circuits inserted during the manufacturing process [5].
Another secure fingerprinting technology named RF-DNA was developed byMicrosoft Research [1]. The RF-DNA technology provides unique and unclon-able physical fingerprints based on the subtleties of the interaction of deviceswhen subjected to an electromagnetic wave. The fingerprints are used to pro-duce a cryptographic certificate of authenticity (COA) which when associatedwith a high value good may be used to verify the authenticity of the good and todistinguish it from counterfeit goods. Another application of manufacturing vari-ability is fingerprinting paper objects. In [4] the authors propose Laser SurfaceAuthentication which uses a high resolution laser microscope to capture the im-age texture from which the fingerprint is developed. In a more recent proposal, acheap commodity scanner was used to identify paper documents [3]. While mostof the results cited above were developed in the last decade, the idea of usingphysical fingerprints to obtain security primitives is not new at all. Accordingto [1], access cards based on physical unclonable properties of media have beenproposed decades ago by Bauder in a Sandia National Labs technical report [2].
Our Contribution: We introduce a method which exploits CD manufac-turing variability to generate unique fingerprints from logically identical CDs.The biggest advantage of our approach is that it uses the electrical signal gener-ated by the photodiode of a CD reader. Thus no expensive scanning or imagingequipment of the CD surface is needed. This means that regular CD readers canimplement the proposed method with minimal change to their design. We inves-tigate the new approach with a study of over 100 identical CDs. Furthermore,we introduce a new technique, called the threshold scheme, for utilizing fuzzyextractors over the Lee metric without much change to the standard code offsetconstruction [10]. The threshold scheme allows us to use error correcting codes

CDs Have Fingerprints Too 3
working under the Hamming metric for samples which are close under the Leemetric. The threshold scheme is not restricted to CDs, and therefore can servein any noisy fingerprinting application where the Lee metric is relevant. Withthe aid of the proposed fuzzy extractor we give specific parameters and a codeconstruction to convert the derived fingerprints into 128-bit cryptographic keys.
The remainder of the paper is organized as follows. In Section 2, we discussthe physical aspects of CD storage, the sources of manufacturing variability andthe statistical model capturing the CD variability. Section 3 presents experimen-tal data to verify our statistical model. In Section 4 we discuss the fingerprintextraction technique and determine the parameters necessary for key generation.We discuss the robustness of the fingerprint in Section 5 and finally conclude inSection 6.
2 Pits and Lands
On a typical CD data is stored as a series of lands and pits formed on the surfaceof the CD. The pits are bumps separated by the lands to form a spiral track onthe surface of the CD. The spiral track starts from the center of the CD andspirals outward. It has a width of about 0.5 µm and a 1.6 µm separation. Thelength of the land or pit determines the stored data. The encoding length canassume only one of nine lengths with minimum value in the range 833 to 972 nmup to a maximum of 3054 to 3563 nm with increments ranging from 278 to 324nm. Note that the range is dependent on the speed used while writing the CD.To read the data on the CD the reader shines a laser on the surface of the CDand collects the reflected beam. When the laser hits the pits it will reflect in adiffused fashion thus appearing relatively dark compared to the lands. Upon thecollection of the reflected beam, the reader can deduce the location and lengthof the lands and pits which results in reading the data on the CD.
CDs are written in two ways, pressing and burning. In pressed CDs a mastertemplate is formed with lands and pits corresponding to the data. The mastertemplate is then pressed into blank CDs in order to form a large number ofcopies. In burned CDs, the writing laser heats the dye layer on the CD-R to apoint where it turns dark, thus reflecting the reading laser in a manner consistentwith physical lands. Note that burned CDs will not have physical lands and pitsbut will act as if they had these features. Figures 1 and 2 show the lands andpits of a pressed CD. We captured Figure 1 using an optical microscope andFigure 2 using a scanning electron microscope.
2.1 Source of Variation
Similar to any physical process, during the writing process CDs will undergomanufacturing variation which will directly affect the length of the lands andpits. For burned CDs this variability will be a direct result of the CD velocitywhile writing takes place. This velocity is assumed to be at a fixed rate between1.2 and 1.4 m/s where the velocity variation during writing should be within

4 Ghaith Hammouri, Aykutlu Dana, and Berk Sunar
Fig. 1. Lands and pits image using an op-tical microscope
Fig. 2. Lands and pits image using a scan-ning electron microscope
±0.01m/s [11]. Pressed CDs are manufactured by molding thermoplastics from amicro or nanostructured master prepared by lithographic methods. The moldingprocess itself is optimized for replication fidelity and speed with typical repli-cation variations on the order of tens of nanometers [17]. The molding processinvolves contacting the thermoplastic with the master slightly above the glasstransition temperature of the material, with a preset pressure for a brief amountof time, cooling the master and the thermoplastic to below the glass transitiontemperature and demoulding. Local variations of polymer material’s mechani-cal and thermal properties, local variations of the temperature and pressure allpotentially lead to variations in the imprinted structures. The thermal stressesinduced during cooling and demoulding also potentially lead to variations. In thispaper we aim at using the small variation in the length of lands and pits in orderto form a unique fingerprint for each CD. In the next section we characterize thelength features of lands and pits.
2.2 Single Location Characterization
Together lands and pits form the full spiral track. Therefore, it makes senseto fingerprint only lands or pits. The length of both lands and pits will followsimilar distributions which is why we will simply use the term location to refer toeither of them. We label the lengths of n consecutive locations by starting from areference point on the track, as L1, L2, . . . , Ln. In the ideal setting Li = ci ·L fora small constant integer ci ∈ [3, 4, . . . , 11] and L ≈ 300 nm. However, due to thesubtle variations we discussed in the previous section we expect Li = ci ·L + `i.The variable `i is expected to be quite small compared to Li, and thereforedifficult to measure precisely. Still our measurements should be centered aroundthe ideal length. Hence, quite naturally across all identical CDs we model Li asa random variable drawn from a Gaussian distribution Hi = N(Mi, Σ) whereMi = ci · L and Σ denotes the mean and the standard deviation respectively3.
Here we are assuming that regardless of the location, the standard deviationΣ will be the same. This is a quite a realistic assumption since Σ essentially
3 N(µ, σ) is a normal distribution with mean µ and standard deviation σ.

CDs Have Fingerprints Too 5
captures the manufacturing variability which should affect all locations similarly.The more precise the manufacturing process is, the less of a standard deviationwe would expect Hi to have. A perfect manufacturing process would yield Σ = 0and would therefore give all CDs the same exact length of a specific locationacross all identical CDs. On the other hand, for better identification of CDs wewould like Hi to have a relatively large Σ.
In a typical CD reader, the reading laser is reflected from the CD surfaceback into a photodiode which generates an electrical signal that depends onthe intensity of the reflected laser. Therefore, the electrical signal is expectedto depict the shape of the CD surface. If these electrical signals are used tomeasure the length of any given location, we expect these measurements to havea certain level of noise following a Gaussian distribution. So for location i onCDj we denote this distribution by Dij = N(µij , σ). The noise in the lengthmeasurements is captured through the standard deviation σ. Since this quantitymainly depends on the readers noise, we assume that its the same for all CDsand all CD locations. Contrary to Σ, to identify different CDs using the lengthinformation of CD locations we would like to see a relatively small σ.
3 Experimental Validation
To validate the statistical model outlined in the previous section, we conductedextensive experiments on a number of CDs. We directly probed into the electri-cal signal coming out of the photodiode constellation inside the CD reader. Theintensity of this signal will reflect the CD surface geometry, and therefore can beused to study the length of the CD locations. To sample the waveform we useda 20 GHz oscilloscope. Each CD was read a number of times in order to get anidea of the actual D distribution. Similarly, we read from the same locations ofabout 100 identical CDs in order to generate the H distribution. Each collectedtrace required about 100 MBytes of storage space. Moreover, synchronizing thedifferent traces to make sure that the data was captured from the same locationof the CD was quite a challenge. We had to assign a master trace which repre-sented the locations we were interested in studying and then ran the other tracesthrough multiple correlation stages with the master to finally extract synchro-nized signals from the same locations on different CDs. Automating the processin order to accurately capture this massive amount of data was a time consumingchallenge. However, we note that all this work would be almost trivially elimi-nated if we had access to the internal synchronization signals of the CD readerchip. The captured signals were then further processed using Matlab to extractthe location lengths and obtain the distributions. After processing, we extractedthe length of 500 locations (lands) on the CDs. We used commercially pressedCDs for all the experiments reported in this paper.4
Figure 3 shows the histogram of lengths extracted from 550 reads for a ran-domly chosen location on one CD. The mean length of the histogram is about
4 We have verified a similar behavior for burned CDs. Not surprisingly, data comingfrom burned CDs had a much larger variation and was easier to analyze.

6 Ghaith Hammouri, Aykutlu Dana, and Berk Sunar
µij = 958 nm. This histogram captures the D distribution. The other locationsobserve similar distributions with different mean lengths which will depend onthe encoded information. When considering data coming from different locationsand different CDs we obtain σ = 20 nm (with an average standard deviation of2 nm on σ). This will be a good estimate for the noise observed during prob-ing of the electrical signals. These results verify the assumption that the noisein the electrical signal can be approximated as Gaussian noise. Note that withGaussian noise simple averaging can be used to substantially reduce the noiselevel. As we are interested in studying the behavior of the location lengths across
850 900 950 1000 1050 11000
5
10
15
20
25
30
35
40
Fig. 3. Histogram of reads coming fromthe same location on the same CD
880 900 920 940 960 980 1000 1020 1040 1060 10800
5
10
15
20
25
30
35
40
45
Fig. 4. Histograms of reads coming fromthe same location on two identical CDs
different CDs, we next shift our attention to two CDs before we look at a largerbatch of CDs. Figure 4 captures a histogram for the length of the same locationon two identical CDs. What is important here is the distance between the twoGaussians. The larger this distance becomes the easier it is to identify CDs. Ourbasic thesis for fingerprinting CDs is that the length of a single location will varyacross multiple identical CDs. As pointed out earlier, this behavior can be mod-eled with the Gaussian distribution Hi. The histogram in Figure 4 captures thisfor two CDs. To generalize these results and estimate the Hi distribution we needa larger sample space. The major problem here is that each data point needsto come from a different CD. Therefore, to obtain a histogram which clearlydepicts a Gaussian we would need to test on the order of 500 CDs. This wasnot possible as each CD required substantial time, computing power and storagespace in order to produce final data points. However, we were able to carry outthis experiment for about 100 CDs. Each CD was read about 16 times to reducethe noise. Finally, we extracted the lengths of 500 locations for each of the CDs.Figure 5 depicts the histogram over 100 CDs for a randomly chosen location outof the 500 extracted locations. The histogram in Figure 5 has a mean of about940 nm. Overall locations, Σ had a mean of 21 nm (with an average standarddeviation of 1.8 nm on Σ). The histogram in Figure 5 looks similar to a Gaussiandistribution generated from 100 data points. However, it would be interestingto get a confirmation that with more data points this histogram would actuallyyield a Gaussian. To do so, we normalized the lengths of each location by sub-
CDs Have Fingerprints Too 7
840 860 880 900 920 940 960 980 10000
1
2
3
4
5
6
7
8
9
10
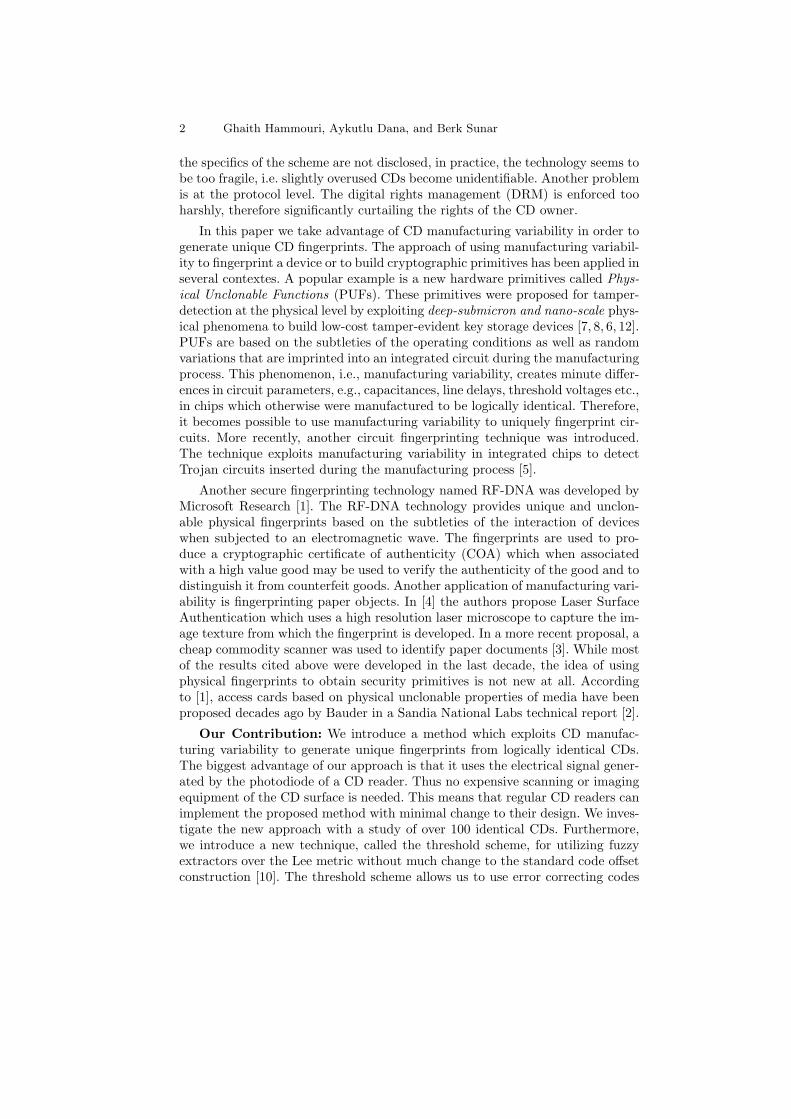
Fig. 5. Histograms of reads coming fromthe same location on 100 identical CDs
−150 −100 −50 0 50 100 1500
50
100
150
200
250
300
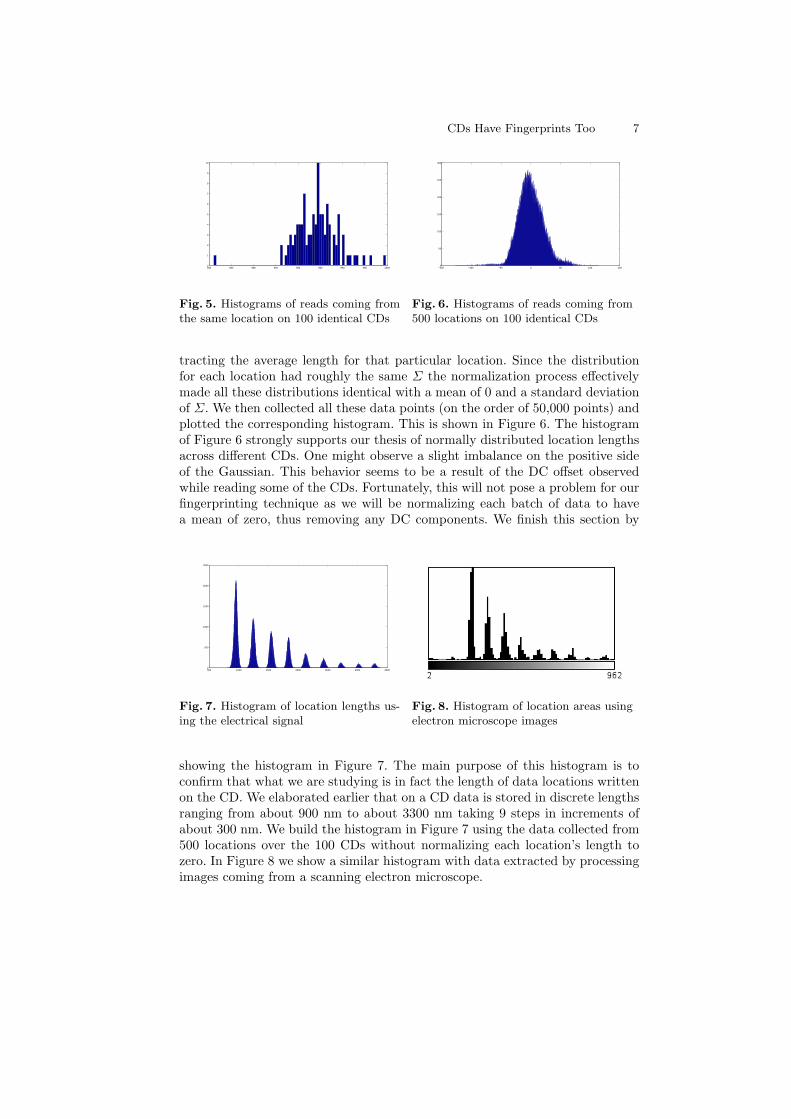
Fig. 6. Histograms of reads coming from500 locations on 100 identical CDs
tracting the average length for that particular location. Since the distributionfor each location had roughly the same Σ the normalization process effectivelymade all these distributions identical with a mean of 0 and a standard deviationof Σ. We then collected all these data points (on the order of 50,000 points) andplotted the corresponding histogram. This is shown in Figure 6. The histogramof Figure 6 strongly supports our thesis of normally distributed location lengthsacross different CDs. One might observe a slight imbalance on the positive sideof the Gaussian. This behavior seems to be a result of the DC offset observedwhile reading some of the CDs. Fortunately, this will not pose a problem for ourfingerprinting technique as we will be normalizing each batch of data to havea mean of zero, thus removing any DC components. We finish this section by
500 1000 1500 2000 2500 3000 35000
500
1000
1500
2000
2500
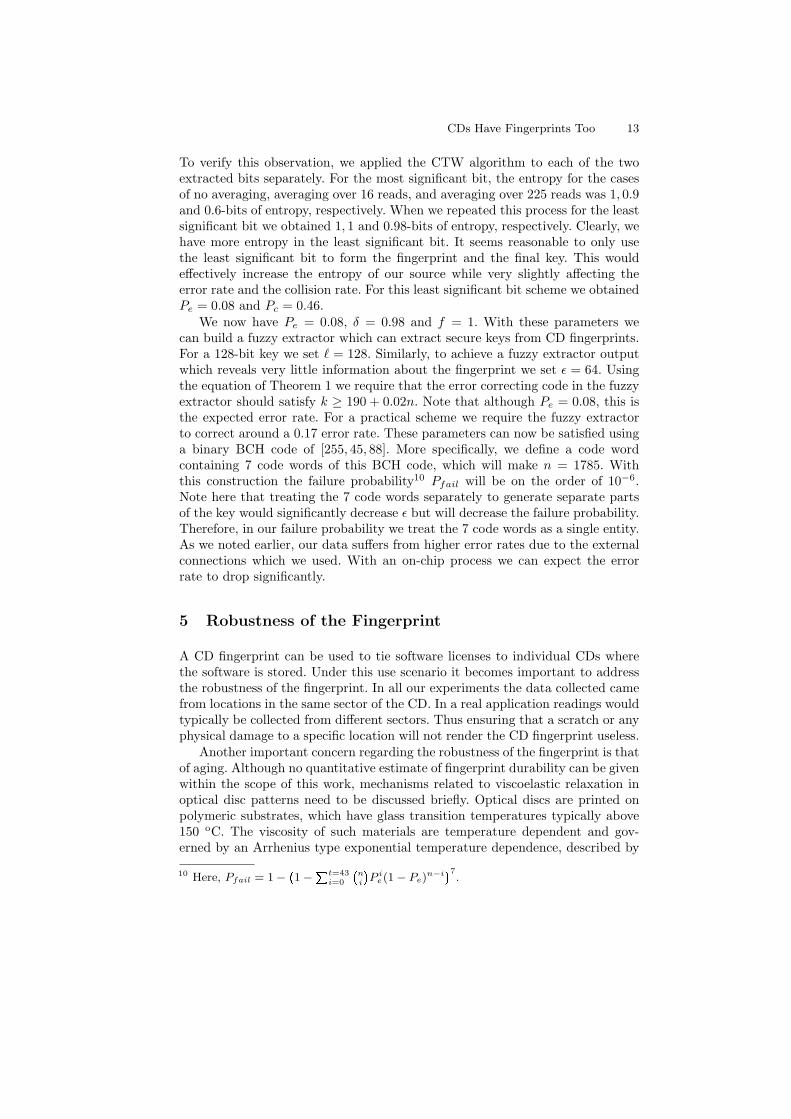
Fig. 7. Histogram of location lengths us-ing the electrical signal
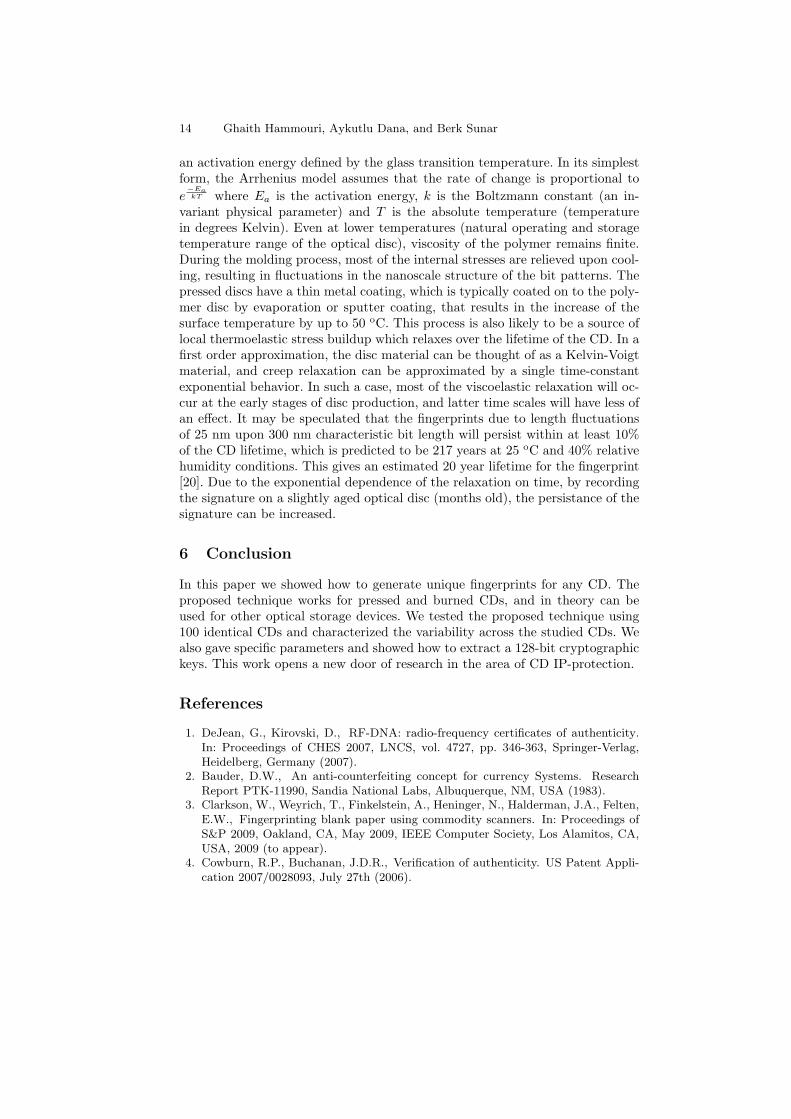
Fig. 8. Histogram of location areas usingelectron microscope images
showing the histogram in Figure 7. The main purpose of this histogram is toconfirm that what we are studying is in fact the length of data locations writtenon the CD. We elaborated earlier that on a CD data is stored in discrete lengthsranging from about 900 nm to about 3300 nm taking 9 steps in increments ofabout 300 nm. We build the histogram in Figure 7 using the data collected from500 locations over the 100 CDs without normalizing each location’s length tozero. In Figure 8 we show a similar histogram with data extracted by processingimages coming from a scanning electron microscope.

8 Ghaith Hammouri, Aykutlu Dana, and Berk Sunar
4 CD Fingerprinting
There are many challenges in deriving a robust and secure fingerprint. Oneimportant issue is the reading noise. Similar to a human fingerprint, we saw inthe previous section that the readings used to extract the CD fingerprint areinherently noisy. The extraction of a deterministic and secure fingerprint fromnoisy data has been previously studied in the literature [15, 14, 10]. Most relevantto our work is the fuzzy extractor technique proposed by Dodis et al. in [10]. Forthe remainder of this section we will present a quick review of the fuzzy extractortechnique and then discuss how this technique can be modified and applied tothe CD setting. Moreover, we will discuss the experimental results and presentvarious bounds needed to achieve high levels of security.
4.1 Fuzzy Extractors
Loosely speaking a fuzzy extractor is a technique to extract an almost uniformrandom string from a given input such that it is possible to reproduce the sameoutput string from a noisy version of the input. In [10] the authors show how afuzzy extractor can be built using an error correcting code along with a universalhashing function. Their construction requires that the output of the fingerprint(the biometric data in their language) be represented as an element of Fn forsome field F and an integer n which represents the size of the fingerprint. More-over, it is naturally assumed that the noise experienced by the fingerprint isupper bounded by a constant distance from the original fingerprint in order toguarantee identical reproduction of the extracted key. We start by quoting thefollowing theorem introduced in [10], and then give the specific constructionwhich the theorem describes.
Theorem 1. ([10]) Given any [n, k, 2t+1]F code C and any m, ε, there exists an
average-case (M,m, `, t, ε)-fuzzy extractor, where ` = m+kf −nf −2 log(1
ε)+2.
The generation algorithm GEN and the recovery algorithm REP are efficient if
C has efficient encoding and decoding.
We explain the parameters in the theorem by outlining an actual construc-tion. This construction is proposed in [10] and further explained in [12]. Asstated in the theorem, C is an error correcting code over the field F , wheref = log(|F|).5 For the construction we will also need a family of universal hash-ing functions H.6 The generation algorithm GEN takes the fingerprint x ∈ Fn
as input and outputs the triplet (k,w, v). Here, x is drawn from some distri-bution X over Fn which has min-entropy m. Note that in our context the pa-rameter m captures the entropy provided by the CD variability. GEN startsby computing w = x + c for a randomly chosen code word c ∈ C and thencomputes the key k = hv(x) ∈ {0, 1}` for some string v chosen uniformly atrandom such that hv ∈ H. The recovery algorithm REP takes in the helper data
5 Note that all logarithms in this paper are with respect to base 2.6 For details on universal hashing the reader is referred to [9].

CDs Have Fingerprints Too 9
(w, v) along with x′, a noisy version of the fingerprint x, and returns the keyk. REP starts by computing c′ = w − x′ which is a noisy version of c. If theHamming distance between x and x′ is less than t then so will the Hammingdistance between c and c′. Therefore, using the error correcting code C, REPcan reproduce c from c′. Next, REP computes x = w− c and consequently com-pute k = hv(x) which will conclude the recovery algorithm. All that remains tobe defined is the parameter ε which captures the security of the fuzzy extrac-tor. Specifically, if the conditional min-entropy7 H∞(X|I) (meaning X condi-tioned on I)8 is larger than m then SD((k, (w, v), I), (U`, (w, v), I) ≤ ε) whereSD(A,B)= 1
2
∑v |Pr(A = v) − Pr(B = v)| is the statistical distance between
two probability distributions A and B. Finally, U` is the uniform distributionover {0, 1}` and I is any auxiliary random variable.
With this construction we will have a clear way to build a fuzzy extractor.However, the key size ` and the security parameter ε will both depend on mand the code used. Moreover, the code will depend on the noise rate in thefingerprint. We finish this section by relating the min-entropy and the error rateof the fingerprint. Recall, that x is required to have a min-entropy of m andat the same time using the above construction x will have n symbols from F .To merge these two requirements we define the average min-entropy in everysymbol δ = m/n. We also define ν to be the noise rate in the fingerprint x andF = |F|. With these definitions we can now prove the following simple boundrelating the noise rate and the min-entropy rate δ/f .
Proposition 1. For the fuzzy extractor construction of Theorem 1, and for any
meaningful security parameters of ε < 1 and ` > 2 we have HF (ν) < δf. Where
HF is the F -ary entropy function.
Proof. From Theorem 1 we now that ` = m + kf − nf − 2 log(1
ε) + 2. Let
A = ` + 2 log(1
ε) − 2 = m + kf − nf . From the conditions above we now that
A > 0 and therefore m+kf−nf > 0. Let R = k/n which yields (δ+Rf−f)n > 0and therefore R > 1−δ/f . Using the sphere packing bound where R ≤ 1−HF (ν)we immediately get HF (ν) < δ
f.
As it is quite difficult to calculate the min-entropy for a physical source we willestimate this quantity over the symbols of x. The bound given above will give usan idea whether the min-entropy in the symbols of x will be sufficient to handlethe measured noise rate. Next we shift our attention to the fingerprint extractiontechnique. Note here that we still did not address how the data extracted fromthe CDs will be transformed into the fingerprint x.
4.2 Fingerprint Extraction
In Section 3 we described how the empirical data suggests that every CD hasunique location lengths. These location lengths as can be seen from Figure 7
7 The definition of min entropy is H∞(A) = − log(maxaPr[A = a]).8 Typically we use the | operator to mean concatenation. This will be the only part
of the paper where it will have a different meaning.

10 Ghaith Hammouri, Aykutlu Dana, and Berk Sunar
will have different values depending on the encoded information. Moreover, wediscussed earlier that the raw data measured from the electrical signal will some-times have different DC offsets. Therefore, it is important to process the databefore the different locations can be combined together in order to produce thefinal fingerprint x. The first step in processing the data coming from every lo-cation on every CD is to remove the signal noise. To achieve this, the lengthof every location on a CD is averaged over a number of readings. Since we areassuming Gaussian noise, the noise level σ will scale to σ/
√a where a is the
number of readings used for averaging. Next, we normalize the data using theideal average of each location. As the ideal location lengths are discretized itbecomes easy to find the ideal length for every location and subtract it fromthe measured lengths. This will guarantee that all location lengths have similardistributions as we saw in Figure 6. Finally, to remove the DC component weneed a second normalizing step. We subtract the mean of the reading comingfrom different locations of the same CD. Figures 9 and 10 show the variationin the length of 500 locations for two identical CDs after being averaged andnormalized. Each figure contains three traces with an added horizontal shift toset the traces apart. The top two traces in each figure are obtained from readingstaken at different times using one CD reader. The bottom trace in each figurewas obtained three months after the first two traces using a second CD readerwith a different brand and model. The vertical axis represents the variation innanometers from the ideal length of that location. These figures clearly supportthe idea of identical CDs having different fingerprints which are reproduciblefrom different readers. We still need to outline a technique to extract a final
Fig. 9. Length variation over 500 loca-tions from CD1 with the bottom tracetaken 3 months after the top two traces
Fig. 10. Length variation over 500 loca-tions from CD2 with the bottom tracetaken 3 months after the top two traces
fingerprint. Even after the previous averaging and normalization steps we willstill have errors in the length readings. Although we will be using a fuzzy ex-tractor to correct the errors, the biggest challenge towards achieving an efficientextraction technique will be the nature of these errors. The noise is Gaussianover the real values of the lengths. This means that even when the data is dis-cretized the error will manifest itself more as a shift error from the ideal lengthrather than a bit flip error. Unfortunately, the Hamming metric does not nat-

CDs Have Fingerprints Too 11
urally accommodate for this kind of error. Moreover, if we assume that everylocation length of the CD will be a symbol in the extracted fingerprint, thenthe error rate would be very high as it is very difficult to get the same exactlength for the CD locations. A more natural distance metric in this situationwould be the Lee metric [16]. However, this will require finding long codes thathave good decoding performance under the Lee metric. To solve this problem wepropose a threshold scheme which uses the Hamming distance while allowing ahigher noise tolerance level. The threshold scheme also works naturally with thefuzzy extractor construction of Theorem 1. Table 1 shows a formulation of thethreshold scheme applied to the CD setting. The threshold τ solves the error cor-
Threshold Scheme: (GEN,REP) parameterized by M, m, `, t, ε, l, C,H, τ = 2s
GEN: (k, w, v)← GEN(CDj)
1. Obtain (a) samples for the length of each of the n locations on CDj.2. Generate z = zn . . . z1:
a. Average the lengths over a samples,b. Subtract the ideal mean from the averaged reads,c. Normalize the sequence to have a zero mean and set that to z.
3. Find u such that −2u−1 ≤ zi ≤ 2u−1 − 1 for all i, and shift zi to 0 ≤ zi ≤ 2u − 1.4. Shift the binary representation of zi left by l bits, round to an integer and set to zi.5. Form z2,i, the lowest s + 1 bits of zi, and xi = z1,i, the remaining bits of zi.6. Set x = xn . . . x1 to be the fingerprint template.7. Choose a random code word c ∈ C, such that c = cn . . . c1.8. Compute wi = (xi|z2,i) + (c|τ) and form w = wn . . . w1.9. Randomly choose v to compute k = hv(x) where hv ∈ H, and output (k, w, v).
REP: k ← REP(CDj, w, v)
1. Generate z′ = z′
n . . . z′
1 as z = zn . . . z1 was generated in Steps 1 through 4 of GEN.2. Set c′i to be the highest u + l − s− 1 bits of wi − z′
i.3. Use C to correct c′ = c′n . . . c′1 to c = cn . . . c1.4. Compute xi = wi − ci.5. Form x = xn . . . x1 and return k = hv(x).
Table 1. Formulation of the threshold scheme for CD fingerprint extraction
recting problem with respect to the Lee distance. In particular, τ helps controlthe error rate which arises when treating the real values as symbols over somefield. Without a threshold scheme (τ = 0), the error rate will be very high. Onthe other hand, if τ grows too large then the error rate will be low. However, theHamming distance between the extracted fingerprint originating from differentCDs will decrease thus decreasing distinguishability between CDs. An importantaspect about the threshold scheme is that it is very simple to compute and doesnot require previous knowledge of the distribution average.

12 Ghaith Hammouri, Aykutlu Dana, and Berk Sunar
4.3 Entropy Estimation and 128-bit Security
The previous sections dealt with the theoretical aspects of extracting the CDfingerprint. In this section we take more of an experimental approach where weare interested in computing actual parameters. The most important parametersthat we need to estimate are the entropy of the source (the CD variability) andthe noise level. With these two parameters the rest of the parameters can bedetermined. The first and hardest task here will be to decide the amount ofentropy generated by the source. In [12] and [13] the authors use a universalsource coding algorithm in order to estimate the secrecy rate. In particular itwas proposed to use the Context-Tree Weighting Method (CTW) [19]. What isquite useful about the CTW algorithm is that in [18] it was shown that for anybinary stationary and ergodic source X, the compression rate achieved by CTWis upper bounded by the min-entropy H∞(X) as the length of the input sequenceapproaches infinity. This is a good indication about the entropy produced by thesource provided enough bits are fed to the algorithm. To apply this algorithm toour setting we start by using the data coming from the 100 CDs. On each CD wecollected data from 500 locations and processed the data with a threshold valueof τ = 22. The final data came out to be in the range [0, 25 − 1] and we did notuse any fractional bits so l = 0. With these parameters the size of the symbolswas f = 2. This means that every CD produced 1000 bits. The data was fed intothe CTW algorithm which resulted in a compression rate of about 0.83 bits ofentropy per extracted bit. Recall here that these samples were not averaged overmultiple reads. Therefore the error rate is quite high. When we averaged over16 samples the combined entropy rate became 0.71. This is expected since thenoise will add to the entropy. In order to get a more precise estimate for the minentropy we decided to average over 225 reads. With this many reads we had torestrict our sample to only 14 CDs as the amount of data quickly becomes large.With the new sample the compression rate of the CTW algorithm was about0.675 which seemed to be a good estimate of our min-entropy. For this sample,the average error rate is Pe = 0.08. On the other hand the collision probabilityPc, the probability of extracting similar bits between two different CDs, is about0.46.
Proposition 1 suggests that for a noise rate of 0.08 and f = 2 the entropyof the source should be at least 0.40 which translates to δ = 0.8 < 1.35, andtherefore we conclude that we have enough entropy in our source. However, withthis level of entropy we are placing stringent conditions on R, i.e. the rate ofthe error correcting code.9 To relax the restriction on the code rate we took acloser look at our source bits. Ideally the two bits would have the same entropy.However, looking at Figure 9 and 10 and multiple similar figures we clearly seethat there is a degree of dependency between the adjacent locations. There is alow probability of a sharp change in the length variability from one location toits neighbor. With this observation we would suspect that the most significantbit will have less entropy as it is less likely to change across adjacent locations.
9 Recall from the prof of Proposition 1 that R ≥ A/nf + (1− δ/f) for a security levelof at least A = ` + 2ε− 2.
CDs Have Fingerprints Too 13
To verify this observation, we applied the CTW algorithm to each of the twoextracted bits separately. For the most significant bit, the entropy for the casesof no averaging, averaging over 16 reads, and averaging over 225 reads was 1, 0.9and 0.6-bits of entropy, respectively. When we repeated this process for the leastsignificant bit we obtained 1, 1 and 0.98-bits of entropy, respectively. Clearly, wehave more entropy in the least significant bit. It seems reasonable to only usethe least significant bit to form the fingerprint and the final key. This wouldeffectively increase the entropy of our source while very slightly affecting theerror rate and the collision rate. For this least significant bit scheme we obtainedPe = 0.08 and Pc = 0.46.
We now have Pe = 0.08, δ = 0.98 and f = 1. With these parameters wecan build a fuzzy extractor which can extract secure keys from CD fingerprints.For a 128-bit key we set ` = 128. Similarly, to achieve a fuzzy extractor outputwhich reveals very little information about the fingerprint we set ε = 64. Usingthe equation of Theorem 1 we require that the error correcting code in the fuzzyextractor should satisfy k ≥ 190 + 0.02n. Note that although Pe = 0.08, this isthe expected error rate. For a practical scheme we require the fuzzy extractorto correct around a 0.17 error rate. These parameters can now be satisfied usinga binary BCH code of [255, 45, 88]. More specifically, we define a code wordcontaining 7 code words of this BCH code, which will make n = 1785. Withthis construction the failure probability10 Pfail will be on the order of 10−6.Note here that treating the 7 code words separately to generate separate partsof the key would significantly decrease ε but will decrease the failure probability.Therefore, in our failure probability we treat the 7 code words as a single entity.As we noted earlier, our data suffers from higher error rates due to the externalconnections which we used. With an on-chip process we can expect the errorrate to drop significantly.
5 Robustness of the Fingerprint
A CD fingerprint can be used to tie software licenses to individual CDs wherethe software is stored. Under this use scenario it becomes important to addressthe robustness of the fingerprint. In all our experiments the data collected camefrom locations in the same sector of the CD. In a real application readings wouldtypically be collected from different sectors. Thus ensuring that a scratch or anyphysical damage to a specific location will not render the CD fingerprint useless.
Another important concern regarding the robustness of the fingerprint is thatof aging. Although no quantitative estimate of fingerprint durability can be givenwithin the scope of this work, mechanisms related to viscoelastic relaxation inoptical disc patterns need to be discussed briefly. Optical discs are printed onpolymeric substrates, which have glass transition temperatures typically above150 oC. The viscosity of such materials are temperature dependent and gov-erned by an Arrhenius type exponential temperature dependence, described by
10 Here, Pfail = 1−�1− � t=43
i=0
�n
i �P ie(1− Pe)
n−i�7.
14 Ghaith Hammouri, Aykutlu Dana, and Berk Sunar
an activation energy defined by the glass transition temperature. In its simplestform, the Arrhenius model assumes that the rate of change is proportional to
e−Ea
kT where Ea is the activation energy, k is the Boltzmann constant (an in-variant physical parameter) and T is the absolute temperature (temperaturein degrees Kelvin). Even at lower temperatures (natural operating and storagetemperature range of the optical disc), viscosity of the polymer remains finite.During the molding process, most of the internal stresses are relieved upon cool-ing, resulting in fluctuations in the nanoscale structure of the bit patterns. Thepressed discs have a thin metal coating, which is typically coated on to the poly-mer disc by evaporation or sputter coating, that results in the increase of thesurface temperature by up to 50 oC. This process is also likely to be a source oflocal thermoelastic stress buildup which relaxes over the lifetime of the CD. In afirst order approximation, the disc material can be thought of as a Kelvin-Voigtmaterial, and creep relaxation can be approximated by a single time-constantexponential behavior. In such a case, most of the viscoelastic relaxation will oc-cur at the early stages of disc production, and latter time scales will have less ofan effect. It may be speculated that the fingerprints due to length fluctuationsof 25 nm upon 300 nm characteristic bit length will persist within at least 10%of the CD lifetime, which is predicted to be 217 years at 25 oC and 40% relativehumidity conditions. This gives an estimated 20 year lifetime for the fingerprint[20]. Due to the exponential dependence of the relaxation on time, by recordingthe signature on a slightly aged optical disc (months old), the persistance of thesignature can be increased.
6 Conclusion
In this paper we showed how to generate unique fingerprints for any CD. Theproposed technique works for pressed and burned CDs, and in theory can beused for other optical storage devices. We tested the proposed technique using100 identical CDs and characterized the variability across the studied CDs. Wealso gave specific parameters and showed how to extract a 128-bit cryptographickeys. This work opens a new door of research in the area of CD IP-protection.
References
1. DeJean, G., Kirovski, D., RF-DNA: radio-frequency certificates of authenticity.In: Proceedings of CHES 2007, LNCS, vol. 4727, pp. 346-363, Springer-Verlag,Heidelberg, Germany (2007).
2. Bauder, D.W., An anti-counterfeiting concept for currency Systems. ResearchReport PTK-11990, Sandia National Labs, Albuquerque, NM, USA (1983).
3. Clarkson, W., Weyrich, T., Finkelstein, A., Heninger, N., Halderman, J.A., Felten,E.W., Fingerprinting blank paper using commodity scanners. In: Proceedings ofS&P 2009, Oakland, CA, May 2009, IEEE Computer Society, Los Alamitos, CA,USA, 2009 (to appear).
4. Cowburn, R.P., Buchanan, J.D.R., Verification of authenticity. US Patent Appli-cation 2007/0028093, July 27th (2006).
CDs Have Fingerprints Too 15
5. Agrawal, D., Baktir, S., Karakoyunlu, D., Rohatgi, P., Sunar, B., Trojan detectionusing IC fingerprinting. In: Proceedings of S&P 2007, 20-23 May 2007, Oakland,California, USA, pp. 296-310, IEEE Computer Society, Los Alamitos, CA, USA(2007).
6. Lim, D., Lee, J.W., Gassend, B., Suh, G.E., van Dijk, M., Devadas, S., Extractingsecret keys from integrated circuits. IEEE Transactions on VLSI Systems, 13(10),pp. 1200-1205, (2005).
7. Ravikanth, P.S., Physical One-Way Functions. PhD thesis, Department of MediaArts and Science, Massachusetts Institute of Technology, Cambridge, MA, USA,2001.
8. Tuyls, P., Schrijen, G.J., Skoric, B., van Geloven, J., Verhaegh, N., Wolters, R.,Read-proof hardware from protective coatings. In: Proceedings of CHES 2006,LNCS, vol. 4249, pp. 369-383, Springer-Verlag, Heidelberg, Germany (2006).
9. Carter, L., Wegman, M., Universal hash functions. Journal of Computer andSystem Sciences, 18(2), pp. 143-154, (1979).
10. Dodis, Y., Ostrovsky, R., Reyzin, L., Smith, A., Fuzzy extractors: how to generatestrong keys from biometrics and other noisy data. SIAM Journal on Computing,38(1), pp. 97-139, (2008).
11. European Computer Manufacturers’ Association. Standard ECMA-130: Data in-terchange on read-only 120mm optical data disks (CD-ROM) (2nd ed.). ECMA,Geneva, Switzerland, 1996.
12. Guajardo, J., Kumar, S.S., Schrijen, G.J., Tuyls, P., FPGA intrinsic PUFs andtheir use for IP protection. In: Proceedings of CHES 2007, LNCS, vol. 4727, pp.63-80, Springer-Verlag, Heidelberg, Germany (2007).
13. Ignatenko, T., Schrijen, G.J., Skoric, B., Tuyls, P., Willems, F., Estimatingthe secrecy-rate of physical unclonable functions with the context-tree weightingmethod. In: Proceedings of ISIT 2006, 9-14 July, 2006, Seattle, Washington, USA,pp. 499-503, IEEE, Washington, DC, USA (2006).
14. Juels, A., Sudan, M., A fuzzy vault scheme. Designs, Codes and Cryptography,38(2), pp. 237-257, (2006).
15. Juels, A., Wattenberg, M., A fuzzy commitment scheme. In: Proceedings of CCS1999, pp 28-36, ACM, New York, NY, USA (1999).
16. Lee, C., Some properties of nonbinary error-correcting codes. IRE Transactionson Information Theory, 4(2), pp. 77-82, (1958).
17. Schift, H., David, C., Gabriel, M., Gobrecht, J., Heyderman, L.J., Kaiser, W.,Koppel, S., Scandella, L., Nanoreplication in polymers using hot embossing andinjection molding. Microelectronic Engineering, 53(1-4), pp. 171-174, (2000).
18. Willems, F.M.J., The context-tree weighting method: extensions. IEEE Transac-tions on Information Theory, 44(2), pp. 792-798, (1998).
19. Willems, F.M.J., Shtarkov, Y.M., Tjalkens, T.J., The context-tree weightingmethod: basic properties. IEEE Transactions on Information Theory, 41(3), pp.653-664, (1995).
20. Stinson, D., Ameli, F., Zaino, N., Lifetime of Kodak writable CD and photo CDmedia. Eastman Kodak Company, Digital & Applied Imaging, NY, USA (1995).