Embed Size (px)
Citation preview
Page 1 of 165
CDP
Coca-Cola HBC AG - Climate Change 2018
C0. Introduction
C0.1
(C0.1) Give a general description and introduction to your organization.
Coca-Cola HBC is one of the world’s largest bottlers of drinks from The Coca Cola Company and our business has a strong foundation for long-term growth. Coca-Cola HBC (Coca-Cola Hellenic Bottling Company) is a bottling partner of The Coca-Cola Company. This means that The Coca-Cola Company manufactures and sells concentrates, bases and syrups to its bottling partners, owns the brands and is responsible for consumer brand marketing initiatives. We use the concentrates and syrups to manufacture, package, merchandise and distribute the final branded products to our trade partners and consumers. Selling more than 2.1 billion unit cases every year – that’s 50 billion servings – we’re one of the world’s largest bottlers of The Coca-Cola Company’s brands. We operate in 28 countries, serving 600 million potential consumers across three continents. We bottle, sell and distribute the world’s most recognised soft drink: Coca-Cola. Along with Coca-Cola Light, Sprite and Fanta, also licensed to us by The Coca-Cola Company, these are four of the world’s five best-selling non-alcoholic ready-to drink beverages. Still drinks – water, juices, tea and energy drinks – make up to 31 percent of our volume. This diverse portfolio means that we’re a strong partner for our customers and provide great c hoice for consumers. We’ve integrated sustainability and corporate responsibility into every part of our business, aiming to build long -term value for our stakeholders. Coca-Cola HBC is headquartered in Zug, Switzerland and has a premium listing on the London Stock Exchange and secondary listing on the Athens Exchange.
C0.2
Page 2 of 165
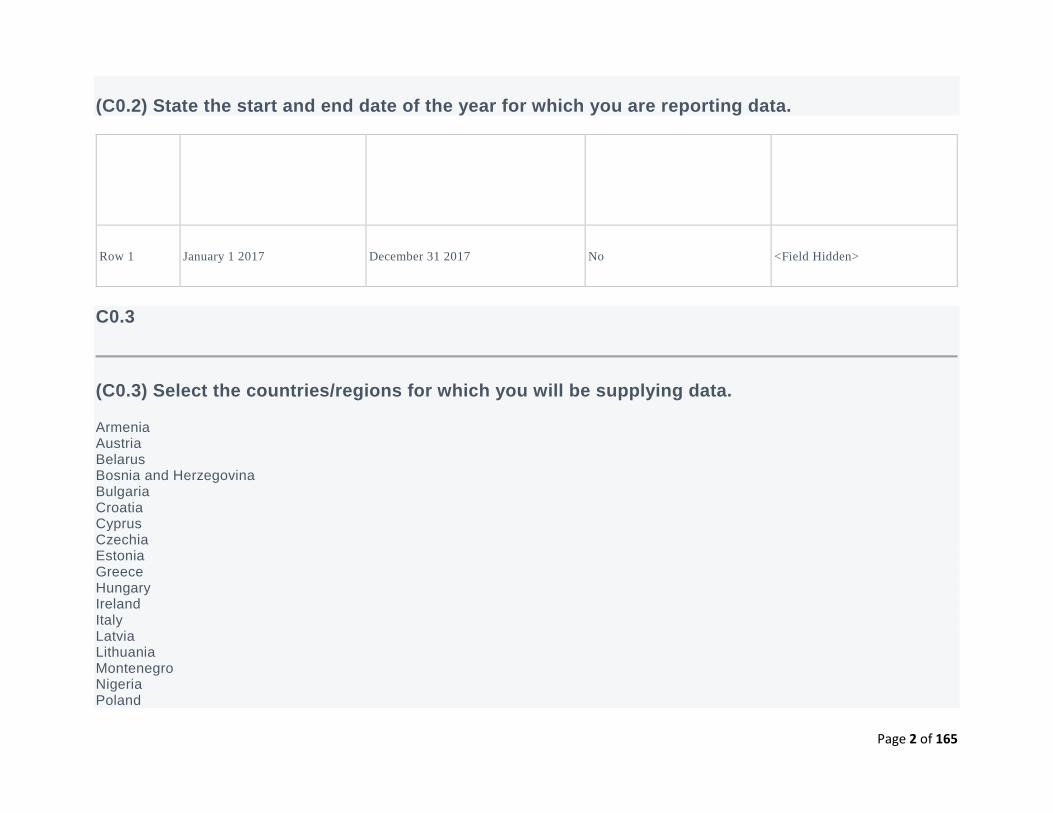
(C0.2) State the start and end date of the year for which you are reporting data.
Start date End date
Indicate if you are providing
emissions data for past
reporting years
Select the number of past
reporting years you will be
providing emissions data for
Row 1 January 1 2017 December 31 2017 No <Field Hidden>
C0.3
(C0.3) Select the countries/regions for which you will be supplying data.
Armenia Austria Belarus Bosnia and Herzegovina Bulgaria Croatia Cyprus Czechia Estonia Greece Hungary Ireland Italy Latvia Lithuania Montenegro Nigeria Poland
Page 3 of 165
Romania Russian Federation Serbia Slovakia Slovenia Switzerland The former Yugoslav Republic of Macedonia Ukraine United Kingdom of Great Britain and Northern Ireland Republic of Moldova
C0.4
(C0.4) Select the currency used for all financial information disclosed throughout your response.
EUR
C0.5
(C0.5) Select the option that describes the reporting boundary for which climate-related impacts on your business are being reported. Note that this option should align with your consolidation approach to your Scope 1 and Scope 2 greenhouse gas inventory.
Operational control
C-AC0.6/C-FB0.6/C-PF0.6
Page 4 of 165
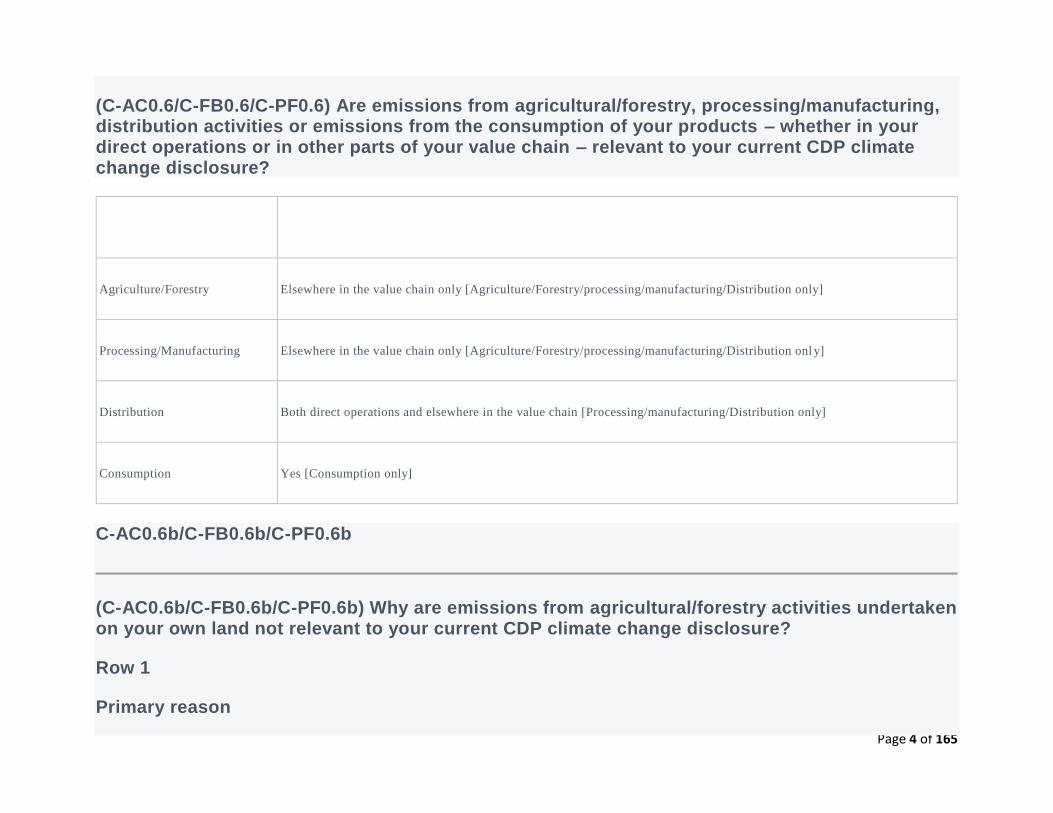
(C-AC0.6/C-FB0.6/C-PF0.6) Are emissions from agricultural/forestry, processing/manufacturing, distribution activities or emissions from the consumption of your products – whether in your direct operations or in other parts of your value chain – relevant to your current CDP climate change disclosure?
Relevance
Agriculture/Forestry Elsewhere in the value chain only [Agriculture/Forestry/processing/manufacturing/Distribution only]
Processing/Manufacturing Elsewhere in the value chain only [Agriculture/Forestry/processing/manufacturing/Distribution onl y]
Distribution Both direct operations and elsewhere in the value chain [Processing/manufacturing/Distribution only]
Consumption Yes [Consumption only]
C-AC0.6b/C-FB0.6b/C-PF0.6b
(C-AC0.6b/C-FB0.6b/C-PF0.6b) Why are emissions from agricultural/forestry activities undertaken on your own land not relevant to your current CDP climate change disclosure?
Row 1
Primary reason
Page 5 of 165
Do not own/manage land
Please explain
We buy from our suppliers the ingredients needed for our production: sugar, sweeteners, juice concentrates. We don't have our own farms/land and we don’t use anything directly from the farms.
C-AC0.6d/C-FB0.6d/C-PF0.6d
(C-AC0.6d/C-FB0.6d/C-PF0.6d) Why are emissions from processing/manufacturing activities within your direct operations not relevant to your current CDP climate change disclosure?
Row 1
Primary reason
Outside the scope of my organization
Please explain
We don't process/manufacture raw agricultural ingredients. We use the processed already ingredients from our suppliers (We buy from our suppliers the ingredients needed for our production: sugar, sweeteners, juice concentrates which are already processed ) . We don't have our own farms/land and we don’t process anything directly from the farms.
C-AC0.7/C-FB0.7/C-PF0.7
(C-AC0.7/C-FB0.7/C-PF0.7) Which agricultural commodity(ies) that your organization produces and/or sources are the most significant to your business by revenue? Select up to five.
Page 6 of 165
Agricultural commodity
Sugar
% of revenue dependent on this agricultural commodity
20-40%
Produced or sourced
Sourced
Please explain
We source crystal sugar of fructose syrup from our suppliers and use this sugar in our beverages as an ingredient. We don't process/manufacture neither sugar cane nor sugar beet.
Agricultural commodity
Other, please specify (Oranges)
% of revenue dependent on this agricultural commodity
Less than 10%
Produced or sourced
Sourced
Please explain
We source orange concentrate from our suppliers and use this concentrate in our beverages as an ingredient. We don't process/manufacture any raw oranges.
Page 7 of 165
Agricultural commodity
Other, please specify (Apples)
% of revenue dependent on this agricultural commodity
Less than 10%
Produced or sourced
Sourced
Please explain
We source apple concentrate from our suppliers and use this concentrate in our beverages as an ingredient. We don't process/m anufacture any raw apples.
C1. Governance
C1.1
(C1.1) Is there board-level oversight of climate-related issues within your organization?
Yes
C1.1a
Page 8 of 165
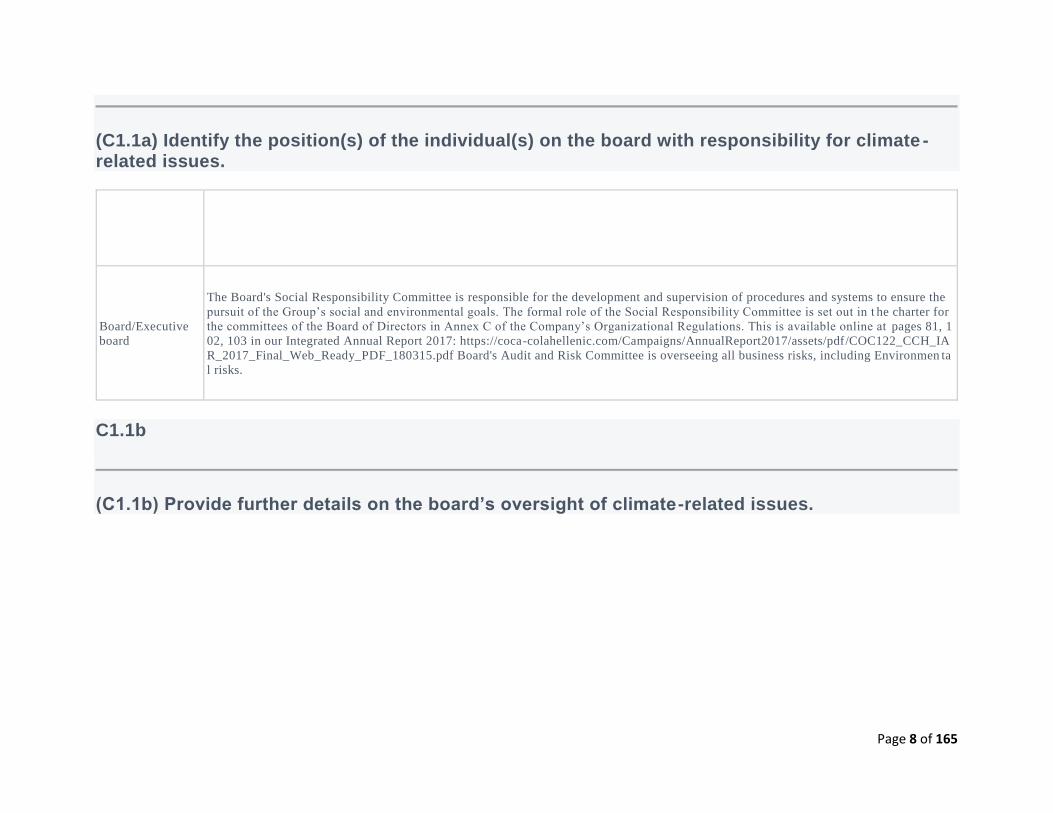
(C1.1a) Identify the position(s) of the individual(s) on the board with responsibility for climate -related issues.
Position of
individual(s) Please explain
Board/Executive
board
The Board's Social Responsibility Committee is responsible for the development and supervision of procedures and systems to ensure the
pursuit of the Group’s social and environmental goals. The formal role of the Social Responsibility Committee is set out in t he charter for
the committees of the Board of Directors in Annex C of the Company’s Organizational Regulations. This is available online at pages 81, 1
02, 103 in our Integrated Annual Report 2017: https://coca-colahellenic.com/Campaigns/AnnualReport2017/assets/pdf/COC122_CCH_IA
R_2017_Final_Web_Ready_PDF_180315.pdf Board's Audit and Risk Committee is overseeing all business risks, including Environmen ta
l risks.
C1.1b
(C1.1b) Provide further details on the board’s oversight of climate-related issues.
Page 9 of 165
Frequency
with which
climate-
related issues
are a
scheduled
agenda item
Governance mechanisms into
which climate-related issues are
integrated
Please explain
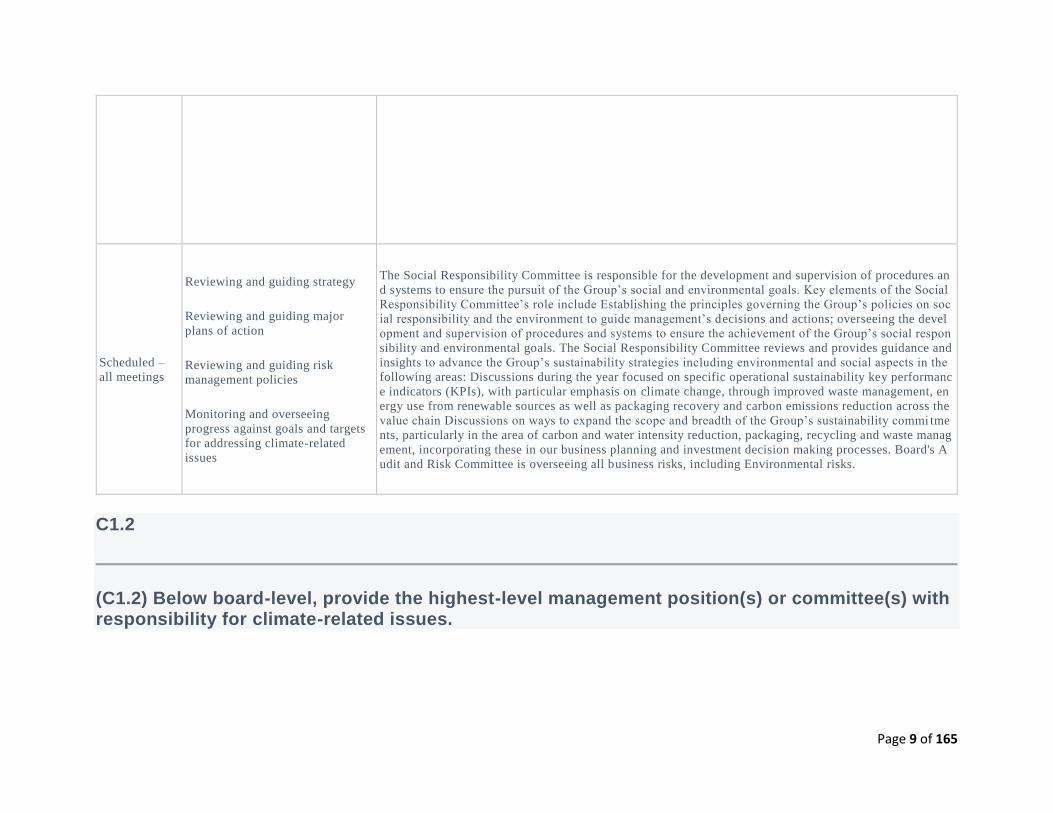
Scheduled –
all meetings
Reviewing and guiding strategy
Reviewing and guiding major
plans of action
Reviewing and guiding risk
management policies
Monitoring and overseeing
progress against goals and targets
for addressing climate-related
issues
The Social Responsibility Committee is responsible for the development and supervision of procedures an
d systems to ensure the pursuit of the Group’s social and environmental goals. Key elements of the Social
Responsibility Committee’s role include Establishing the principles governing the Group’s policies on soc
ial responsibility and the environment to guide management’s decisions and actions; overseeing the devel
opment and supervision of procedures and systems to ensure the achievement of the Group’s social respon
sibility and environmental goals. The Social Responsibility Committee reviews and provides guidance and
insights to advance the Group’s sustainability strategies including environmental and social aspects in the
following areas: Discussions during the year focused on specific operational sustainability key performanc
e indicators (KPIs), with particular emphasis on climate change, through improved waste management, en
ergy use from renewable sources as well as packaging recovery and carbon emissions reduction across the
value chain Discussions on ways to expand the scope and breadth of the Group’s sustainability commi tme
nts, particularly in the area of carbon and water intensity reduction, packaging, recycling and waste manag
ement, incorporating these in our business planning and investment decision making processes. Board's A
udit and Risk Committee is overseeing all business risks, including Environmental risks.
C1.2
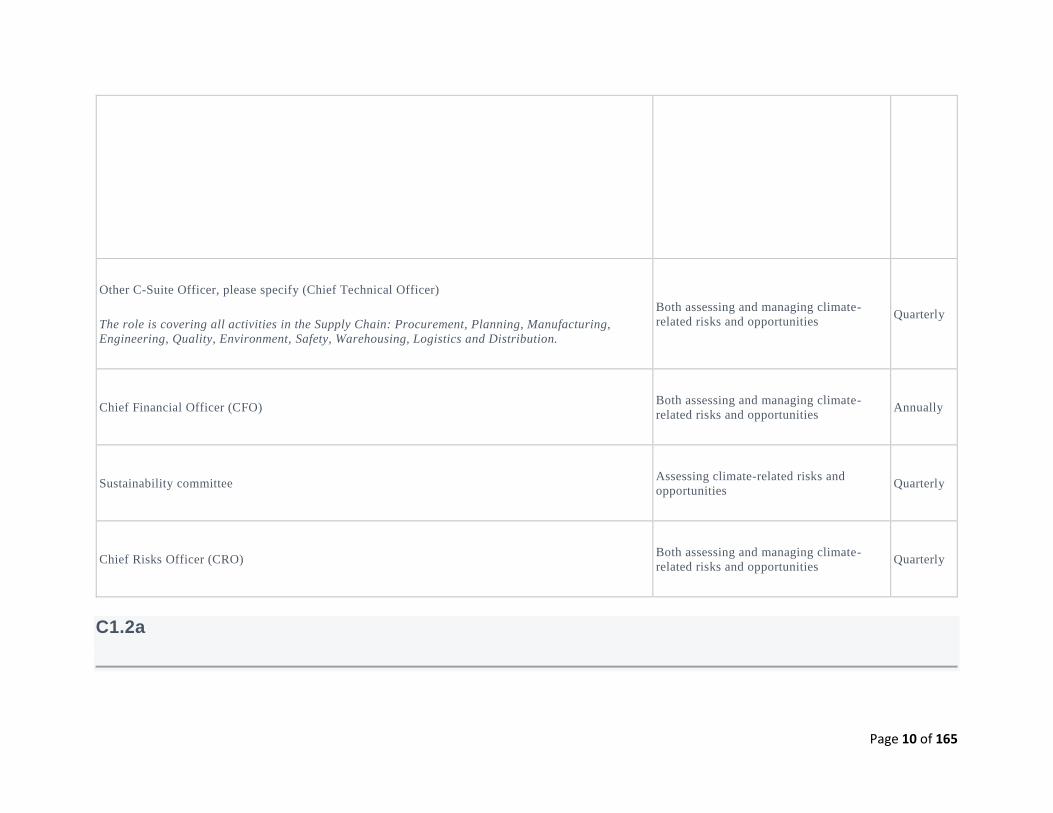
(C1.2) Below board-level, provide the highest-level management position(s) or committee(s) with responsibility for climate-related issues.
Page 10 of 165
Name of the position(s) and/or committee(s) Responsibility
Frequency
of
reporting
to the
board on
climate-
related
issues
Other C-Suite Officer, please specify (Chief Technical Officer)
The role is covering all activities in the Supply Chain: Procurement, Planning, Manufacturing,
Engineering, Quality, Environment, Safety, Warehousing, Logistics and Distribution.
Both assessing and managing climate-
related risks and opportunities Quarterly
Chief Financial Officer (CFO) Both assessing and managing climate-
related risks and opportunities Annually
Sustainability committee Assessing climate-related risks and
opportunities Quarterly
Chief Risks Officer (CRO) Both assessing and managing climate-
related risks and opportunities Quarterly
C1.2a
Page 11 of 165
(C1.2a) Describe where in the organizational structure this/these position(s) and/or committees lie, what their associated responsibilities are, and how climate-related issues are monitored.
Chie Technical Officer (CTO) is reporting to the CEO and is responsible for the whole value chain: from Procurment, Planning, Delivery, Manufacturing, Quality, Safety, Environemnt, to Warehousing, Storage, Transportation and Distribution of our products to the customers. There is a regular quarterly update on all Environmental issues, including the risks and opportunities with cl imate change and Climate related Sustainability commitments. The reports are presented to the CEO and Board. In addition, CTO is part of th e Sustainability Steering Committee - a Committee which assesses all Sustainability Trends&Risk, give proposals and projections, track performance.
The Group’s Chief Financial Officer (CFO) is a member of the Operating Committee, the organisation’s highest executive govern ing body. The CFO is responsible for the development, implementation and monitoring of our Accounting 4 Sustainability (A4S) initiative as well as the development of the TCFD reporting framework. A4S concept: is the quantitative measurement of our direct environmental impact (water and carbon) by applying a "true cost" of water, water stress multiplier per plant (per river basin) and internal carbon price, it is used in our investment decision-making process. In November 2017 our CFO signed off the letter to support to TCFD with the commitment to implement the TCFD requirements.
The Chief Risk Officer (CRO), is the senior leader responsible for the operational implementation and oversight of the risk management programs across the group. Visibility of risk management across streams is obtained via the Group risk forum and reviewin g risk data submitted by the operations. The CRO reports to the Operating Committee and indirectly to the Board of Directors (BoD). Climate, Carbon and Water is one of Coca-Cola HBC’s principles risks and the CRO and his team are responsible for assessing the likelihood of occurrence and the potential consequences to our business.
The Sustainability Steering Committee (SUSCO) is a cross-functional governance body, which assumes responsibility for our sustainability strategy, including climate-related issues. It reviews and adjusts our sustainability priority issues that affect our business strategy, business model and the types of capitals our business uses or affects. SUSCO is monitoring the progress of climate -rellated commitments (for carbon reduciton, renewable energy, water and packaging reduction), also receive information about the activities which contribute to carbon/water reduction.
C1.3
(C1.3) Do you provide incentives for the management of climate-related issues, including the attainment of targets?
Page 12 of 165
Yes
C1.3a
(C1.3a) Provide further details on the incentives provided for the management of climate-related issues.
Who is entitled to benefit from these incentives?
Chief Financial Officer (CFO)
Types of incentives
Monetary reward
Activity incentivized
Other, please specify (Integration of Climate in IAR)
Comment
In the monetary incentives of the CFO there is: a full Integration of the Climate related information in the Group's Integrat ed Annual Report, which constitutes its main annual financial filing; sign off and support the implementation of the TCFD (Task Force on Climate-Related Financial Disclosure).
Who is entitled to benefit from these incentives?
Chief Procurement Officer (CPO)
Types of incentives
Page 13 of 165
Monetary reward
Activity incentivized
Environmental criteria included in purchases
Comment
CPO has in his/her objectives the implementation of our publicly available commitment: to source more than 95% of the key agr icultural ingredients in accordance to our Sustainable Agricultural Guiding Principles (SAGP). In add ition, a prerequisite to become listed as a Coca-Cola HBC supplier is to commit to the Coca-Cola HBC Supplier Guiding Principles. SAGP contain requirements in the areas of environment and management systems like water and energy management, climate, conservation of natural habitats and ecosystems, soil management, crop protection, responsible agro-chemical use, biodiversity, harvest and post-harvest handling, reproductive material identity, selection and handling, record keeping and transparency, business integrity etc.
Who is entitled to benefit from these incentives?
All employees
Types of incentives
Recognition (non-monetary)
Activity incentivized
Behavior change related indicator
Comment
We have a mandatory leading KPI: Near Loss, which includes all proposals related to energy/water efficiency, waste reduction, carbon saving. All people work in our manufacturing sites have a target for reporting and closing of the Near Losses. In addition , we have established an annual individual reward for the best idea (best Near Loss). Energy reduction is part of our "Pay for Performance" incentives in almost all of our plants.
Page 14 of 165
C2. Risks and opportunities
C2.1
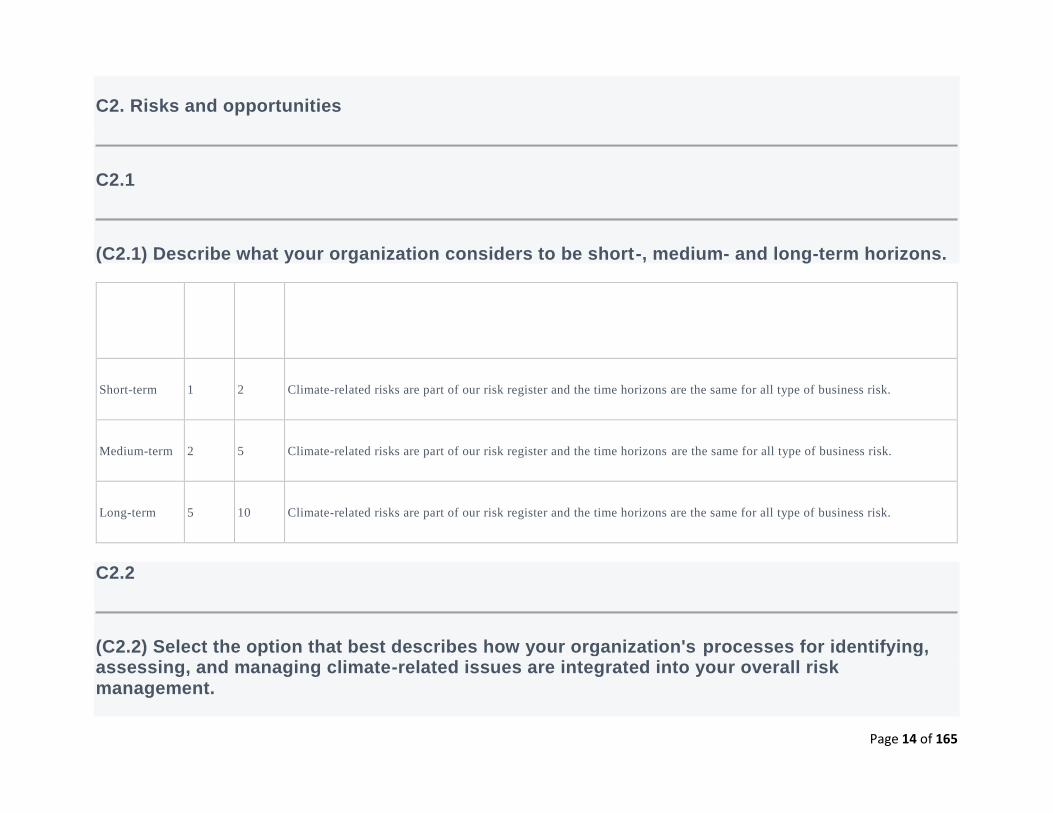
(C2.1) Describe what your organization considers to be short-, medium- and long-term horizons.
From
(years)
To
(years) Comment
Short-term 1 2 Climate-related risks are part of our risk register and the time horizons are the same for all type of business risk.
Medium-term 2 5 Climate-related risks are part of our risk register and the time horizons are the same for all type of business risk.
Long-term 5 10 Climate-related risks are part of our risk register and the time horizons are the same for all type of business risk.
C2.2
(C2.2) Select the option that best describes how your organization's processes for identifying, assessing, and managing climate-related issues are integrated into your overall risk management.
Page 15 of 165
Integrated into multi-disciplinary company-wide risk identification, assessment, and management processes
C2.2a
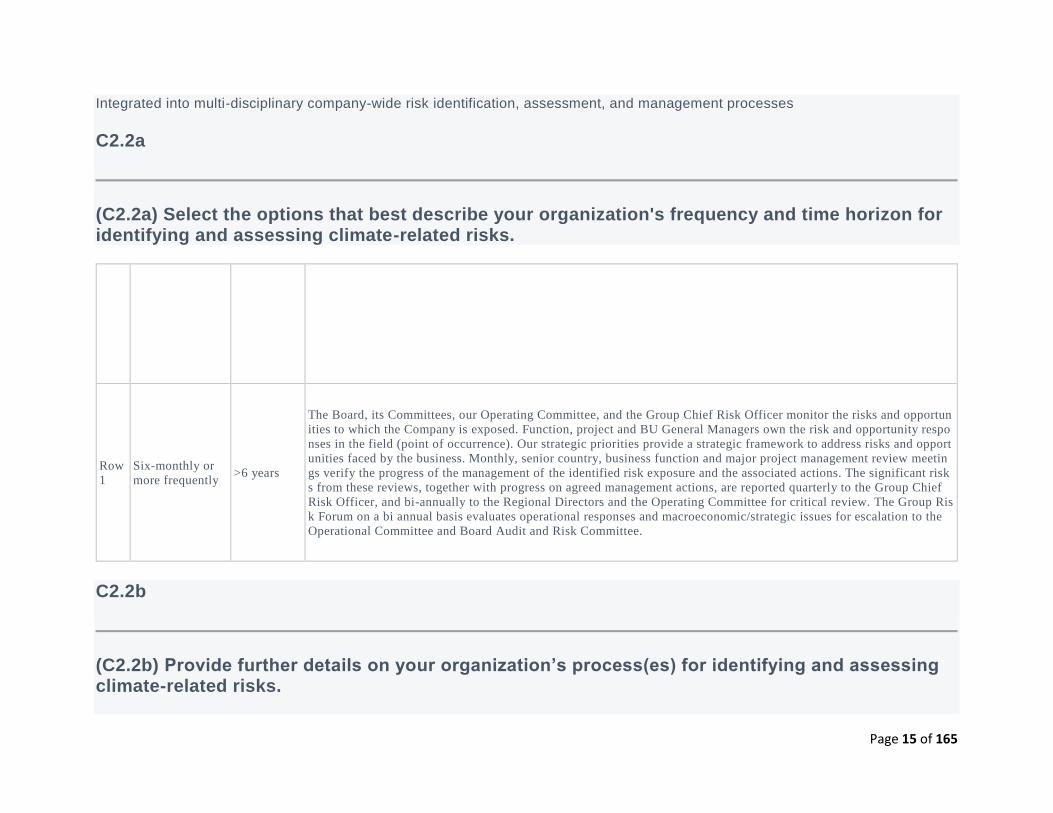
(C2.2a) Select the options that best describe your organization's frequency and time horizon for identifying and assessing climate-related risks.
Frequency of
monitoring
How far
into the
future are
risks
considered?
Comment
Row
1
Six-monthly or
more frequently >6 years
The Board, its Committees, our Operating Committee, and the Group Chief Risk Officer monitor the risks and opportun
ities to which the Company is exposed. Function, project and BU General Managers own the risk and opportunity respo
nses in the field (point of occurrence). Our strategic priorities provide a strategic framework to address risks and opport
unities faced by the business. Monthly, senior country, business function and major project management review meetin
gs verify the progress of the management of the identified risk exposure and the associated actions. The significant risk
s from these reviews, together with progress on agreed management actions, are reported quarterly to the Group Chief
Risk Officer, and bi-annually to the Regional Directors and the Operating Committee for critical review. The Group Ris
k Forum on a bi annual basis evaluates operational responses and macroeconomic/strategic issues for escalation to the
Operational Committee and Board Audit and Risk Committee.
C2.2b
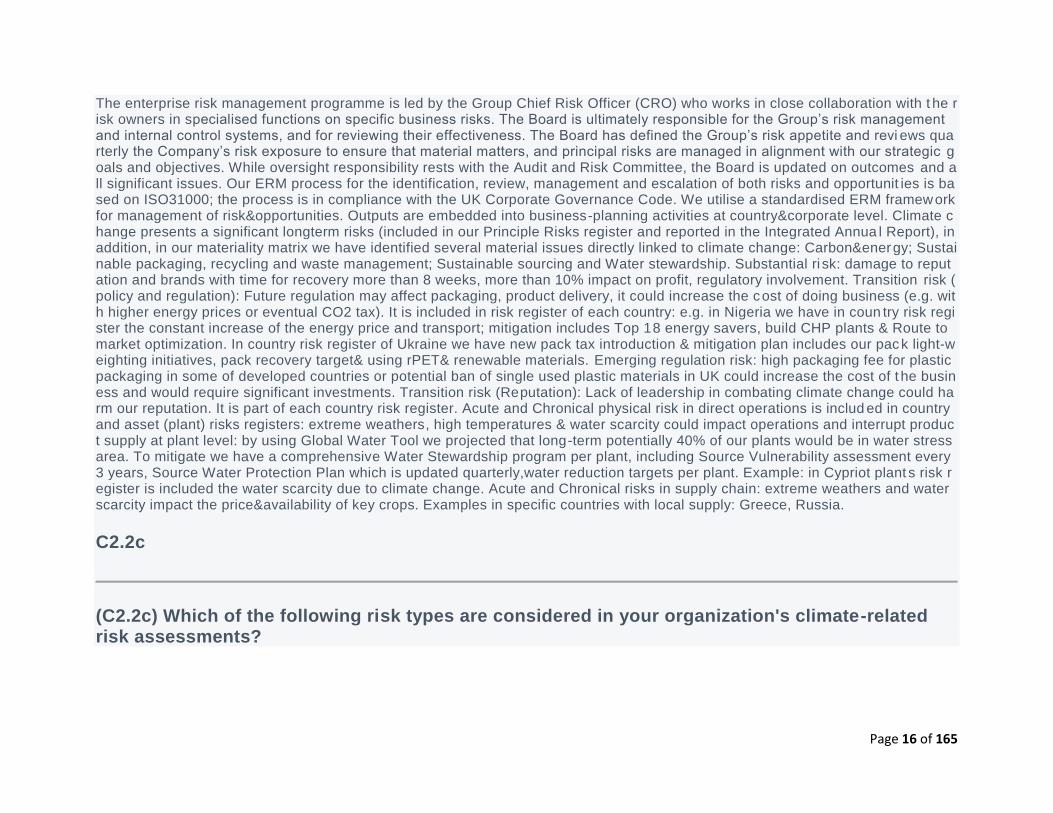
(C2.2b) Provide further details on your organization’s process(es) for identifying and assessing climate-related risks.
Page 16 of 165
The enterprise risk management programme is led by the Group Chief Risk Officer (CRO) who works in close collaboration with t he risk owners in specialised functions on specific business risks. The Board is ultimately responsible for the Group’s risk management and internal control systems, and for reviewing their effectiveness. The Board has defined the Group’s risk appetite and revi ews quarterly the Company’s risk exposure to ensure that material matters, and principal risks are managed in alignment with our strategic goals and objectives. While oversight responsibility rests with the Audit and Risk Committee, the Board is updated on outcomes and all significant issues. Our ERM process for the identification, review, management and escalation of both risks and opportunit ies is based on ISO31000; the process is in compliance with the UK Corporate Governance Code. We utilise a standardised ERM framework for management of risk&opportunities. Outputs are embedded into business-planning activities at country&corporate level. Climate change presents a significant longterm risks (included in our Principle Risks register and reported in the Integrated Annua l Report), in addition, in our materiality matrix we have identified several material issues directly linked to climate change: Carbon&energy; Sustainable packaging, recycling and waste management; Sustainable sourcing and Water stewardship. Substantial ri sk: damage to reputation and brands with time for recovery more than 8 weeks, more than 10% impact on profit, regulatory involvement. Transition risk (policy and regulation): Future regulation may affect packaging, product delivery, it could increase the cost of doing business (e.g. with higher energy prices or eventual CO2 tax). It is included in risk register of each country: e.g. in Nigeria we have in coun try risk register the constant increase of the energy price and transport; mitigation includes Top 18 energy savers, build CHP plants & Route to market optimization. In country risk register of Ukraine we have new pack tax introduction & mitigation plan includes our pack light-weighting initiatives, pack recovery target& using rPET& renewable materials. Emerging regulation risk: high packaging fee for plastic packaging in some of developed countries or potential ban of single used plastic materials in UK could increase the cost of t he business and would require significant investments. Transition risk (Reputation): Lack of leadership in combating climate change could harm our reputation. It is part of each country risk register. Acute and Chronical physical risk in direct operations is includ ed in country and asset (plant) risks registers: extreme weathers, high temperatures & water scarcity could impact operations and interrupt product supply at plant level: by using Global Water Tool we projected that long-term potentially 40% of our plants would be in water stress area. To mitigate we have a comprehensive Water Stewardship program per plant, including Source Vulnerability assessment every 3 years, Source Water Protection Plan which is updated quarterly,water reduction targets per plant. Example: in Cypriot plant s risk register is included the water scarcity due to climate change. Acute and Chronical risks in supply chain: extreme weathers and water scarcity impact the price&availability of key crops. Examples in specific countries with local supply: Greece, Russia.
C2.2c
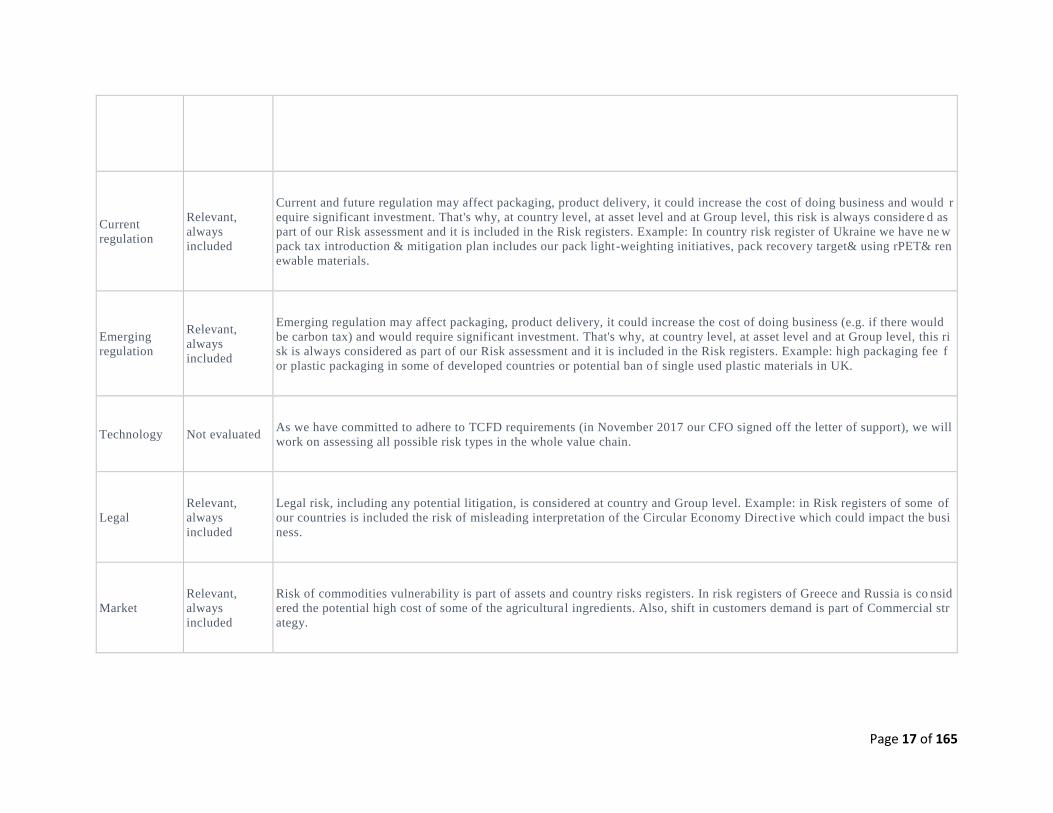
(C2.2c) Which of the following risk types are considered in your organization's climate-related risk assessments?
Page 17 of 165
Relevance &
inclusion Please explain
Current
regulation
Relevant,
always
included
Current and future regulation may affect packaging, product delivery, it could increase the cost of doing business and would r
equire significant investment. That's why, at country level, at asset level and at Group level, this risk is always considere d as
part of our Risk assessment and it is included in the Risk registers. Example: In country risk register of Ukraine we have ne w
pack tax introduction & mitigation plan includes our pack light-weighting initiatives, pack recovery target& using rPET& ren
ewable materials.
Emerging
regulation
Relevant,
always
included
Emerging regulation may affect packaging, product delivery, it could increase the cost of doing business (e.g. if there would
be carbon tax) and would require significant investment. That's why, at country level, at asset level and at Group level, this ri
sk is always considered as part of our Risk assessment and it is included in the Risk registers. Example: high packaging fee f
or plastic packaging in some of developed countries or potential ban of single used plastic materials in UK.
Technology Not evaluated As we have committed to adhere to TCFD requirements (in November 2017 our CFO signed off the letter of support), we will
work on assessing all possible risk types in the whole value chain.
Legal
Relevant,
always
included
Legal risk, including any potential litigation, is considered at country and Group level. Example: in Risk registers of some of
our countries is included the risk of misleading interpretation of the Circular Economy Direct ive which could impact the busi
ness.
Market
Relevant,
always
included
Risk of commodities vulnerability is part of assets and country risks registers. In risk registers of Greece and Russia is co nsid
ered the potential high cost of some of the agricultural ingredients. Also, shift in customers demand is part of Commercial str
ategy.
Page 18 of 165
Relevance &
inclusion Please explain
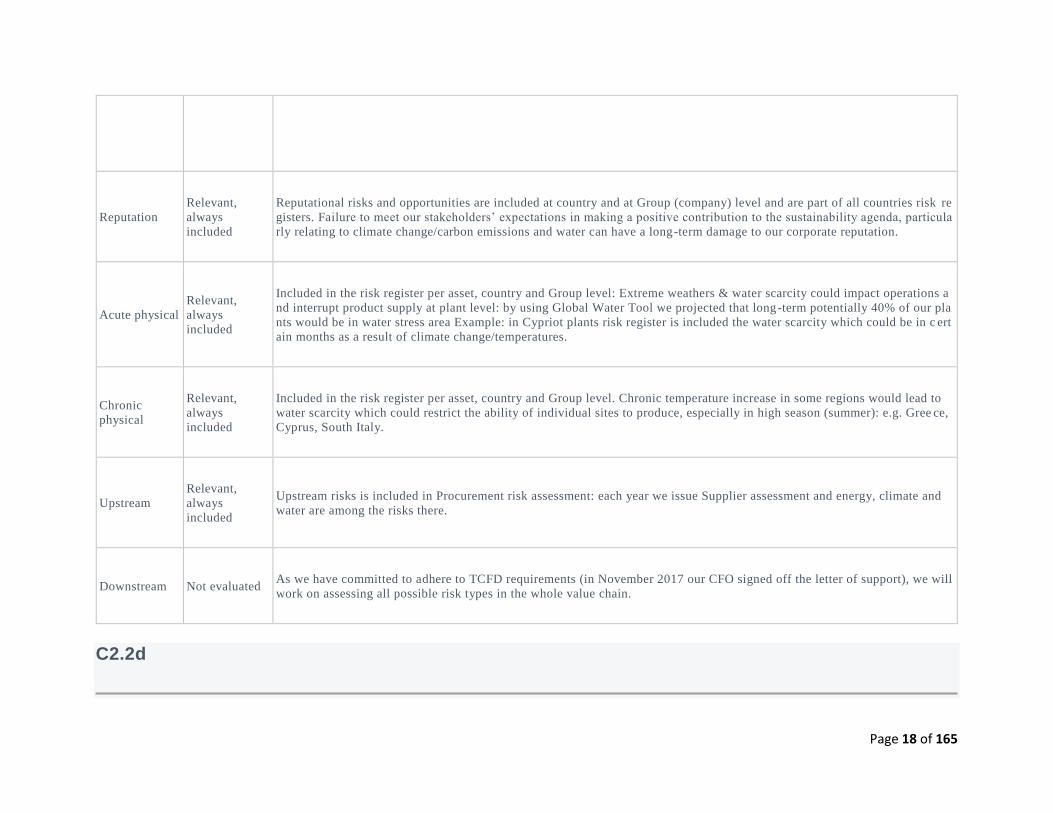
Reputation
Relevant,
always
included
Reputational risks and opportunities are included at country and at Group (company) level and are part of all countries risk re
gisters. Failure to meet our stakeholders’ expectations in making a positive contribution to the sustainability agenda, particula
rly relating to climate change/carbon emissions and water can have a long-term damage to our corporate reputation.
Acute physical
Relevant,
always
included
Included in the risk register per asset, country and Group level: Extreme weathers & water scarcity could impact operations a
nd interrupt product supply at plant level: by using Global Water Tool we projected that long-term potentially 40% of our pla
nts would be in water stress area Example: in Cypriot plants risk register is included the water scarcity which could be in c ert
ain months as a result of climate change/temperatures.
Chronic
physical
Relevant,
always
included
Included in the risk register per asset, country and Group level. Chronic temperature increase in some regions would lead to
water scarcity which could restrict the ability of individual sites to produce, especially in high season (summer): e.g. Gree ce,
Cyprus, South Italy.
Upstream
Relevant,
always
included
Upstream risks is included in Procurement risk assessment: each year we issue Supplier assessment and energy, climate and
water are among the risks there.
Downstream Not evaluated As we have committed to adhere to TCFD requirements (in November 2017 our CFO signed off the letter of support), we will
work on assessing all possible risk types in the whole value chain.
C2.2d
Page 19 of 165
(C2.2d) Describe your process(es) for managing climate-related risks and opportunities.
We utilize a standardized ERM framework for management of risk&opportunities. Outputs are embedded into business -planning activities at country&corporate level. Climate change is part of our Risk register and is one of our Top 12 material issues, publicly described in our Integrated Annual Report. The ERM approach is used consistently across all business units and operations: the proc ess documents all business related and financial risks against impact, likelihood, vulnerability, etc. Key risks are measured inherently, residually, and by target. The process also documents responsible mitigation plans and accountable managers. Risks are assessed qualitatively and quantitatively across business units, functions and projects. The qualitative assessments are graphically depicted in two ways, as heat maps and risk maps. The Group Business Resilience Function aggregates risks for review by the Group Chief Ri sk Officer, Regional Directors and the Group Risk Forum on a cyclical timeline. Risks, irrespective of classification, are also evaluated in a quantified risk model. This stage of the risk assessment process is distinct from the qualitative assessment described a bove as it assesses the residual exposure post management actions as opposed to the pre-management or inherent risk exposure. Actions focusing on mitigation and control are evaluated as to their impact on the overall risk level to formulate target risk as requi red. The Board-approved Risk Management Policy sets the contextual basis for our response and the ERM Framework documents the standardized assessment methodologies utilized. Standardized methodologies enable aggregation and detailed strategic evaluation. Risk sponsors, reporting to the General Managers, have been assigned in all business units and key functions, to drive accountability and focus. Monitoring is performed monthly in Business Units, with quarterly reporting to Group Chief Risk Officer and bi -annual analysis by the Group Risk Forum. Risks at plant/asset level are part of each manufacturing site’s risks as 99.6% of our production volume is certified in ISO 14001. Central Procurement is dealing with the risks of suppliers of raw& pack materials. Example of business case-Transition risk (policy and regulation): in Nigeria we have in country risk register the constant increase of the energy price and transport prices which impact and would continue impacting the cost of doing business. To mitigate the risk, we set mandatory Top 18 energy savers in each plant, built CHP (Combined Heat and Pawer) plants, optimized Route to market to save fuel. As a result, we reduced energy intensity in the last 2 years by 6% and absolute fuel consumption by 2%, regardless of the production increase by 10 %. Business case Physical risk: Our plant in Nicosia in Cyprus, could potentially would be in water stress area due to drought, which would cause production stoppage during the high season (some summer months). To mitigate we have a comprehensive Water Stewardship program, including Source Vulnerability assessment every 3 years, Source Water Protection Plan which is updated quarterly, specific water reduction targets and water savers implemented. Water intensity was decrease by 2% just for 1 year and the plan t was certified in Gold European Water Stewardship certification, proving sustainable end-to-end water management process.
C2.3
(C2.3) Have you identified any inherent climate-related risks with the potential to have a substantive financial or strategic impact on your business?
Page 20 of 165
Yes
C2.3a
(C2.3a) Provide details of risks identified with the potential to have a substantive financial or strategic impact on your business.
Identifier
Risk 1
Where in the value chain does the risk driver occur?
Direct operations
Risk type
Transition risk
Primary climate-related risk driver
Policy and legal: Other
Type of financial impact driver
Policy and legal: Increased operating costs (e.g., higher compliance costs, increased insurance premiums)
Company- specific description
Increase in energy prices, transport tariffs and eventual CO2 tax would lead to higher operating cost.
Page 21 of 165
Time horizon
Medium-term
Likelihood
Likely
Magnitude of impact
Medium-low
Potential financial impact
5500000
Explanation of financial impact
Potential carbon tax of €10/tonne of direct CO2 could have a negative impact of €5.5m. In case of higher CO2 price per tonne of CO2, the impact on business will be even higher. Potential increase in energy cost would impact the annual opex by 5 -10%, in a time horizon of 5 and 5+ years.
Management method
Since 2015 we use an internal carbon price for our decision-making purposes related to investment projects in energy efficiency, carbon reduction and renewables. We set a commitment to reduce the carbon ratio from direct operations by 50% by 2020 vs. 2010 : this target was approved by WRI as science-based target. We are one of the first 12 companies in the world with science-based carbon reduction targets. In the business plans of each country we included carbon&energy reduction initiatives. In 2017 we inve sted €4.1 million in energy-saving projects in our plants resulted in savings of €1.6 million during 2017 and together with the procurement of renewable electricity led to 9.1% reduction of direct carbon emissions vs. 2016. We included CO2 reduction initia tives in the 2018 Business Plan, worth €9.5m that will further reduce CO2 by 23K tons vs. 2017. In Nigeria, in a few of our manufacturing plants, w e invested €1.4 million in waste heat recovery boilers which are saving more than 400 tonnes of carbon emissions each year. The waste heat coming from our generators is converted to steam and used again in the plant. This steam can also be used to create chille d water with vapour absorption chillers. After a €35’000 investment, the Istra plant in Russia now burns biogas taken from its waste water tr
Page 22 of 165
eatment process, rather than natural gas. Through this, we expect savings of 181,000 Nm3 of natural gas each year, and 540 to nnes of CO2.
Cost of management
4100000
Comment
2017 Capex for energy saving projects in our plants.
Identifier
Risk 2
Where in the value chain does the risk driver occur?
Supply chain
Risk type
Physical risk
Primary climate-related risk driver
Please select
Type of financial impact driver
Please select
Company- specific description
Page 23 of 165
Chronic changes in precipitation patterns and extreme weather could lead to low crop in certain geographies and thus lead to problems with the crop availability and respectively increased cost of raw materials: we use sugar from sugar beet and sugar cane f or our beverages, also juice beverages are produced from fruit concentrate. All these agricultural ingredients are sources in differe nt countries and could be affected by extreme weathers.
Time horizon
Medium-term
Likelihood
Likely
Magnitude of impact
Medium-low
Potential financial impact
5000000
Explanation of financial impact
The impact on COGS could be 5 mio Eur if some of the raw materials prices (agricultural raw materials) is increased, time -horizon is 5 years.
Management method
Engagement with suppliers to promote best practices and awareness of supplier diversification. We work with all our ingredien ts’ suppliers on the adherence to Sustainable Agriculture Guiding Principles which include clear requirements on Environment and Fa rm Management Systems helping to mitigate water risks. We set commitment to certify >95% of our key ingredients suppliers toward s our Sustainable Agricultural Guiding Principles, which include water, energy, carbon management, crop and soil management, pos t harvesting practices etc. In addition, we have developed an environmental, social and governance supplier pre -assessment process for our strategic buy segment which includes criteria for supplier selection. We maintain transparency throughout our supply base utilizing The Coca-Cola Company Supplier Guiding Principles compliance audits, membership of SEDEX and EcoVadis CSR Platform.
Page 24 of 165
We also recognize supplier certifications as per international standards including ISO 9001, 14001, 50001, FSSC 2200 and OHSA S 18001. For agricultural commodities, we recognize the Rain Forest Alliance, Fair Trade, Bonsucro, Sustainable Agriculture Ini tiative Platform (SAI Platform), GlobalG.A.P. & GRASP certifications.
Cost of management
1000000
Comment
We work together with juice suppliers on water management & crop protection systems. We support key Greek orange, apricot and peach suppliers to improve their production capabilities and optimize cost by continuously supporting and favoring local sour cing vs imports. For agricultural commodities we align with industry to recognize Rain Forrest Alliance, Fair Trade, BonSucro and Sustainable Agriculture Initiative Platform. We performed Sustainability workshop with juice and sugar suppliers in Greece and we discu ssed the actions for assuring Environmental sustainability.
Identifier
Risk 3
Where in the value chain does the risk driver occur?
Customer
Risk type
Transition risk
Primary climate-related risk driver
Market: Changing customer behavior
Type of financial impact driver
Page 25 of 165
Reputation: Reduced revenue from decreased demand for goods/services
Company- specific description
Lack of leadership in combating climate change could harm our reputation and that's why the customers demand on our products would be decreased. If our coolers which we provide to our customers are not energy efficient, Customer behavior could be changed and they could switch to competitors. It could happen in a time-horizon of 5+ years and will affect our revenue.
Time horizon
Long-term
Likelihood
More likely than not
Magnitude of impact
Medium-low
Potential financial impact
16500000
Explanation of financial impact
The number represents the eventual energy cost that our customers save when they use our energy efficient coolers, calculated based on735.2 million kWh of electricity saved in 2017. This amount would be translated as reduced revenue as the customer will shift their expenses (which mean lower demand to our products).
Management method
We provide to our customer energy efficient coolers, so called I-coolers and for the old models we install Energy Management Devices. It is part of our Commercial strategy and part of our Sustainability commitments in the value chain.
Page 26 of 165
Cost of management
84700000
Comment
We invested €84.7 million in new energy-efficient and HFC-free cold drink equipment in 2017, which helped our customers save 735.2 million kWh of electricity - a 26% increase vs. 2016; the respective carbon emissions saving was 330,605 tonnes of CO2 eq. We continue with our programme for providing more energy efficient cold drink equipment (CDE) and continue working with suppliers of CDE for innovations and further energy reduction.
C2.4
(C2.4) Have you identified any climate-related opportunities with the potential to have a substantive financial or strategic impact on your business?
Yes
C2.4a
(C2.4a) Provide details of opportunities identified with the potential to have a substantive financial or strategic impact on your business.
Identifier
Opp1
Where in the value chain does the opportunity occur?
Page 27 of 165
Direct operations
Opportunity type
Resource efficiency
Primary climate-related opportunity driver
Use of more efficient production and distribution processes
Type of financial impact driver
Reduced operating costs (e.g., through efficiency gains and cost reductions)
Company- specific description
Energy optimization projects and water savings will bring reduced operational cost for our manufacturing sites and warehouses . The current energy spend is 5%-10% of OPEX per year. Time horizon: 5 years.
Time horizon
Medium-term
Likelihood
Likely
Magnitude of impact
Medium-low
Potential financial impact
Page 28 of 165
6000000
Explanation of financial impact
It is 2017 annual saving from all of our energy (carbon) and water saving projects and optimization projects. it is calculated with the respective energy cost in each country.
Strategy to realize opportunity
Carbon and water reduction commitments which are publicly available, science-based carbon reduction targets. In addition, we have internal energy reduction targets per plant. Carbon and water reduction initiatives are fully embedded in each country's business plan. We have a Carbon and Water Champion in each country and at Group level which ae working for all energy, water and carbon s aving initiatives and plans. Monitoring of the progress is monthly.
Cost to realize opportunity
8000000
Comment
Annual capex for energy and water saving projects (aggregated at Group level).
Identifier
Opp2
Where in the value chain does the opportunity occur?
Customer
Opportunity type
Resource efficiency
Page 29 of 165
Primary climate-related opportunity driver
Other
Type of financial impact driver
Reduced operating costs (e.g., through efficiency gains and cost reductions)
Company- specific description
With the energy efficient coolers which we provide to our customers (for storage and cooling of our beverages), we help them to save electricity cost. We invested €84.7 million in new energy-efficient and HFC-free cold drink equipment in 2017, which helped our customers save 735.2 million kWh of electricity - a 26% increase vs. 2016; the respective carbon emissions saving was 330,605 tonnes of CO2 eq. We continue with our programme for providing more energy efficient cold drink equipment (CDE) and continue worki ng with suppliers of CDE for innovations and further energy reduction.
Time horizon
Medium-term
Likelihood
Likely
Magnitude of impact
Medium
Potential financial impact
16500000
Explanation of financial impact
Page 30 of 165
The cost of energy saving from all of energy-efficient coolers we provide (using an average electricity price of 0.0224 EUR/kWh).
Strategy to realize opportunity
We invested €84.7 million in new energy-efficient and HFC-free cold drink equipment in 2017, which helped our customers save 735.2 million kWh of electricity - a 26% increase vs. 2016; the respective carbon emissions saving was 330,605 tonnes of CO2 eq.
Cost to realize opportunity
84700000
Comment
This is the total Capex in all new coolers at market place in 2017.
Identifier
Opp3
Where in the value chain does the opportunity occur?
Direct operations
Opportunity type
Resilience
Primary climate-related opportunity driver
Other
Type of financial impact driver
Page 31 of 165
Other, please specify (Sustainable Water Source)
Company- specific description
Ensuring sustainable water source management (end to end) will improve our resilience to all water related risks which would come from climate change, extreme weathers and droughts.
Time horizon
Medium-term
Likelihood
Likely
Magnitude of impact
Medium-low
Potential financial impact
1700000
Explanation of financial impact
Eventual avoidance of plant stoppages during high season (in summer months) in the plants which are considered in water stres s areas (17 plants * 100'000).
Strategy to realize opportunity
We have committed to certify all of our manufacturing sites in Water Stewardship (European Water Stewardship or Alliance for Water Stewardship) by 2020. This would allow us to be much more resilient in all of the sites and to assure our social license to operate. In addition, we have obligatory programmes for Source Vulnerability Assessment and Source Water Protection Plan, monitored qua rterly.
Page 32 of 165
Cost to realize opportunity
1000000
Comment
Cost of assuring water stewardship programmes in the last 3 years (cumulative in all of the manufacturing sites).
C2.5
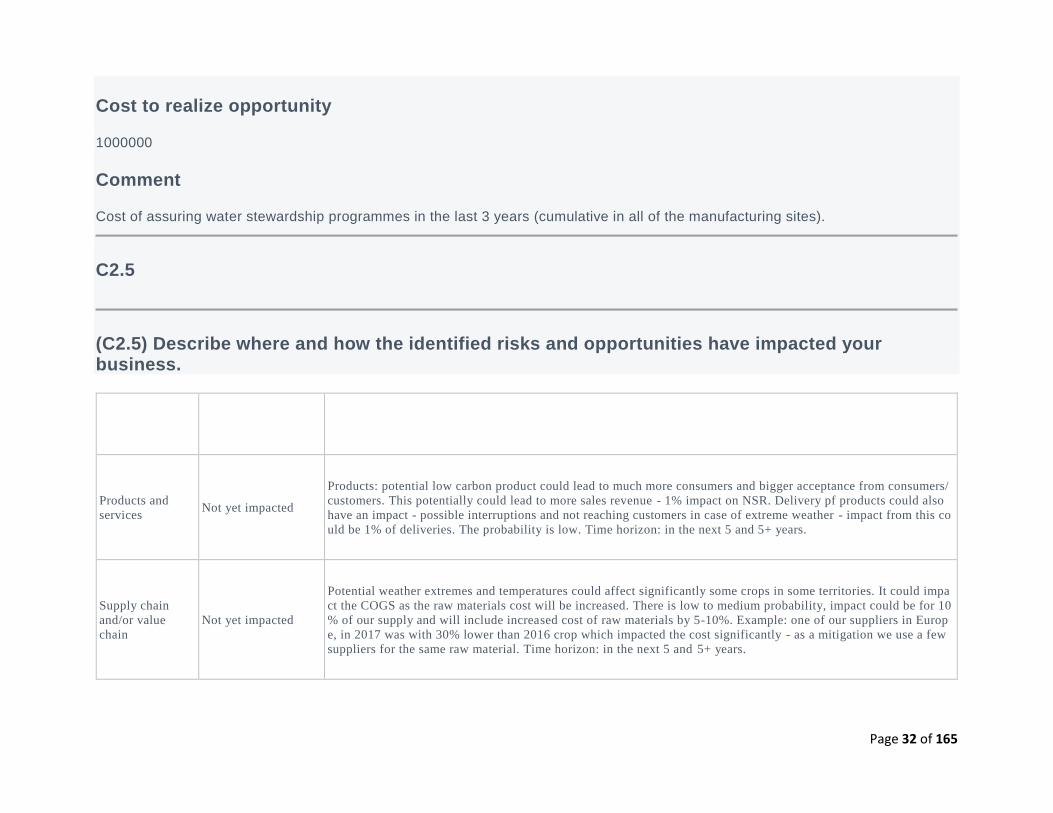
(C2.5) Describe where and how the identified risks and opportunities have impacted your business.
Impact Description
Products and
services Not yet impacted
Products: potential low carbon product could lead to much more consumers and bigger acceptance from consumers/
customers. This potentially could lead to more sales revenue - 1% impact on NSR. Delivery pf products could also
have an impact - possible interruptions and not reaching customers in case of extreme weather - impact from this co
uld be 1% of deliveries. The probability is low. Time horizon: in the next 5 and 5+ years.
Supply chain
and/or value
chain
Not yet impacted
Potential weather extremes and temperatures could affect significantly some crops in some territories. It could impa
ct the COGS as the raw materials cost will be increased. There is low to medium probability, impact could be for 10
% of our supply and will include increased cost of raw materials by 5-10%. Example: one of our suppliers in Europ
e, in 2017 was with 30% lower than 2016 crop which impacted the cost significantly - as a mitigation we use a few
suppliers for the same raw material. Time horizon: in the next 5 and 5+ years.
Page 33 of 165
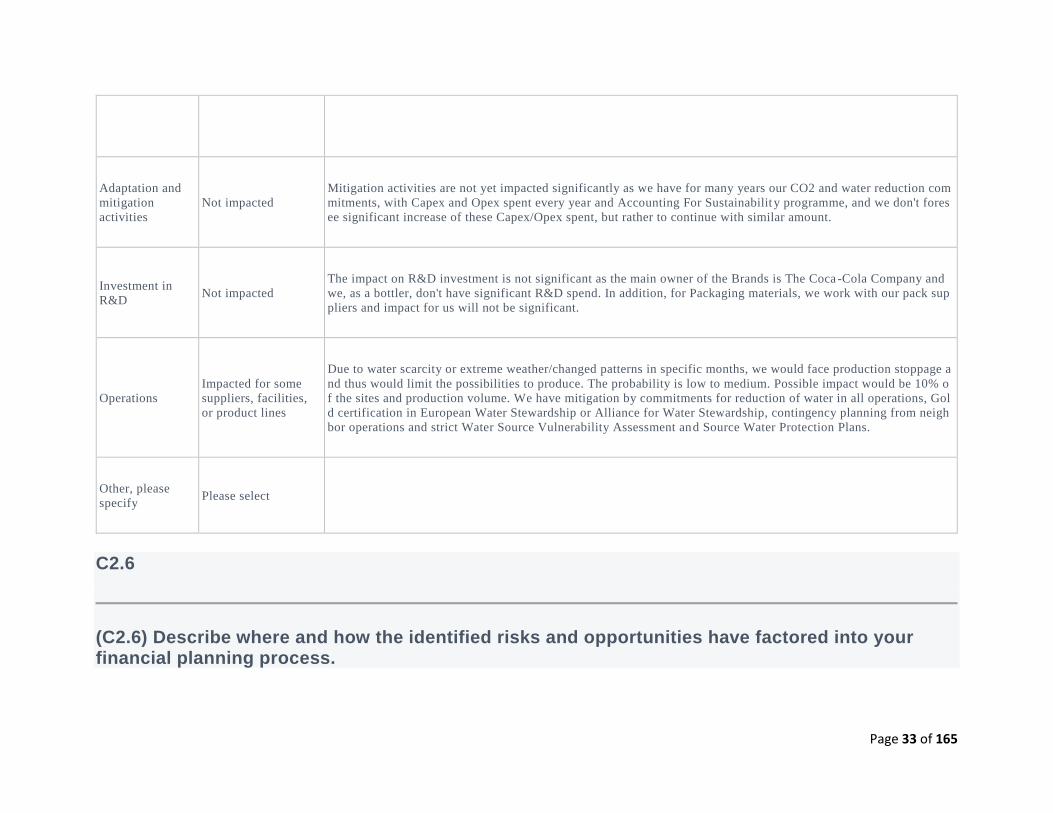
Impact Description
Adaptation and
mitigation
activities
Not impacted
Mitigation activities are not yet impacted significantly as we have for many years our CO2 and water reduction com
mitments, with Capex and Opex spent every year and Accounting For Sustainabilit y programme, and we don't fores
ee significant increase of these Capex/Opex spent, but rather to continue with similar amount.
Investment in
R&D Not impacted
The impact on R&D investment is not significant as the main owner of the Brands is The Coca -Cola Company and
we, as a bottler, don't have significant R&D spend. In addition, for Packaging materials, we work with our pack sup
pliers and impact for us will not be significant.
Operations
Impacted for some
suppliers, facilities,
or product lines
Due to water scarcity or extreme weather/changed patterns in specific months, we would face production stoppage a
nd thus would limit the possibilities to produce. The probability is low to medium. Possible impact would be 10% o
f the sites and production volume. We have mitigation by commitments for reduction of water in all operations, Gol
d certification in European Water Stewardship or Alliance for Water Stewardship, contingency planning from neigh
bor operations and strict Water Source Vulnerability Assessment and Source Water Protection Plans.
Other, please
specify Please select
C2.6
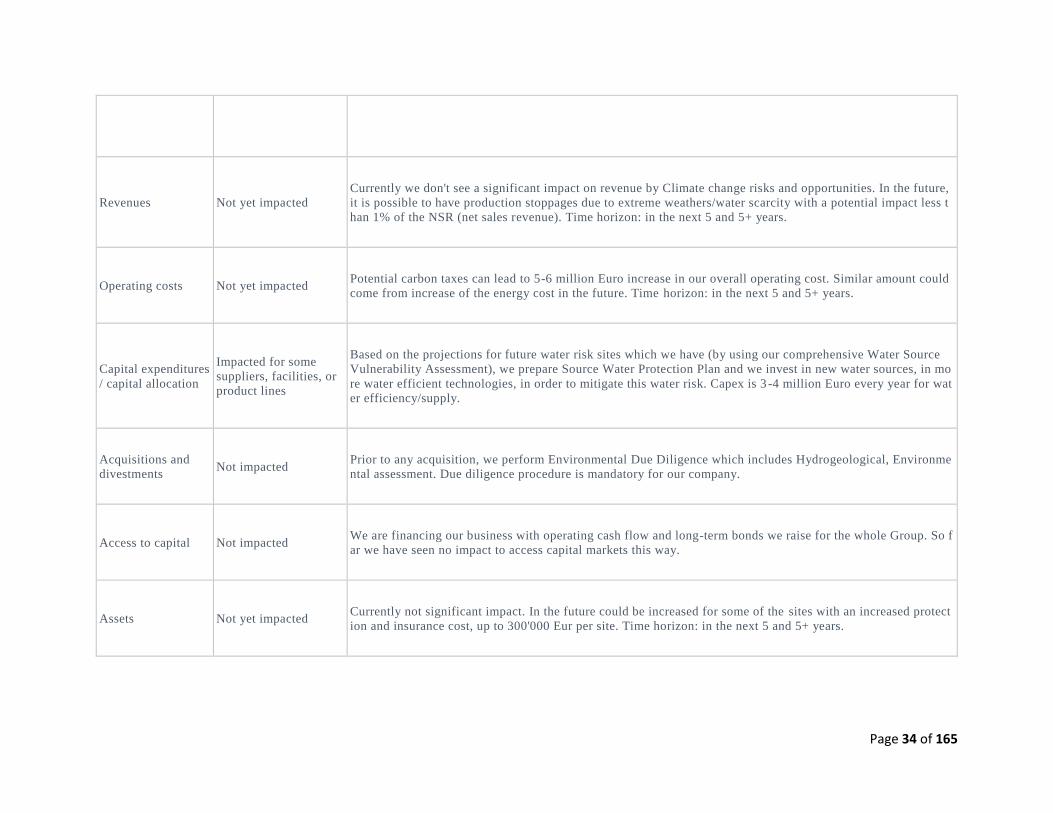
(C2.6) Describe where and how the identified risks and opportunities have factored into your financial planning process.
Page 34 of 165
Relevance Description
Revenues Not yet impacted
Currently we don't see a significant impact on revenue by Climate change risks and opportunities. In the future,
it is possible to have production stoppages due to extreme weathers/water scarcity with a potential impact less t
han 1% of the NSR (net sales revenue). Time horizon: in the next 5 and 5+ years.
Operating costs Not yet impacted Potential carbon taxes can lead to 5-6 million Euro increase in our overall operating cost. Similar amount could
come from increase of the energy cost in the future. Time horizon: in the next 5 and 5+ years.
Capital expenditures
/ capital allocation
Impacted for some
suppliers, facilities, or
product lines
Based on the projections for future water risk sites which we have (by using our comprehensive Water Source
Vulnerability Assessment), we prepare Source Water Protection Plan and we invest in new water sources, in mo
re water efficient technologies, in order to mitigate this water risk. Capex is 3 -4 million Euro every year for wat
er efficiency/supply.
Acquisitions and
divestments Not impacted
Prior to any acquisition, we perform Environmental Due Diligence which includes Hydrogeological, Environme
ntal assessment. Due diligence procedure is mandatory for our company.
Access to capital Not impacted We are financing our business with operating cash flow and long-term bonds we raise for the whole Group. So f
ar we have seen no impact to access capital markets this way.
Assets Not yet impacted Currently not significant impact. In the future could be increased for some of the sites with an increased protect
ion and insurance cost, up to 300'000 Eur per site. Time horizon: in the next 5 and 5+ years.
Page 35 of 165
Relevance Description
Liabilities Not evaluated
Other Please select
C3. Business Strategy
C3.1
(C3.1) Are climate-related issues integrated into your business strategy?
Yes
C3.1a
(C3.1a) Does your organization use climate-related scenario analysis to inform your business strategy?
Yes, qualitative
Page 36 of 165
C-AC3.1b/C-CE3.1b/C-CH3.1b/C-CO3.1b/C-EU3.1b/C-FB3.1b/C-MM3.1b/C-OG3.1b/C-PF3.1b/C-ST3.1b/C-TO3.1b/C-TS3.1b)
(C-AC3.1b/C-CE3.1b/C-CH3.1b/C-CO3.1b/C-EU3.1b/C-FB3.1b/C-MM3.1b/C-OG3.1b/C-PF3.1b/C-ST3.1b/C-TO3.1b/C-TS3.1b) Indicate whether your organization has developed a low-carbon transition plan to support the long-term business strategy.
Yes
C3.1c
(C3.1c) Explain how climate-related issues are integrated into your business objectives and strategy.
i) How the business strategy has been influenced: We have integrated sustainability into the way we run our business. We identified material issues to our business with our stakeholders and developed ambitious strategies, demanding targets, rigorous governa nce and integrated reporting. We have also implemented internationally recognized management systems 99.6% of our production volume now comes from plants certified in environmental management (ISO 14001). In our materiality matrix we have identified seve ral material issues directly linked to climate change: Carbon&energy; Sustainable packaging, recycling and waste management; Sustainable sourcing and Water stewardship. Prior to the UN Climate Change Conference meeting in Paris in late 2015 we joined We Mea n Business and we committed to 4 of the initiatives: adopt a science-based emissions reduction target; put a price on carbon; engage responsibly to advance climate policy; and report climate change information in corporate reporting as a fiduciary duty. We h ave publicly issued our Sustainability commitments and in the area of Environment these are: Reduce direct carbon emissions intensity by 50% (approved science based carbon reduction target); Reduce the carbon emissions intensity in the value chain by 25% (approve d science-based target); Cover 40% of total energy use from renewable and clean energy sources; Recover for recycling an average of 40% of total packaging we introduce to our markets; Have 20% of the total PET used coming from recycled PET and/or PET from renewable materials; Reduce the amount of packaging by 25% per litre of beverage produced; Certify over 95% of key agricultural ingredients against the Coca-Cola System’s Supplier Agricultural Guiding Principles; Reduce water use from our plants by 30%; Certify all of our plants in European Water Stewardship or Alliance for Water Stewardship standard. We are among the first 12 companies world-wide with approved by the WRI science-based targets. We have developed and communicated several policies linked to climate: Climate Change Policy, Environmental Policy, Packaging waste & recycling Policy, Water Stewardship Policy, Sustainable Agricu
Page 37 of 165
ltural Guiding principles. ii) Aspects of climate change which have influenced the strategy: •Regulation: increased energy pr ices and the introduction of CO2 taxes for Scope 1+2 emissions would increase our operational cost. •Physical aspect: a) impacts on the supply chain and cost of key raw materials: Poor weather conditions creates significant volatility in our sweeteners’ costs by a ffecting yields of beet and/or cane crops. b) Water scarcity could restrict the ability of individual sites to produce. iii) Climate change has influenced short-term, mid- and long-term strategy in the aspects of risk management, cost leadership, community trust: • Setting new sustainability targets • Since 2015 all our newly purchased cold drink equipment is HFC -free • Top 18 Energy savers, mandatory for each of our plants • Installing of CHP plants: Totally we have 12 CHP • On-site investments and purchasing of renewable energy: in 2017 34.1% of energy was from Renewable&Clean sources. iv) Long-term business strategy influenced by climate change: • Approved science-based carbon reduction targets for direct operations and the value chain • Using of internal carbon price for decision -making purposes, it is integrated in the financial process • Climate change information is part of our Integrated Annual reports a nd it is verified by an independent organization for compliance with AA1000AS Assurance Standard, GRI G4 Comprehensive standards, a dvanced level for COP • Carbon, energy management and packaging optimization programmes and targets • Partnering with NGOs and INGOs on common issues such as nature conservation • Partnering with local communities to minimise environmental impact • F ocus on sustainable procurement v. Strategic advantage over your competitors: • Continuously improved environmental performance increases the reputation and it is recognized by the stakeholders, employees and consumers • Approved science -based carbon reduction targets in both direct operations and the value chain would attract more consumers and are part of our license to operate • S ustainably sourced agricultural raw materials ensure supply and reduce price volatility • Providing HFC -free and energy efficient coolers to our customers make us preferred supplier • Innovation in packaging, such as bio PET bottle gives us an advantage to customers and consumers vi. Most substantial business decisions during the reporting year: In November 2017, our CFO signed off t he letter of support to TCFD and we have committed to implement the TCFD requirements in our next Integrated Annual Report; we are well on-track in reaching our 2020 Sustainability commitments (for Renewable energy, packaging decrease, pack recovery, carbon&water reduction) and Accounting for Sustainability concept was cascading to all operations and used in Financial planning.
C3.1d
(C3.1d) Provide details of your organization’s use of climate-related scenario analysis.
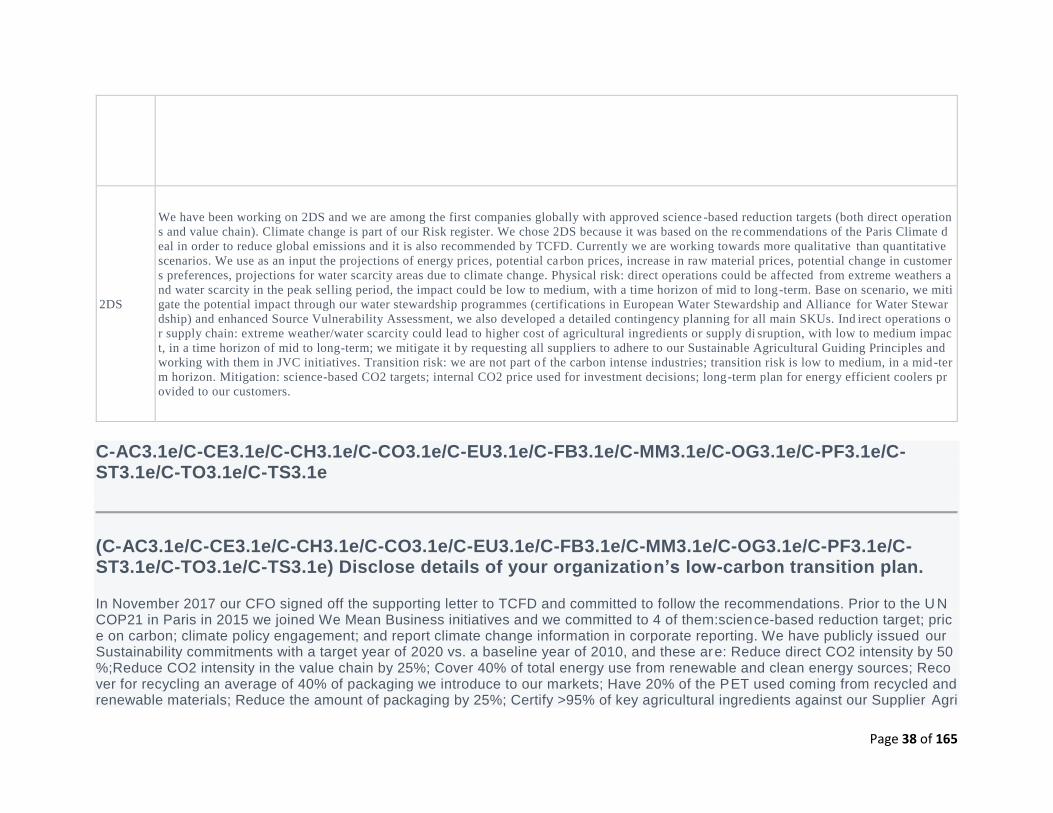
Page 38 of 165
Climate-
related
scenarios
Details
2DS
We have been working on 2DS and we are among the first companies globally with approved science -based reduction targets (both direct operation
s and value chain). Climate change is part of our Risk register. We chose 2DS because it was based on the re commendations of the Paris Climate d
eal in order to reduce global emissions and it is also recommended by TCFD. Currently we are working towards more qualitative than quantitative
scenarios. We use as an input the projections of energy prices, potential carbon prices, increase in raw material prices, potential change in customer
s preferences, projections for water scarcity areas due to climate change. Physical risk: direct operations could be affected from extreme weathers a
nd water scarcity in the peak selling period, the impact could be low to medium, with a time horizon of mid to long-term. Base on scenario, we miti
gate the potential impact through our water stewardship programmes (certifications in European Water Stewardship and Alliance for Water Stewar
dship) and enhanced Source Vulnerability Assessment, we also developed a detailed contingency planning for all main SKUs. Ind irect operations o
r supply chain: extreme weather/water scarcity could lead to higher cost of agricultural ingredients or supply di sruption, with low to medium impac
t, in a time horizon of mid to long-term; we mitigate it by requesting all suppliers to adhere to our Sustainable Agricultural Guiding Principles and
working with them in JVC initiatives. Transition risk: we are not part of the carbon intense industries; transition risk is low to medium, in a mid-ter
m horizon. Mitigation: science-based CO2 targets; internal CO2 price used for investment decisions; long-term plan for energy efficient coolers pr
ovided to our customers.
C-AC3.1e/C-CE3.1e/C-CH3.1e/C-CO3.1e/C-EU3.1e/C-FB3.1e/C-MM3.1e/C-OG3.1e/C-PF3.1e/C-ST3.1e/C-TO3.1e/C-TS3.1e
(C-AC3.1e/C-CE3.1e/C-CH3.1e/C-CO3.1e/C-EU3.1e/C-FB3.1e/C-MM3.1e/C-OG3.1e/C-PF3.1e/C-ST3.1e/C-TO3.1e/C-TS3.1e) Disclose details of your organization’s low-carbon transition plan.
In November 2017 our CFO signed off the supporting letter to TCFD and committed to follow the recommendations. Prior to the U N COP21 in Paris in 2015 we joined We Mean Business initiatives and we committed to 4 of them:science-based reduction target; price on carbon; climate policy engagement; and report climate change information in corporate reporting. We have publicly issued our Sustainability commitments with a target year of 2020 vs. a baseline year of 2010, and these are: Reduce direct CO2 intensity by 50%;Reduce CO2 intensity in the value chain by 25%; Cover 40% of total energy use from renewable and clean energy sources; Recover for recycling an average of 40% of packaging we introduce to our markets; Have 20% of the PET used coming from recycled and renewable materials; Reduce the amount of packaging by 25%; Certify >95% of key agricultural ingredients against our Supplier Agri
Page 39 of 165
cultural Guiding Principles; Reduce water use from our plants by 30%; Certify all of our plan ts in European Water Stewardship or AWS standard. We are among the first 12 companies world-wide with approved SBT. To reach the commitments, we have established year-on-year improvement targets and actions (what, how, who). All yearly targets&actions are part of each country’s Business plan, tracked quarterly by the Senior Leaders and performance is communicated quarterly to all employees during the Quarterly Senio r Management call. We have customised system for reporting of the Environmental targets, aggregated at production site level, country, region &corporate level. Actions to low-carbon transition: Manufacturing: energy reduction plans are established by 2020 and currently we are working beyond 2020 (by 2030), which include Top 18 obligatory energy savers (set points reduction, ceramic reflectors for blowing, HP/LP compressors upgrade, filling of beverages at ambient temperature), Top 10 mandatory water savers (backwash w ater reuse from carbon/sand filters, dry lubrication of conveyers, air rinsing of empty bottles, data driven backwash of all filters, cooling water reuse, CIP closed loop, ECA CIP use), purchasing of renewable electricity via certificates, reduction of CO2 losses f or beverage carbonation, combining aerobic with anaerobic waste water treatment in our own waste water plants to produce biogas, expanding our programme for CHP (co-generation) on site. Transport: specific plans for purchasing of hybrids and electrical vehicles for sales force and management; working for purchasing distribution tracks with lower fuel consumption. Suppliers of agricultural ingredients: work jointly for better water management, crop management, post-harvesting methods and soil fertilization practices. Customers: since 2015 all the new coolers we purchase and provide to our customers are HFC-free, also we have specific plans for retrofitting of the old energy consuming coolers and gradual replacement by new energy efficient coolers, which use SMART technology. Products: as beverage company, water is the main ingredient in our products. Water scarcity could restrict the ability of individual sites to produce: we projected that 18% of our sites in some specific geographies would operate in vulnerable areas. That’s why we set ambitious water reduction target and set target to have 100% of our plants certified in European Water Stewardship or AWS by 2020. For each water source, we use comprehensive Source Vulnerability Assessment provided by external recognised experts, Source Water Protection Programme, Top 10 Water savers, water replenishment&conservation projects with communities. Physical aspects triggered the business strategy to have contingency plans, assessments& prevention measures for potential interruption. Capex: every year we invest €10 million in energy/carbon/water reduction in our plants; >€70 mil in energy-efficient coolers which we provide to customers; >€14 mil in pack optimization which help reduce CO2 in our packaging, respectively in products. Challenges identifie d: -Renewable electricity affordability, especially in certain geographies (still ROI is above the internal threshold, even by using our internal CO2 price). To mitigate, we work with partnership and prepare a detailed business case for each possible solution; -Not viable renewable solution for thermal energy: for cleaning/pasteurization in our manufacturing process, we use hot water/steam with very high temperature, which cannot be produced by renewable source. To mitigate, we enhance our CHP (Co-generation) programme, so to find cleaner solution for thermal energy; -Lack of packaging waste collection in some of the countries in which we operate: using of recycled materials reduce our CO2 footprint, however the rPET feedstock depends on the collection of post -consumer materials which is limited in some of our big countries (Nigeria, Ukraine). Mitigation: working with suppliers, start -up companies and municipalities for development of such collection system.
C4. Targets and performance
Page 40 of 165
C4.1
(C4.1) Did you have an emissions target that was active in the reporting year?
Intensity target
C4.1b
(C4.1b) Provide details of your emissions intensity target(s) and progress made against those target(s).
Target reference number
Int 1
Scope
Scope 1 +2 (market-based)
% emissions in Scope
100
% reduction from baseline year
50
Metric
Page 41 of 165
Other, please specify (Gram CO2 per Litre of produced beverage)
Base year
2010
Start year
2010
Normalized baseline year emissions covered by target (metric tons CO2e)
78.3
Target year
2020
Is this a science-based target?
Yes, this target has been approved as science-based by the Science Based Targets initiative
% achieved (emissions)
83
Target status
Underway
Please explain
Page 42 of 165
We are well on track to achieve the target. It is a target set in 2015 by using Sectoral Decarbonization Approach method. It was approved in February 2016 by the WRI and it is published on science-based targets web site. We were among the first 12 companies globally with approved SBT.
% change anticipated in absolute Scope 1+2 emissions
20
% change anticipated in absolute Scope 3 emissions
0
Target reference number
Int 2
Scope
Other, please specify (Scope 1+2 (market-based) + Scope 3 (all))
% emissions in Scope
100
% reduction from baseline year
25
Metric
Other, please specify (Gram CO2 per Litre of produced beverage)
Base year
Page 43 of 165
2010
Start year
2010
Normalized baseline year emissions covered by target (metric tons CO2e)
441.4
Target year
2020
Is this a science-based target?
Yes, this target has been approved as science-based by the Science Based Targets initiative
% achieved (emissions)
93
Target status
Underway
Please explain
We are well on track to achieve the target. It is a target set in 2015 by using Sectoral Decarbonization Approach method. It was approved in February 2016 by the WRI and it is published on science-based targets web site. We were among the first 12 companies globally with approved SBT.
% change anticipated in absolute Scope 1+2 emissions
Page 44 of 165
1
% change anticipated in absolute Scope 3 emissions
10
C4.2
(C4.2) Provide details of other key climate-related targets not already reported in question C4.1/a/b.
Target
Renewable energy consumption
KPI – Metric numerator
% out of total energy consumed in our organization which is coming from renewable and clean (CHP) sources.
KPI – Metric denominator (intensity targets only)
N/A
Base year
2014
Start year
2014
Page 45 of 165
Target year
2020
KPI in baseline year
15
KPI in target year
40
% achieved in reporting year
85
Target Status
Underway
Please explain
Quite on track of achieving the 2020 renewable and clean energy target.
Part of emissions target
This target contributes in reaching CO2 reduction targets both in direct operations and in the value chain.
Is this target part of an overarching initiative?
Please select
Page 46 of 165
Target
Waste
KPI – Metric numerator
grammes of Landfilled waste coming from our manufacturing sites per litre of produced beverage.
KPI – Metric denominator (intensity targets only)
liters of produced beverages
Base year
2004
Start year
2004
Target year
2020
KPI in baseline year
5
KPI in target year
0.5
% achieved in reporting year
Page 47 of 165
100
Target Status
Underway
Please explain
We reached the target already in 2017 (and the target was by 2020), so a new target will be set.
Part of emissions target
No
Is this target part of an overarching initiative?
Please select
C4.3
(C4.3) Did you have emissions reduction initiatives that were active within the reporting year? Note that this can include those in the planning and/or implementation phases.
Yes
C4.3a
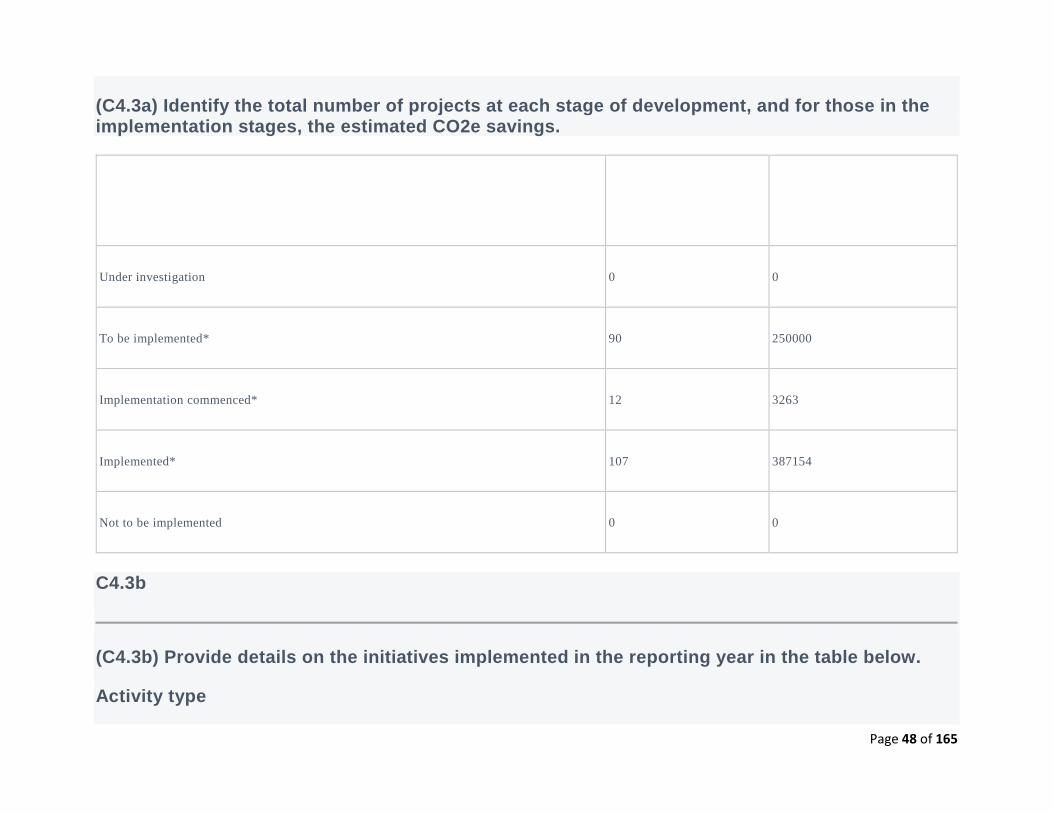
Page 48 of 165
(C4.3a) Identify the total number of projects at each stage of development, and for those in the implementation stages, the estimated CO2e savings.
Number of projects
Total estimated annual CO2e
savings in metric tonnes CO2e
(only for rows marked *)
Under investigation 0 0
To be implemented* 90 250000
Implementation commenced* 12 3263
Implemented* 107 387154
Not to be implemented 0 0
C4.3b
(C4.3b) Provide details on the initiatives implemented in the reporting year in the table below.
Activity type
Page 49 of 165
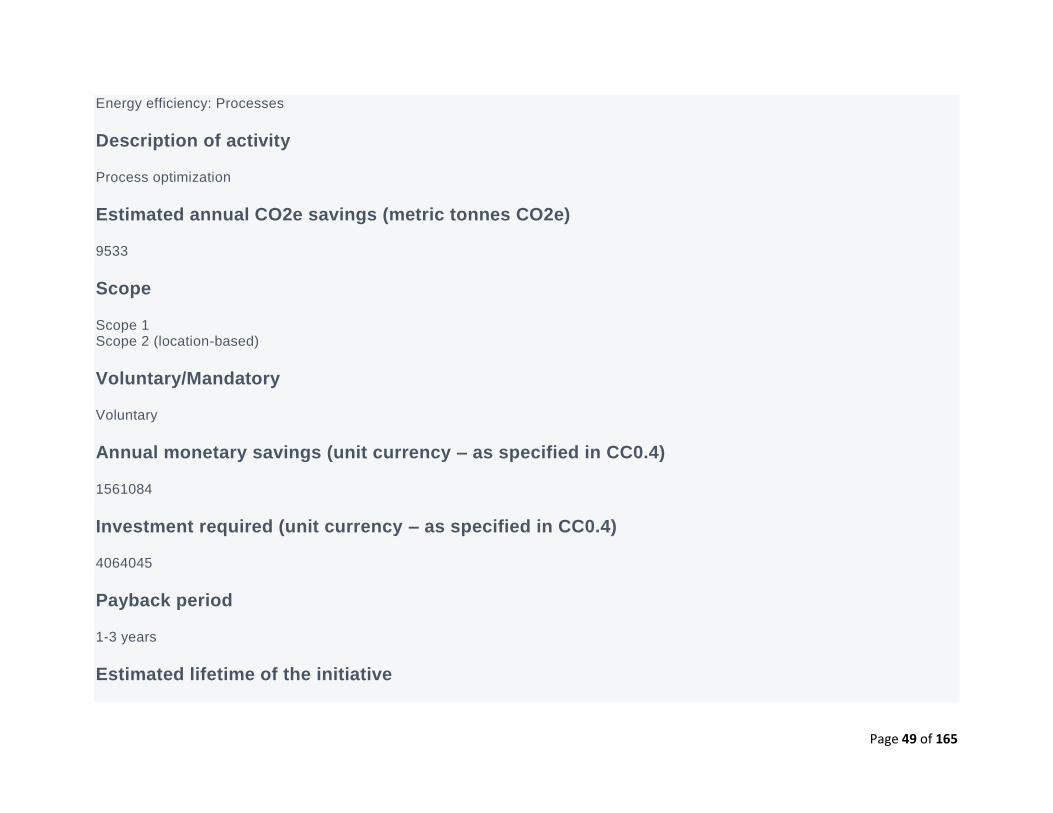
Energy efficiency: Processes
Description of activity
Process optimization
Estimated annual CO2e savings (metric tonnes CO2e)
9533
Scope
Scope 1 Scope 2 (location-based)
Voluntary/Mandatory
Voluntary
Annual monetary savings (unit currency – as specified in CC0.4)
1561084
Investment required (unit currency – as specified in CC0.4)
4064045
Payback period
1-3 years
Estimated lifetime of the initiative
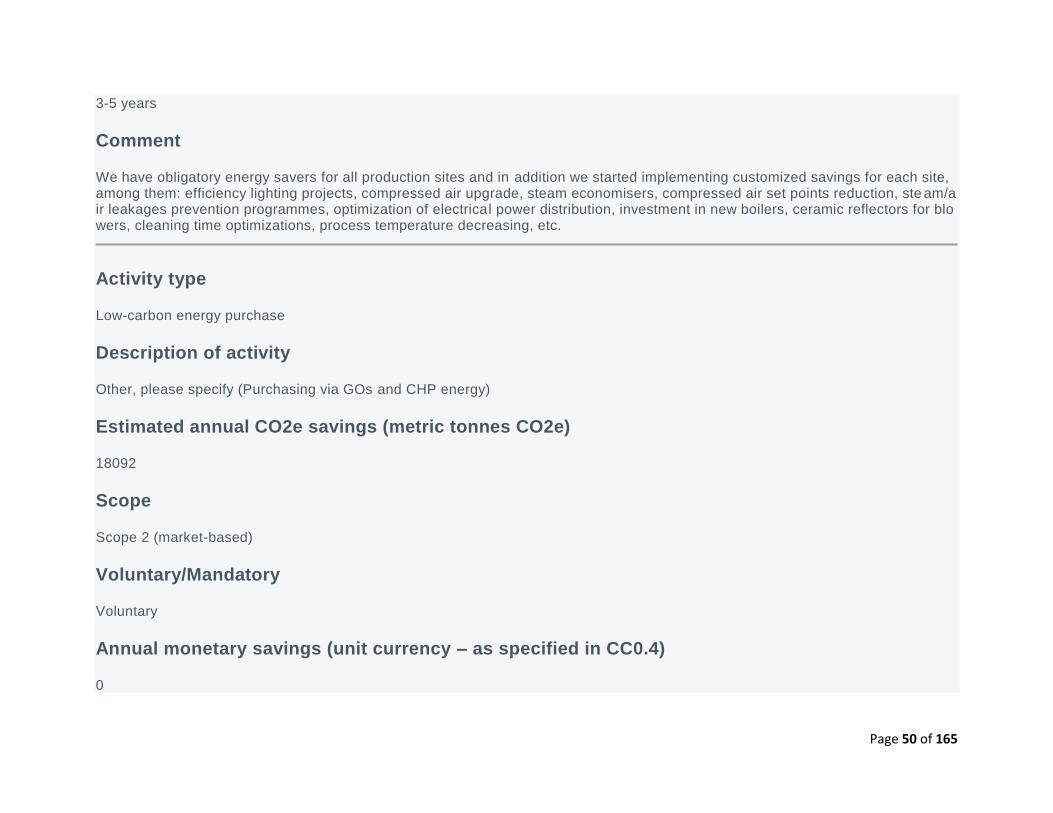
Page 50 of 165
3-5 years
Comment
We have obligatory energy savers for all production sites and in addition we started implementing customized savings for each site, among them: efficiency lighting projects, compressed air upgrade, steam economisers, compressed air set points reduction, ste am/air leakages prevention programmes, optimization of electrical power distribution, investment in new boilers, ceramic reflectors for blowers, cleaning time optimizations, process temperature decreasing, etc.
Activity type
Low-carbon energy purchase
Description of activity
Other, please specify (Purchasing via GOs and CHP energy)
Estimated annual CO2e savings (metric tonnes CO2e)
18092
Scope
Scope 2 (market-based)
Voluntary/Mandatory
Voluntary
Annual monetary savings (unit currency – as specified in CC0.4)
0
Page 51 of 165
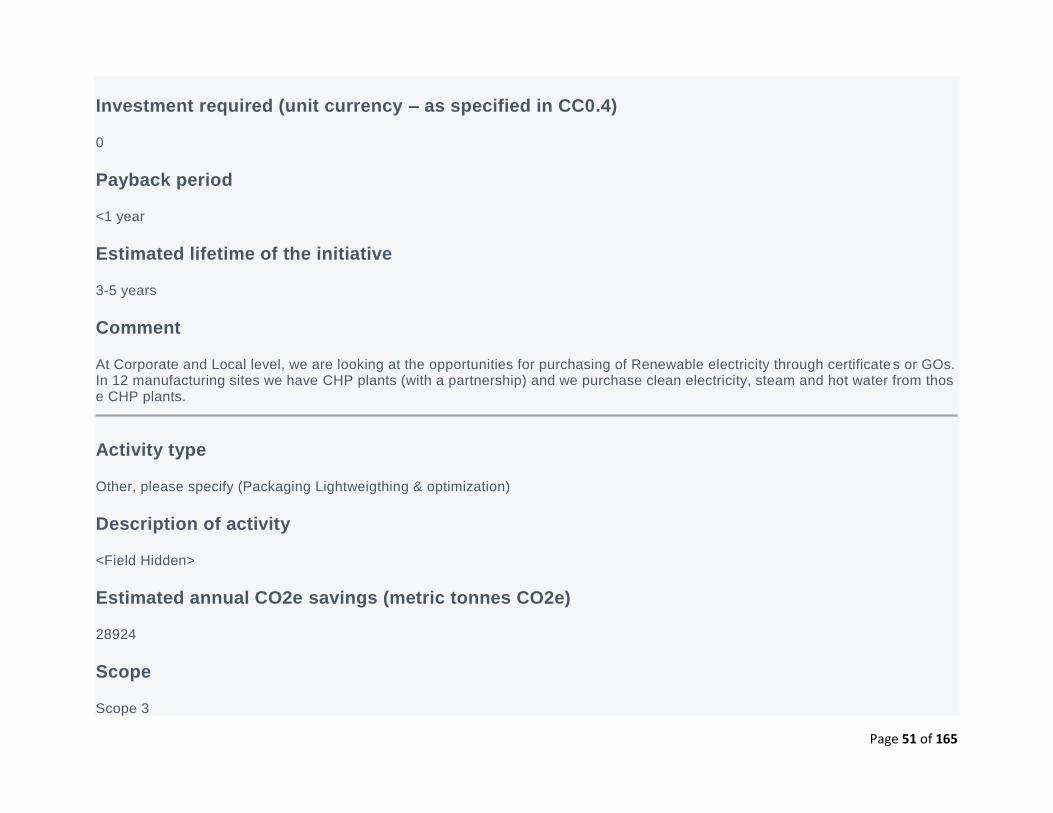
Investment required (unit currency – as specified in CC0.4)
0
Payback period
<1 year
Estimated lifetime of the initiative
3-5 years
Comment
At Corporate and Local level, we are looking at the opportunities for purchasing of Renewable electricity through certificates or GOs. In 12 manufacturing sites we have CHP plants (with a partnership) and we purchase clean electricity, steam and hot water from those CHP plants.
Activity type
Other, please specify (Packaging Lightweigthing & optimization)
Description of activity
<Field Hidden>
Estimated annual CO2e savings (metric tonnes CO2e)
28924
Scope
Scope 3
Page 52 of 165
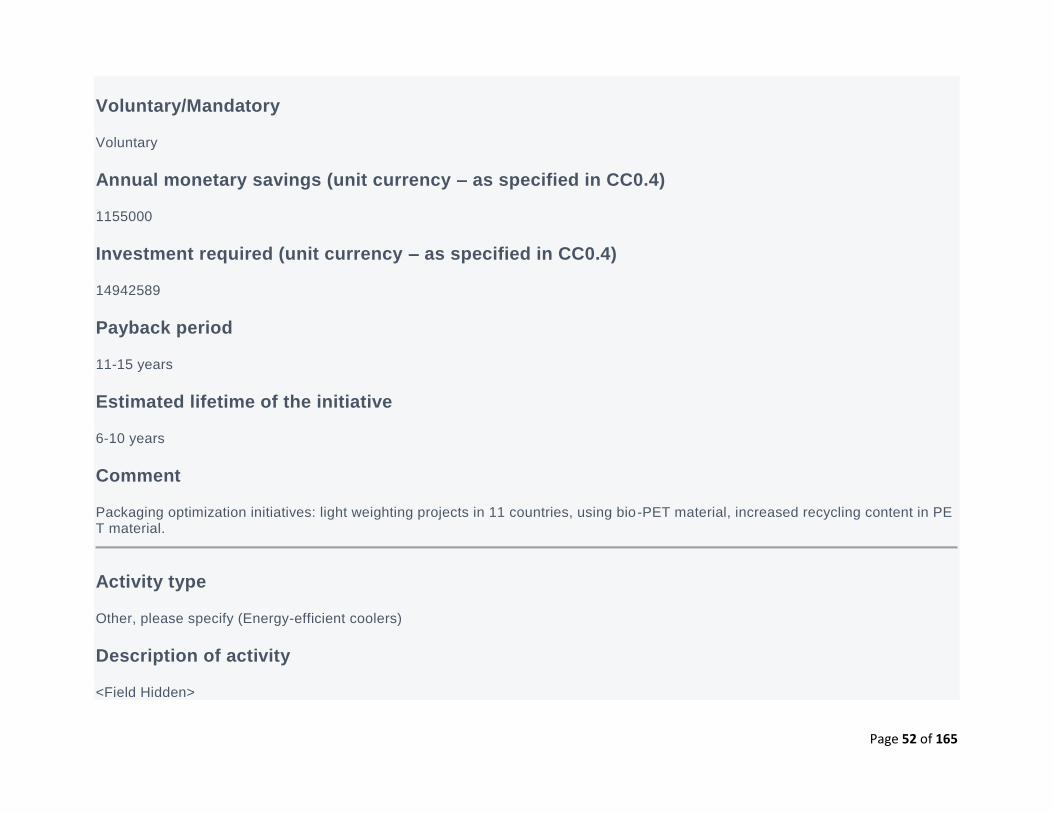
Voluntary/Mandatory
Voluntary
Annual monetary savings (unit currency – as specified in CC0.4)
1155000
Investment required (unit currency – as specified in CC0.4)
14942589
Payback period
11-15 years
Estimated lifetime of the initiative
6-10 years
Comment
Packaging optimization initiatives: light weighting projects in 11 countries, using bio-PET material, increased recycling content in PET material.
Activity type
Other, please specify (Energy-efficient coolers)
Description of activity
<Field Hidden>
Page 53 of 165
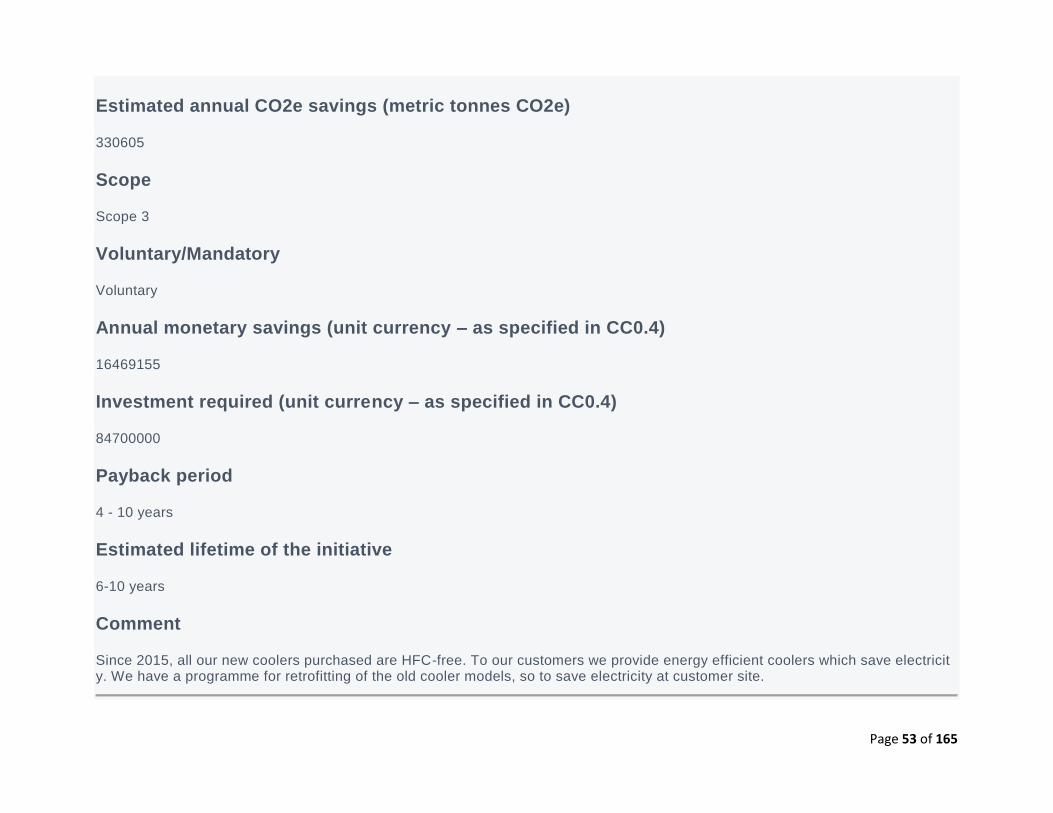
Estimated annual CO2e savings (metric tonnes CO2e)
330605
Scope
Scope 3
Voluntary/Mandatory
Voluntary
Annual monetary savings (unit currency – as specified in CC0.4)
16469155
Investment required (unit currency – as specified in CC0.4)
84700000
Payback period
4 - 10 years
Estimated lifetime of the initiative
6-10 years
Comment
Since 2015, all our new coolers purchased are HFC-free. To our customers we provide energy efficient coolers which save electricity. We have a programme for retrofitting of the old cooler models, so to save electricity at customer site.
Page 54 of 165
C4.3c
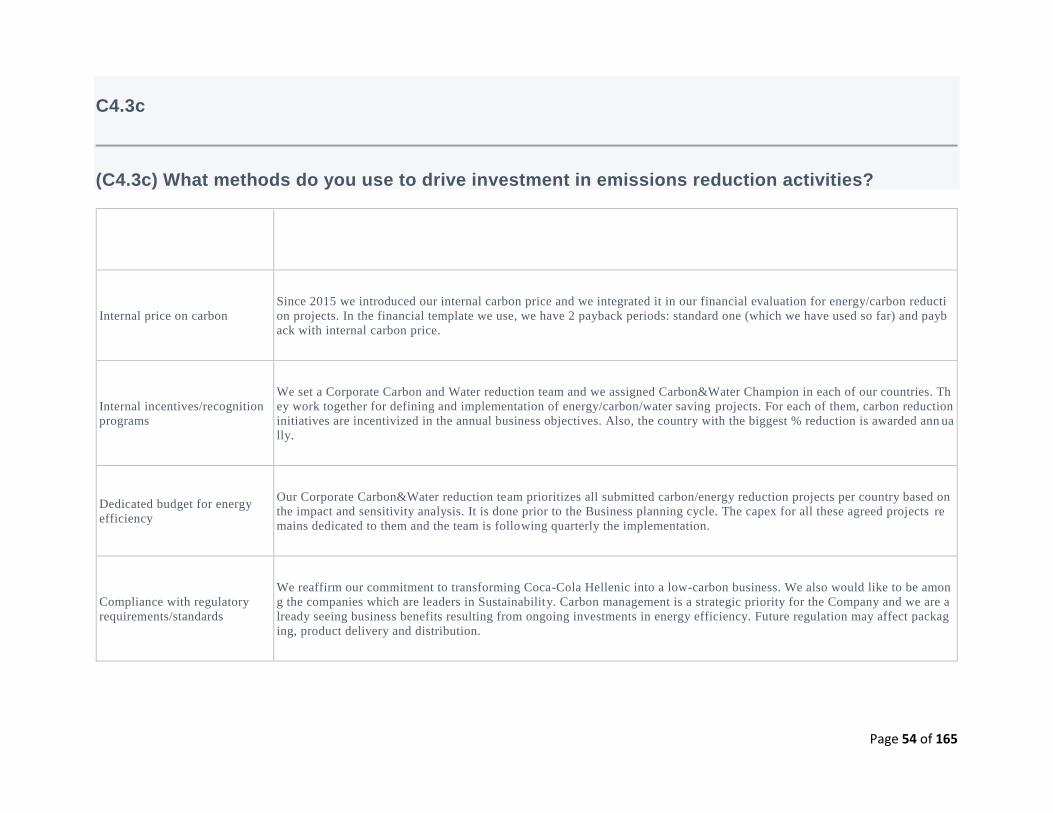
(C4.3c) What methods do you use to drive investment in emissions reduction activities?
Method Comment
Internal price on carbon
Since 2015 we introduced our internal carbon price and we integrated it in our financial evaluation for energy/carbon reducti
on projects. In the financial template we use, we have 2 payback periods: standard one (which we have used so far) and payb
ack with internal carbon price.
Internal incentives/recognition
programs
We set a Corporate Carbon and Water reduction team and we assigned Carbon&Water Champion in each of our countries. Th
ey work together for defining and implementation of energy/carbon/water saving projects. For each of them, carbon reduction
initiatives are incentivized in the annual business objectives. Also, the country with the biggest % reduction is awarded ann ua
lly.
Dedicated budget for energy
efficiency
Our Corporate Carbon&Water reduction team prioritizes all submitted carbon/energy reduction projects per country based on
the impact and sensitivity analysis. It is done prior to the Business planning cycle. The capex for all these agreed projects re
mains dedicated to them and the team is following quarterly the implementation.
Compliance with regulatory
requirements/standards
We reaffirm our commitment to transforming Coca-Cola Hellenic into a low-carbon business. We also would like to be amon
g the companies which are leaders in Sustainability. Carbon management is a strategic priority for the Company and we are a
lready seeing business benefits resulting from ongoing investments in energy efficiency. Future regulation may affect packag
ing, product delivery and distribution.
Page 55 of 165
Method Comment
Other
We work with our suppliers in order to be able to buy less intensive carbon products: e.g purchasing of energy-efficient new
models of coolers and other cold drink equipment. Also, together with our packaging suppliers we develop new pack design
which allow light-weighting of our PET bottles and aluminium Cans.
C4.5
(C4.5) Do you classify any of your existing goods and/or services as low-carbon products or do they enable a third party to avoid GHG emissions?
Yes
C4.5a
(C4.5a) Provide details of your products and/or services that you classify as low-carbon products or that enable a third party to avoid GHG emissions.
Level of aggregation
Company-wide
Description of product/Group of products
Included here: a) products which are in Plantbottle™ packaging, the first fully recyclable PET bottle to use renewable plantb ased content; b) beverages in PET packaging which has recycledPET content, since the CO2 factor of this packaging is much lower (ba sed
Page 56 of 165
on LCA); c) our juices packed in bricks used FSC (Forest Stewardship Council) certified packaging from our supplier, which ha s lower CO2 factor; d) all beverages containing water produced at plants certified in European Water Stewardship (EWS): as of e nd of 2017 we have 26 sites certified with a Gold certification in European Water Stewardship (EWS). As water is linked to carbon, es pecially having all activities at water sheds/basin and community level required to achieve a EWS, we consider these bevera ges as low carbon ones.
Are these low-carbon product(s) or do they enable avoided emissions?
Low-carbon product and avoided emissions
Taxonomy, project or methodology used to classify product(s) as low-carbon or to calculate avoided emissions
Other, please specify (Lower CO2 factors of materials) Plantbottle™ and rPET materials have lower CO2 factors (based on LCA studies performed for The Coca -Cola Company by ifeu). Tetrabricks packaging is with lower CO2 factor, coming from our supplier database. EWS Gold means that we assure end to end sustainable water stewardship, with no any negative impact on HVAC, biodiversity, land, forests etc.
% revenue from low carbon product(s) in the reporting year
61.5
Comment
39716 tonnes of avoided CO2 eq in 2017.
Level of aggregation
Company-wide
Description of product/Group of products
Page 57 of 165
Avoided emissions at third-parties: As part of our climate change strategy, we offer to our customers energy efficient coolers and HFC-free coolers. Regarding the old coolers in the market place which are not so energy efficient as the new ones, we regularly retrofit them, until we are able to replace them, by installing Energy Management Devices (EMD), LED lights, insulation etc.
Are these low-carbon product(s) or do they enable avoided emissions?
Avoided emissions
Taxonomy, project or methodology used to classify product(s) as low-carbon or to calculate avoided emissions
Other, please specify (Saving in energy transformed in CO2 )
% revenue from low carbon product(s) in the reporting year
19.6
Comment
Avoided emissions: 330 605 met. ton. CO2 eq .The figure shows the % NSR generated by products which are sold in our coolers w ith installed EMD (Energy Management Device) and in our new energy efficient coolers (so called I -coolers). Avoided CO2 emissions are calculated by multiplying the electricity saving in each country (from the coolers) by the electricity grid factor in the se countries (grid factor per country is based on International Energy Agency data).
C5. Emissions methodology
C5.1
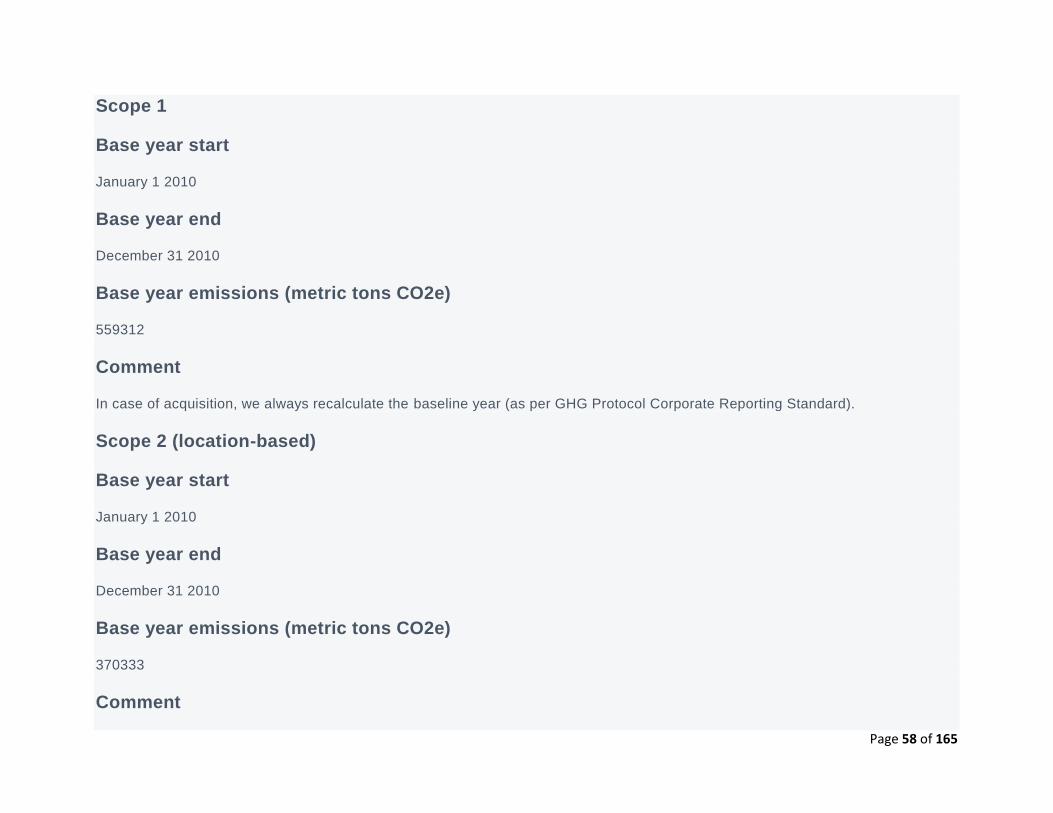
(C5.1) Provide your base year and base year emissions (Scopes 1 and 2).
Page 58 of 165
Scope 1
Base year start
January 1 2010
Base year end
December 31 2010
Base year emissions (metric tons CO2e)
559312
Comment
In case of acquisition, we always recalculate the baseline year (as per GHG Protocol Corporate Reporting Standard).
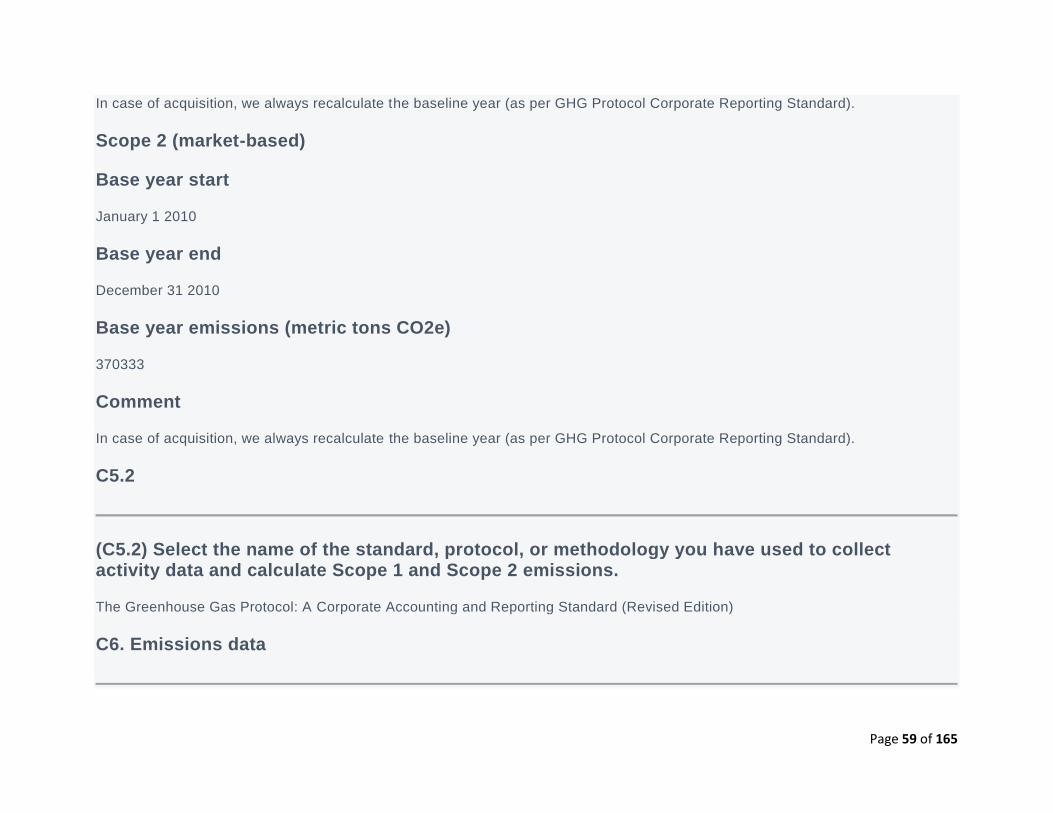
Scope 2 (location-based)
Base year start
January 1 2010
Base year end
December 31 2010
Base year emissions (metric tons CO2e)
370333
Comment
Page 59 of 165
In case of acquisition, we always recalculate the baseline year (as per GHG Protocol Corporate Reporting Standard).
Scope 2 (market-based)
Base year start
January 1 2010
Base year end
December 31 2010
Base year emissions (metric tons CO2e)
370333
Comment
In case of acquisition, we always recalculate the baseline year (as per GHG Protocol Corporate Reporting Standard).
C5.2
(C5.2) Select the name of the standard, protocol, or methodology you have used to collect activity data and calculate Scope 1 and Scope 2 emissions.
The Greenhouse Gas Protocol: A Corporate Accounting and Reporting Standard (Revised Edition)
C6. Emissions data
Page 60 of 165
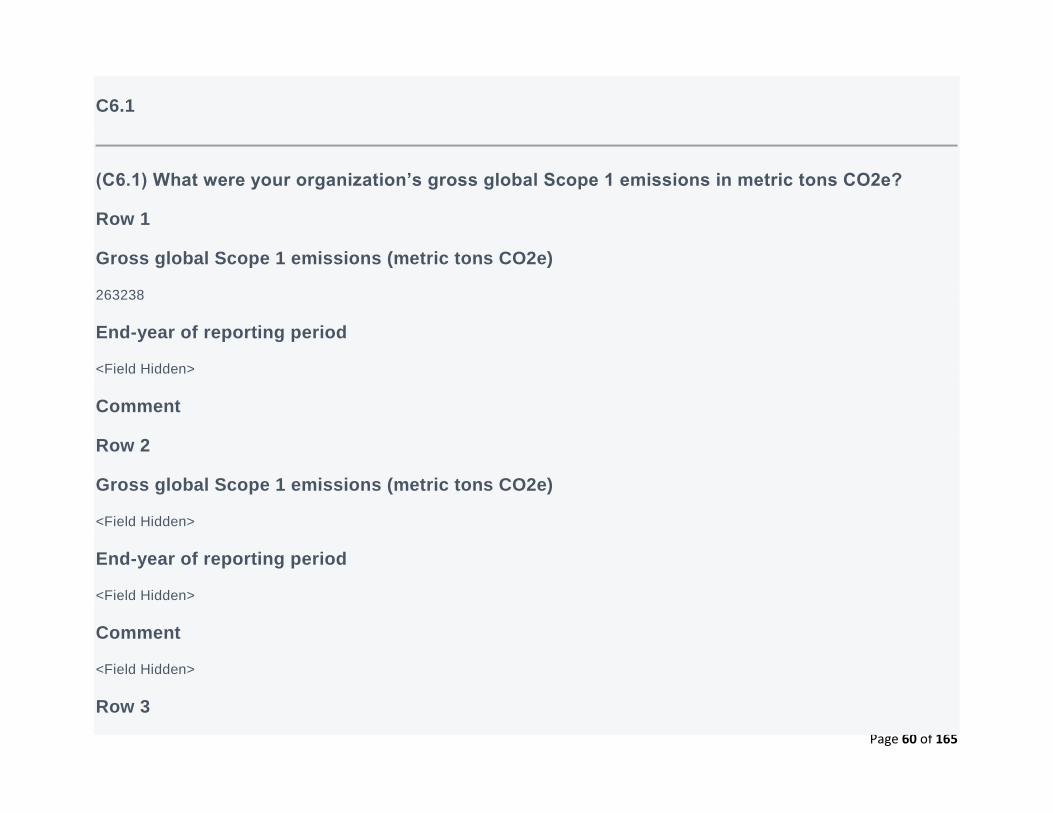
C6.1
(C6.1) What were your organization’s gross global Scope 1 emissions in metric tons CO2e?
Row 1
Gross global Scope 1 emissions (metric tons CO2e)
263238
End-year of reporting period
<Field Hidden>
Comment
Row 2
Gross global Scope 1 emissions (metric tons CO2e)
<Field Hidden>
End-year of reporting period
<Field Hidden>
Comment
<Field Hidden>
Row 3
Page 61 of 165
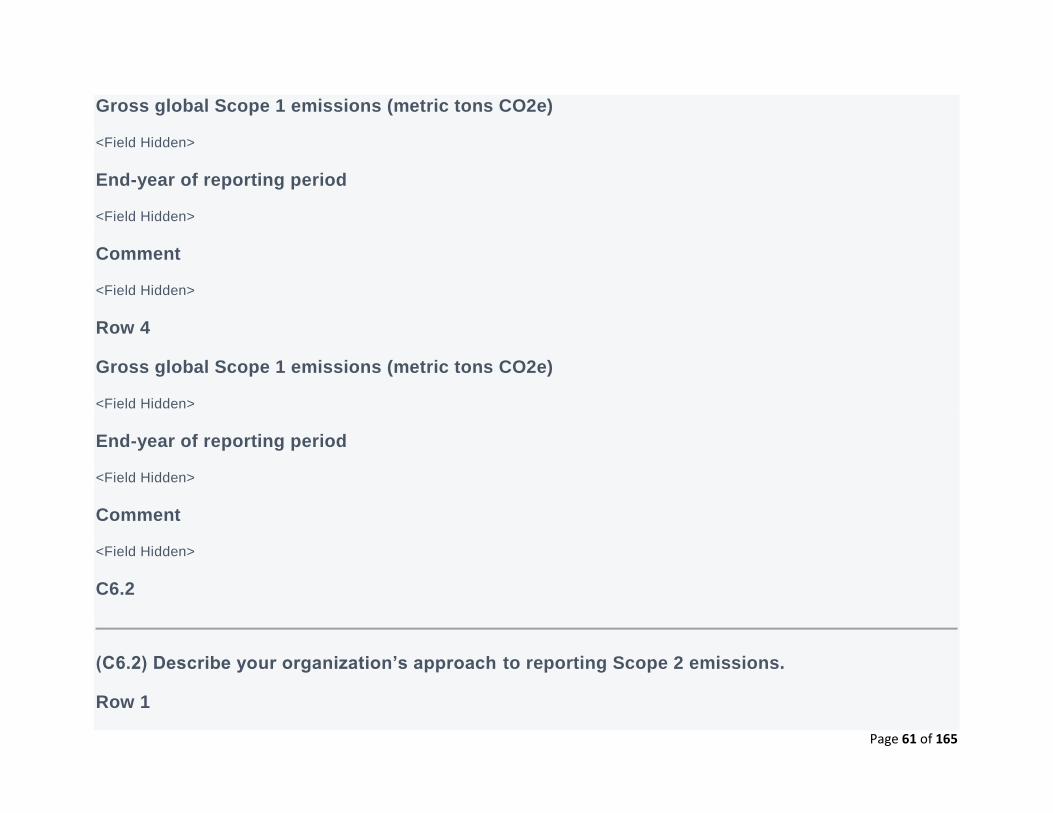
Gross global Scope 1 emissions (metric tons CO2e)
<Field Hidden>
End-year of reporting period
<Field Hidden>
Comment
<Field Hidden>
Row 4
Gross global Scope 1 emissions (metric tons CO2e)
<Field Hidden>
End-year of reporting period
<Field Hidden>
Comment
<Field Hidden>
C6.2
(C6.2) Describe your organization’s approach to reporting Scope 2 emissions.
Row 1
Page 62 of 165
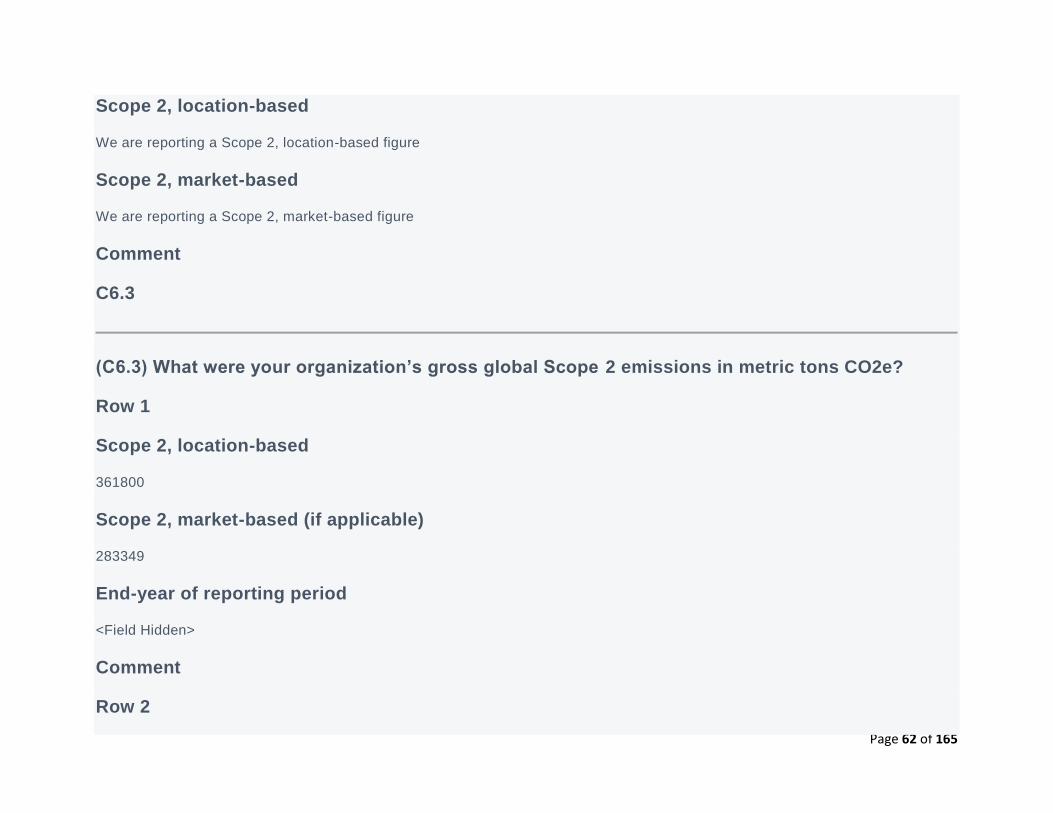
Scope 2, location-based
We are reporting a Scope 2, location-based figure
Scope 2, market-based
We are reporting a Scope 2, market-based figure
Comment
C6.3
(C6.3) What were your organization’s gross global Scope 2 emissions in metric tons CO2e?
Row 1
Scope 2, location-based
361800
Scope 2, market-based (if applicable)
283349
End-year of reporting period
<Field Hidden>
Comment
Row 2
Page 63 of 165
Scope 2, location-based
<Field Hidden>
Scope 2, market-based (if applicable)
<Field Hidden>
End-year of reporting period
<Field Hidden>
Comment
<Field Hidden>
Row 3
Scope 2, location-based
<Field Hidden>
Scope 2, market-based (if applicable)
<Field Hidden>
End-year of reporting period
<Field Hidden>
Comment
<Field Hidden>
Page 64 of 165
Row 4
Scope 2, location-based
<Field Hidden>
Scope 2, market-based (if applicable)
<Field Hidden>
End-year of reporting period
<Field Hidden>
Comment
<Field Hidden>
C6.4
(C6.4) Are there any sources (e.g. facilities, specific GHGs, activities, geographies, etc.) of Scope 1 and Scope 2 emissions that are within your selected reporting boundary which are not included in your disclosure?
No
C6.5
Page 65 of 165
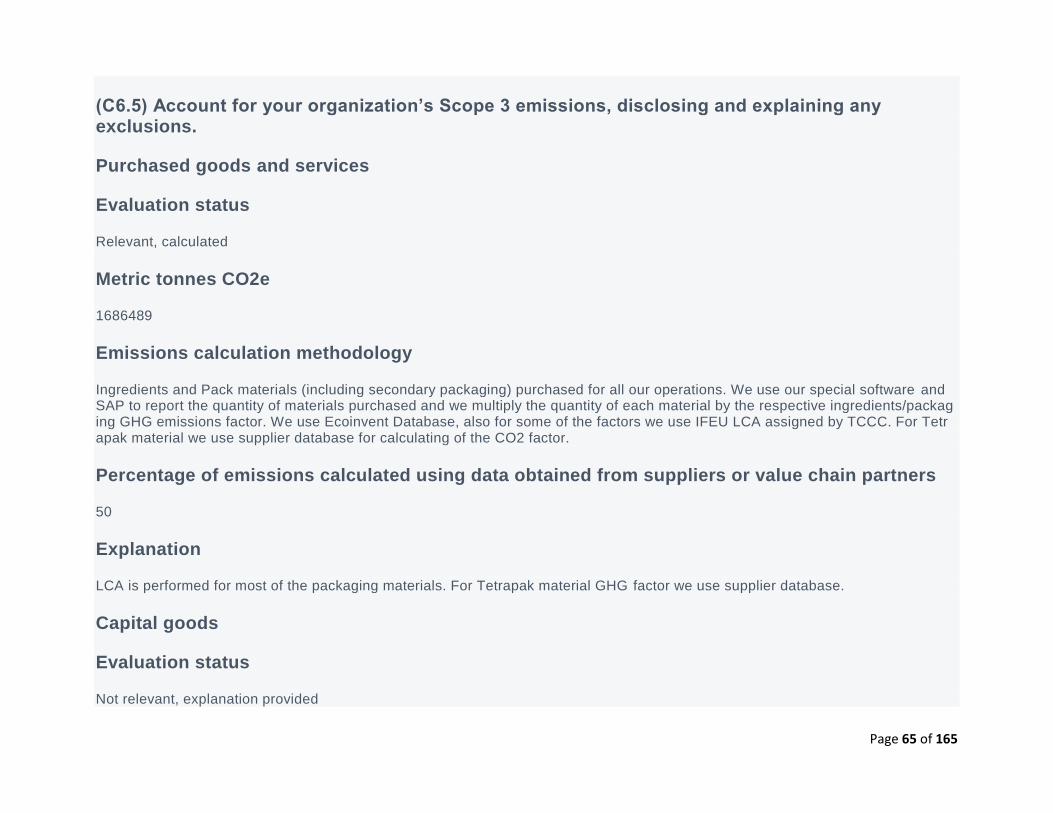
(C6.5) Account for your organization’s Scope 3 emissions, disclosing and explaining any exclusions.
Purchased goods and services
Evaluation status
Relevant, calculated
Metric tonnes CO2e
1686489
Emissions calculation methodology
Ingredients and Pack materials (including secondary packaging) purchased for all our operations. We use our special software and SAP to report the quantity of materials purchased and we multiply the quantity of each material by the respective ingredients/packaging GHG emissions factor. We use Ecoinvent Database, also for some of the factors we use IFEU LCA assigned by TCCC. For Tetrapak material we use supplier database for calculating of the CO2 factor.
Percentage of emissions calculated using data obtained from suppliers or value chain partners
50
Explanation
LCA is performed for most of the packaging materials. For Tetrapak material GHG factor we use supplier database.
Capital goods
Evaluation status
Not relevant, explanation provided
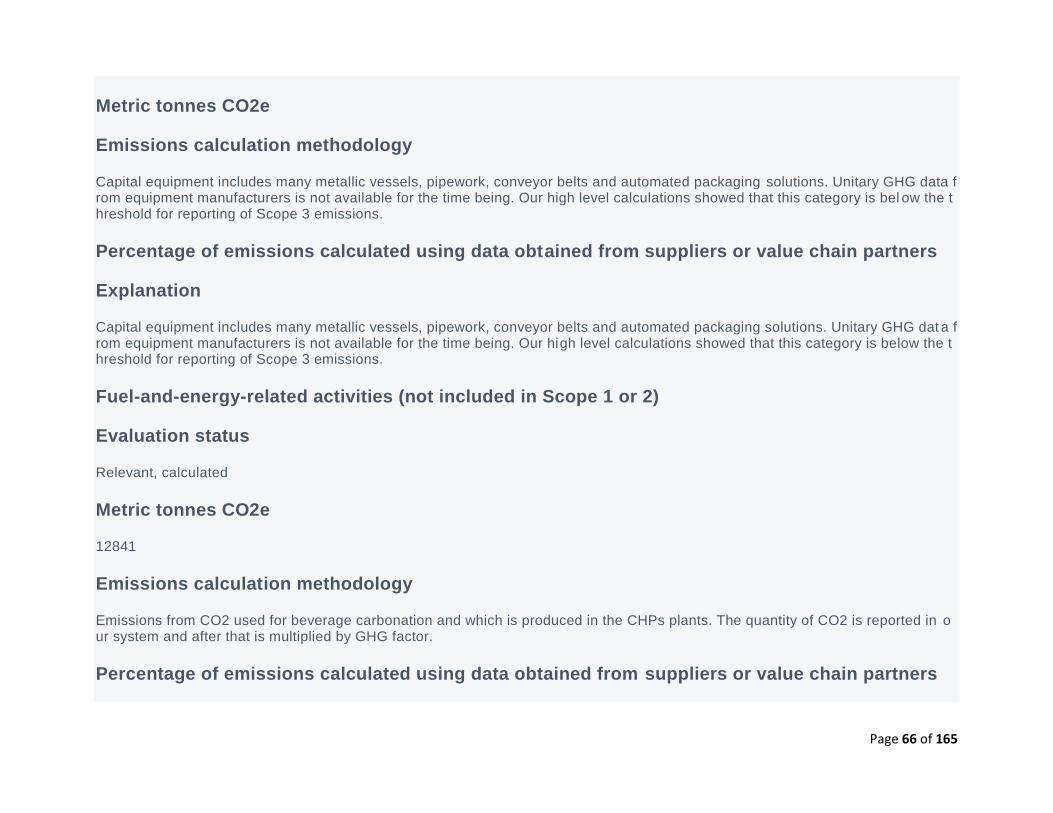
Page 66 of 165
Metric tonnes CO2e
Emissions calculation methodology
Capital equipment includes many metallic vessels, pipework, conveyor belts and automated packaging solutions. Unitary GHG data from equipment manufacturers is not available for the time being. Our high level calculations showed that this category is bel ow the threshold for reporting of Scope 3 emissions.
Percentage of emissions calculated using data obtained from suppliers or value chain partners
Explanation
Capital equipment includes many metallic vessels, pipework, conveyor belts and automated packaging solutions. Unitary GHG dat a from equipment manufacturers is not available for the time being. Our high level calculations showed that this category is below the threshold for reporting of Scope 3 emissions.
Fuel-and-energy-related activities (not included in Scope 1 or 2)
Evaluation status
Relevant, calculated
Metric tonnes CO2e
12841
Emissions calculation methodology
Emissions from CO2 used for beverage carbonation and which is produced in the CHPs plants. The quantity of CO2 is reported in our system and after that is multiplied by GHG factor.
Percentage of emissions calculated using data obtained from suppliers or value chain partners
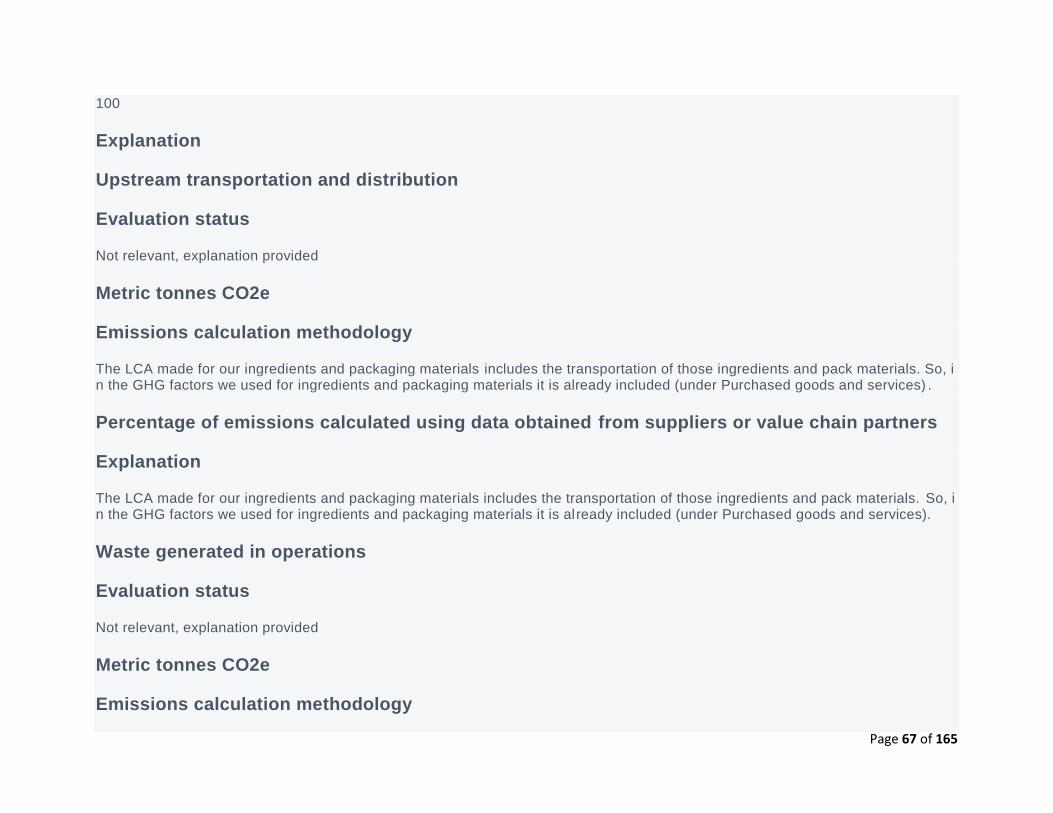
Page 67 of 165
100
Explanation
Upstream transportation and distribution
Evaluation status
Not relevant, explanation provided
Metric tonnes CO2e
Emissions calculation methodology
The LCA made for our ingredients and packaging materials includes the transportation of those ingredients and pack materials. So, in the GHG factors we used for ingredients and packaging materials it is already included (under Purchased goods and services) .
Percentage of emissions calculated using data obtained from suppliers or value chain partners
Explanation
The LCA made for our ingredients and packaging materials includes the transportation of those ingredients and pack materials. So, in the GHG factors we used for ingredients and packaging materials it is al ready included (under Purchased goods and services).
Waste generated in operations
Evaluation status
Not relevant, explanation provided
Metric tonnes CO2e
Emissions calculation methodology
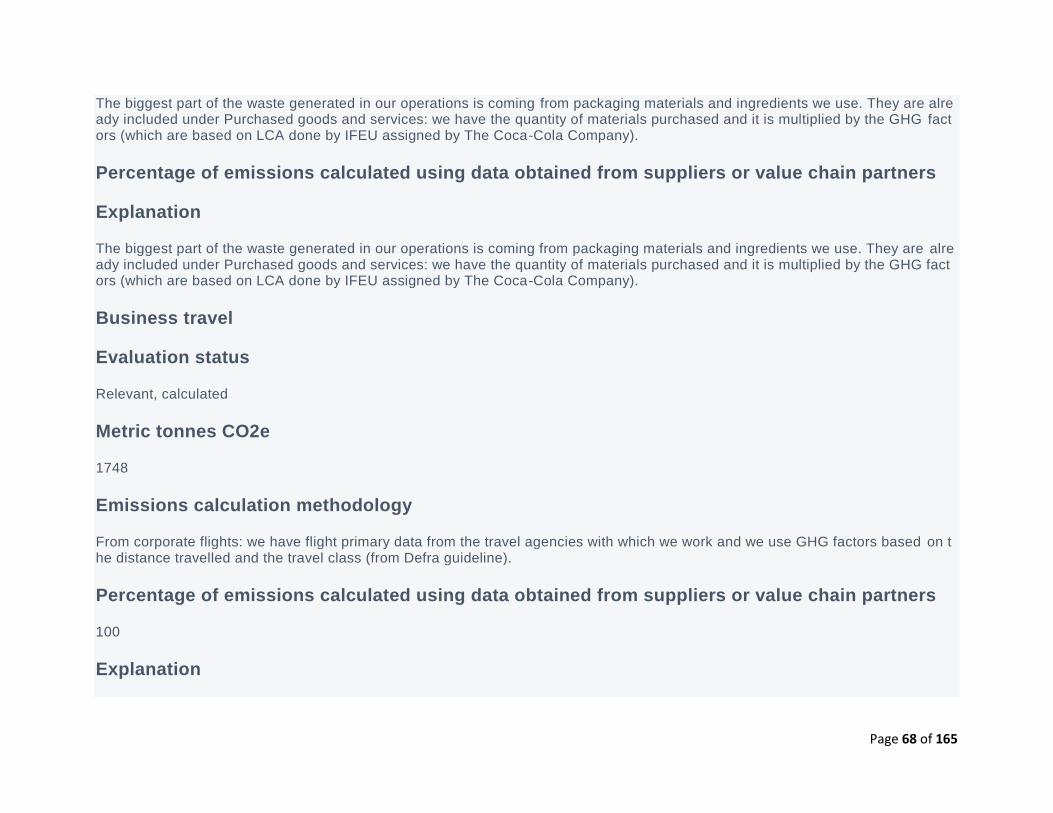
Page 68 of 165
The biggest part of the waste generated in our operations is coming from packaging materials and ingredients we use. They are already included under Purchased goods and services: we have the quantity of materials purchased and it is multiplied by the GHG factors (which are based on LCA done by IFEU assigned by The Coca-Cola Company).
Percentage of emissions calculated using data obtained from suppliers or value chain partners
Explanation
The biggest part of the waste generated in our operations is coming from packaging materials and ingredients we use. They are already included under Purchased goods and services: we have the quantity of materials purchased and it is multiplied by the GHG factors (which are based on LCA done by IFEU assigned by The Coca-Cola Company).
Business travel
Evaluation status
Relevant, calculated
Metric tonnes CO2e
1748
Emissions calculation methodology
From corporate flights: we have flight primary data from the travel agencies with which we work and we use GHG factors based on the distance travelled and the travel class (from Defra guideline).
Percentage of emissions calculated using data obtained from suppliers or value chain partners
100
Explanation
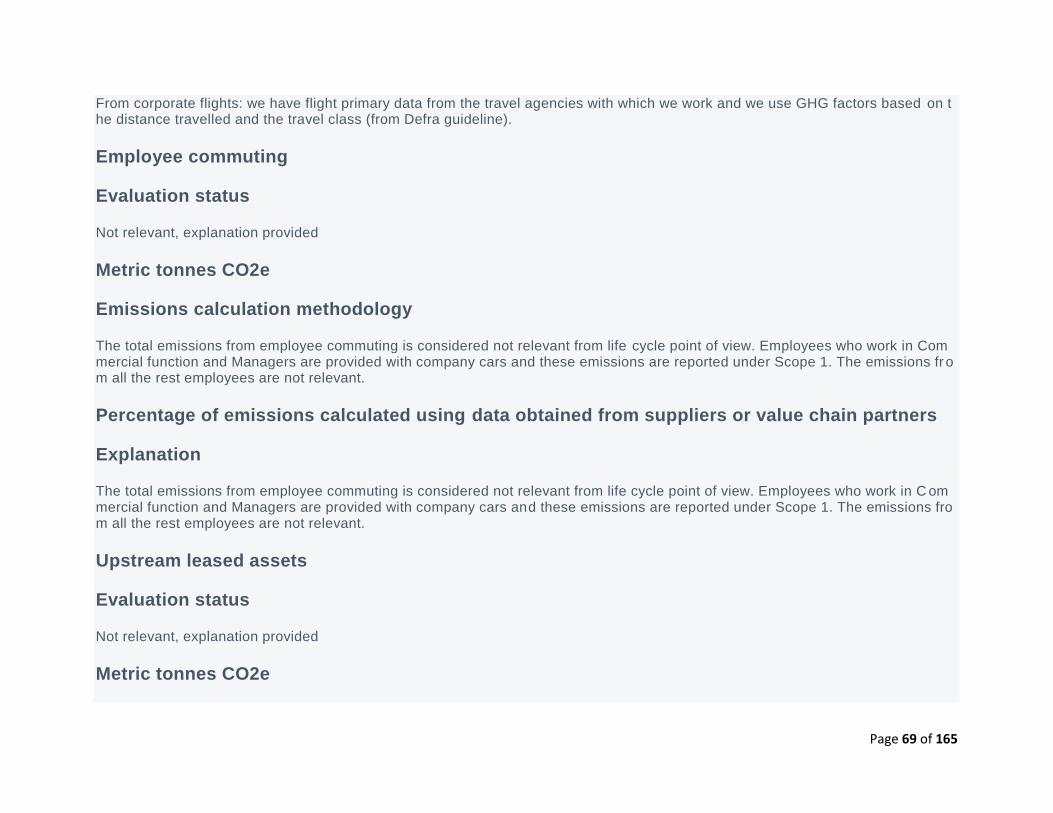
Page 69 of 165
From corporate flights: we have flight primary data from the travel agencies with which we work and we use GHG factors based on the distance travelled and the travel class (from Defra guideline).
Employee commuting
Evaluation status
Not relevant, explanation provided
Metric tonnes CO2e
Emissions calculation methodology
The total emissions from employee commuting is considered not relevant from life cycle point of view. Employees who work in Commercial function and Managers are provided with company cars and these emissions are reported under Scope 1. The emissions fr om all the rest employees are not relevant.
Percentage of emissions calculated using data obtained from suppliers or value chain partners
Explanation
The total emissions from employee commuting is considered not relevant from life cycle point of view. Employees who work in C ommercial function and Managers are provided with company cars and these emissions are reported under Scope 1. The emissions from all the rest employees are not relevant.
Upstream leased assets
Evaluation status
Not relevant, explanation provided
Metric tonnes CO2e
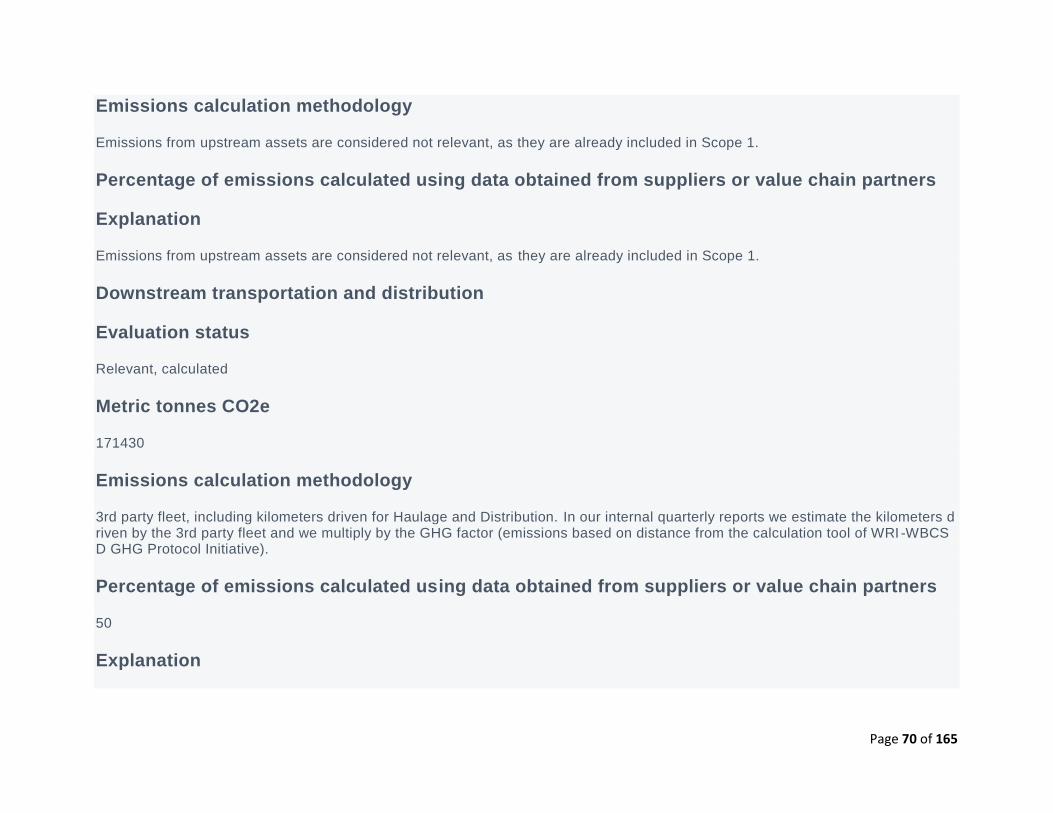
Page 70 of 165
Emissions calculation methodology
Emissions from upstream assets are considered not relevant, as they are already included in Scope 1.
Percentage of emissions calculated using data obtained from suppliers or value chain partners
Explanation
Emissions from upstream assets are considered not relevant, as they are already included in Scope 1.
Downstream transportation and distribution
Evaluation status
Relevant, calculated
Metric tonnes CO2e
171430
Emissions calculation methodology
3rd party fleet, including kilometers driven for Haulage and Distribution. In our internal quarterly reports we estimate the kilometers driven by the 3rd party fleet and we multiply by the GHG factor (emissions based on distance from the calculation tool of WRI -WBCSD GHG Protocol Initiative).
Percentage of emissions calculated using data obtained from suppliers or value chain partners
50
Explanation
Page 71 of 165
3rd party fleet, including kilometers driven for Haulage and Distribution. In our internal quarterly reports we estimate the kilometers driven by the 3rd party fleet and we multiply by the GHG factor (emissions based on distance from the calculation tool of WRI-WBCSD GHG Protocol Initiative).
Processing of sold products
Evaluation status
Not relevant, explanation provided
Metric tonnes CO2e
Emissions calculation methodology
Our products are sold in a finished, ready-to-consume state. No further processing is required.
Percentage of emissions calculated using data obtained from suppliers or value chain partners
Explanation
Our products are sold in a finished, ready-to-consume state. No further processing is required.
Use of sold products
Evaluation status
Relevant, calculated
Metric tonnes CO2e
68156
Emissions calculation methodology
Page 72 of 165
CO2 (carbonation) in our carbonated soft drinks. In our SAP system we report the quantity of CO2 used for the carbonation of our beverages and we multiply by the GHG factor.
Percentage of emissions calculated using data obtained from suppliers or value chain partners
100
Explanation
CO2 (carbonation) in our carbonated soft drinks. In our SAP system we report the quantity of CO2 used for the carbonation of our beverages and we multiply by the GHG factor.
End of life treatment of sold products
Evaluation status
Not relevant, explanation provided
Metric tonnes CO2e
Emissions calculation methodology
Already included in the CO2 factor of pack materials.
Percentage of emissions calculated using data obtained from suppliers or value chain partners
Explanation
Already included in the CO2 factor of pack materials.
Downstream leased assets
Evaluation status
Page 73 of 165
Relevant, calculated
Metric tonnes CO2e
1569224
Emissions calculation methodology
Electricity used by our cold drink equipment (use of leased coolers) which we provide to our customers. We use SAP as databas e for all cold drink equipment. For each country, for each type of cooler, we get the figure on electricity consumption by the coolers suppliers. Then the electricity per cooler type is multiplied by the number of the coolers and the total electricity consumption is multiplied by the country (location-based) grid factor (this factor is taken from IEA database).
Percentage of emissions calculated using data obtained from suppliers or value chain partners
100
Explanation
Electricity used by our cold drink equipment (use of leased coolers) which we provide to our customers. We use SAP as database for all cold drink equipment. For each country, for each type of cooler, we get the figure on electricity consumption by the co olers suppliers. Then the electricity per cooler type is multiplied by the number of the coolers and the total electricity consumption is multiplied by the country (location-based) grid factor (this factor is taken from IEA database).
Franchises
Evaluation status
Not relevant, explanation provided
Metric tonnes CO2e
Emissions calculation methodology
Page 74 of 165
We don't operate any franchises.
Percentage of emissions calculated using data obtained from suppliers or value chain partners
Explanation
We don't operate any franchises.
Investments
Evaluation status
Not relevant, explanation provided
Metric tonnes CO2e
Emissions calculation methodology
Coca-Cola Hellenic does not engage in project finance or other investment activities in specific GHG generating assets.
Percentage of emissions calculated using data obtained from suppliers or value chain partners
Explanation
Coca-Cola Hellenic does not engage in project finance or other investment activities in specific GHG generating assets.
Other (upstream)
Evaluation status
Metric tonnes CO2e
Page 75 of 165
Emissions calculation methodology
Percentage of emissions calculated using data obtained from suppliers or value chain partners
Explanation
Other (downstream)
Evaluation status
Metric tonnes CO2e
Emissions calculation methodology
Percentage of emissions calculated using data obtained from suppliers or value chain partners
Explanation
C-AC6.6/C-FB6.6/C-PF6.6
(C-AC6.6/C-FB6.6/C-PF6.6) Can you breakdown your Scope 3 emissions by relevant business activity areas?
Yes
C-AC6.6a/C-FB6.6a/C-PF6.6a
Page 76 of 165
(C-AC6.6a/C-FB6.6a/C-PF6.6a) Disclose your Scope 3 emissions for each of your relevant business activity areas.
Activity
Agriculture/Forestry
Scope 3 category
Purchased goods and services
Emissions (metric tons CO2e)
417867
Please explain
These are emissions from sugar cane, sugar beet and corn syrup we use. We report the quantity used and multiply by the emissions factor, which is based on LCA.
C-AC6.8/C-FB6.8/C-PF6.8
(C-AC6.8/C-FB6.8/C-PF6.8) Is biogenic carbon pertaining to your direct operations relevant to your current CDP climate change disclosure?
No
C-AC6.9/C-FB6.9/C-PF6.9
Page 77 of 165
(C-AC6.9/C-FB6.9/C-PF6.9) Do you collect or calculate greenhouse gas emissions for each commodity reported as significant to your business in C-AC0.7/FB0.7/PF0.7?
Agricultural commodities
Sugar
Do you collect or calculate GHG emissions for this commodity?
Yes
Please explain
All sugar which we use is reported based on the origin of its production: from sugar cane or sugar beet. Co2 factors used are from LCA.
C-AC6.9a/C-FB6.9a/C-PF6.9a
(C-AC6.9a/C-FB6.9a/C-PF6.9a) Report your greenhouse gas emissions figure(s) for your disclosing commodity(ies), explain your methodology, and include any exclusions.
Sugar
Reporting emissions by
Total
Emissions (metric tons CO2e)
417867
Page 78 of 165
Denominator: unit of production
<Field Hidden>
Change from last reporting year
Lower
Please explain
4% lower in absolute value due to lower quantity we have used in 2017 vs. 2016. Emissions factor for 2016 and 2017 are the sa me.
C6.10
(C6.10) Describe your gross global combined Scope 1 and 2 emissions for the reporting year in metric tons CO2e per unit currency total revenue and provide any additional intensity metrics that are appropriate to your business operations.
Intensity figure
0.00008393
Metric numerator (Gross global combined Scope 1 and 2 emissions)
625038
Metric denominator
unit total revenue
Metric denominator: Unit total
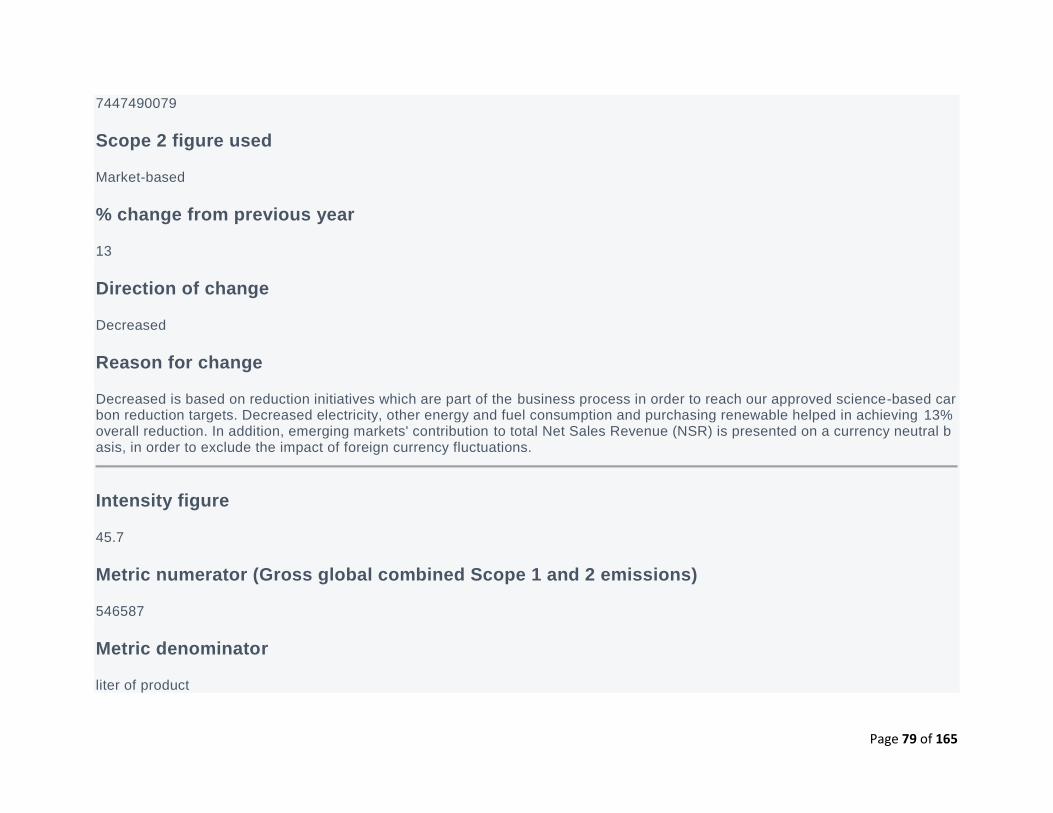
Page 79 of 165
7447490079
Scope 2 figure used
Market-based
% change from previous year
13
Direction of change
Decreased
Reason for change
Decreased is based on reduction initiatives which are part of the business process in order to reach our approved science-based carbon reduction targets. Decreased electricity, other energy and fuel consumption and purchasing renewable helped in achieving 13% overall reduction. In addition, emerging markets' contribution to total Net Sales Revenue (NSR) is presented on a currency neutral basis, in order to exclude the impact of foreign currency fluctuations.
Intensity figure
45.7
Metric numerator (Gross global combined Scope 1 and 2 emissions)
546587
Metric denominator
liter of product
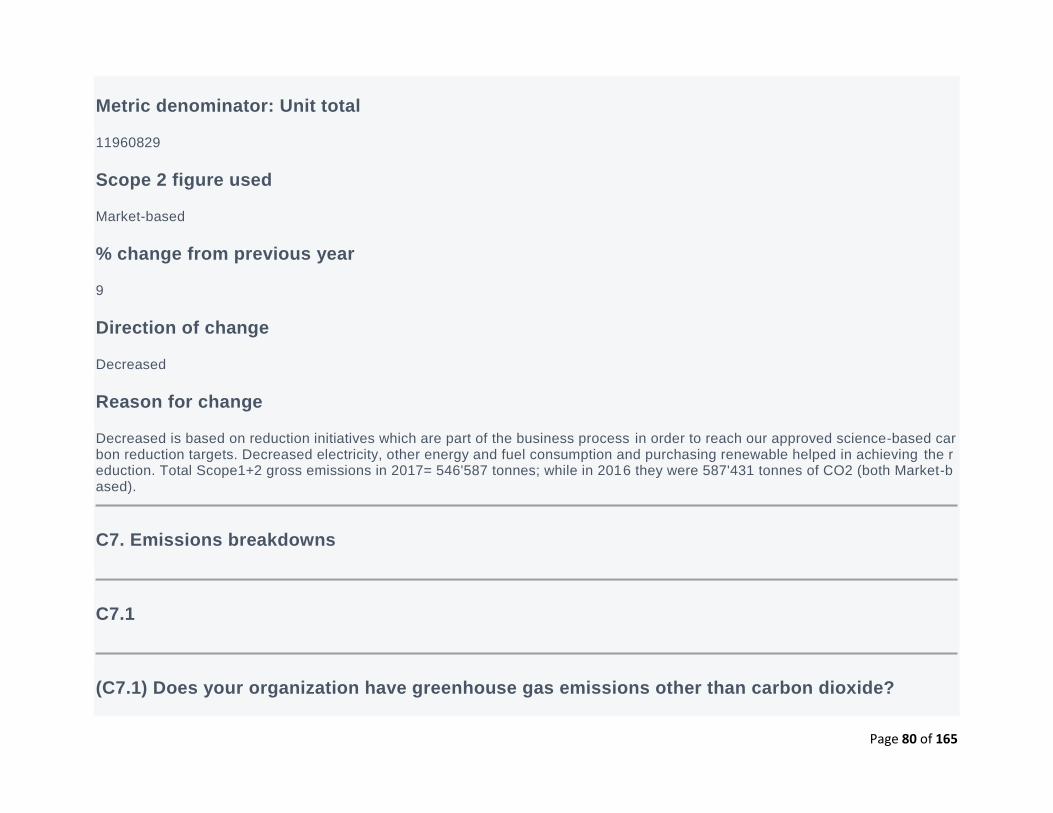
Page 80 of 165
Metric denominator: Unit total
11960829
Scope 2 figure used
Market-based
% change from previous year
9
Direction of change
Decreased
Reason for change
Decreased is based on reduction initiatives which are part of the business process in order to reach our approved science-based carbon reduction targets. Decreased electricity, other energy and fuel consumption and purchasing renewable helped in achieving the reduction. Total Scope1+2 gross emissions in 2017= 546'587 tonnes; while in 2016 they were 587'431 tonnes of CO2 (both Market-based).
C7. Emissions breakdowns
C7.1
(C7.1) Does your organization have greenhouse gas emissions other than carbon dioxide?
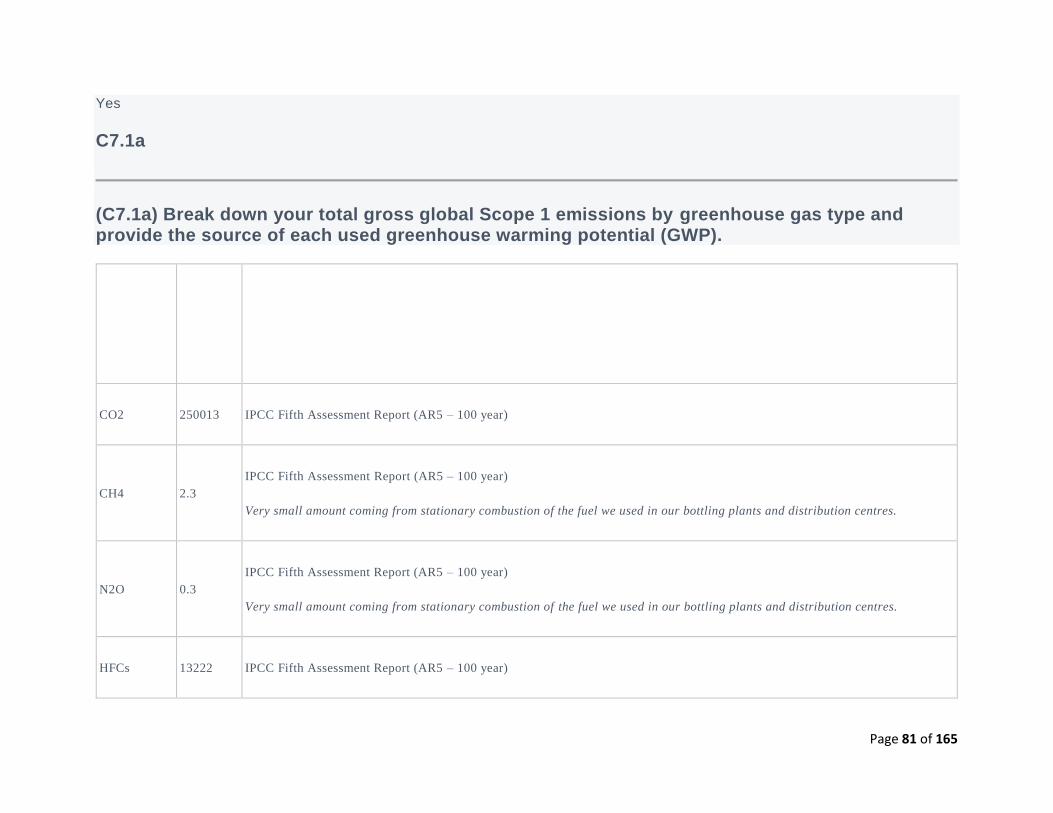
Page 81 of 165
Yes
C7.1a
(C7.1a) Break down your total gross global Scope 1 emissions by greenhouse gas type and provide the source of each used greenhouse warming potential (GWP).
Greenhouse
gas
Scope 1
emissions
(metric
tons of
CO2e)
GWP Reference
CO2 250013 IPCC Fifth Assessment Report (AR5 – 100 year)
CH4 2.3
IPCC Fifth Assessment Report (AR5 – 100 year)
Very small amount coming from stationary combustion of the fuel we used in our bottling plants and distribution centres.
N2O 0.3
IPCC Fifth Assessment Report (AR5 – 100 year)
Very small amount coming from stationary combustion of the fuel we used in our bottling plants and distribution centres.
HFCs 13222 IPCC Fifth Assessment Report (AR5 – 100 year)
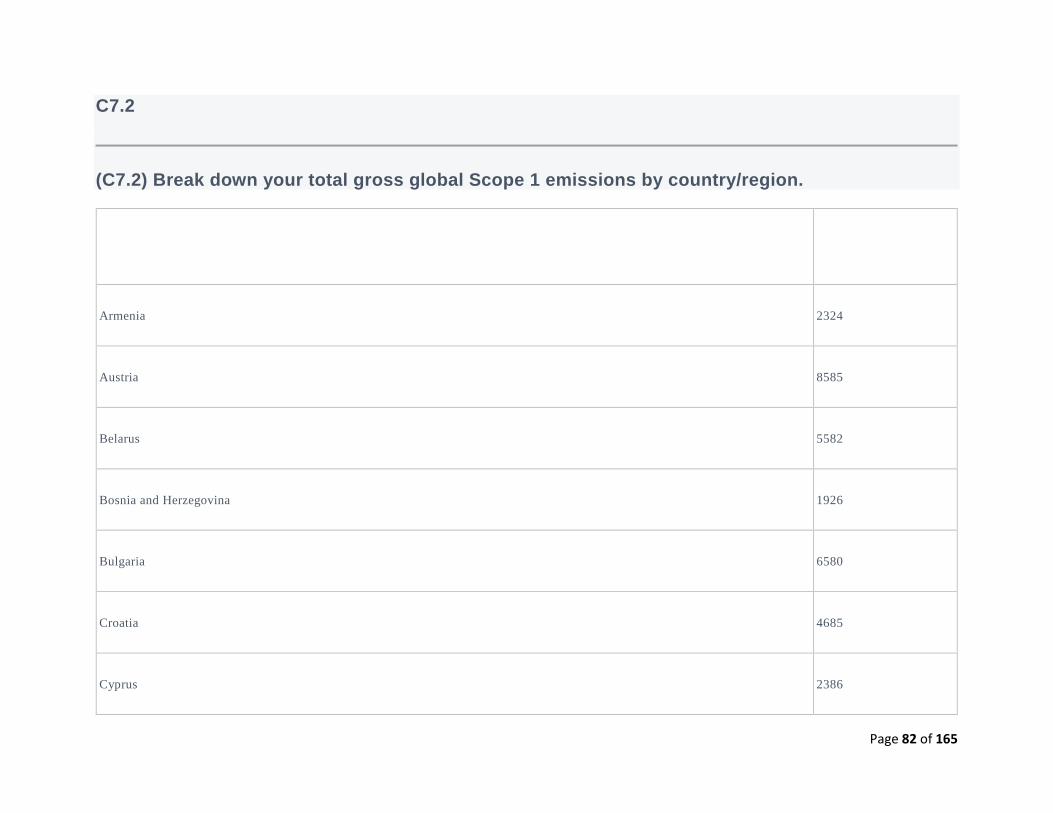
Page 82 of 165
C7.2
(C7.2) Break down your total gross global Scope 1 emissions by country/region.
Country/Region Scope 1 emissions
(metric tons CO2e)
Armenia 2324
Austria 8585
Belarus 5582
Bosnia and Herzegovina 1926
Bulgaria 6580
Croatia 4685
Cyprus 2386
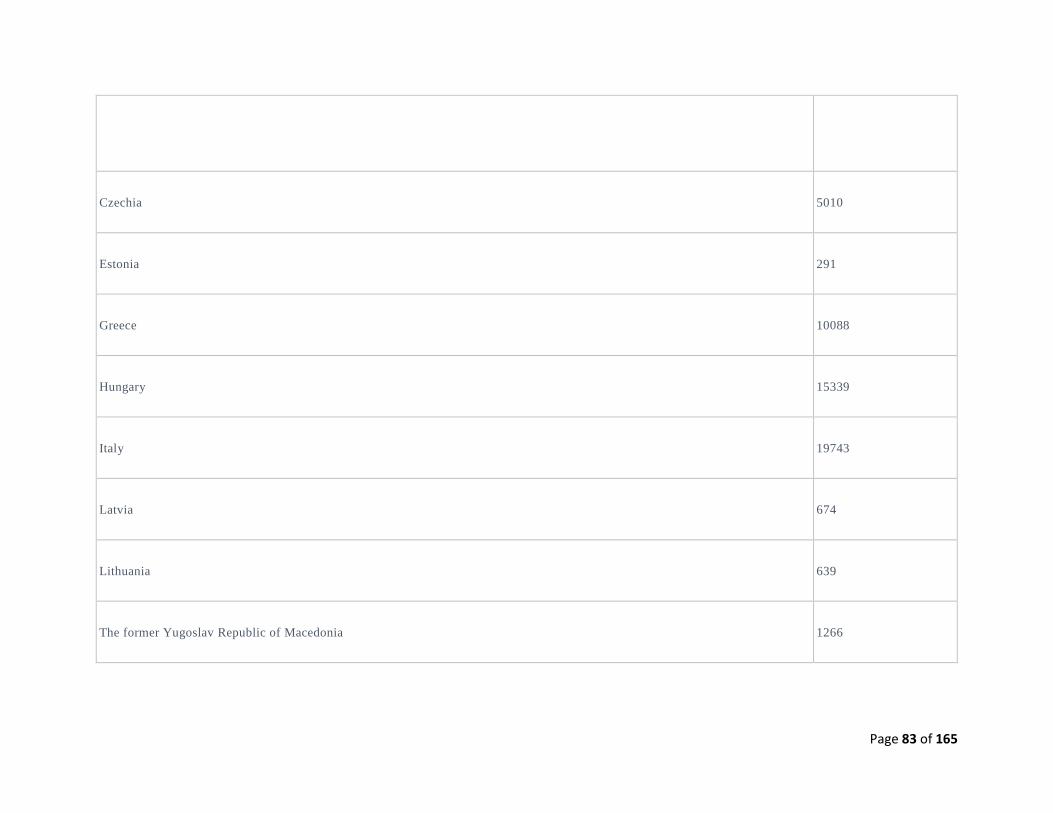
Page 83 of 165
Country/Region Scope 1 emissions
(metric tons CO2e)
Czechia 5010
Estonia 291
Greece 10088
Hungary 15339
Italy 19743
Latvia 674
Lithuania 639
The former Yugoslav Republic of Macedonia 1266
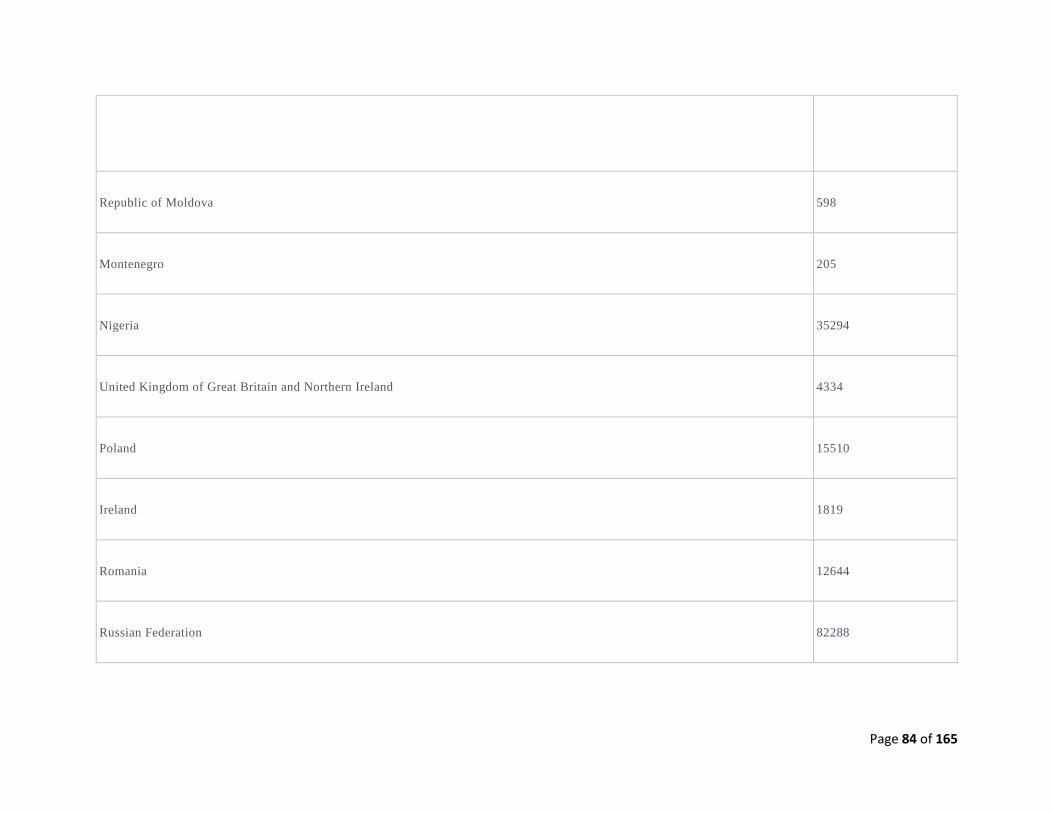
Page 84 of 165
Country/Region Scope 1 emissions
(metric tons CO2e)
Republic of Moldova 598
Montenegro 205
Nigeria 35294
United Kingdom of Great Britain and Northern Ireland 4334
Poland 15510
Ireland 1819
Romania 12644
Russian Federation 82288
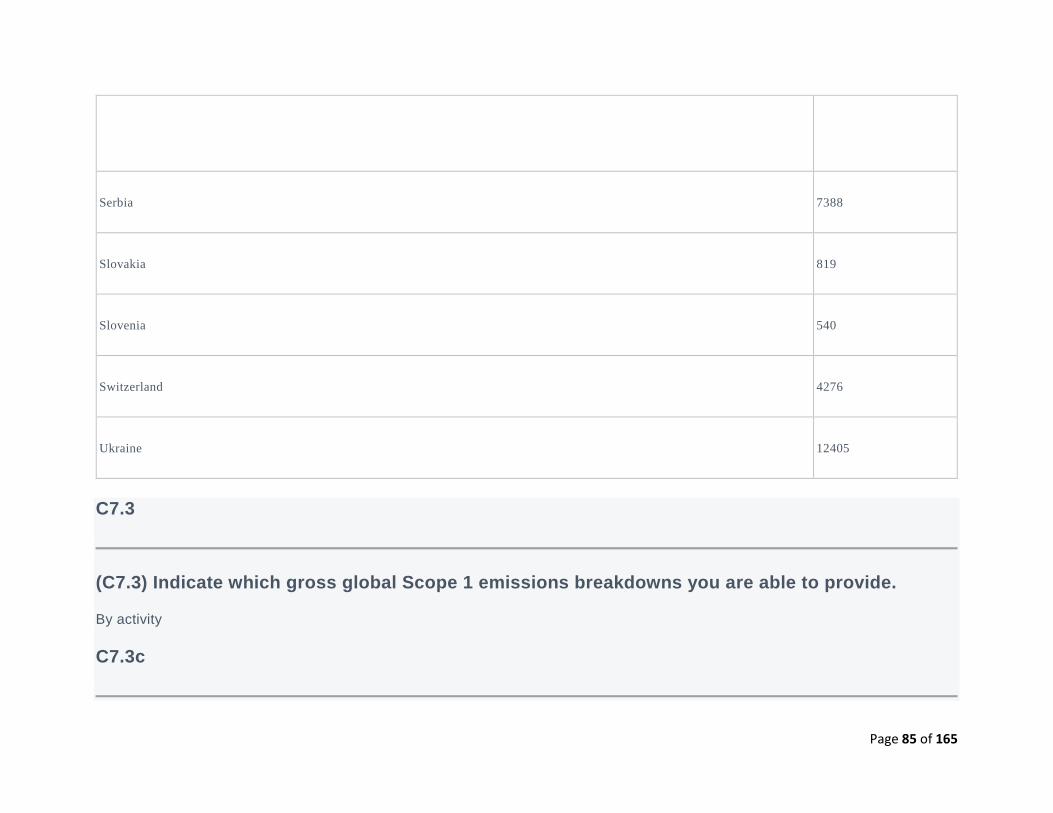
Page 85 of 165
Country/Region Scope 1 emissions
(metric tons CO2e)
Serbia 7388
Slovakia 819
Slovenia 540
Switzerland 4276
Ukraine 12405
C7.3
(C7.3) Indicate which gross global Scope 1 emissions breakdowns you are able to provide.
By activity
C7.3c
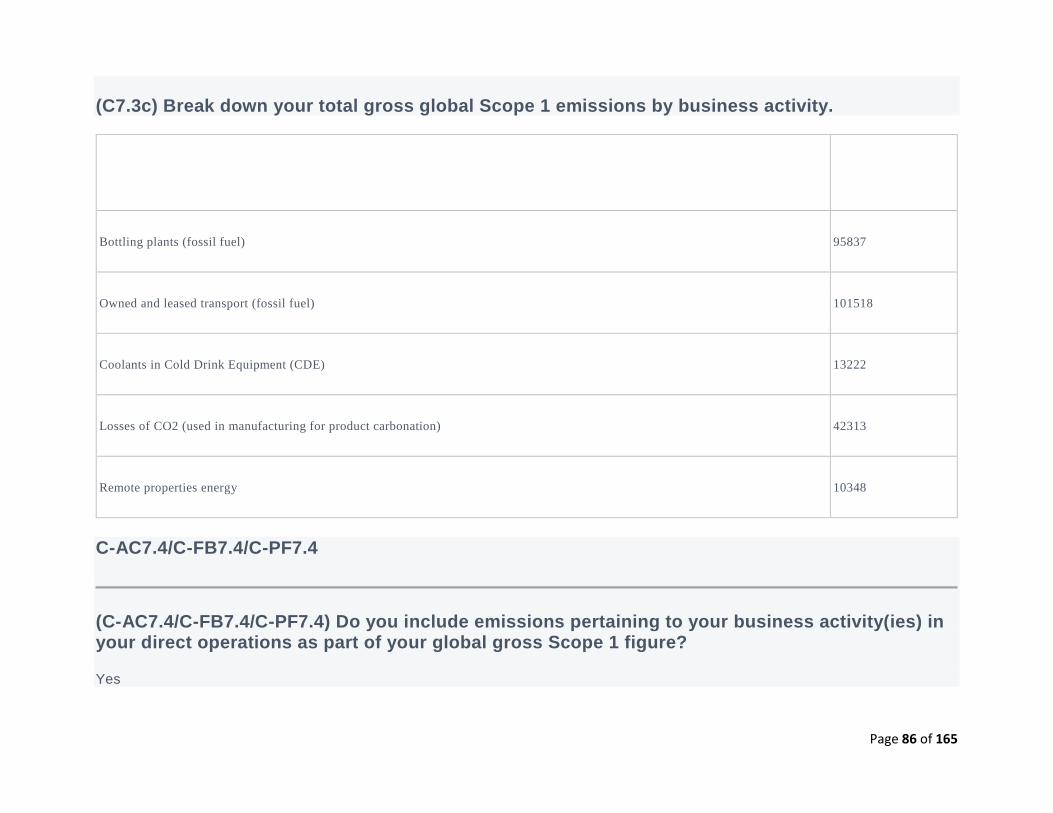
Page 86 of 165
(C7.3c) Break down your total gross global Scope 1 emissions by business activity.
Activity Scope 1 emissions
(metric tons CO2e)
Bottling plants (fossil fuel) 95837
Owned and leased transport (fossil fuel) 101518
Coolants in Cold Drink Equipment (CDE) 13222
Losses of CO2 (used in manufacturing for product carbonation) 42313
Remote properties energy 10348
C-AC7.4/C-FB7.4/C-PF7.4
(C-AC7.4/C-FB7.4/C-PF7.4) Do you include emissions pertaining to your business activity(ies) in your direct operations as part of your global gross Scope 1 figure?
Yes
Page 87 of 165
C-AC7.4b/C-FB7.4b/C-PF7.4b
(C-AC7.4b/C-FB7.4b/C-PF7.4b) Report the Scope 1 emissions pertaining to your business activity(ies) and explain any exclusions. If applicable, disaggregate your agricultural/forestry by GHG emissions category.
Activity
Distribution
Emissions category
<Field Hidden>
Emissions (metric tons CO2e)
101518
Methodology
Default emissions factor
Please explain
The factors are coming from Mobile Combustion GHG Emissions Calculation Tool, Version 2.6, published on the web site of GHG P rotocol. Each of the fuel types we use in our own/leased transport is multiplied by the respective factor.
C7.5
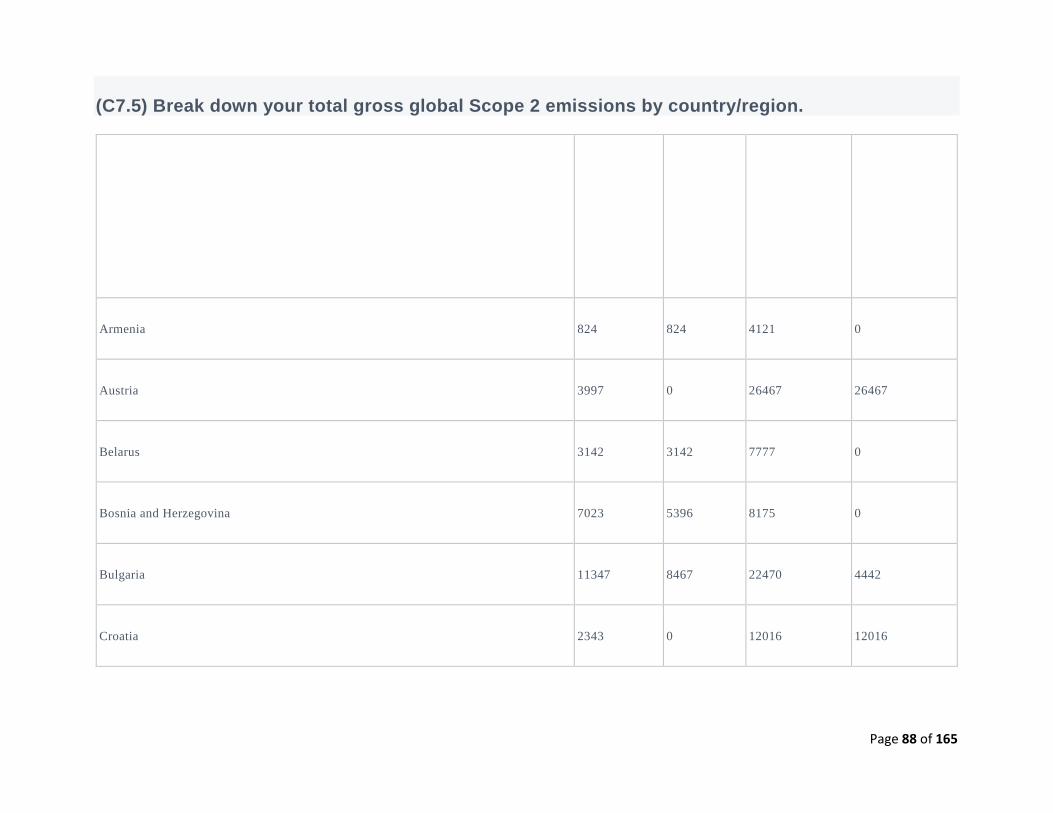
Page 88 of 165
(C7.5) Break down your total gross global Scope 2 emissions by country/region.
Country/Region
Scope 2,
location-based
(metric tons
CO2e)
Scope 2,
market-
based
(metric tons
CO2e)
Purchased and
consumed
electricity, heat,
steam or cooling
(MWh)
Purchased and
consumed low-
carbon
electricity, heat,
steam or cooling
accounted in
market-based
approach (MWh)
Armenia 824 824 4121 0
Austria 3997 0 26467 26467
Belarus 3142 3142 7777 0
Bosnia and Herzegovina 7023 5396 8175 0
Bulgaria 11347 8467 22470 4442
Croatia 2343 0 12016 12016
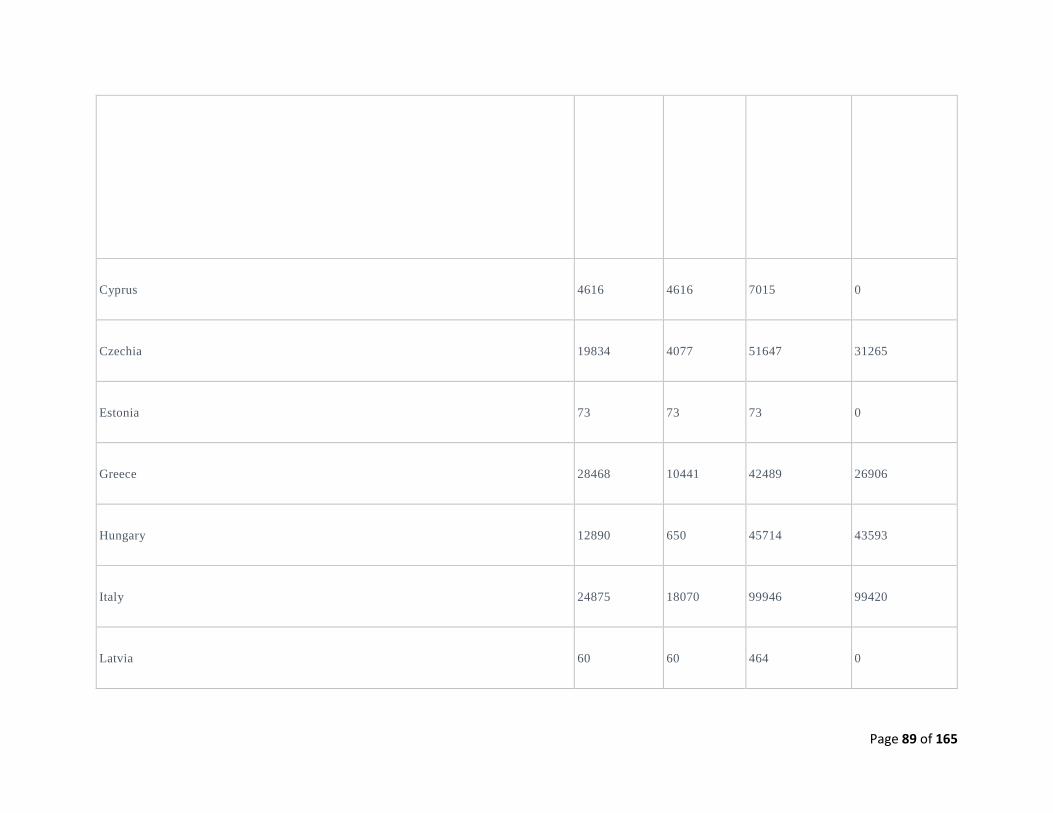
Page 89 of 165
Country/Region
Scope 2,
location-based
(metric tons
CO2e)
Scope 2,
market-
based
(metric tons
CO2e)
Purchased and
consumed
electricity, heat,
steam or cooling
(MWh)
Purchased and
consumed low-
carbon
electricity, heat,
steam or cooling
accounted in
market-based
approach (MWh)
Cyprus 4616 4616 7015 0
Czechia 19834 4077 51647 31265
Estonia 73 73 73 0
Greece 28468 10441 42489 26906
Hungary 12890 650 45714 43593
Italy 24875 18070 99946 99420
Latvia 60 60 464 0
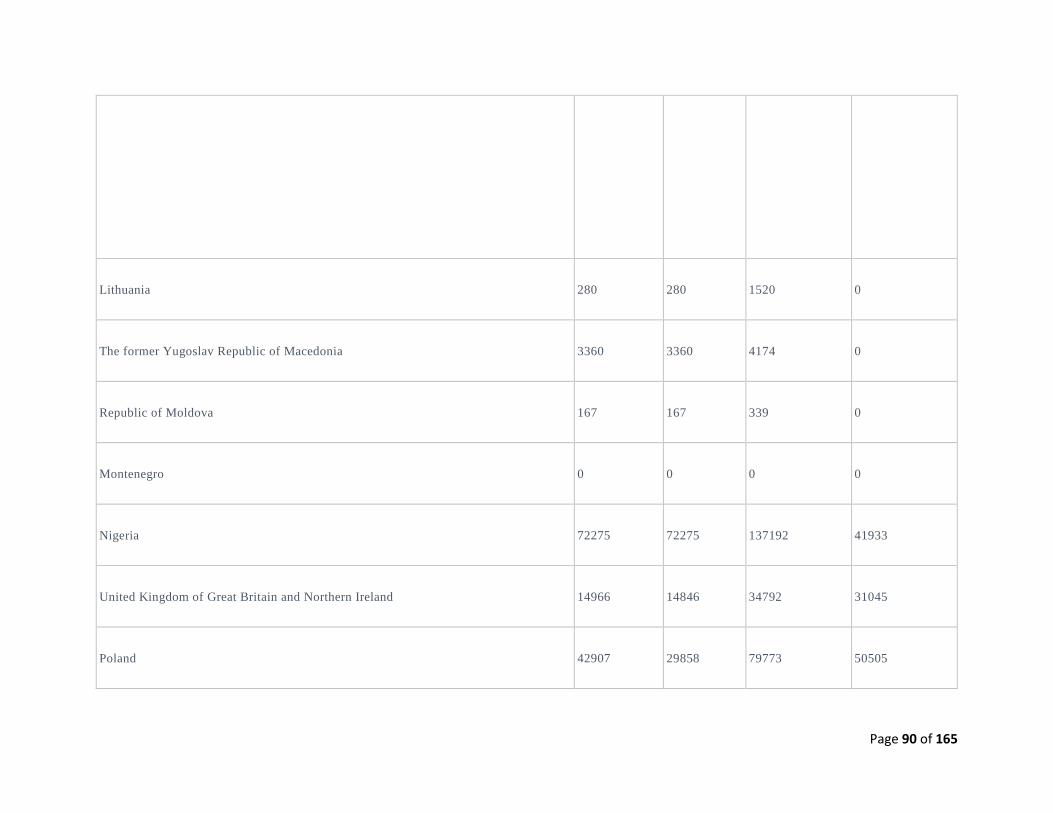
Page 90 of 165
Country/Region
Scope 2,
location-based
(metric tons
CO2e)
Scope 2,
market-
based
(metric tons
CO2e)
Purchased and
consumed
electricity, heat,
steam or cooling
(MWh)
Purchased and
consumed low-
carbon
electricity, heat,
steam or cooling
accounted in
market-based
approach (MWh)
Lithuania 280 280 1520 0
The former Yugoslav Republic of Macedonia 3360 3360 4174 0
Republic of Moldova 167 167 339 0
Montenegro 0 0 0 0
Nigeria 72275 72275 137192 41933
United Kingdom of Great Britain and Northern Ireland 14966 14846 34792 31045
Poland 42907 29858 79773 50505
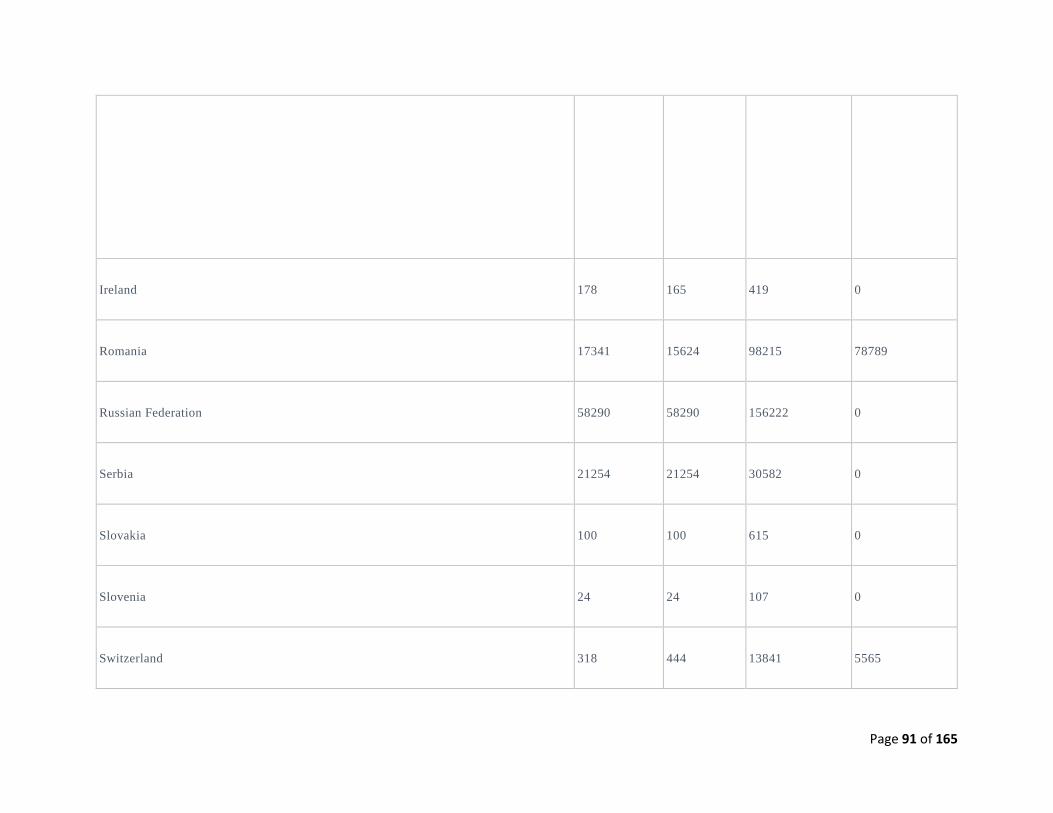
Page 91 of 165
Country/Region
Scope 2,
location-based
(metric tons
CO2e)
Scope 2,
market-
based
(metric tons
CO2e)
Purchased and
consumed
electricity, heat,
steam or cooling
(MWh)
Purchased and
consumed low-
carbon
electricity, heat,
steam or cooling
accounted in
market-based
approach (MWh)
Ireland 178 165 419 0
Romania 17341 15624 98215 78789
Russian Federation 58290 58290 156222 0
Serbia 21254 21254 30582 0
Slovakia 100 100 615 0
Slovenia 24 24 107 0
Switzerland 318 444 13841 5565
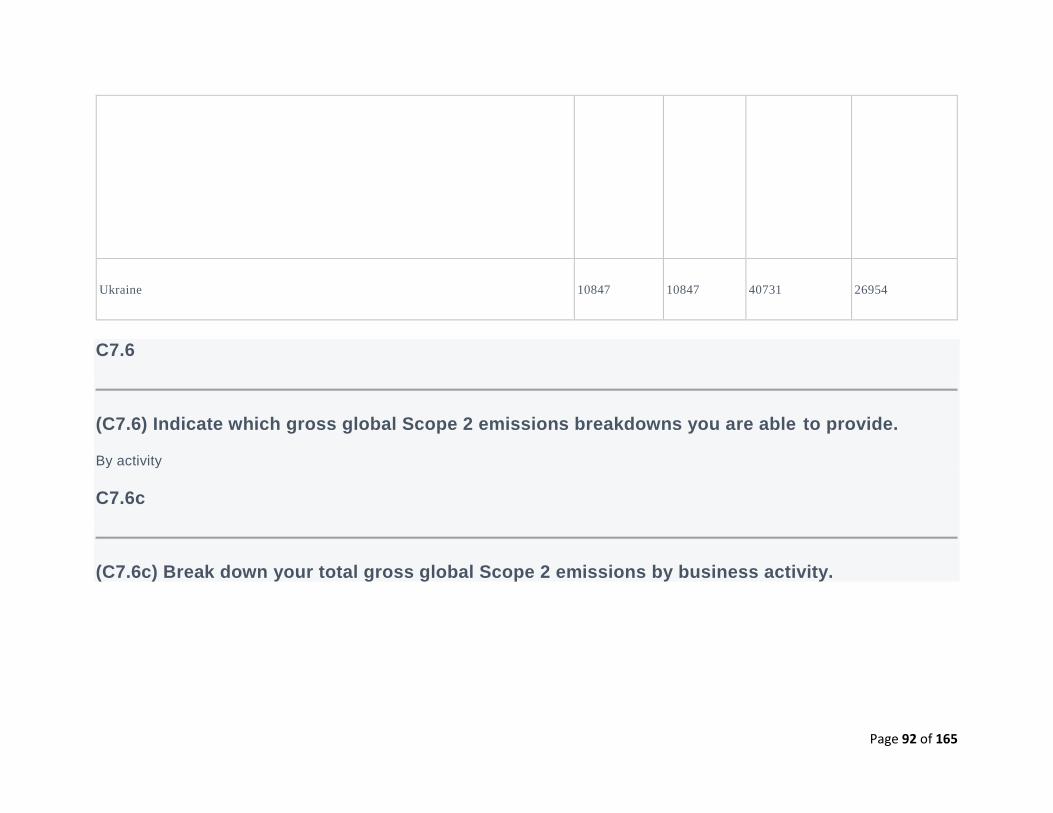
Page 92 of 165
Country/Region
Scope 2,
location-based
(metric tons
CO2e)
Scope 2,
market-
based
(metric tons
CO2e)
Purchased and
consumed
electricity, heat,
steam or cooling
(MWh)
Purchased and
consumed low-
carbon
electricity, heat,
steam or cooling
accounted in
market-based
approach (MWh)
Ukraine 10847 10847 40731 26954
C7.6
(C7.6) Indicate which gross global Scope 2 emissions breakdowns you are able to provide.
By activity
C7.6c
(C7.6c) Break down your total gross global Scope 2 emissions by business activity.
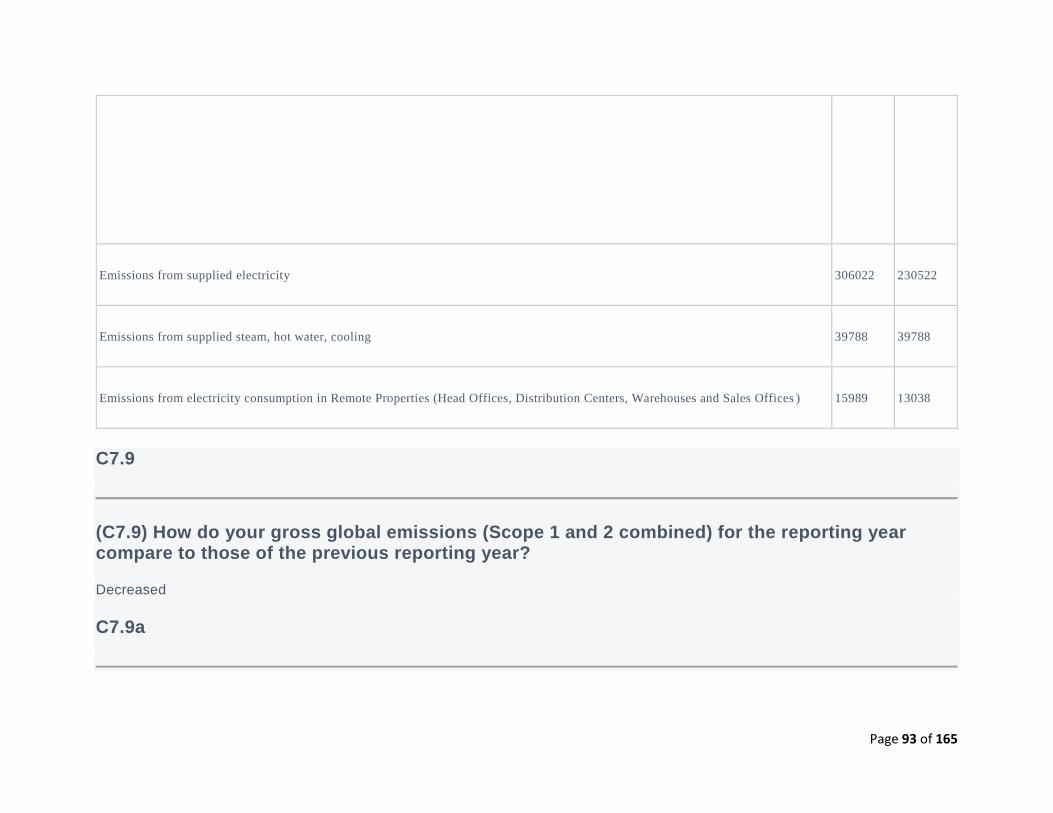
Page 93 of 165
Activity
Scope 2,
location-
based
emissions
(metric
tons
CO2e)
Scope 2,
market-
based
emissions
(metric
tons
CO2e)
Emissions from supplied electricity 306022 230522
Emissions from supplied steam, hot water, cooling 39788 39788
Emissions from electricity consumption in Remote Properties (Head Offices, Distribution Centers, Warehouses and Sales Offices ) 15989 13038
C7.9
(C7.9) How do your gross global emissions (Scope 1 and 2 combined) for the reporting year compare to those of the previous reporting year?
Decreased
C7.9a
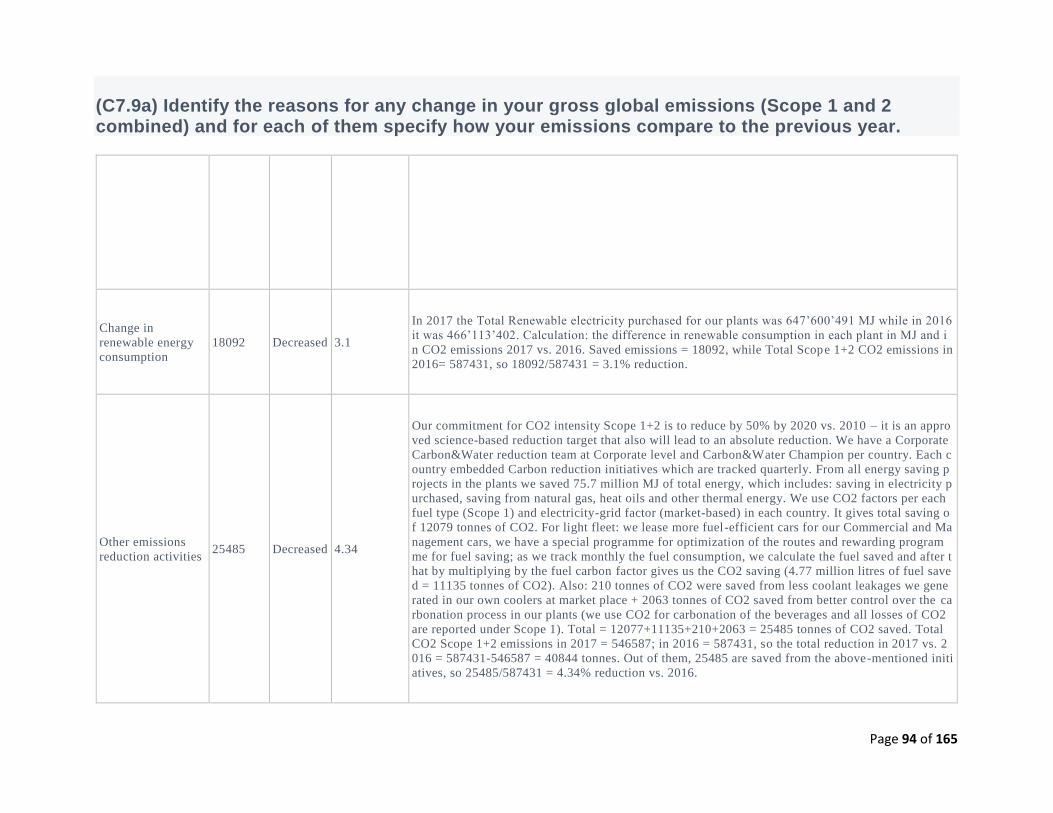
Page 94 of 165
(C7.9a) Identify the reasons for any change in your gross global emissions (Scope 1 and 2 combined) and for each of them specify how your emissions compare to the previous year.
Change
in
emissions
(metric
tons
CO2e)
Direction
of change
Emissions
value
(percentage)
Please explain calculation
Change in
renewable energy
consumption
18092 Decreased 3.1
In 2017 the Total Renewable electricity purchased for our plants was 647’600’491 MJ while in 2016
it was 466’113’402. Calculation: the difference in renewable consumption in each plant in MJ and i
n CO2 emissions 2017 vs. 2016. Saved emissions = 18092, while Total Scope 1+2 CO2 emissions in
2016= 587431, so 18092/587431 = 3.1% reduction.
Other emissions
reduction activities 25485 Decreased 4.34
Our commitment for CO2 intensity Scope 1+2 is to reduce by 50% by 2020 vs. 2010 – it is an appro
ved science-based reduction target that also will lead to an absolute reduction. We have a Corporate
Carbon&Water reduction team at Corporate level and Carbon&Water Champion per country. Each c
ountry embedded Carbon reduction initiatives which are tracked quarterly. From all energy saving p
rojects in the plants we saved 75.7 million MJ of total energy, which includes: saving in electricity p
urchased, saving from natural gas, heat oils and other thermal energy. We use CO2 factors per each
fuel type (Scope 1) and electricity-grid factor (market-based) in each country. It gives total saving o
f 12079 tonnes of CO2. For light fleet: we lease more fuel-efficient cars for our Commercial and Ma
nagement cars, we have a special programme for optimization of the routes and rewarding program
me for fuel saving; as we track monthly the fuel consumption, we calculate the fuel saved and after t
hat by multiplying by the fuel carbon factor gives us the CO2 saving (4.77 million litres of fuel save
d = 11135 tonnes of CO2). Also: 210 tonnes of CO2 were saved from less coolant leakages we gene
rated in our own coolers at market place + 2063 tonnes of CO2 saved from better control over the ca
rbonation process in our plants (we use CO2 for carbonation of the beverages and all losses of CO2
are reported under Scope 1). Total = 12077+11135+210+2063 = 25485 tonnes of CO2 saved. Total
CO2 Scope 1+2 emissions in 2017 = 546587; in 2016 = 587431, so the total reduction in 2017 vs. 2
016 = 587431-546587 = 40844 tonnes. Out of them, 25485 are saved from the above-mentioned initi
atives, so 25485/587431 = 4.34% reduction vs. 2016.
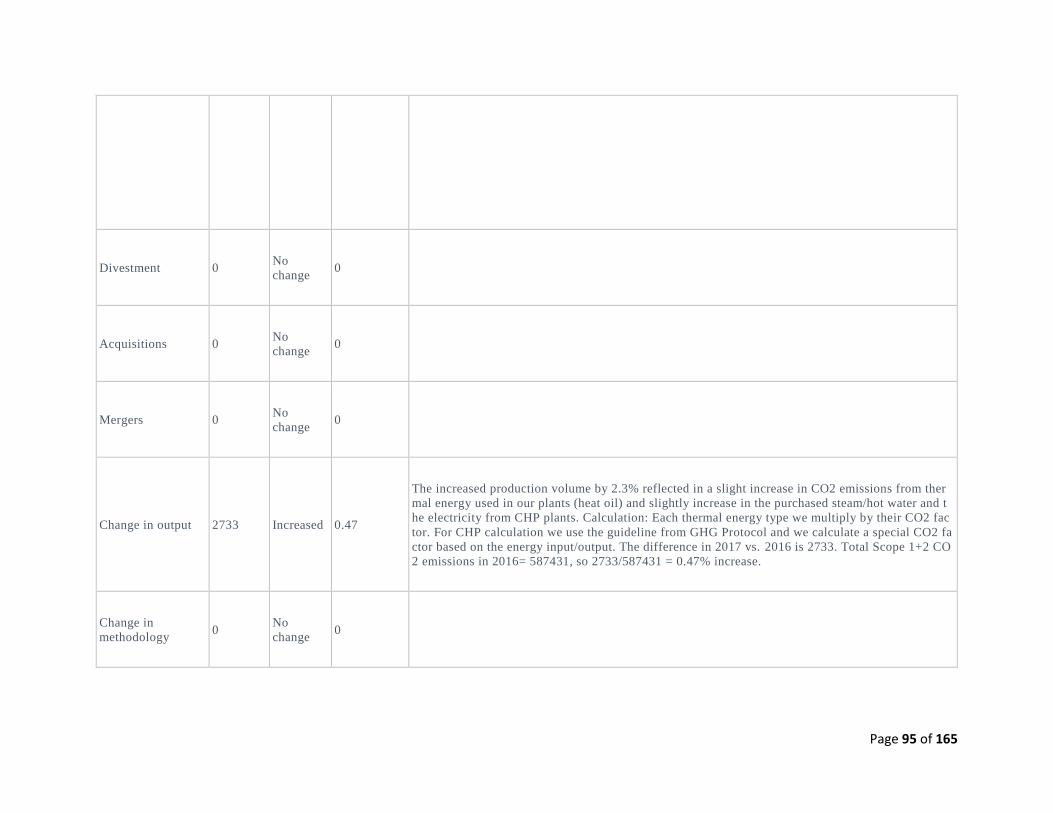
Page 95 of 165
Change
in
emissions
(metric
tons
CO2e)
Direction
of change
Emissions
value
(percentage)
Please explain calculation
Divestment 0 No
change 0
Acquisitions 0 No
change 0
Mergers 0 No
change 0
Change in output 2733 Increased 0.47
The increased production volume by 2.3% reflected in a slight increase in CO2 emissions from ther
mal energy used in our plants (heat oil) and slightly increase in the purchased steam/hot water and t
he electricity from CHP plants. Calculation: Each thermal energy type we multiply by their CO2 fac
tor. For CHP calculation we use the guideline from GHG Protocol and we calculate a special CO2 fa
ctor based on the energy input/output. The difference in 2017 vs. 2016 is 2733. Total Scope 1+2 CO
2 emissions in 2016= 587431, so 2733/587431 = 0.47% increase.
Change in
methodology 0
No
change 0
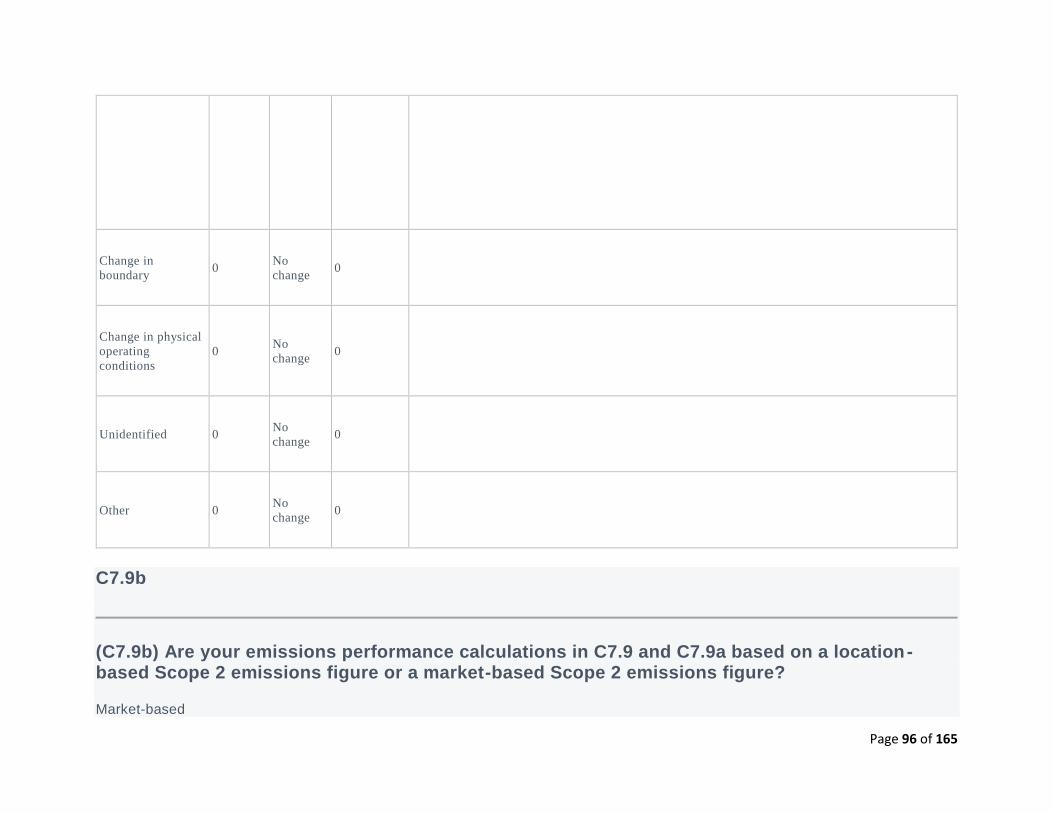
Page 96 of 165
Change
in
emissions
(metric
tons
CO2e)
Direction
of change
Emissions
value
(percentage)
Please explain calculation
Change in
boundary 0
No
change 0
Change in physical
operating
conditions
0 No
change 0
Unidentified 0 No
change 0
Other 0 No
change 0
C7.9b
(C7.9b) Are your emissions performance calculations in C7.9 and C7.9a based on a location-based Scope 2 emissions figure or a market-based Scope 2 emissions figure?
Market-based
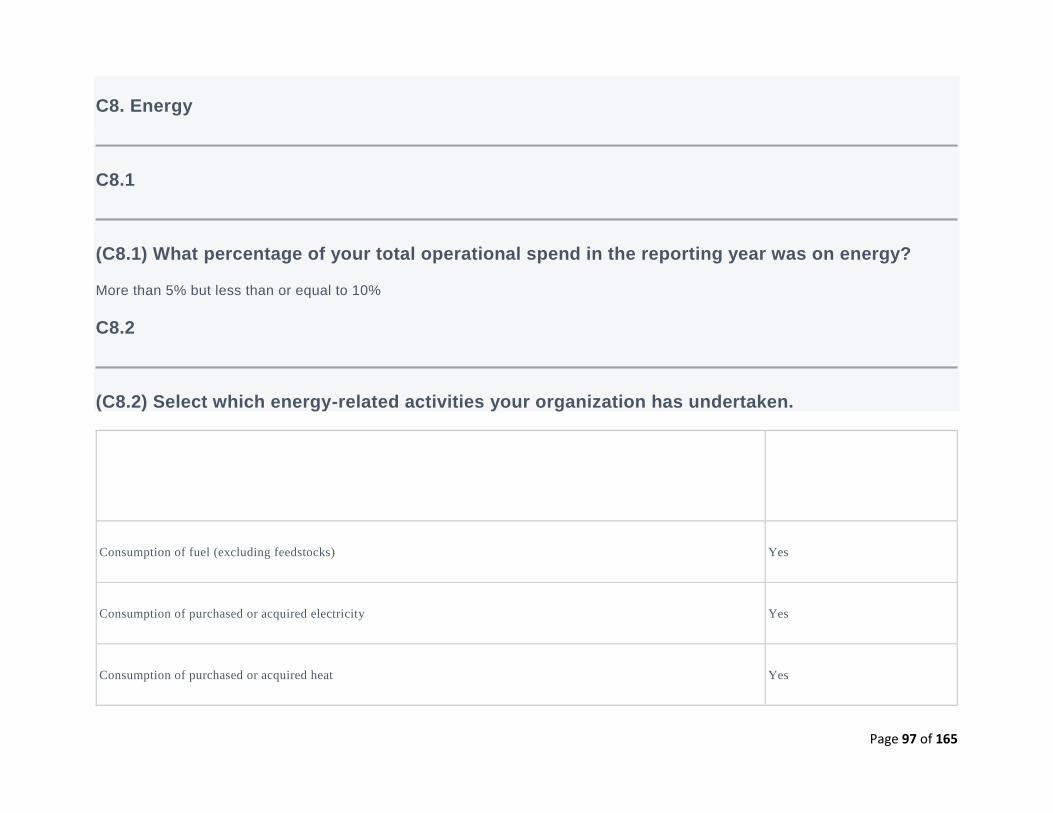
Page 97 of 165
C8. Energy
C8.1
(C8.1) What percentage of your total operational spend in the reporting year was on energy?
More than 5% but less than or equal to 10%
C8.2
(C8.2) Select which energy-related activities your organization has undertaken.
Indicate whether your
organization undertakes this
energy-related activity
Consumption of fuel (excluding feedstocks) Yes
Consumption of purchased or acquired electricity Yes
Consumption of purchased or acquired heat Yes
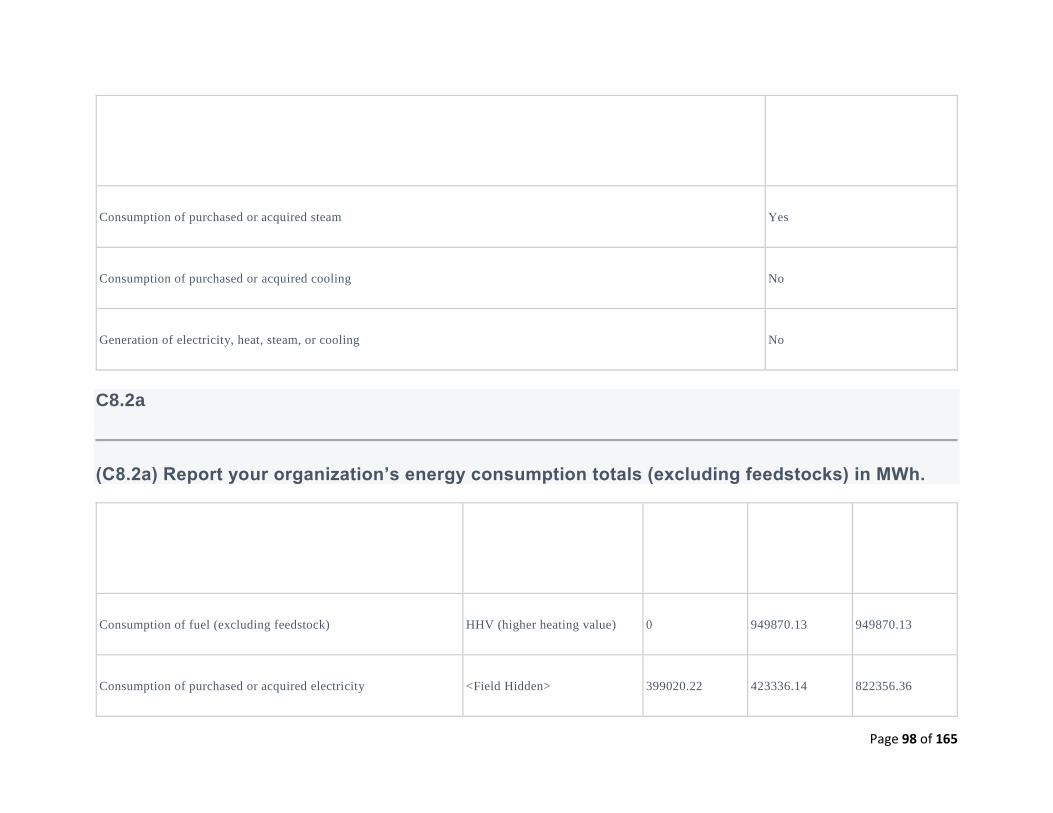
Page 98 of 165
Indicate whether your
organization undertakes this
energy-related activity
Consumption of purchased or acquired steam Yes
Consumption of purchased or acquired cooling No
Generation of electricity, heat, steam, or cooling No
C8.2a
(C8.2a) Report your organization’s energy consumption totals (excluding feedstocks) in MWh.
Heating value
MWh from
renewable
sources
MWh from non-
renewable
sources
Total MWh
Consumption of fuel (excluding feedstock) HHV (higher heating value) 0 949870.13 949870.13
Consumption of purchased or acquired electricity <Field Hidden> 399020.22 423336.14 822356.36
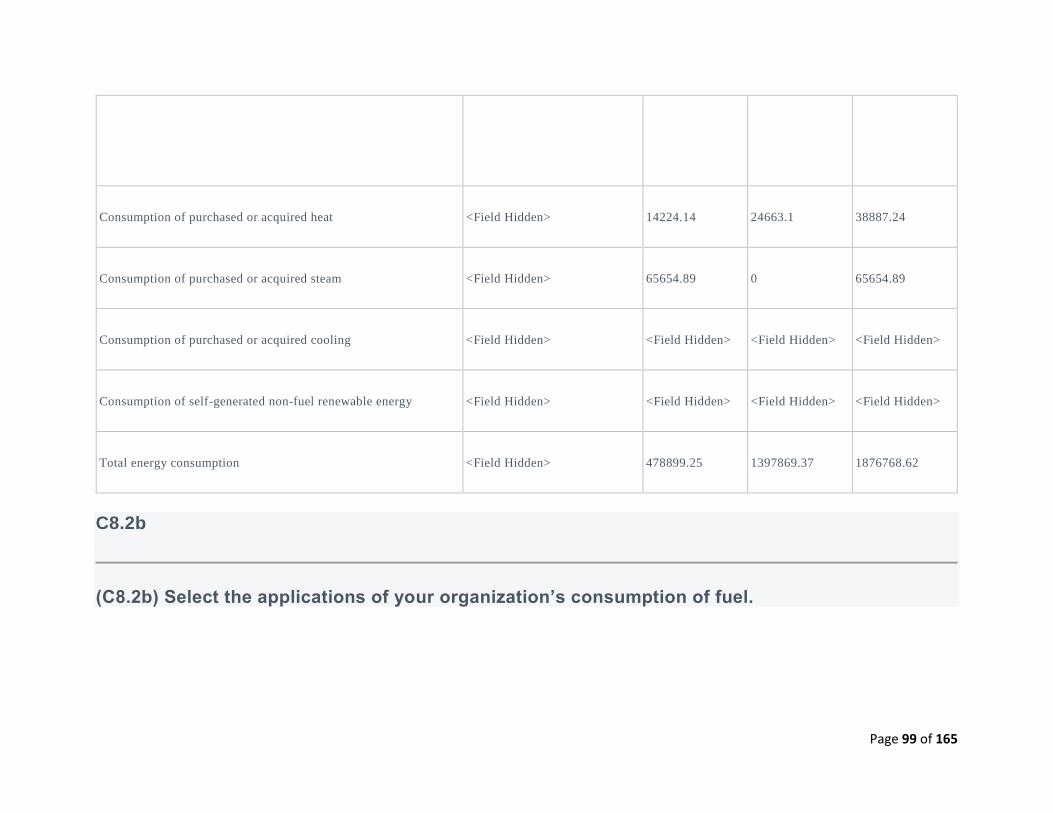
Page 99 of 165
Heating value
MWh from
renewable
sources
MWh from non-
renewable
sources
Total MWh
Consumption of purchased or acquired heat <Field Hidden> 14224.14 24663.1 38887.24
Consumption of purchased or acquired steam <Field Hidden> 65654.89 0 65654.89
Consumption of purchased or acquired cooling <Field Hidden> <Field Hidden> <Field Hidden> <Field Hidden>
Consumption of self-generated non-fuel renewable energy <Field Hidden> <Field Hidden> <Field Hidden> <Field Hidden>
Total energy consumption <Field Hidden> 478899.25 1397869.37 1876768.62
C8.2b
(C8.2b) Select the applications of your organization’s consumption of fuel.
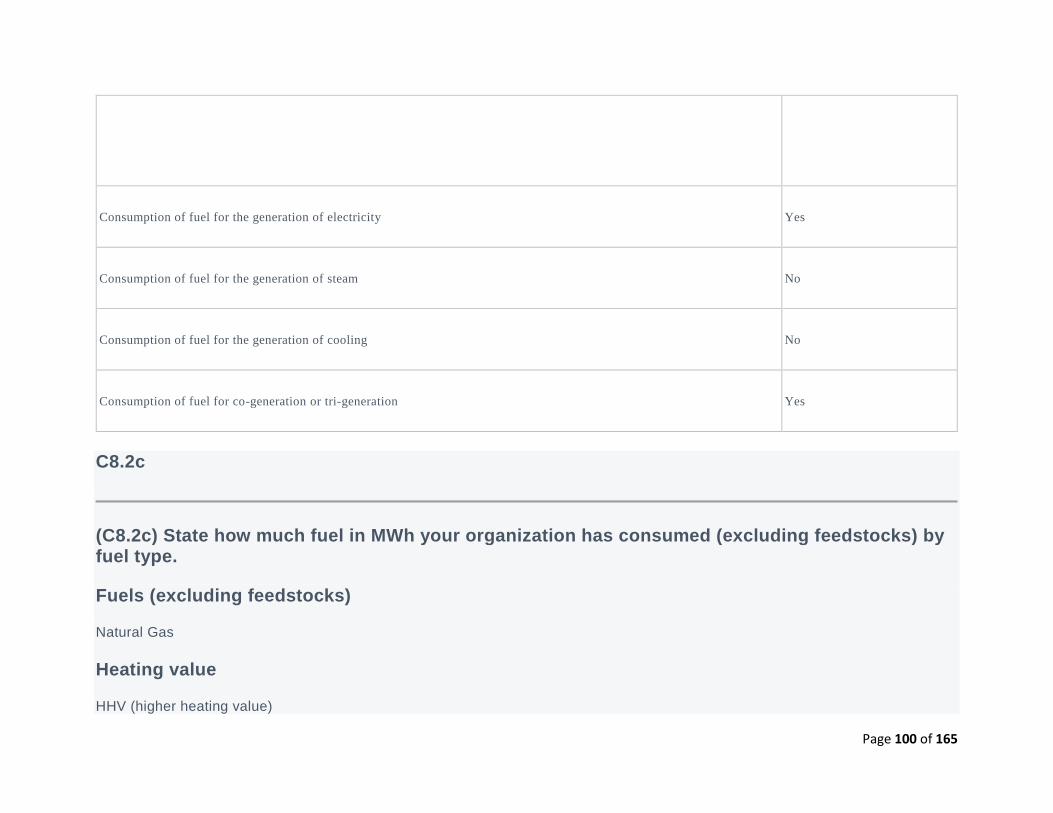
Page 100 of 165
Indicate whether your
organization undertakes this
fuel application
Consumption of fuel for the generation of electricity Yes
Consumption of fuel for the generation of steam No
Consumption of fuel for the generation of cooling No
Consumption of fuel for co-generation or tri-generation Yes
C8.2c
(C8.2c) State how much fuel in MWh your organization has consumed (excluding feedstocks) by fuel type.
Fuels (excluding feedstocks)
Natural Gas
Heating value
HHV (higher heating value)

Page 101 of 165
Total fuel MWh consumed by the organization
422794
MWh fuel consumed for the self-generation of electricity
0
MWh fuel consumed for self-generation of heat
0
MWh fuel consumed for self-generation of steam
<Field Hidden>
MWh fuel consumed for self-generation of cooling
<Field Hidden>
MWh fuel consumed for self- cogeneration or self-trigeneration
0
Fuels (excluding feedstocks)
Diesel
Heating value
HHV (higher heating value)

Page 102 of 165
Total fuel MWh consumed by the organization
262801
MWh fuel consumed for the self-generation of electricity
0
MWh fuel consumed for self-generation of heat
0
MWh fuel consumed for self-generation of steam
<Field Hidden>
MWh fuel consumed for self-generation of cooling
<Field Hidden>
MWh fuel consumed for self- cogeneration or self-trigeneration
0
Fuels (excluding feedstocks)
Liquefied Petroleum Gas (LPG)
Heating value
HHV (higher heating value)
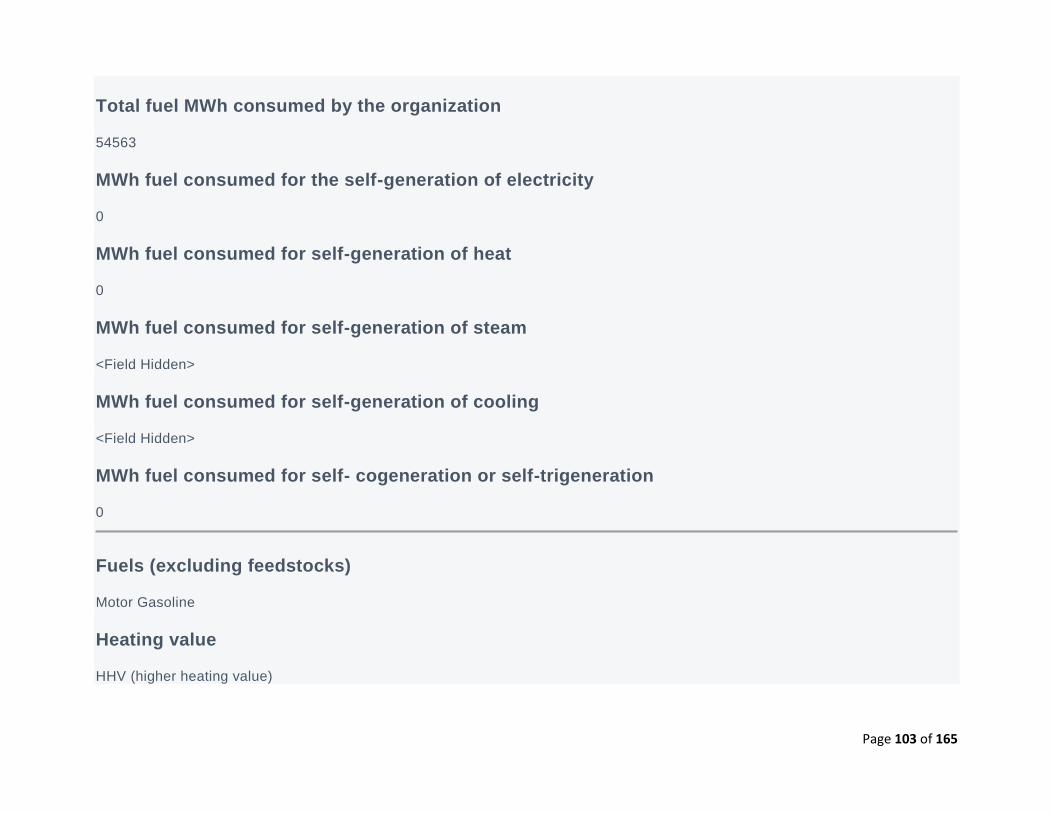
Page 103 of 165
Total fuel MWh consumed by the organization
54563
MWh fuel consumed for the self-generation of electricity
0
MWh fuel consumed for self-generation of heat
0
MWh fuel consumed for self-generation of steam
<Field Hidden>
MWh fuel consumed for self-generation of cooling
<Field Hidden>
MWh fuel consumed for self- cogeneration or self-trigeneration
0
Fuels (excluding feedstocks)
Motor Gasoline
Heating value
HHV (higher heating value)

Page 104 of 165
Total fuel MWh consumed by the organization
132068
MWh fuel consumed for the self-generation of electricity
0
MWh fuel consumed for self-generation of heat
0
MWh fuel consumed for self-generation of steam
<Field Hidden>
MWh fuel consumed for self-generation of cooling
<Field Hidden>
MWh fuel consumed for self- cogeneration or self-trigeneration
0
Fuels (excluding feedstocks)
Other, please specify (Light Fuel Oil)
Heating value
HHV (higher heating value)
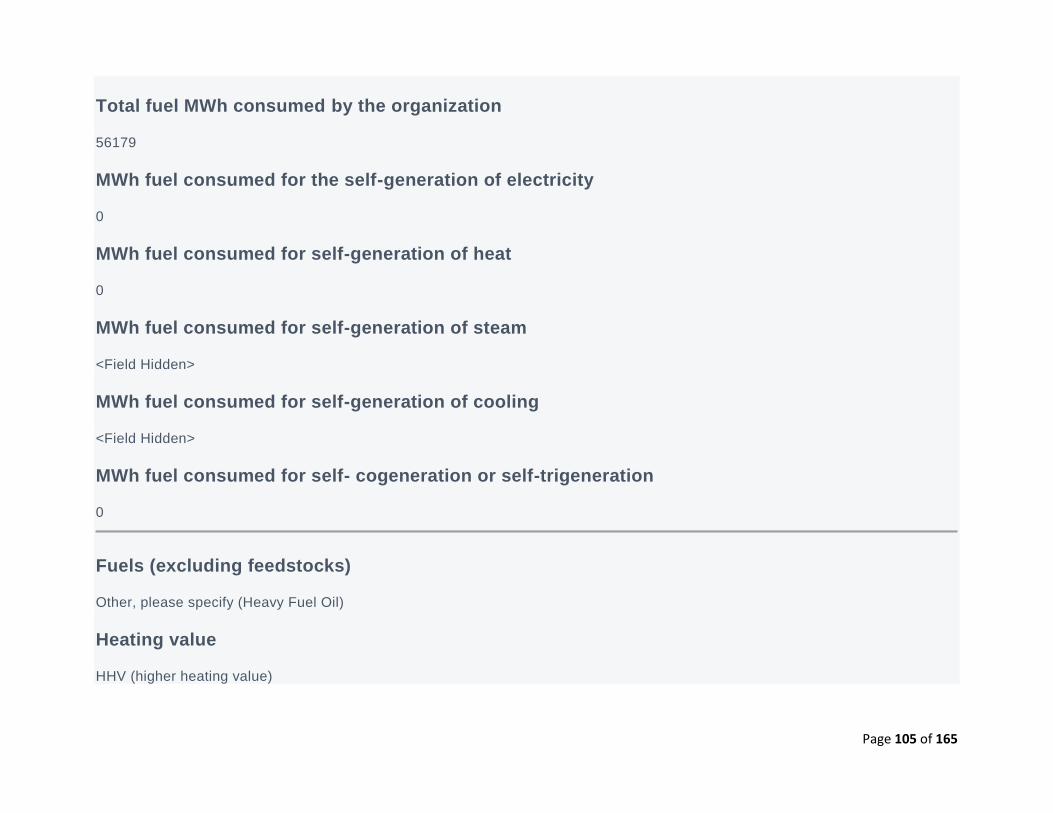
Page 105 of 165
Total fuel MWh consumed by the organization
56179
MWh fuel consumed for the self-generation of electricity
0
MWh fuel consumed for self-generation of heat
0
MWh fuel consumed for self-generation of steam
<Field Hidden>
MWh fuel consumed for self-generation of cooling
<Field Hidden>
MWh fuel consumed for self- cogeneration or self-trigeneration
0
Fuels (excluding feedstocks)
Other, please specify (Heavy Fuel Oil)
Heating value
HHV (higher heating value)
Page 106 of 165
Total fuel MWh consumed by the organization
21465
MWh fuel consumed for the self-generation of electricity
0
MWh fuel consumed for self-generation of heat
0
MWh fuel consumed for self-generation of steam
<Field Hidden>
MWh fuel consumed for self-generation of cooling
<Field Hidden>
MWh fuel consumed for self- cogeneration or self-trigeneration
0
< <Field Hidden>
Diesel
Emission factor
72.14
Page 107 of 165
Unit
kg CO2e per GJ
Emission factor source
Mobile Combustion GHG Emissions Calculation Tool, Version 2.6
Liquefied Petroleum Gas (LPG)
Emission factor
56.84
Unit
kg CO2e per GJ
Emission factor source
GHG Protocol - Stationary combustion tool, version 4.1
Comment
Motor Gasoline
Emission factor
66.03
Unit
kg CO2e per GJ
Page 108 of 165
Emission factor source
Mobile Combustion GHG Emissions Calculation Tool, Version 2.6
Comment
Natural Gas
Emission factor
50.54
Unit
lb CO2e per GJ
Emission factor source
GHG Protocol - Stationary combustion tool, version 4.1
Comment
Other
Emission factor
73.77
Unit
kg CO2e per GJ
Emission factor source
Page 109 of 165
GHG Protocol - Stationary combustion tool, version 4.1
Comment
Others: Heavy Fuel Oil. We use one more fuel type from "Other" category: Light fuel oil and it's emission factor is 70.63 kg CO2e/GJ, from GHG Protocol - Stationary combustion tool, version 4.1.
C8.2f
(C8.2f) Provide details on the electricity, heat, steam and/or cooling amounts that were accounted for at a low-carbon emission factor in the market-based Scope 2 figure reported in C6.3.
Basis for applying a low-carbon emission factor
Contract with suppliers or utilities ( e.g. green tariff), supported by energy attribute certificates
Low-carbon technology type
Solar PV Wind Hydropower
MWh consumed associated with low-carbon electricity, heat, steam or cooling
186098.18
Emission factor (in units of metric tons CO2e per MWh)
0
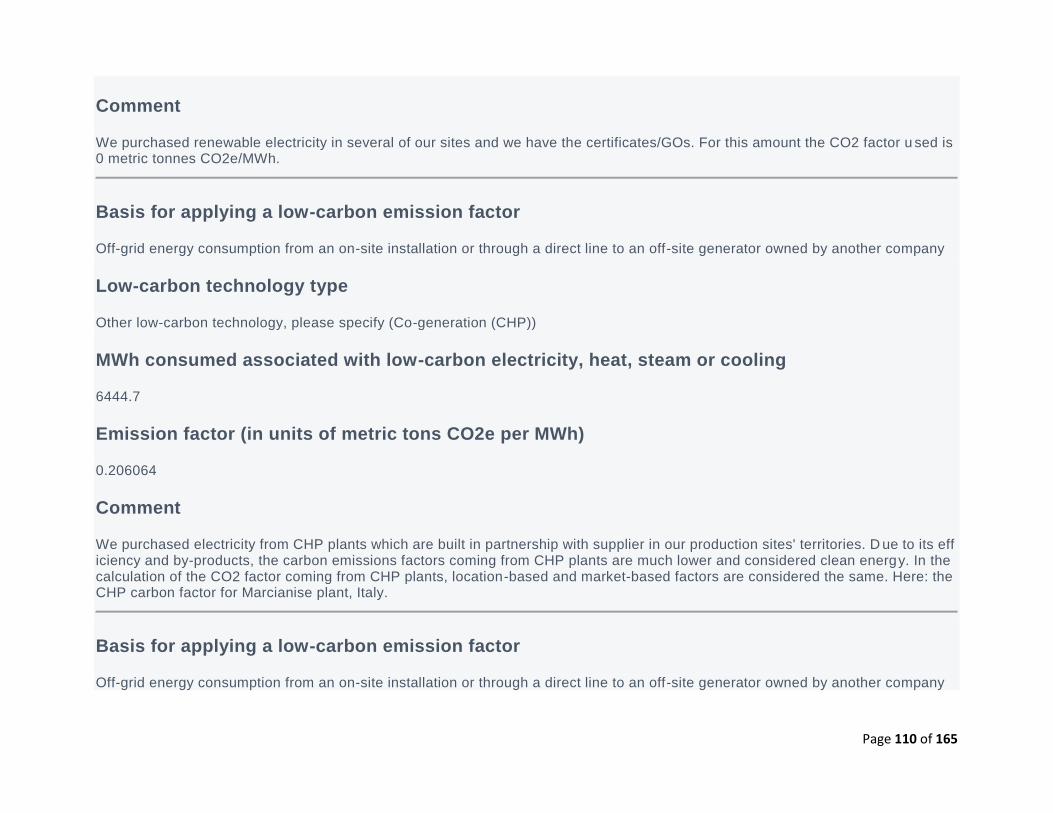
Page 110 of 165
Comment
We purchased renewable electricity in several of our sites and we have the certificates/GOs. For this amount the CO2 factor u sed is 0 metric tonnes CO2e/MWh.
Basis for applying a low-carbon emission factor
Off-grid energy consumption from an on-site installation or through a direct line to an off-site generator owned by another company
Low-carbon technology type
Other low-carbon technology, please specify (Co-generation (CHP))
MWh consumed associated with low-carbon electricity, heat, steam or cooling
6444.7
Emission factor (in units of metric tons CO2e per MWh)
0.206064
Comment
We purchased electricity from CHP plants which are built in partnership with supplier in our production sites' territories. D ue to its efficiency and by-products, the carbon emissions factors coming from CHP plants are much lower and considered clean energy. In the calculation of the CO2 factor coming from CHP plants, location-based and market-based factors are considered the same. Here: the CHP carbon factor for Marcianise plant, Italy.
Basis for applying a low-carbon emission factor
Off-grid energy consumption from an on-site installation or through a direct line to an off-site generator owned by another company
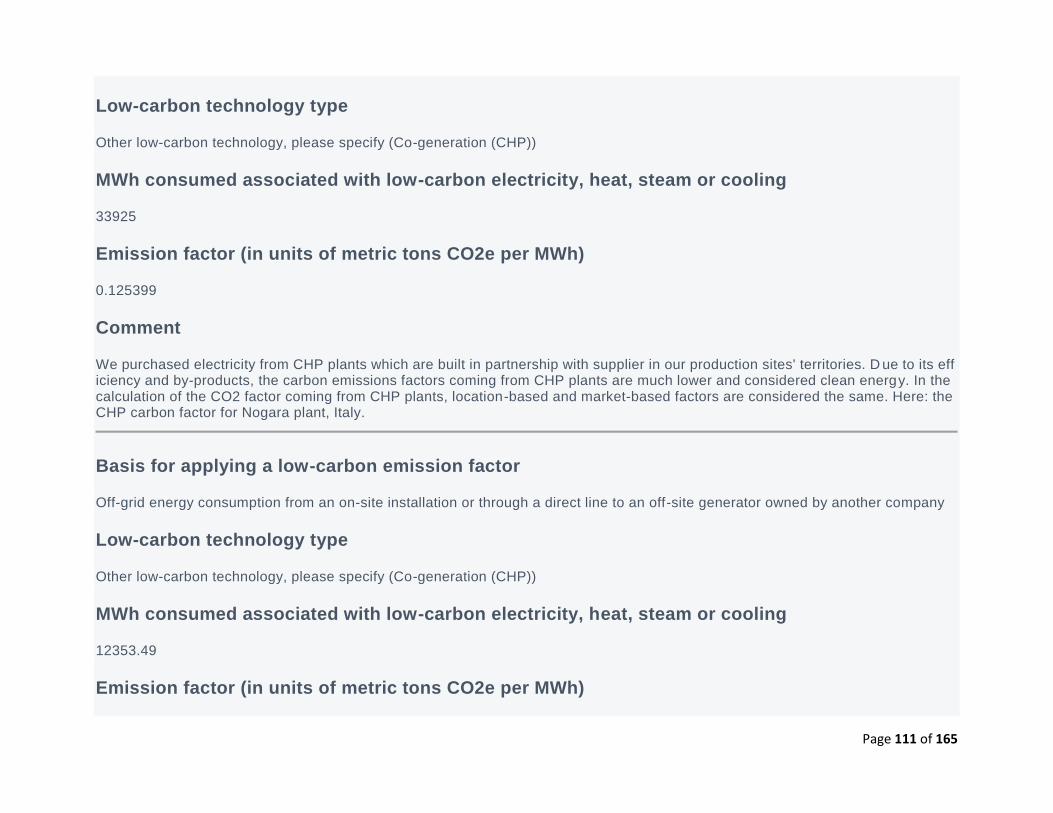
Page 111 of 165
Low-carbon technology type
Other low-carbon technology, please specify (Co-generation (CHP))
MWh consumed associated with low-carbon electricity, heat, steam or cooling
33925
Emission factor (in units of metric tons CO2e per MWh)
0.125399
Comment
We purchased electricity from CHP plants which are built in partnership with supplier in our production sites' territories. D ue to its efficiency and by-products, the carbon emissions factors coming from CHP plants are much lower and considered clean energy. In the calculation of the CO2 factor coming from CHP plants, location-based and market-based factors are considered the same. Here: the CHP carbon factor for Nogara plant, Italy.
Basis for applying a low-carbon emission factor
Off-grid energy consumption from an on-site installation or through a direct line to an off-site generator owned by another company
Low-carbon technology type
Other low-carbon technology, please specify (Co-generation (CHP))
MWh consumed associated with low-carbon electricity, heat, steam or cooling
12353.49
Emission factor (in units of metric tons CO2e per MWh)
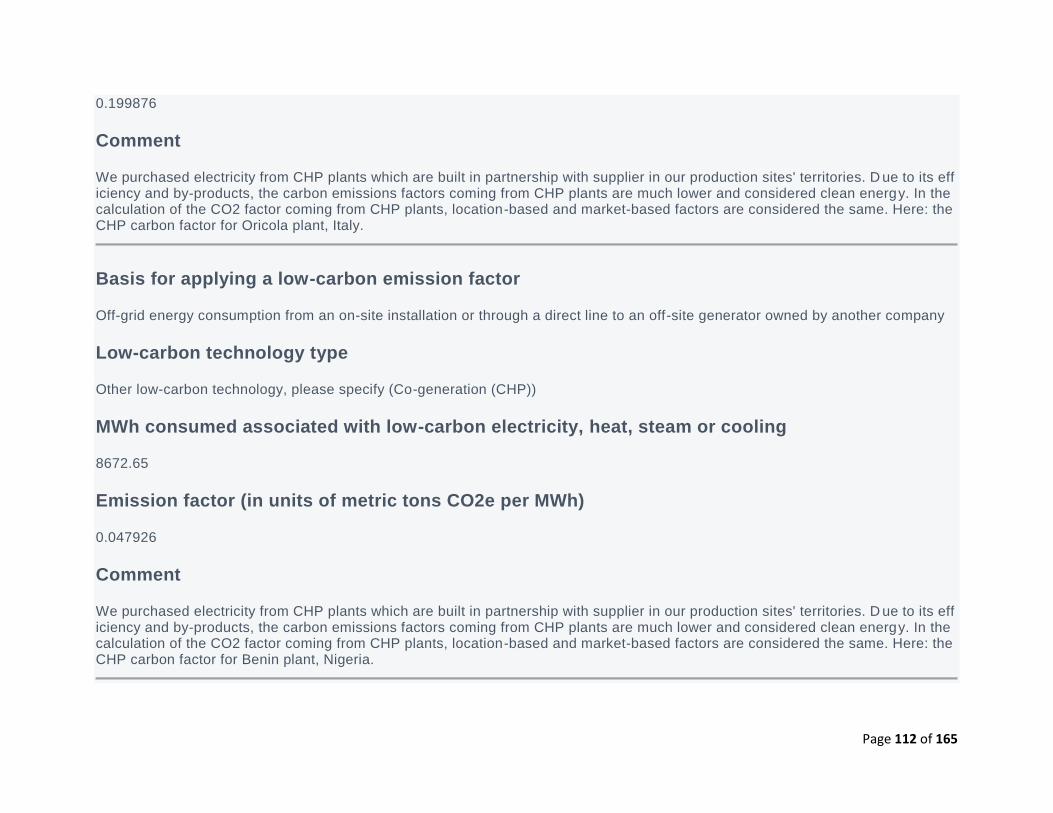
Page 112 of 165
0.199876
Comment
We purchased electricity from CHP plants which are built in partnership with supplier in our production sites' territories. D ue to its efficiency and by-products, the carbon emissions factors coming from CHP plants are much lower and considered clean energy. In the calculation of the CO2 factor coming from CHP plants, location-based and market-based factors are considered the same. Here: the CHP carbon factor for Oricola plant, Italy.
Basis for applying a low-carbon emission factor
Off-grid energy consumption from an on-site installation or through a direct line to an off-site generator owned by another company
Low-carbon technology type
Other low-carbon technology, please specify (Co-generation (CHP))
MWh consumed associated with low-carbon electricity, heat, steam or cooling
8672.65
Emission factor (in units of metric tons CO2e per MWh)
0.047926
Comment
We purchased electricity from CHP plants which are built in partnership with supplier in our production sites' territories. D ue to its efficiency and by-products, the carbon emissions factors coming from CHP plants are much lower and considered clean energy. In the calculation of the CO2 factor coming from CHP plants, location-based and market-based factors are considered the same. Here: the CHP carbon factor for Benin plant, Nigeria.
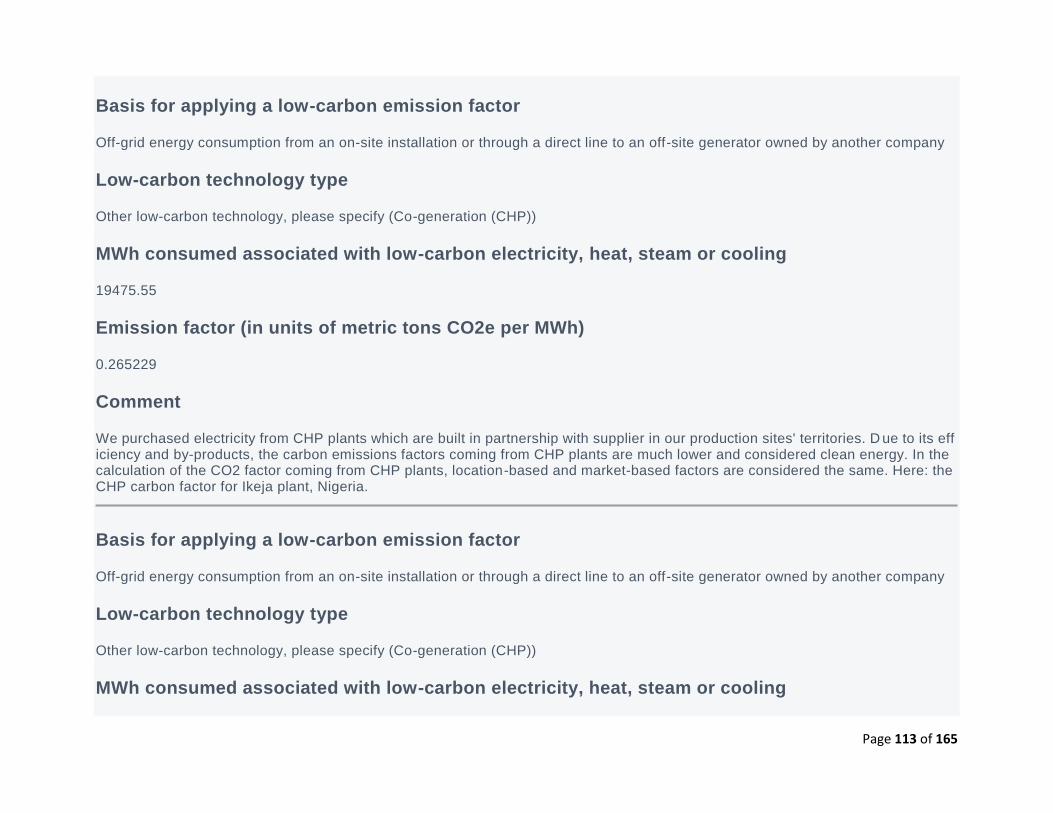
Page 113 of 165
Basis for applying a low-carbon emission factor
Off-grid energy consumption from an on-site installation or through a direct line to an off-site generator owned by another company
Low-carbon technology type
Other low-carbon technology, please specify (Co-generation (CHP))
MWh consumed associated with low-carbon electricity, heat, steam or cooling
19475.55
Emission factor (in units of metric tons CO2e per MWh)
0.265229
Comment
We purchased electricity from CHP plants which are built in partnership with supplier in our production sites' territories. D ue to its efficiency and by-products, the carbon emissions factors coming from CHP plants are much lower and considered clean energy. In the calculation of the CO2 factor coming from CHP plants, location-based and market-based factors are considered the same. Here: the CHP carbon factor for Ikeja plant, Nigeria.
Basis for applying a low-carbon emission factor
Off-grid energy consumption from an on-site installation or through a direct line to an off-site generator owned by another company
Low-carbon technology type
Other low-carbon technology, please specify (Co-generation (CHP))
MWh consumed associated with low-carbon electricity, heat, steam or cooling
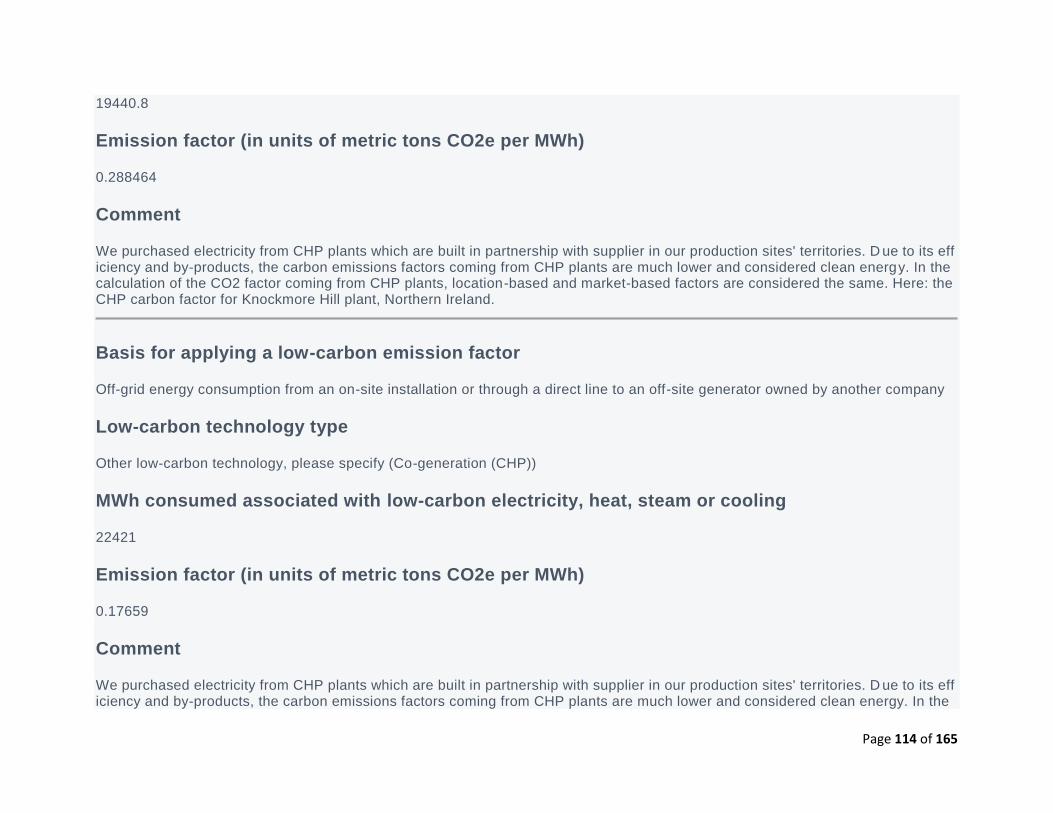
Page 114 of 165
19440.8
Emission factor (in units of metric tons CO2e per MWh)
0.288464
Comment
We purchased electricity from CHP plants which are built in partnership with supplier in our production sites' territories. D ue to its efficiency and by-products, the carbon emissions factors coming from CHP plants are much lower and considered clean energy. In the calculation of the CO2 factor coming from CHP plants, location-based and market-based factors are considered the same. Here: the CHP carbon factor for Knockmore Hill plant, Northern Ireland.
Basis for applying a low-carbon emission factor
Off-grid energy consumption from an on-site installation or through a direct line to an off-site generator owned by another company
Low-carbon technology type
Other low-carbon technology, please specify (Co-generation (CHP))
MWh consumed associated with low-carbon electricity, heat, steam or cooling
22421
Emission factor (in units of metric tons CO2e per MWh)
0.17659
Comment
We purchased electricity from CHP plants which are built in partnership with supplier in our production sites' territories. D ue to its efficiency and by-products, the carbon emissions factors coming from CHP plants are much lower and considered clean energy. In the
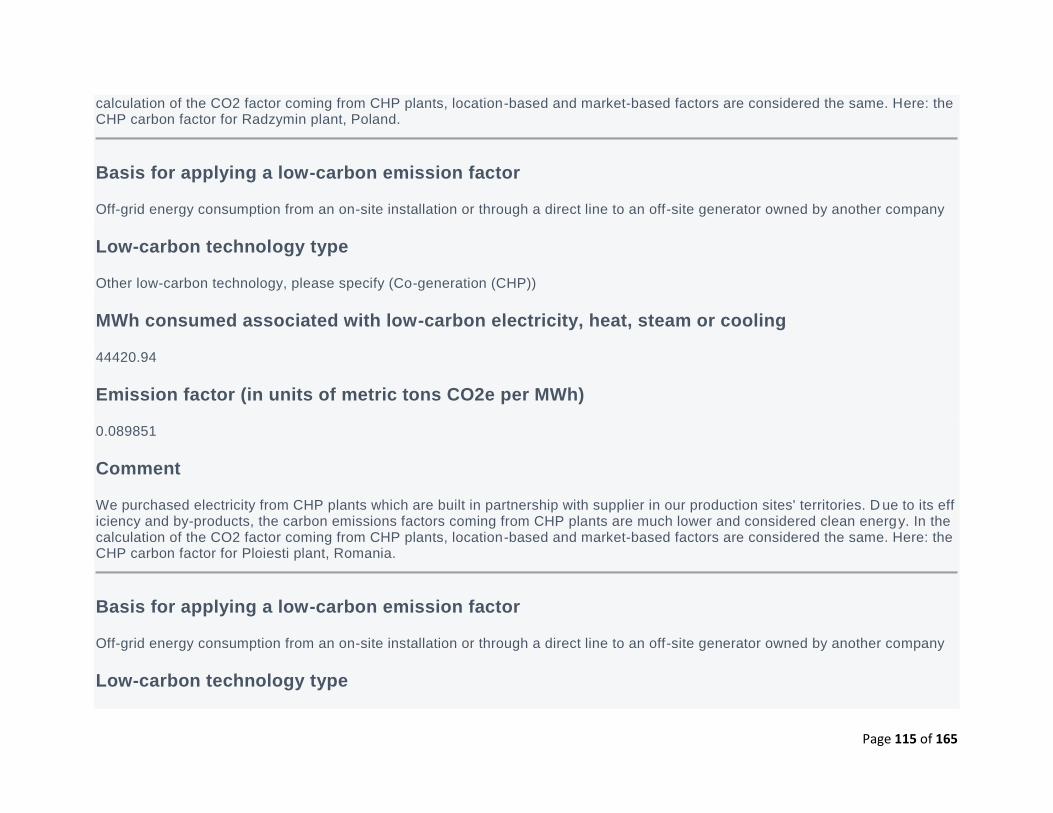
Page 115 of 165
calculation of the CO2 factor coming from CHP plants, location-based and market-based factors are considered the same. Here: the CHP carbon factor for Radzymin plant, Poland.
Basis for applying a low-carbon emission factor
Off-grid energy consumption from an on-site installation or through a direct line to an off-site generator owned by another company
Low-carbon technology type
Other low-carbon technology, please specify (Co-generation (CHP))
MWh consumed associated with low-carbon electricity, heat, steam or cooling
44420.94
Emission factor (in units of metric tons CO2e per MWh)
0.089851
Comment
We purchased electricity from CHP plants which are built in partnership with supplier in our production sites' territories. D ue to its efficiency and by-products, the carbon emissions factors coming from CHP plants are much lower and considered clean energy. In the calculation of the CO2 factor coming from CHP plants, location-based and market-based factors are considered the same. Here: the CHP carbon factor for Ploiesti plant, Romania.
Basis for applying a low-carbon emission factor
Off-grid energy consumption from an on-site installation or through a direct line to an off-site generator owned by another company
Low-carbon technology type
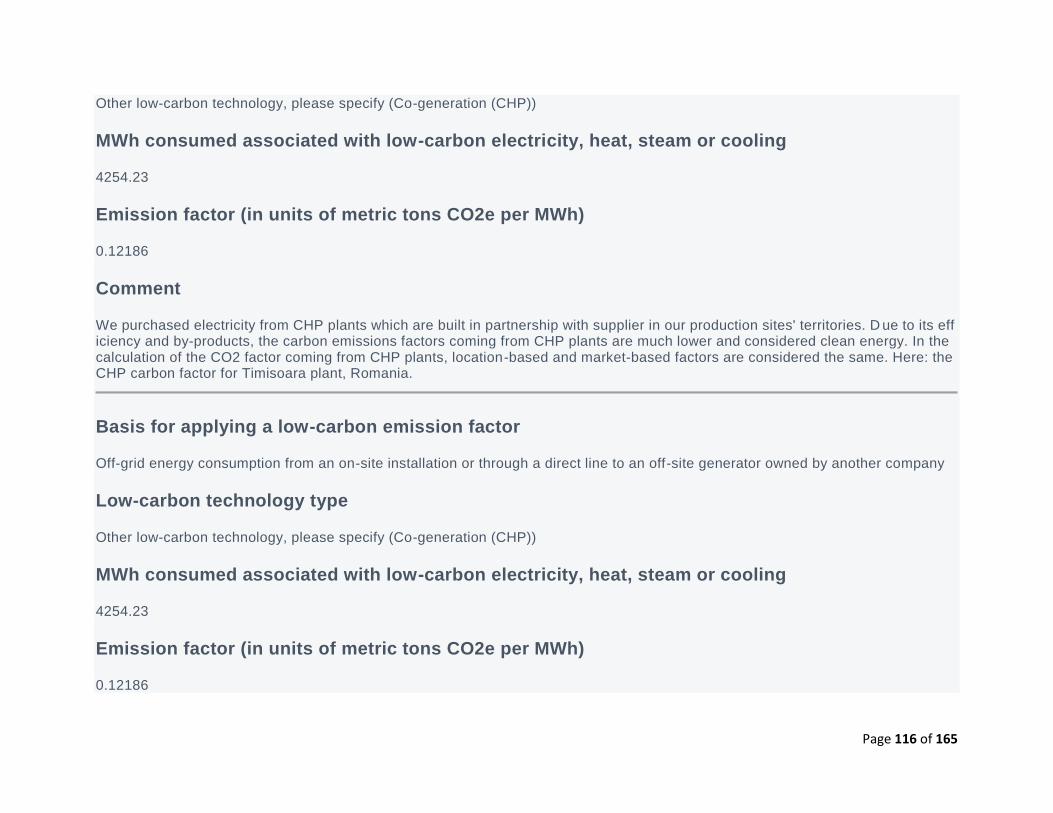
Page 116 of 165
Other low-carbon technology, please specify (Co-generation (CHP))
MWh consumed associated with low-carbon electricity, heat, steam or cooling
4254.23
Emission factor (in units of metric tons CO2e per MWh)
0.12186
Comment
We purchased electricity from CHP plants which are built in partnership with supplier in our production sites' territories. D ue to its efficiency and by-products, the carbon emissions factors coming from CHP plants are much lower and considered clean energy. In the calculation of the CO2 factor coming from CHP plants, location-based and market-based factors are considered the same. Here: the CHP carbon factor for Timisoara plant, Romania.
Basis for applying a low-carbon emission factor
Off-grid energy consumption from an on-site installation or through a direct line to an off-site generator owned by another company
Low-carbon technology type
Other low-carbon technology, please specify (Co-generation (CHP))
MWh consumed associated with low-carbon electricity, heat, steam or cooling
4254.23
Emission factor (in units of metric tons CO2e per MWh)
0.12186
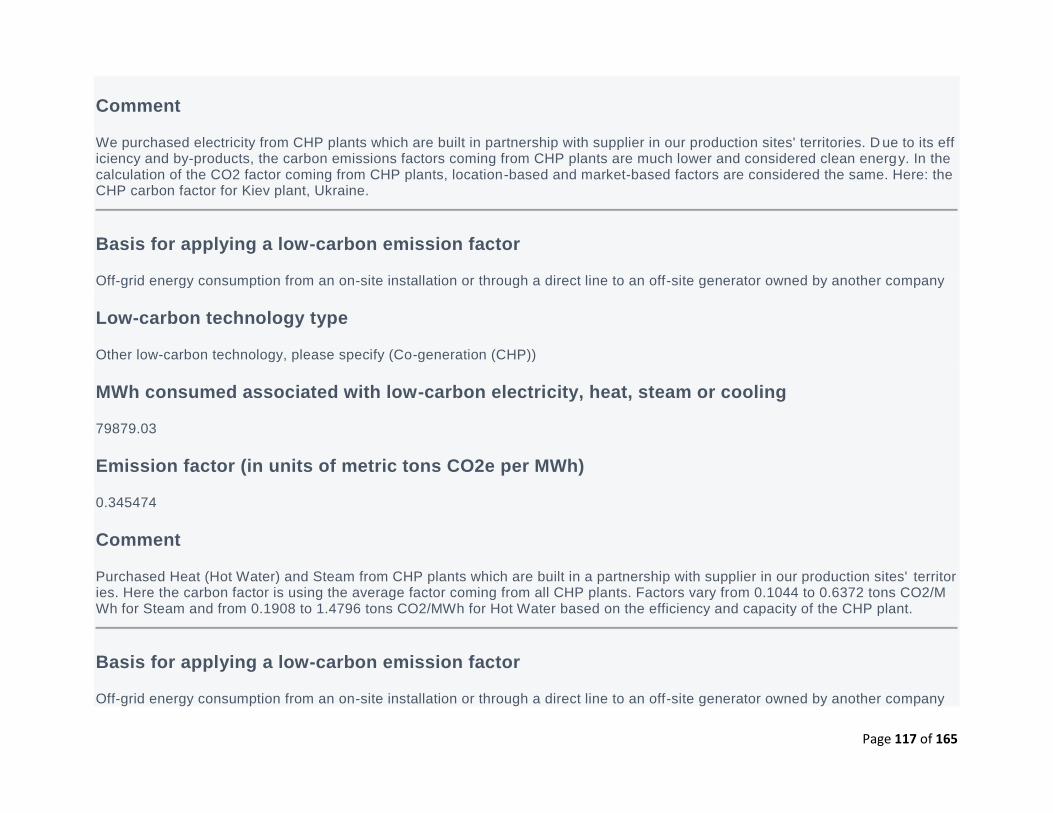
Page 117 of 165
Comment
We purchased electricity from CHP plants which are built in partnership with supplier in our production sites' territories. D ue to its efficiency and by-products, the carbon emissions factors coming from CHP plants are much lower and considered clean energy. In the calculation of the CO2 factor coming from CHP plants, location-based and market-based factors are considered the same. Here: the CHP carbon factor for Kiev plant, Ukraine.
Basis for applying a low-carbon emission factor
Off-grid energy consumption from an on-site installation or through a direct line to an off-site generator owned by another company
Low-carbon technology type
Other low-carbon technology, please specify (Co-generation (CHP))
MWh consumed associated with low-carbon electricity, heat, steam or cooling
79879.03
Emission factor (in units of metric tons CO2e per MWh)
0.345474
Comment
Purchased Heat (Hot Water) and Steam from CHP plants which are built in a partnership with supplier in our production sites' territories. Here the carbon factor is using the average factor coming from all CHP plants. Factors vary from 0.1044 to 0.6372 tons CO2/MWh for Steam and from 0.1908 to 1.4796 tons CO2/MWh for Hot Water based on the efficiency and capacity of the CHP plant.
Basis for applying a low-carbon emission factor
Off-grid energy consumption from an on-site installation or through a direct line to an off-site generator owned by another company
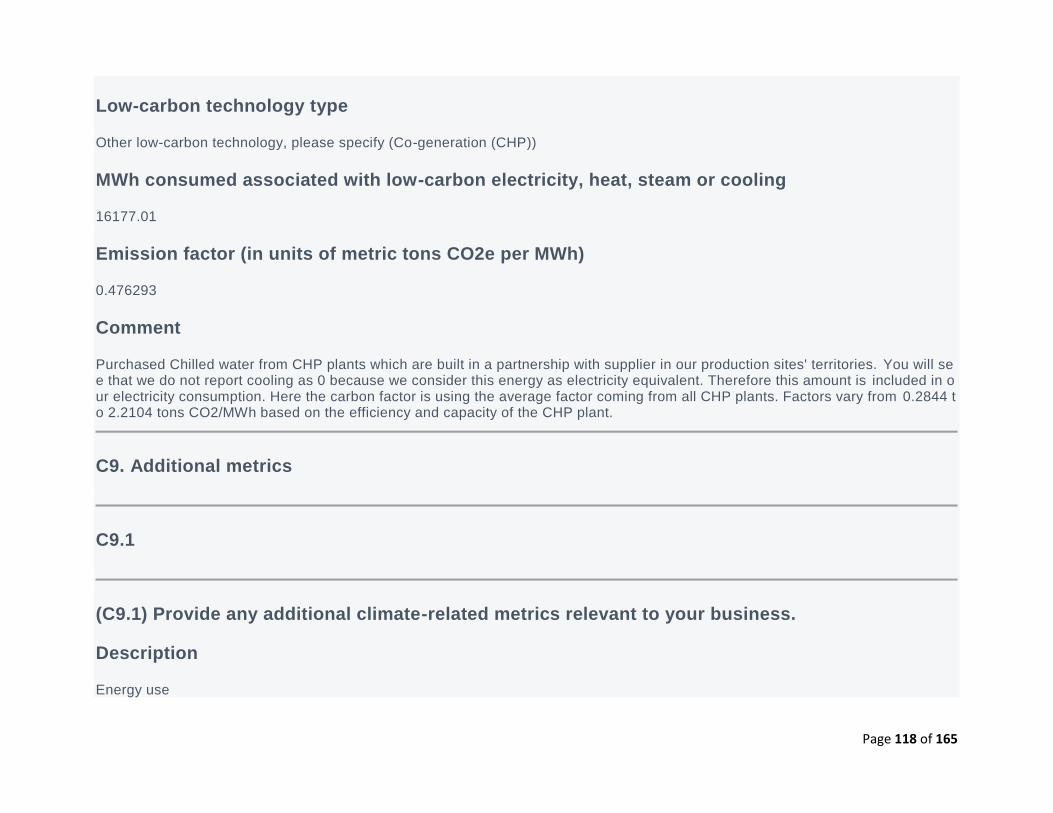
Page 118 of 165
Low-carbon technology type
Other low-carbon technology, please specify (Co-generation (CHP))
MWh consumed associated with low-carbon electricity, heat, steam or cooling
16177.01
Emission factor (in units of metric tons CO2e per MWh)
0.476293
Comment
Purchased Chilled water from CHP plants which are built in a partnership with supplier in our production sites' territories. You will see that we do not report cooling as 0 because we consider this energy as electricity equivalent. Therefore this amount is included in our electricity consumption. Here the carbon factor is using the average factor coming from all CHP plants. Factors vary from 0.2844 to 2.2104 tons CO2/MWh based on the efficiency and capacity of the CHP plant.
C9. Additional metrics
C9.1
(C9.1) Provide any additional climate-related metrics relevant to your business.
Description
Energy use
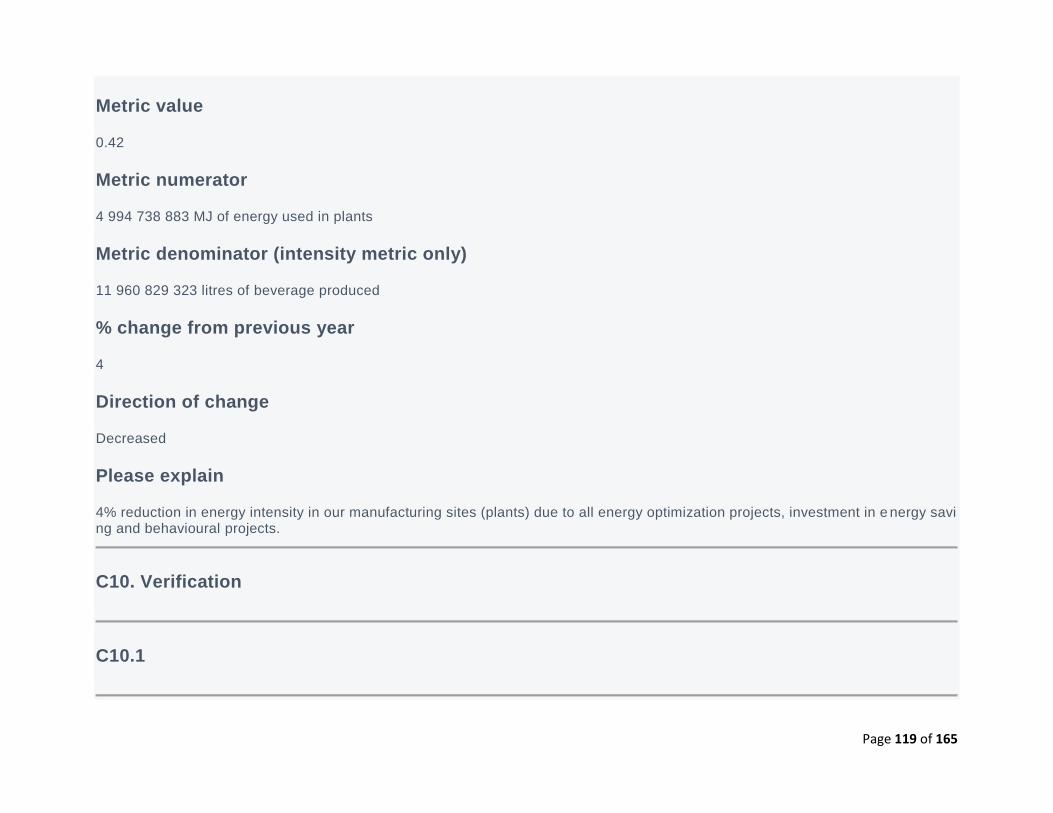
Page 119 of 165
Metric value
0.42
Metric numerator
4 994 738 883 MJ of energy used in plants
Metric denominator (intensity metric only)
11 960 829 323 litres of beverage produced
% change from previous year
4
Direction of change
Decreased
Please explain
4% reduction in energy intensity in our manufacturing sites (plants) due to all energy optimization projects, investment in e nergy saving and behavioural projects.
C10. Verification
C10.1
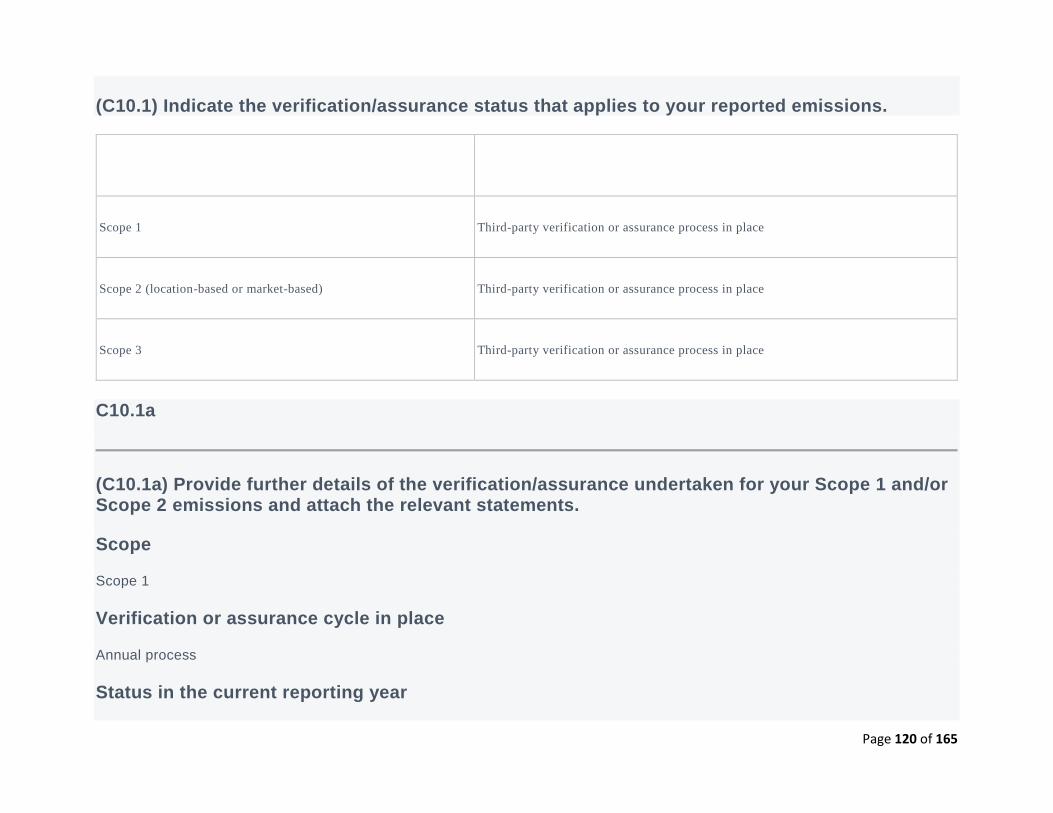
Page 120 of 165
(C10.1) Indicate the verification/assurance status that applies to your reported emissions.
Verification/assurance status
Scope 1 Third-party verification or assurance process in place
Scope 2 (location-based or market-based) Third-party verification or assurance process in place
Scope 3 Third-party verification or assurance process in place
C10.1a
(C10.1a) Provide further details of the verification/assurance undertaken for your Scope 1 and/or Scope 2 emissions and attach the relevant statements.
Scope
Scope 1
Verification or assurance cycle in place
Annual process
Status in the current reporting year

Page 121 of 165
Complete
Type of verification or assurance
High assurance
Attach the statement
2017_IAR.PDF
Page/ section reference
pages 227-229: "Independent Assurance Statement on the 2017 Integrated Annual Report".
Relevant standard
A1000AS
Proportion of reported emissions verified (%)
100
Scope
Scope 2 location-based
Verification or assurance cycle in place
Annual process
Status in the current reporting year
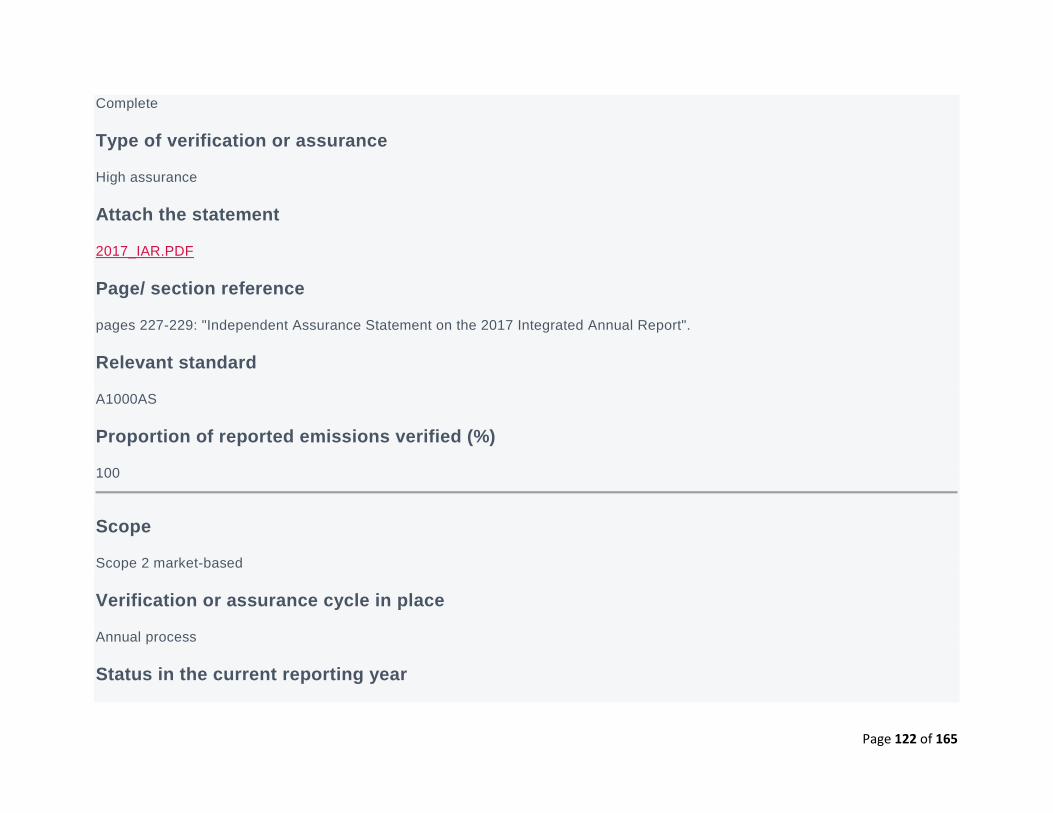
Page 122 of 165
Complete
Type of verification or assurance
High assurance
Attach the statement
2017_IAR.PDF
Page/ section reference
pages 227-229: "Independent Assurance Statement on the 2017 Integrated Annual Report".
Relevant standard
A1000AS
Proportion of reported emissions verified (%)
100
Scope
Scope 2 market-based
Verification or assurance cycle in place
Annual process
Status in the current reporting year
Page 123 of 165
Complete
Type of verification or assurance
High assurance
Attach the statement
2017_IAR.PDF
Page/ section reference
pages 227-229: "Independent Assurance Statement on the 2017 Integrated Annual Report".
Relevant standard
A1000AS
Proportion of reported emissions verified (%)
100
C10.1b
(C10.1b) Provide further details of the verification/assurance undertaken for your Scope 3 emissions and attach the relevant statements.
Scope
Scope 3- all relevant categories
Page 124 of 165
Verification or assurance cycle in place
Annual process
Status in the current reporting year
Complete
Attach the statement
2017_IAR.PDF
Page/section reference
pages 227-229: "Independent Assurance Statement on the 2017 Integrated Annual Report".
Relevant standard
AA1000AS
C10.2
(C10.2) Do you verify any climate-related information reported in your CDP disclosure other than the emissions figures reported in C6.1, C6.3, and C6.5?
Yes
C10.2a
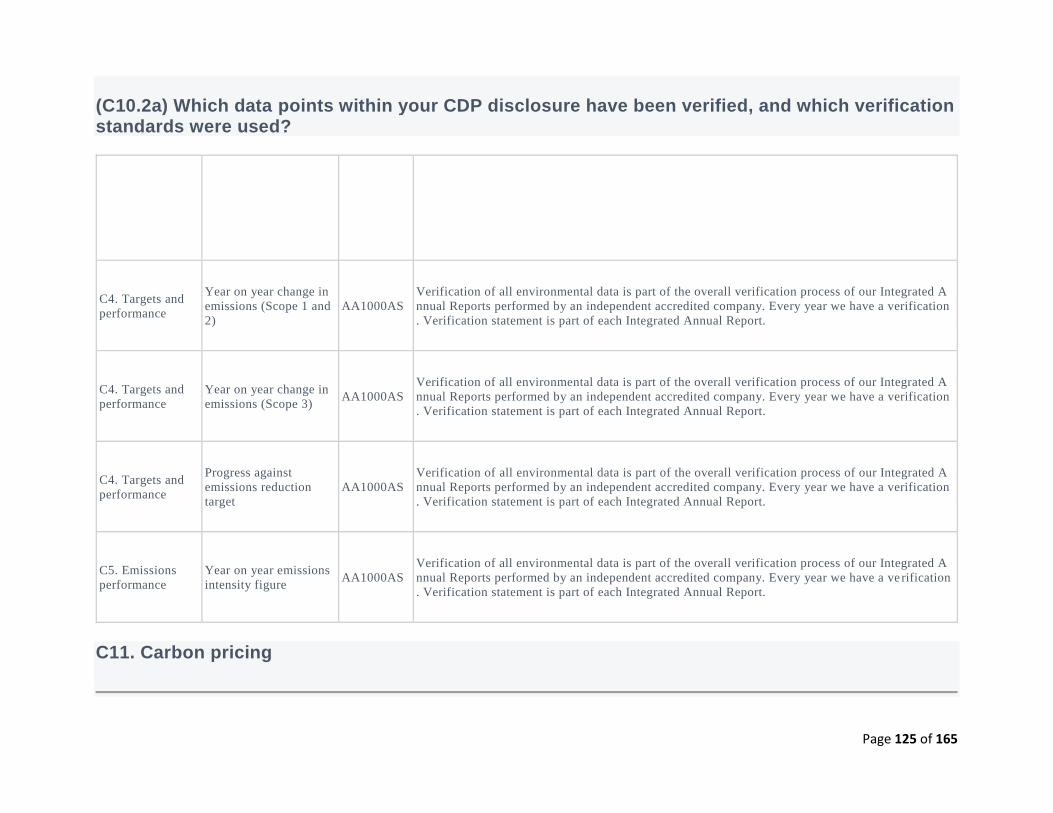
Page 125 of 165
(C10.2a) Which data points within your CDP disclosure have been verified, and which verification standards were used?
Disclosure
module
verification
relates to
Data verified Verification
standard Please explain
C4. Targets and
performance
Year on year change in
emissions (Scope 1 and
2)
AA1000AS
Verification of all environmental data is part of the overall verification process of our Integrated A
nnual Reports performed by an independent accredited company. Every year we have a verification
. Verification statement is part of each Integrated Annual Report.
C4. Targets and
performance
Year on year change in
emissions (Scope 3) AA1000AS
Verification of all environmental data is part of the overall verification process of our Integrated A
nnual Reports performed by an independent accredited company. Every year we have a verification
. Verification statement is part of each Integrated Annual Report.
C4. Targets and
performance
Progress against
emissions reduction
target
AA1000AS
Verification of all environmental data is part of the overall verification process of our Integrated A
nnual Reports performed by an independent accredited company. Every year we have a verification
. Verification statement is part of each Integrated Annual Report.
C5. Emissions
performance
Year on year emissions
intensity figure AA1000AS
Verification of all environmental data is part of the overall verification process of our Integrated A
nnual Reports performed by an independent accredited company. Every year we have a ve rification
. Verification statement is part of each Integrated Annual Report.
C11. Carbon pricing
Page 126 of 165
C11.1
(C11.1) Are any of your operations or activities regulated by a carbon pricing system (i.e. ETS, Cap & Trade or Carbon Tax)?
No, and we do not anticipate being regulated in the next three years
C11.2
(C11.2) Has your organization originated or purchased any project-based carbon credits within the reporting period?
No
C11.3
(C11.3) Does your organization use an internal price on carbon?
Yes
C11.3a
(C11.3a) Provide details of how your organization uses an internal price on carbon.
Objective for implementing an internal carbon price
Page 127 of 165
Change internal behavior Drive energy efficiency
GHG Scope
Scope 1 Scope 2
Application
Since 2015 we introduced an internal carbon price and we are among the committed companies from "We mean business" platform prior to COP21 meeting in Paris. The internal carbon price is part of so called "Accounting for Sustainability" programme and it is integrated in our country's business plans. We calculate each investment in energy/carbon reduction by using the internal carbon price and the decision making process is based on the payback with the internal carbon price. With the internal CO2 cost we cap ture: a.Actual Greenhouse Gas Emissions as per respective regulations and schemes, plus b. Risk of incremental costs incurring due to additional regulation on GHGs, plus c.Risk of reputation damage to brand and share value. At central level, we developed C arbon saving calculation tool, which includes return on investment with and without internal carbon price and this tool is used by each pl ant for all energy/carbon projects.
Actual price(s) used (Currency /metric ton)
25
Variance of price(s) used
Since the introduction of our internal carbon price, we have not changed it. Our current internal CO2 price is calculated: EU ETS (E uropean Union Emission Trading Scheme) + CRC (Carbon Reduction Commitment) current price. The review of the price is annually and it is fully integrated with our Finance tool for projects payback calculation (so called Finance Investment Assessment Tool).
Type of internal carbon price
Shadow price
Impact & implication
Page 128 of 165
Since 2015 we introduced an internal carbon price and we are among the committed companies from "We mean business" platform prior to COP21 meeting in Paris. The internal carbon price is part of so called "Accounting for Sustainability" programme and it is integrated in our country's business plans. We calculate each investment in energy/carbon reduction by using the internal carbon price and the decision making process is based on the payback with the internal carbon price. With the internal CO2 cost we cap ture: a.Actual Greenhouse Gas Emissions as per respective regulations and schemes, plus b. Risk of incremental costs incurring due to additional regulation on GHGs, plus c.Risk of reputation damage to brand and share value. At central level, we developed C arbon saving calculation tool, which includes return on investment with and without internal carbon price and this tool is used by each pl ant for all energy/carbon projects.
C12. Engagement
C12.1
(C12.1) Do you engage with your value chain on climate-related issues?
Yes, our suppliers Yes, our customers
C12.1a
(C12.1a) Provide details of your climate-related supplier engagement strategy.
Type of engagement
Compliance & onboarding
Details of engagement
Page 129 of 165
Included climate change in supplier selection / management mechanism Climate change is integrated into supplier evaluation processes
% of suppliers by number
90
% total procurement spend (direct and indirect)
90
% Scope 3 emissions as reported in C6.5
97
Rationale for the coverage of your engagement
We expect our suppliers to conduct business in ways that protect and preserve the environment. At a minimum, we expect our su ppliers to meet applicable environmental laws, rules and regulations in their countries of operation and in all their facilities. The CCHBC Supplier Guiding Principles (SGP) communicate our values and expectations of compliance with all applicable laws, core intern ational conventions and emphasize the importance of responsible human and workplace practices. The Sustainable Agriculture Guiding Principles (SAGP) expand on the SGP and provide further guidance to our suppliers of agricultural ingredients in the areas of environment & management systems like water and energy management, climate, conservation of natural habitats and ecosystems, soil management, crop protection, responsible agro-chemical use, biodiversity, harvest and post-harvest handling, reproductive material identity, selection and handling, record keeping and transparency, business integrity etc. Scope 3 emissions which are included are coming from: Cold Drink Equipment suppliers, packaging and raw materials suppliers and outsources logistics suppliers.
Impact of engagement, including measures of success
The main agricultural raw materials in Coca-Cola HBC products are sugar and other natural sweeteners as well as juice concentrates we use for our juice products. We have a publicly communicated commitment to achieve an at least 95% sustainable supply of our agriculture commodities by 2020. In addition, we have developed an environmental, social and governance supplier pre-assessment process for our strategic buy segment which includes criteria for supplier selection. We maintain transparency throughout our supply base utilizing The Coca-Cola Company Supplier Guiding Principles compliance audits, membership of SEDEX and EcoVadis CSR Pl
Page 130 of 165
atform. Measure of success: 90% of the main agricultural suppliers have committed to set a roadmap and to comply with our Sus tainable Principles by 2020.
Comment
Type of engagement
Engagement & incentivization (changing supplier behavior)
Details of engagement
Other, please specify (Joint initiatives for CO2 decrease)
% of suppliers by number
12
% total procurement spend (direct and indirect)
61
% Scope 3 emissions as reported in C6.5
48
Rationale for the coverage of your engagement
To increase awareness of sustainability, engagement with strategic suppliers and the development of our people, we introduced new events, workshops and tools in 2017. We piloted three sustainability day events in 2017 with strategic suppliers in Zurich, Belgrade and Moscow, which created an opportunity to share information about our Company’s corporate social responsibility policy and sustainability commitments, share achievements and best practices, and begin working together on joint targets and initiatives. Consistent with our interest in developing our people and our suppliers, we developed workshops and training sessions for specific co mmodit
Page 131 of 165
ies for packaging, such as PET plastic and metals used for cans. The Ecovadis CSR platform, a third-party assessment tool, was introduced in 2017 to evaluate corporate social responsibility performance management systems for our suppliers. More than 120 c ritical suppliers have already been assessed using the platform. Scope 3 emissions include Packaging emissions, Raw material emission.
Impact of engagement, including measures of success
We have aligned with TCCC system Sustainable Agriculture Guiding Principles (SAGP) for certification of more than 95% of key agricultural commodities by 2020 supported by third party verification. By the end of 2017 almost all of our ingredient suppliers (sweeteners and juices) have committed road maps to achieve 100% of sustainable supply by 2020 or earlier as assessed by the SAI plat form Farm Sustainable assessment or other globally recognized sustainability certifications. As of 31 December 2017 we have achieved 33% of our key agricultural ingredients sourced sustainably. For 2018 our targets are to increase the percentage of sustain ably sourced sweeteners to estimated 65% and juices to 35% and having achieved this, we will reach 64% overall SAGP compliance for k ey agricultural ingredients managed by Coca-Cola HBC. We have launched our lightest beverage can, the ʻB-canʼ, which is an ultra-light can with 4.5% less material than the standard 33cl can. In 2015, we became the first Coca-Cola bottler to pilot the ʻB-canʼ in Serbia and Hungary, while today it is fully commercialized in Ireland. The new 330ml can weighs only 9.45g compared to its 10 g predecessor. In 2016, we went even further by introducing Sleek can which weight is 9.35gr in both Hungary and Serbia, while in Ita ly we were the first one in the Coca-Cola System globally to authorise the lightest 330ml sleek can at 9.3gr, which was later introduced in Russia as well. At the same time, we have introduced light weighed 202 CDDL/ISE ends in all countries with the only ones pendi ng being Nigeria, FYROM and Ukraine. Overall, by the end of 2017 we have converted approximately 85% of our 330ml can volume to 330ml sleek can which save CO2 emissions from packaging. As a result, while transitioning from 330ml STD to 330ml SLK, we have reduced the average weight of the can for bodies and ends from 12.8 gr in the beginning of 2016, to 12.4gr in 2017 and with firm plans to reach 12.0gr by the end of 2018. In addition to the ongoing focus on light-weighting projects for packaging, we will increase the use of recycled PET content. We are currently working on two joint value creation projects with our PET resin suppliers to develop the technology required to achieve this. Measure of success: at lest 50% of the procurement spent of the strategic suppliers to b e covered through our joint initiatives.
Comment
C12.1b
(C12.1b) Give details of your climate-related engagement strategy with your customers.
Page 132 of 165
Type of engagement
Education/information sharing
Details of engagement
Share information about your products and relevant certification schemes (i.e. Energy STAR)
Size of engagement
33
% Scope 3 emissions as reported in C6.5
15
Please explain the rationale for selecting this group of customers and scope of engagement
Currently at market place we have 33% of our total coolers' portfolio, equipped with Energy Management Device (EMD which is i nstalled by us for energy saving purposes) or are brand new models, very energy efficient (so called I -coolers). Their Scope 3 emissions: coming from electricity is 15% out of all Scope 3 emissions.
Impact of engagement, including measures of success
We train our sales force to raise awareness among our customers on the use of our coolers in order to save energy and carbon. Customers are prioritised based on their volume and contribution to NSR. We work with GfK to track the satisfaction levels of ou r customers and each year we perform customer satisfaction survey, which includes sustainability questions. The sample size in the 2017 GfK was 15.839 of our customers and 767 managers in 445 key accounts to give us a benchmark against other FMCG companies. We measure the % of customers who rate us as good and excellent. In the outlet survey of non-alcoholic ready-to-drink suppliers, 19 of our *25 surveyed countries achieved the position of number 1 supplier with the number 1 relationship. In a separate survey for key accounts, GfK reports in *20 countries: we are the number 1 supplier with the number 1 relationship, in 8 countries.
C-AC12.2/C-FB12.2/C-PF12.2
Page 133 of 165
(C-AC12.2/C-FB12.2/C-PF12.2) Do you encourage your suppliers to undertake any agricultural or forest management practices with climate change mitigation and/or adaptation benefits?
Yes
C-AC12.2a/C-FB12.2a/C-PF12.2a
(C-AC12.2a/C-FB12.2a/C-PF12.2a) Specify which agricultural or forest management practices with climate change mitigation and/or adaptation benefits you encourage your suppliers to undertake and describe your role in the implementation of each practice.
Management practice reference number
MP1
Management practice
Other, please specify (Water management)
Description of management practice
More than 80% of our sugar supply is beet sugar. As beet is 75% water, our strategic suppliers (Tereos, Suedzucker, Nordzucker & CristalCo) use this water in the sugar production process. Through this process, beet sugar producers use almost zero amount of water from the environment. Even if our Group Critical suppliers are not exposed to high risks related to water availability, we are working with them for further improvements. For example, we have been working with the Russian beet sugar industry to replace a s much imported cane sugar with local beet sugar as possible. Beet sugar needs c.50% less water to be produced than cane. As a re sult of our joint efforts and investment over $100million to increase local production of high-quality beet sugar our consumption in Russia is 100% from locally grown beet.
Page 134 of 165
Your role in the implementation
Knowledge sharing
Explanation of how you encourage implementation
We are working with our suppliers in all areas of sustainability including water. Group Critical Suppliers' exposure to water risks is an integral part of our annual supply base assessment (SBA). Focusing on water risk management we introduced an additional tool - Water Risk Filter (WRF). It quantifies water-related risks for all industries and all countries. The WRF was applied to 100% of our direct material suppliers and selected indirect suppliers where appropriate (Group Critical Suppliers). 138 suppliers were initial ly identified with high water risk and we are working directly with them to develop releasing a more comprehensive toolset from the platform. Water Management is a focus area in the TCCC System Sustainable Agriculture Guiding Principles (SAGP). We have a public commitment to comply against the SAGPs with at least 95% of our key agricultural ingredients by 2020 and we have in place a clear roadmap to reach it. In 2017, we achieved compliance rate of 33% with a target to be 64% compliant till end of 2018.
Climate change related benefit
Increasing resilience to climate change (adaptation) Other, please specify (Decrease water usage)
Comment
C-AC12.2b/C-FB12.2b/C-PF12.2b
(C-AC12.2b/C-FB12.2b/C-PF12.2b) Do you collect information from your suppliers about the outcomes of any implemented agricultural/forest management practices you have encouraged?
Yes
C12.3
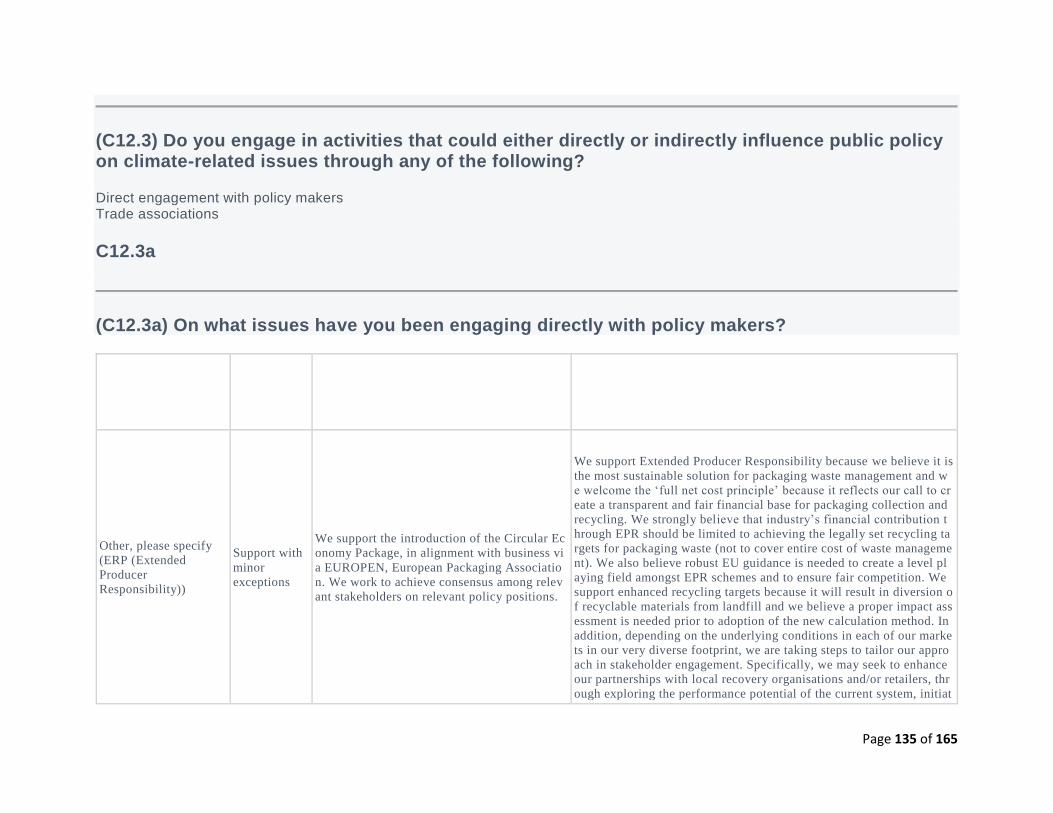
Page 135 of 165
(C12.3) Do you engage in activities that could either directly or indirectly influence public policy on climate-related issues through any of the following?
Direct engagement with policy makers Trade associations
C12.3a
(C12.3a) On what issues have you been engaging directly with policy makers?
Focus of legislation Corporate
position Details of engagement Proposed legislative solution
Other, please specify
(ERP (Extended
Producer
Responsibility))
Support with
minor
exceptions
We support the introduction of the Circular Ec
onomy Package, in alignment with business vi
a EUROPEN, European Packaging Associatio
n. We work to achieve consensus among relev
ant stakeholders on relevant policy positions.
We support Extended Producer Responsibility because we believe it is
the most sustainable solution for packaging waste management and w
e welcome the ‘full net cost principle’ because it reflects our call to cr
eate a transparent and fair financial base for packaging collection and
recycling. We strongly believe that industry’s financial contribution t
hrough EPR should be limited to achieving the legally set recycling ta
rgets for packaging waste (not to cover entire cost of waste manageme
nt). We also believe robust EU guidance is needed to create a level pl
aying field amongst EPR schemes and to ensure fair competition. We
support enhanced recycling targets because it will result in diversion o
f recyclable materials from landfill and we believe a proper impact ass
essment is needed prior to adoption of the new calculation method. In
addition, depending on the underlying conditions in each of our marke
ts in our very diverse footprint, we are taking steps to tailor our appro
ach in stakeholder engagement. Specifically, we may seek to enhance
our partnerships with local recovery organisations and/or retailers, thr
ough exploring the performance potential of the current system, initiat
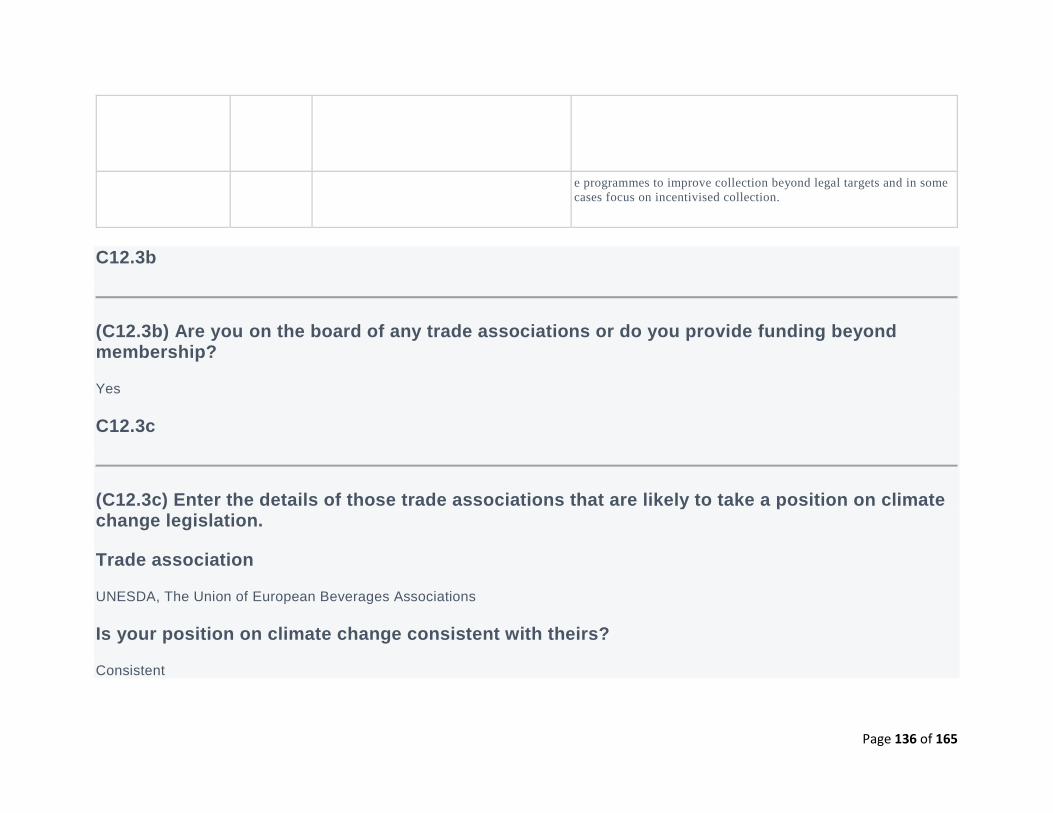
Page 136 of 165
Focus of legislation Corporate
position Details of engagement Proposed legislative solution
e programmes to improve collection beyond legal targets and in some
cases focus on incentivised collection.
C12.3b
(C12.3b) Are you on the board of any trade associations or do you provide funding beyond membership?
Yes
C12.3c
(C12.3c) Enter the details of those trade associations that are likely to take a position on climate change legislation.
Trade association
UNESDA, The Union of European Beverages Associations
Is your position on climate change consistent with theirs?
Consistent
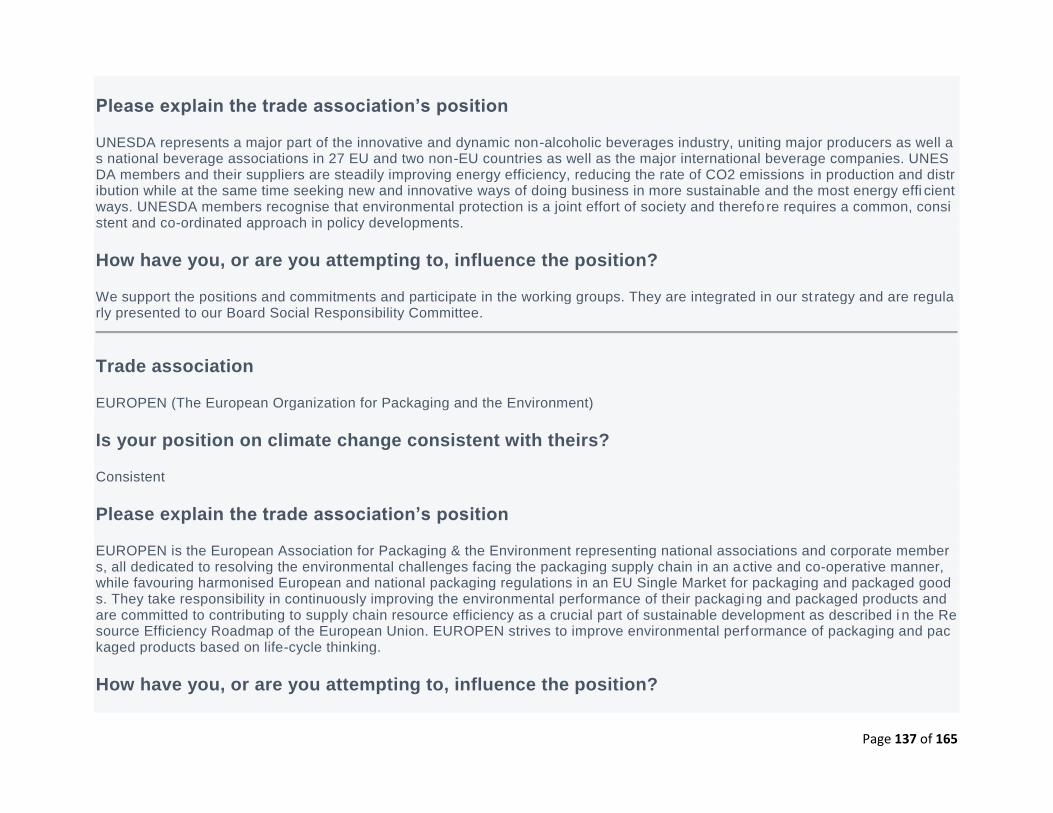
Page 137 of 165
Please explain the trade association’s position
UNESDA represents a major part of the innovative and dynamic non-alcoholic beverages industry, uniting major producers as well as national beverage associations in 27 EU and two non-EU countries as well as the major international beverage companies. UNESDA members and their suppliers are steadily improving energy efficiency, reducing the rate of CO2 emissions in production and distribution while at the same time seeking new and innovative ways of doing business in more sustainable and the most energy effi cient ways. UNESDA members recognise that environmental protection is a joint effort of society and therefo re requires a common, consistent and co-ordinated approach in policy developments.
How have you, or are you attempting to, influence the position?
We support the positions and commitments and participate in the working groups. They are integrated in our st rategy and are regularly presented to our Board Social Responsibility Committee.
Trade association
EUROPEN (The European Organization for Packaging and the Environment)
Is your position on climate change consistent with theirs?
Consistent
Please explain the trade association’s position
EUROPEN is the European Association for Packaging & the Environment representing national associations and corporate members, all dedicated to resolving the environmental challenges facing the packaging supply chain in an active and co-operative manner, while favouring harmonised European and national packaging regulations in an EU Single Market for packaging and packaged goods. They take responsibility in continuously improving the environmental performance of their packaging and packaged products and are committed to contributing to supply chain resource efficiency as a crucial part of sustainable development as described i n the Resource Efficiency Roadmap of the European Union. EUROPEN strives to improve environmental performance of packaging and packaged products based on life-cycle thinking.
How have you, or are you attempting to, influence the position?
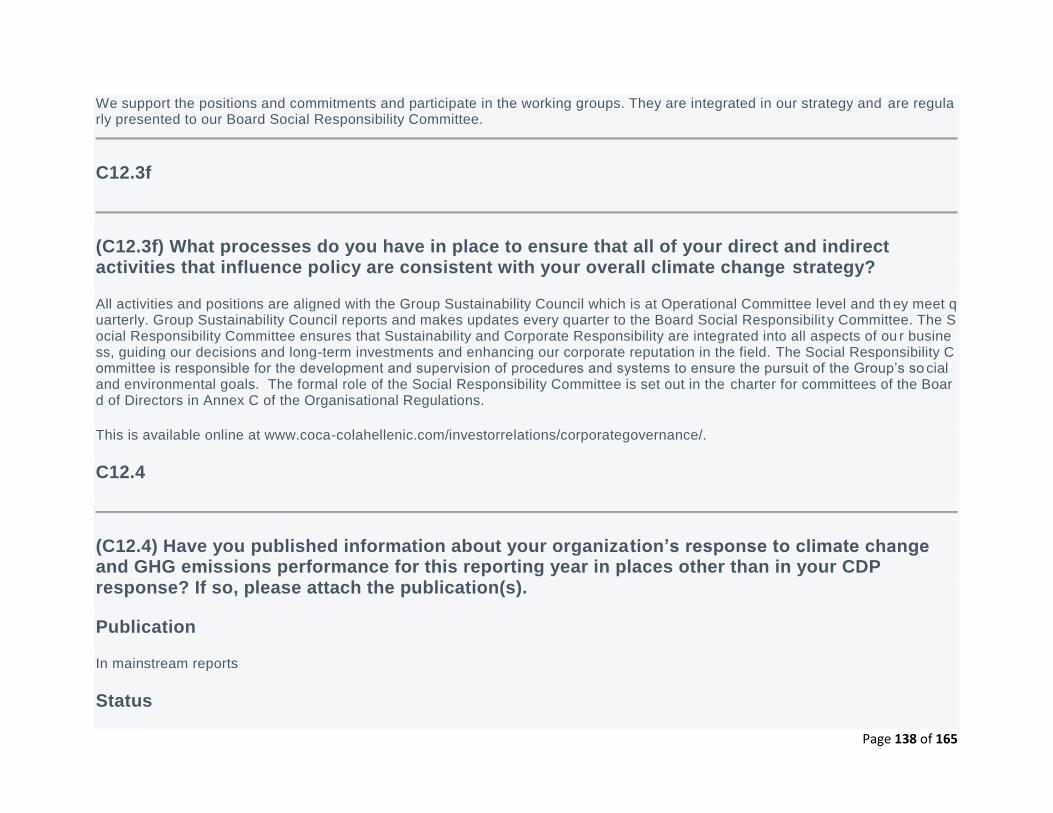
Page 138 of 165
We support the positions and commitments and participate in the working groups. They are integrated in our strategy and are regularly presented to our Board Social Responsibility Committee.
C12.3f
(C12.3f) What processes do you have in place to ensure that all of your direct and indirect activities that influence policy are consistent with your overall climate change strategy?
All activities and positions are aligned with the Group Sustainability Council which is at Operational Committee level and th ey meet quarterly. Group Sustainability Council reports and makes updates every quarter to the Board Social Responsibilit y Committee. The Social Responsibility Committee ensures that Sustainability and Corporate Responsibility are integrated into all aspects of ou r business, guiding our decisions and long-term investments and enhancing our corporate reputation in the field. The Social Responsibility Committee is responsible for the development and supervision of procedures and systems to ensure the pursuit of the Group’s so cial and environmental goals. The formal role of the Social Responsibility Committee is set out in the charter for committees of the Board of Directors in Annex C of the Organisational Regulations.
This is available online at www.coca-colahellenic.com/investorrelations/corporategovernance/.
C12.4
(C12.4) Have you published information about your organization’s response to climate change and GHG emissions performance for this reporting year in places other than in your CDP response? If so, please attach the publication(s).
Publication
In mainstream reports
Status
Page 139 of 165
Complete
Attach the document
2017_IAR.PDF
Content elements
Governance Strategy Risks & opportunities Emissions figures Emission targets
C13. Other land management impacts
C-AC13.2/C-FB13.2/C-PF13.2
(C-AC13.2/C-FB13.2/C-PF13.2) Do you know if any of the management practices mentioned in C-AC12.2a/C-FB12.2a/C-PF12.2a that were implemented by your suppliers have other impacts besides climate change mitigation/adaptation?
No
C14. Signoff
C-FI
Page 140 of 165
(C-FI) Use this field to provide any additional information or context that you feel is relevant to your organization's response. Please note that this field is optional and is not scored.
C14.1
(C14.1) Provide details for the person that has signed off (approved) your CDP climate change response.
Job title Corresponding job category
Row 1 CFO of Coca-Cola HBC AG Chief Financial Officer (CFO)
SC. Supply chain module
SC0.0
(SC0.0) If you would like to do so, please provide a separate introduction to this module.
Coca-Cola HBC is one of the world’s largest bottlers of drinks from The Coca Cola Company and our business has a strong foundation for long-term growth. Coca-Cola HBC (Coca-Cola Hellenic Bottling Company) is a bottling partner of The Coca-Cola Company. This means that The Coca-Cola Company manufactures and sells concentrates, bases and syrups to its bottling partners, owns the brands and is responsible for consumer brand marketing initiatives. We use the concentrates and syrups to manufacture, package, me
Page 141 of 165
rchandise and distribute the final branded products to our trade partners and consumers. Selling more than 2.1 billion unit c ases every year – that’s 50 billion servings – we’re one of the world’s largest bottlers of The Coca-Cola Company’s brands. We operate in 28 countries, serving 600 million potential consumers across three continents
SC0.1
(SC0.1) What is your company’s annual revenue for the stated reporting period?
Annual Revenue
Row 1 6522035273
SC0.2
(SC0.2) Do you have an ISIN for your company that you would be willing to share with CDP?
Yes
SC0.2a
(SC0.2a) Please use the table below to share your ISIN.
Page 142 of 165
ISIN country code (2 letters) ISIN numeric identifier and single check digit (10 numbers
overall)
Row 1 CH 0198251305
SC1.1
(SC1.1) Allocate your emissions to your customers listed below according to the goods or services you have sold them in this reporting period.
Requesting member
Amdocs Ltd
Scope of emissions
Scope 1
Emissions in metric tonnes of CO2e
0.22
Uncertainty (±%)
2
Major sources of emissions
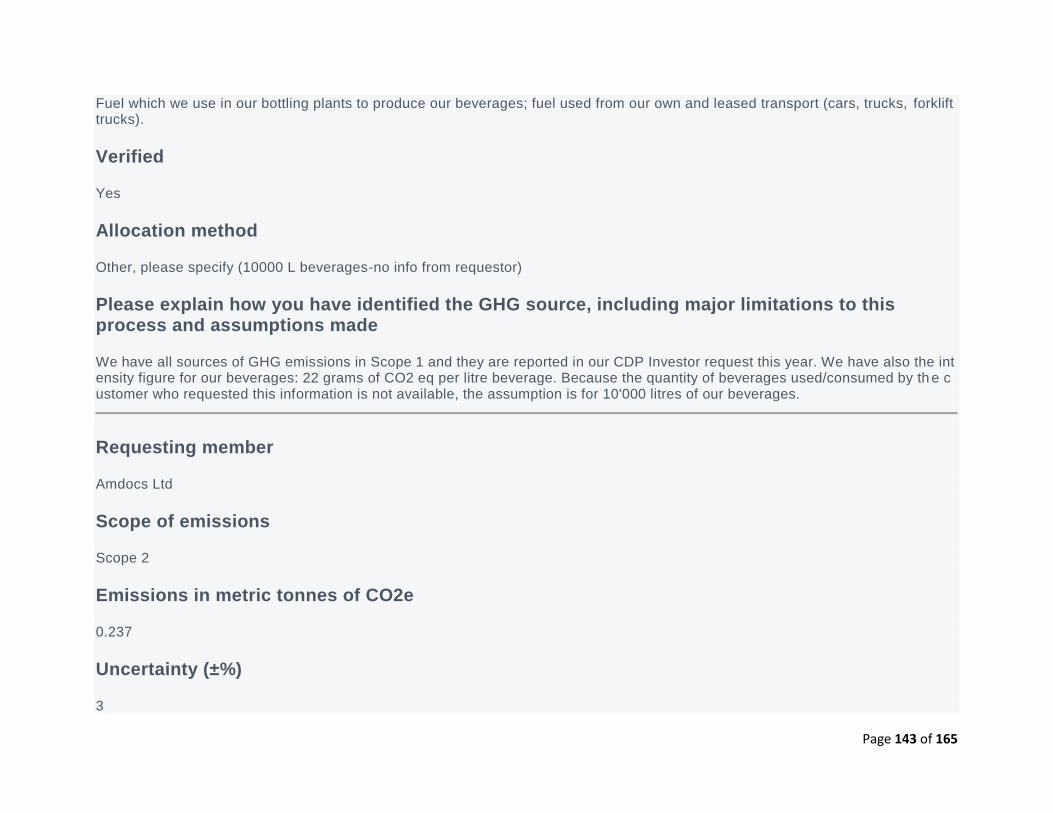
Page 143 of 165
Fuel which we use in our bottling plants to produce our beverages; fuel used from our own and leased transport (cars, trucks, forklift trucks).
Verified
Yes
Allocation method
Other, please specify (10000 L beverages-no info from requestor)
Please explain how you have identified the GHG source, including major limitations to this process and assumptions made
We have all sources of GHG emissions in Scope 1 and they are reported in our CDP Investor request this year. We have also the intensity figure for our beverages: 22 grams of CO2 eq per litre beverage. Because the quantity of beverages used/consumed by th e customer who requested this information is not available, the assumption is for 10'000 litres of our beverages.
Requesting member
Amdocs Ltd
Scope of emissions
Scope 2
Emissions in metric tonnes of CO2e
0.237
Uncertainty (±%)
3
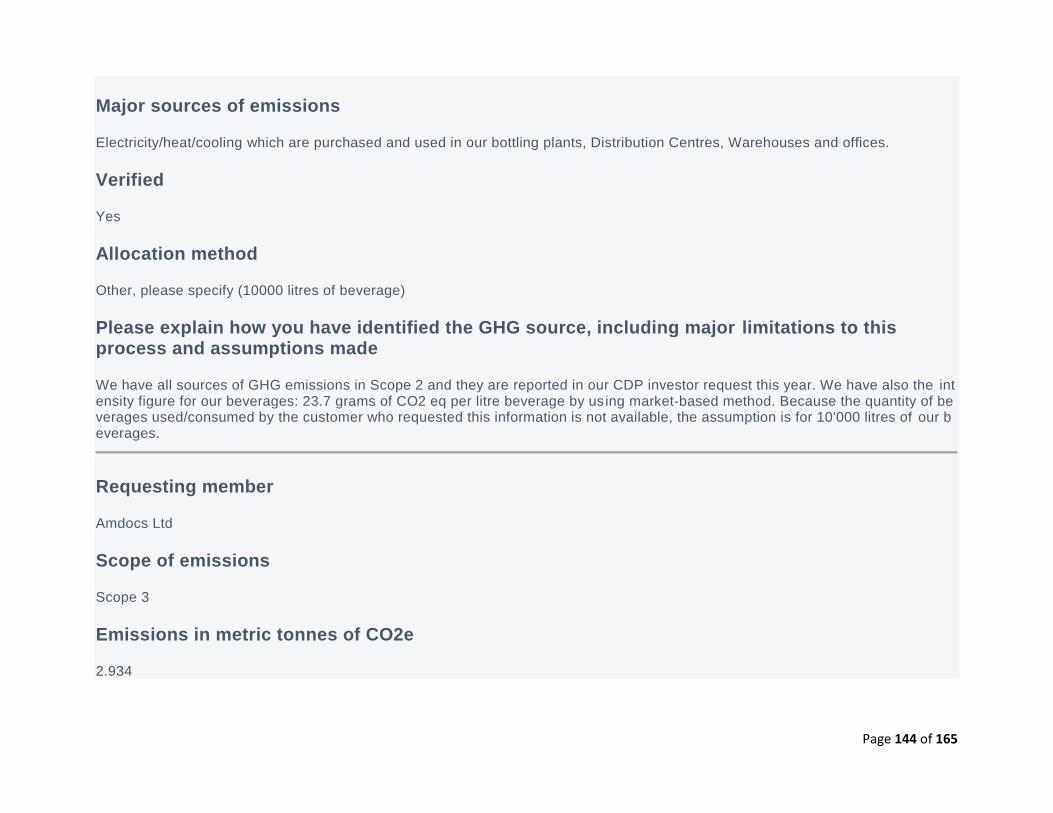
Page 144 of 165
Major sources of emissions
Electricity/heat/cooling which are purchased and used in our bottling plants, Distribution Centres, Warehouses and offices.
Verified
Yes
Allocation method
Other, please specify (10000 litres of beverage)
Please explain how you have identified the GHG source, including major limitations to this process and assumptions made
We have all sources of GHG emissions in Scope 2 and they are reported in our CDP investor request this year. We have also the intensity figure for our beverages: 23.7 grams of CO2 eq per litre beverage by using market-based method. Because the quantity of beverages used/consumed by the customer who requested this information is not available, the assumption is for 10'000 litres of our beverages.
Requesting member
Amdocs Ltd
Scope of emissions
Scope 3
Emissions in metric tonnes of CO2e
2.934
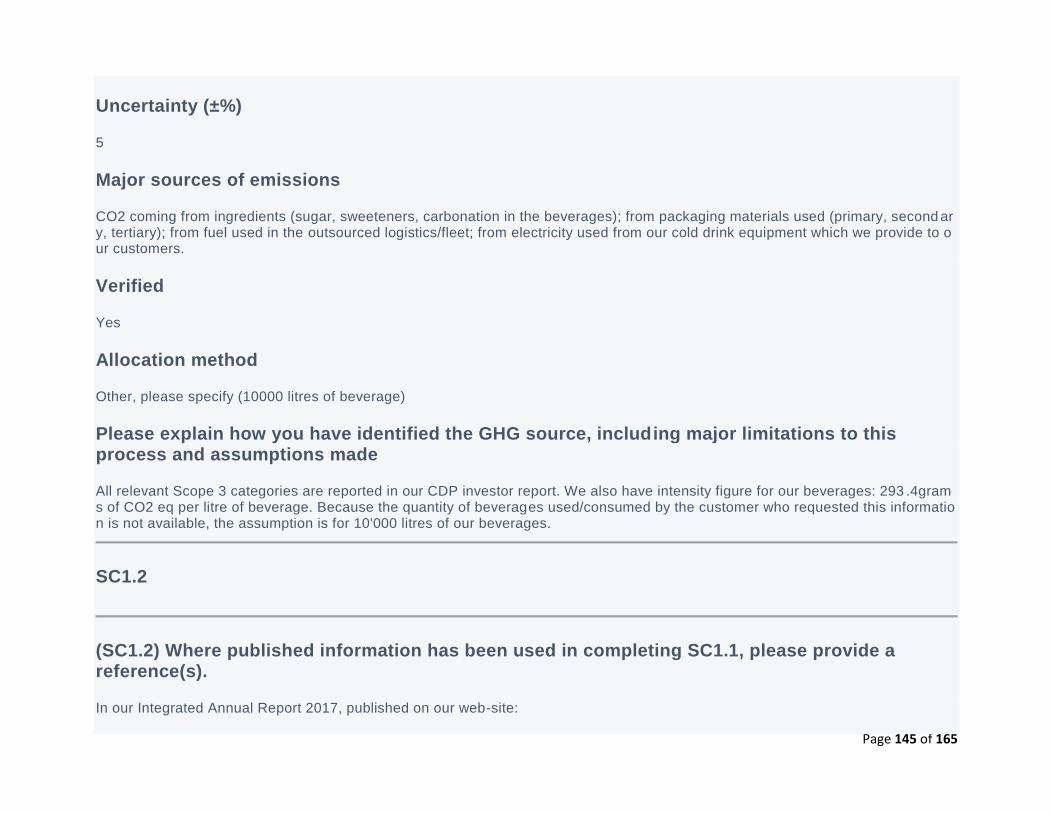
Page 145 of 165
Uncertainty (±%)
5
Major sources of emissions
CO2 coming from ingredients (sugar, sweeteners, carbonation in the beverages); from packaging materials used (primary, second ary, tertiary); from fuel used in the outsourced logistics/fleet; from electricity used from our cold drink equipment which we provide to our customers.
Verified
Yes
Allocation method
Other, please specify (10000 litres of beverage)
Please explain how you have identified the GHG source, including major limitations to this process and assumptions made
All relevant Scope 3 categories are reported in our CDP investor report. We also have intensity figure for our beverages: 293 .4grams of CO2 eq per litre of beverage. Because the quantity of beverages used/consumed by the customer who requested this information is not available, the assumption is for 10'000 litres of our beverages.
SC1.2
(SC1.2) Where published information has been used in completing SC1.1, please provide a reference(s).
In our Integrated Annual Report 2017, published on our web-site:
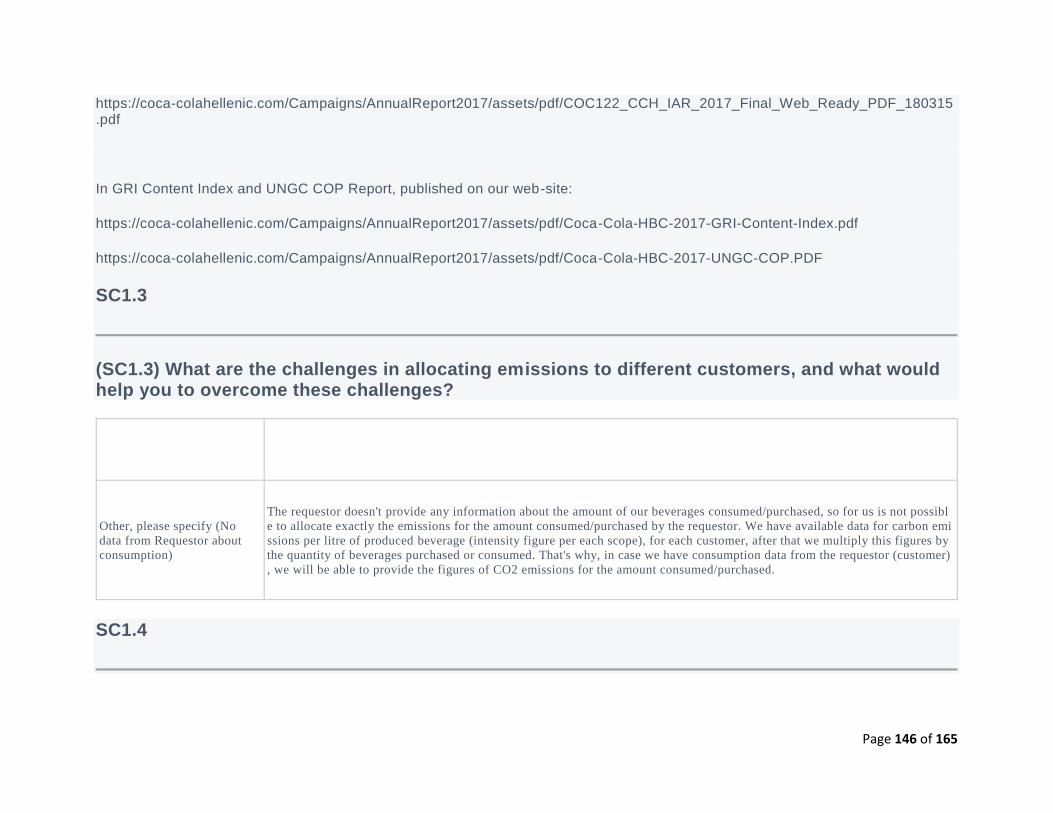
Page 146 of 165
https://coca-colahellenic.com/Campaigns/AnnualReport2017/assets/pdf/COC122_CCH_IAR_2017_Final_Web_Ready_PDF_180315.pdf
In GRI Content Index and UNGC COP Report, published on our web-site:
https://coca-colahellenic.com/Campaigns/AnnualReport2017/assets/pdf/Coca-Cola-HBC-2017-GRI-Content-Index.pdf
https://coca-colahellenic.com/Campaigns/AnnualReport2017/assets/pdf/Coca-Cola-HBC-2017-UNGC-COP.PDF
SC1.3
(SC1.3) What are the challenges in allocating emissions to different customers, and what would help you to overcome these challenges?
Allocation challenges Please explain what would help you overcome these challenges
Other, please specify (No
data from Requestor about
consumption)
The requestor doesn't provide any information about the amount of our beverages consumed/purchased, so for us is not possibl
e to allocate exactly the emissions for the amount consumed/purchased by the requestor. We have available data for carbon emi
ssions per litre of produced beverage (intensity figure per each scope), for each customer, after that we multiply this figures by
the quantity of beverages purchased or consumed. That's why, in case we have consumption data from the requestor (customer)
, we will be able to provide the figures of CO2 emissions for the amount consumed/purchased.
SC1.4
Page 147 of 165
(SC1.4) Do you plan to develop your capabilities to allocate emissions to your customers in the future?
Yes
SC1.4a
(SC1.4a) Describe how you plan to develop your capabilities.
By working for more comprehensive LCA and Products Environmental Footprint with internal resources and by using external experts.
SC2.1
(SC2.1) Please propose any mutually beneficial climate-related projects you could collaborate on with specific CDP Supply Chain members.
Requesting member
Amdocs Ltd
Group type of project
Other, please specify (Packaging Waste segregation and recovery)
Type of project
Other, please specify (Packaging Waste segregation and recovery)
Page 148 of 165
Emissions targeted
Actions that would reduce both our own and our customers’ emissions
Estimated timeframe for carbon reductions to be realized
1-3 years
Estimated lifetime CO2e savings
1
Estimated payback
1-3 years
Details of proposal
To collect separately all PET bottles from our beverages they consume, all Aluminum cans and glass bottles. Collection, recovery and recycling of our packages is one of our key focus areas and it helps in reducing the landfill waste and decrease emissions ( as materials are reused or recycled). Possible CO2 eq saving for the assumed quantity of our products is 1-2 tonnes of packaging.
Requesting member
Amdocs Ltd
Group type of project
Other, please specify (Use our energy efficient HFC-free cooler)
Type of project
Other, please specify (Use our energy efficient HFC-free cooler)
Page 149 of 165
Emissions targeted
Actions that would reduce both our own and our customers’ emissions
Estimated timeframe for carbon reductions to be realized
1-3 years
Estimated lifetime CO2e savings
3
Estimated payback
1-3 years
Details of proposal
By using our efficient cooler, the customer will save electricity, which is Scope 2 for the customer, Scope 3 for us. Saving wil l be 2kWh electricity per cooler, which annually would be 17'520 kWh or 4.4 tonnes of CO2 per cooler annually (assuming the grid fa ctor is 250g/KWh). In addition, these new coolers' models are HFC-free (they use either HC or CO2 as a refrigerant gas).
SC2.2
(SC2.2) Have requests or initiatives by CDP Supply Chain members prompted your organization to take organizational-level emissions reduction initiatives?
No
SC3.1
Page 150 of 165
(SC3.1) Do you want to enroll in the 2018-2019 CDP Action Exchange initiative?
Yes
SC3.1a
(SC3.1a) Identify which member(s), if any, have motivated you to take part in Action Exchange this year.
Please select
SC3.1b
(SC3.1b) Select the types of emissions reduction activities that your company would like support in analyzing or in implementing in the next reporting year.
Energy efficiency: Processes Low-carbon energy purchase Low-carbon energy installation Transportation: fleet Behavioral change Green project finance
SC3.1c
(SC3.1c) As part of Action Exchange, would you like facility level analysis?
Page 151 of 165
No
SC3.2
(SC3.2) Is your company a participating supplier in CDP’s 2017-2018 Action Exchange initiative?
No
SC4.1
(SC4.1) Are you providing product level data for your organization’s goods or services, if so, what functionality will you be using?
Yes, I will provide data
SC4.1a
(SC4.1a) Give the overall percentage of total emissions, for all Scopes, that are covered by these products.
41
SC4.2a
(SC4.2a) Complete the following table for the goods/services for which you want to provide data.
Page 152 of 165
Name of good/ service
Coca-Cola (all packaging and sizes)
Description of good/ service
Coca-Cola soft drink (carbonated non-alcoholic ready to drink beverage)
Type of product
Final
SKU (Stock Keeping Unit)
Coca-Cola 1 litre.
Total emissions in kg CO2e per unit
0.14
±% change from previous figure supplied
-5.6
Date of previous figure supplied
July 30 2017
Explanation of change
Decrease is due to our reduction activities in the whole value chain, the thorough process we have for carbon performance rev iew and big focus on carbon/energy saving.
Page 153 of 165
Methods used to estimate lifecycle emissions
GHG Protocol Product Accounting & Reporting Standard
SC4.2b
(SC4.2b) Complete the following table with data for lifecycle stages of your goods and/or services.
Name of good/ service
Coca-Cola 1 litre, however due to the unit of measure that CDP requires (kg CO2eq/unit) and the limit space for the figure (allowing only 2 digits after the decimal place), the data will be given for 100 litre product.
Please select the scope
Scope 1
Please select the lifecycle stage
Production
Emissions at the lifecycle stage in kg CO2e per unit
0.33
Is this stage under your ownership or control?
Yes
Page 154 of 165
Type of data used
Primary
Data quality
Data are average for all Coca-Cola pack sizes and types. The emissions here are from the fossil fuel used in our bottling plants - we have a system for measurement and reporting monthly of all fuel quantity per type of fuel. The amount of fuel used is multiplied by the respective CO2 factor.
If you are verifying/assuring this product emission data, please tell us how
Our company carbon footprint data are checked and verified by an independent third-party company in accordance with the AA1000AS Assurance Standard: high assurance.
Name of good/ service
Coca-Cola 1 litre, however due to the unit of measure that CDP requires (kg CO2eq/unit) and the limit space for the figure (allowing only 2 digits after the decimal place), the data will be given for 100 litre product.
Please select the scope
Scope 1
Please select the lifecycle stage
Transportation
Emissions at the lifecycle stage in kg CO2e per unit
0.35
Is this stage under your ownership or control?
Page 155 of 165
Yes
Type of data used
Primary
Data quality
Data are average for all Coke brands (Coca-Cola, Coca-Cola Light and Coca-Cola Zero), pack sizes and types. The emissions here are from our own fleet/transport (from fossil fuels) - we have a system for measurement and reporting monthly of fuel used for transportation (per fuel type).
If you are verifying/assuring this product emission data, please tell us how
Our company carbon footprint data are checked and verified by an independent third-party company in accordance with the AA1000AS Assurance Standard: high assurance
Name of good/ service
Coca-Cola 1 litre, however due to the unit of measure that CDP requires (kg CO2eq/unit) and the limit space for the figure (allowing only 2 digits after the decimal place), the data will be given for 100 litre product.
Please select the scope
Scope 1
Please select the lifecycle stage
Storage
Emissions at the lifecycle stage in kg CO2e per unit
0.05
Page 156 of 165
Is this stage under your ownership or control?
Yes
Type of data used
Primary
Data quality
Data are average for all Coke brands (Coca-Cola, Coca-Cola Light and Coca-Cola Zero), pack sizes and types. The emissions here are from coolants in Cold Drink Equipment we own, and which is used for storage of our products on the market place. We have primary data for all coolant leakages and we know the coolant type per cooler, so the leak qty is multiplied by the respective c oolant's carbon factor.
If you are verifying/assuring this product emission data, please tell us how
Our company carbon footprint data are checked and verified by an independent third-party company in accordance with the AA1000AS Assurance Standard: high assurance.
Name of good/ service
Coca-Cola 1 litre, however due to the unit of measure that CDP requires (kg CO2eq/unit) and the limit space for the figure (allowing only 2 digits after the decimal place), the data will be given for 100 litre product.
Please select the scope
Scope 1
Please select the lifecycle stage
Other, please specify (CO2 Lossesed from beverage' carbonation)
Page 157 of 165
Emissions at the lifecycle stage in kg CO2e per unit
0.15
Is this stage under your ownership or control?
Yes
Type of data used
Primary
Data quality
Data are average for all Coke brands (Coca-Cola, Coca-Cola Light and Coca-Cola Zero), pack sizes and types. The emissions here are from CO2 losses (from product carbonation) during manufacturing process in our bottling plants - weekly data are monitored and reported. After that it is multiplied by CO2 factor.
If you are verifying/assuring this product emission data, please tell us how
Our company carbon footprint data are checked and verified by an independent third-party company in accordance with the AA1000AS Assurance Standard: high assurance.
Name of good/ service
Coca-Cola 1 litre, however due to the unit of measure that CDP requires (kg CO2eq/unit) and the limit space for the figure (allowi ng only 2 digits after the decimal place), the data will be given for 100 litre product.
Please select the scope
Scope 1
Please select the lifecycle stage
Page 158 of 165
Other, please specify (Fuel used in remote properties )
Emissions at the lifecycle stage in kg CO2e per unit
0.04
Is this stage under your ownership or control?
Yes
Type of data used
Primary
Data quality
Data are average for all Coke brands (Coca-Cola, Coca-Cola Light and Coca-Cola Zero), pack sizes and types. The emissions here are from the fuel used in our remote properties (Distribution centres, warehouses, offices) which are not part of manufacturing facilities - there is a system for quarterly monitoring&reporting.
If you are verifying/assuring this product emission data, please tell us how
Our company carbon footprint data are checked and verified by an independent third-party company in accordance with the AA1000AS Assurance Standard: high assurance.
Name of good/ service
Coca-Cola 1 litre, however due to the unit of measure that CDP requires (kg CO2eq/unit) and the limit space for the figure (allowi ng only 2 digits after the decimal place), the data will be given for 100 litre product.
Please select the scope
Scope 2
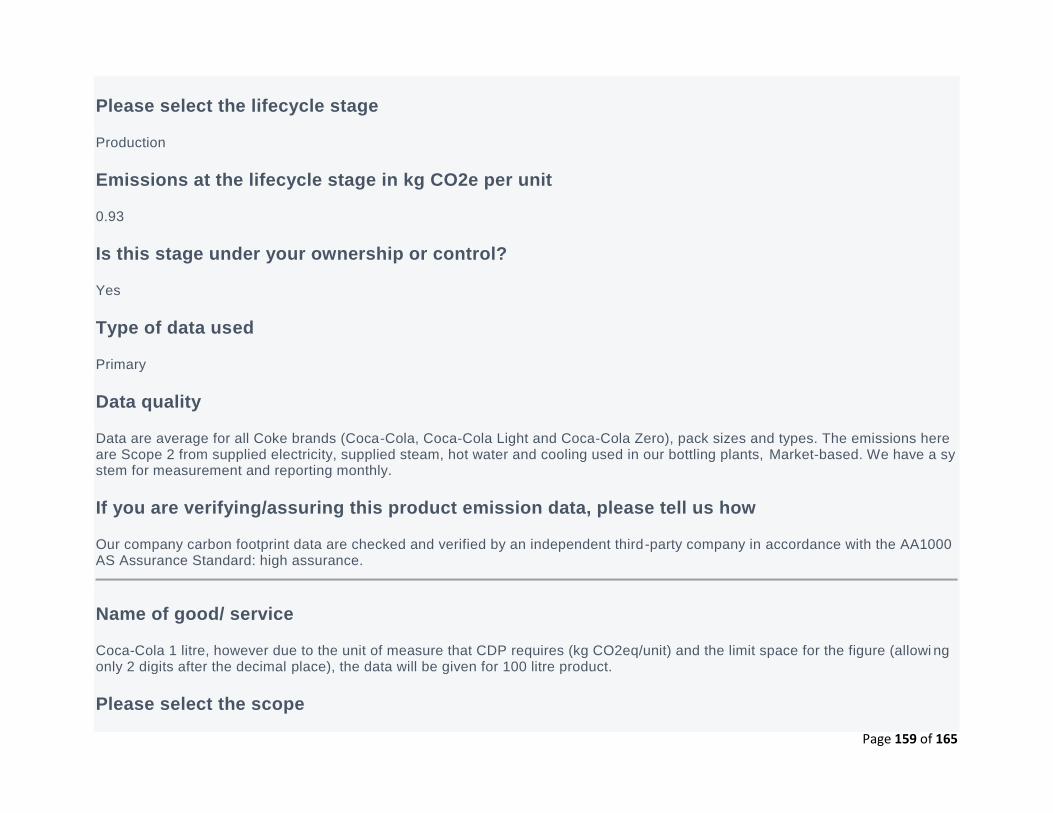
Page 159 of 165
Please select the lifecycle stage
Production
Emissions at the lifecycle stage in kg CO2e per unit
0.93
Is this stage under your ownership or control?
Yes
Type of data used
Primary
Data quality
Data are average for all Coke brands (Coca-Cola, Coca-Cola Light and Coca-Cola Zero), pack sizes and types. The emissions here are Scope 2 from supplied electricity, supplied steam, hot water and cooling used in our bottling plants, Market-based. We have a system for measurement and reporting monthly.
If you are verifying/assuring this product emission data, please tell us how
Our company carbon footprint data are checked and verified by an independent third-party company in accordance with the AA1000AS Assurance Standard: high assurance.
Name of good/ service
Coca-Cola 1 litre, however due to the unit of measure that CDP requires (kg CO2eq/unit) and the limit space for the figure (allowi ng only 2 digits after the decimal place), the data will be given for 100 litre product.
Please select the scope
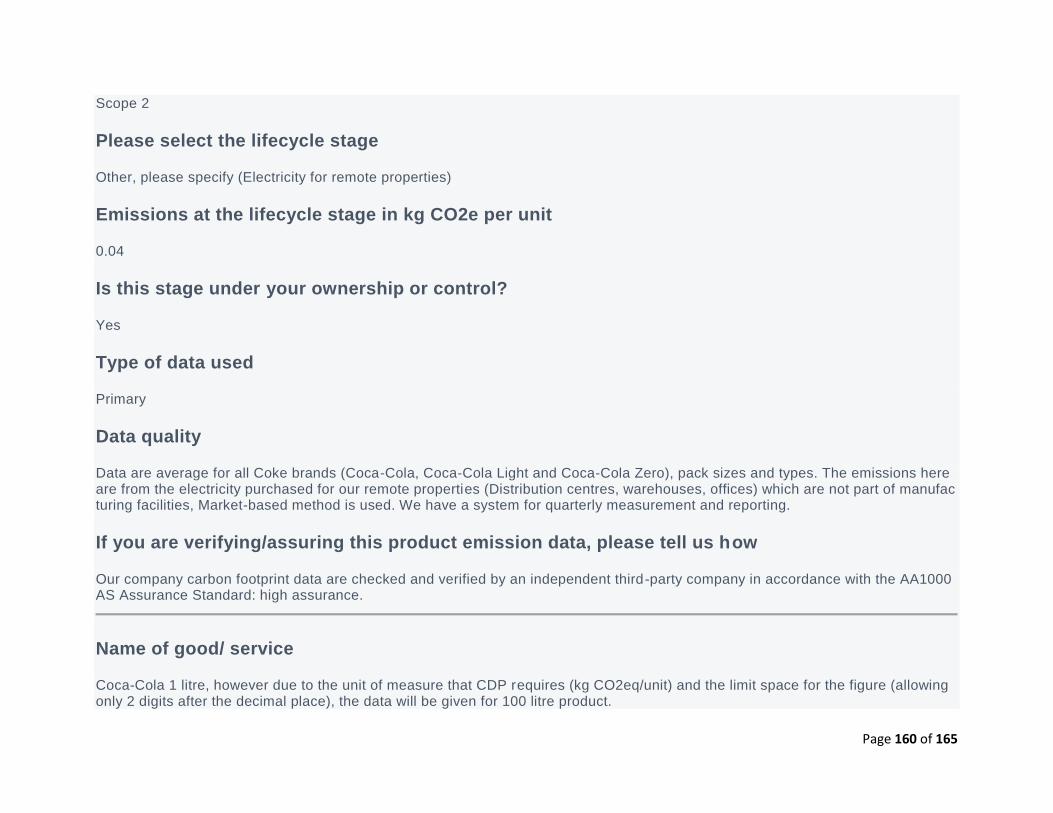
Page 160 of 165
Scope 2
Please select the lifecycle stage
Other, please specify (Electricity for remote properties)
Emissions at the lifecycle stage in kg CO2e per unit
0.04
Is this stage under your ownership or control?
Yes
Type of data used
Primary
Data quality
Data are average for all Coke brands (Coca-Cola, Coca-Cola Light and Coca-Cola Zero), pack sizes and types. The emissions here are from the electricity purchased for our remote properties (Distribution centres, warehouses, offices) which are not part of manufacturing facilities, Market-based method is used. We have a system for quarterly measurement and reporting.
If you are verifying/assuring this product emission data, please tell us how
Our company carbon footprint data are checked and verified by an independent third-party company in accordance with the AA1000AS Assurance Standard: high assurance.
Name of good/ service
Coca-Cola 1 litre, however due to the unit of measure that CDP requires (kg CO2eq/unit) and the limit space for the figure (allowing only 2 digits after the decimal place), the data will be given for 100 litre product.
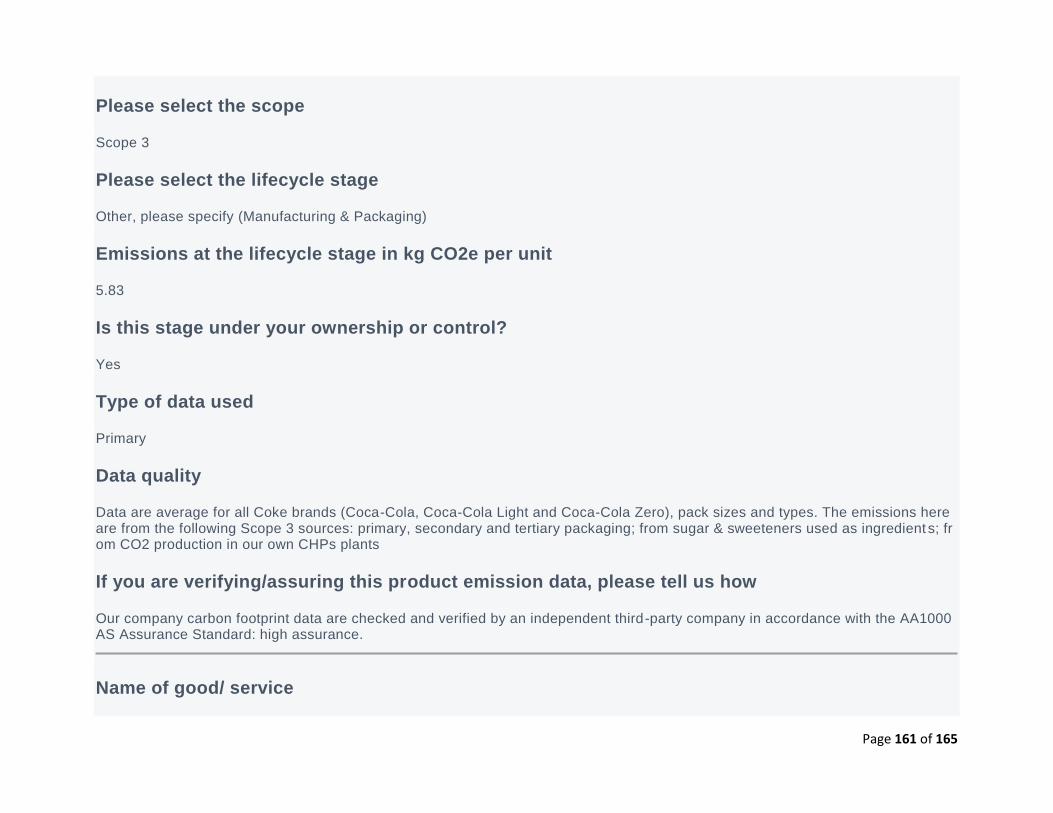
Page 161 of 165
Please select the scope
Scope 3
Please select the lifecycle stage
Other, please specify (Manufacturing & Packaging)
Emissions at the lifecycle stage in kg CO2e per unit
5.83
Is this stage under your ownership or control?
Yes
Type of data used
Primary
Data quality
Data are average for all Coke brands (Coca-Cola, Coca-Cola Light and Coca-Cola Zero), pack sizes and types. The emissions here are from the following Scope 3 sources: primary, secondary and tertiary packaging; from sugar & sweeteners used as ingredient s; from CO2 production in our own CHPs plants
If you are verifying/assuring this product emission data, please tell us how
Our company carbon footprint data are checked and verified by an independent third-party company in accordance with the AA1000AS Assurance Standard: high assurance.
Name of good/ service
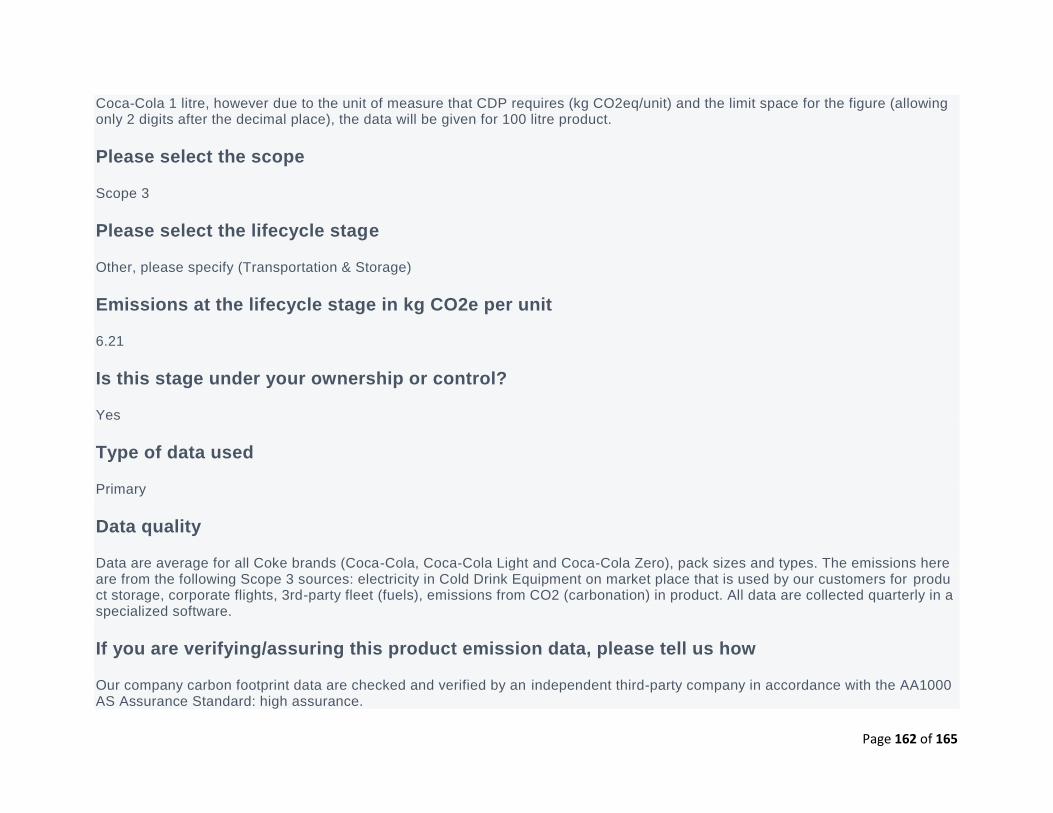
Page 162 of 165
Coca-Cola 1 litre, however due to the unit of measure that CDP requires (kg CO2eq/unit) and the limit space for the figure (allowing only 2 digits after the decimal place), the data will be given for 100 litre product.
Please select the scope
Scope 3
Please select the lifecycle stage
Other, please specify (Transportation & Storage)
Emissions at the lifecycle stage in kg CO2e per unit
6.21
Is this stage under your ownership or control?
Yes
Type of data used
Primary
Data quality
Data are average for all Coke brands (Coca-Cola, Coca-Cola Light and Coca-Cola Zero), pack sizes and types. The emissions here are from the following Scope 3 sources: electricity in Cold Drink Equipment on market place that is used by our customers for product storage, corporate flights, 3rd-party fleet (fuels), emissions from CO2 (carbonation) in product. All data are collected quarterly in a specialized software.
If you are verifying/assuring this product emission data, please tell us how
Our company carbon footprint data are checked and verified by an independent third-party company in accordance with the AA1000AS Assurance Standard: high assurance.
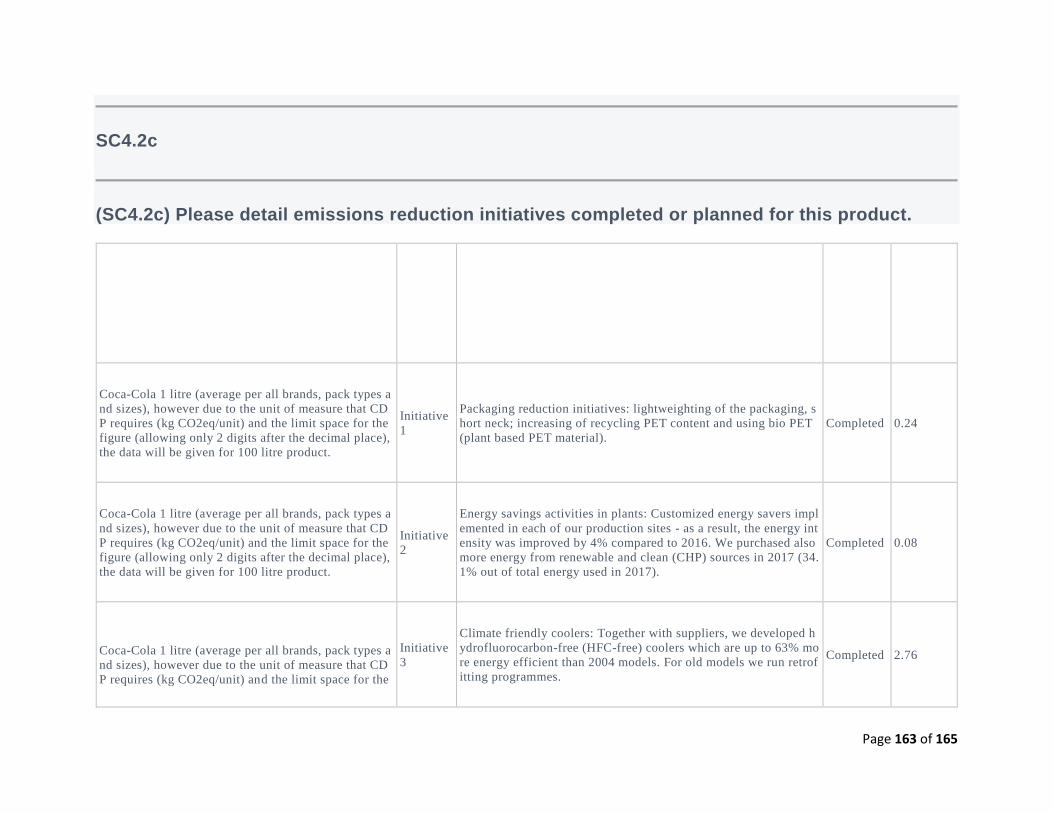
Page 163 of 165
SC4.2c
(SC4.2c) Please detail emissions reduction initiatives completed or planned for this product.
Name of good/ service Initiative
ID Description of initiative
Completed
or planned
Emission
reductions
in kg
CO2e per
unit
Coca-Cola 1 litre (average per all brands, pack types a
nd sizes), however due to the unit of measure that CD
P requires (kg CO2eq/unit) and the limit space for the
figure (allowing only 2 digits after the decimal place),
the data will be given for 100 litre product.
Initiative
1
Packaging reduction initiatives: lightweighting of the packaging, s
hort neck; increasing of recycling PET content and using bio PET
(plant based PET material).
Completed 0.24
Coca-Cola 1 litre (average per all brands, pack types a
nd sizes), however due to the unit of measure that CD
P requires (kg CO2eq/unit) and the limit space for the
figure (allowing only 2 digits after the decimal place),
the data will be given for 100 litre product.
Initiative
2
Energy savings activities in plants: Customized energy savers impl
emented in each of our production sites - as a result, the energy int
ensity was improved by 4% compared to 2016. We purchased also
more energy from renewable and clean (CHP) sources in 2017 (34.
1% out of total energy used in 2017).
Completed 0.08
Coca-Cola 1 litre (average per all brands, pack types a
nd sizes), however due to the unit of measure that CD
P requires (kg CO2eq/unit) and the limit space for the
Initiative
3
Climate friendly coolers: Together with suppliers, we developed h
ydrofluorocarbon-free (HFC-free) coolers which are up to 63% mo
re energy efficient than 2004 models. For old models we run retrof
itting programmes.
Completed 2.76
Page 164 of 165
Name of good/ service Initiative
ID Description of initiative
Completed
or planned
Emission
reductions
in kg
CO2e per
unit
figure (allowing only 2 digits after the decimal place),
the data will be given for 100 litre product.
SC4.2d
(SC4.2d) Have any of the initiatives described in SC4.2c been driven by requesting CDP Supply Chain members?
No
Submit your response
In which language are you submitting your response?
English
Please confirm below
I have read and accept the applicable Terms
• C0. Introduction
Page 165 of 165
o C0.1C0.2C0.3C0.4C0.5C-AC0.6/C-FB0.6/C-PF0.6C-AC0.6b/C-FB0.6b/C-PF0.6bC-AC0.6d/C-FB0.6d/C-PF0.6dC-AC0.7/C-FB0.7/C-PF0.7C1. Governance
o C1.1C1.1aC1.1bC1.2C1.2aC1.3C1.3aC2. Risks and opportunities o C2.1C2.2C2.2aC2.2bC2.2cC2.2dC2.3C2.3aC2.4C2.4aC2.5C2.6C3. Business Strategy o C3.1C3.1aC-AC3.1b/C-CE3.1b/C-CH3.1b/C-CO3.1b/C-EU3.1b/C-FB3.1b/C-MM3.1b/C-OG3.1b/C-PF3.1b/C-ST3.1b/C-TO3.1b/C-
TS3.1b)C3.1cC3.1dC-AC3.1e/C-CE3.1e/C-CH3.1e/C-CO3.1e/C-EU3.1e/C-FB3.1e/C-MM3.1e/C-OG3.1e/C-PF3.1e/C-ST3.1e/C-TO3.1e/C-TS3.1eC4. Targets and performance
o C4.1C4.1bC4.2C4.3C4.3aC4.3bC4.3cC4.5C4.5aC5. Emissions methodology o C5.1C5.2C6. Emissions data o C6.1C6.2C6.3C6.4C6.5C-AC6.6/C-FB6.6/C-PF6.6C-AC6.6a/C-FB6.6a/C-PF6.6aC-AC6.8/C-FB6.8/C-PF6.8C-AC6.9/C-FB6.9/C-PF6.9C-
AC6.9a/C-FB6.9a/C-PF6.9aC6.10C7. Emissions breakdowns o C7.1C7.1aC7.2C7.3C7.3cC-AC7.4/C-FB7.4/C-PF7.4C-AC7.4b/C-FB7.4b/C-PF7.4bC7.5C7.6C7.6cC7.9C7.9aC7.9bC8. Energy o C8.1C8.2C8.2aC8.2bC8.2cC8.2dC8.2fC9. Additional metrics o C9.1C10. Verification o C10.1C10.1aC10.1bC10.2C10.2aC11. Carbon pricing o C11.1C11.2C11.3C11.3aC12. Engagement o C12.1C12.1aC12.1bC-AC12.2/C-FB12.2/C-PF12.2C-AC12.2a/C-FB12.2a/C-PF12.2aC-AC12.2b/C-FB12.2b/C-
PF12.2bC12.3C12.3aC12.3bC12.3cC12.3fC12.4C13. Other land management impacts o C-AC13.2/C-FB13.2/C-PF13.2C14. Signoff o C-FIC14.1SC. Supply chain module o SC0.0SC0.1SC0.2SC0.2aSC1.1SC1.2SC1.3SC1.4SC1.4aSC2.1SC2.2SC3.1SC3.1aSC3.1bSC3.1cSC3.2SC4.1SC4.1aSC4.2aSC4.2bSC4.2cS
C4.2dSubmit your response