Embed Size (px)
Citation preview
The Wisdom Of Data The Wisdom Of Data
VisualizationVisualization
A Discussion Surrounding The Use Of
Data Visualizations With Big Data
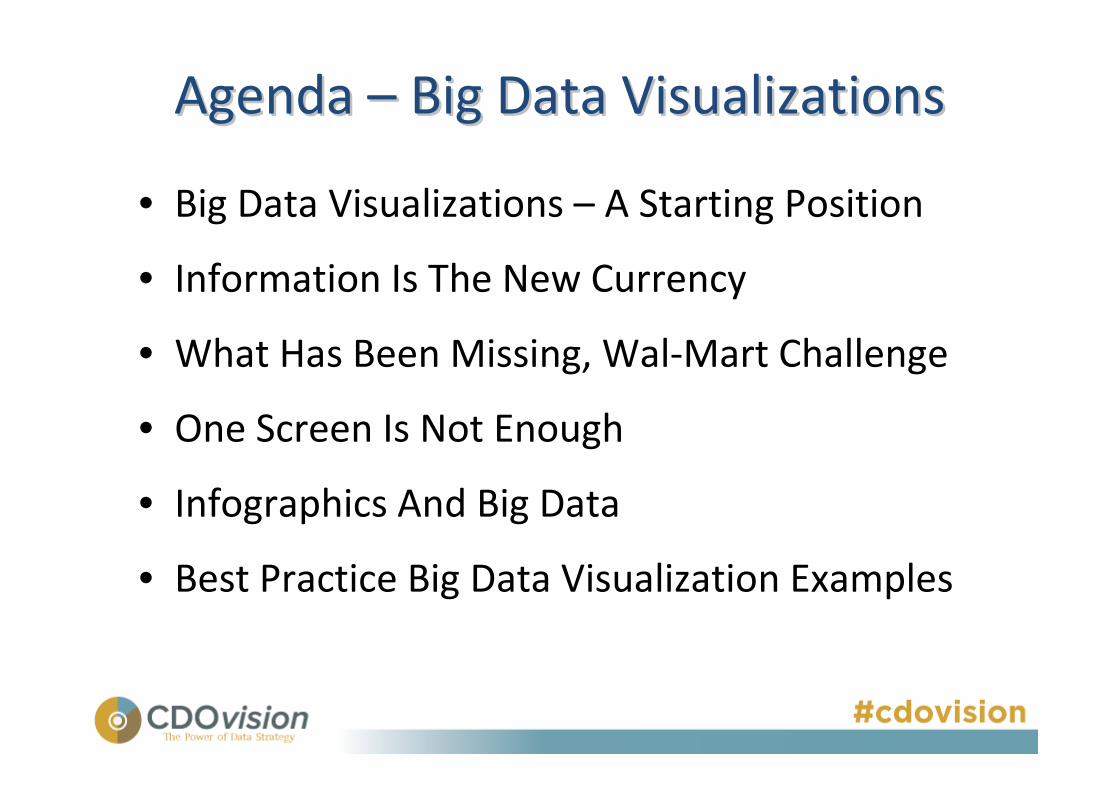
Agenda Agenda –– Big Data VisualizationsBig Data Visualizations
• Big Data Visualizations – A Starting Position
• Information Is The New Currency
• What Has Been Missing, Wal-Mart Challenge
• One Screen Is Not Enough
• Infographics And Big Data
• Best Practice Big Data Visualization Examples
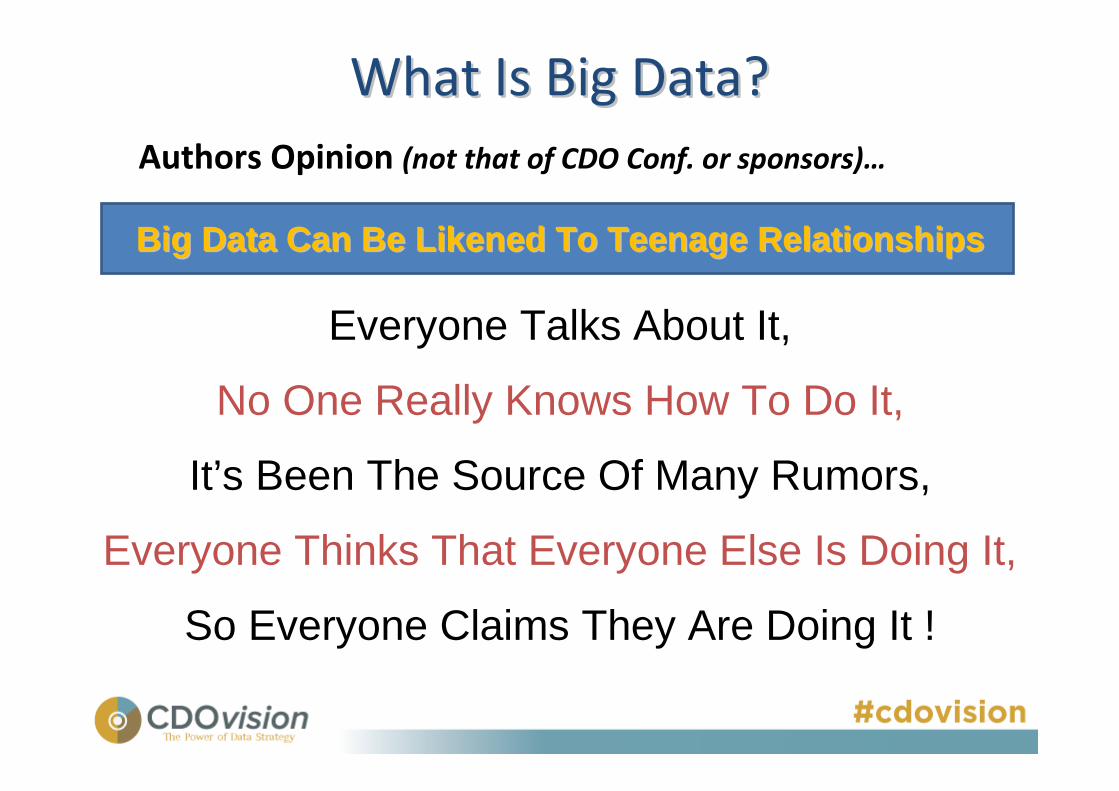
What Is Big Data?What Is Big Data?
Authors Opinion (not that of CDO Conf. or sponsors)…
Big Data Can Be Likened To Teenage RelationshipsBig Data Can Be Likened To Teenage Relationships
Everyone Talks About It,
No One Really Knows How To Do It,
It’s Been The Source Of Many Rumors,
Everyone Thinks That Everyone Else Is Doing It,
So Everyone Claims They Are Doing It !
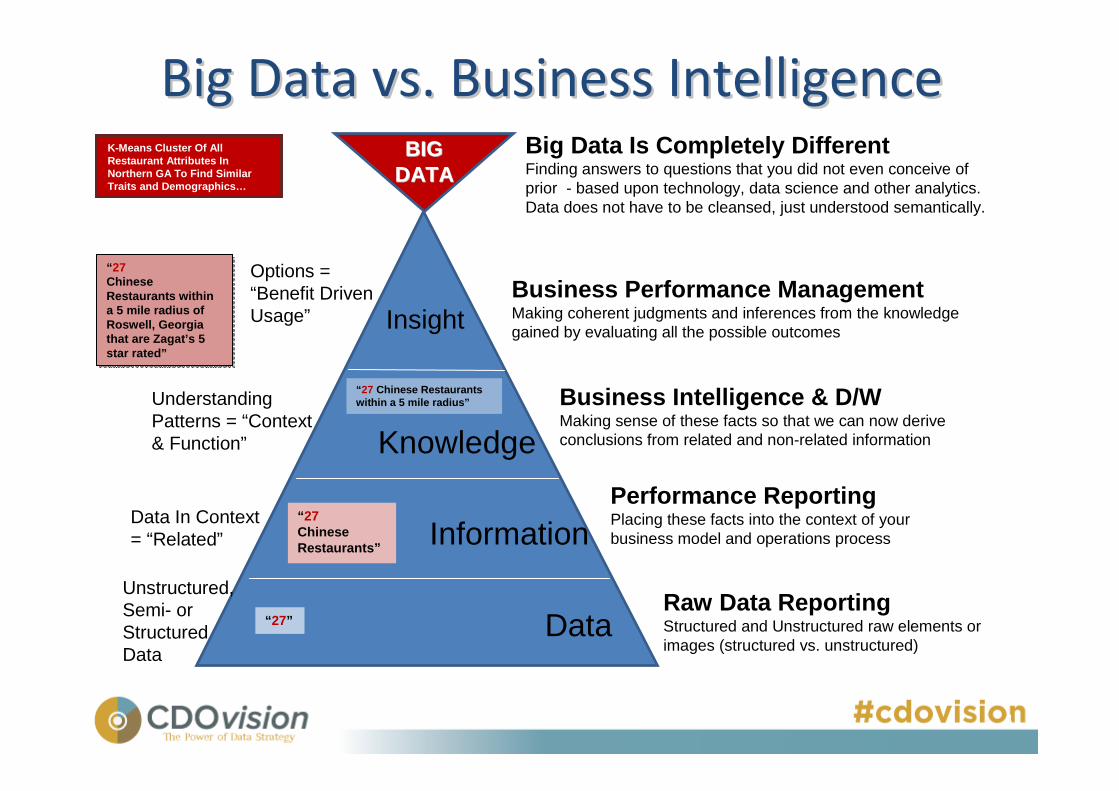
Big Data vs. Business IntelligenceBig Data vs. Business Intelligence
4
“27Chinese Restaurants within a 5 mile radius of Roswell, Georgia that are Zagat’s 5 star rated”
“ 27Chinese Restaurants within a 5 mile radius of Roswell, Georgia that are Zagat’s 5 star rated”
Options = “Benefit Driven Usage”
Understanding Patterns = “Context & Function”
Data In Context = “Related”
Unstructured,Semi- orStructuredData
Insight
Knowledge
Information
Data
Business Performance ManagementMaking coherent judgments and inferences from the knowledge gained by evaluating all the possible outcomes
Business Intelligence & D/WMaking sense of these facts so that we can now derive conclusions from related and non-related information
Performance ReportingPlacing these facts into the context of your business model and operations process
Raw Data ReportingStructured and Unstructured raw elements or images (structured vs. unstructured)
Big Data Is Completely DifferentFinding answers to questions that you did not even conceive of prior - based upon technology, data science and other analytics. Data does not have to be cleansed, just understood semantically.
BIGBIGDATADATA
“ 27”
“ 27ChineseRestaurants”
“ 27 Chinese Restaurants within a 5 mile radius”
K-Means Cluster Of All Restaurant Attributes In Northern GA To Find Similar Traits and Demographics…
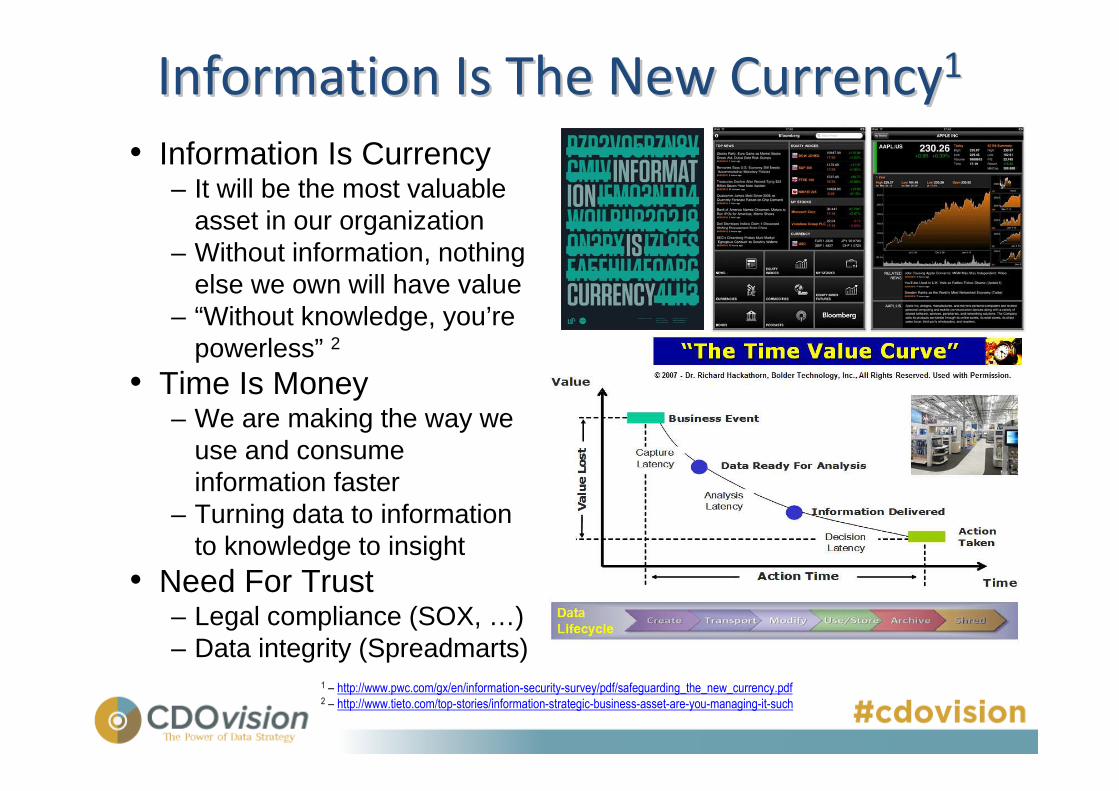
Information Is The New CurrencyInformation Is The New Currency11
1 – http://www.pwc.com/gx/en/information-security-survey/pdf/safeguarding_the_new_currency.pdf2 – http://www.tieto.com/top-stories/information-strategic-business-asset-are-you-managing-it-such
• Information Is Currency– It will be the most valuable
asset in our organization– Without information, nothing
else we own will have value– “Without knowledge, you’re
powerless” 2
• Time Is Money– We are making the way we
use and consume information faster
– Turning data to information to knowledge to insight
• Need For Trust– Legal compliance (SOX, …)– Data integrity (Spreadmarts)
Big Data VisualizationsBig Data Visualizations
• Authors Starting Opinion On Visualizations…
– One Screen Does Not Support “Ah-Ha” Moments1
– “Infographics” - are graphic, visual representations of
information, data or knowledge2
• Intended to present complex information quickly/clearly
• They can improve cognition utilizing graphics to enhance
human visual system’s ability to see patterns and trends
– Visualizations Provide A Picture Of Information
• A picture is worth a thousand words � when used right
1 – “The Work Of Edward Tufte & Graphics Press” www.edwardtufte.com2 – “Infographic” www./Wikipedia.com
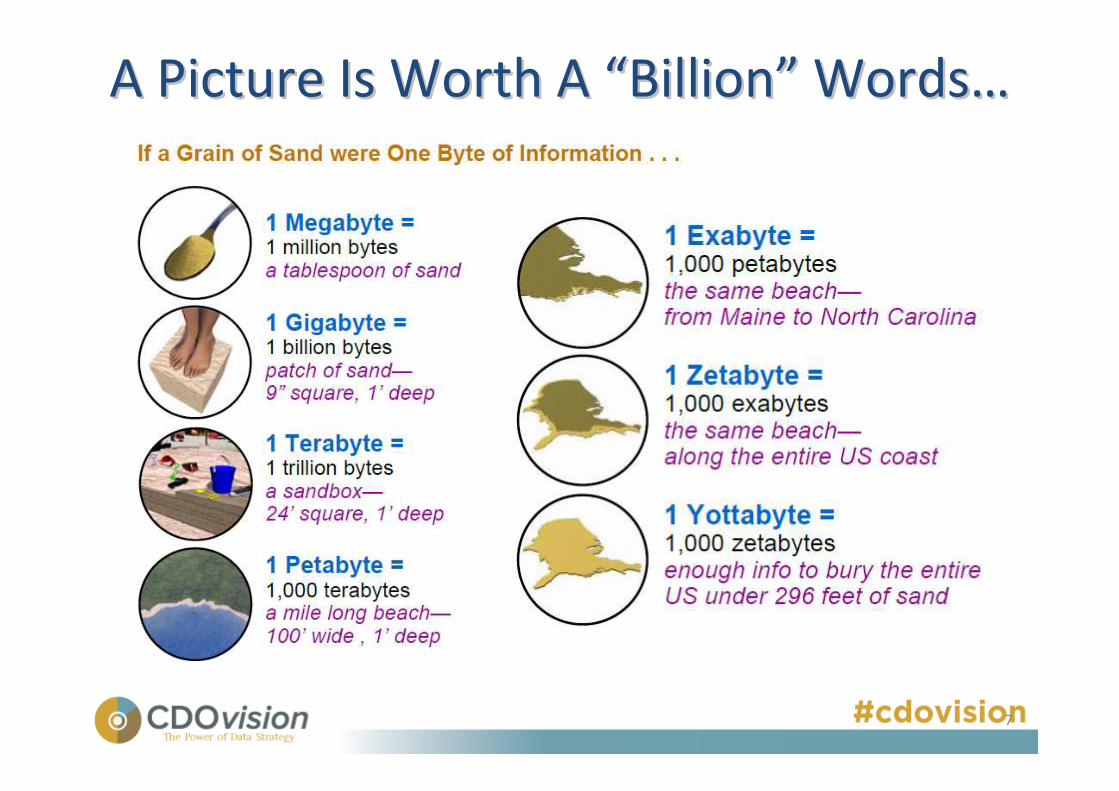
A Picture Is Worth A A Picture Is Worth A ““BillionBillion”” WordsWords……
7
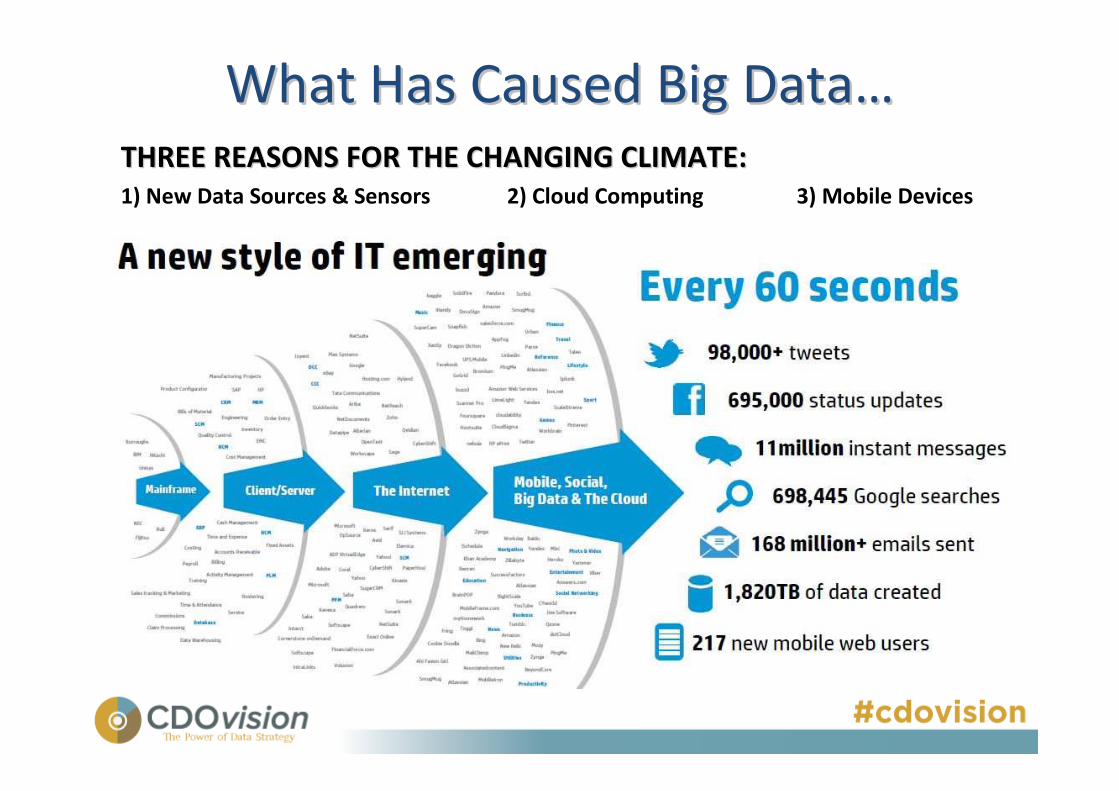
What Has Caused Big DataWhat Has Caused Big Data……
THREE REASONS FOR THE CHANGING CLIMATE:THREE REASONS FOR THE CHANGING CLIMATE:
1) New Data Sources & Sensors 2) Cloud Computing 3) Mobile Devices
Providing Insight Providing Insight –– The SamThe Sam’’s Club Challenges Club Challenge
• Information was trapped by constraints
– Locked into silo’s of systems (dates)
– Projects created one-off solutions
• Data was everywhere – but not cataloged
– Tending to downplay challenges and risks
• More than one dictionary in enterprise
– Item
– Business Terms
• Brittle, tightly-coupled systems
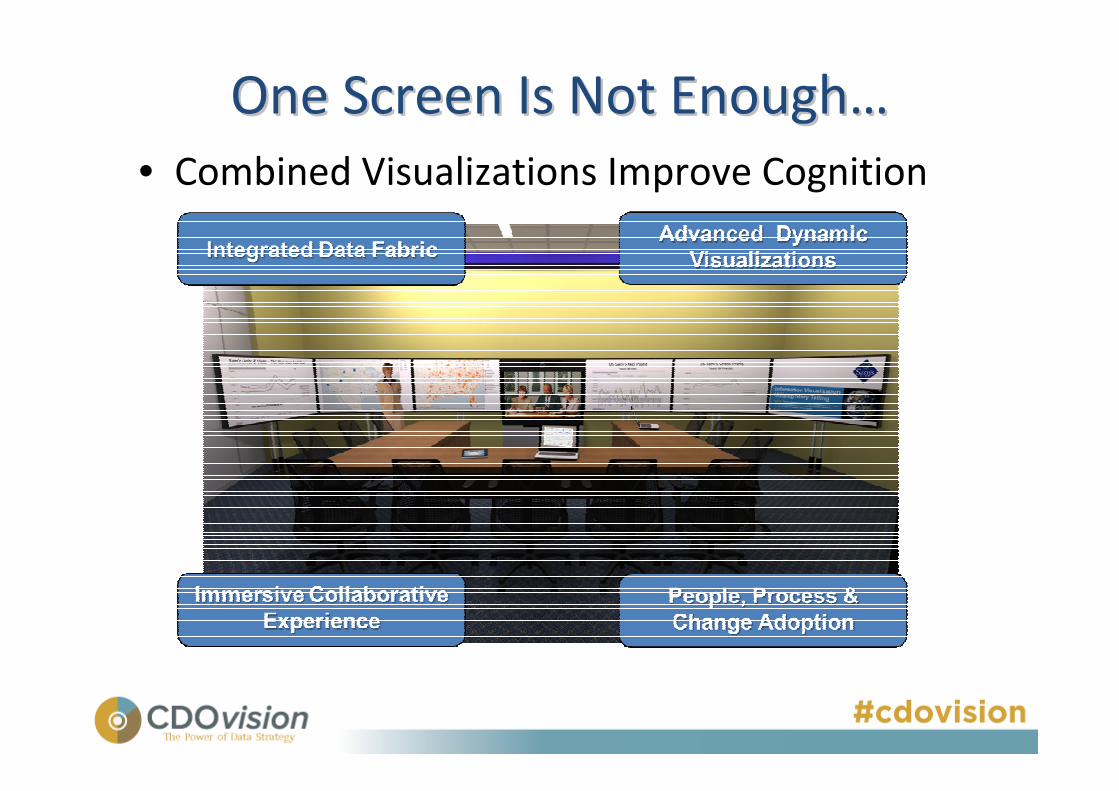
One Screen Is Not EnoughOne Screen Is Not Enough……
• Combined Visualizations Improve Cognition
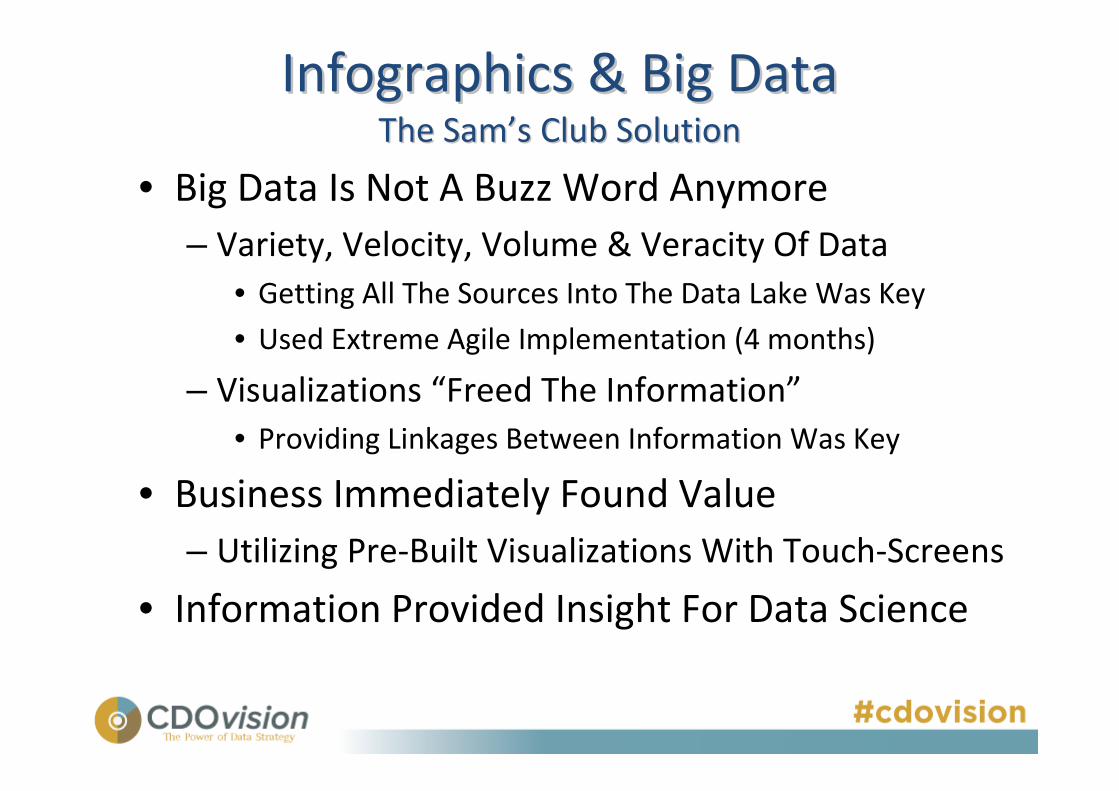
Infographics & Big DataInfographics & Big DataThe SamThe Sam’’s Club Solutions Club Solution
• Big Data Is Not A Buzz Word Anymore
– Variety, Velocity, Volume & Veracity Of Data
• Getting All The Sources Into The Data Lake Was Key
• Used Extreme Agile Implementation (4 months)
– Visualizations “Freed The Information”
• Providing Linkages Between Information Was Key
• Business Immediately Found Value
– Utilizing Pre-Built Visualizations With Touch-Screens
• Information Provided Insight For Data Science
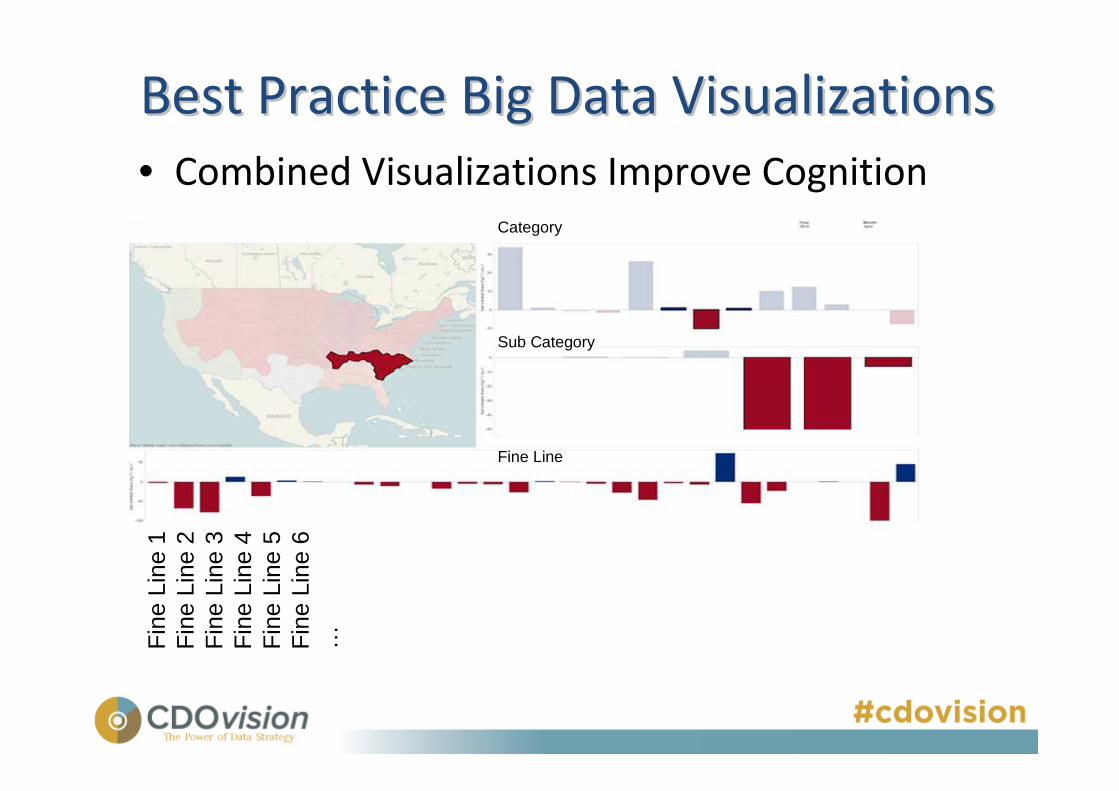
Best Practice Big Data VisualizationsBest Practice Big Data Visualizations
• Combined Visualizations Improve Cognition
Category
Sub Category
Fine Line
Fin
e Li
ne 1
Fin
e Li
ne 2
Fin
e Li
ne 3
Fin
e Li
ne 4
Fin
e Li
ne 5
Fin
e Li
ne 6
…
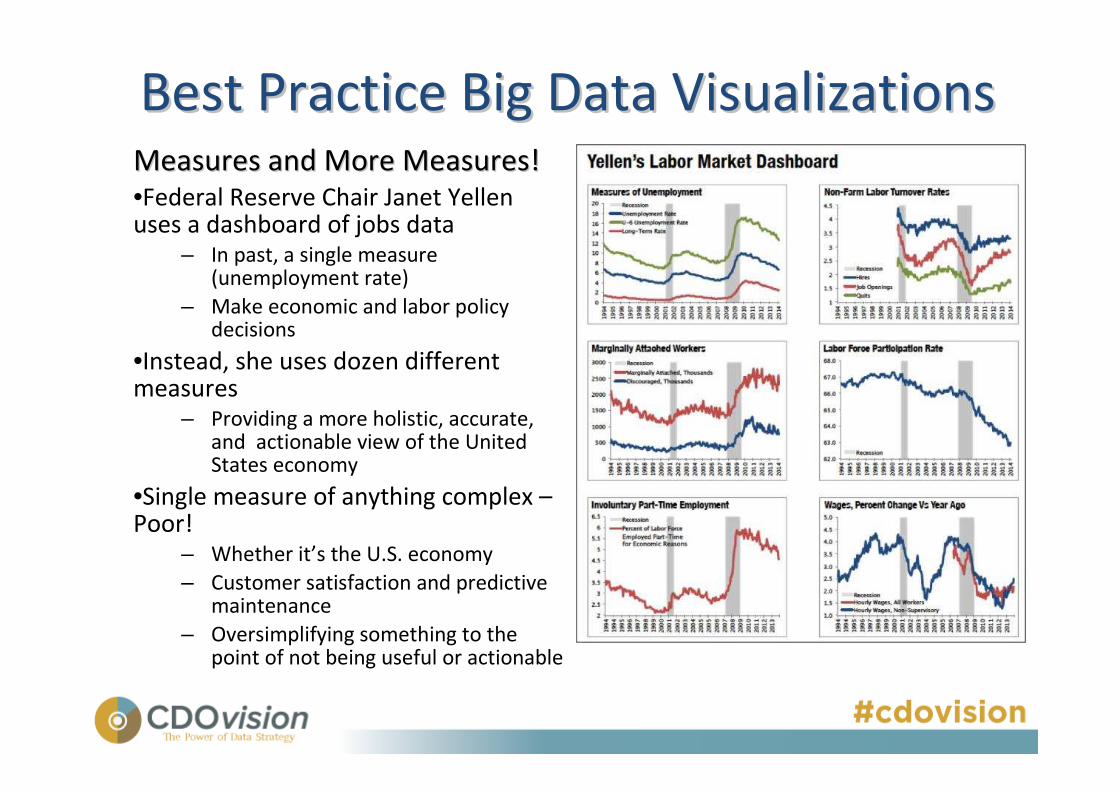
Best Practice Big Data VisualizationsBest Practice Big Data VisualizationsMeasures and More Measures!Measures and More Measures!•Federal Reserve Chair Janet Yellen uses a dashboard of jobs data
– In past, a single measure (unemployment rate)
– Make economic and labor policy decisions
•Instead, she uses dozen different measures
– Providing a more holistic, accurate, and actionable view of the United States economy
•Single measure of anything complex –Poor!
– Whether it’s the U.S. economy
– Customer satisfaction and predictive maintenance
– Oversimplifying something to the point of not being useful or actionable
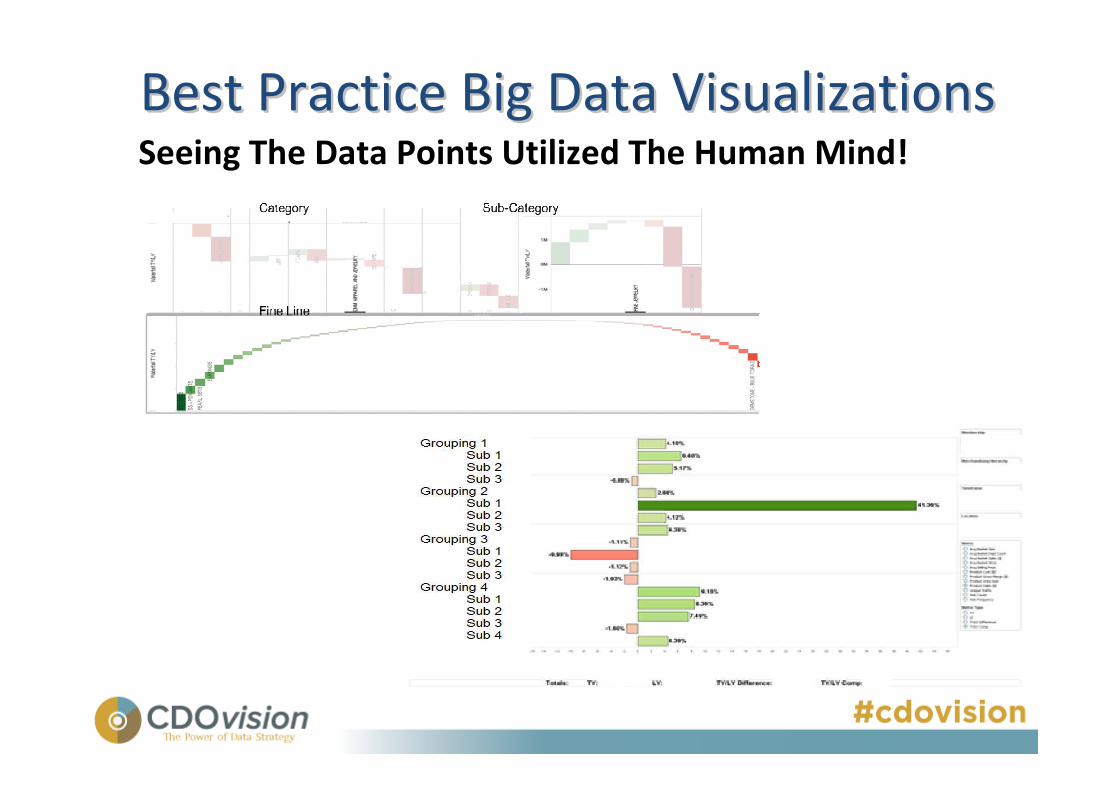
Best Practice Big Data VisualizationsBest Practice Big Data VisualizationsSeeing The Data Points Utilized The Human Mind!
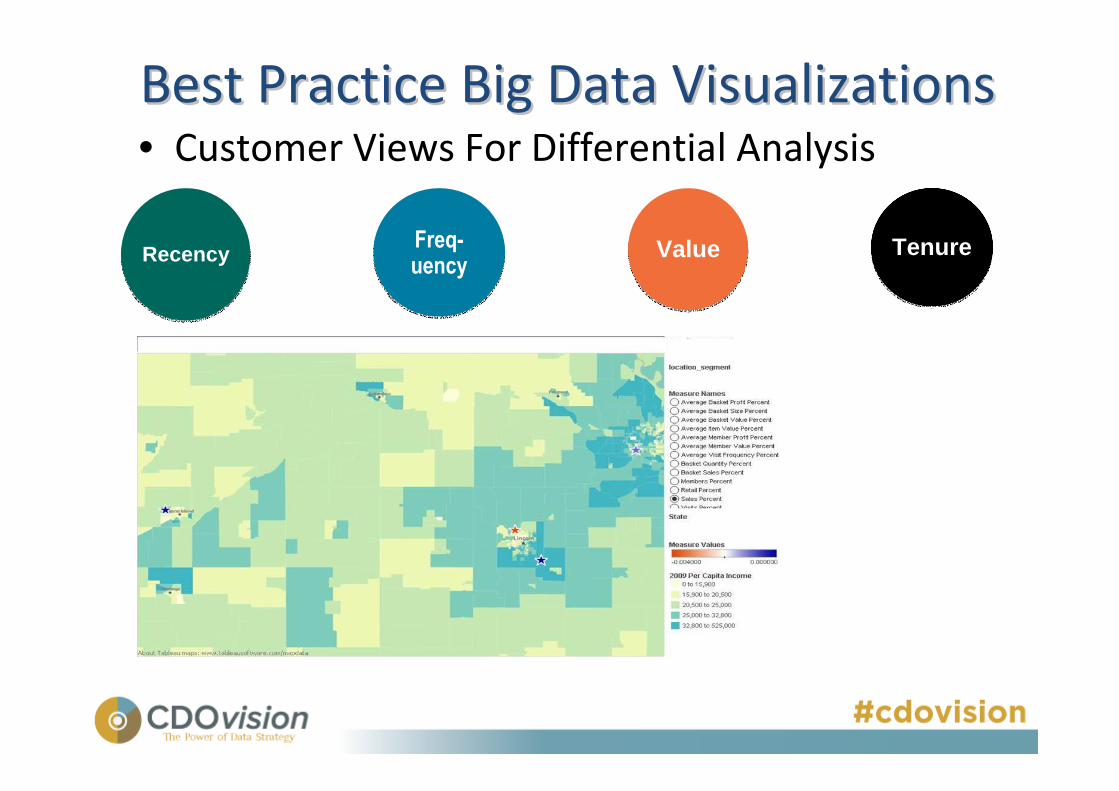
Best Practice Big Data VisualizationsBest Practice Big Data Visualizations• Customer Views For Differential Analysis
RecencyFreq-uency
Value Tenure
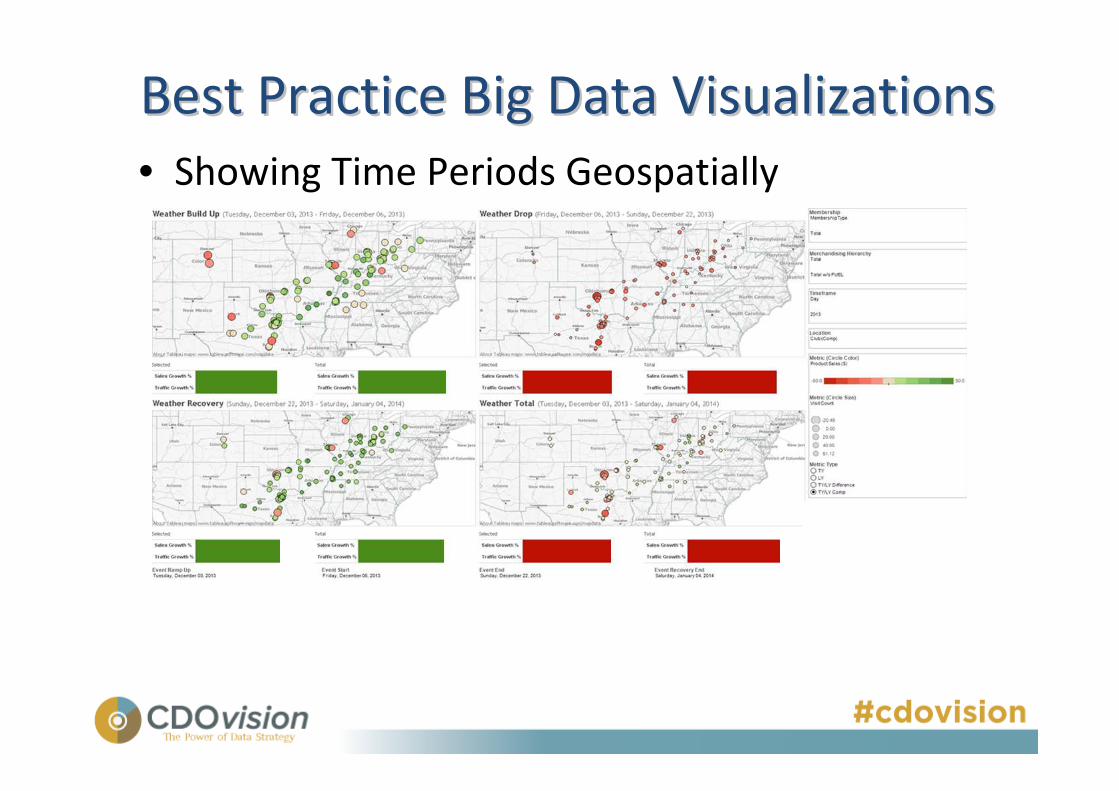
Best Practice Big Data VisualizationsBest Practice Big Data Visualizations
• Showing Time Periods Geospatially
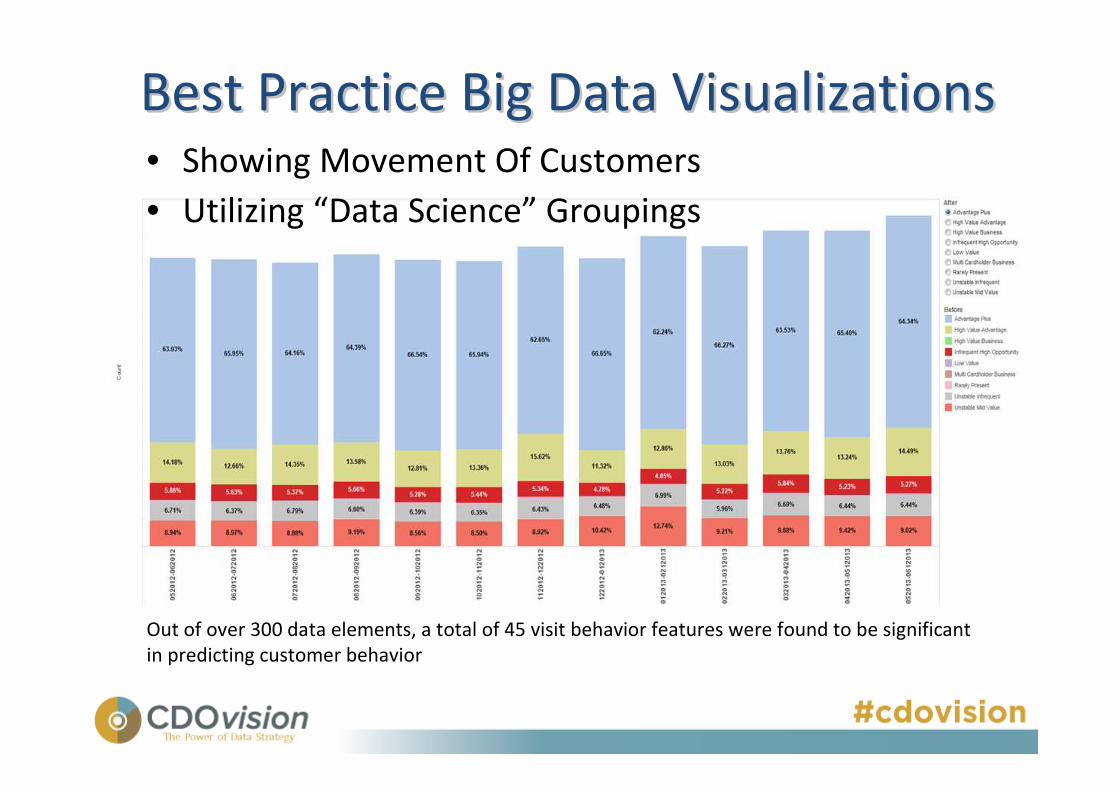
Best Practice Big Data VisualizationsBest Practice Big Data Visualizations• Showing Movement Of Customers
• Utilizing “Data Science” Groupings
Out of over 300 data elements, a total of 45 visit behavior features were found to be significant
in predicting customer behavior
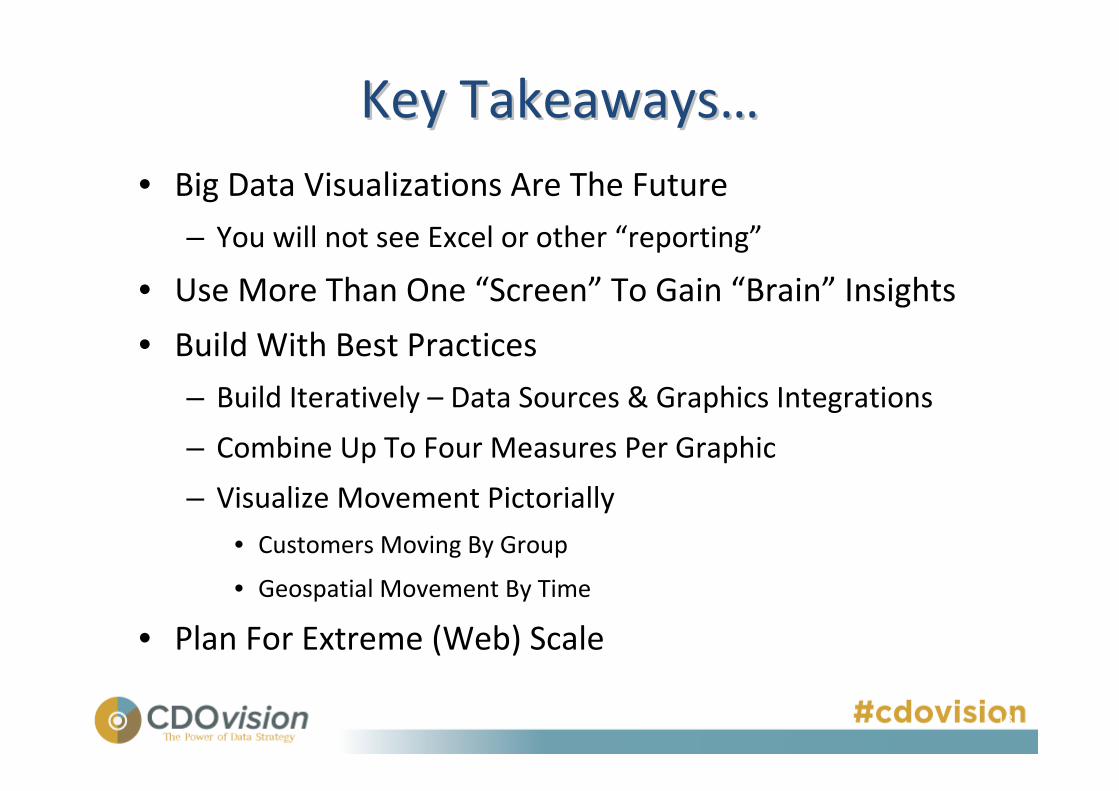
Key TakeawaysKey Takeaways……
• Big Data Visualizations Are The Future
– You will not see Excel or other “reporting”
• Use More Than One “Screen” To Gain “Brain” Insights
• Build With Best Practices
– Build Iteratively – Data Sources & Graphics Integrations
– Combine Up To Four Measures Per Graphic
– Visualize Movement Pictorially
• Customers Moving By Group
• Geospatial Movement By Time
• Plan For Extreme (Web) Scale
18
An Open Exchange Of IdeasAn Open Exchange Of Ideas
Author InformationAuthor Information
Robert J. Abate CBIP, CDMP
Global Director – Enterprise Data Management & Analytics
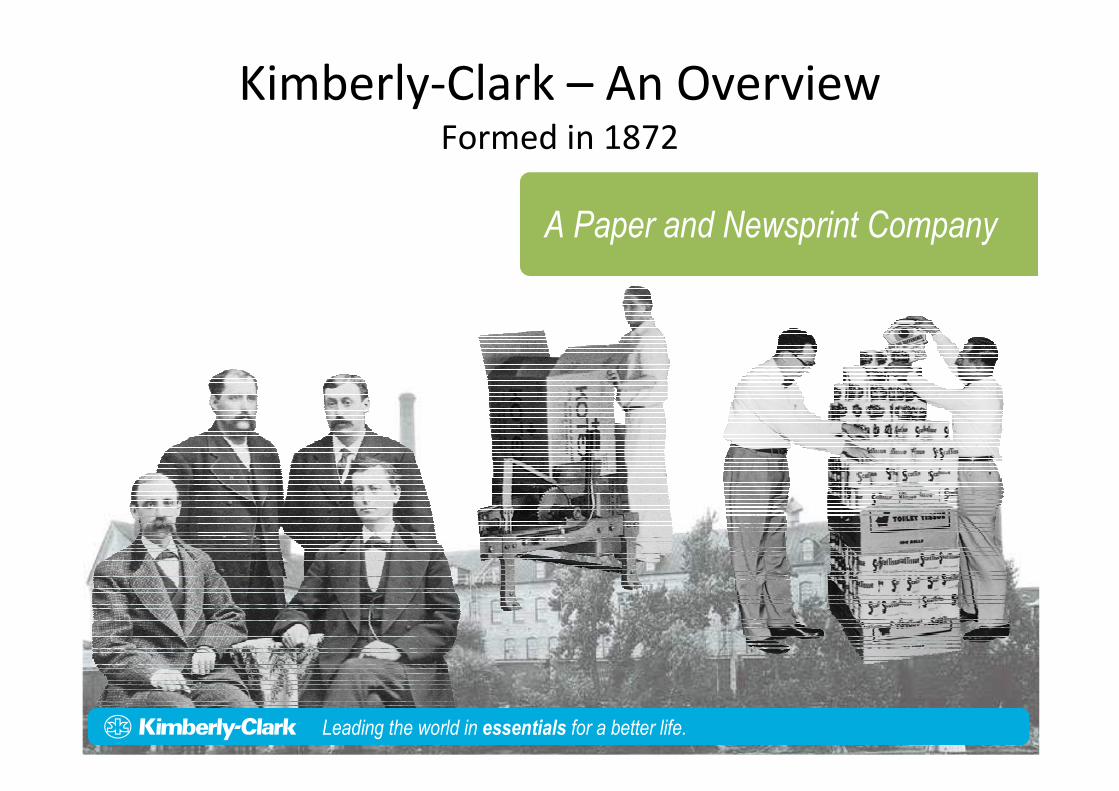
Kimberly-Clark – An OverviewFormed in 1872
A Paper and Newsprint Company
Leading the world in essentials for a better life.
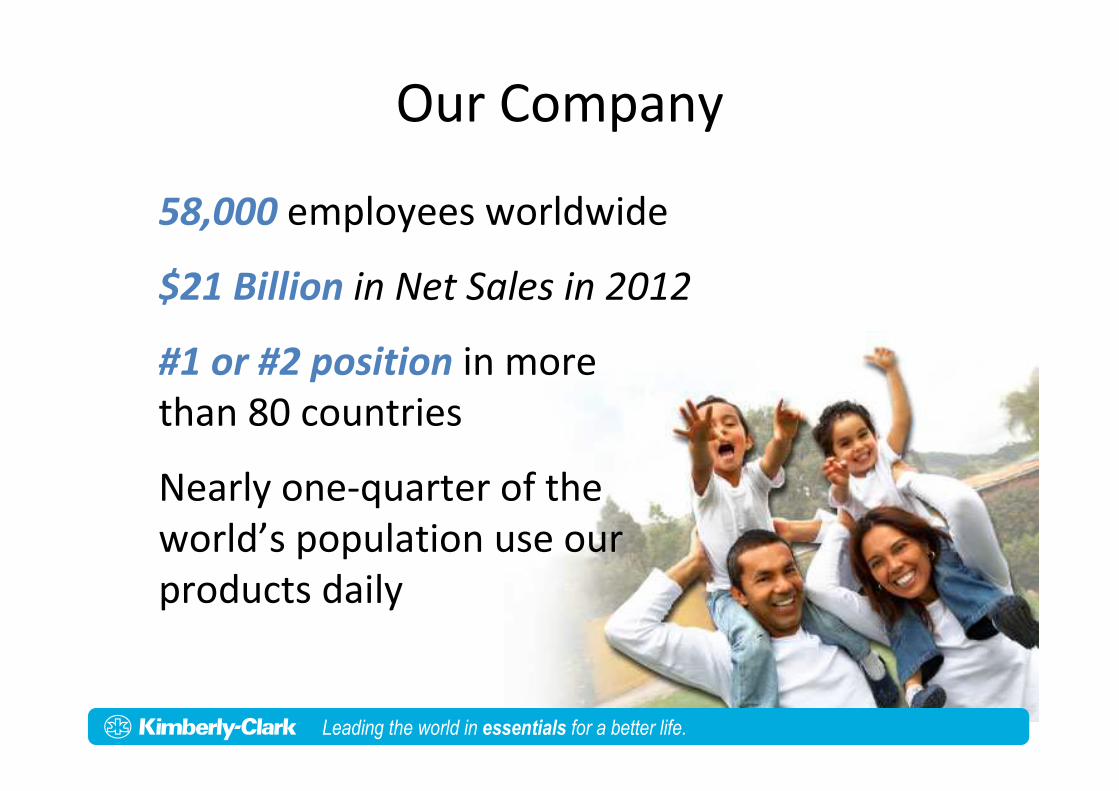
Our Company
58,000 employees worldwide
$21 Billion in Net Sales in 2012
#1 or #2 position in more
than 80 countries
Nearly one-quarter of the
world’s population use our
products daily
Leading the world in essentials for a better life.Leading the world in essentials for a better life.
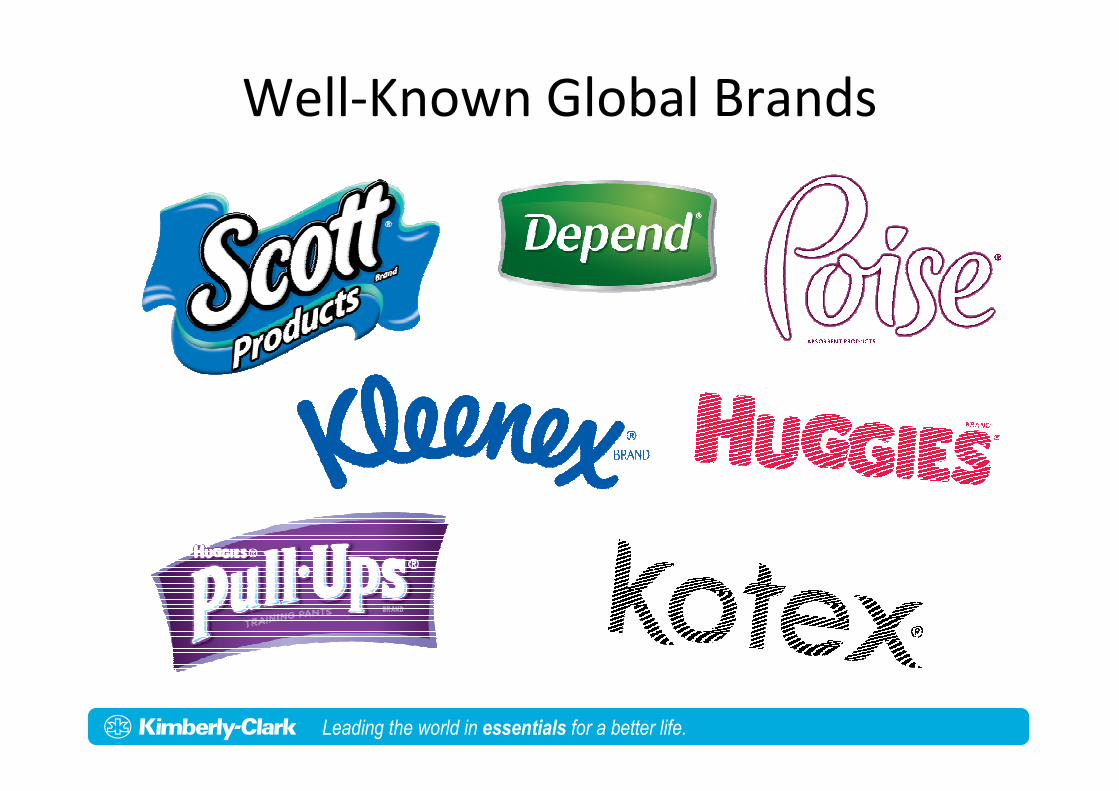
Well-Known Global Brands
Leading the world in essentials for a better life.Leading the world in essentials for a better life.
Leading the world in essentials for a better life.Leading the world in essentials for a better life.
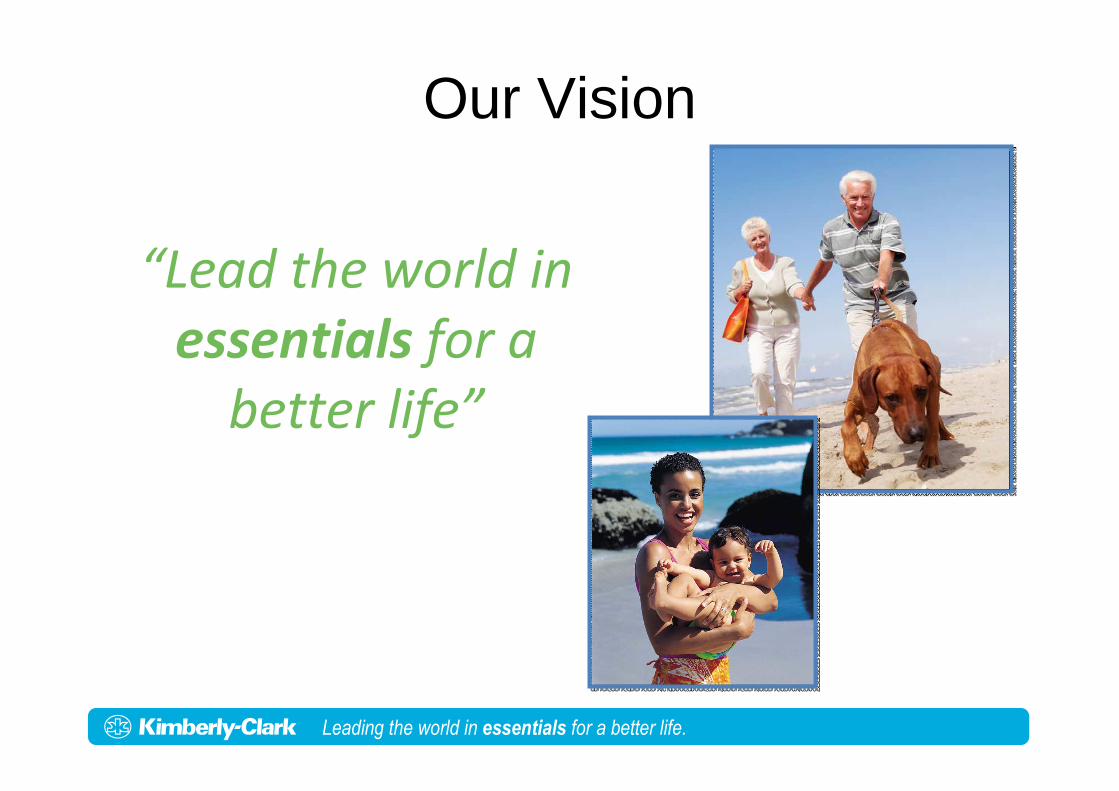
“Lead the world in
essentials for a
better life”
Our Vision
Leading the world in essentials for a better life.Leading the world in essentials for a better life.
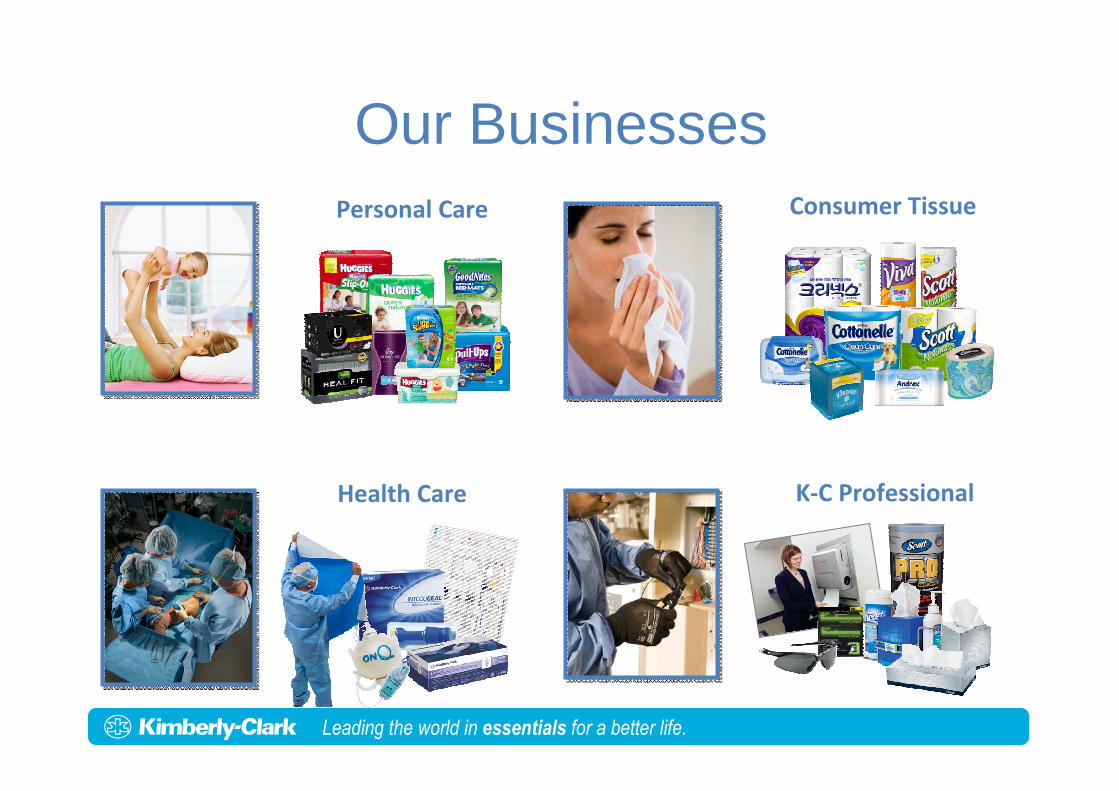
Our BusinessesPersonal Care
Health Care
Consumer Tissue
K-C Professional
Leading the world in essentials for a better life.Leading the world in essentials for a better life.
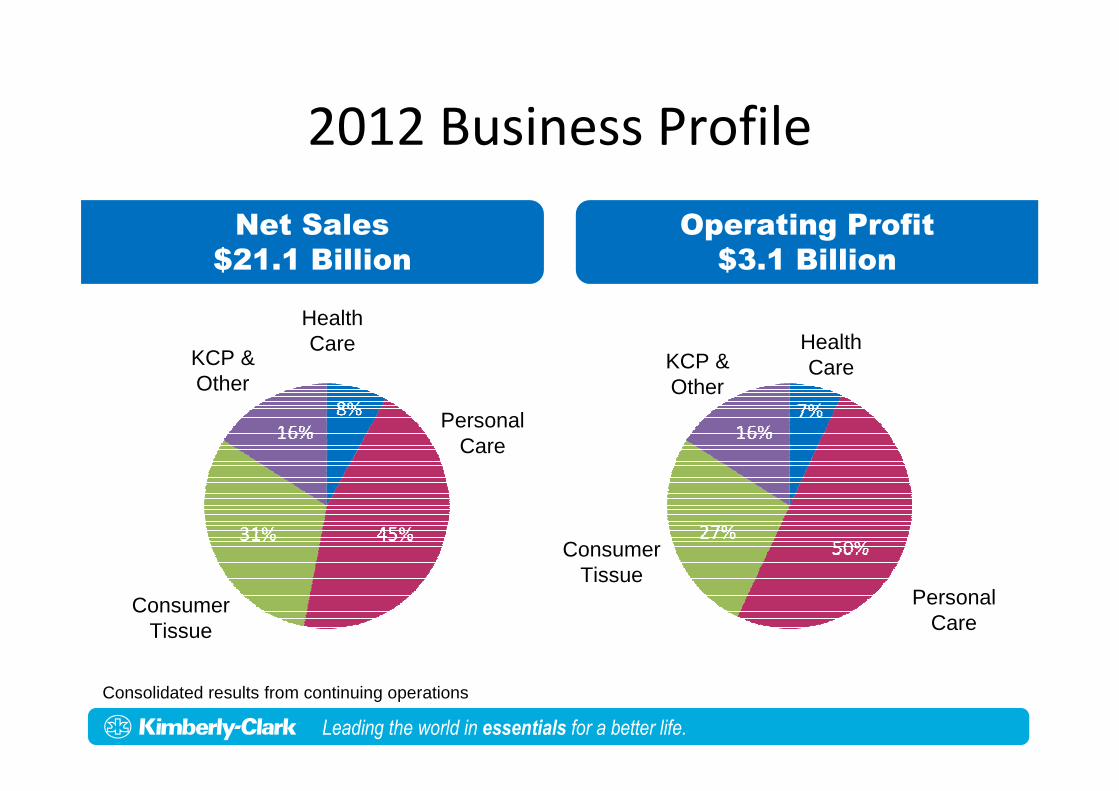
2012 Business Profile
KCP &Other
Personal Care
Net Sales$21.1 Billion
KCP &Other
ConsumerTissue
PersonalCare
Operating Profit$3.1 Billion
Health Care Health
Care
ConsumerTissue
Consolidated results from continuing operations
Leading the world in essentials for a better life.Leading the world in essentials for a better life.
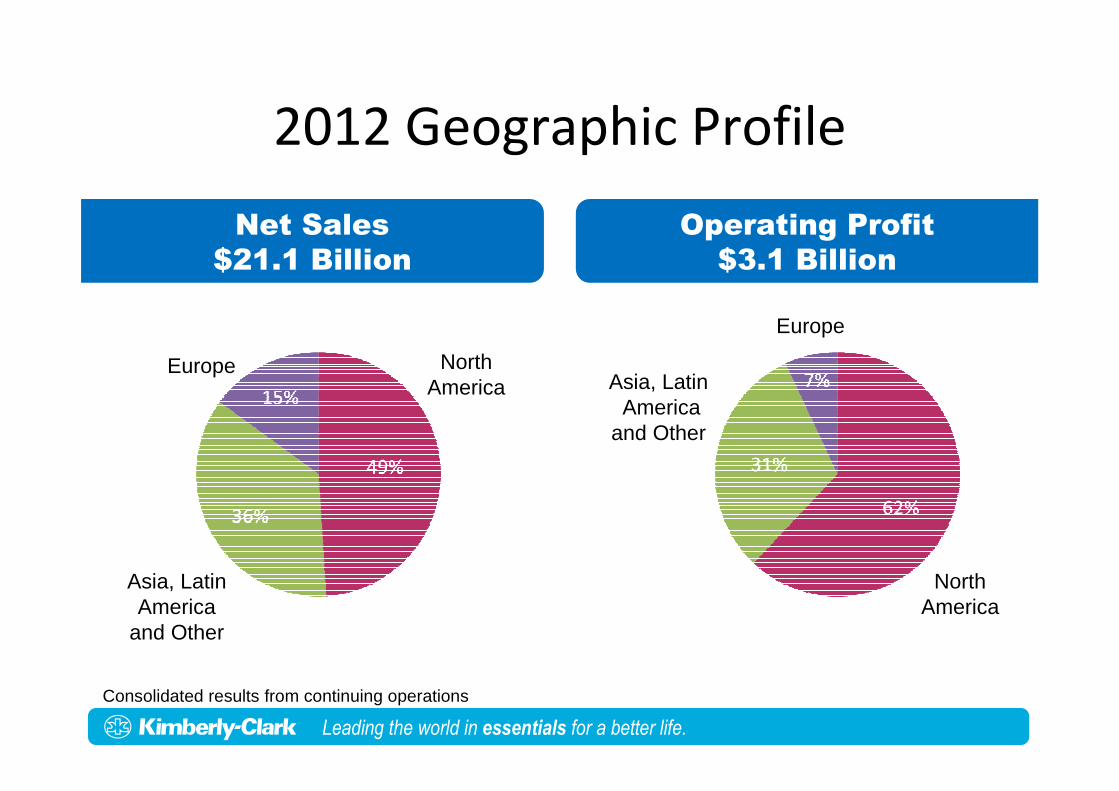
2012 Geographic Profile
Europe
Asia, LatinAmerica
and Other
North America
North America
Asia, LatinAmerica
and Other
Europe
Consolidated results from continuing operations
Net Sales$21.1 Billion
Operating Profit$3.1 Billion
Leading the world in essentials for a better life.Leading the world in essentials for a better life.
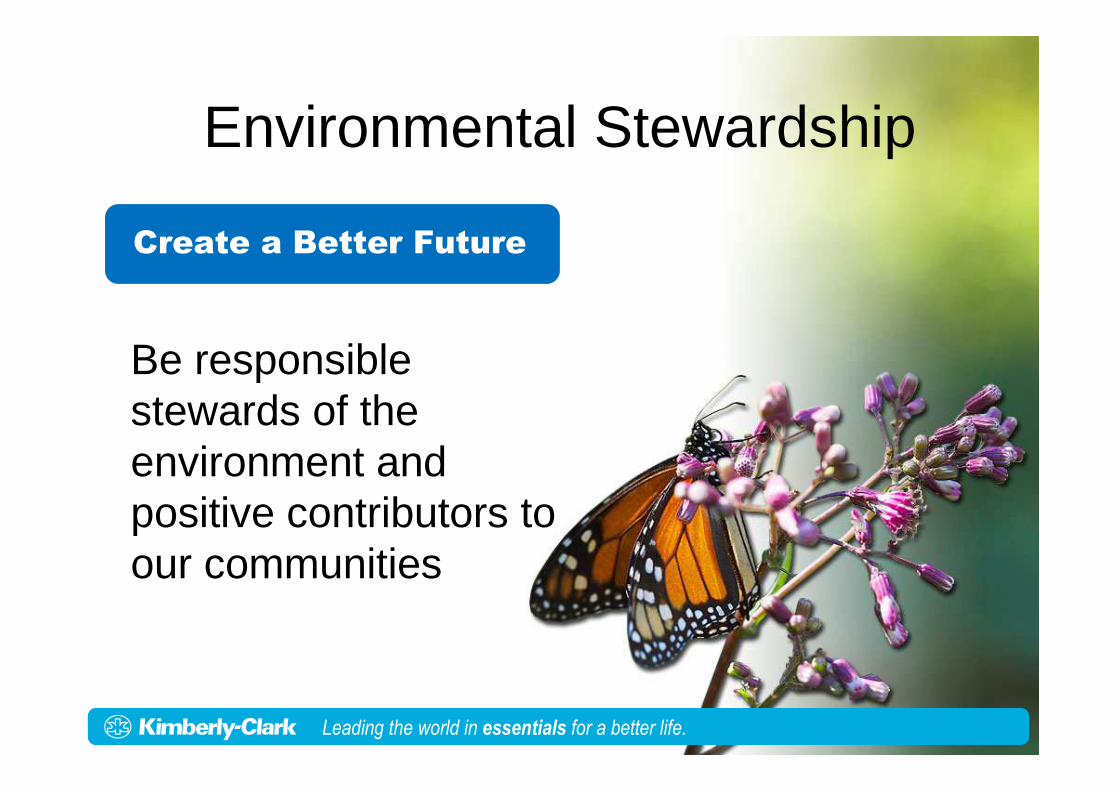
Environmental Stewardship
Be responsible stewards of the environment and positive contributors to our communities
Create a Better Future
Leading the world in essentials for a better life.
Leading the world in essentials for a better life.Leading the world in essentials for a better life.
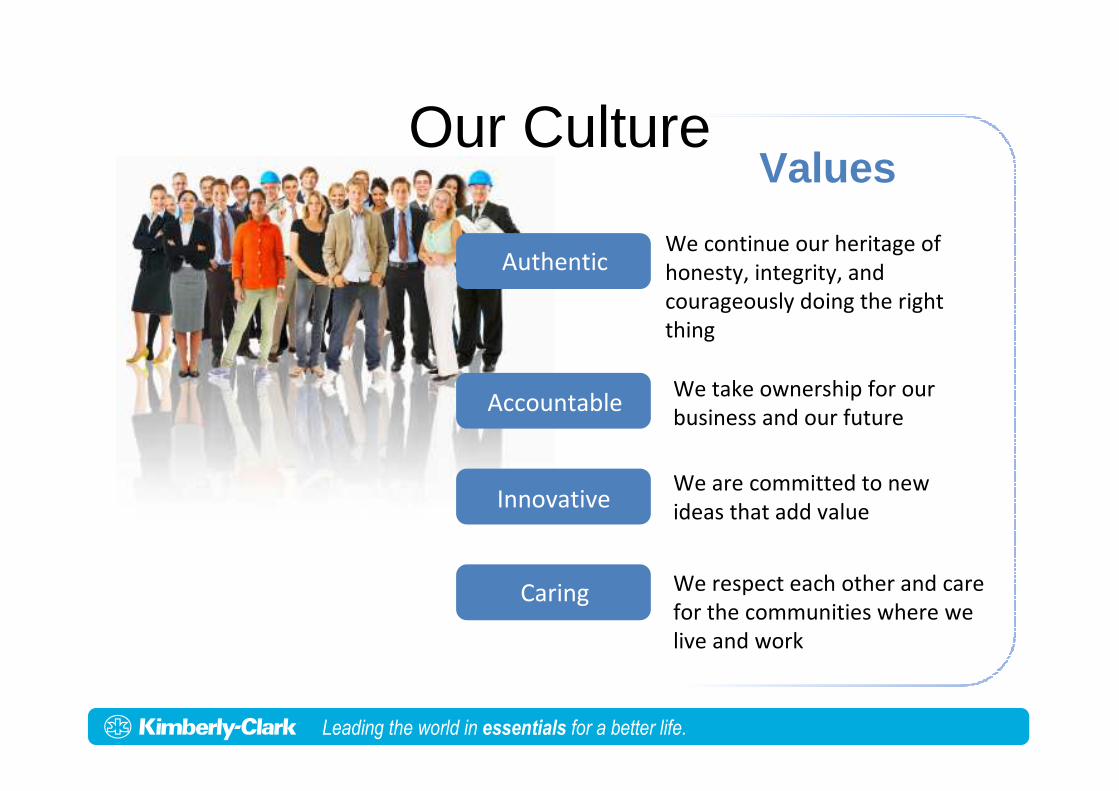
Authentic
Accountable
Innovative
Caring
Our Culture
We continue our heritage of
honesty, integrity, and
courageously doing the right
thing
We take ownership for our
business and our future
We are committed to new
ideas that add value
We respect each other and care
for the communities where we
live and work
Values
Leading the world in essentials for a better life.Leading the world in essentials for a better life.
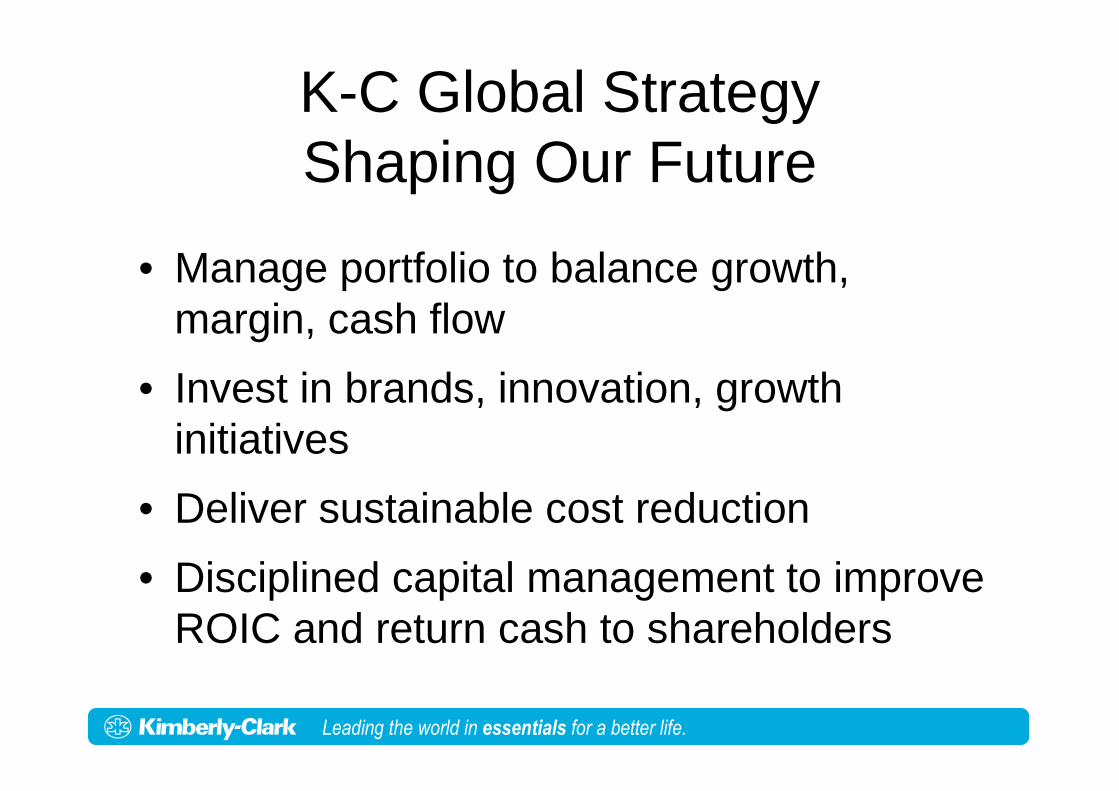
K-C Global StrategyShaping Our Future
• Manage portfolio to balance growth, margin, cash flow
• Invest in brands, innovation, growth initiatives
• Deliver sustainable cost reduction
• Disciplined capital management to improve ROIC and return cash to shareholders