Embed Size (px)
Citation preview
CON 5 7
[Turn over
Instructions.—(1) Attempt any five questions.(2) Each question carries 20 marks.(3) Answers must be written in English or in Hindi.(4) QUESTIONS FROM EACH SECTION SHOULD BE ANSWERED ON
SEPARATE ANSWER-BOOK/SUPPLEMENTS.(5) Answer to each question must begin on a fresh page and the question number
must be written on the top.(6) On the answer-book, Name, Roll Number etc. are to be written in the space
provided for them. Name or Roll Number should not be written on thesupplement.
(7) Candidates should use their own pen, pencil, eraser and pencil-sharpener andfootrule.
(8) No reference books, Text books, Mathematical tables, Engineering tables,Calculators or other instruments will be supplied or allowed to be used oreven allowed to be kept with the candidates. Violation of this rule may leadto penalties.
(9) ALL ROUGH WORK MUST BE DONE IN THE LAST THREE OR FOURPAGES OF THE ANSWER BOOKLET; ADDITIONAL BOOKLETS WILLBE PROVIDED ON DEMAND, WHICH SHOULD BE ATTACHED TO THEANSWER BOOKLET BEFORE RETURNING.
Section A1. (a) Prove the following :—
xnmnm uu x
(b) Prove the following :—
m....x6.4.25.3.1x
4.23.1x
21x m4m2m2m terms
mm xx )21()
21(
2. (a) The following value of the function f (x) for values of x are given :—f (1) = 4, f (2) = 5, f (7) = 5, f (8) = 4.Find the value of f (6) and also the value of x for which f(x) is maximum or minimum
(b) Using Simpson’s one-third rule, estimate approximately the area of the cross-section ofa river 80 feet wide, the depth d (in feet) at a distance x from one bank being given bythe following table :—
x : 0 10 20 30 40 50 60 70 80d : 0 4 7 9 12 15 14 8 3.
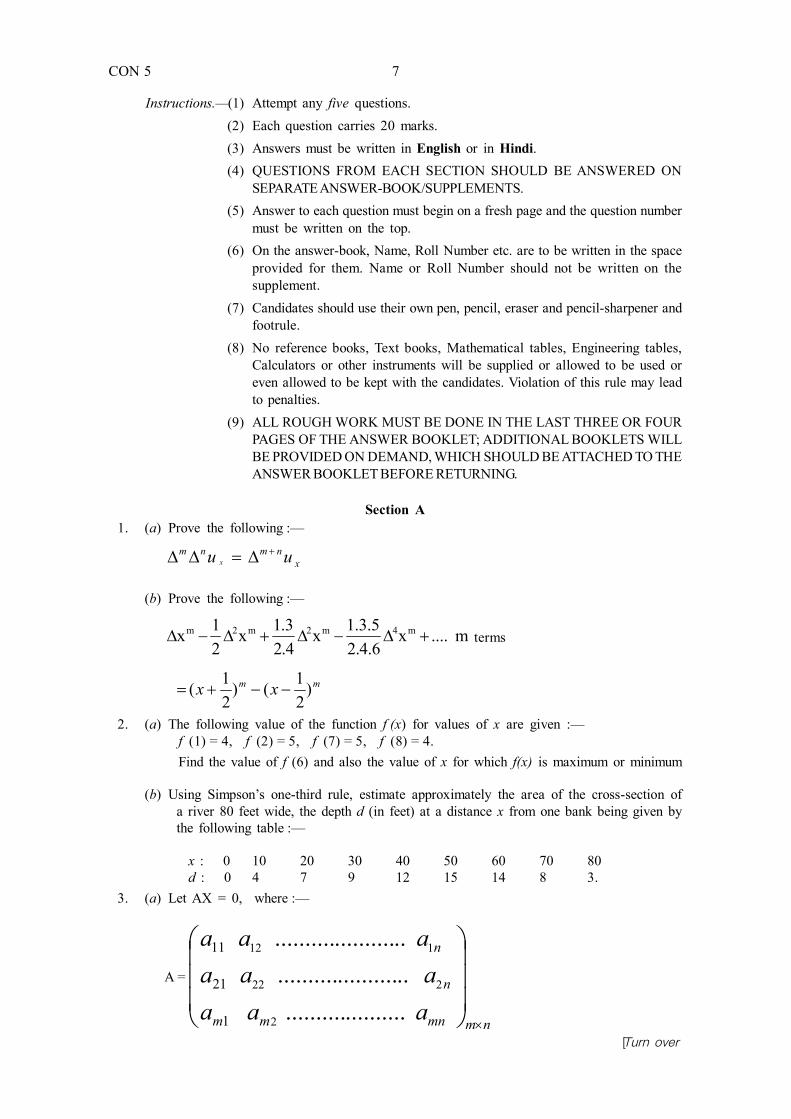
3. (a) Let AX = 0, where :—
A =
nmmnmm
n
n
aaaaaa
aaa
................................................................
2
222
112
1
21
11
CON 5 8
X1= (x1 , x2, ..................... xn )
be a system of m homogeneous linear equations in n unknowns and assume that n > m.Then prove that there exists a non-trivial solution.
(b) Solve the following equations by Gauss reduction method :—
x 1 + x 2 + 2 x 3 - x 4 = 43x 2- x 3 + 4x 4 = 2x 1 + 2x 2 + 3x 3 + 5x 4 = 0x 1 + x 2 - 5x 3 + 6x 4 = 0
Section B
4. (a) How do you incorporate qualitative variables in regression model using dummy variables ?If monthly data over number of years is available how many dummy variables will youintroduce to show that (i) all 12 months exhibit seasonal patterns (ii) only March, June,September and December exhibit seasonal patterns.
(b) The following data gives starting salaries of 10 college teachers by sex of the teacher.Express the data using appropriate regression model. From the model find mean salaryof (i) female college teacher (ii) Male college teacher.
Starting Salary 22 19 18 22 18 21 21 17 18 21
( in 1000 Rs.) Sex M F F M F M M F F M
(c) What do you understand by heteroscedasticity in the context of linear models ? In sucha case describe generalised least square (GLS) method of estimating parameters.State the properties of GLS estimators.
5. (a) Describe briefly the difficulties involved in the construction of cost of living index num-bers.
(b) How is Fisher’s formula for cost of living index number derived ? Show that it satisfies(i) factor reversal and (ii) time reversal tests.
6. (a) Describe a production function when there are two inputs X1, X2 and one output q. Whendo you call a production function homogeneous ?
(b) Is the Cobb-Douglas production function given by q = A 1X
2X homogeneous. If X1 and
X2 are increased by factor m explain its effect on q. What conclusion are possible from
the values of βα ?
If q= 1.01 75.01X 25.0
2X find q when (X1 X2) = (121, 138).
Section C
7. (a) Describe Lahiri’s method of dawing PPSWR n-draws sample. Show that under this methodprobability of selection of unit i is propotional to size.
(b) Fom the following data corresponding to N=10 villages draw PPSWR 2-draws sample :—
Village No. i 1 2 3 4 5 6 7 8 9 10
Size Xi 15 21 109 51 42 7 11 40 52 32
Use the following pairs of random numbers (i, R) where 1 < i < 10 and 1 < R < 109(7, 25) ; (2, 73) ; (5, 31) ; (7, 73) ; (11, 17) ; (8, 40).
CON 5 9
8. (a) What do you understand by proportional allocation, optimum allocation and Neymanallocation in stratified sampling. Show that V ( y st ) prop > V ( y st ).
(b) A rural block in a district was divided into three strata. The following table gives thenumber of villages (Nh) and standard deviation (Sh ) of area under wheat crop fordifferent strata :—
Stratum No. No. of Villages Standard Deviationh Nh Sh
1 15 100
2 10 50
3 25 120
A sample of 20 villages is to be drawn. How many villages should be selected from eachstrata under :—
(i) proportional allocation.(ii) Neyman allocation ?
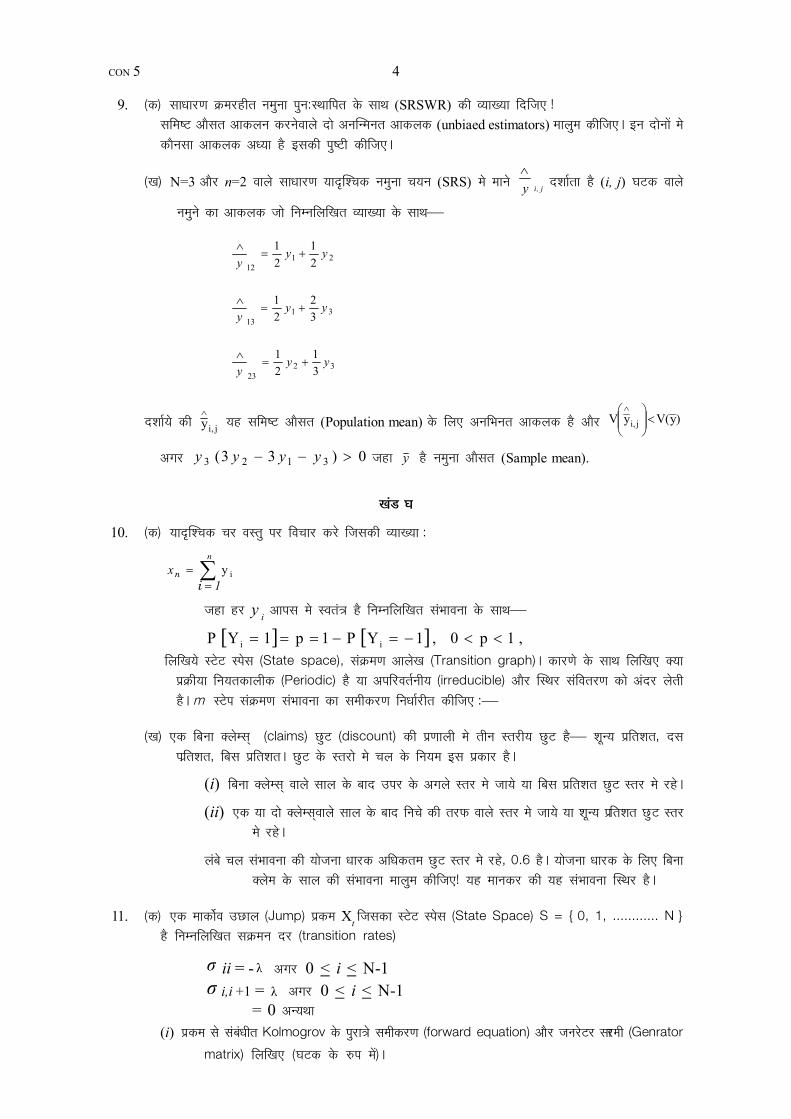
9. (a) Define SRSWR (simple random sample with replacement). Give two unbiased estimatorsof the population mean. Justify which is the better estimator.
(b) In simple reandom sampling with N = 3 n = 2 let ijy denote the estimator based on the
sample that has units (i, j). So defined as follows :—
3223
3113
2112
y31y
21y
y32y
21y
y21y
21y
Show that ijy is unbiased for population mean and ).y(VyV ij if
0)33( 3123 yyyy where y denotes sample mean.
Section D
10. (a) Consider the random variable defined by
n
i1YX
in
with each Yi mutually independent
with probability —
,1p0,1YP1p1YP ii
Write down state space, transition graph. State with reason whether the process isaperiodic, or irreducible and admits a stationary distribution. Derive the expression for mstep transition probabilities.
[Turn over
—3
CON 5 10
(b) A No claim discount system has three levels of discount : zero percent, ten percent, twentypercent. The rules for moving between the discount levels are —
(i) After a claim free year, move upto the next higher level or remain at twentypercent discount level.
(ii) After a year with one or more claims move down to next lower level or remainat zero percent discount level.
The long run probability that a policyholder is in the maximum discount level is 0.6 .Calculate the probability that the policyholder has a claim free year assuming that thisprobability is constant.
11. (a) A Markov jump process Xt with state space S = { 0, 1, ................ N } has thefollowing transition rates :—
i,i = for 0 < i < N-1
1i,i = λ for 0 < i < N-1= 0 otherwise.
(i) Write down the generator matrix and Kolmogorov forward equation associated withthe process (in component form).
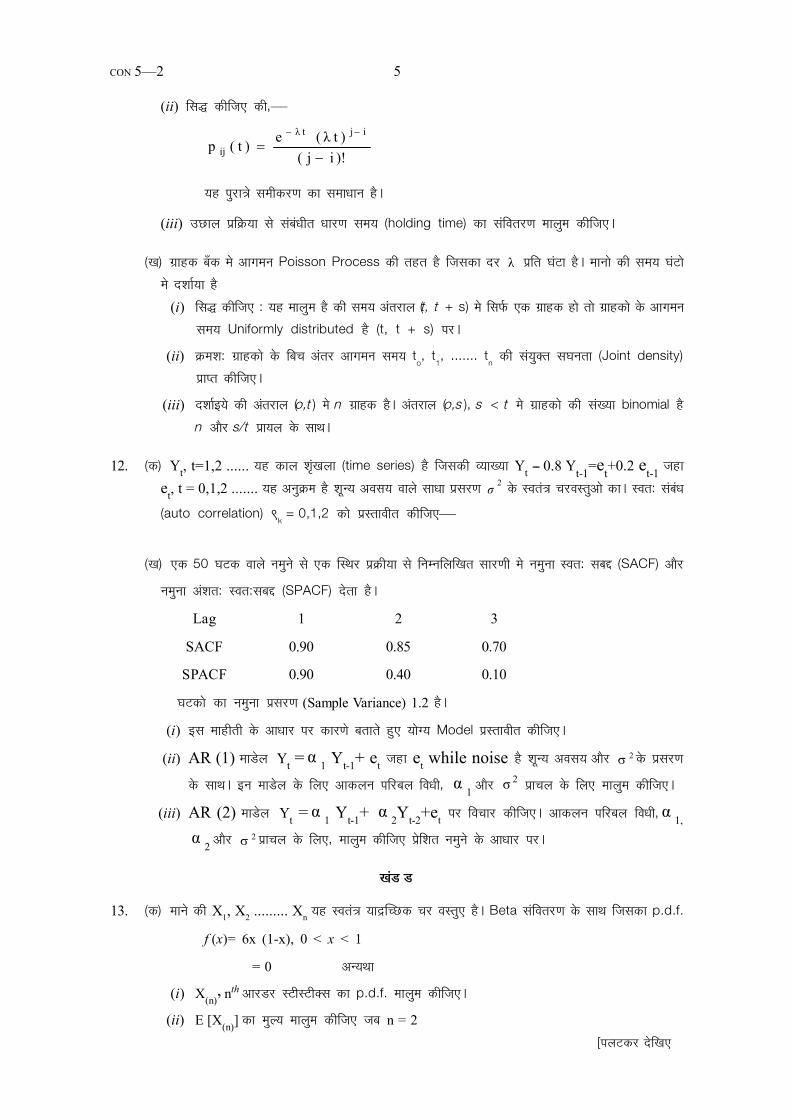
(ii) Show that—
)!ij()t(e)t(p
ijt
ij
is the solution of forward equation.(iii) Obtain the distribution of holding times associated with the jump process.
(b) A Customers arrive at a Bank according to a Poisson process with rate λ per hourAssume time is expressed in hours.—
(i) Show that, given that there is exactly one customer in the time interval (t, t+s) thetime of customer arrival is uniformly distributed on (t, t+s).
(ii) Derive the joint density of interarrival times t0, t1, ........ tn between successivecustomer.
(iii) Show that there is n customers in the interval (0, t) the number of custmers inthe interval (0, s), is binominal with parameters n and s/t.
12. (a) Yt , t = 1,2, ......is time series defined by Yt -- 0.8 Yt-1= et + 0.2 et-1 where et , t = 0,1,2, .......is a sequence of independent zero mean variables with common variance 2 . Derive theautocorrelation 9 k, k = 0, 1, 2.
(b) From a sample of 50 observations from a stationary process the table below gives valuesfor the sample autocorrelation function (SACF) and sample partial autocorrelationfunction (SPACF) :—
Lag 1 2 3SACF 0.90 0.85 0.70
SPACF 0.90 0.40 0.10Sample variance of observations is 1.2.(i) Based on this information suggest an appropriate model giving your reasoning.
(ii) For the AR (1) model Yt = α 1 YYt-1+ et where et is white noise with mean zero andvariance 2. Calculate the method of moments estimates for parameters 1 and 2.
(iii) Consider the AR (2) model Yt = α 1 YYt-1+ α 2Yt-2+et calculate method of momentestimates for the parametrs 1, 2 on the basis of observed sample.
CON 5 11
SECTION E
13. (a) Let X1, X2 ......... Xn be independent random variables with Beta distribution having p.d.f.f (x) = 6x (1-x), 0 < x < 1
= 0 otherwise.(i) Find the p.d.f. of (X(n) ) the nth order statistic.
(ii) Find E (X(n) ) when n = 2
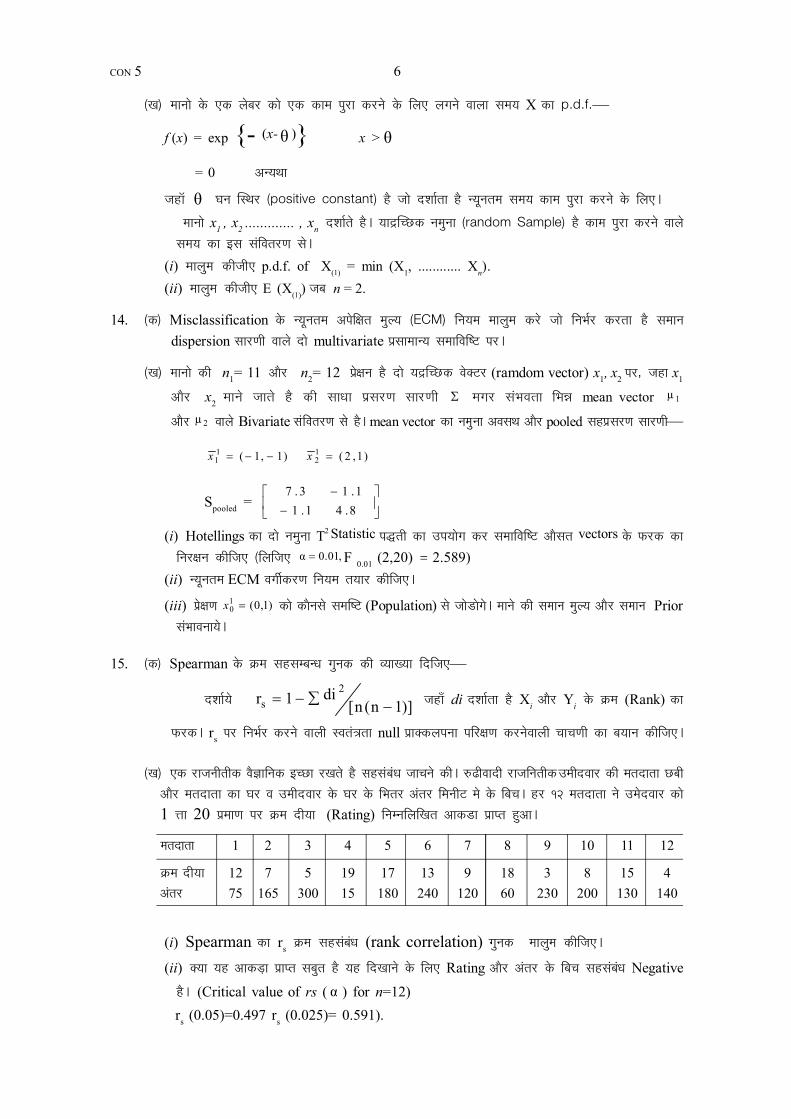
(b) Suppose the length of time x it takes a worker to complete a certain task has the probabilitydensity function.
f (x) = exp {- (x- ) } x > θ= 0 otherwise
where θ is a positive constant that represent the minimum time until the task completion.Let x1 , x2 ............. , xn denote a random sample of completion times from this distri-bution
(i) Find the p. d. f. of (X(1) ) = Min (X1, ............ Xn ).(ii) Find E (X(1) ) when n = 2.
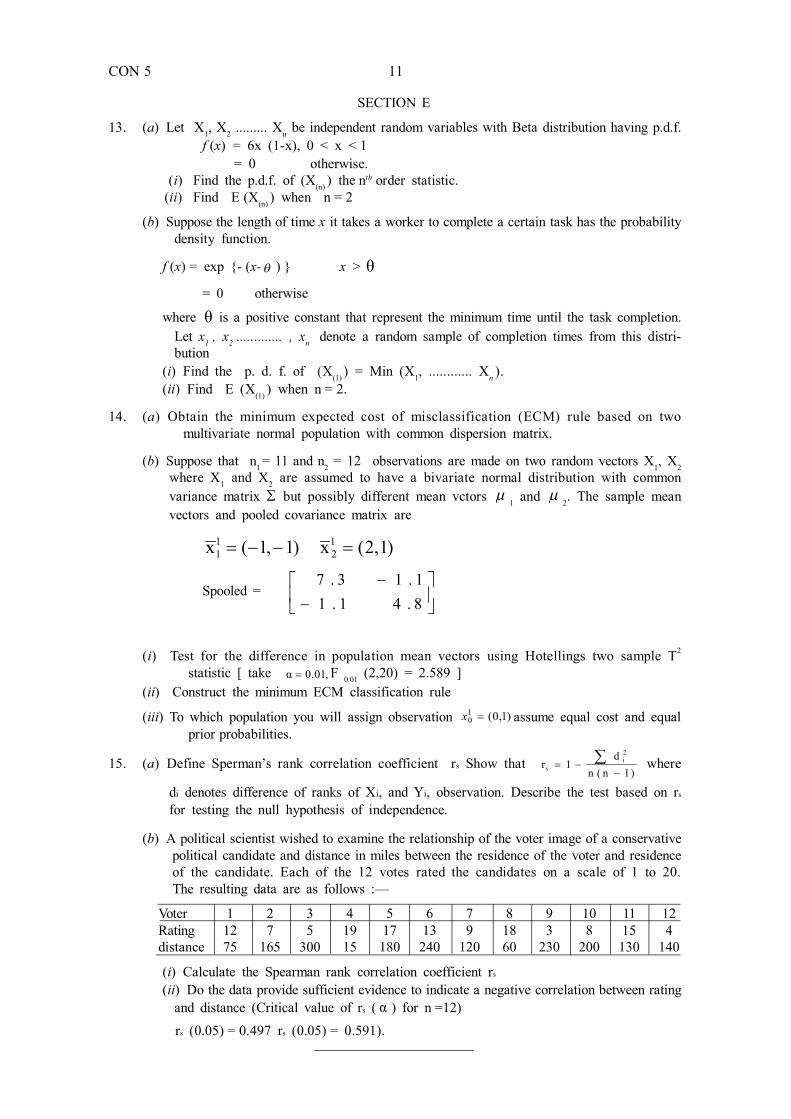
14. (a) Obtain the minimum expected cost of misclassification (ECM) rule based on twomultivariate normal population with common dispersion matrix.
(b) Suppose that n1 = 11 and n2 = 12 observations are made on two random vectors X1, X2where X1 and X2 are assumed to have a bivariate normal distribution with commonvariance matrix but possibly different mean vctors 1 and 2. The sample meanvectors and pooled covariance matrix are
)1,2(x)1,1(x 12
11
Spooled =
8.41.11.13.7
(i) Test for the difference in population mean vectors using Hotellings two sample T2
statistic [ take ,01.0α F 0.01 (2,20) = 2.589 ](ii) Construct the minimum ECM classification rule
(iii) To which population you will assign observation )1,0(10 x assume equal cost and equal
prior probabilities.
15. (a) Define Sperman’s rank correlation coefficient rs Show that )1n(n
d1r
2i
s where
di denotes difference of ranks of Xi, and Yi, observation. Describe the test based on rs
for testing the null hypothesis of independence.
(b) A political scientist wished to examine the relationship of the voter image of a conservativepolitical candidate and distance in miles between the residence of the voter and residenceof the candidate. Each of the 12 votes rated the candidates on a scale of 1 to 20.The resulting data are as follows :—
Voter 1 2 3 4 5 6 7 8 9 10 11 12Rating 12 7 5 19 17 13 9 18 3 8 15 4distance 75 165 300 15 180 240 120 60 230 200 130 140
(i) Calculate the Spearman rank correlation coefficient rs
(ii) Do the data provide sufficient evidence to indicate a negative correlation between ratingand distance (Critical value of rs ( α ) for n =12)
rs (0.05) = 0.497 rs (0.05) = 0.591).
†Öã¤êü¿Ö.—(1) ×�úÆüß ¯ÖÖÑ“Ö ¯ÖÏ¿ÖÖë �êú ˆ¢Ö¸ü ×»Ö�Öë…
(2) ¯ÖÏŸµÖê�ú ¯ÖÏ¿Ö �êú 20 †Ó�ú Æïü…
(3) ˆ¢Ö¸ü ×Æü¤üß †£Ö¾ÖÖ †Ó�ÖÏê•Öß ´Öë Æüß ×»Ö�Öë…
(4) ¯ÖÏŸµÖê�ú �ÖÓ›ü �êú ¯ÖÏ¿ÖÖë �êú ˆ¢Ö ü †»Ö�Ö ˆ¢Ö ü ÖãÛßÖ�úÖ†Öë/†Öã¯Öæ ü�úÖë (ÃÖ¯»Öß´Öë™ËüÃÖ) ¯Ö ü פü‹ •ÖÖÖê “ÖÖ×Æü‹…
(5) ¯ÖÏŸµÖê�ú ¯ÖÏ¿Ö �úÖ ˆ¢Ö¸ü ÖµÖê ¯Öéšü ÃÖê ¿Öãºþ �ú¸ëü †Öî ü ÃÖ²ÖÃÖê ‰ú¯Ö¸ü ¯ÖÏ¿Ö ÃÖÓ�µÖÖ †¾Ö¿µÖ ×»Ö�Öë…
(6) ˆ¢Ö¸ü¯ÖãÛßÖ�úÖ ¯Ö¸ü ÖÖ´Ö, †Öã�Îú´ÖÖÓ�ú †Öפü ˆÖ�êú ×»Ö‹ ×Ö¬ÖÖÔ׸üŸÖ ãÖÖÖ ¯Ö¸ü ×»Ö�Öê •ÖÖ‹Ó… †Öã Öæ ü�úÖë(ÃÖ¯»Öß´Öë™ËüÃÖ) ¯Ö¸ü ÖÖ´Ö †£Ö¾ÖÖ †Öã�Îú´ÖÖÓ�ú ÖÆüà ×»Ö�Öê •ÖÖÖê “ÖÖ×Æü‹…
(7) ˆ´´Öߤü¾ÖÖ¸üÖë �úÖê †¯ÖÖê Æüß ¯ÖêÖ, ¯Öë×ÃÖ»Ö, ‡¸êü•Ö¸ü, ¯Öë×ÃÖ»Ö-¿ÖÖ¯ÖÔÖ¸ü †Öî¸ü ±ãú™üºþ»Ö ‡ÃŸÖê ÖÖ»Ö �ú¸üÖê “ÖÖ×Æü‹…
(8) ˆ´´Öߤü¾ÖÖ¸üÖë �úÖê �úÖê‡Ô ³Öß ÃÖÓ¤ü³ÖÔ ¯Öã×ßÖ�úÖ‹Ó, ¯ÖÖšü¶¯ÖãßÖ�êú, �Ö×�ÖŸÖßµÖ ™êü²Ö»Ö, ‡Ó•Öß×ÖµÖظü�Ö ™êü²Ö»Ö,�îú»ÖŒµÖã»Öê™ü ü †£Ö¾ÖÖ †µÖ ˆ¯Ö�ú¸ü�Ö ÖÆüà פüµÖê •ÖÖ‹Ó�Öê †Öî ü Ö Æüß ˆÆëü ˆÖ�êú ‡ÃŸÖê´ÖÖ»Ö �úß †Öã Öן֤üß •ÖÖ‹�Öß, µÖÆüÖÑ ŸÖ�ú ×�ú ¾Öê ˆÆëü †¯ÖÖê ¯ÖÖÃÖ ¸ü�Ö ³Öß ÖÆüà ÃÖ�ëú�Öê… ‡ÃÖ ×ÖµÖ´Ö �úÖ ˆ»»ÖÓ‘ÖÖ�ú¸üÖê ¯Ö¸ü ¤Óü›ü פüµÖÖ •ÖÖ ÃÖ�úŸÖÖ Æîü…
(9) ÃÖ´ÖÃŸÖ �ú““ÖÖ �úÖµÖÔ (¸ü±ú ¾Ö�Ôú) ˆ¢Ö ü¯ÖãÛßÖ�úÖ �êú †Ó×ŸÖ´Ö ŸÖßÖ †£Ö¾ÖÖ “ÖÖ ü ¯ÖéšüÖë ´Öë ×�úµÖÖ •ÖÖ‹ ; ´ÖÖÓ�ÖÖê¯Ö¸ü †×ŸÖ׸üŒŸÖ ¯ÖãÛßÖ�úÖ‹Ñ ¤üß •ÖÖ‹Ó�Öß, וÖÆëü »ÖÖî™üÖÖê ÃÖê ¯Öæ¾ÖÔ ˆ¢Ö¸ü ÖãÛßÖ�úÖ �êú ÃÖÖ£Ö ÃÖÓ»Ö�Ö ×�úµÖÖ•ÖÖÖÖ “ÖÖ×Æü‹…
¯ÖÏ¿Ö¯Ö¡Ö 2
�ÖÓ›ü �ú
1. (�ú) ×Ö´Ö×»Ö×�ÖŸÖ �úÖê ×ÃÖ¨ü �úßו֋ :—
xx uu nmnm
(�Ö) ×Ö´Ö×»Ö×�ÖŸÖ �úÖê ×ÃÖ¨ü �úßו֋
m....x6.4.25.3.1x
4.23.1x
21x mm 42m2m
¯Ö¤ü
mm)
21x()
21x(
CON 5---1
[¯Ö»Ö™ü�ú ü ¤êüü×�Ö‹
†Ö¸ü.²Öß.‹ÃÖ.²Öß. (†ÖãÃÖÓ¬ÖÖÖ †×¬Ö�úÖ¸üß — ÃÖÖÓ.ÃÖæ.¯ÖÏ.×¾Öü.) 2009R. B. S. B. (R.O.—DSIM) 2009
¯Öæ¾ÖÖÔÆüÖFORENOON
¯Ö¸üß�ÖÖ �æú™üTEST CODE : D
¯ÖÏ¿Ö¯Ö¡Ö 2—(¾Ö�ÖÔÖÖŸ´Ö�ú þֺþ¯Ö)
PAPER II—(DESCRIPTIVE TYPE ON STATISTICS)
[ÃÖ´ÖµÖ : ¯Öæ¾ÖÖÔÆËÖ 9-30 ÃÖê †¯Ö üÖÆËüÖ 12-30 ²Ö•Öê ŸÖ�ú](¯Öæ�ÖÖÕ�ú 100)
[Time : 09-30 A.M. to 12-30 P.M.](Maximum Marks 100)
2. (�ú) x �úß ÃÖÓ�µÖÖ �êú ×»Ö‹ ×Ö´Ö×»Ö×�ÖŸÖ f (x) �úß ÃÖÓ�µÖÖ ×¤üµÖß �ÖµÖß Æîü—f (1)=4, f (2)=5, f (7)=5, f (8)=4
f (6) �úÖ ´Öã»µÖ ´ÖÖ»Öã Ö �úßו֋ †Öî ü µÖÆü ×³Ö ´ÖÖ»Öã Ö �úßו֋ �úß x �úß �úÖîÖÃÖß ÃÖÓ�µÖÖ �êú ×»Ö‹ f (x) †×¬Ö�úŸÖ´Ö
µÖÖ µÖæÖŸÖ´Ö Æîü ?
(�Ö) Ö¤üß ŸÖ»Ö (river bed) �úß ¹Óý¤üß 80 ±úß™ü Æîü, ˆÃÖ�úß �ÖÆü¸üÖ‡Ô ‹�ú ×�úÖÖ¸êü ÃÖê x �úß ¤ãü¸üָ߯ü d ×±ú™ü Æîü •ÖÖê
×Ö´Ö×»Ö×�ÖŸÖ ÃÖÖ¸ü�Öß ´Öê ¤üß �ÖµÖß Æîüîü—x : 0 10 20 30 40 50 60 70 80
d : 0 4 7 9 12 15 14 8 3
×ÃÖ´¯ÖÃÖÖ ‹�ú ס֟ÖÖÓ¿Ö )31( ×ÖµÖ´Ö �úÖ ¯ÖϵÖÖê�Ö �ú¸ü Ö¤üß-ŸÖ»Ö �êú †Ó¿Ö (Cross Section) �úÖ †Ó¤üÖ•ÖßŸÖ �Öê¡Ö±ú»Ö
�úÖ †Öã ÖÖÖ �ú¸êü…
3. (�ú) ´ÖÖÖê AX=0 •ÖÆüÖÑ—
A=
nmmnmm
n
n
aaa
aaa
aaa
.....................
.....................
......................
21
22221
11211
X1= (x1 ,x2, ..................... xn) µÖÆü m ÃÖ´Ö•ÖÖŸÖßµÖ ¸êü�ÖßµÖ ÃÖ´Öß�ú¸ü�Öê �úß n †–ÖÖŸÖÖê ´Öê ¯ÖÏ�ÖÖ»Öß Æîü… †Öî ü
´ÖÖÖ »Öß•Öß‹ �úß n > m ŸÖ²Ö ×ÃÖ ü �úßו֋ �úß µÖÆüÖ ¯Ö¸ü †ÃÖÖ¬ÖÖ¸ü�Ö ÃÖ´ÖÖ¬ÖÖÖ (Non-trivial solution) ´ÖÖî•Öã¤ü
Æîü…
(�Ö) ×Ö´Ö×»Ö×�ÖŸÖ ÃÖ´Öß�ú¸ü�ÖÖê �úÖ ÃÖ´ÖÖ¬ÖÖÖ �ÖÖòÃÖ ×¸ü›üŒ¿ÖÖ ¯Ö¨üŸÖß ÃÖê �ú¸êü :---
x1+x2+2x3 -x4 =4
3x2-x3+4x4 = 2
x1+2x2-3x3 +5x4= 0
x1+x2-5x3 +6x4= 0
�ÖÓ›ü �Ö
4. (�ú) ÃÖ´ÖÖÁÖµÖ�Ö ¯ÖÏןֹý¯Ö ´Öê ›ü´Öß “Ö»Ö �úÖ ¯ÖϵÖÖê�Ö �ú¸ü †Ö¯Ö �Öã�ÖÖŸ´Ö�ú “Ö»Ö �úÖê ×�úÃÖ ŸÖ¸üÆü ×Ö�ÖÔ×´ÖŸÖ �ú¸ëü�Öê ? †�Ö¸ü
´ÖÖ×ÃÖ�ú †ÖÓ�ú›üÖ �ú‡Ô ÃÖÖ»ÖÖê �êú ×»Ö‹ ˆ¯Ö»Ö²¬Ö Æîü ŸÖÖê ×�úŸÖÖê ›ü´Öß “Ö»Ö †Ö¯Ö ×Ö�ÖÔ×´ÖŸÖ �ú¸ëü�Öê µÖÆü ×ÃÖ¨ü �ú¸üÖê �êú
×»Ö‹ : (i) ÃÖ³Öß 12 ´Ö×ÆüÖê ¤ü¿ÖÖÔŸÖê Æîü ´ÖÖêÃÖ´Öß Ö´ÖãÖÖ (ii) ×ÃÖ±Ôú ´ÖÖ“ÖÔ, •ÖæÖ, ÃÖ¯™ëü²Ö¸ü †Öî¸ü ×›üÃÖë²Ö ü ¤ü¿ÖÖÔŸÖê Æîü ´ÖÖêÃÖ´Öß
Ö´ÖãÖÖ (Seasonal Patterns).
(�Ö) ×Ö´Ö×»Ö×�ÖŸÖ †ÖÓ�ú›ÍüÖ 10 ´ÖÆüÖ×¾ÖªÖ»ÖµÖßÖ ×¿Ö�Ö�ú �úß ¿Öãºþ �úÖ ¾ÖêŸÖÖ Ø»Ö�Ö �êú †ÖãÃÖÖ¸ü Æîü… µÖÖê�µÖ ÃÖ´ÖÖÁÖµÖ�Ö
¯ÖÏןֹý¯Ö (Regression Model) �úÖ ˆ¯ÖµÖÖê�Ö �ú¸ü †Ö�ú›ÍüÖ ¤ü¿ÖÖÔµÖê… ´ÖÖò›ü»Ö ÃÖê (i) ¯Öã¹ýÂÖ ´ÖÆüÖ×¾ÖªÖ»ÖµÖ ×¿Ö�Ö�ú
(ii) áÖß ´ÖÆüÖ×¾ÖªÖ»ÖµÖ ×¿Ö�Ö�ú �úÖ ´Ö¬µÖ ¾ÖêŸÖÖ (mean salary) ´ÖÖ»Öã Ö �úßו֋…
¿Öã¹ý �úÖ ¾ÖêŸÖÖ 22 19 18 22 18 21 21 17 18 21
(1000 Rs. ´Öë)
Ø»Ö�Ö M F F M F M M F F M
CON 5 2
CON 5 3
(�Ö) ¸êü�ÖßµÖ ¯ÖÏןֹý¯Ö �êú ÃÖÓ¤ü³ÖÔ ´Öê heteroscedasticity �êú ²ÖÖ¸êü ´Öê †Ö¯Ö ŒµÖÖ –ÖÖÖ ¸ü�ÖŸÖê Æîü ? ‡ÃÖ ŸÖ¸üÆü �êú case
´Öê Generalised Least Square (GLS) «üÖ¸üÖ ¯ÖÏÖ“Ö»Ö �úÖ †Ö�ú»ÖÖ ¯Ö¨üŸÖß �úÖ ¾Ö�ÖÔÖ �úßו֋… GLS
¯ÖÏÖ“Ö»Ö �úß ¾Öî׿ÖšüŸÖÖ (Properties) ×»Ö×�Ö‹…
5. (�ú) ×Ö¾ÖÖÔÆü ¾µÖµÖ ÃÖã“Ö�úÖÓ�ú (Cost of Living Index) ²ÖÖÖÖê ÃÖê ÃÖÓ²ÖÓ¬ÖßŸÖ �úךüÖÖ‡µÖÖêÓ �úÖ ÃÖÓ×�Ö¯ŸÖ ´ÖêÓ ¾Ö�ÖÔÖ �ú¸êü…
(�Ö) ×�úÃÖ ŸÖ üÆü ±úß¿Ö¸ü ÃÖã¡Ö ×Ö¾ÖÖÔÆü ¾µÖµÖ ÃÖã“Ö�úÖÓ�ú ´ÖÖ»Öã Ö �ú¸ü�Öê �êú ×»Ö‹ ×Ö�úÖ»ÖÖ •ÖÖŸÖÖ Æîü… ×ÃÖ ü �úßו֋ �úß ×±ú¿Ö¸ü
ÃÖã¡Ö (i) Factor Reversal †Öî ü (ii) Time reversal “ÖÖ“Ö�Öß ÃÖÓŸÖã™ü �ú¸üŸÖÖ Æîü…
6. (�ú) ¤üÖê †Ö�ÖŸÖ x1, x2 †Öî ü ‹�ú ×Ö�úÖÃÖß q ¾ÖÖ»Öê ˆŸ¯ÖÖ¤üÖ ±ú»ÖÖ (Production function) �úÖ ¾Ö�ÖÔÖ �úßו֋…
ˆŸ¯ÖÖ¤üÖ ±ú»ÖÖ �úÖê ÃÖ´Ö•ÖÖŸÖßµÖ (homogeneous) �ú²Ö �úÆüÖ •ÖÖµÖê�ÖÖ…
(�Ö) �úÖò²Ö-›ü�»ÖÃÖ ˆŸ¯ÖÖ¤üÖ ±ú»ÖÖ q = A α1x .
β2x úÃÖ´Ö•ÖÖŸÖßµÖ Æîü ŒµÖÖ ? †�Ö ü X1 †Öî¸ü X2 �úÖê ²Ö›üÖµÖÖ •ÖÖµÖ ‘Ö™ü�ú
m ÃÖê ŸÖÖê ˆÃÖ�úÖ q ¯Ö¸ü ÆüÖêüÖê¾ÖÖ»ÖÖ ¯Ö¸üßÖÖ´Ö ²ÖµÖÖÖ �úßו֋… βα �êú ´Öã»µÖ ÃÖê ŒµÖÖ ×ÖÂÖ�úÂÖÔ ÃÖÓ³Ö¾Ö Æîü… †�Ö¸
q= 1.01 75.01X 25.0
2X ü ŸÖÖê q ´ÖÖ»Öã Ö �úßו֋ •Ö²Ö (X1 X2) = (121, 138).
�ÖÓ›ü �Ö
7. (�ú) »ÖÖÆü߸üß �úß PPSWR n ×Ö�úÖÃÖ �úÖ Ö´ÖãÖÖ ×Ö�úÖ»ÖÖê �úß ¯Ö¨üŸÖ �úÖ ¾Ö�ÖÔÖ �úßו֋… פü�ÖÖµÖê �úß ‡ÃÖ ¯Ö¨üŸÖ �êú†ÖãÃÖÖ¸ü µÖãÖß™ü i �êú “ÖµÖÖ �úß ÃÖÓ³ÖÖ¾ÖÖÖ ˆÃÖ�êú †Ö�úÖ¸ü �êú †ÖãÃÖÖ¸ü Æîü…
(�Ö) ×Ö´Ö×»Ö×�ÖŸÖ †Ö�ú›ÍüÖ ÃÖÓ²ÖÓ¬ÖßŸÖ Æîü -- N=10 �ÖÖÑ¾Ö ×Ö�úÖ»ÖßµÖê PPSWR 2 -- ×Ö�úÖÃÖ (draws) Ö´ÖãÖÖ—
�ÖÖÑ¾Ö ÃÖÓ�µÖÖ i 1 2 3 4 5 6 7 8 9 10
†Ö�úÖ¸ü X i 15 21 109 51 42 7 11 40 52 32
×Ö´Ö×»Ö×�ÖŸÖ �Îú´Ö¸üפüŸÖ ÃÖÓ�µÖÖ (random number) (i, R) •ÖÖê›üßµÖÖê �úÖ ˆ¯ÖµÖÖê�Ö �úßו֋ •ÖÆüÖÑ 1 < i < 10 †Öî ü1 < R < 109 (7, 25) ; (2, 73) ; (5, 31) ; (7, 73) ; (11, 17) ; (8, 40).
8. (�ú) †Ö¯Ö ßָüß�éúŸÖ Ö´ÖãÖÖ “ÖµÖÖ ¯Ö¨ü×ŸÖ ´Öë ÃÖ´ÖÖÖã ÖןÖ�ú †Ö²ÖÓ™üÖ (Proportional allocation), ‡Â™üŸÖ´Ö †Ö²ÖÓ™üÖ(optimum allocation) †Öî ü ÖêµÖ´ÖÖ †Ö²ÖÓ™üÖ (Neyman allocation) ÃÖê ŒµÖÖ ÃÖ´Ö—ÖŸÖê Æîü…
פü�ÖÖµÖê �úß )y(Vprop)y(V stst
(�Ö) ‹�ú וֻÆêü �úÖ ×ÆüÃÃÖÖ 3 ³ÖÖ�Ö ´Öê ²ÖÖ™üÖ �ÖµÖÖ Æîü… ×Ö´Ö×»Ö×�ÖŸÖ ÃÖÖ¸ü�Öß ´Öê �ÖÖ¾ÖÖê �úß ÃÖÓ�µÖÖ Nh †Öî ü ˆÖ�úÖ ¯ÖÏÃÖ ü�Ö(SD) Sh �ÖêÆÑãü �úß �ÖêŸÖß †ŸÖ¸Óü�ÖŸÖ ³ÖÖ�Ö ×¤üµÖÖ �ÖµÖÖ Æîü—
³ÖÖ�Ö �Îú. �ÖÖÑ¾Ö �úß ÃÖÓ�µÖÖ ¯ÖÏÃÖ¸ü�Öh Nh (Standard Deviation) Sh
1 15 100
2 10 50
3 25 120
20 �ÖÖѾÖÖê �úÖ Ö´ÖãÖÖ “ÖµÖÖ �ú¸üÖÖ Æîü… Æü¸ü ³ÖÖ�Ö ´Öê ÃÖê ×�úŸÖÖê �ÖÖÑ¾Ö �úÖ “ÖµÖÖ �ú¸üÖÖ ÆüÖê�ÖÖ …(i) ÃÖ´ÖÖÖã ÖןÖ�ú †Ö²ÖÓ™üÖ
(ii) ÖêµÖµÖÖ †Ö²ÖÓ™üÖ �êú †ÖãÃÖÖ¸ü…
[¯Ö»Ö™ü�ú ü ¤êüü×�Ö‹
9. (�ú) ÃÖÖ¬ÖÖ¸ü�Ö �Îú´Ö¸üÆüßŸÖ Ö´ÖãÖÖ ¯ÖãÖ:ãÖÖ×¯ÖŸÖ �êú ÃÖÖ£Ö (SRSWR) �úß ¾µÖÖ�µÖÖ ×¤üו֋ !ÃÖ×´Ö™ü †ÖîÃÖŸÖ †Ö�ú»ÖÖ �ú¸üÖê¾ÖÖ»Öê ¤üÖê †ÖÛ´ÖÖŸÖ †Ö�ú»Ö�ú (unbiaed estimators) ´ÖÖ»Öã Ö �úßו֋… ‡Ö ¤üÖêÖÖë ´Öê�úÖîÖÃÖÖ †Ö�ú»Ö�ú †¬µÖÖ Æîü ‡ÃÖ�úß ¯Öã™üß �úßו֋…
(�Ö) N=3 †Öî ü n=2 ¾ÖÖ»Öê ÃÖÖ¬ÖÖ¸ü�Ö µÖÖ¥üÛ¿“Ö�ú Ö´ÖãÖÖ “ÖµÖÖ (SRS) ´Öê ´ÖÖÖê y
i, j ¤ü¿ÖÖÔŸÖÖ Æîü (i, j) ‘Ö™ü�ú ¾ÖÖ»Öê
Ö´ÖãÖê �úÖ †Ö�ú»Ö�ú •ÖÖê ×Ö´Ö×»Ö×�ÖŸÖ ¾µÖÖ�µÖÖ �êú ÃÖÖ£Ö—
3223
3113
2112
31
21
32
21
21
21
yyy
yyy
yyy
¤ü¿ÖÖÔµÖê �úß j,iy
µÖÆü ÃÖ×´Ö™ü †ÖîÃÖŸÖ (Population mean) �êú ×»Ö‹ †Ö׳ÖÖŸÖ †Ö�ú»Ö�ú Æîü †Öî ü )y(VyV j,i
†�Ö¸ 0)33( 3123 yyyy •ÖÆüÖ y Æîü Ö´ÖãÖÖ †ÖîÃÖŸÖ (Sample mean).
�ÖÓ›ü ‘Ö
10. (�ú) µÖÖ¥üÛ¿“Ö�ú “Ö¸ü ¾ÖßÖã ¯Ö¸ü ×¾Ö“ÖÖ¸ü �ú¸êü וÖÃÖ�úß ¾µÖÖ�µÖÖ :
n
1x
in iy
•ÖÆüÖ Æü¸ü y i †Ö¯ÖÃÖ ´Öê þ֟ÖÓ¡Ö Æîü ×Ö´Ö×»Ö×�ÖŸÖ ÃÖÓ³ÖÖ¾ÖÖÖ �êú ÃÖÖ£Ö—
,1p0,1YP1p1YP ii ×»Ö×�ÖµÖê Ùêü™ü ïÖêÃÖ (State space), ÃÖÓ�Îú´Ö�Ö †Ö»Öê�Ö (Transition graph)… �úÖ¸ü�Öê �êú ÃÖÖ£Ö ×»Ö×�Ö‹ ŒµÖÖ
¯ÖÏ�ÎúßµÖÖ ×ÖµÖŸÖ�úÖ»Öß�ú (Periodic) Æüî µÖÖ †¯Ö׸ü¾ÖŸÖÔÖßµÖ (irreducible) †Öî ü Ûãָü ÃÖÓ×¾ÖŸÖ¸ü�Ö �úÖê †Ó¤ü¸ü »ÖêŸÖßÆîü… m Ùêü¯Ö ÃÖÓ�Îú´Ö�Ö ÃÖÓ³ÖÖ¾ÖÖÖ �úÖ ÃÖ´Öß�ú¸ü�Ö ×Ö¬ÖÖÔ üßŸÖ �úßו֋ :—
(�Ö) ‹�ú ײÖÖÖ Œ»Öê ÃÖË (claims) ”ãû™ü (discount) �úß ¯ÖÏ�ÖÖ»Öß ´Öê ŸÖßÖ ÃŸÖ¸üßµÖ ”ãû™ü Æîü— ¿ÖæµÖ ¯ÖÏןֿ֟Ö, ¤üÃÖ¯Ö×ÏŸÖ¿ÖŸÖ, ײÖÃÖ ¯ÖÏןֿ֟օ ”ãû™ü �êú ßָüÖê ´Öê “Ö»Ö �êú ×ÖµÖ´Ö ‡ÃÖ ¯ÖÏ�úÖ¸ü Æîü…
(i) ײÖÖÖ Œ»Öê ÃÖË ¾ÖÖ»Öê ÃÖÖ»Ö �êú ²ÖÖ¤ü ˆ¯Ö¸ü �êú †�Ö»Öê ßָü ´Öê •ÖÖµÖê µÖÖ ×²ÖÃÖ ¯ÖÏ×ŸÖ¿ÖŸÖ ”ãû™ü ßָü ´Öê ¸üÆêü…
(ii) ‹�ú µÖÖ ¤üÖê Œ»Öê ÃÖ˾ÖÖ»Öê ÃÖÖ»Ö �êú ²ÖÖ¤ü ×Ö“Öê �úß ŸÖ¸ü±ú ¾ÖÖ»Öê ÃŸÖ ü ´Öê •ÖÖµÖê µÖÖ ¿ÖæµÖ ¯ÖÏ×ŸÖ¿ÖŸÖ ”ãû™ü ßָü´Öê ¸üÆêü…
»ÖÓ²Öê “Ö»Ö ÃÖÓ³ÖÖ¾ÖÖÖ �úß µÖÖê•ÖÖÖ ¬ÖÖ¸ü�ú †×¬Ö�úŸÖ´Ö ”ãû™ü ßָü ´Öê ¸üÆêü, 0.6 Æîü… µÖÖê•ÖÖÖ ¬ÖÖ¸ü�ú �êú ×»Ö‹ ײÖÖÖŒ»Öê Ö �êú ÃÖÖ»Ö �úß ÃÖÓ³ÖÖ¾ÖÖÖ ´ÖÖ»Öã Ö �úßו֋! µÖÆü ´ÖÖÖ�ú¸ü �úß µÖÆü ÃÖÓ³ÖÖ¾ÖÖÖ Ûãָü Æîü…
11. (�ú) ‹�ú ´ÖÖ�úÖì¾Ö ˆ”ûÖ»Ö (Jump) ¯ÖÏ�ú´Ö Xt וÖÃÖ�úÖ Ã™êü™ü ïÖêÃÖ (State Space) S = { 0, 1, ............ N }Æîü ×Ö´Ö×»Ö×�ÖŸÖ ÃÖ�Îú´ÖÖ ¤ü¸ü (transition rates)
σ ii = - λ †�Ö¸ü 0 < i < N-1σ i,i +1 = λ †�Ö¸ü 0 < i < N-1
= 0 †µÖ£ÖÖ
(i) ¯ÖÏ�ú´Ö ÃÖê ÃÖÓ²ÖÓ¬ÖßŸÖ Kolmogrov �êú ¯Öã üÖ¡Öê ÃÖ´Öß�ú¸ü�Ö (forward equation) †Öî¸ü •ÖÖ êü™ü ü ÃÖÖ ü´Öß (Genrator
matrix) ×»Ö×�Ö‹ (‘Ö™ü�ú �êú ¹ý¯Ö ´Öë)…
CON 5 4
(ii) ×ÃÖ¨ü �úßו֋ �úß,—
)!ij()tλ(e)t(p
ijtλ
ij
µÖÆü ¯Öã üÖ¡Öê ÃÖ´Öß�ú¸ü�Ö �úÖ ÃÖ´ÖÖ¬ÖÖÖ Æîü…
(iii) ˆ”ûÖ»Ö ¯ÖÏ×�ÎúµÖÖ ÃÖê ÃÖÓ²ÖÓ¬ÖßŸÖ ¬ÖÖ¸ü�Ö ÃÖ´ÖµÖ (holding time) �úÖ ÃÖÓ×¾ÖŸÖ¸ü�Ö ´ÖÖ»Öã Ö �úßו֋…
(�Ö) �ÖÏÖÆü�ú ²ÖÑ�ú ´Öê †Ö�Ö´ÖÖ Poisson Process �úß ŸÖÆüŸÖ Æîü וÖÃÖ�úÖ ¤ü¸ü λ ¯ÖÏ×ŸÖ ‘ÖÓ™üÖ Æîü… ´ÖÖÖÖê �úß ÃÖ´ÖµÖ ‘ÖÓ™üÖê
´Öê ¤ü¿ÖÖÔµÖÖ Æîü
(i) ×ÃÖ¨ü �úßו֋ : µÖÆü ´ÖÖ»Öã´Ö Æîü �úß ÃÖ´ÖµÖ †ÓŸÖ¸üÖ»Ö (t, t + s) ´Öê ×ÃÖ±Ôú ‹�ú �ÖÏÖÆü�ú ÆüÖê ŸÖÖê �ÖÏÖÆü�úÖê �êú †Ö�Ö´ÖÖ
ÃÖ´ÖµÖ Uniformly distributed Æîü (t, t + s) ¯Ö¸ü…ü
(ii) �Îú´Ö¿Ö: �ÖÏÖÆü�úÖê �êú ×²Ö“Ö †ÓŸÖ¸ü †Ö�Ö´ÖÖ ÃÖ´ÖµÖ to, t
1, ....... t
n �úß ÃÖÓµÖãŒŸÖ ÃÖ‘ÖÖŸÖÖ (Joint density)
¯ÖÏÖ¯ŸÖ �úßו֋…
(iii) ¤ü¿ÖÖÔ‡µÖê �úß †ÓŸÖ üÖ»Ö (o,t) ´Öê n �ÖÏÖÆü�ú Æîü… †ÓŸÖ üÖ»Ö (o,s), s < t ´Öê �ÖÏÖÆü�úÖê �úß ÃÖÓ�µÖÖ binomial Æîü
n †Öî ü s/t ¯ÖÏÖµÖ»Ö �êú ÃÖÖ£Ö…
12. (�ú) Yt, t=1,2 ...... µÖÆü �úÖ»Ö ¿ÖéÓ�Ö»ÖÖ (time series) Æîü וÖÃÖ�úß ¾µÖÖ�µÖÖ Yt -- 0.8 Yt-1=et+0.2 et-1 •ÖÆüÖet, t = 0,1,2 ....... µÖÆü †Öã�Îú´Ö Æîü ¿ÖæµÖ †¾ÖÃÖµÖü ¾ÖÖ»Öê ÃÖÖ¬ÖÖ ¯ÖÏÃÖ ü�Ö σ 2 �êú þ֟ÖÓ¡Ö “Ö¸ü¾ÖßÖã†Öê �úÖ… þ֟Ö: ÃÖÓ²ÖÓ¬Ö
(auto correlation) 9k= 0,1,2 �úÖê ¯ÖÏßÖÖ¾ÖßŸÖ �úßו֋—
(�Ö) ‹�ú 50 ‘Ö™ü�ú ¾ÖÖ»Öê Ö´ÖãÖê ÃÖê ‹�ú Ûãָü ¯ÖÏ�ÎúßµÖÖ ÃÖê ×Ö´Ö×»Ö×�ÖŸÖ ÃÖÖ¸ü�Öß ´Öê Ö´ÖãÖÖ Ã¾ÖŸÖ: ÃÖ²Ö§ü (SACF) †Öî ü
Ö´ÖãÖÖ †Ó¿ÖŸÖ: þ֟Ö:ÃÖ²Ö§ü (SPACF) ¤êüŸÖÖ Æîü…
Lag 1 2 3
SACF 0.90 0.85 0.70
SPACF 0.90 0.40 0.10
‘Ö™ü�úÖê �úÖ Ö´ÖãÖÖ ¯ÖÏÃÖ¸ü�Ö (Sample Variance) 1.2 Æîü…
(i) ‡ÃÖ ´ÖÖÆüߟÖß �êú †Ö¬ÖÖ¸ü ¯Ö¸ü �úÖ¸�Öê ²ÖŸÖÖŸÖê Æãü‹ µÖÖê�µÖ Model ¯ÖÏßÖÖ¾ÖßŸÖ �úßו֋…
(ii) AR (1) ´ÖÖ›êü»Ö úYt = α 1 Yt-1+ et •ÖÆüüÖ et while noise Æîü ¿ÖæµÖ †¾ÖÃÖµÖü †Öî ü 2 �êú ¯ÖÏÃÖ¸ü�Ö
�êú ÃÖÖ£Ö… ‡Ö ´ÖÖ›êü»Ö �êú ×»Ö‹ †Ö�ú»ÖÖ ¯Ö׸ü²Ö»Ö ×¾Ö¬Öß, α 1 †Öî ü 2σ ¯ÖÏÖ“Ö»Ö �êú ×»Ö‹ ´ÖÖ»Öã Ö �úßו֋…
(iii) AR (2) ´ÖÖ›êü»Ö úYt = α 1 Yt-1+ α 2Yt-2+et ¯Ö¸ ×¾Ö“ÖÖ¸ü �úßו֋… †Ö�ú»ÖÖ ¯Ö׸ü²Ö»Ö ×¾Ö¬Öß, α 1,
α2 †Öî ü 2 ¯ÖÏÖ“Ö»Ö �êú ×»Ö‹, ´ÖÖ»Öã Ö �úßו֋ ¯ÖÏê×¿ÖŸÖ Ö´ÖãÖê �êú †Ö¬ÖÖ¸ ü¯Ö¸ü…
�ÖÓ›ü ›ü
13. (�ú) ´ÖÖÖê �úß X1, X2 ......... Xn µÖÆü þ֟ÖÓ¡Ö µÖÖ¦üÛ“”û�ú “Ö¸ü ¾ÖßÖã‹ Æîü… Beta ÃÖÓ×¾ÖŸÖ¸ü�Ö �êú ÃÖÖ£Ö ×•ÖÃÖ�úÖ p.d.f.
f (x)= 6x (1-x), 0 < x < 1
= 0 †µÖ£ÖÖ
(i) X(n), nth †Ö¸ü›ü¸ü ÙßÙüߌÃÖ �úÖ p.d.f. ´ÖÖ»Öã Ö �úßו֋…
(ii) E [X(n)] �úÖ ´Öã»µÖ ´ÖÖ»Öã Ö �úßו֋ •Ö²Ö n = 2
CON 5—2 5
[¯Ö»Ö™ü�ú ü ¤êüü×�Ö‹
CON 5 6
(�Ö) ´ÖÖÖÖê �êú ‹�ú »Öê²Ö¸ü �úÖê ‹�ú �úÖ´Ö ¯Öã üÖ �ú¸üÖê �êú ×»Ö‹ »Ö�ÖÖê ¾ÖÖ»ÖÖ ÃÖ´ÖµÖ X �úÖ p.d.f.—
f (x) = exp {- (x-θ )} x >θ
= 0 †µÖ£ÖÖ
•ÖÆüÖò θ ‘ÖÖ Ûãָü (positive constant) Æîü •ÖÖê ¤ü¿ÖÖÔŸÖÖ Æîü µÖæÖŸÖ´Ö ÃÖ´ÖµÖ �úÖ´Ö ¯Öã üÖ �ú¸üÖê �êú ×»Ö‹…
´ÖÖÖÖê x1 , x2 ............. , xn ¤ü¿ÖÖÔŸÖê Æîü… µÖÖ¦üÛ“”û�ú Ö´ÖãÖÖ (random Sample) Æîü �úÖ´Ö ¯Öã üÖ �ú¸üÖê ¾ÖÖ»ÖêÃÖ´ÖµÖ �úÖ ‡ÃÖ ÃÖÓ×¾ÖŸÖ¸ü�Ö ÃÖê…
(i) ´ÖÖ»Öã Ö �úß•Öß‹ p.d.f. of X(1) = min (X1, ............ Xn).(ii) ´ÖÖ»Öã Ö �úß•Öß‹ E (X(1)) •Ö²Ö n = 2.
14. (�ú) Misclassification �êú µÖæÖŸÖ´Ö †¯Öê×�ÖŸÖ ´Öã»µÖ (ECM) ×ÖµÖ´Ö ´ÖÖ»Öã Ö �ú¸êü •ÖÖê ×Ö³ÖÔ ü �ú¸üŸÖÖ Æîü ÃÖ´ÖÖÖdispersion ÃÖÖ¸ü�Öß ¾ÖÖ»Öê ¤üÖê multivariate ¯ÖÏÃÖÖ´ÖÖµÖ ÃÖ´ÖÖ×¾Ö×™ü ¯Ö¸ü…
(�Ö) ´ÖÖÖÖê �úß n1= 11 †Öî ü n2= 12 ¯ÖÏê�ÖÖ Æîü ¤üÖê µÖ¦üÛ“”û�ú ¾Öꌙü¸ü (ramdom vector) x1, x2 ¯Ö¸ü, •ÖÆüÖ x1
†Öî ü x2 ´ÖÖÖê •ÖÖŸÖê Æîü �úß ÃÖÖ¬ÖÖ ¯ÖÏÃÖ¸ü�Ö ÃÖÖ¸ü�Öß ´Ö�Ö¸ü ÃÖÓ³Ö¾ÖŸÖÖ ×³Ö®Ö mean vector 1µ
†Öî¸ü 2µ ú¾ÖÖ»Öê Bivariate ÃÖÓ×¾ÖŸÖ ü�Ö ÃÖê Æîü… mean vector �úÖ Ö´ÖãÖÖ †¾ÖÃÖ£Ö †Öî ü pooled ÃÖÆü ÖÏÃÖ ü�Ö ÃÖÖ ü�Öß—
)1,2()1,1( 12
11 xx
Spooled =
8.41.11.13.7
(i) Hotellings �úÖ ¤üÖê Ö´ÖãÖÖ T2 Statistic ¯Ö¨üŸÖß �úÖ ˆ¯ÖµÖÖê�Ö �ú¸ü ÃÖ´ÖÖ×¾Ö×™ü †ÖîÃÖŸÖ vectors �êú ±ú¸ü�ú �úÖ×Ö¸ü�ÖÖ �úßו֋ (×»Öו֋ ,01.0α F 0.01 (2,20) = 2.589)
(ii) µÖæÖŸÖ´Ö ECM ¾Ö�Öá�ú¸ü�Ö ×ÖµÖ´Ö ŸÖµÖÖ¸ü �úßו֋…
(iii) ¯ÖÏê�Ö�Ö )1,0(10 x �úÖê �úÖîÖÃÖê ÃÖ´ÖÛ™ü (Population) ÃÖê •ÖÖê›üÖê�Öê… ´ÖÖÖê �úß ÃÖ´ÖÖÖ ´Öã»µÖ †Öî¸ü ÃÖ´ÖÖÖ ü Prior
ÃÖÓ³ÖÖ¾ÖÖÖµÖê…
15. (�ú) Spearman �êú �Îú´Ö ÃÖÆüÃÖ´²Ö¬Ö �ÖãÖ�ú �úß ¾µÖÖ�µÖÖ ×¤üו֋—
¤ü¿ÖÖÔµÖê )]1n(n[di1r
2s •ÖÆüÖÑ di ¤ü¿ÖÖÔŸÖÖ Æîü Xi †Öî ü Yi �êú �Îú´Ö (Rank) �úÖ
±ú¸ü�ú… rs ¯Ö¸ü ×Ö³ÖÔ ü �ú¸üÖê ¾ÖÖ»Öß Ã¾ÖŸÖÓ¡ÖŸÖÖ null ¯ÖÏÖŒ�ú»Ö¯ÖÖÖ ¯Ö׸ü�Ö�Ö �ú¸üÖê¾ÖÖ»Öß “ÖÖ“Ö�Öß �úÖ ²ÖµÖÖÖ �úßו֋…
(�Ö) ‹�ú ¸üÖ•ÖÖߟÖß�ú ¾Öî–ÖÖ×Ö�ú ‡“”ûÖ ü�ÖŸÖê Æîü ÃÖÆüÃÖÓ²ÖÓ¬Ö •ÖÖ“ÖÖê �úß… ¹ýœüß¾ÖÖ¤üß ¸üÖ•Ö×ÖŸÖß�ú ˆ´Öߤüü¾ÖÖ¸ü �úß ´ÖŸÖ¤üÖŸÖÖ ”û²Ö߆Öî ü ´ÖŸÖ¤üÖŸÖÖ �úÖ ‘Ö¸ü ¾Ö ˆ´Öߤüü¾ÖÖ¸ü �êú ‘Ö¸ü �êú ׳ָ֟ü †ÓŸÖ¸ü ×´ÖÖß™ü ´Öê �êú ײ֓օ Æü¸ü 12 ´ÖŸÖ¤üÖŸÖÖ Öê ˆ´Öê¤ü¾ÖÖ¸ü �úÖê1 ¢ÖÖ 20 ¯ÖÏ ÖÖ�Ö ¯Ö¸ü �Îú´Ö ¤üßµÖÖ (Rating) ×Ö´Ö×»Ö×�ÖŸÖ †Ö�ú›üÖ ¯ÖÏÖ¯ŸÖ Æãü†Ö…
´ÖŸÖ¤üÖŸÖÖ 1 2 3 4 5 6 7 8 9 10 11 12
�Îú´Ö ¤üßµÖÖ 12 7 5 19 17 13 9 18 3 8 15 4†ÓŸÖ ü 75 165 300 15 180 240 120 60 230 200 130 140
(i) Spearman �úÖ rs �Îú´Ö ÃÖÆüÃÖÓ²ÖÓ¬Ö (rank correlation) �ÖãÖ�ú ´ÖÖ»Öã Ö �úßו֋…(ii) ŒµÖÖ µÖÆü †Ö�ú›üÍÖ ¯ÖÏÖ¯ŸÖ ÃÖ²ÖãŸÖ Æîü µÖÆü פü�ÖÖÖê �êú ×»Ö‹ Rating †Öî ü †ÓŸÖ¸ü �êú ×²Ö“Ö ÃÖÆüÃÖÓ²ÖÓ¬Ö Negative
Æîü… (Critical value of rs ( α ) for n=12) rs (0.05)=0.497 rs (0.025)= 0.591).


![C:Documents and SettingsAdmin - Maharashtra · 2016-11-08 · who are registered practitioners possessing 1 [any of the recognised medical quali-fications] and are engaged in teaching](https://img.pdfslide.us/doc/110x75/5ea439712538604a26226754/cdocuments-and-settingsadmin-maharashtra-2016-11-08-who-are-registered-practitioners.jpg)