Embed Size (px)
Citation preview
CDM BaselineConstruction forVietnam NationalElectricity Grid
Tran Minh TuyenAxel Michaelowa
HWWA DISCUSSION PAPER
295Hamburgisches Welt-Wirtschafts-Archiv (HWWA)
Hamburg Institute of International Economics2004
ISSN 1616-4814
Hamburgisches Welt-Wirtschafts-Archiv (HWWA)Hamburg Institute of International EconomicsNeuer Jungfernstieg 21 – 20347 Hamburg, GermanyTelefon: 040/428 34 355Telefax: 040/428 34 451e-mail: [email protected]: http://www.hwwa.de
The HWWA is a member of:
• Wissenschaftsgemeinschaft Gottfried Wilhelm Leibniz (WGL)• Arbeitsgemeinschaft deutscher wirtschaftswissenschaftlicher Forschungsinstitute
(ARGE)• Association d’Instituts Européens de Conjoncture Economique (AIECE)
HWWA Discussion Paper
CDM BaselineConstruction for VietnamNational Electricity Grid
Tran Minh TuyenAxel Michaelowa
HWWA Discussion Paper 295http://www.hwwa.de
Hamburg Institute of International Economics (HWWA)Neuer Jungfernstieg 21 – 20347 Hamburg, Germany
e-mail: [email protected]
This paper profited from a short stay by Tran Minh Tuyen as a guest researcher atHamburg Institute of International Economics in June 2004. We thank Dr. Nguyen TienNguyen from the Research Center for Energy and Environment and Dr. Bui Huy Phungfrom the Vietnamese Academy of Science and Technology (National Center for NaturalScience and Technology of Vietnam) for valuable information.
Edited by the Department World EconomyHead: PD Dr. Carsten Hefeker
HWWA DISCUSSION PAPER 295September 2004
CDM Baseline Construction for VietnamNational Electricity Grid
ABSTRACT
For projects under the Clean Development Mechanism (CDM), a baseline has to be setto allow calculation of the greenhouse gas emissions reductions achieved. An importantobstacle to CDM project development is the lack of data for baseline definition; oftenproject developers do not have access to data and therefore incur high transaction coststo collect them. The government of Vietnam has set up all necessary institutions forCDM, wants to promote CDM projects and thus is interested to reduce transaction costs.We calculate emission factors of the Vietnam electricity grid according to the rulesdefined by the CDM Executive Board for small scale projects and for large renewableelectricity generation projects. The emission factors lie between 365 and 899 gCO2/kWh depending on the specification. The weighted operating and build marginreaches 600 g for 2003, while grid average reaches 399 g. Using three-year averages, acombined build and operating margin of 705 g is calculated. We hope that these datafacilitate CDM project development in the electricity supply and energy efficiencyimprovement in Vietnam.
Key words: CDM, baseline, electricity generation, Vietnam
JEL codes: D62, F18, Q25, Q41
Tran Minh TuyenResearch Center for Energy and the Environment,Lane 62, Nguyen Chi Thanh Street,Hanoi, VietnamTel: +84 4 7733686Fax: +84 4 7734022E-mail: [email protected]
Axel MichaelowaHamburg Institute of International Economics (HWWA)Neuer Jungfernstieg 2120347 HamburgTel: 040-42834-309Fax: 040-42834-367E-mail: [email protected]
2
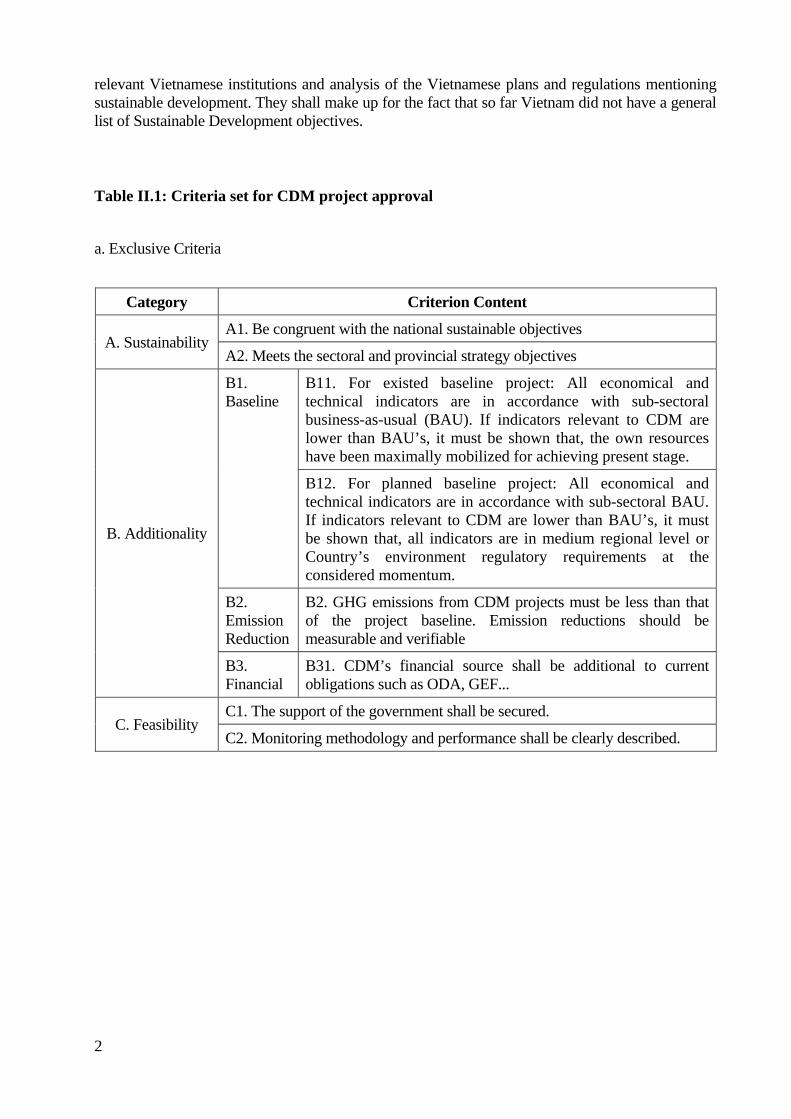
relevant Vietnamese institutions and analysis of the Vietnamese plans and regulations mentioningsustainable development. They shall make up for the fact that so far Vietnam did not have a generallist of Sustainable Development objectives.
Table II.1: Criteria set for CDM project approval
a. Exclusive Criteria
Category Criterion Content
A1. Be congruent with the national sustainable objectivesA. Sustainability
A2. Meets the sectoral and provincial strategy objectives
B11. For existed baseline project: All economical andtechnical indicators are in accordance with sub-sectoralbusiness-as-usual (BAU). If indicators relevant to CDM arelower than BAU’s, it must be shown that, the own resourceshave been maximally mobilized for achieving present stage.
B1.Baseline
B12. For planned baseline project: All economical andtechnical indicators are in accordance with sub-sectoral BAU.If indicators relevant to CDM are lower than BAU’s, it mustbe shown that, all indicators are in medium regional level orCountry’s environment regulatory requirements at theconsidered momentum.
B2.EmissionReduction
B2. GHG emissions from CDM projects must be less than thatof the project baseline. Emission reductions should bemeasurable and verifiable
B. Additionality
B3.Financial
B31. CDM’s financial source shall be additional to currentobligations such as ODA, GEF...
C1. The support of the government shall be secured.C. Feasibility
C2. Monitoring methodology and performance shall be clearly described.
1
I. Introduction
Vietnam is embarking on an active role in the international CDM market. To be an attractivehost, the transaction costs for project developers have to be minimised. As determination of thebaseline can be one of the most complex and costly parts of a Project Design Document,provision of baseline data plays an important role in increasing attractiveness to projectdevelopers. This paper provides data for all approved methodologies for projects that provideelectricity to the grid. All data are referenced to the official sources, thus allowing to fully quotethem in case an Operational Entity or the Executive Board requires to do so.
II. CDM institutions and approval criteria in Vietnam1
Vietnam fulfils all requirements to be a CDM host country. It has signed and ratified UNFCCC in1994, signed the Kyoto Protocol in 1997 and ratified it on August 20, 2002. The ratification comesinto force in September 25, 2002.
The Vietnamese government is highly interested in the climate change issue. It considers that theglobal warming due to anthropogenic greenhouse gases is a real threat and Vietnam is one of themost vulnerable countries. By participating in CDM, Vietnam wants to show its willingness tocontribute to global environmental protection while looking for additional investment and fortechnology transfer.
In June 2003, the Vietnamese government designated the National Office for Climate Change andOzone Protection (NOCCOP), part of the International Cooperation Department (ICD) of theMinistry of Natural Resources and Environment (MONRE) as CDM National Authority (CNA)2.Moreover, the CDM National Executive and Consultative Board was established in April 20033. Itis composed of government officials from MONRE, Ministry of Planning and Investment (MPI),Ministry of Science and Technology (MOST), Ministry of Finance (MOF), Ministry of ForeignAffairs (MOFA), Ministry of Industry (MOI), Ministry of Agriculture and Rural Development(MOARD), Ministry of Trade (MOT), Ministry of Training and Education (MOTE), and arepresentative from Viet Nam Union of Science and Technology Associations (VUSTA). TheBoard is chaired by the Director General of ICD, MONRE. It is responsible for approving projectproposals and for the definition of project eligibility criteria.
CNA‘s functions are as follows:
− Undertake the administrative functions of the Board.
− Liaison with project developers and with the UNFCCC CDM Executive Board.
− Provide information related to CDM to interested investors and hosts companies,national and international operation entities, and consultants.
The Board has defined a detailed set of CDM eligibility criteria that consist of a set of exclusivecriteria that have to be fulfilled by all projects and a set of further criteria that define the project’simportance. The latter have been identified after consultation with selected stakeholders in the
1 This section is based on Ministry of Natural Resources and Environment (2003).2 Contact address : Department of International Cooperation, MONRE, 83-Nguyen Chi Thanh Str., Hanoi, Vietnam,Tel: 84-4-8357910/Fax: 84-4-83521913 Decision No. 553 by MONRE. Contact address : National Office for Climate Change&Ozone Protection, 57 NguyenDu Str., Hanoi, Vietnam, Tel: 84-4-8228974/Fax: 84-4-8263847, E-mail: [email protected]
3
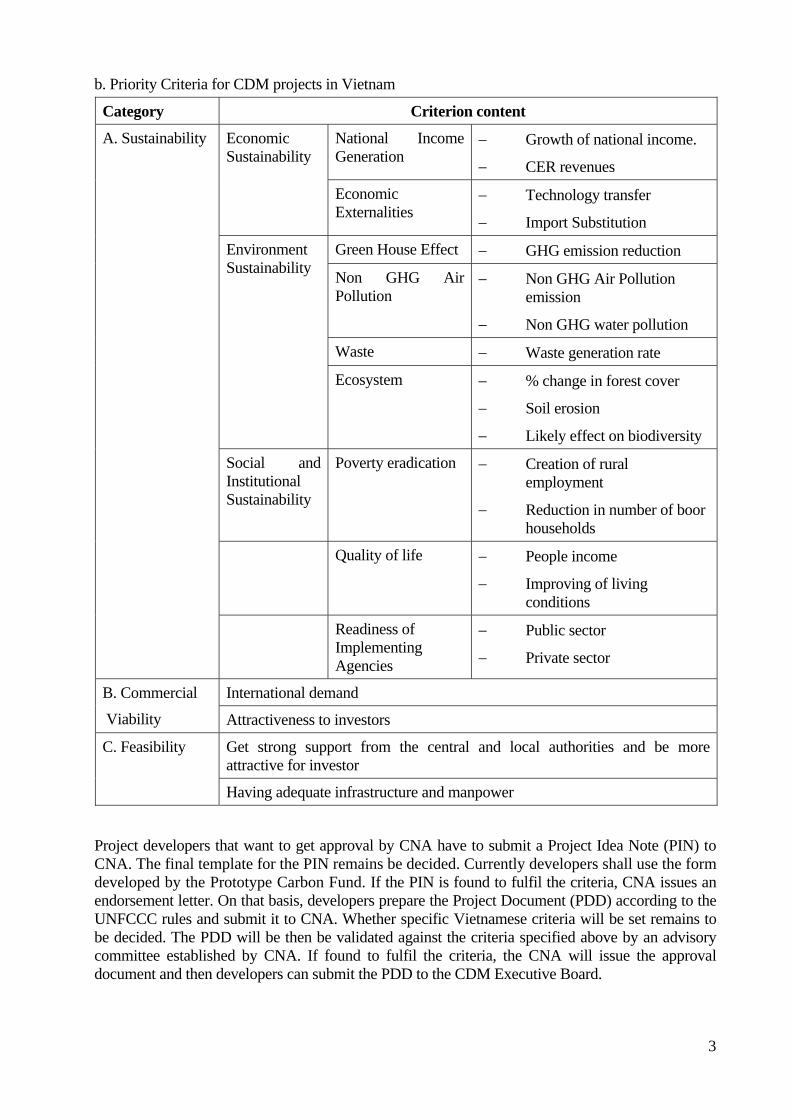
b. Priority Criteria for CDM projects in Vietnam
Category Criterion content
National IncomeGeneration
− Growth of national income.
− CER revenues
EconomicSustainability
EconomicExternalities
− Technology transfer
− Import Substitution
Green House Effect − GHG emission reduction
Non GHG AirPollution
− Non GHG Air Pollution emission
− Non GHG water pollution
Waste − Waste generation rate
EnvironmentSustainability
Ecosystem − % change in forest cover
− Soil erosion
− Likely effect on biodiversity
Social andInstitutionalSustainability
Poverty eradication − Creation of rural employment
− Reduction in number of boor households
Quality of life − People income
− Improving of living conditions
A. Sustainability
Readiness ofImplementingAgencies
− Public sector
− Private sector
International demandB. Commercial
Viability Attractiveness to investors
Get strong support from the central and local authorities and be moreattractive for investor
C. Feasibility
Having adequate infrastructure and manpower
Project developers that want to get approval by CNA have to submit a Project Idea Note (PIN) toCNA. The final template for the PIN remains be decided. Currently developers shall use the formdeveloped by the Prototype Carbon Fund. If the PIN is found to fulfil the criteria, CNA issues anendorsement letter. On that basis, developers prepare the Project Document (PDD) according to theUNFCCC rules and submit it to CNA. Whether specific Vietnamese criteria will be set remains tobe decided. The PDD will be then be validated against the criteria specified above by an advisorycommittee established by CNA. If found to fulfil the criteria, the CNA will issue the approvaldocument and then developers can submit the PDD to the CDM Executive Board.
4
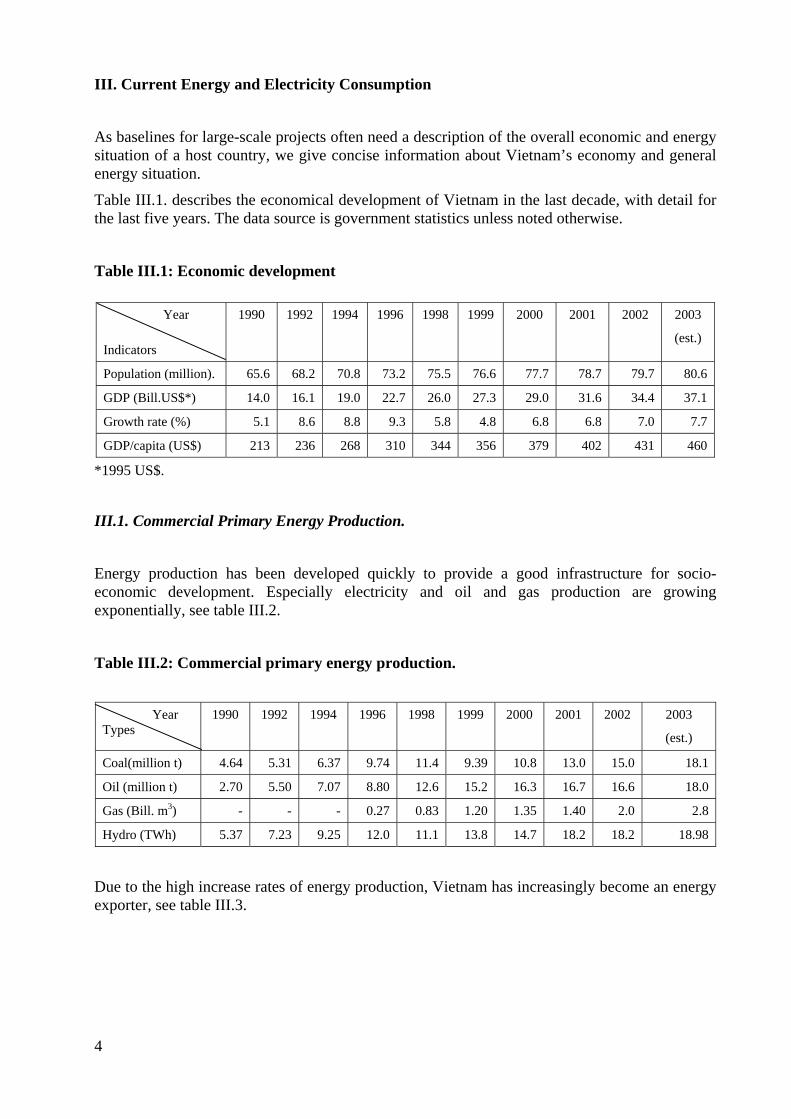
III. Current Energy and Electricity Consumption
As baselines for large-scale projects often need a description of the overall economic and energysituation of a host country, we give concise information about Vietnam’s economy and generalenergy situation.
Table III.1. describes the economical development of Vietnam in the last decade, with detail forthe last five years. The data source is government statistics unless noted otherwise.
Table III.1: Economic development
Year
Indicators
1990 1992 1994 1996 1998 1999 2000 2001 2002 2003
(est.)
Population (million). 65.6 68.2 70.8 73.2 75.5 76.6 77.7 78.7 79.7 80.6
GDP (Bill.US$*) 14.0 16.1 19.0 22.7 26.0 27.3 29.0 31.6 34.4 37.1
Growth rate (%) 5.1 8.6 8.8 9.3 5.8 4.8 6.8 6.8 7.0 7.7
GDP/capita (US$) 213 236 268 310 344 356 379 402 431 460
*1995 US$.
III.1. Commercial Primary Energy Production.
Energy production has been developed quickly to provide a good infrastructure for socio-economic development. Especially electricity and oil and gas production are growingexponentially, see table III.2.
Table III.2: Commercial primary energy production.
YearTypes
1990 1992 1994 1996 1998 1999 2000 2001 2002 2003
(est.)
Coal(million t) 4.64 5.31 6.37 9.74 11.4 9.39 10.8 13.0 15.0 18.1
Oil (million t) 2.70 5.50 7.07 8.80 12.6 15.2 16.3 16.7 16.6 18.0
Gas (Bill. m3) - - - 0.27 0.83 1.20 1.35 1.40 2.0 2.8
Hydro (TWh) 5.37 7.23 9.25 12.0 11.1 13.8 14.7 18.2 18.2 18.98
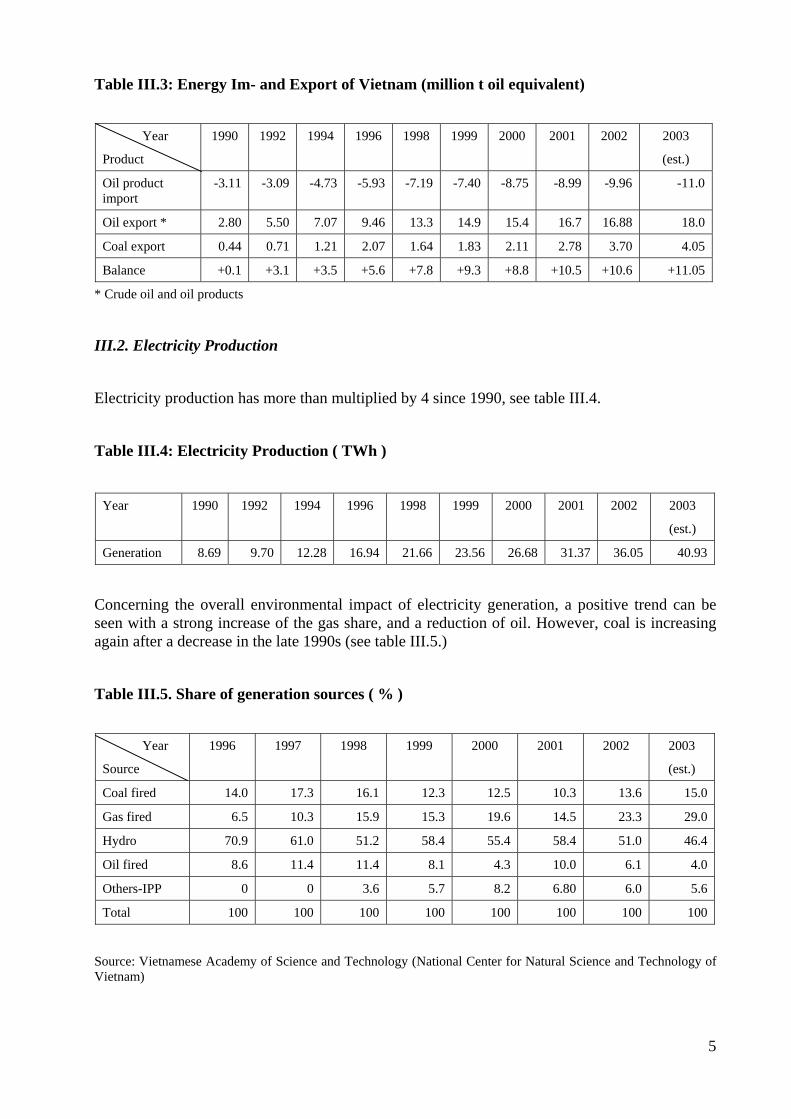
Due to the high increase rates of energy production, Vietnam has increasingly become an energyexporter, see table III.3.
5
Table III.3: Energy Im- and Export of Vietnam (million t oil equivalent)
Year
Product
1990 1992 1994 1996 1998 1999 2000 2001 2002 2003
(est.)
Oil productimport
-3.11 -3.09 -4.73 -5.93 -7.19 -7.40 -8.75 -8.99 -9.96 -11.0
Oil export * 2.80 5.50 7.07 9.46 13.3 14.9 15.4 16.7 16.88 18.0
Coal export 0.44 0.71 1.21 2.07 1.64 1.83 2.11 2.78 3.70 4.05
Balance +0.1 +3.1 +3.5 +5.6 +7.8 +9.3 +8.8 +10.5 +10.6 +11.05
* Crude oil and oil products
III.2. Electricity Production
Electricity production has more than multiplied by 4 since 1990, see table III.4.
Table III.4: Electricity Production ( TWh )
Year 1990 1992 1994 1996 1998 1999 2000 2001 2002 2003
(est.)
Generation 8.69 9.70 12.28 16.94 21.66 23.56 26.68 31.37 36.05 40.93
Concerning the overall environmental impact of electricity generation, a positive trend can beseen with a strong increase of the gas share, and a reduction of oil. However, coal is increasingagain after a decrease in the late 1990s (see table III.5.)
Table III.5. Share of generation sources ( % )
Year
Source
1996 1997 1998 1999 2000 2001 2002 2003
(est.)
Coal fired 14.0 17.3 16.1 12.3 12.5 10.3 13.6 15.0
Gas fired 6.5 10.3 15.9 15.3 19.6 14.5 23.3 29.0
Hydro 70.9 61.0 51.2 58.4 55.4 58.4 51.0 46.4
Oil fired 8.6 11.4 11.4 8.1 4.3 10.0 6.1 4.0
Others-IPP 0 0 3.6 5.7 8.2 6.80 6.0 5.6
Total 100 100 100 100 100 100 100 100
Source: Vietnamese Academy of Science and Technology (National Center for Natural Science and Technology ofVietnam)
6
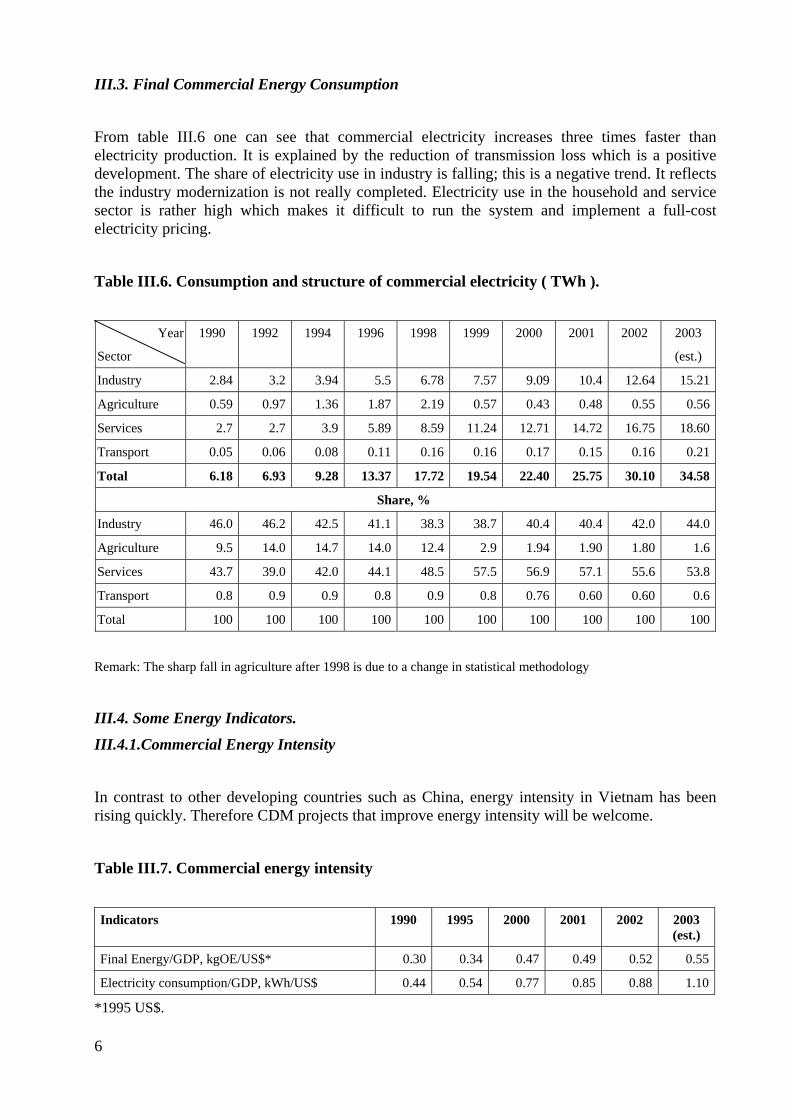
III.3. Final Commercial Energy Consumption
From table III.6 one can see that commercial electricity increases three times faster thanelectricity production. It is explained by the reduction of transmission loss which is a positivedevelopment. The share of electricity use in industry is falling; this is a negative trend. It reflectsthe industry modernization is not really completed. Electricity use in the household and servicesector is rather high which makes it difficult to run the system and implement a full-costelectricity pricing.
Table III.6. Consumption and structure of commercial electricity ( TWh ).
Year
Sector
1990 1992 1994 1996 1998 1999 2000 2001 2002 2003
(est.)
Industry 2.84 3.2 3.94 5.5 6.78 7.57 9.09 10.4 12.64 15.21
Agriculture 0.59 0.97 1.36 1.87 2.19 0.57 0.43 0.48 0.55 0.56
Services 2.7 2.7 3.9 5.89 8.59 11.24 12.71 14.72 16.75 18.60
Transport 0.05 0.06 0.08 0.11 0.16 0.16 0.17 0.15 0.16 0.21
Total 6.18 6.93 9.28 13.37 17.72 19.54 22.40 25.75 30.10 34.58
Share, %
Industry 46.0 46.2 42.5 41.1 38.3 38.7 40.4 40.4 42.0 44.0
Agriculture 9.5 14.0 14.7 14.0 12.4 2.9 1.94 1.90 1.80 1.6
Services 43.7 39.0 42.0 44.1 48.5 57.5 56.9 57.1 55.6 53.8
Transport 0.8 0.9 0.9 0.8 0.9 0.8 0.76 0.60 0.60 0.6
Total 100 100 100 100 100 100 100 100 100 100
Remark: The sharp fall in agriculture after 1998 is due to a change in statistical methodology
III.4. Some Energy Indicators.
III.4.1.Commercial Energy Intensity
In contrast to other developing countries such as China, energy intensity in Vietnam has beenrising quickly. Therefore CDM projects that improve energy intensity will be welcome.
Table III.7. Commercial energy intensity
Indicators 1990 1995 2000 2001 2002 2003(est.)
Final Energy/GDP, kgOE/US$* 0.30 0.34 0.47 0.49 0.52 0.55
Electricity consumption/GDP, kWh/US$ 0.44 0.54 0.77 0.85 0.88 1.10
*1995 US$.
7
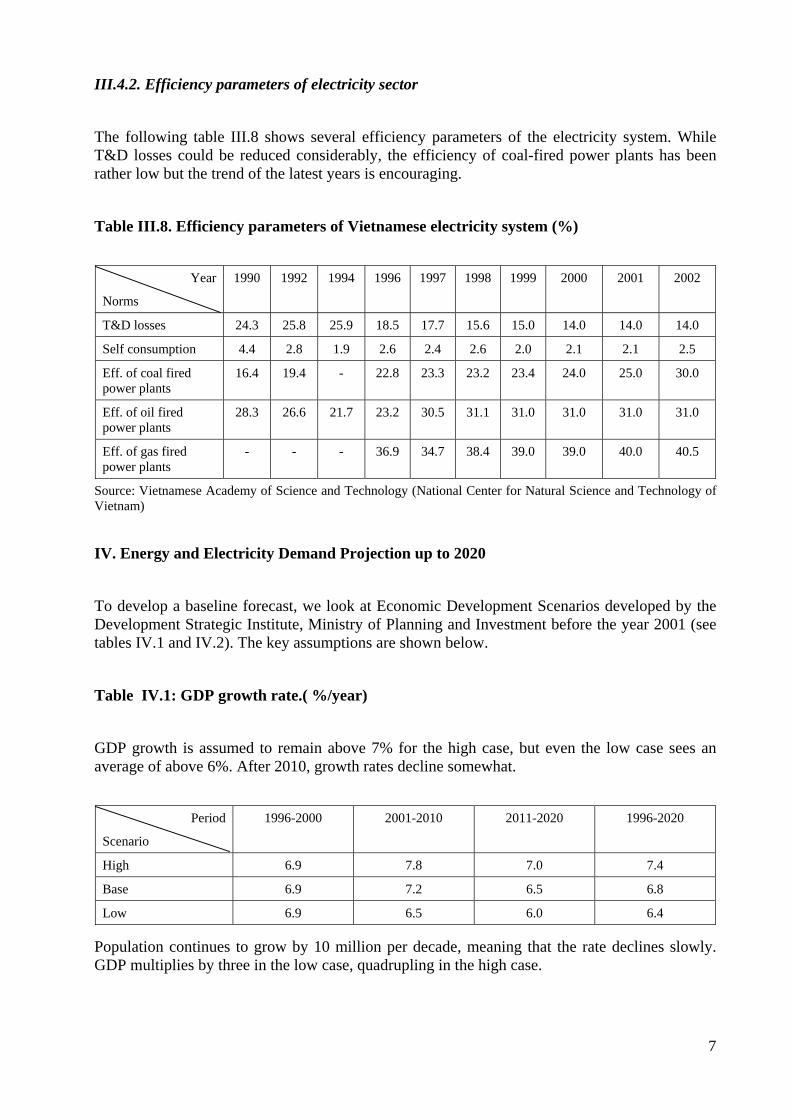
III.4.2. Efficiency parameters of electricity sector
The following table III.8 shows several efficiency parameters of the electricity system. WhileT&D losses could be reduced considerably, the efficiency of coal-fired power plants has beenrather low but the trend of the latest years is encouraging.
Table III.8. Efficiency parameters of Vietnamese electricity system (%)
Year
Norms
1990 1992 1994 1996 1997 1998 1999 2000 2001 2002
T&D losses 24.3 25.8 25.9 18.5 17.7 15.6 15.0 14.0 14.0 14.0
Self consumption 4.4 2.8 1.9 2.6 2.4 2.6 2.0 2.1 2.1 2.5
Eff. of coal firedpower plants
16.4 19.4 - 22.8 23.3 23.2 23.4 24.0 25.0 30.0
Eff. of oil firedpower plants
28.3 26.6 21.7 23.2 30.5 31.1 31.0 31.0 31.0 31.0
Eff. of gas firedpower plants
- - - 36.9 34.7 38.4 39.0 39.0 40.0 40.5
Source: Vietnamese Academy of Science and Technology (National Center for Natural Science and Technology ofVietnam)
IV. Energy and Electricity Demand Projection up to 2020
To develop a baseline forecast, we look at Economic Development Scenarios developed by theDevelopment Strategic Institute, Ministry of Planning and Investment before the year 2001 (seetables IV.1 and IV.2). The key assumptions are shown below.
Table IV.1: GDP growth rate.( %/year)
GDP growth is assumed to remain above 7% for the high case, but even the low case sees anaverage of above 6%. After 2010, growth rates decline somewhat.
Period
Scenario
1996-2000 2001-2010 2011-2020 1996-2020
High 6.9 7.8 7.0 7.4
Base 6.9 7.2 6.5 6.8
Low 6.9 6.5 6.0 6.4
Population continues to grow by 10 million per decade, meaning that the rate declines slowly.GDP multiplies by three in the low case, quadrupling in the high case.
8
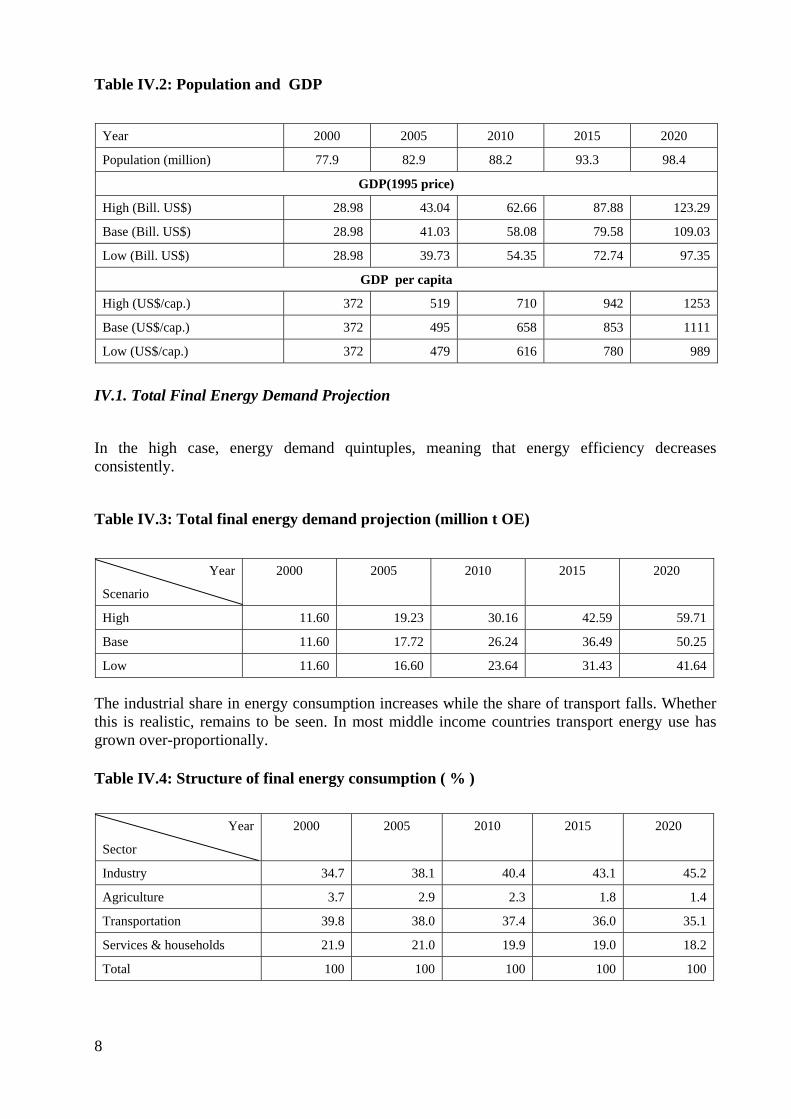
Table IV.2: Population and GDP
Year 2000 2005 2010 2015 2020
Population (million) 77.9 82.9 88.2 93.3 98.4
GDP(1995 price)
High (Bill. US$) 28.98 43.04 62.66 87.88 123.29
Base (Bill. US$) 28.98 41.03 58.08 79.58 109.03
Low (Bill. US$) 28.98 39.73 54.35 72.74 97.35
GDP per capita
High (US$/cap.) 372 519 710 942 1253
Base (US$/cap.) 372 495 658 853 1111
Low (US$/cap.) 372 479 616 780 989
IV.1. Total Final Energy Demand Projection
In the high case, energy demand quintuples, meaning that energy efficiency decreasesconsistently.
Table IV.3: Total final energy demand projection (million t OE)
Year
Scenario
2000 2005 2010 2015 2020
High 11.60 19.23 30.16 42.59 59.71
Base 11.60 17.72 26.24 36.49 50.25
Low 11.60 16.60 23.64 31.43 41.64
The industrial share in energy consumption increases while the share of transport falls. Whetherthis is realistic, remains to be seen. In most middle income countries transport energy use hasgrown over-proportionally.
Table IV.4: Structure of final energy consumption ( % )
Year
Sector
2000 2005 2010 2015 2020
Industry 34.7 38.1 40.4 43.1 45.2
Agriculture 3.7 2.9 2.3 1.8 1.4
Transportation 39.8 38.0 37.4 36.0 35.1
Services & households 21.9 21.0 19.9 19.0 18.2
Total 100 100 100 100 100
9
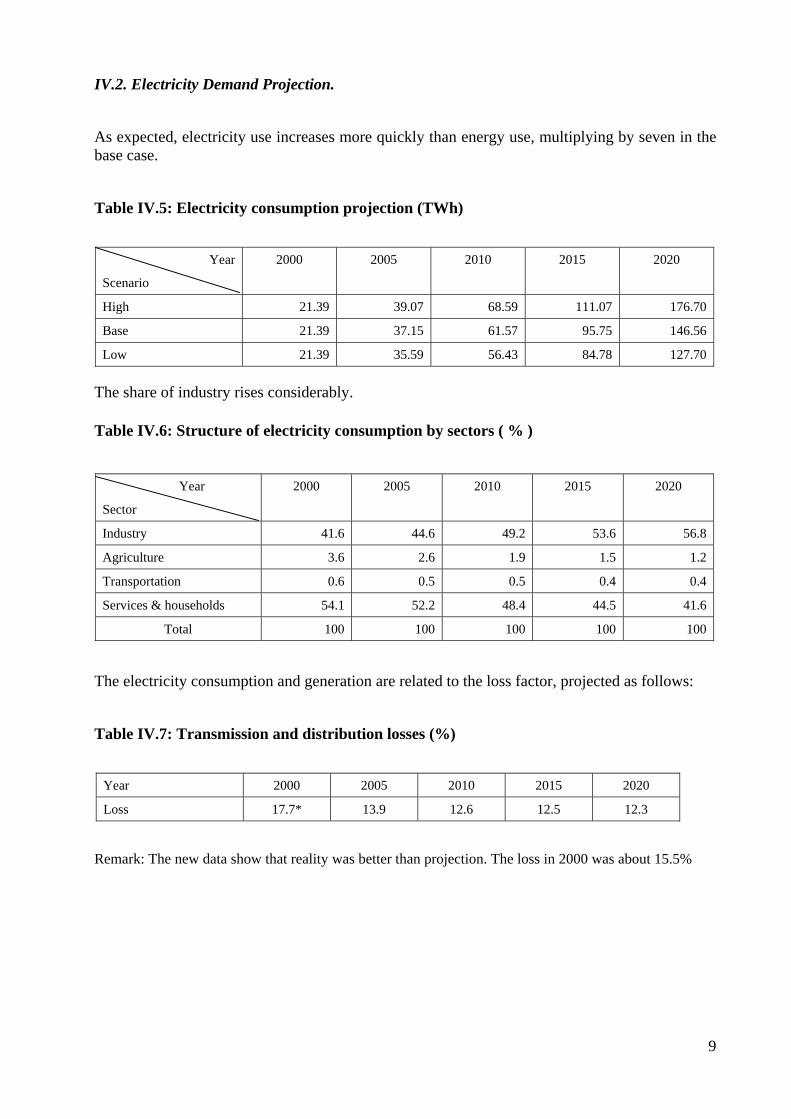
IV.2. Electricity Demand Projection.
As expected, electricity use increases more quickly than energy use, multiplying by seven in thebase case.
Table IV.5: Electricity consumption projection (TWh)
Year
Scenario
2000 2005 2010 2015 2020
High 21.39 39.07 68.59 111.07 176.70
Base 21.39 37.15 61.57 95.75 146.56
Low 21.39 35.59 56.43 84.78 127.70
The share of industry rises considerably.
Table IV.6: Structure of electricity consumption by sectors ( % )
Year
Sector
2000 2005 2010 2015 2020
Industry 41.6 44.6 49.2 53.6 56.8
Agriculture 3.6 2.6 1.9 1.5 1.2
Transportation 0.6 0.5 0.5 0.4 0.4
Services & households 54.1 52.2 48.4 44.5 41.6
Total 100 100 100 100 100
The electricity consumption and generation are related to the loss factor, projected as follows:
Table IV.7: Transmission and distribution losses (%)
Year 2000 2005 2010 2015 2020
Loss 17.7* 13.9 12.6 12.5 12.3
Remark: The new data show that reality was better than projection. The loss in 2000 was about 15.5%
10
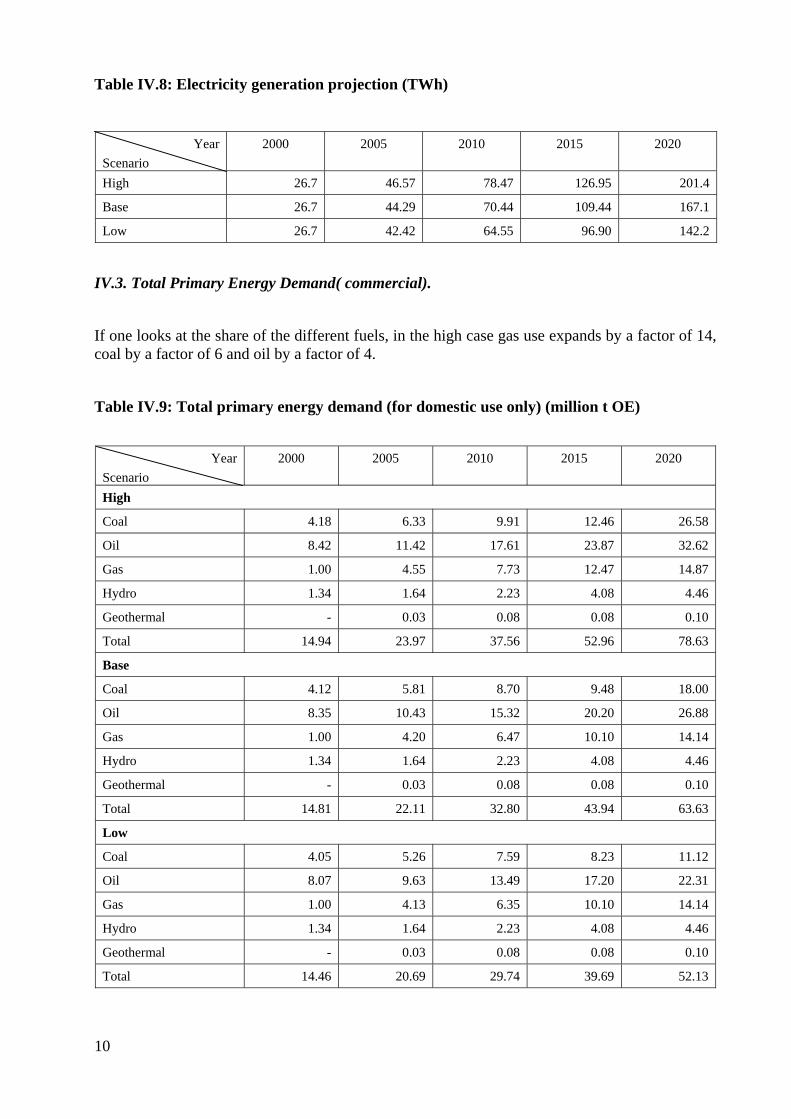
Table IV.8: Electricity generation projection (TWh)
YearScenario
2000 2005 2010 2015 2020
High 26.7 46.57 78.47 126.95 201.4
Base 26.7 44.29 70.44 109.44 167.1
Low 26.7 42.42 64.55 96.90 142.2
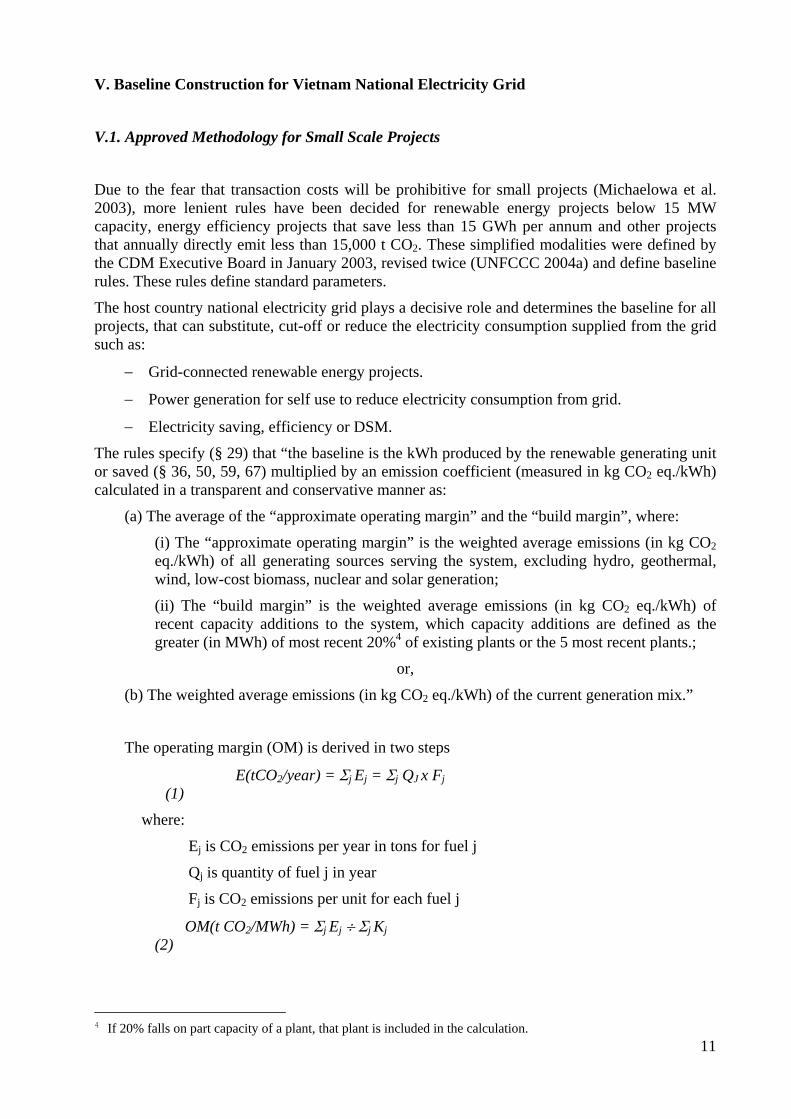
IV.3. Total Primary Energy Demand( commercial).
If one looks at the share of the different fuels, in the high case gas use expands by a factor of 14,coal by a factor of 6 and oil by a factor of 4.
Table IV.9: Total primary energy demand (for domestic use only) (million t OE)
YearScenario
2000 2005 2010 2015 2020
High
Coal 4.18 6.33 9.91 12.46 26.58
Oil 8.42 11.42 17.61 23.87 32.62
Gas 1.00 4.55 7.73 12.47 14.87
Hydro 1.34 1.64 2.23 4.08 4.46
Geothermal - 0.03 0.08 0.08 0.10
Total 14.94 23.97 37.56 52.96 78.63
Base
Coal 4.12 5.81 8.70 9.48 18.00
Oil 8.35 10.43 15.32 20.20 26.88
Gas 1.00 4.20 6.47 10.10 14.14
Hydro 1.34 1.64 2.23 4.08 4.46
Geothermal - 0.03 0.08 0.08 0.10
Total 14.81 22.11 32.80 43.94 63.63
Low
Coal 4.05 5.26 7.59 8.23 11.12
Oil 8.07 9.63 13.49 17.20 22.31
Gas 1.00 4.13 6.35 10.10 14.14
Hydro 1.34 1.64 2.23 4.08 4.46
Geothermal - 0.03 0.08 0.08 0.10
Total 14.46 20.69 29.74 39.69 52.13
11
V. Baseline Construction for Vietnam National Electricity Grid
V.1. Approved Methodology for Small Scale Projects
Due to the fear that transaction costs will be prohibitive for small projects (Michaelowa et al.2003), more lenient rules have been decided for renewable energy projects below 15 MWcapacity, energy efficiency projects that save less than 15 GWh per annum and other projectsthat annually directly emit less than 15,000 t CO2. These simplified modalities were defined bythe CDM Executive Board in January 2003, revised twice (UNFCCC 2004a) and define baselinerules. These rules define standard parameters.
The host country national electricity grid plays a decisive role and determines the baseline for allprojects, that can substitute, cut-off or reduce the electricity consumption supplied from the gridsuch as:
− Grid-connected renewable energy projects.
− Power generation for self use to reduce electricity consumption from grid.
− Electricity saving, efficiency or DSM.
The rules specify (§ 29) that “the baseline is the kWh produced by the renewable generating unitor saved (§ 36, 50, 59, 67) multiplied by an emission coefficient (measured in kg CO2 eq./kWh)calculated in a transparent and conservative manner as:
(a) The average of the “approximate operating margin” and the “build margin”, where:
(i) The “approximate operating margin” is the weighted average emissions (in kg CO2eq./kWh) of all generating sources serving the system, excluding hydro, geothermal,wind, low-cost biomass, nuclear and solar generation;
(ii) The “build margin” is the weighted average emissions (in kg CO2 eq./kWh) ofrecent capacity additions to the system, which capacity additions are defined as thegreater (in MWh) of most recent 20%4 of existing plants or the 5 most recent plants.;
or,
(b) The weighted average emissions (in kg CO2 eq./kWh) of the current generation mix.”
The operating margin (OM) is derived in two steps
E(tCO2/year) = Σj Ej = Σj QJ x Fj (1)where:
Ej is CO2 emissions per year in tons for fuel j
Qj is quantity of fuel j in year
Fj is CO2 emissions per unit for each fuel j
OM(t CO2/MWh) = Σj Ej ÷ Σj Kj(2)
4 If 20% falls on part capacity of a plant, that plant is included in the calculation.
12
where:
Kj is electricity generation from fuel j
The formula to calculate the build margin (BM) is:
BM(tCO2/MWh) = m
mmm
jj
m
jjj
GGGGeGeGe
G
Ge
++++++
=
∑
∑
...........
.
21
2211
(3)where:
Gj : the generation (MWh) from unit j
ej : the emission rate (in t CO2/MWh) for unit j
j : invidual plants included among the selected representative set of plants
The idea of looking at OM and BM was developed by Kartha et al. (2002).
Therefore, we need the following data for the Vietnamese grid:
• Weighted average emissions of all thermal power stations for the most recent year(OM)
• Generation of most recent 20% of existing plants (G-BM1)
• Generation of 5 most recent plants (G-BM2)
• Weighted average emissions of the higher of the two generation levels for the mostrecent year (BM)
• Weighted average emissions of all power stations (grid average, GA)
For all power plants serving the national grid, detailed data on capacity, fuel used and fuelconsumption are available for 2000, 2001 and 2002. Preliminary data are available for 2003. Thebig challenge is to keep these data up to date in the long term. As there is a very detailed plan forpower supply expansion, we can estimate these numbers until 2010. For the period 2003 – 2010,the different parameters are calculated using the expansion plan of Energy of Vietnam (EVN)(Electricity of Vietnam 2002). The weighted average emissions of all thermal power stations forthe most recent year (OM) and the weighted average emissions of all power stations (GA) caneasily be calculated from the aggregated grid numbers. Here, the strong expansion of coal powerplants leads to an increase in OM from 2007 onwards.
13
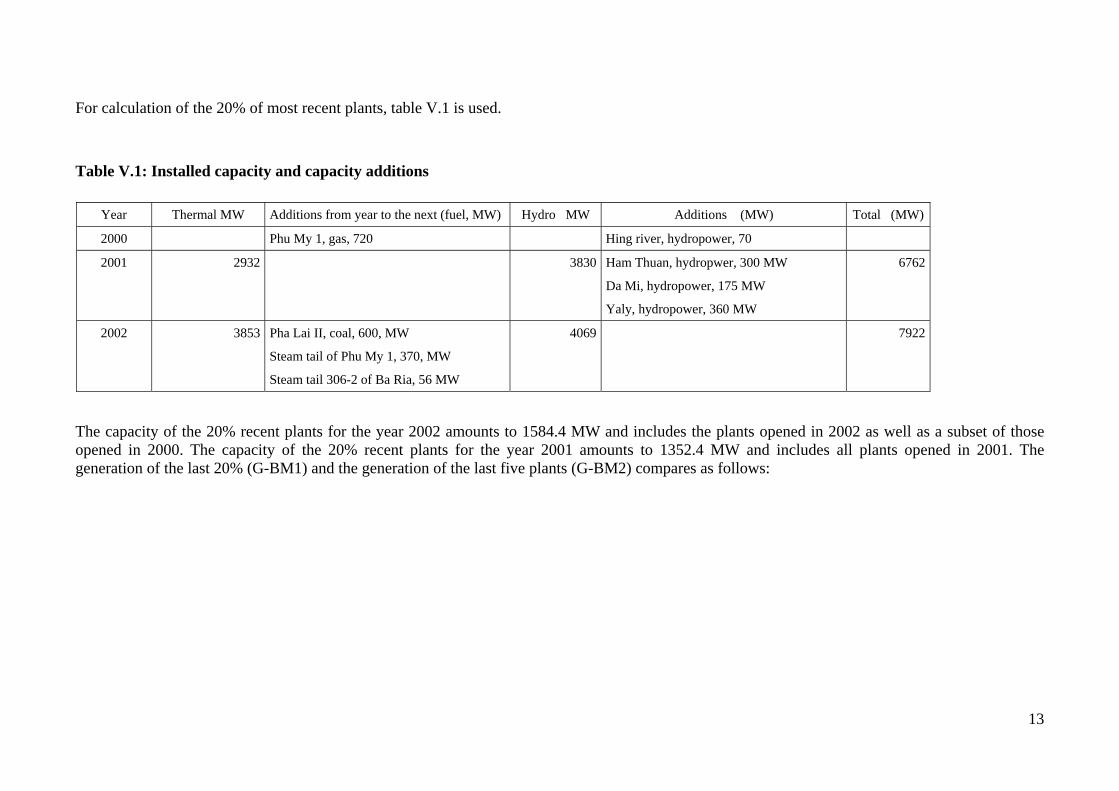
For calculation of the 20% of most recent plants, table V.1 is used.
Table V.1: Installed capacity and capacity additions
Year Thermal MW Additions from year to the next (fuel, MW) Hydro MW Additions (MW) Total (MW)
2000 Phu My 1, gas, 720 Hing river, hydropower, 70
2001 2932 3830 Ham Thuan, hydropwer, 300 MW
Da Mi, hydropower, 175 MW
Yaly, hydropower, 360 MW
6762
2002 3853 Pha Lai II, coal, 600, MW
Steam tail of Phu My 1, 370, MW
Steam tail 306-2 of Ba Ria, 56 MW
4069 7922
The capacity of the 20% recent plants for the year 2002 amounts to 1584.4 MW and includes the plants opened in 2002 as well as a subset of thoseopened in 2000. The capacity of the 20% recent plants for the year 2001 amounts to 1352.4 MW and includes all plants opened in 2001. Thegeneration of the last 20% (G-BM1) and the generation of the last five plants (G-BM2) compares as follows:
14
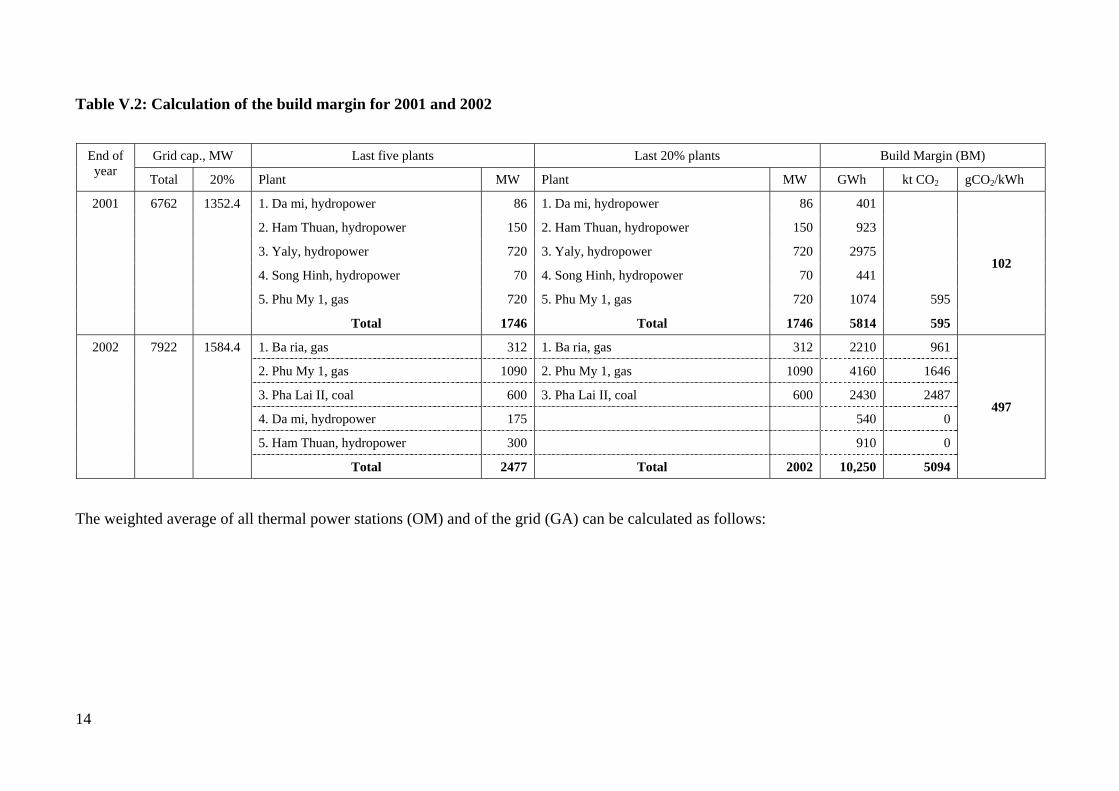
Table V.2: Calculation of the build margin for 2001 and 2002
Grid cap., MW Last five plants Last 20% plants Build Margin (BM)End ofyear Total 20% Plant MW Plant MW GWh kt CO2 gCO2/kWh
1. Da mi, hydropower 86 1. Da mi, hydropower 86 401
2. Ham Thuan, hydropower 150 2. Ham Thuan, hydropower 150 923
3. Yaly, hydropower 720 3. Yaly, hydropower 720 2975
4. Song Hinh, hydropower 70 4. Song Hinh, hydropower 70 441
5. Phu My 1, gas 720 5. Phu My 1, gas 720 1074 595
2001 6762 1352.4
Total 1746 Total 1746 5814 595
102
1. Ba ria, gas 312 1. Ba ria, gas 312 2210 961
2. Phu My 1, gas 1090 2. Phu My 1, gas 1090 4160 1646
3. Pha Lai II, coal 600 3. Pha Lai II, coal 600 2430 2487
4. Da mi, hydropower 175 540 0
5. Ham Thuan, hydropower 300 910 0
2002 7922 1584.4
Total 2477 Total 2002 10,250 5094
497
The weighted average of all thermal power stations (OM) and of the grid (GA) can be calculated as follows:
15
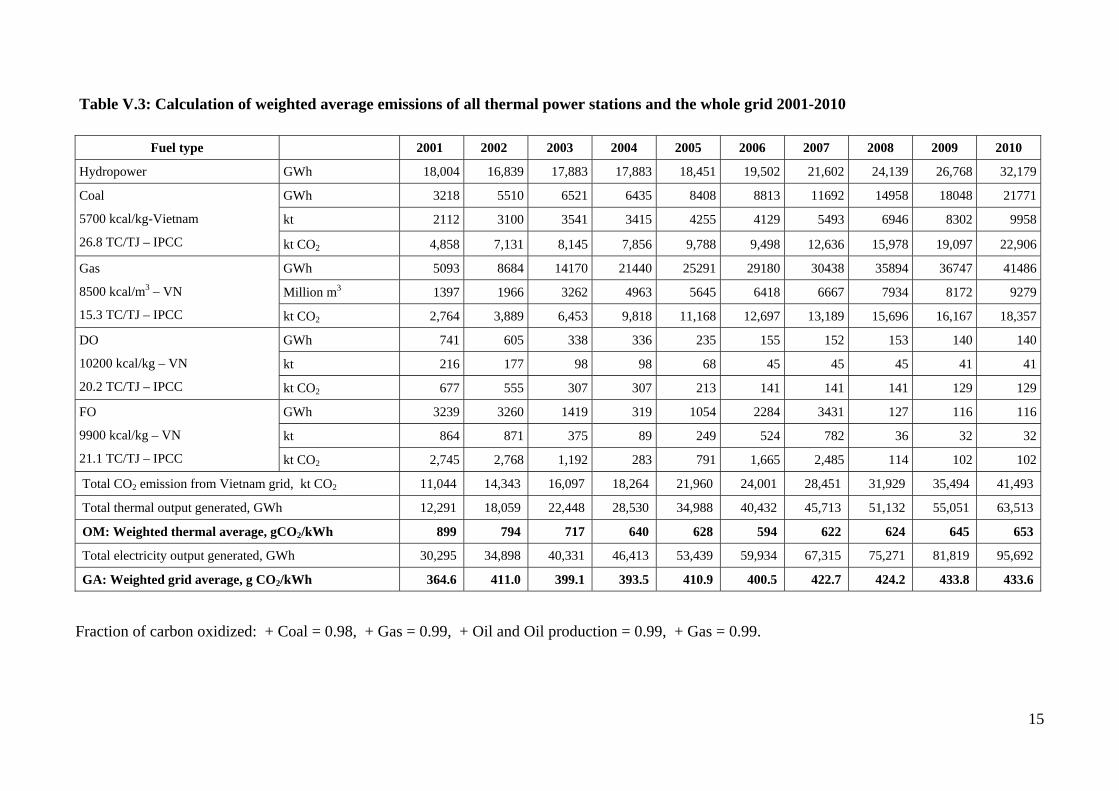
Table V.3: Calculation of weighted average emissions of all thermal power stations and the whole grid 2001-2010
Fuel type 2001 2002 2003 2004 2005 2006 2007 2008 2009 2010
Hydropower GWh 18,004 16,839 17,883 17,883 18,451 19,502 21,602 24,139 26,768 32,179
GWh 3218 5510 6521 6435 8408 8813 11692 14958 18048 21771
kt 2112 3100 3541 3415 4255 4129 5493 6946 8302 9958
Coal
5700 kcal/kg-Vietnam
26.8 TC/TJ – IPCC kt CO2 4,858 7,131 8,145 7,856 9,788 9,498 12,636 15,978 19,097 22,906
GWh 5093 8684 14170 21440 25291 29180 30438 35894 36747 41486
Million m3 1397 1966 3262 4963 5645 6418 6667 7934 8172 9279
Gas
8500 kcal/m3 – VN
15.3 TC/TJ – IPCC kt CO2 2,764 3,889 6,453 9,818 11,168 12,697 13,189 15,696 16,167 18,357
GWh 741 605 338 336 235 155 152 153 140 140
kt 216 177 98 98 68 45 45 45 41 41
DO
10200 kcal/kg – VN
20.2 TC/TJ – IPCC kt CO2 677 555 307 307 213 141 141 141 129 129
GWh 3239 3260 1419 319 1054 2284 3431 127 116 116
kt 864 871 375 89 249 524 782 36 32 32
FO
9900 kcal/kg – VN
21.1 TC/TJ – IPCC kt CO2 2,745 2,768 1,192 283 791 1,665 2,485 114 102 102
Total CO2 emission from Vietnam grid, kt CO2 11,044 14,343 16,097 18,264 21,960 24,001 28,451 31,929 35,494 41,493
Total thermal output generated, GWh 12,291 18,059 22,448 28,530 34,988 40,432 45,713 51,132 55,051 63,513
OM: Weighted thermal average, gCO2/kWh 899 794 717 640 628 594 622 624 645 653
Total electricity output generated, GWh 30,295 34,898 40,331 46,413 53,439 59,934 67,315 75,271 81,819 95,692
GA: Weighted grid average, g CO2/kWh 364.6 411.0 399.1 393.5 410.9 400.5 422.7 424.2 433.8 433.6
Fraction of carbon oxidized: + Coal = 0.98, + Gas = 0.99, + Oil and Oil production = 0.99, + Gas = 0.99.
16
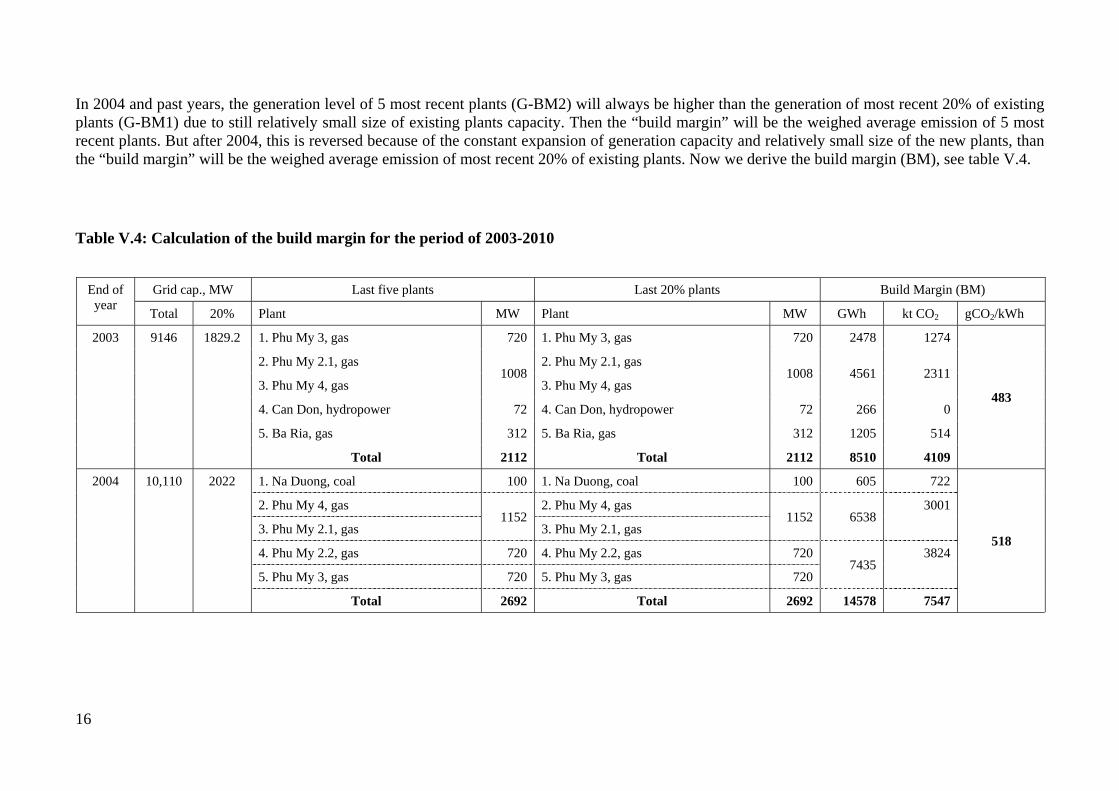
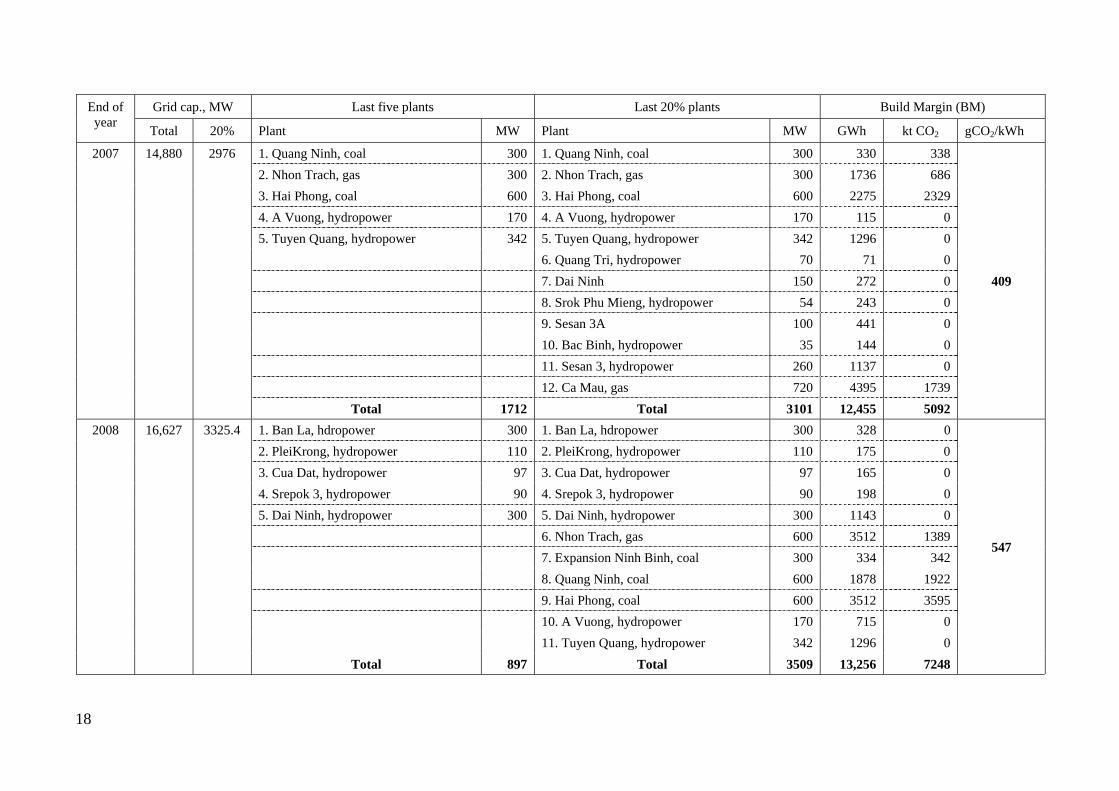
In 2004 and past years, the generation level of 5 most recent plants (G-BM2) will always be higher than the generation of most recent 20% of existingplants (G-BM1) due to still relatively small size of existing plants capacity. Then the “build margin” will be the weighed average emission of 5 mostrecent plants. But after 2004, this is reversed because of the constant expansion of generation capacity and relatively small size of the new plants, thanthe “build margin” will be the weighed average emission of most recent 20% of existing plants. Now we derive the build margin (BM), see table V.4.
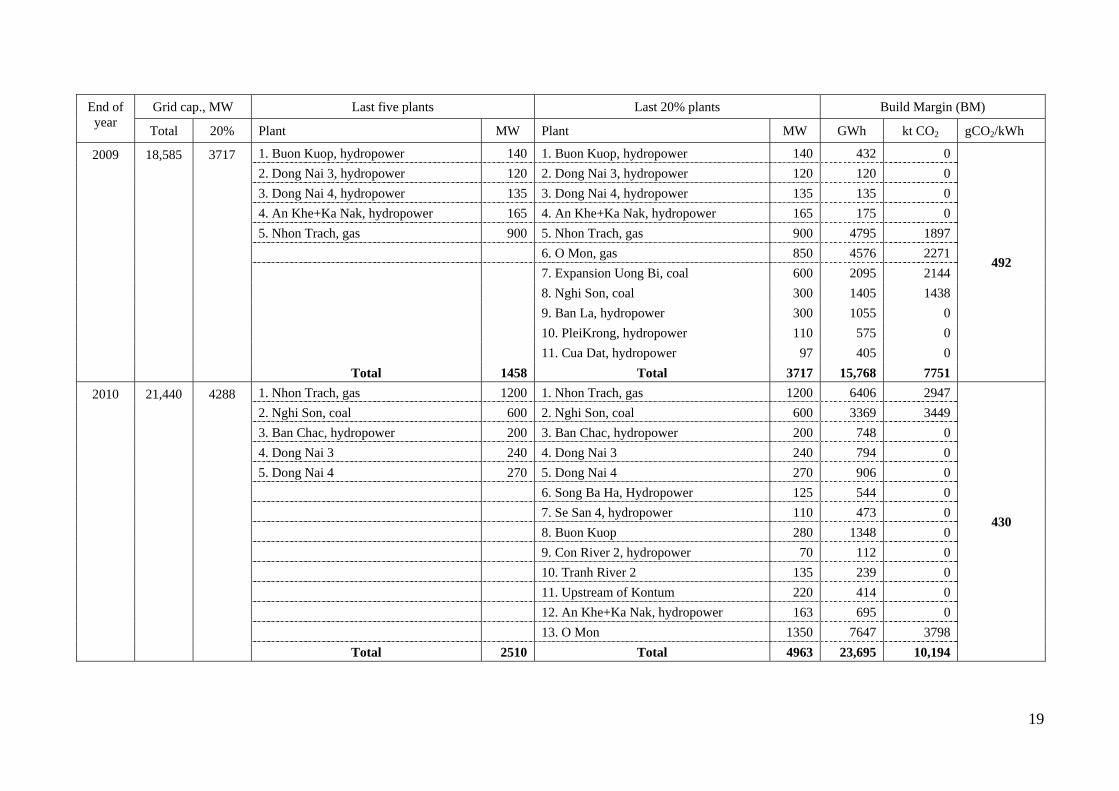
Table V.4: Calculation of the build margin for the period of 2003-2010
Grid cap., MW Last five plants Last 20% plants Build Margin (BM)End ofyear Total 20% Plant MW Plant MW GWh kt CO2 gCO2/kWh
1. Phu My 3, gas 720 1. Phu My 3, gas 720 2478 1274
2. Phu My 2.1, gas 2. Phu My 2.1, gas
3. Phu My 4, gas1008
3. Phu My 4, gas1008 4561 2311
4. Can Don, hydropower 72 4. Can Don, hydropower 72 266 0
5. Ba Ria, gas 312 5. Ba Ria, gas 312 1205 514
2003 9146 1829.2
Total 2112 Total 2112 8510 4109
483
1. Na Duong, coal 100 1. Na Duong, coal 100 605 722
2. Phu My 4, gas 2. Phu My 4, gas
3. Phu My 2.1, gas1152
3. Phu My 2.1, gas1152 6538
3001
4. Phu My 2.2, gas 720 4. Phu My 2.2, gas 720
5. Phu My 3, gas 720 5. Phu My 3, gas 7207435
3824
2004 10,110 2022
Total 2692 Total 2692 14578 7547
518
17
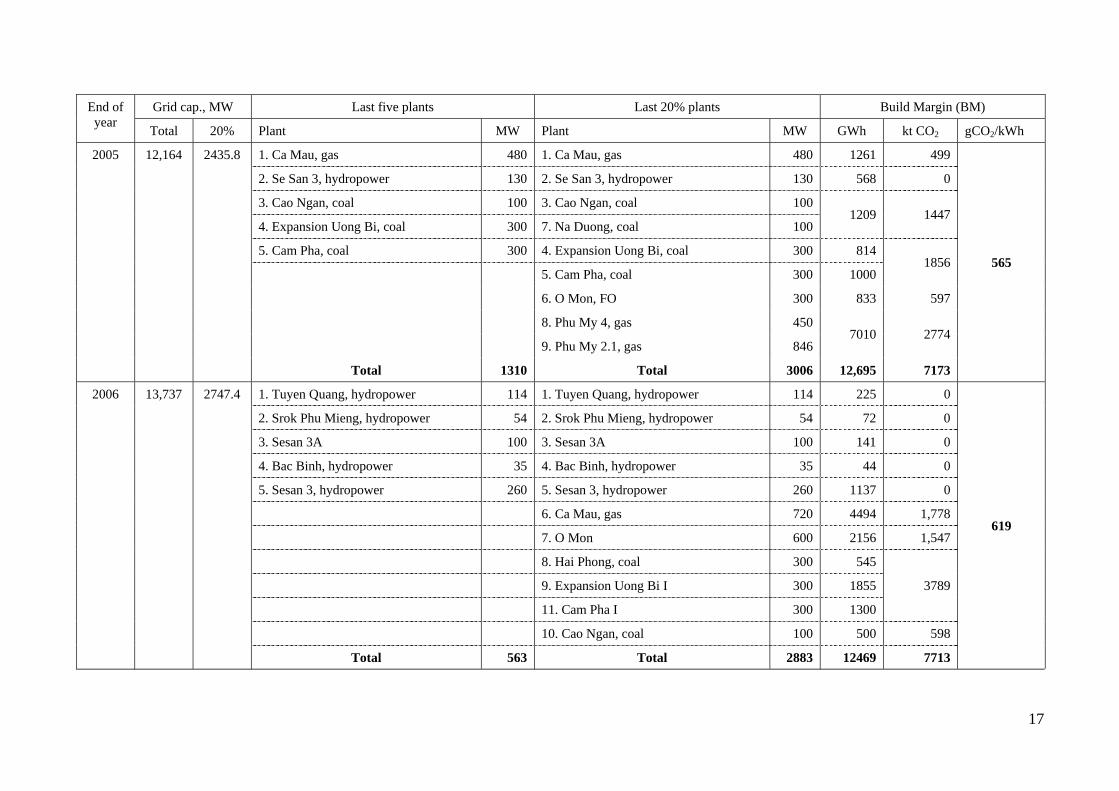
Grid cap., MW Last five plants Last 20% plants Build Margin (BM)End ofyear Total 20% Plant MW Plant MW GWh kt CO2 gCO2/kWh
1. Ca Mau, gas 480 1. Ca Mau, gas 480 1261 499
2. Se San 3, hydropower 130 2. Se San 3, hydropower 130 568 0
3. Cao Ngan, coal 100 3. Cao Ngan, coal 100
4. Expansion Uong Bi, coal 300 7. Na Duong, coal 1001209 1447
5. Cam Pha, coal 300 4. Expansion Uong Bi, coal 300 814
5. Cam Pha, coal 300 10001856
6. O Mon, FO 300 833 597
8. Phu My 4, gas 450
9. Phu My 2.1, gas 8467010 2774
2005 12,164 2435.8
Total 1310 Total 3006 12,695 7173
565
1. Tuyen Quang, hydropower 114 1. Tuyen Quang, hydropower 114 225 0
2. Srok Phu Mieng, hydropower 54 2. Srok Phu Mieng, hydropower 54 72 0
3. Sesan 3A 100 3. Sesan 3A 100 141 0
4. Bac Binh, hydropower 35 4. Bac Binh, hydropower 35 44 0
5. Sesan 3, hydropower 260 5. Sesan 3, hydropower 260 1137 0
6. Ca Mau, gas 720 4494 1,778
7. O Mon 600 2156 1,547
8. Hai Phong, coal 300 545
9. Expansion Uong Bi I 300 1855
11. Cam Pha I 300 1300
3789
10. Cao Ngan, coal 100 500 598
2006 13,737 2747.4
Total 563 Total 2883 12469 7713
619
18
Grid cap., MW Last five plants Last 20% plants Build Margin (BM)End ofyear Total 20% Plant MW Plant MW GWh kt CO2 gCO2/kWh
1. Quang Ninh, coal 300 1. Quang Ninh, coal 300 330 3382. Nhon Trach, gas 300 2. Nhon Trach, gas 300 1736 6863. Hai Phong, coal 600 3. Hai Phong, coal 600 2275 23294. A Vuong, hydropower 170 4. A Vuong, hydropower 170 115 05. Tuyen Quang, hydropower 342 5. Tuyen Quang, hydropower 342 1296 0
6. Quang Tri, hydropower 70 71 07. Dai Ninh 150 272 08. Srok Phu Mieng, hydropower 54 243 09. Sesan 3A 100 441 010. Bac Binh, hydropower 35 144 011. Sesan 3, hydropower 260 1137 012. Ca Mau, gas 720 4395 1739
2007 14,880 2976
Total 1712 Total 3101 12,455 5092
409
1. Ban La, hdropower 300 1. Ban La, hdropower 300 328 02. PleiKrong, hydropower 110 2. PleiKrong, hydropower 110 175 03. Cua Dat, hydropower 97 3. Cua Dat, hydropower 97 165 04. Srepok 3, hydropower 90 4. Srepok 3, hydropower 90 198 05. Dai Ninh, hydropower 300 5. Dai Ninh, hydropower 300 1143 0
6. Nhon Trach, gas 600 3512 13897. Expansion Ninh Binh, coal 300 334 3428. Quang Ninh, coal 600 1878 19229. Hai Phong, coal 600 3512 359510. A Vuong, hydropower 170 715 011. Tuyen Quang, hydropower 342 1296 0
2008 16,627 3325.4
Total 897 Total 3509 13,256 7248
547
19
Grid cap., MW Last five plants Last 20% plants Build Margin (BM)End ofyear Total 20% Plant MW Plant MW GWh kt CO2 gCO2/kWh
1. Buon Kuop, hydropower 140 1. Buon Kuop, hydropower 140 432 02. Dong Nai 3, hydropower 120 2. Dong Nai 3, hydropower 120 120 03. Dong Nai 4, hydropower 135 3. Dong Nai 4, hydropower 135 135 04. An Khe+Ka Nak, hydropower 165 4. An Khe+Ka Nak, hydropower 165 175 05. Nhon Trach, gas 900 5. Nhon Trach, gas 900 4795 1897
6. O Mon, gas 850 4576 22717. Expansion Uong Bi, coal 600 2095 21448. Nghi Son, coal 300 1405 14389. Ban La, hydropower 300 1055 010. PleiKrong, hydropower 110 575 011. Cua Dat, hydropower 97 405 0
2009 18,585 3717
Total 1458 Total 3717 15,768 7751
492
1. Nhon Trach, gas 1200 1. Nhon Trach, gas 1200 6406 29472. Nghi Son, coal 600 2. Nghi Son, coal 600 3369 34493. Ban Chac, hydropower 200 3. Ban Chac, hydropower 200 748 04. Dong Nai 3 240 4. Dong Nai 3 240 794 05. Dong Nai 4 270 5. Dong Nai 4 270 906 0
6. Song Ba Ha, Hydropower 125 544 07. Se San 4, hydropower 110 473 08. Buon Kuop 280 1348 09. Con River 2, hydropower 70 112 010. Tranh River 2 135 239 011. Upstream of Kontum 220 414 012. An Khe+Ka Nak, hydropower 163 695 013. O Mon 1350 7647 3798
2010 21,440 4288
Total 2510 Total 4963 23,695 10,194
430
20
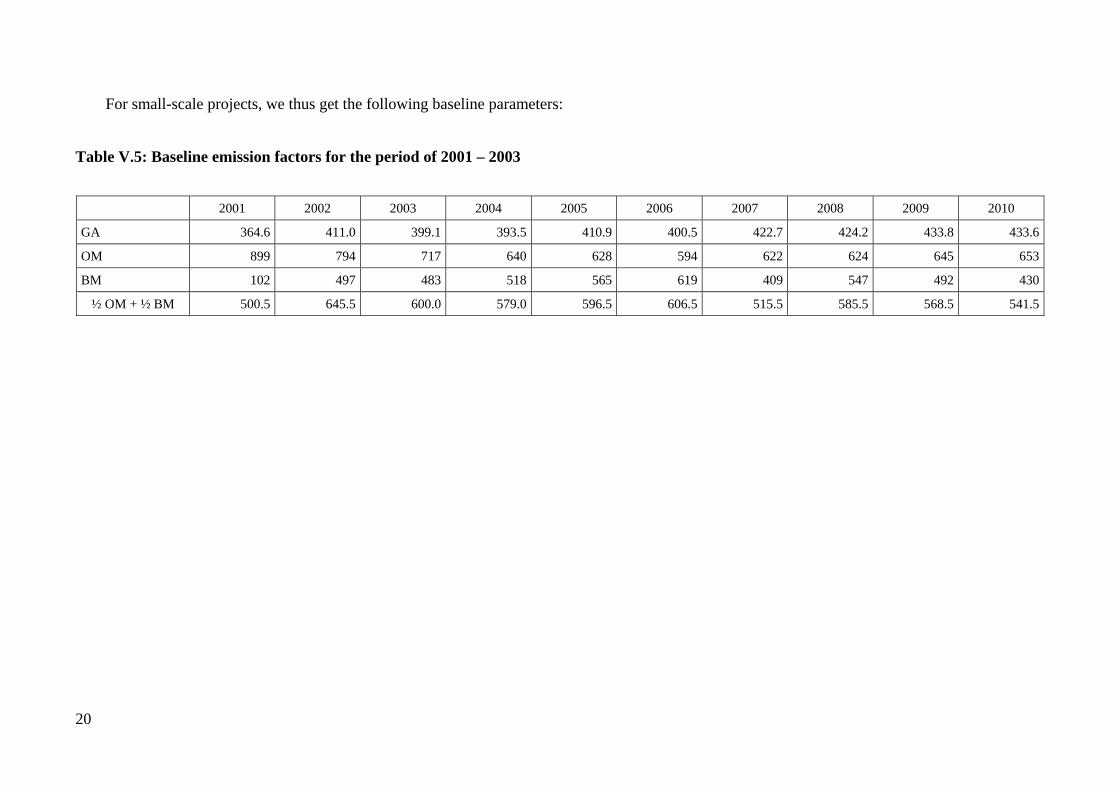
For small-scale projects, we thus get the following baseline parameters:
Table V.5: Baseline emission factors for the period of 2001 – 2003
2001 2002 2003 2004 2005 2006 2007 2008 2009 2010
GA 364.6 411.0 399.1 393.5 410.9 400.5 422.7 424.2 433.8 433.6
OM 899 794 717 640 628 594 622 624 645 653
BM 102 497 483 518 565 619 409 547 492 430
½ OM + ½ BM 500.5 645.5 600.0 579.0 596.5 606.5 515.5 585.5 568.5 541.5
21
V.2. Approved methodologies for large projects
Until September 2004, the CDM Executive Board has approved the following methodologiesthat relate to electricity grids: El Gallo Hydroelectric Project in Mexico (AM 5), Bagasse powerplant in Brazil (AM15), Rice husk power plant in Thailand (AM 4), Landfill gas plant in SouthAfrica (AM 10) (UNFCCC 2004c). These methodologies have a lot in common with the small-scale methodologies discussed above. One uses a combination of operating (OM) and buildmargin (BM): ½ OM + ½ BM. Differences occur in the calculation of the build margin. Theothers just use grid average (GA).
V.2.1. Baseline methodology (barrier analysis, baseline scenario development and baselineemission rate, using combined margin) for small grid-connected zero-emissions renewableelectricity generation (El Gallo Hydroelectricity Project in Mexico)
This methodology is only applicable for renewable energy projects with a capacity of < 60 MWserving a grid with less than 50% of generating sources with zero- or low –operating costs suchas hydro, geothermal, wind, solar, nuclear, and low-cost biomass. So it is applicable to Vietnamas the share of hydro has recently dropped below 50%.
The formula ½ OM + ½ BM is used with OM equal to the emission factor of the thermal plants,such as calculated above. However, the BM can be chosen among the weighted emission of thelast 5 plants or the last 20% installed under the following condition: “The project participant is todemonstrate which is appropriate for the proposed project to the Operational Entity, otherwise,the more conservative one is selected”. The ex-post monitoring of the BM may be used only ifthe project is small compared with the total additions to the grid.
This methodology accounts for imports and exports with the emission factors of the respectivegrids.
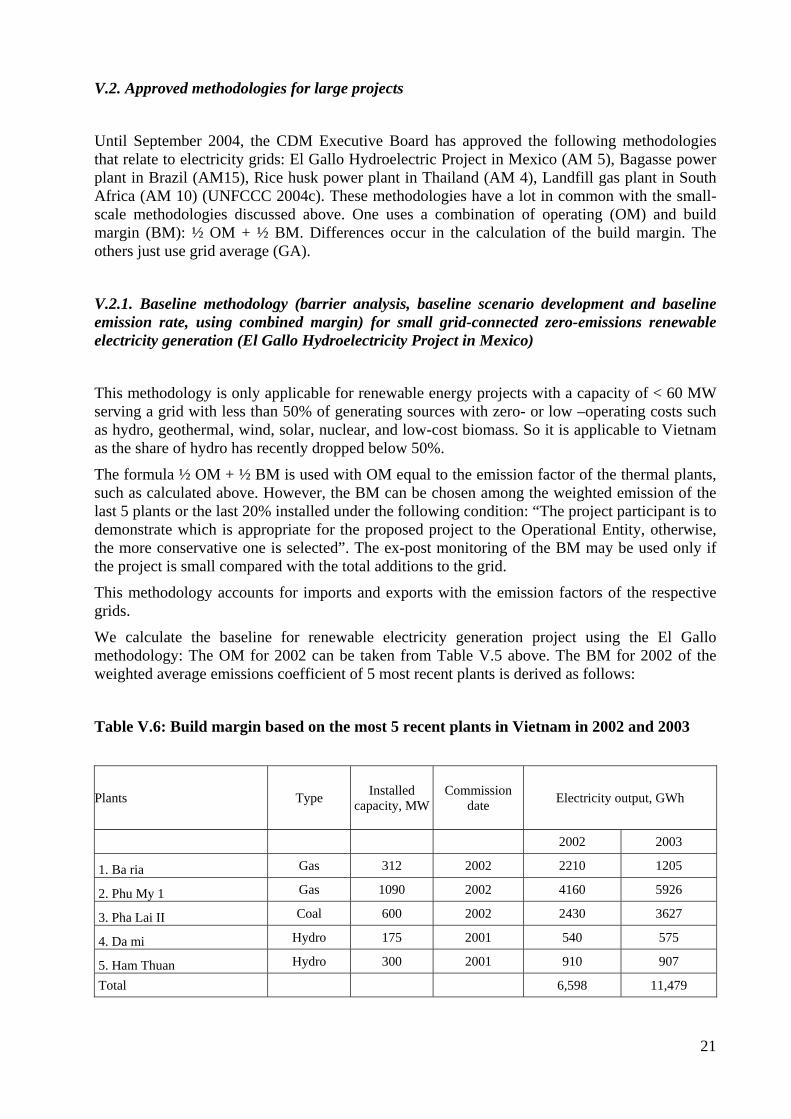
We calculate the baseline for renewable electricity generation project using the El Gallomethodology: The OM for 2002 can be taken from Table V.5 above. The BM for 2002 of theweighted average emissions coefficient of 5 most recent plants is derived as follows:
Table V.6: Build margin based on the most 5 recent plants in Vietnam in 2002 and 2003
Plants Type Installedcapacity, MW
Commissiondate Electricity output, GWh
2002 2003
1. Ba ria Gas 312 2002 2210 1205
2. Phu My 1 Gas 1090 2002 4160 5926
3. Pha Lai II Coal 600 2002 2430 3627
4. Da mi Hydro 175 2001 540 575
5. Ham Thuan Hydro 300 2001 910 907
Total 6,598 11,479
22
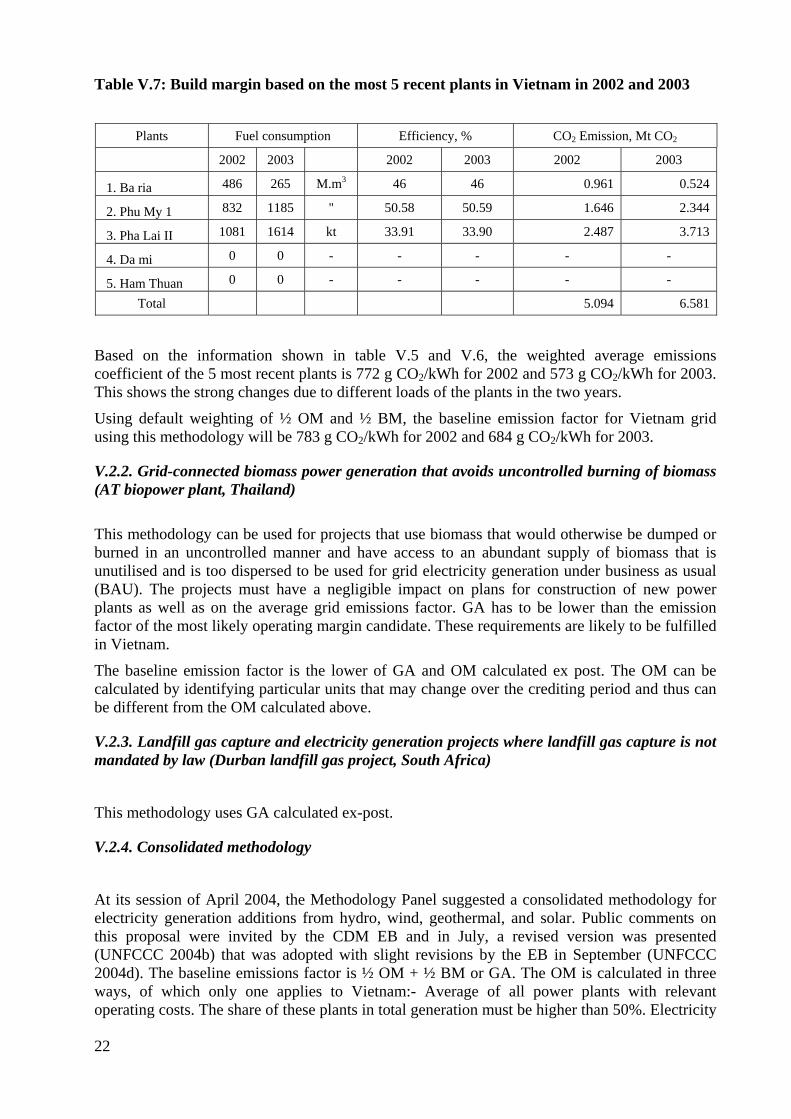
Table V.7: Build margin based on the most 5 recent plants in Vietnam in 2002 and 2003
Plants Fuel consumption Efficiency, % CO2 Emission, Mt CO2
2002 2003 2002 2003 2002 2003
1. Ba ria 486 265 M.m3 46 46 0.961 0.524
2. Phu My 1 832 1185 '' 50.58 50.59 1.646 2.344
3. Pha Lai II 1081 1614 kt 33.91 33.90 2.487 3.713
4. Da mi 0 0 - - - - -
5. Ham Thuan 0 0 - - - - -
Total 5.094 6.581
Based on the information shown in table V.5 and V.6, the weighted average emissionscoefficient of the 5 most recent plants is 772 g CO2/kWh for 2002 and 573 g CO2/kWh for 2003.This shows the strong changes due to different loads of the plants in the two years.
Using default weighting of ½ OM and ½ BM, the baseline emission factor for Vietnam gridusing this methodology will be 783 g CO2/kWh for 2002 and 684 g CO2/kWh for 2003.
V.2.2. Grid-connected biomass power generation that avoids uncontrolled burning of biomass(AT biopower plant, Thailand)
This methodology can be used for projects that use biomass that would otherwise be dumped orburned in an uncontrolled manner and have access to an abundant supply of biomass that isunutilised and is too dispersed to be used for grid electricity generation under business as usual(BAU). The projects must have a negligible impact on plans for construction of new powerplants as well as on the average grid emissions factor. GA has to be lower than the emissionfactor of the most likely operating margin candidate. These requirements are likely to be fulfilledin Vietnam.
The baseline emission factor is the lower of GA and OM calculated ex post. The OM can becalculated by identifying particular units that may change over the crediting period and thus canbe different from the OM calculated above.
V.2.3. Landfill gas capture and electricity generation projects where landfill gas capture is notmandated by law (Durban landfill gas project, South Africa)
This methodology uses GA calculated ex-post.
V.2.4. Consolidated methodology
At its session of April 2004, the Methodology Panel suggested a consolidated methodology forelectricity generation additions from hydro, wind, geothermal, and solar. Public comments onthis proposal were invited by the CDM EB and in July, a revised version was presented(UNFCCC 2004b) that was adopted with slight revisions by the EB in September (UNFCCC2004d). The baseline emissions factor is ½ OM + ½ BM or GA. The OM is calculated in threeways, of which only one applies to Vietnam:- Average of all power plants with relevantoperating costs. The share of these plants in total generation must be higher than 50%. Electricity
23
imports have to be taken into account at the average emission factor of the exporting grid. Theemission factor is calculated as energy content of fuels used (GJ) times carbon emission factor ofthe fuel (t CO2/GJ). Here local statistics have to be used; if they do not exist IPCC emissionfactors replace them. Either three-year averages going backwards from the “most recent statisticsat time of PDD submission” or ex-post updates for every year of the crediting period can beused.
As Vietnam’s hydro share has fallen below 50%, this OM is applicable. Based on table V.5, itreaches 803 g CO2/kWh in 2004.
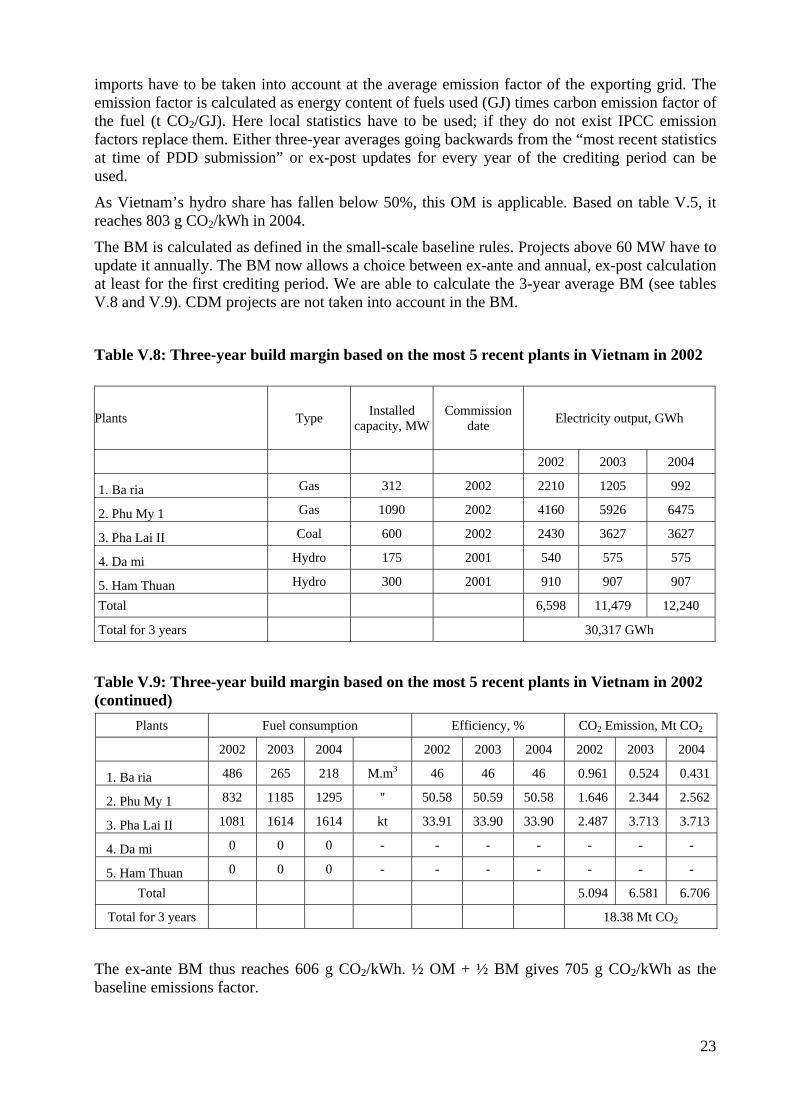
The BM is calculated as defined in the small-scale baseline rules. Projects above 60 MW have toupdate it annually. The BM now allows a choice between ex-ante and annual, ex-post calculationat least for the first crediting period. We are able to calculate the 3-year average BM (see tablesV.8 and V.9). CDM projects are not taken into account in the BM.
Table V.8: Three-year build margin based on the most 5 recent plants in Vietnam in 2002
Plants Type Installedcapacity, MW
Commissiondate Electricity output, GWh
2002 2003 2004
1. Ba ria Gas 312 2002 2210 1205 992
2. Phu My 1 Gas 1090 2002 4160 5926 6475
3. Pha Lai II Coal 600 2002 2430 3627 3627
4. Da mi Hydro 175 2001 540 575 575
5. Ham Thuan Hydro 300 2001 910 907 907
Total 6,598 11,479 12,240
Total for 3 years 30,317 GWh
Table V.9: Three-year build margin based on the most 5 recent plants in Vietnam in 2002(continued)
Plants Fuel consumption Efficiency, % CO2 Emission, Mt CO2
2002 2003 2004 2002 2003 2004 2002 2003 2004
1. Ba ria 486 265 218 M.m3 46 46 46 0.961 0.524 0.431
2. Phu My 1 832 1185 1295 '' 50.58 50.59 50.58 1.646 2.344 2.562
3. Pha Lai II 1081 1614 1614 kt 33.91 33.90 33.90 2.487 3.713 3.713
4. Da mi 0 0 0 - - - - - - -
5. Ham Thuan 0 0 0 - - - - - - -
Total 5.094 6.581 6.706
Total for 3 years 18.38 Mt CO2
The ex-ante BM thus reaches 606 g CO2/kWh. ½ OM + ½ BM gives 705 g CO2/kWh as thebaseline emissions factor.

24
VI. Conclusion
We are able to calculate all necessary parameters for small and large CDM projects related to theelectricity grid for Vietnam. In this regard, Vietnam has a competitive advantage to othercountries where these data are not readily available. The challenge now is to ensure timelyavailability of data in the future as CERs can only be issued if the verifier can check the actualdata. A delay of two years would mean that CDM project owners would have to wait for CERissuance accordingly.
25
VII. References
Electricity of Vietnam (2002): V-Master plan of Electricity Expansion (2001 – 2010) (inVietnamese), Hanoi.
Kartha, S., Lazarus, M. and M. Bosi (2002): Practical Baseline Recommendation forGreenhouse Gas Mitigation Project in the Electric Power Sector, Information PaperCOM/ENV/EPOC/SLT (2002) 1, OECD, Paris
Ministry of Natural Resources and Environment, Vietnam (2003): Vietnam National StrategyStudy on Clean Development Mechanism, Hanoi.
Michaelowa, A.; Stronzik, M.; Eckermann, F. and A. Hunt (2003): Transaction costs of theKyoto Mechanisms, in: Climate Policy, 3, 3, p. 261-278
Program of National Project Energy Development – 2001 – 2005 (in Vietnamese), Hanoi.
UNFCCC/ United Nations Framework Convention on Climate Change (2004d): Approvedconsolidated methodology for grid-connected electricity generation from renewable sources,ACM0002, see http://cdm.unfccc.int/EB/Meetings/015/eb15repan2.pdf
UNFCCC/ United Nations Framework Convention on Climate Change (2004c): Approvedbaseline methodologies, see http://cdm.unfccc.int/methodologies/approved.html
UNFCCC/United Nations Framework Convention on Climate Change (2004b): DRAFT -Approved baseline methodology AM00XX “Consolidated baseline methodology for grid-connected electricity generation from renewable sources”, seehttp://cdm.unfccc.int/EB/Panels/meth/Meth11_Annex1_Consolidated_elct.pdf
UNFCCC/United Nations Framework Convention on Climate Change (2004a): Indicativesimplified baseline and monitoring methodologies for selected small-scale CDM project activitycategories, Appendix B1 of the simplified modalities and procedures for small-scale CDMproject activities, Bonn
26
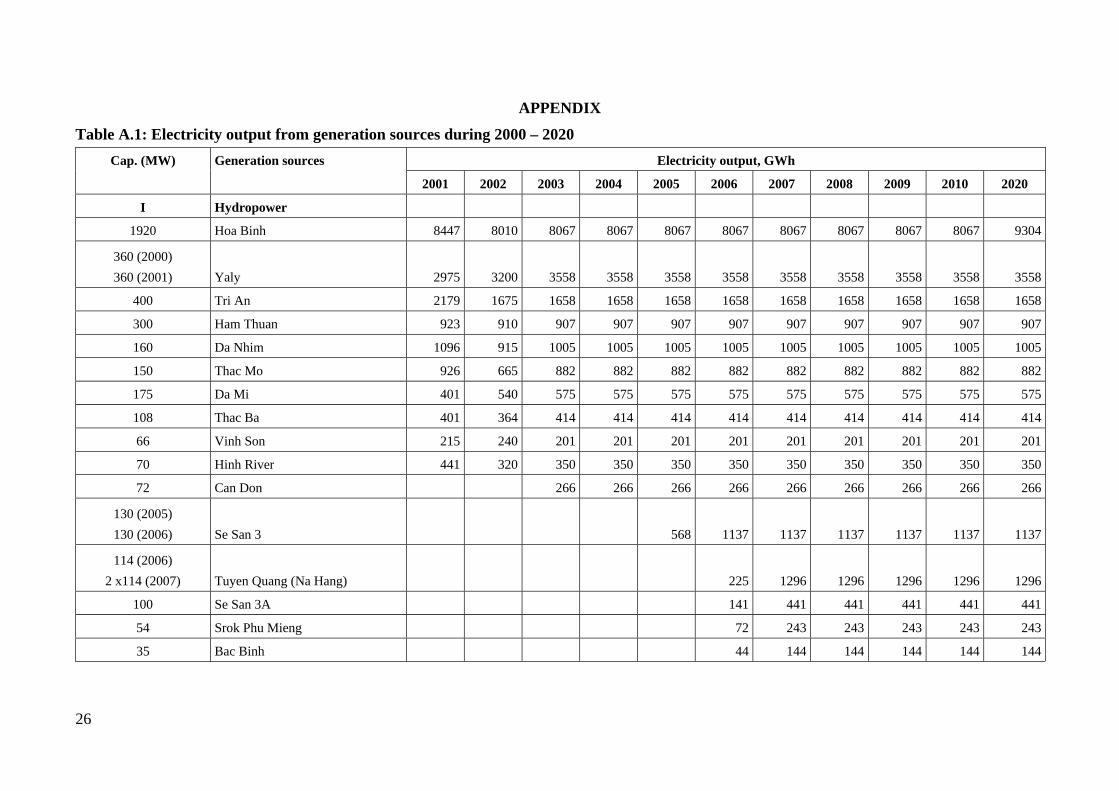
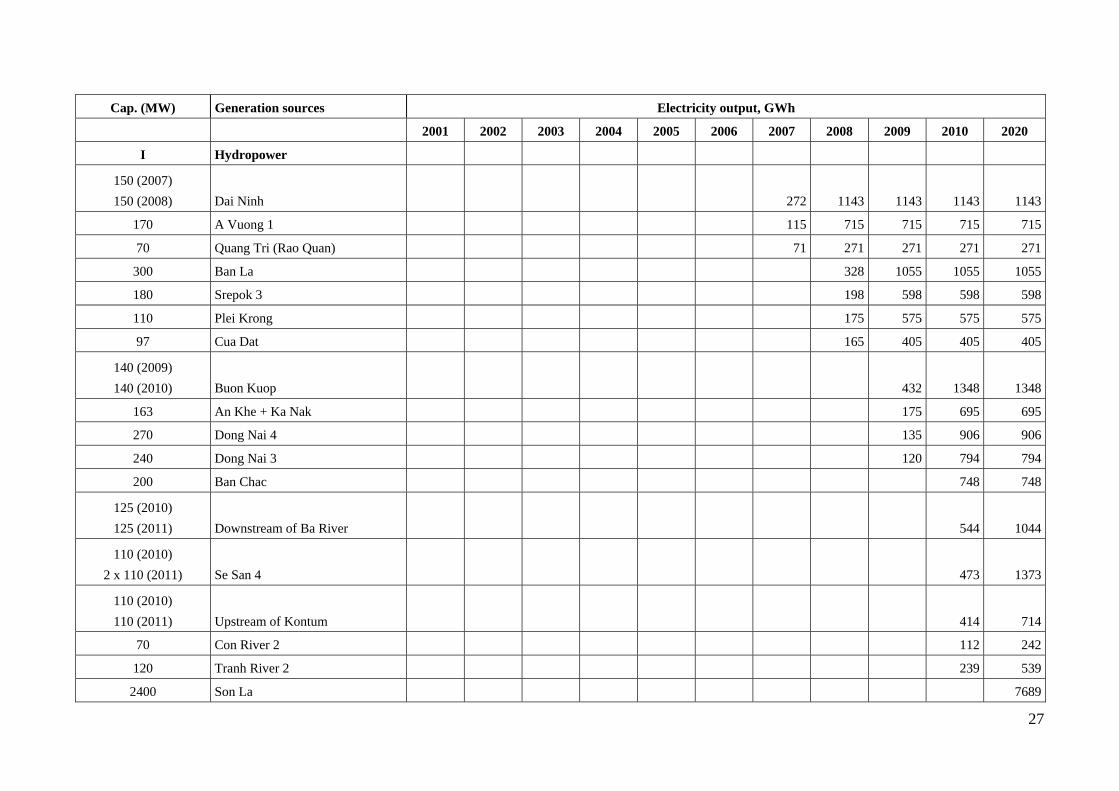
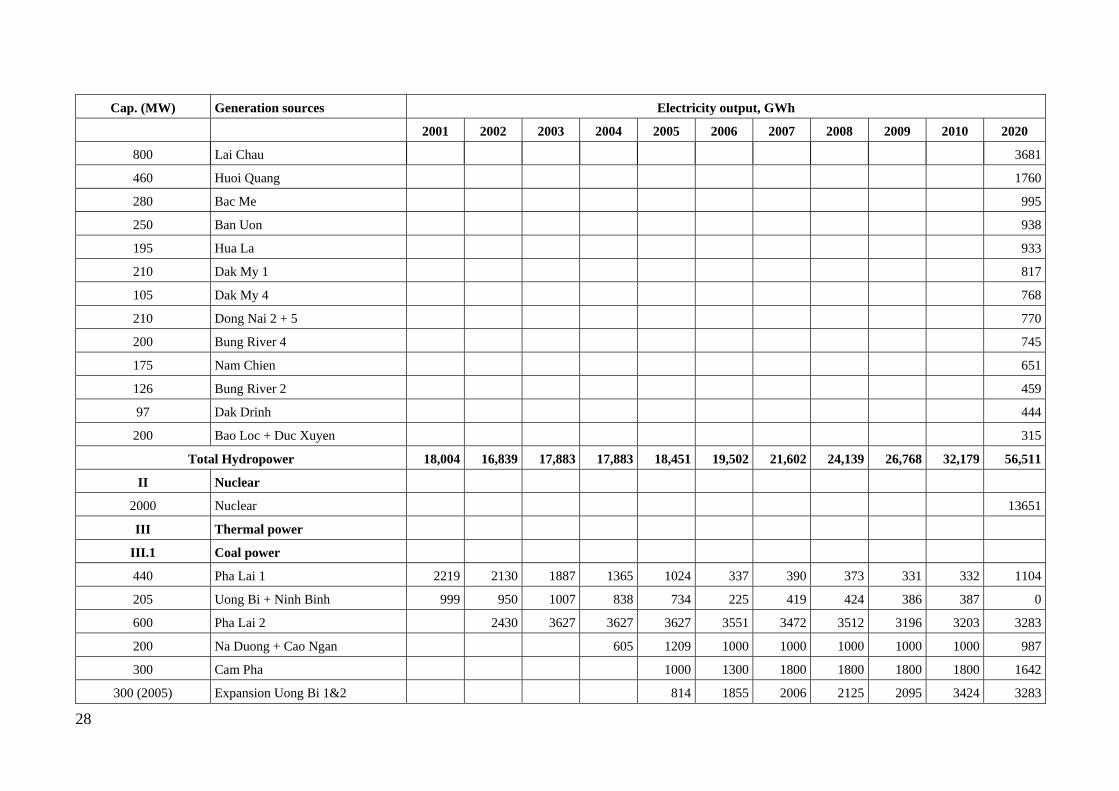
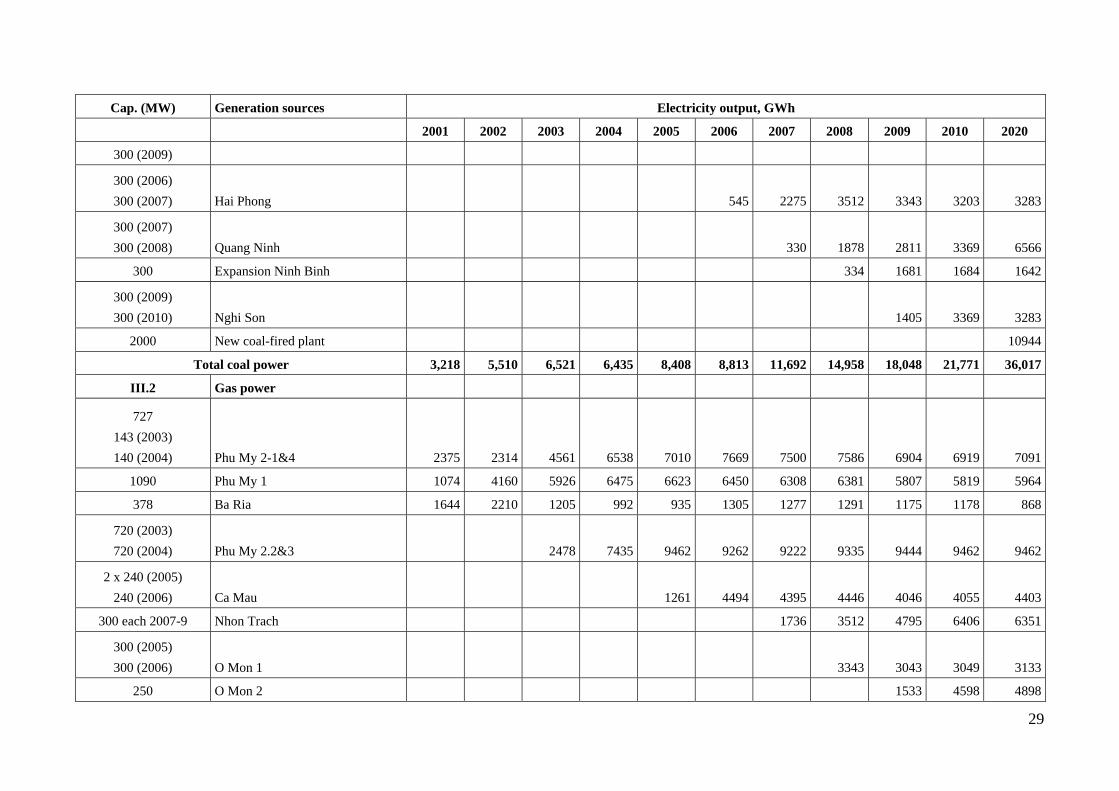
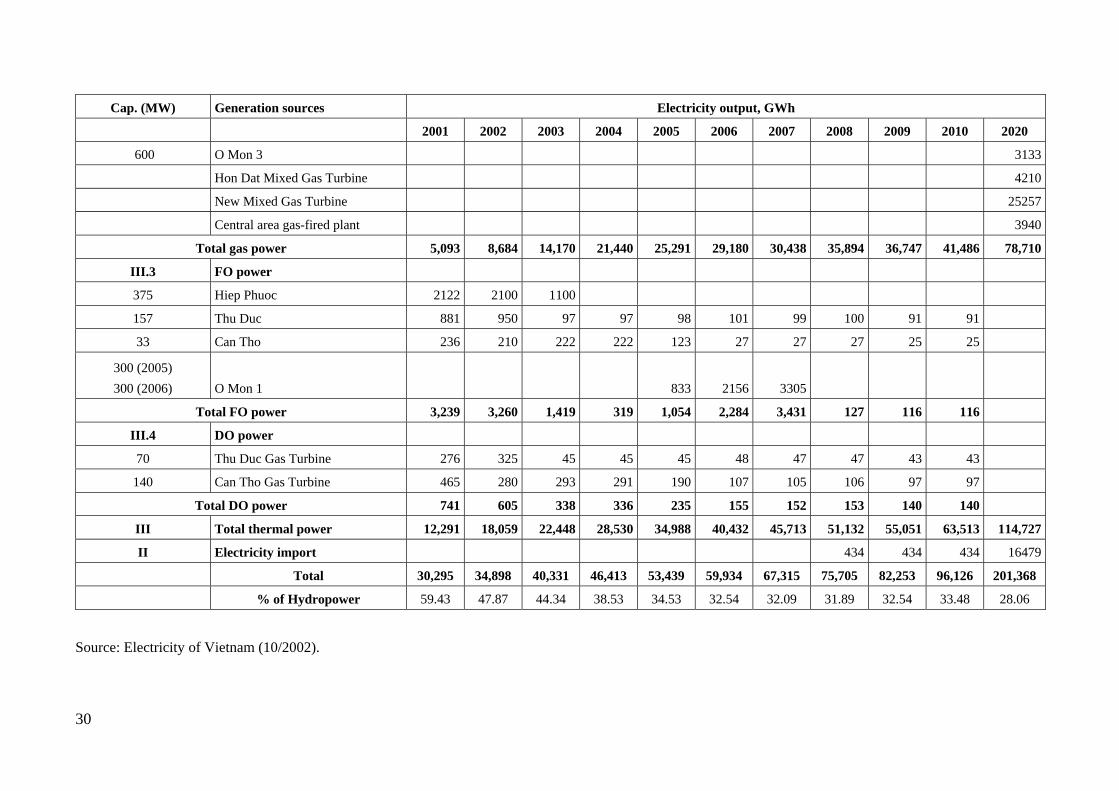
APPENDIXTable A.1: Electricity output from generation sources during 2000 – 2020
Cap. (MW) Generation sources Electricity output, GWh
2001 2002 2003 2004 2005 2006 2007 2008 2009 2010 2020
I Hydropower
1920 Hoa Binh 8447 8010 8067 8067 8067 8067 8067 8067 8067 8067 9304
360 (2000)360 (2001) Yaly 2975 3200 3558 3558 3558 3558 3558 3558 3558 3558 3558
400 Tri An 2179 1675 1658 1658 1658 1658 1658 1658 1658 1658 1658
300 Ham Thuan 923 910 907 907 907 907 907 907 907 907 907
160 Da Nhim 1096 915 1005 1005 1005 1005 1005 1005 1005 1005 1005
150 Thac Mo 926 665 882 882 882 882 882 882 882 882 882
175 Da Mi 401 540 575 575 575 575 575 575 575 575 575
108 Thac Ba 401 364 414 414 414 414 414 414 414 414 414
66 Vinh Son 215 240 201 201 201 201 201 201 201 201 201
70 Hinh River 441 320 350 350 350 350 350 350 350 350 350
72 Can Don 266 266 266 266 266 266 266 266 266
130 (2005)130 (2006) Se San 3 568 1137 1137 1137 1137 1137 1137
114 (2006)2 x114 (2007) Tuyen Quang (Na Hang) 225 1296 1296 1296 1296 1296
100 Se San 3A 141 441 441 441 441 441
54 Srok Phu Mieng 72 243 243 243 243 243
35 Bac Binh 44 144 144 144 144 144
27
Cap. (MW) Generation sources Electricity output, GWh
2001 2002 2003 2004 2005 2006 2007 2008 2009 2010 2020
I Hydropower
150 (2007)150 (2008) Dai Ninh 272 1143 1143 1143 1143
170 A Vuong 1 115 715 715 715 715
70 Quang Tri (Rao Quan) 71 271 271 271 271
300 Ban La 328 1055 1055 1055
180 Srepok 3 198 598 598 598
110 Plei Krong 175 575 575 575
97 Cua Dat 165 405 405 405
140 (2009)140 (2010) Buon Kuop 432 1348 1348
163 An Khe + Ka Nak 175 695 695
270 Dong Nai 4 135 906 906
240 Dong Nai 3 120 794 794
200 Ban Chac 748 748
125 (2010)125 (2011) Downstream of Ba River 544 1044
110 (2010)2 x 110 (2011) Se San 4 473 1373
110 (2010)110 (2011) Upstream of Kontum 414 714
70 Con River 2 112 242
120 Tranh River 2 239 539
2400 Son La 7689
28
Cap. (MW) Generation sources Electricity output, GWh
2001 2002 2003 2004 2005 2006 2007 2008 2009 2010 2020
800 Lai Chau 3681
460 Huoi Quang 1760
280 Bac Me 995
250 Ban Uon 938
195 Hua La 933
210 Dak My 1 817
105 Dak My 4 768
210 Dong Nai 2 + 5 770
200 Bung River 4 745
175 Nam Chien 651
126 Bung River 2 459
97 Dak Drinh 444
200 Bao Loc + Duc Xuyen 315
Total Hydropower 18,004 16,839 17,883 17,883 18,451 19,502 21,602 24,139 26,768 32,179 56,511
II Nuclear
2000 Nuclear 13651
III Thermal power
III.1 Coal power
440 Pha Lai 1 2219 2130 1887 1365 1024 337 390 373 331 332 1104
205 Uong Bi + Ninh Binh 999 950 1007 838 734 225 419 424 386 387 0
600 Pha Lai 2 2430 3627 3627 3627 3551 3472 3512 3196 3203 3283
200 Na Duong + Cao Ngan 605 1209 1000 1000 1000 1000 1000 987
300 Cam Pha 1000 1300 1800 1800 1800 1800 1642
300 (2005) Expansion Uong Bi 1&2 814 1855 2006 2125 2095 3424 3283
29
Cap. (MW) Generation sources Electricity output, GWh
2001 2002 2003 2004 2005 2006 2007 2008 2009 2010 2020
300 (2009)
300 (2006)300 (2007) Hai Phong 545 2275 3512 3343 3203 3283
300 (2007)300 (2008) Quang Ninh 330 1878 2811 3369 6566
300 Expansion Ninh Binh 334 1681 1684 1642
300 (2009)300 (2010) Nghi Son 1405 3369 3283
2000 New coal-fired plant 10944
Total coal power 3,218 5,510 6,521 6,435 8,408 8,813 11,692 14,958 18,048 21,771 36,017
III.2 Gas power
727143 (2003)140 (2004) Phu My 2-1&4 2375 2314 4561 6538 7010 7669 7500 7586 6904 6919 7091
1090 Phu My 1 1074 4160 5926 6475 6623 6450 6308 6381 5807 5819 5964
378 Ba Ria 1644 2210 1205 992 935 1305 1277 1291 1175 1178 868
720 (2003)720 (2004) Phu My 2.2&3 2478 7435 9462 9262 9222 9335 9444 9462 9462
2 x 240 (2005)240 (2006) Ca Mau 1261 4494 4395 4446 4046 4055 4403
300 each 2007-9 Nhon Trach 1736 3512 4795 6406 6351
300 (2005)300 (2006) O Mon 1 3343 3043 3049 3133
250 O Mon 2 1533 4598 4898
30
Cap. (MW) Generation sources Electricity output, GWh
2001 2002 2003 2004 2005 2006 2007 2008 2009 2010 2020
600 O Mon 3 3133
Hon Dat Mixed Gas Turbine 4210
New Mixed Gas Turbine 25257
Central area gas-fired plant 3940
Total gas power 5,093 8,684 14,170 21,440 25,291 29,180 30,438 35,894 36,747 41,486 78,710
III.3 FO power
375 Hiep Phuoc 2122 2100 1100
157 Thu Duc 881 950 97 97 98 101 99 100 91 91
33 Can Tho 236 210 222 222 123 27 27 27 25 25
300 (2005)300 (2006) O Mon 1 833 2156 3305
Total FO power 3,239 3,260 1,419 319 1,054 2,284 3,431 127 116 116
III.4 DO power
70 Thu Duc Gas Turbine 276 325 45 45 45 48 47 47 43 43
140 Can Tho Gas Turbine 465 280 293 291 190 107 105 106 97 97
Total DO power 741 605 338 336 235 155 152 153 140 140
III Total thermal power 12,291 18,059 22,448 28,530 34,988 40,432 45,713 51,132 55,051 63,513 114,727
II Electricity import 434 434 434 16479
Total 30,295 34,898 40,331 46,413 53,439 59,934 67,315 75,705 82,253 96,126 201,368
% of Hydropower 59.43 47.87 44.34 38.53 34.53 32.54 32.09 31.89 32.54 33.48 28.06
Source: Electricity of Vietnam (10/2002).
31
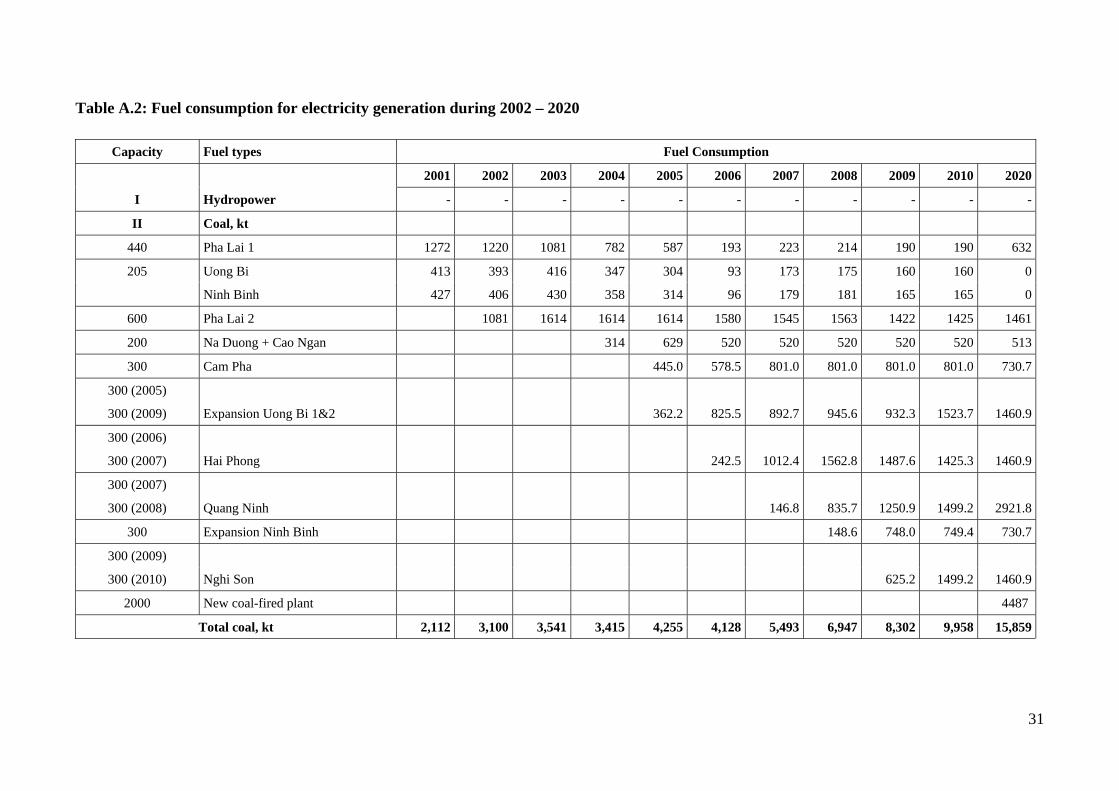
Table A.2: Fuel consumption for electricity generation during 2002 – 2020
Capacity Fuel types Fuel Consumption
2001 2002 2003 2004 2005 2006 2007 2008 2009 2010 2020
I Hydropower - - - - - - - - - - -
II Coal, kt
440 Pha Lai 1 1272 1220 1081 782 587 193 223 214 190 190 632
205 Uong Bi 413 393 416 347 304 93 173 175 160 160 0
Ninh Binh 427 406 430 358 314 96 179 181 165 165 0
600 Pha Lai 2 1081 1614 1614 1614 1580 1545 1563 1422 1425 1461
200 Na Duong + Cao Ngan 314 629 520 520 520 520 520 513
300 Cam Pha 445.0 578.5 801.0 801.0 801.0 801.0 730.7
300 (2005)
300 (2009) Expansion Uong Bi 1&2 362.2 825.5 892.7 945.6 932.3 1523.7 1460.9
300 (2006)
300 (2007) Hai Phong 242.5 1012.4 1562.8 1487.6 1425.3 1460.9
300 (2007)
300 (2008) Quang Ninh 146.8 835.7 1250.9 1499.2 2921.8
300 Expansion Ninh Binh 148.6 748.0 749.4 730.7
300 (2009)
300 (2010) Nghi Son 625.2 1499.2 1460.9
2000 New coal-fired plant 4487
Total coal, kt 2,112 3,100 3,541 3,415 4,255 4,128 5,493 6,947 8,302 9,958 15,859
32
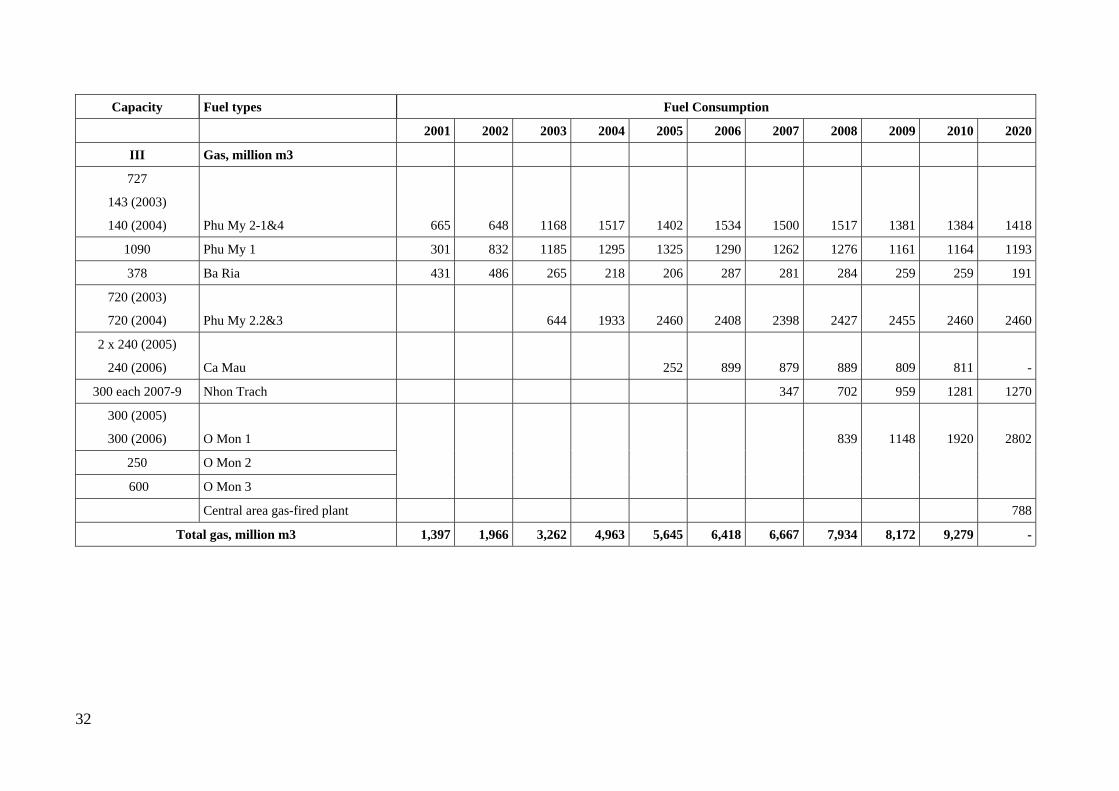
Capacity Fuel types Fuel Consumption
2001 2002 2003 2004 2005 2006 2007 2008 2009 2010 2020
III Gas, million m3
727
143 (2003)
140 (2004) Phu My 2-1&4 665 648 1168 1517 1402 1534 1500 1517 1381 1384 1418
1090 Phu My 1 301 832 1185 1295 1325 1290 1262 1276 1161 1164 1193
378 Ba Ria 431 486 265 218 206 287 281 284 259 259 191
720 (2003)
720 (2004) Phu My 2.2&3 644 1933 2460 2408 2398 2427 2455 2460 2460
2 x 240 (2005)
240 (2006) Ca Mau 252 899 879 889 809 811 -
300 each 2007-9 Nhon Trach 347 702 959 1281 1270
300 (2005)
300 (2006) O Mon 1
839 1148 1920 2802
250 O Mon 2
600 O Mon 3
Central area gas-fired plant 788
Total gas, million m3 1,397 1,966 3,262 4,963 5,645 6,418 6,667 7,934 8,172 9,279 -
33
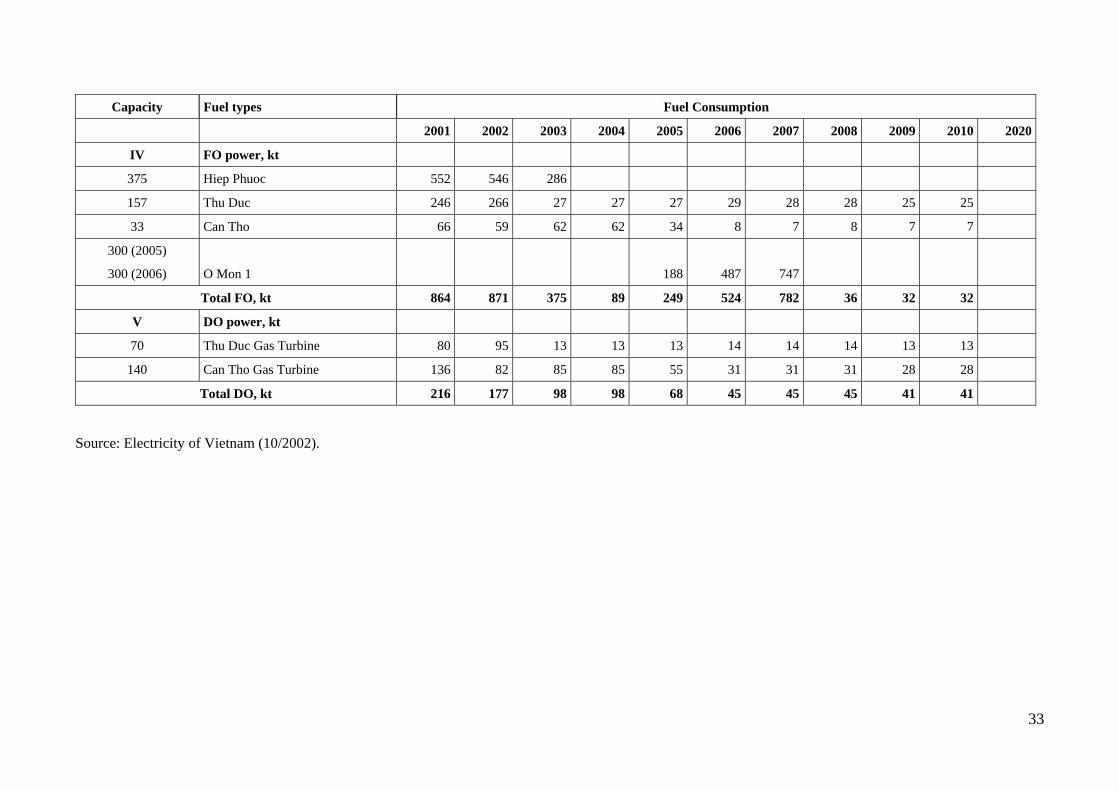
Capacity Fuel types Fuel Consumption
2001 2002 2003 2004 2005 2006 2007 2008 2009 2010 2020
IV FO power, kt
375 Hiep Phuoc 552 546 286
157 Thu Duc 246 266 27 27 27 29 28 28 25 25
33 Can Tho 66 59 62 62 34 8 7 8 7 7
300 (2005)
300 (2006) O Mon 1 188 487 747
Total FO, kt 864 871 375 89 249 524 782 36 32 32
V DO power, kt
70 Thu Duc Gas Turbine 80 95 13 13 13 14 14 14 13 13
140 Can Tho Gas Turbine 136 82 85 85 55 31 31 31 28 28
Total DO, kt 216 177 98 98 68 45 45 45 41 41
Source: Electricity of Vietnam (10/2002).