Embed Size (px)
Citation preview
~Pr= SJ( (fI-?••••OACIt<(lO\lNO: ~A»;o A-~"'Aol'I~)
o
.
CDlww'1 ?I
r ~-- I.fL ~I ~-
I .3(f)WHAT ?')A;k~' P&.ES~r:~~~':",-:'~!Q)PEs
1- ..
-- ,.....,
,..f D t:lPT IS
(§) HoW? .~iNCiP~$ of iNTE"RFe«oMeT'"R'Y:.. WSRT. ,,-.A. VC.BA •""B% •\fSOP, ••.
@fW'-IAT-2.? 'PItiNc.'Pc.E',", of Av~i~Jt "I"'IfA~AItt'\I
-t------- --- ..,-III
®1 ••ow-2 ? 'PE~FEcriNc; 'NTEIt~IIo~E"''''':
I CAua. hAPPiNf; •1>e-coNV.S~~c..
~How-1? 4If'ltE ~.F JE"CoNVoc..vTiON",-rHE <;•••• erHE .:IA-•., ~ uq •.•,."
I
I :
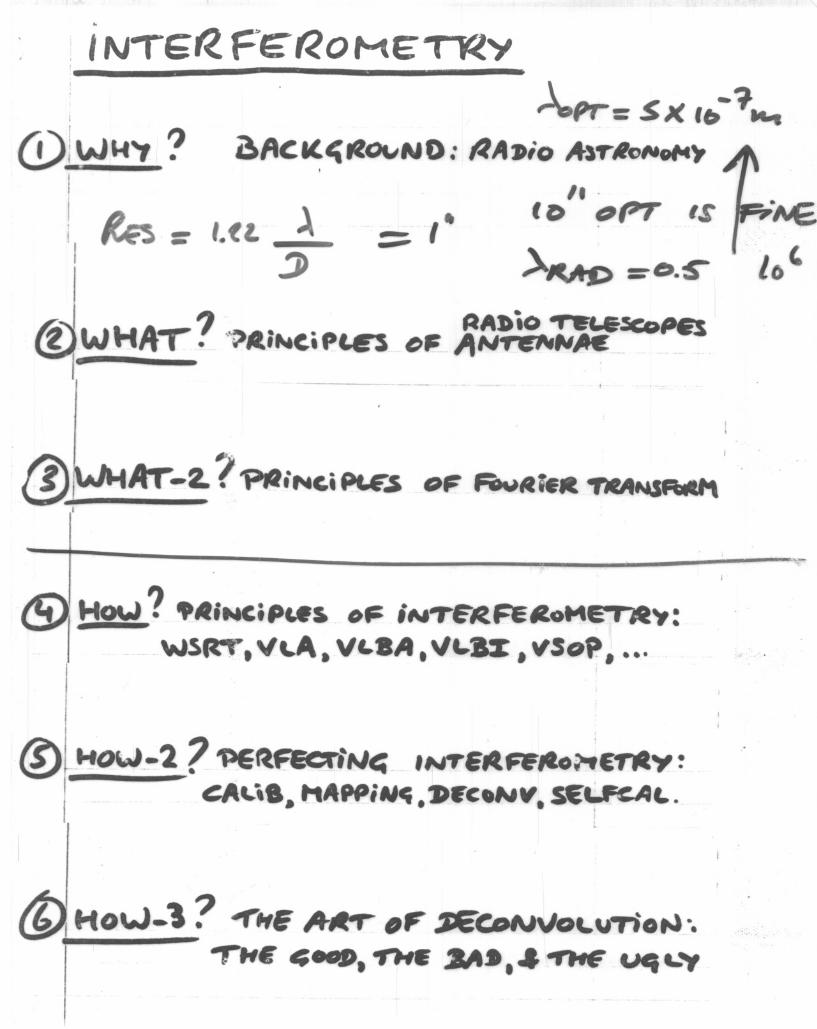
(1)WHkr. HOW.'" ""liEN? APPf.;c/"r;o~II
:~ souttcE CoUNTS. $;t.s ~s panta-. ;AQEy
.' -,
Radio Astronomy
John D. Kraus, Ph.D.
Professor of Astronomy and Electrical Engineering,
and Director of the Radio Observatory,
The Ohio State University
~ith a chapter on Radio-Telescope Receivers by.. Marui E. Tiuri
Doctor of Technology
Professor of Radio Engineering,
Institute of Technology, Helsinki, Finland
rl,e Fo" •.ie •. T,·a"sfo •.",
""d Its Applications
Ron BracewellProfeuor of Electrical Engineering, Stanford University
McGraw-Hill Book Compau)'N ew York St. Louis San Francisco Toronto London Sydney
McGraw-Dill Boor, CompanyNew Yark San Francisco Toronto Lnndon Sydney
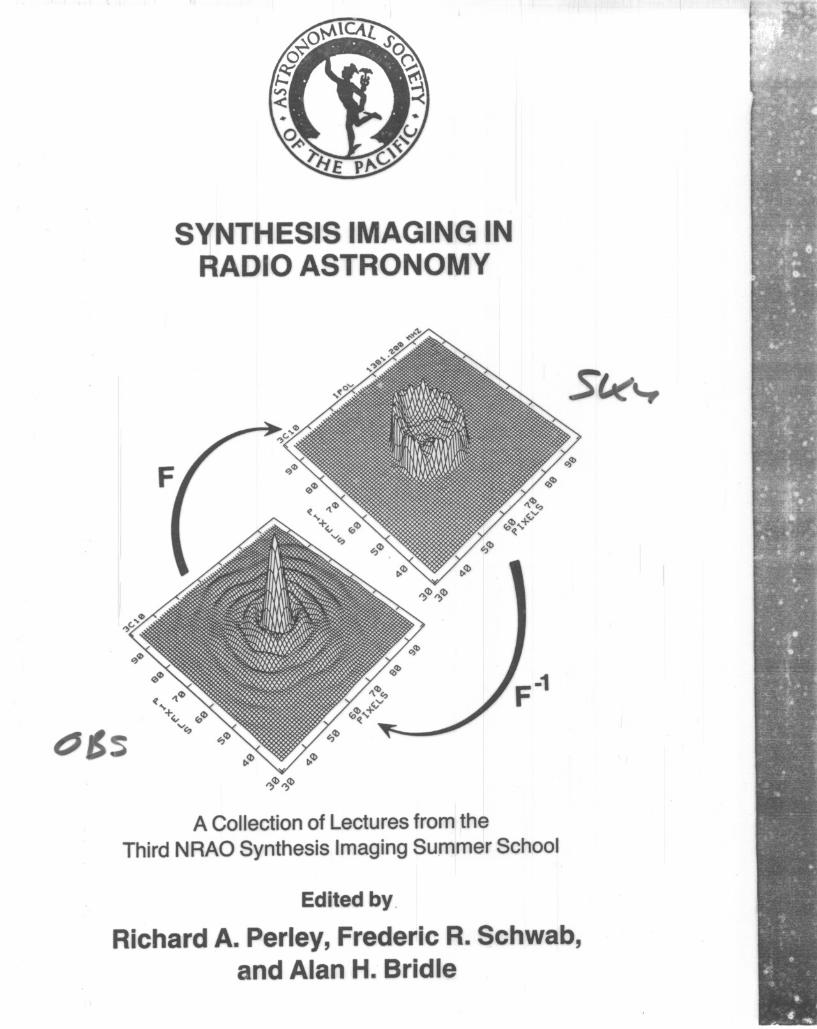
SYNTHESIS IMAGING INRADIO ASTRONOMY
A Collection of Lectures from the
Third NRAO Synthesis Imaging Summer School
Edited by.
Richard A. Perley, Frederic R. Schwab,and Alan H. Bridle
I
,.:..,

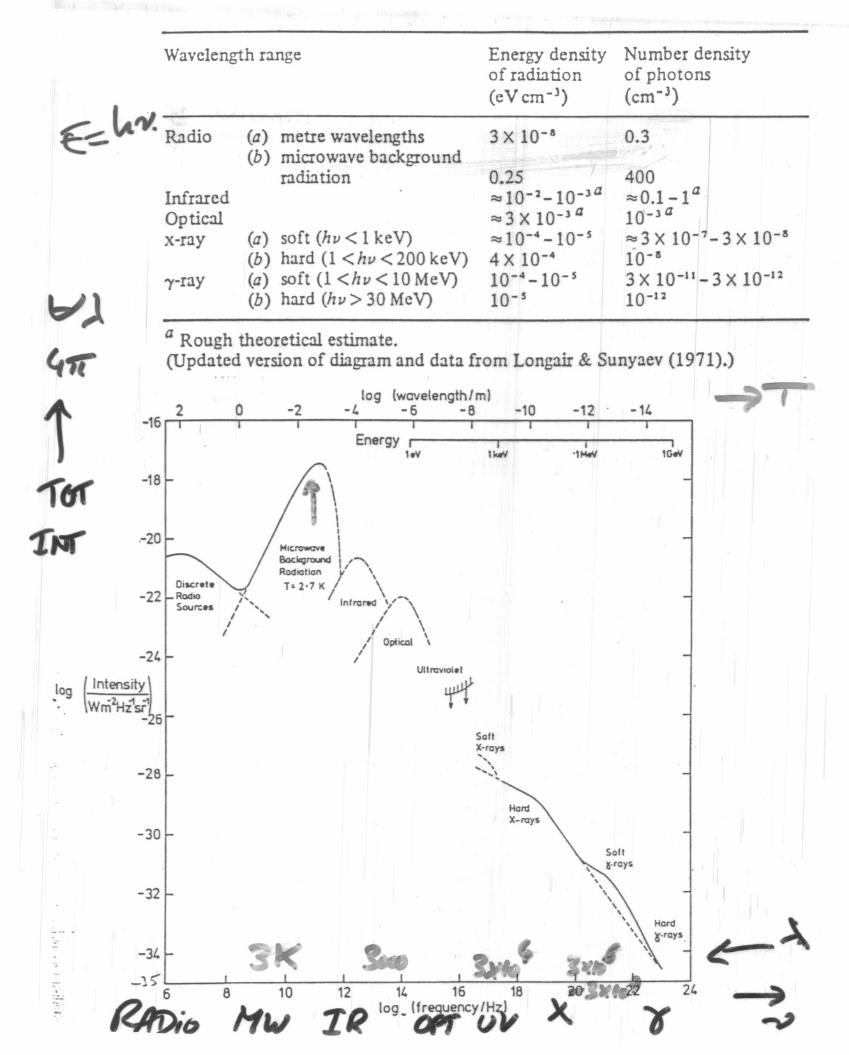
Wavelength range Energy density Number densityof radiation of photons(eV cm-J) (cm-J)
3 X 10-11 0.3
Infrared
Opticalx-ray
i-ray
(a) metre wavelengths(b) microwave background
radiation
(a) soft (hv < 1keV)(b) hard (1 <hv < 200 keY)(a) soft (1 <hv < 10 MeV)(b) hard (hv > 30 MeV)
0.25;:::,10-2_10-Ja~ 3 X 1 O-J a;:::,10-4 -10-54 X 10-410-4-10-510- 5
II
400 I:::::O.l-la.10-Ja;:::,3 X 10-7-3X 10-11
10-1S
3 X 10-11- 3 X 10⁻¹:2
10-12
a Rough theoretical estimate.(Updated version of diagram and data from Longair & Sunyaev (1971).)
-16
-18
.-20
-21.
,log(~n~~:~~;'-~6
-28
-30
-32
-31.
2 o -2log (wcvelength/mJ
-I. -6 -8
I1 ••••••
Soft
~'roys,,..•.. \..~
11. 16 18
XR 109w (<<tncyu~
I'1Mrt'
-1'
I1Gft'
2'
•ill;c.:aJ.~W~"C[aJ.')i~1Cl3.L!N!'.~'~".,1.0"4-~~"~AM"''''''!o_,.~-~~'GH.•~~
't_(!w.s;(~)'''N4-",
~"'~.a ,-~

80 Radio Astronomy Radio-Astronomy Pundamentals 81
.......... (3~1) ~(3-1)7)
To facilitate integration let us put (Richtmyer and Kennard, 1942)h"
x = kT
from which it follows that
kT kT" = T x and d" = T dx
Substituting these values into (3-53) gives
B' = 2;'. eTY (a> ~ dxc2 h Jo ez - 1
(3-55)
(3-56)
The integral is a constant. Combining this constant with the others in theequation, we obtain the Stefan-Boltzmann relation *
~~ ff •••. 7~where B' = total brightness, watts m-2 rad-2 •••••• ~u = constant (= 1.80 X 10⁻⁸ watt 01-2 °K-I) U ~
T = temperature of blackbody, OKThe total brightness B' at a given temperature is given by the area
under the Planck-radiation-Iaw curve for that temperature. According to
1012
10-l4,10-10
,
1018
Wavelenglh, m-10-8 1O-ii 1()-4 10-2
, , • I
~ Frequency, Cpt1016 1014 1012 10.0 108
102,
106
104,
1012
102
106 108
~ Wavelength, m10-2
I ()-41O-ii10-810-1010-1210-14,
,,,,,
}BA
Frequency, cp' ---+- 10101012101410.61018
1010 10.0
10-22
108
106
10-20IQ-S
1030.., I""•
Iozs _~
'E
1020 'i'E·'ii
10lS J.<
I:Q·1010 ~
.=.!I'~
IOS =
10'S
1040
X ray andultraviolet
I 00,000 'K
IO,oOO'"1f'~
6,ooo'K
l,ooo'K
loo'K
102
104
106
108
10-ii
10-8
10-12
1040
Y
1035
I billion 'K X..r~100 million 'K
10·0..'i'
..I
r-IO million 'K."
." fI million 'K
1025 fi.iloo,ooo'K
E•.."
IO,ooo'K .",.1020 'i'..IE E
6,000 'K • ~ ~1015 ~
'iil,ooo'K J
loo'K1C;C..
"~I:Q
, .•... ., ";;;,'C=
lUeS
10-'0
X ray andultraviolf"t
102
104
10-16
1. 10-2"'i'E I()-4.~ 10-iiJ
~ 10-1I:Q
~ 10-10=:: 10-12;;,
'C= 10-14
..I."f
10.0 1012 1014 1016Frequency, cpa --..
10·8 1020
10-2 1()-4 1O-ii 10-1-Wavelength, m
,IC-a
I Imicron mlu em
I I I I
1O-ii 1()-4 10-2Wavelength, m .....•
1m,
102 10'
I Iem mm
Imicron
Iangstrom, .
10-'0 1()-14
Fig. 3-13. Planck-law radiation curves to logarithmic scales with brightness expressedas a function of frequency B (••) (left'and bottom scales) and as a function of wavelengthBA (right and top scales). Wavelength increases to the right.
Fig. 3-14. Plailck-radiation-law curves with frequency increasing to the right.
• The usual stntcment gives the integrated value of B' over one hemisphere as obtainedby multiplying (3-57) by,... See (3-10). /
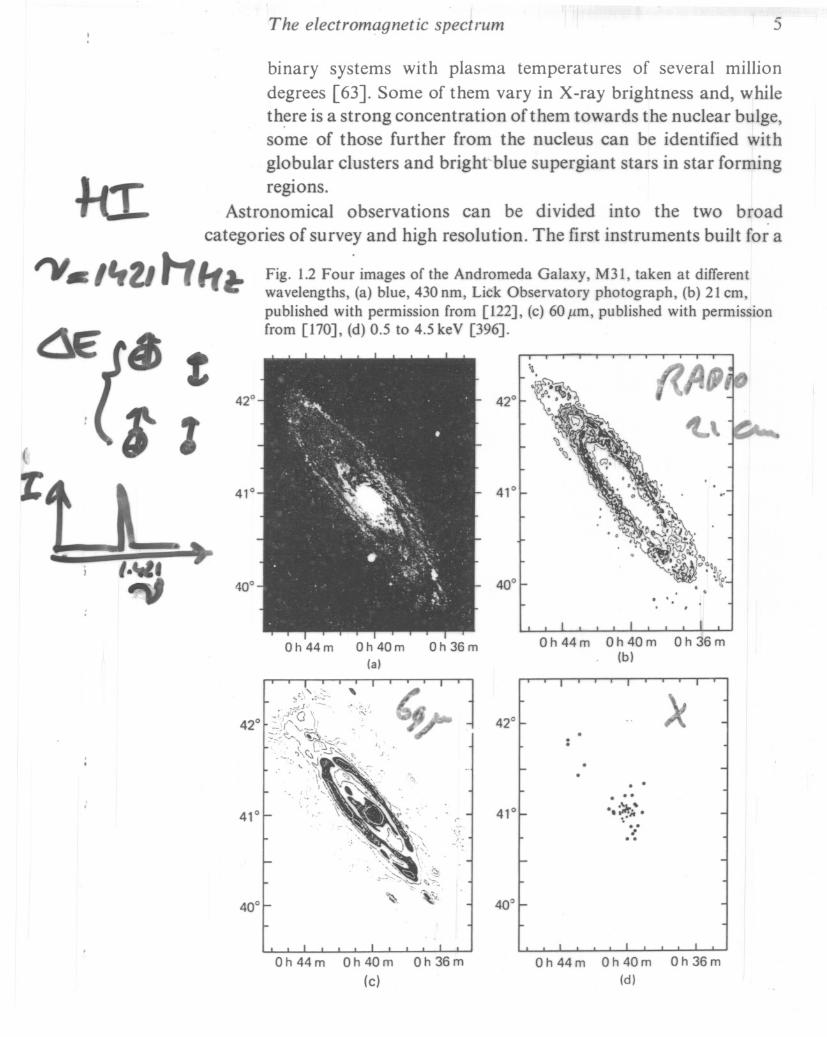
The electromagnetic spectrum 5
Fig. 1.2 Four images of the Andromeda Galaxy, M31, taken at differentwavelengths, (a) blue, 430 nm, Lick Observatory photograph, (b) 21 em,published with permission from [122J, (c) 60,um, published with permissionfrom [170J, (d) 0.5 to 4.5keV [396].
binary systems with plasma temperatures of several million
degrees [63]. Some of them vary in X-ray brightness and, while
th~re is a strong concentration of them towards the nuclear bulge,some of those further from the nucleus can be identified with
globular clusters and bright'blue supergiant stars in star formingregIOns.
Astronomical observations can be divided into the two broad
categories of survey and high resolution. The first instruments built for a
'11.'''21 t111~
•
(
r
, .
o h 44 m 0 h 40 m 0 h 36 m
(a)
.-
o h 44 m 0 h 40 m 0 h 36 m
(c)
40"
o h 44 m 0 h 40 m 0 h 36 m(b)
... ...,~;.".
'.' ......
o h 44 m 0 h 40 m 0 h 36 m(d)
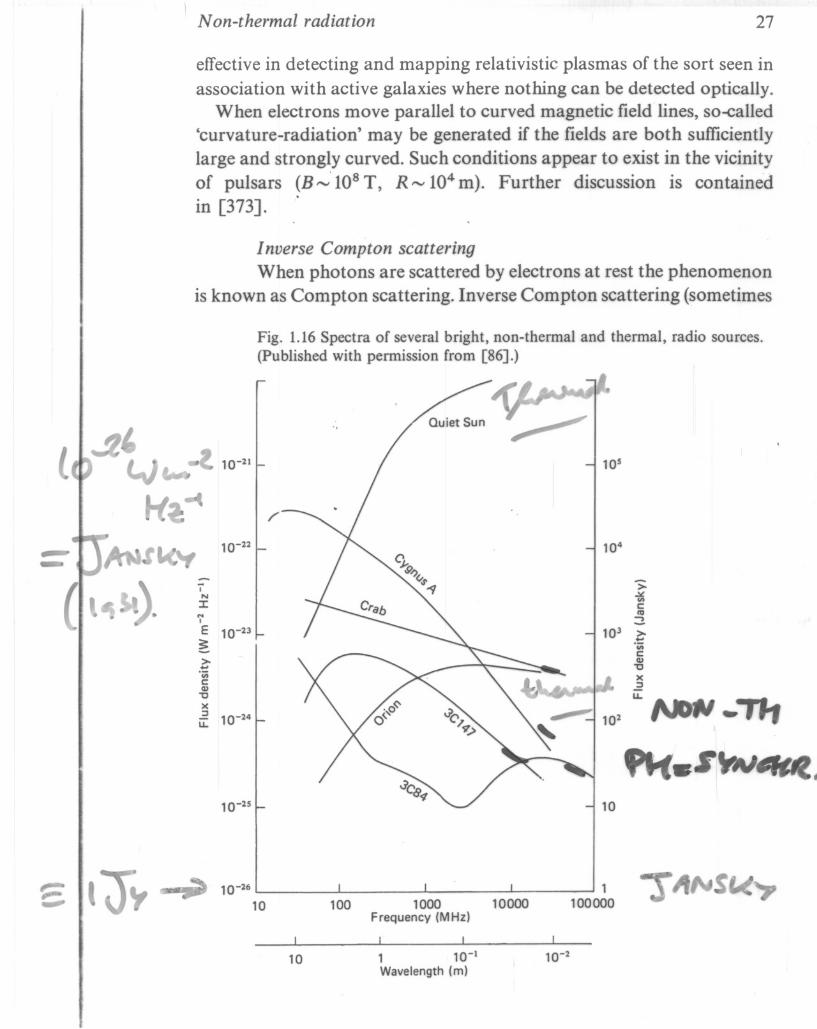
N on-thermal radiation 27
effective in detecting and mapping relativistic plasmas of the sort seen inassociation with active galaxies where nothing can be detected optically.
When electrons move parallel to curved magnetic field"lines, so-called'curvature-radiation' may be generated if the fields are both sufficientlylarge and strongly curved. Such conditions appear to exist in the vicinityof pulsars (B ","108 T, R", 104 m). Further discussion is contained
..
in [373].
I nverse Compton scatteringWhen photons are scattered by electrons at rest the phenomenon
is known as Compton scattering. Inverse Compton scattering (sometimes
Fig. 1.16 Spectra of several bright, non-thermal and thermal, radio sources.(Published with permission from [86].)
..:t~l '-J~;t 10-21
~~~
~fL('1 10-22_
( ,.~.)-
~- -IN
:::r:...IE 10-23~>•...'incQ)"tJX
:J 10-24u..
10-25
'f/P t ".Quiet Sun .-'
10
10 -26
10
10
100 1000Frequency (MHz)
I
1 10-1Wavelength (m)
10000
I10-2
1100000

54 Observational limits
Precession
The rotation axis ')fthe Earth is inclined at 23.5° to its orbital axis
and it precesses in a cone of the same semi-angle, 23.5°, with a period of26 000 years about the orbital axis. This causes the obliquity of the eclipticto change and there are significant changes in stellar coordinates fromyear to year. Approximate and precise formulae for the correction of theeffect of precession and for the effectof nutation and proper motion can befound in the Astronomical Almanac [399]. For back of the envelope
Fig. 2.14 The average variation of natural background radio noise withwavelength. (Published with permission from [235].)
3mWavelength
0.3 m 3cm
10
Antennaangle fromzenith
Atmospheric absorption noise
Wt "'7"-1"
e /" I" I
•• IDry / ' •...
,I I'I IWet ~ I
IDry II"
--- ..•...
110 MHz ·100 MHz 1
Freque
z 10 GHz 100 GHz
o<:)
pI....!J
cent{Be
asit
obse~a
vail
exter408-1
1.3.2
Itis
\to
fugalacfor
s(
sion.teles(
At
and
1985
longito
6C
AlteI
5G
1
!iatitl
c:rppe••
disk
~J.93°
<
..»
Be
~,.~
ther
FI;
thrm
'-'~
.•ruled""
\t-!w
asi
,,"J&
.A.-
sho\\by
it:
t:.,.discr
cent(
Ugala(com
]brig}in
th:
used
forit
1.3.3
Figu
gala(
-250-225-200-175-150-125-100-75 -50 -25 0 25 50 75 100 125 150 175200 225250
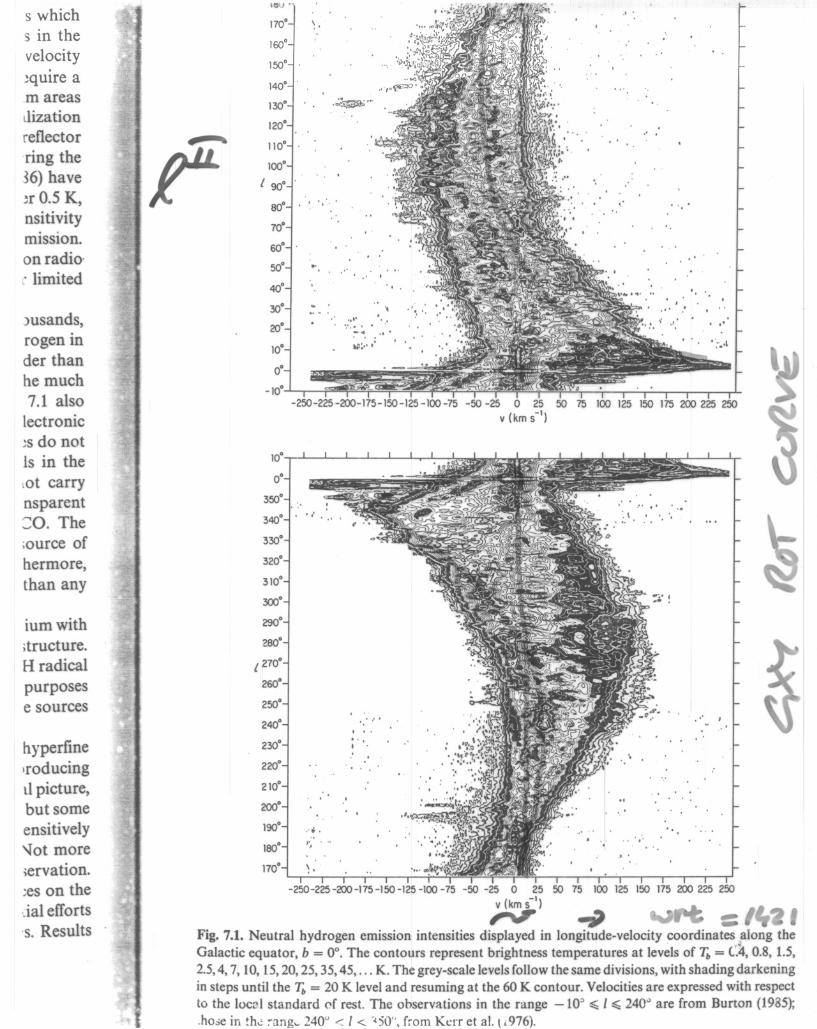
v (km 5-1) ;~ ~....A,. __ 1'_' It""'" ~ 'W'.,., _ .'W ••Fig. 7.1. Neutral hydrogen emission intensities displayed in longitude-velocity coordinates along the
Galactic equator, b = 0°, The contours represent brightness temperatures at lev~ls of T" = C4, 0.8, 1.5,
2.5,4,7, 10, 15,20,25,35,45, ... K. The grey-scale levels follow the same divisions, with shading darkening
in steps until the T" = 20 K level and resuming at the 60 K contour. Velocities are expressed with respectto the loc~l standard C'f rest. The observations in the range -10' ~ I ~ 240" are from Burton (1935);.ho;;e in th.; :-ang" 240U < I < '~SO", from Kerr et al. (.976).
. ,
..
~ ..,.~
. "
. "
~.-50 -25 0 25 50 75 100 125 150 175 200 225 250
v (km 5-1)
','
~~.,,"~- .
••1'......
'.' .
10·
o·3'Y)", .340·
. ,'
330· 320·310·'3QO.290·280·I 270·260·250·240·230·220·210·200·190·
."'; .ISO·
)'..."
170·~.
H:~U•
170·160·150·140·130·120·,.... 110·r 100·I 90·80·70·60·50·40·30·20·10·o·-10·
ium withitructure.H radical
purposese sources
hyperfineIroducingIIpicture,but someensitively\J" ot moreiervation.;es on thedal efforts's. Results
s whichs in the
velocity~qUlre a,m areasllizationreflector
-ring the36) have~r0.5 K,nsitivitymISSIon.
on radio·" limited
Jusands,rogen IIIderthanhe much7.1 also
lectronic;s do notis in the
lot carrynsparent:0. The;ource of
hermore,than any

iSv [Jy]
10
0,01
0,005
I I I I I II I I I I I I I I
NovoV 1500 Cygni
1975• 2.695 GHz)( 4.9 GHzo 8.085 GHzc 90 GHz+ 30 THzv 62.5 THz6 136 THz
fCr
to k~ =~,.
•I
I
Fig. 9
pradl'ejecte,the s
(Fran
FsligJdonnr)D
d..fIwh\.
probehmo:
Figwit:
tun
res(
cor.
alrr
antheWIT
Ifre,
theSIO
bel
by
<:J
Figshe
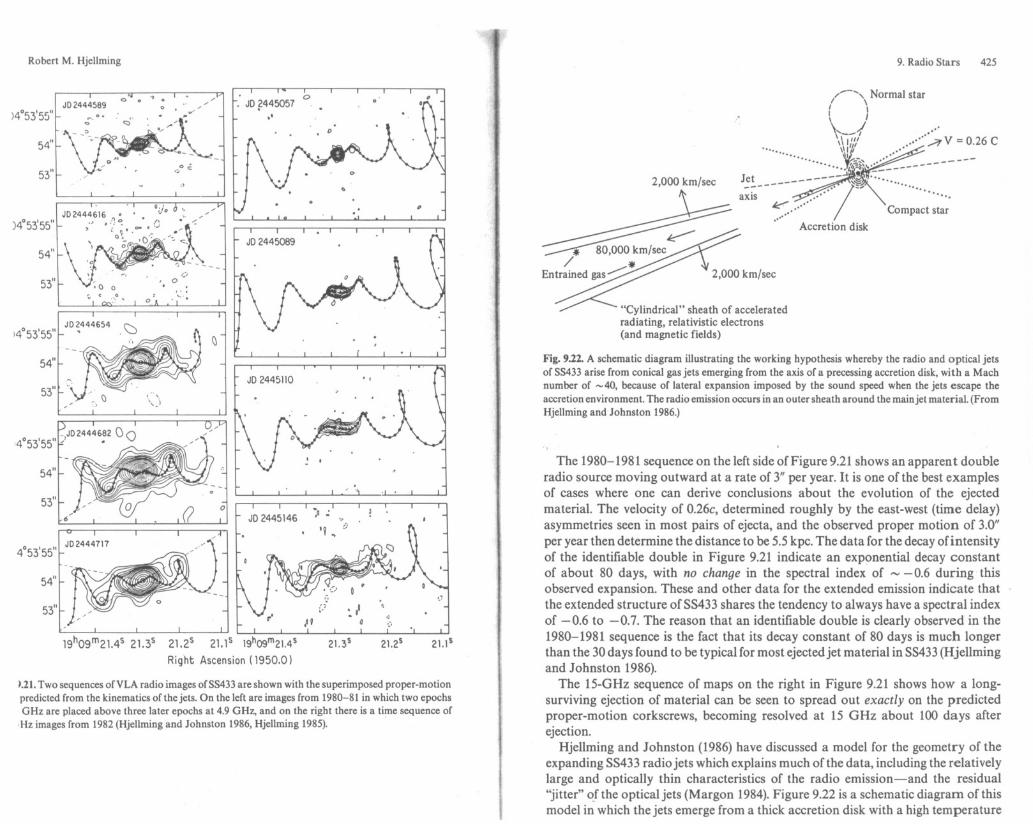
Robert M. Hjellming 9. Radio Stars 425
2,000 km/sec
)4°53'55"
54"
53"
)4°53'55"
54"
JD 2444589o • .., • o
• JD ?445057"
o
2,000 km/sec
~80,000 km/sec/ .
En trained gas..-/:
/ ..- ..., Normal starI \I I
• I I
- \ -I .'.....--1 .0-
.......... \~~:/I~~' ...;r V = 0.26 C
•••••..... -..., .0' __ ---
~~~:::l'~"::---------J:~__------- "/'~' .axis ....•....•
5······· Compact starAccretion disk
19h09m21As 21.3s 21.2s 21.15 19h09m21.4s
Right Ascension (1950.0)
1.21.Two sequences ofVLA radio images ofSS433 are shown with the superimposed proper-motionpredicted from the kinematics of the jets. On the left are images from 1980-81 in which two epochsGHz are placed above three later epochs at 4.9 GHz, and on the right there is a time sequence of
,Hz images from 1982 (Hjellming and Johnston 1986, Hjellming 1985).
54"
53"
4°53'55"
54"
53"
oJD 2445146
"Cylindrical" sheath of acceleratedradiating, relativistic electrons(and magnetic fields)
Fig. 9.22. A schematic diagram illustrating the working hypothesis whereby the radio and optical jetsof SS433 arise from conical gas jets emerging from the axis of a precessing accretion disk. with a Machnumber of -40. because of lateral expansion imposed by the sound speed when the jets escape theaccretion environment. The radio emission occurs in an outer sheath around the mainjet material. (FromHjellming and Johnston 1986.)
The 1980-1981 sequence on the left side of Figure 9.21 shows an apparent doubleradio source moving outward at a rate of 3" per year. It is one of the best examplesof cases where one can derive conclusions about the evolution of the ejectedmaterial. The velocity of 0.26c, determined roughly by the east-west (time delay)asymmetries seen in most pairs of ejecta, and the observed proper motion of 3.0"per year then determine the distance to be 5.5 kpc. The data for the decay of intensityof the identifiable double in Figure 9.21 indicate an exponential decay constantof about 80 days, with no change in the spectral index of '" -0.6 during thisobserved expansion. These and other data for the extended emission indicate thatthe extended structure ofSS433 shares the tendency to always have a spectral indexof -0.6 to -0.7. The reason that an identifiable double is clearly observed in the1980-1981 sequence is the fact that its decay constant of 80 days is much longerthan the 30 days found to be typical for most ejected jet material in SS433 (Hjellmingand Johnston 1986).
The 15-GHz sequence of maps on the right in Figure 9.21 shows how a longsurviving ejection of material can be seen to spread out exactly on the predictedproper-motion corkscrews, becoming resolved at 15 GHz about 100 days afterejection.
Hjellming and Johnston (1986) have discussed a model for the geometry of theexpanding SS433 radio jets which explains much of the data, including the relativelylarge and optically thin characteristics of the radio emission-and the residual"jitter" of the optical jets (Margon 1984). Figure 9.22 is a schematic diagram of thismodel in which the jets emerge from a thick accretion disk with a high temperature
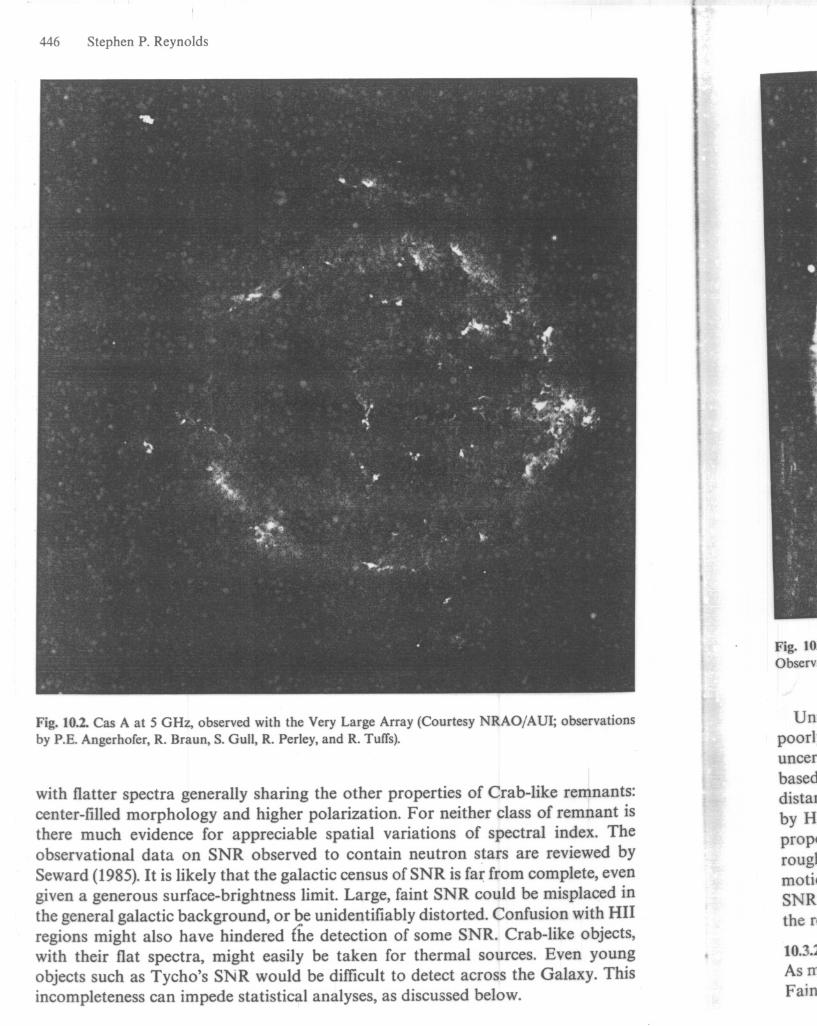
446 Stephen P. Reynolds
Fig. 10.2. Cas A at 5 GHz, observed with the Very Large Array (Courtesy NRAO/AUI; observationsby P.E. Angerhofer, R. Braun, S. Gull, R. Perley, and R. TufTs).
with flatter spectra generally sharing the other properties of Crab-like remnants:center-filled morphology and higher polarization. For neither class of remnant isthere much evidence for appreciable spatial variations of spectral index. Theobservational data on SNR observed to contain neutron stars are reviewed bySeward (1985). It is likely that the galactic census of SNR is far:from complete, evengiven a generous surface-brightness limit. Large, faint SNR could be misplaced inthe general galactic background, or be unidentifiably distorted. Confusion with HIIregions might also have hindered the detection of some SNR. Crab-like objects,with their flat spectra, might easily be taken for thermal sources. Even youngobjects such as Tycho's SNR would be difficult to detect across the Galaxy. Thisincompleteness can impede statistical analyses, as discussed below.
II)It
Fig. 10Observ
Un
poorluncerbaseddistal
by Hproplroug)motilSNRthe r'
1O.3.~
Asrr
Fain

526
>I-enzwawu~e::=>en•...:I:
Yo
Riccardo Giovanelli ~~,1dMartha P. Haynes
oRADIAL DISTANCE
-
( b)
( c )
Yo
--Va
o
(e).,;,,;.;,
\'t'.:'
j.•~,.
. !•..••~.,"',,..
j;i:~;:'
FLUX
(f)
Spimv
fev.
optablsur
elli
the
SUI
12.In
dir
tht
Thth{
a 1
fie
su
in!ax
Fisl1
fa]
ve
cctorn
re
pcm
>I-Ug Vo-w>
I
.. "..,....;";':":; ... :..
."''''ii~;;,., ••..
(d)
-
m
Sl
t)a~S
I
X (ALONG Y=Yl)
Fig. 12.1. Pictorial representation of HI data. Panel (b) simulates the distribution of HI in a galaxiandisk inclined 600 with respect tn the plane normal to the line of sight; the shade intensity is visualizedas being proportional to the HI column density across the disk. Superimposed on the left part of theimage is a family of curves which identifies isovelocity contours. Because this is a symmetric idealizedrepresentation, isovelocity contours on the right part of the galaxies are mirror images of those on theleft. Panel (a) illustrates the azimuthally averaged HI surfac~ density, as a function of distance from thecenter of the galaxy. Panel (c) describes the rotational velocity of the galaxy, as measured along the majoraxis y = Yo; corr~ction of this function by a factor l/sin i,where i is the inclination (600 here) of the disk,
<J
yiIS
gi
(ca'
Sl
d
({
I~b
N 5033 M83o 0
)~.'-'I I
N5055o
-5-'
N7331
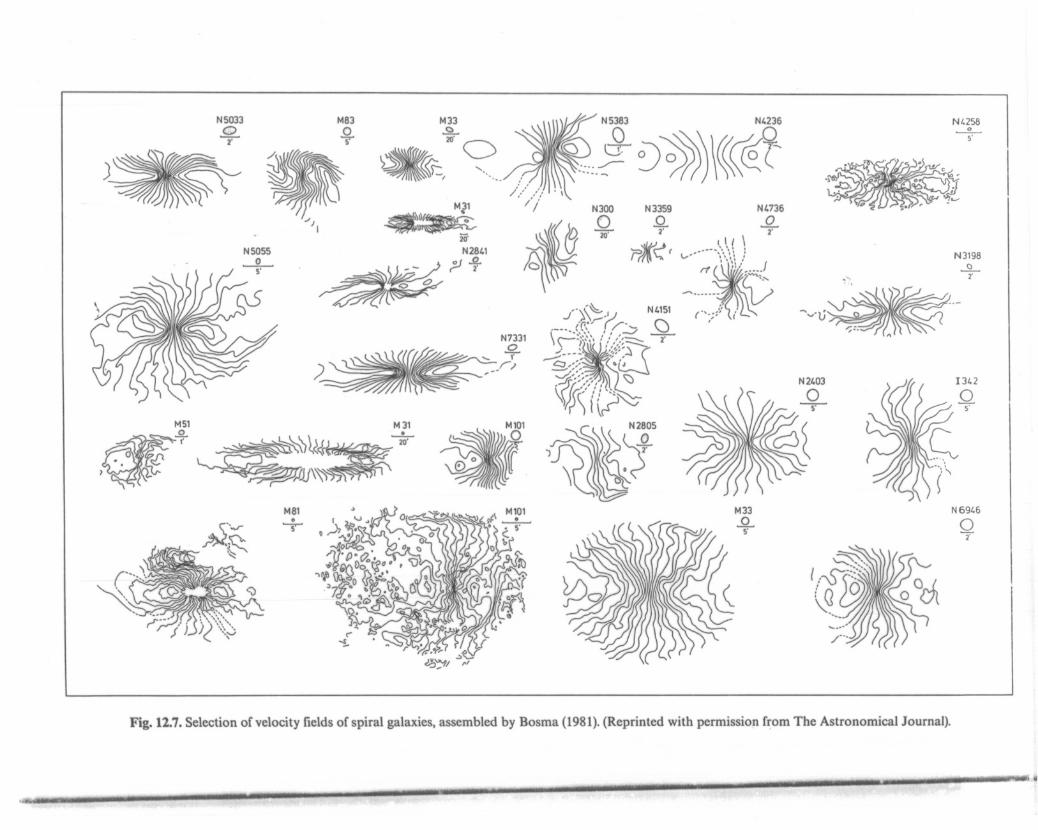
Fig. 12.7. Selection of velocity fields of spiral galaxies, assembled by Bosma (1981). (Reprinted w'th ., fT'I permiSSIOn rom he Astronomical Journal) .
N4258o
-5'
._, .•..---------------------------------- ..-....-.---.
::qL :ucca: 1U UJlIV<1111;11I <111" 'Vldlilia 1 • '.• u,]·n .,
". "".. "
., e".•. " ... "... ".. . .'"..& ••• ".. ~'"••••••••••
• I•• ".-~.. "...." ..... ~ •...••••••••• ••••• • ,=",:1 • ,. "'It "" "'i..:..~.'· - , s... \,." ,.,..
••• ~4f ••• ,,'l· ·~"..•. .\..,,"., ...." I , •
""•• 1 •". ,". I.r" .." .... ,," /'." ."" ." .."""
Hc,cbs-c.~
•
n = 306I-f---i
Tmag1-
2.1
I.-
•
2.3 2.5
log 6~~(0)
2.7
•
2.9
quvel
pnco'
poRl
tYI
a :
sej
Sl~
tu·
etch
reIn
TIbIw
sa
of
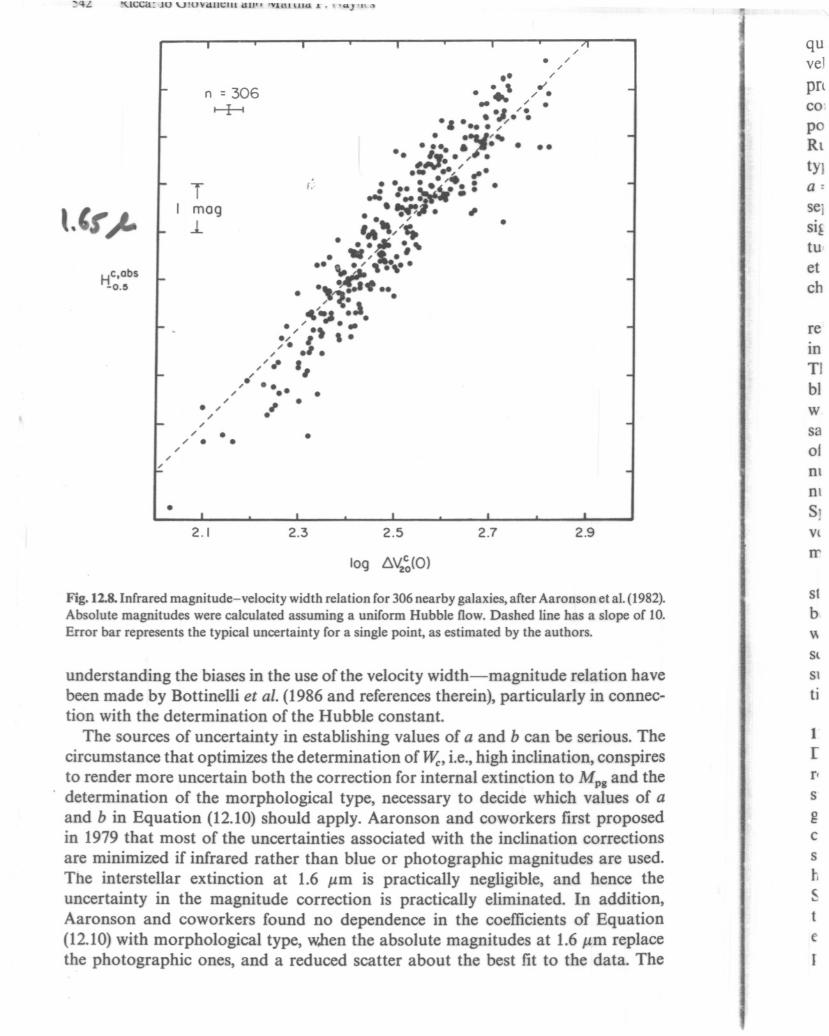
Fig. 12.8. Infrared magnitude-velocity width relation for 306 nearby galaxies, after Aaronson et al. (1982).Absolute magnitudes were calculated assuming a uniform Hubble flow. Dashed line has a slope of 10.Error bar represents the typical uncertainty for a single point, as estimated by the authors.
understanding the biases in the use of the velocity width-magnitude relation havebeen made by Bottinelli et al. (1986 and references therein), particularly in connection with the determination of the Hubble constant.
The sources of uncertainty in establishing values of a and b can be serious. Thecircumstance that optimizes the determination of ~, i.e.,high inclination, conspiresto render more uncertain both the correction for internal extinction to Mpg and thedetermination of the morphological type, necessary to decide which values of aand b in Equation (12.10) should apply. Aaronson and coworkers first proposedin 1979 that most of the uncertainties associated with the inclination correctionsare minimized if infrared rather than blue or photographic magnitudes are used.The interstellar extinction at 1.6 J.lm is practically negligible, and hence theuncertainty in the magnitude correction is practically eliminated. In addition,Aaronson and coworkers found no dependence in the coefficients of Equation(12.10)with morphological type, when the absolute magnitudes at 1.6 J.lm replacethe photographic ones, and a reduced scatter about the best fit to the data. The
sf
bV.
Sl
Sl
ti
1r
s
gcsh
t
e
30F VLA
C ArrayGem
30"'
" c... '
14'00"
~:... ,'" "
OS'18' VLA
C Array18cm17'
30 kpc0>--------<
0 \l")~ 16'0:: :305 15'c:; '"a14'
30"
15'00"
20 kpc
0 •••
04h 3d" 40$ 3S$ 30$ 2S$
Right Ascension, '''150.0)
36$ 34$ 32$ 30$ 28$
Right Ascension 11950.01
IS"
10"
" .
VLA
A ArrayGem
Tapered
2 kpc
o ,
g os"'':;o.Sc:;'"a
))..()o
os· 15'00" ()
.', ""0 ,.
04h 30m 31.5$
OO.S" ·~o,' '.'. "" .. "
q OS· IS'00.0"o\l")
~ S9.S"
o. ." VLA, A Array
2 em ,
"
S9.0·
58.5' 400 pc
58.0' ••
P1•o~
"
o 0 (I50 o. a
04h 30m31.6Ss 31.6Os 31.SS$ 31.50$ 31.4Ss 31.40$
Right Ascension (1950.01
o
-S:>
VLBI
O Dec., 1982Gem
o~~'~.-10 -20 -30 -40
Right AscensionOffset (O~OO1)
o
SuperluminolComoonents
Corel~ D C
-~-0..•'"~<50::
0~ IS0 .Sc:; 10'" a
S0-S-10-IS;
I'~
• •
C ,• •
, 1
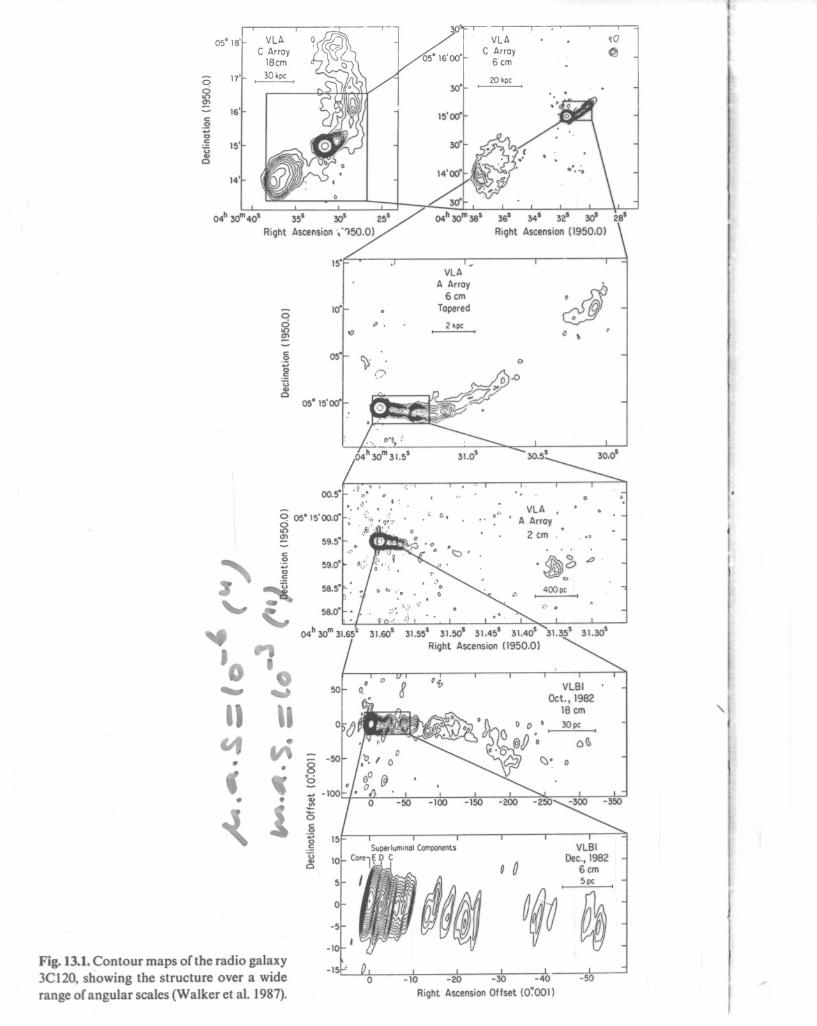
Fig, 13,1. Contour maps of the radio galaxy3C120, showing the structure over a widerange of angular scales (Walker et al. 1987).
586
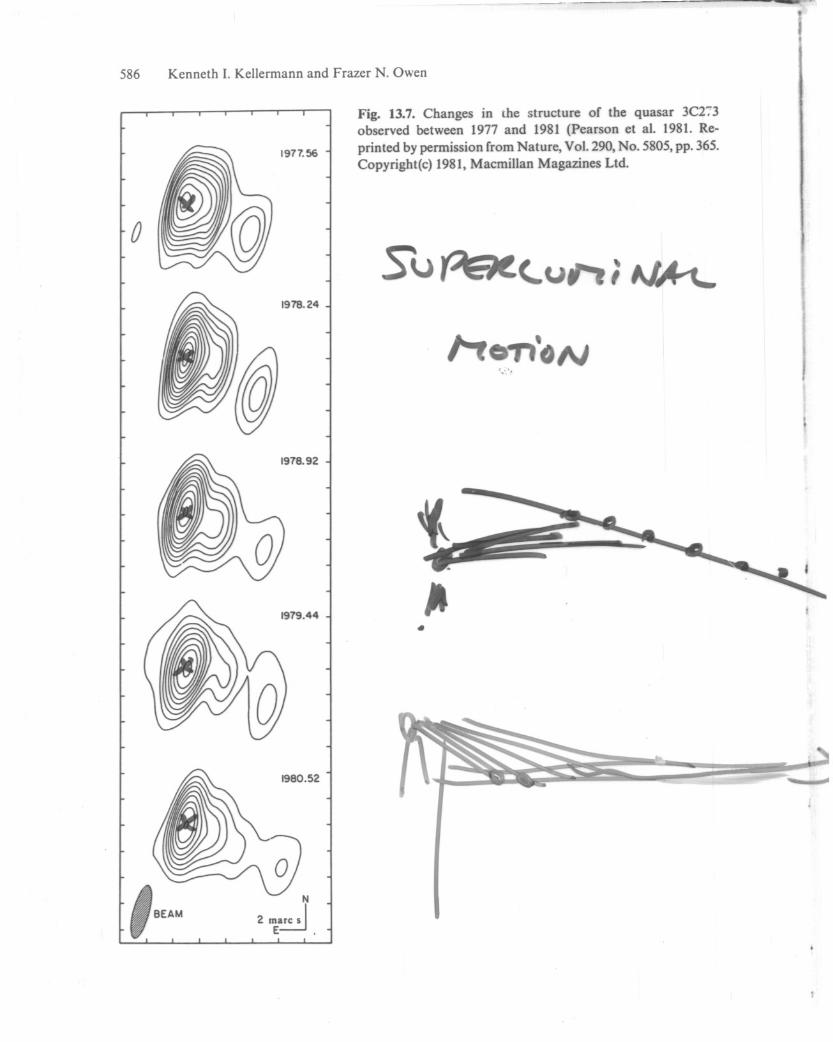
N Owen 3C273d Frazer . he quasarI Kellennann an slruclnre nr t I 1981. Re.
Kenneth .. 137 Changes in ,hed 1981 (Pearson el ~805 pp. 365.F,g. •. ween! 977 an Vol. 290,No. ,ohserved belnnission rro~ Nal;:;:~azines Ltd.printed by pc 981 MacmillanCopyright(c) 1 ,
•
N
2 marc 5 IE
,
10"
17kpc
a
b
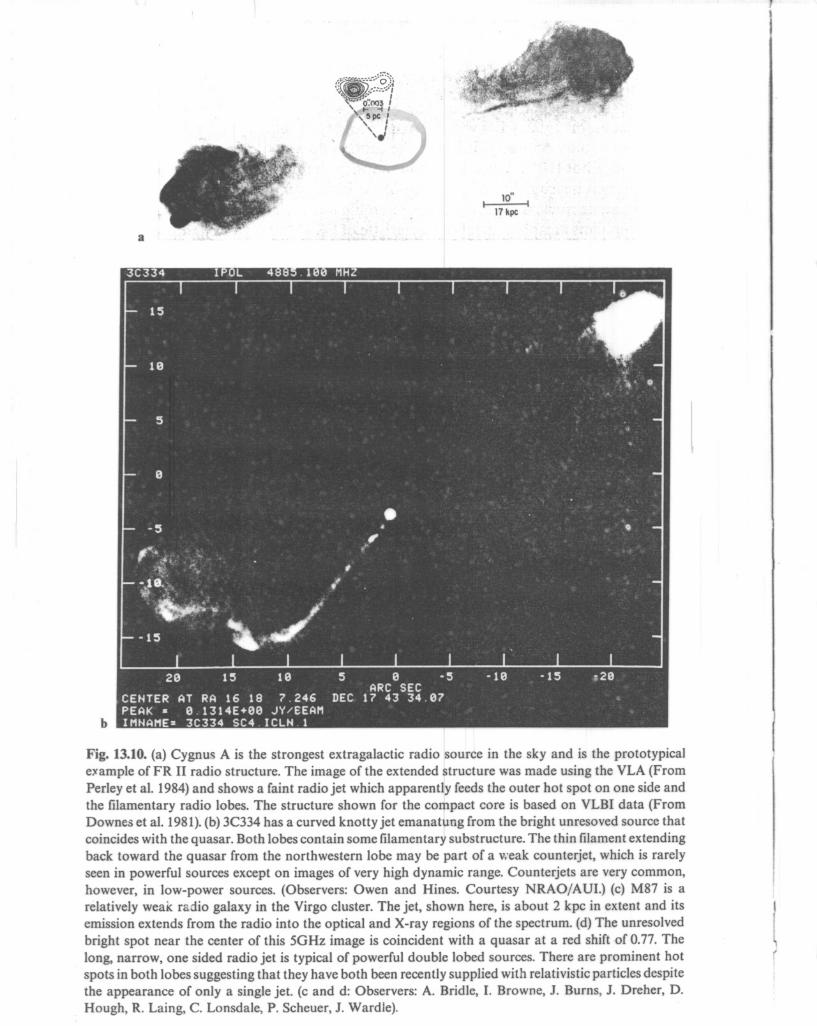
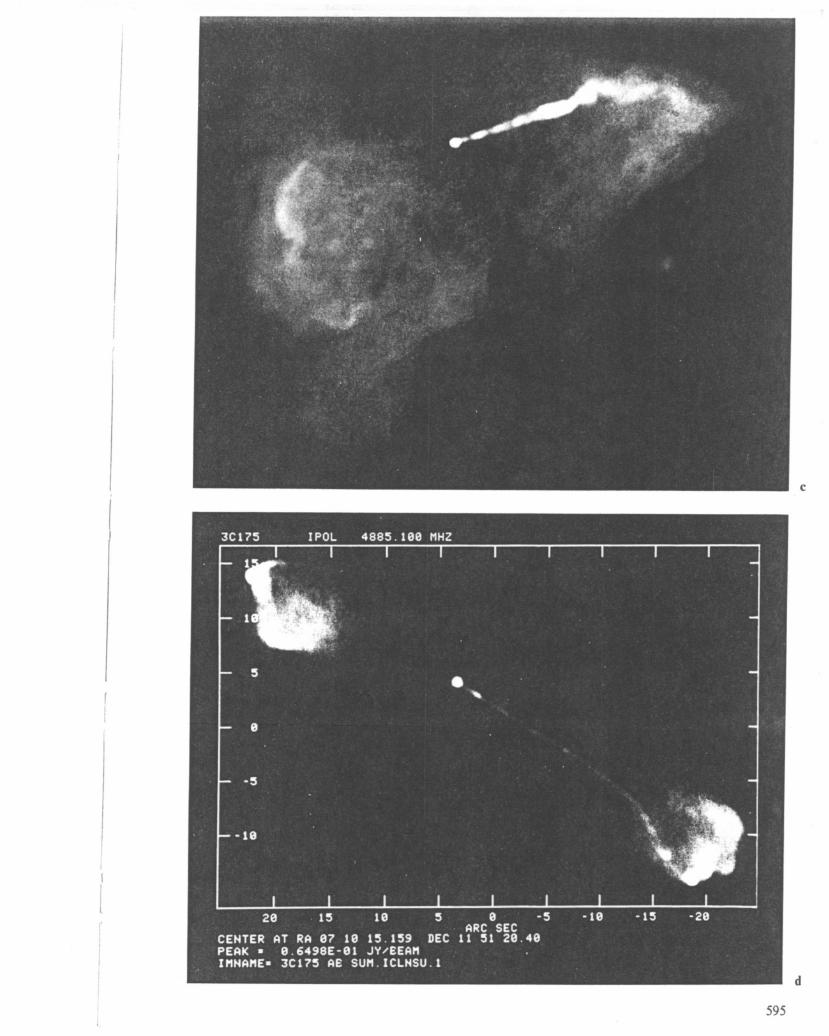
Fig. 13.10. (a) Cygnus A is the strongest extragalactic radio Isource in the sky and is the prototypicaleJfample of FR II radio structure. The image of the extended ~tructure was made using the VLA (FromPerley et aI. 1984) and shows a faint radio jet which apparendy feeds the outer hot spot on one side andthe filamentary radio lobes. The structure shown for the corhpact core is based on VLBI data (FromDownes et aI. 1981). (b) 3C334 has a curved knotty jet emanathng from the bright unresoved source thatcoincides with the quasar. Both lobes contain some filamentary substructure. The thin filament extendingback toward the quasar from the northwestern lobe may be part of a weak counterjet, which is rarelyseen in powerful sources except on images of very high dynamic range. Counterjets are very common,however, in low-power sources. (Observers: Owen and Hines. Courtesy NRAOjAUI.) (c) M87 is ardatively weaK radio galaxy in the Virgo cluster. The jet, shown here, is about 2 kpc in extent and itsemission extends from the radio into the optical and X-ray regions of the spectrum. (d) The unresolvedbright spot near the center of this 5GHz image is coincident with a quasar at a red shift of 0.77. Thelong, narrow, one sided radio jet is typical of powerful double lobed sources. There are prominent hotspots in both lobes suggesting that they have both been recently supplied with relativistic particles despitethe appearance of only a single jet. (c and d: Observers: A. Bridle, I. Browne, J. Burns, J. Dreher, D.Hough, R. Laing, C. Lonsdale, P. Scheuer, J. Wardle).
p
U.-.J0
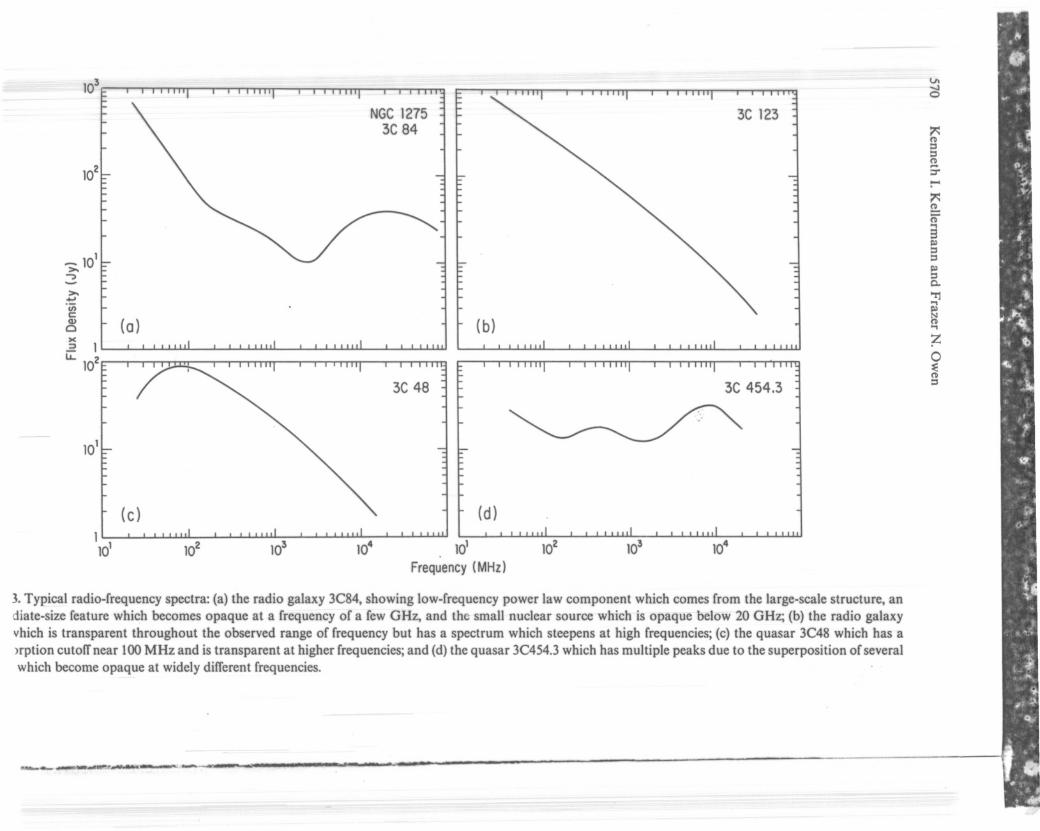
NGC 1275
3C 1233C 84
~0:::J:::J0....::r:-~!!.0'..,3~_101
:::J
:::J>.~
"'?:::J
0..>.'T].•... 'in..,
~c: NQ) (0) (b)
00 ..,><
;Z.21
I.L. 1020
~03C 483C 454.3
:::J
(d)
101
Frequency (MHz)
3. Typical radio-frequency spectra: (a) the radio galaxy 3C84, showing low-frequency power law component which comes from the large-scale structure, andiate-size feature which becomes opaque at a frequency of a few GHz, and the small nuclear source which is opaque below 20 GHz; (b) the radio galaxyvhich is transparent throughout the observed range of frequency but has a spectrum which steepens at high frequencies; (c) the quasar 3C48 which has aJrption cutolTnear 100 MHz and is transparent at higher frequencies; and (d) the quasar 3C454.3 which has multiple peaks due to the superposition of severalwhich become opaque at widely dilTerent frequencies.

Elec1ron $coHering Regioo
0.0_ ,_.".,' »1..... - ' .,. .. --~...... /:----o •••......, . ' . 'I " '.o •
• • 0
, ••• - ,0 OJ . 0
.- ~~oo .o 0 0
\)moecuk:J r ~ ()cbuds~
(:) ~0@o . ,.
17 •+10 em -1- .' .
018 em -IIOZOcm
'0o
Mci)e\..1)i~F.At:N 2>£P. ON
"'€-"'N4 r AIJ~
Fig. 31. A unified model for Seyfert galaxies. The central source and the BIby a thick torus of molecular gas. The Seyfert 1 galaxies are those objects 4
pole direction. Seyfert 2 galaxies are those sources whose inner parts can on Ireflected radiation
-Uev' '::'·C.4-riONot-S£"tl.vCtI. s~es
SE~F.~Type1
oet QSOScattere r
~
RAi)i
~ c:tAV' V~(-.J"~ AtillooaSC,u C)
t'Y ~,-r ~fI:
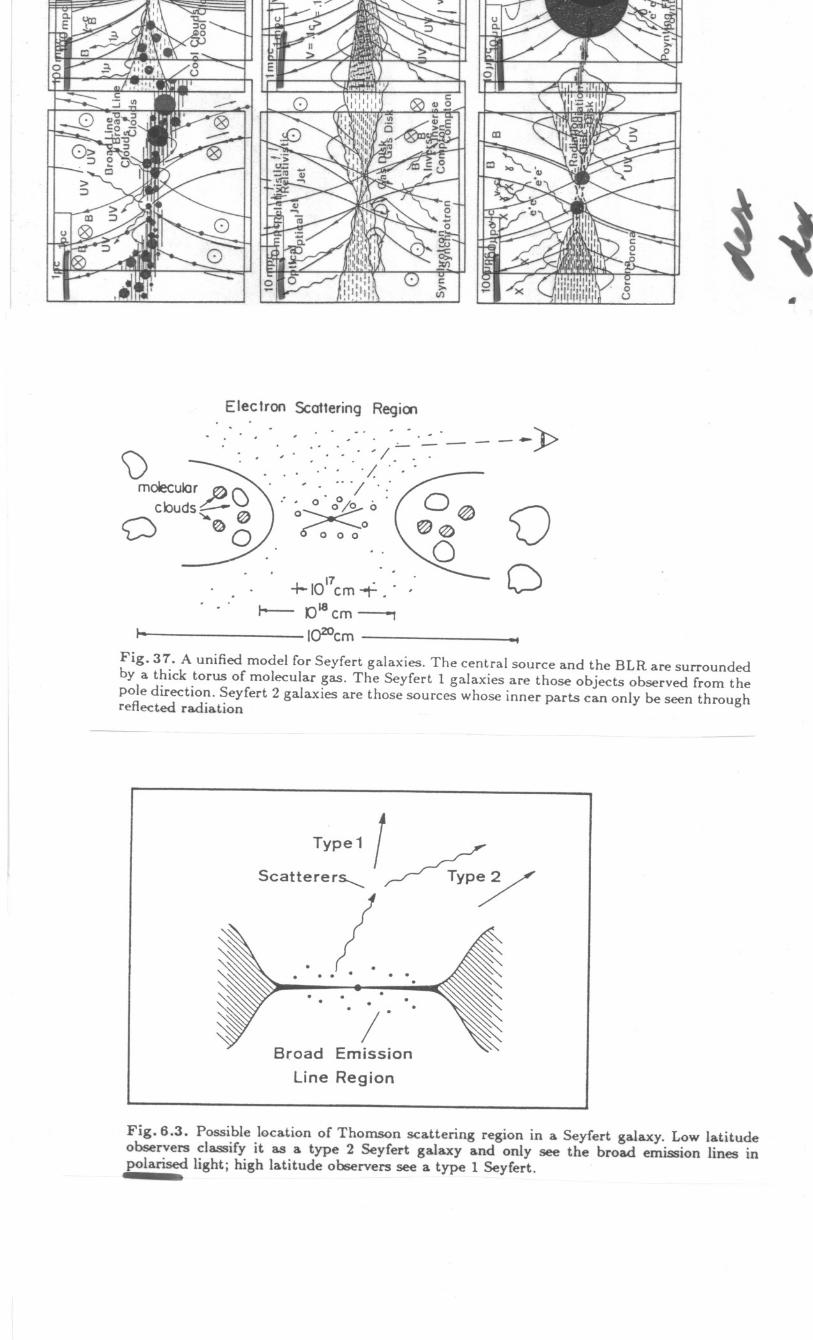
Electron Scattering Regicn
L 17 ",- 10 em -1- .
I--- ()18 em ---,
IOZOcm -------_ •.•
.:-- -'. ' ~/.; .., 'j .:
."~~oo·o 0 0
- --»
vo
Fig. 37. A unified model for Seyfert galaxies. The central source and the BLR are surroundedby a thick torus of molecular gas. The Seyfert 1 galaxies are those objects observed from thepole direction. Seyfert 2 galaxies are those sources whose inner parts can only be seen throughreflected radiation
Type1 / ~Scatterer,,----- ~ TYPYI"" "
I"Broad Emission
Line Region
Fig.6.3. Possible location of Thomson scattering region in a Seyfert galaxy, Low latitudeobservers classify it as a type 2 Seyfert galaxy and only see the broad emission lines inpolarised light; high latitude observers see a type 1 Seyfert.
.Radio sources and galactic nuclei
. - . --~ ~ ,...,~-~&.~-or.......-:?" ~~ -_ '-~f-,..-.:~..:..~._-~:--I ~~_. $~"",
I
-
85
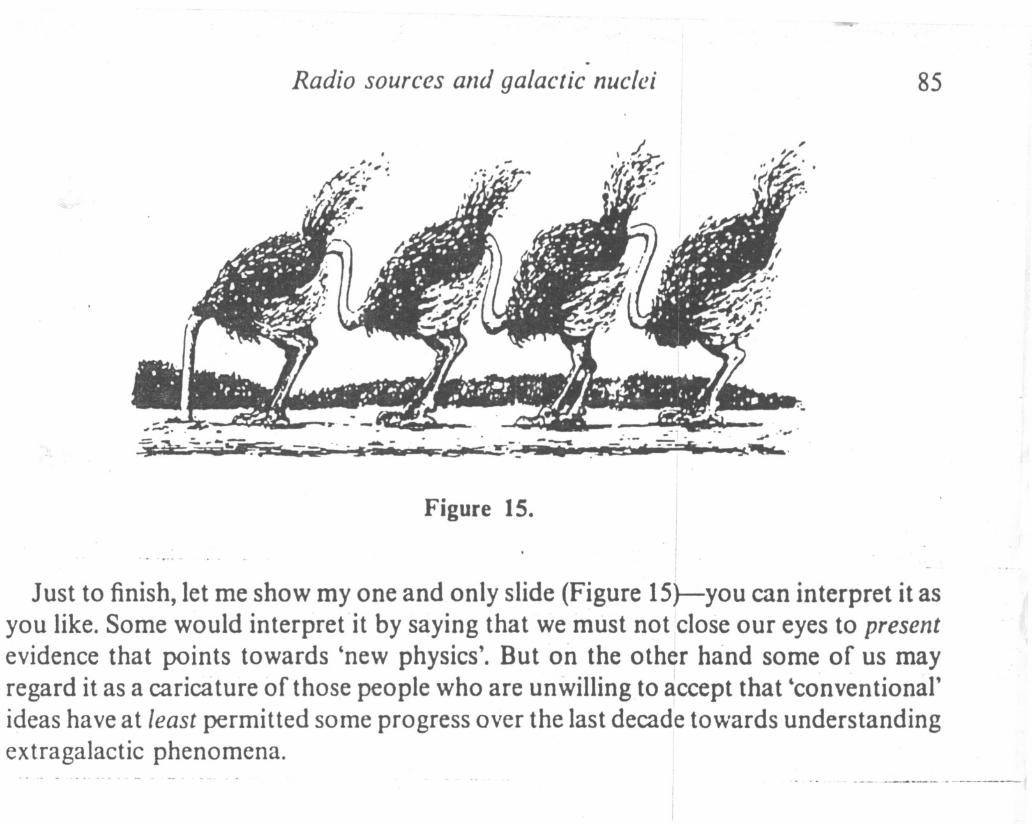
Figure 15. iII
. II
!
Just to finish, let me show my one and only slide (Figure lS)-you can interpret it asyou like. Some would interprefit by saying that we must nofclose our eyes to present
evidence that points towards 'new physics'. But on the oth~r hand some. of us mayregard it as a caricature of those people who are unwilling to accept that 'conventional'
ideas have at least permitted some progress over the last decad,e towards understandingextragalactic phenomena ..