Embed Size (px)
Citation preview
CDK1 substitutes for mTOR kinase to activate mitoticcap-dependent protein translationMasahiro Shuda, Celestino Velásquez, Erdong Cheng, Daniel G. Cordek, Hyun Jin Kwun, Yuan Chang1,and Patrick S. Moore1
Cancer Virology Program, University of Pittsburgh Cancer Institute, Pittsburgh, PA 15213
This contribution is part of the special series of Inaugural Articles by members of the National Academy of Sciences elected in 2012.
Contributed by Patrick S. Moore, March 23, 2015 (sent for review February 13, 2015)
Mitosis is commonly thought to be associated with reduced cap-dependent protein translation. Here we show an alternative controlmechanism for maintaining cap-dependent translation during mitosisrevealed by a viral oncoprotein, Merkel cell polyomavirus small T(MCV sT). We find MCV sT to be a promiscuous E3 ligase inhibitortargeting the anaphase-promoting complex, which increases cellmitogenesis. MCV sT binds through its Large T stabilization domainregion to cell division cycle protein 20 (Cdc20) and, possibly, cdc20homolog 1 (Cdh1) E3 ligase adapters. This activates cyclin-dependentkinase 1/cyclin B1 (CDK1/CYCB1) to directly hyperphosphorylateeukaryotic initiation factor 4E (eIF4E)-binding protein (4E-BP1) at au-thentic sites, generating a mitosis-specific, mechanistic target of rapa-mycin (mTOR) inhibitor-resistant δ phospho-isoform not present inG1-arrested cells. Recombinant 4E-BP1 inhibits capped mRNA reticu-locyte translation, which is partially reversed by CDK1/CYCB1phosphorylation of 4E-BP1. eIF4G binding to the eIF4E–m7GTP capcomplex is resistant to mTOR inhibition during mitosis but sensitiveduring interphase. Flow cytometry, with and without sT, reveals anorthogonal pH3S10+ mitotic cell population having higher inactivep4E-BP1T37/T46+ saturation levels than pH3S10– interphase cells. Usinga Click-iT flow cytometric assay to directly measure mitotic proteinsynthesis, we find that most new protein synthesis during mitosis iscap-dependent, a result confirmed using the eIF4E/4G inhibitor drug4E1RCat. For most cell lines tested, cap-dependent translation levelswere generally similar between mitotic and interphase cells, and themajority of new mitotic protein synthesis was cap-dependent. Thesefindings suggest that mitotic cap-dependent translation is generallysustained during mitosis by CDK1 phosphorylation of 4E-BP1 evenunder conditions of reduced mTOR signaling.
Merkel cell | small T | 4E-BP1 | cyclin-dependent kinase 1 | mitosis
Eukaryotic initiation factor 4E (eIF4E)-binding protein (4E-BP1) is a principal target for mechanistic target of rapamycin
complex 1 (mTORC1) (1–3). mTOR regulates a variety of meta-bolic signaling pathways related to ribosomal biosynthesis andautophagy that contribute to cancer cell survival (1, 3–6). Increasingevidence indicates that direct mTORC1 phosphorylation of 4E-BP1may be the key event in mTOR-associated tumorigenesis (2). In theabsence of activated mTOR, hypophosphorylated 4E-BP1 seques-ters eIF4E to prevent assembly of eIF4F complex components ontocapped mRNA, inhibiting cap-dependent translation. When4E-BP1 is phosphorylated by mTOR (7), first at critical primingthreonine (T) 37 and T46 residues and then at other sites, 4E-BP1 isinactivated and releases eIF4E to allow initiation of cap-dependenttranslation (8). Other non-mTOR kinases, including cyclin-dependent kinase 1 (CDK1), have been shown to be able tophosphorylate 4E-BP1 (9–12) but have not been extensivelyexamined in vivo for their effects on 4E-BP1–regulated cap-dependent translation.Protein synthesis has been described to decrease during mi-
tosis relative to interphase in reports dating back to the 1960s(13, 14). There are two issues, however, with this conclusion:(i) Mitotic cells represent less than 1% of the total cell
population in bulk culture, and even under stringent conditions,high levels of interphase cell contamination can occur. (ii) Manystudies of mitotic cap-dependent translation rely on cell cyclesynchronization studies with microtubule inhibitors (e.g., noco-dazole), which are also mitotic translation inhibitors (15). Underthese conditions, comparisons of interphase and mitotic trans-lation can be imprecise. Single-cell measurements, such as flowcytometry, can potentially overcome these concerns. Additionally,a highly hyperphosphorylated 4E-BP1 isoform called δ-4E-BP1 ispresent in mitotic cells (10, 16). This hyperphosphorylated isoformis predicted to promote rather than inhibit cap-dependent proteintranslation and is therefore inconsistent with the standard model.Our studies on Merkel cell polyomavirus (MCV) provide in-
sights into these issues. MCV is a small double-stranded DNAvirus discovered in 2008 by our laboratory that causes most casesof the human skin cancer Merkel cell carcinoma (MCC) (17) (forreview, see refs. 18–20). The 19-kDa MCV small T (sT) antigenis a transforming oncoprotein required for MCC cell growth(21, 22). A region of the sT protein spanning amino acid residues91–95, called the Large T stabilization domain (LSD), promotesδ-4E-BP1 hyperphosphorylation (23), rodent cell transformation(24), and fibroblast proliferation in a mouse transgenic model(21, 25). Expression of the phosphorylation-defective, dominant-positive 4E-BP1 (26) with alanine substitution mutations atpriming T37/T46 (4E-BP1T37A/T46A) reverses sT-induced rodentfibroblast transformation, suggesting a direct link between 4E-BP1 phosphorylation status and sT-induced transformation (21).
Significance
Cancer cell proliferation is highly dependent on cap-dependentprotein synthesis, which is generally assumed to be inhibitedduring mitosis. Using a viral oncoprotein that enforces mitosis,we show that CDK1 substitutes for mTOR interphase functionsto phosphorylate eukaryotic initiation factor 4E-binding pro-tein (4E-BP1) to a mitosis-specific δ isoform. Flow cytometricassays reveal that mitotic cells have high levels of inactivated4E-BP1 and do not generally show specific loss of cap-depen-dent translation compared with interphase cells. This appears tobe due to cyclin-dependent kinase 1 (CDK1) activity during mi-tosis. Mitotic cells typically represent less than 1% of all cells inbulk culture, and mitosis-arresting drugs, such as nocodazole, candirectly inhibit mitotic protein translation, potentially explainingdifferences between our findings and previous studies showingreduced cap-dependent translation during mitosis.
Author contributions: M.S., C.V., E.C., Y.C., and P.S.M. designed research; M.S., C.V., E.C.,D.G.C., and H.J.K. performed research; M.S., C.V., and H.J.K. contributed new reagents/analytic tools; M.S., C.V., E.C., D.G.C., H.J.K., Y.C., and P.S.M. analyzed data; and M.S., C.V.,E.C., H.J.K., Y.C., and P.S.M. wrote the paper.
The authors declare no conflict of interest.
Freely available online through the PNAS open access option.
See QnAs on page 5862.1To whom correspondence may be addressed. Email: [email protected] or [email protected].
This article contains supporting information online at www.pnas.org/lookup/suppl/doi:10.1073/pnas.1505787112/-/DCSupplemental.
www.pnas.org/cgi/doi/10.1073/pnas.1505787112 PNAS | May 12, 2015 | vol. 112 | no. 19 | 5875–5882
CELL
BIOLO
GY
INAUGURA
LART
ICLE
Surprisingly, sT-induced δ-4E-BP1 hyperphosphorylation is notdependent on mTOR activity (21). The sT LSD region is knownto bind the Fbw7 E3 ligase to promote cell proliferation, butFbw7 targeting is not sufficient to explain either cell trans-formation or 4E-BP1 hyperphosphorylation (24).We show here that MCV sT, through its LSD domain, also
promotes mitogenesis and 4E-BP1 hyperphosphorylation by func-tioning as a promiscuous E3 ligase inhibitor that targets cellularanaphase-promoting complex/cyclosome (APC/C) E3 ligase activity.During sT-induced mitosis, sT-induced CDK1/CYCB1 rather thanmTOR directly phosphorylates 4E-BP1 to the mitosis-specific δisoform. Using a flow cytometry-based method to directly measuremitotic cap-dependent protein synthesis for the first time, to ourknowledge, we do not detect a general shift from cap-dependent tocap-independent protein translation in mitotic cells compared withinterphase cells. Mitotic cells actually show higher saturation levelsof p4E-BP1T37/T46+, consistent with 4E-BP1 inactivation, than in-terphase cells. Consistent with this, and in contrast to previousstudies, we find that δ-4E-BP1–positive mitotic cells show highlevels of cap-dependent protein translation that is reduced by thecap translation inhibitor 4E1RCat. When accentuated or sustained,high levels of mitotic cap-dependent protein translation may play arole in cancer cell transformation and contribute to mTOR in-hibitor resistance in subsets of cancers.
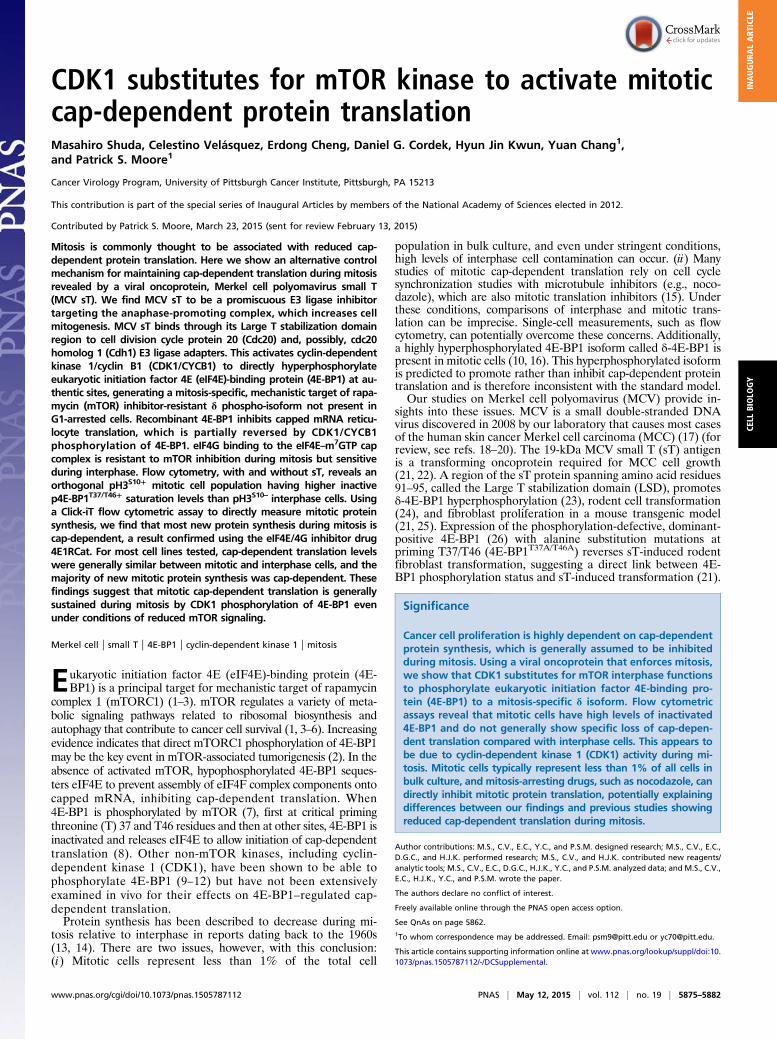
ResultsMCV sT Increases Mitogenesis by Targeting the Cellular APC E3 Ligase.To search for factors contributing to MCV sT-induced trans-formation, the viral oncoprotein was expressed in hTERT-immortalized primary BJ-tert (BJ-T) human foreskin fibroblasts.These cells displayed a rounded phenotype in culture with in-creased phospho-histone H3 serine 10 (pH3S10) phosphoryla-tion, characteristic for mitosis (Fig. 1A). Increased pH3S10 andincreased expression of mitotic markers [including cyclin B1(CYCB1) and phospho-aurora kinase B (pAURKB)] were alsoobserved in 293 cells expressing MCV sT (Fig. S1). Immuno-precipitation of sT revealed an in vivo complex with the APC/Csubstrate recognition subunit cell division cycle protein 20(Cdc20) that was dependent on an intact LSD (Fig. 1B). MCV sTalso interacted with another APC/C substrate recognition sub-unit, cdc20 homolog 1 (Cdh1), but substantial Cdh1 bindingoccurred with sTmLSD having alanine substitutions at residues91–95, suggesting that sT may bind Cdh1 at other sites in addi-tion to the LSD. In line with these results, known APC/C E3targets, including AURKA and AURKB, Skp2, polo-like kinase1 (Plk1), and CYCA2, showed markedly reduced turnover in thepresence of sT on cycloheximide (CHX) immunoblotting (Fig.1C). These APC/C E3 targets retained rapid turnover in thepresence of empty vector or sTmLSD expression. CYCD1, whichis not directly regulated by APC/C (27), was unaffected by MCVsT or sTmLSD expression. Similarly, MCV sT expression stabi-lized FLAG-tagged AURKA and endogenous CYCB1, but notCYCD1, after nocodazole release of 293 cells, whereas MCVsTmLSD expression did not (Fig. S2).
MCV sT Induces mTOR-Independent δ-4E-BP1 Phosphorylation. Wenext examined the role of MCV sT in 4E-BP1 hyperphos-phorylation. 4E-BP1 hyperphosphorylation isoforms are namedα through δ according to ascending molecular mass (Fig. 2A,Left) (28). Most notable was the appearance of the highestmolecular mass form, δ, containing phosphorylation marks at
A sT sTmLSDEmpty pH
3S10
PI (DNA content)
Cou
nts
4N 2N 4N 2N 4N 2N
0.1% 0.3% 1.8%
B
myc-Cdh1
IP: myc
+ +
Input (5%)
- - + + + - - +
myc-Cdh1
sT
IB:
- - HA-Cdc20
IP: HA
+ + Input (5%)
- + + + - +
HA-Cdc20*sT
IB:
C
CHX (h)
Tubulin
Cdc20
sTmLSD
Skp2 Plk1
Claspin
CYCD1
CYCA2
sT
AP
C/C
targ
ets
AURKAAURKB
7.5 12 10
Empty
Mar
ker
0 2 4 7.5 12 10 0 2 4 7.5 12 10 0 2 4
Fig. 1. MCV sT promotes mitosis by targeting APC/C E3-ubiquitin ligases.(A) MCV sT induces cellular mitogenesis. BJ-T cells stably transduced withMCV sT have increased mitotic rounding and a 6–18-fold increase in pH3S10+
mitotic cells compared with empty vector or sTmLSD transduced cells. (B) MCVsT interacts with APC/C E3 ligase substrate recognition subunit Cdc20 andCdh1 proteins. HA-tagged Cdc20 or myc-tagged Cdh1 expression plasmidswere cotransfected with MCV sT, MCV sTmLSD, or SV40 sT expression plasmidsinto 293 cells and immunoprecipitated 48 h later with anti-HA or anti-mycantibodies, followed by immunoblotting using mixed anti-MCV sT (CM8E6)and anti-SV40 sT (PAb419) antibodies. Cdc20 interaction with MCV sT wasnearly eliminated in the sTmLSD mutant protein, whereas partial interactionwas retained between MCV sTmLSD and myc-Cdh1 proteins. Weak interactionbetween SV40 sT and myc-Cdh1 only was detected. Asterisk indicates IgG
heavy chain. (C) APC/C target proteins (AURKA/B, Cdc20, Skp2, Plk1, CYCA2,and claspin) are stabilized by MCV sT expression. BJ-T cells were treated withCHX (100 μg/mL) to inhibit new protein synthesis and harvested at the in-dicated time points. The half-lives of proteins regulated by APC/C are ex-tended by expression of MCV sT but not empty vector or MCV sTmLSD
controls. CYCD1 is not directly regulated by Cdh1, and its half-life was un-changed by MCV sT expression. A representative α-tubulin loading control isshown. Representative results are shown from three independent experiments.
5876 | www.pnas.org/cgi/doi/10.1073/pnas.1505787112 Shuda et al.
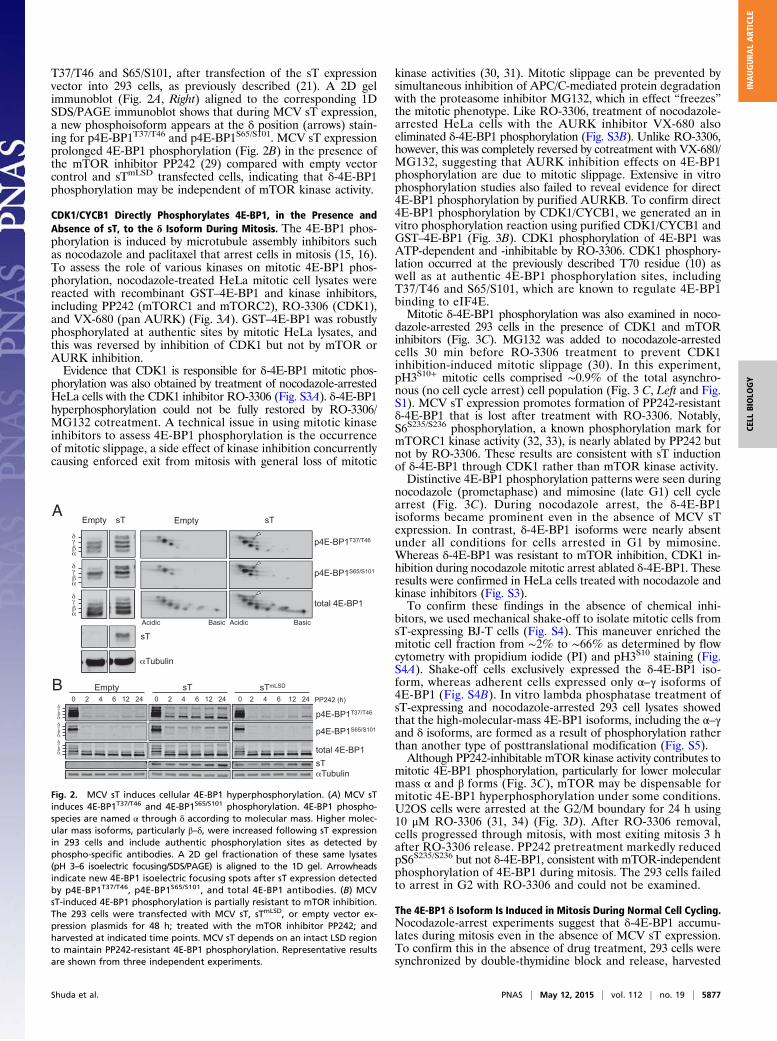
T37/T46 and S65/S101, after transfection of the sT expressionvector into 293 cells, as previously described (21). A 2D gelimmunoblot (Fig. 2A, Right) aligned to the corresponding 1DSDS/PAGE immunoblot shows that during MCV sT expression,a new phosphoisoform appears at the δ position (arrows) stain-ing for p4E-BP1T37/T46 and p4E-BP1S65/S101. MCV sT expressionprolonged 4E-BP1 phosphorylation (Fig. 2B) in the presence ofthe mTOR inhibitor PP242 (29) compared with empty vectorcontrol and sTmLSD transfected cells, indicating that δ-4E-BP1phosphorylation may be independent of mTOR kinase activity.
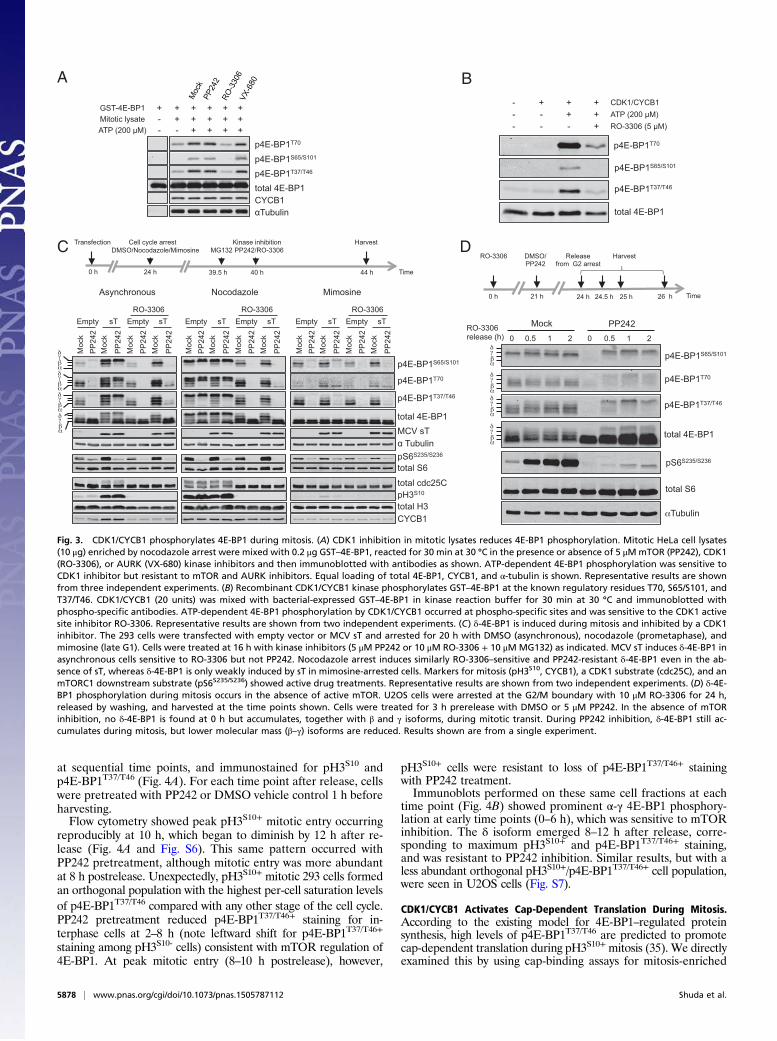
CDK1/CYCB1 Directly Phosphorylates 4E-BP1, in the Presence andAbsence of sT, to the δ Isoform During Mitosis. The 4E-BP1 phos-phorylation is induced by microtubule assembly inhibitors suchas nocodazole and paclitaxel that arrest cells in mitosis (15, 16).To assess the role of various kinases on mitotic 4E-BP1 phos-phorylation, nocodazole-treated HeLa mitotic cell lysates werereacted with recombinant GST–4E-BP1 and kinase inhibitors,including PP242 (mTORC1 and mTORC2), RO-3306 (CDK1),and VX-680 (pan AURK) (Fig. 3A). GST–4E-BP1 was robustlyphosphorylated at authentic sites by mitotic HeLa lysates, andthis was reversed by inhibition of CDK1 but not by mTOR orAURK inhibition.Evidence that CDK1 is responsible for δ-4E-BP1 mitotic phos-
phorylation was also obtained by treatment of nocodazole-arrestedHeLa cells with the CDK1 inhibitor RO-3306 (Fig. S3A). δ-4E-BP1hyperphosphorylation could not be fully restored by RO-3306/MG132 cotreatment. A technical issue in using mitotic kinaseinhibitors to assess 4E-BP1 phosphorylation is the occurrenceof mitotic slippage, a side effect of kinase inhibition concurrentlycausing enforced exit from mitosis with general loss of mitotic
kinase activities (30, 31). Mitotic slippage can be prevented bysimultaneous inhibition of APC/C-mediated protein degradationwith the proteasome inhibitor MG132, which in effect “freezes”the mitotic phenotype. Like RO-3306, treatment of nocodazole-arrested HeLa cells with the AURK inhibitor VX-680 alsoeliminated δ-4E-BP1 phosphorylation (Fig. S3B). Unlike RO-3306,however, this was completely reversed by cotreatment with VX-680/MG132, suggesting that AURK inhibition effects on 4E-BP1phosphorylation are due to mitotic slippage. Extensive in vitrophosphorylation studies also failed to reveal evidence for direct4E-BP1 phosphorylation by purified AURKB. To confirm direct4E-BP1 phosphorylation by CDK1/CYCB1, we generated an invitro phosphorylation reaction using purified CDK1/CYCB1 andGST–4E-BP1 (Fig. 3B). CDK1 phosphorylation of 4E-BP1 wasATP-dependent and -inhibitable by RO-3306. CDK1 phosphory-lation occurred at the previously described T70 residue (10) aswell as at authentic 4E-BP1 phosphorylation sites, includingT37/T46 and S65/S101, which are known to regulate 4E-BP1binding to eIF4E.Mitotic δ-4E-BP1 phosphorylation was also examined in noco-
dazole-arrested 293 cells in the presence of CDK1 and mTORinhibitors (Fig. 3C). MG132 was added to nocodazole-arrestedcells 30 min before RO-3306 treatment to prevent CDK1inhibition-induced mitotic slippage (30). In this experiment,pH3S10+ mitotic cells comprised ∼0.9% of the total asynchro-nous (no cell cycle arrest) cell population (Fig. 3 C, Left and Fig.S1). MCV sT expression promotes formation of PP242-resistantδ-4E-BP1 that is lost after treatment with RO-3306. Notably,S6S235/S236 phosphorylation, a known phosphorylation mark formTORC1 kinase activity (32, 33), is nearly ablated by PP242 butnot by RO-3306. These results are consistent with sT inductionof δ-4E-BP1 through CDK1 rather than mTOR kinase activity.Distinctive 4E-BP1 phosphorylation patterns were seen during
nocodazole (prometaphase) and mimosine (late G1) cell cyclearrest (Fig. 3C). During nocodazole arrest, the δ-4E-BP1isoforms became prominent even in the absence of MCV sTexpression. In contrast, δ-4E-BP1 isoforms were nearly absentunder all conditions for cells arrested in G1 by mimosine.Whereas δ-4E-BP1 was resistant to mTOR inhibition, CDK1 in-hibition during nocodazole mitotic arrest ablated δ-4E-BP1. Theseresults were confirmed in HeLa cells treated with nocodazole andkinase inhibitors (Fig. S3).To confirm these findings in the absence of chemical inhi-
bitors, we used mechanical shake-off to isolate mitotic cells fromsT-expressing BJ-T cells (Fig. S4). This maneuver enriched themitotic cell fraction from ∼2% to ∼66% as determined by flowcytometry with propidium iodide (PI) and pH3S10 staining (Fig.S4A). Shake-off cells exclusively expressed the δ-4E-BP1 iso-form, whereas adherent cells expressed only α–γ isoforms of4E-BP1 (Fig. S4B). In vitro lambda phosphatase treatment ofsT-expressing and nocodazole-arrested 293 cell lysates showedthat the high-molecular-mass 4E-BP1 isoforms, including the α–γand δ isoforms, are formed as a result of phosphorylation ratherthan another type of posttranslational modification (Fig. S5).Although PP242-inhibitable mTOR kinase activity contributes to
mitotic 4E-BP1 phosphorylation, particularly for lower molecularmass α and β forms (Fig. 3C), mTOR may be dispensable formitotic 4E-BP1 hyperphosphorylation under some conditions.U2OS cells were arrested at the G2/M boundary for 24 h using10 μM RO-3306 (31, 34) (Fig. 3D). After RO-3306 removal,cells progressed through mitosis, with most exiting mitosis 3 hafter RO-3306 release. PP242 pretreatment markedly reducedpS6S235/S236 but not δ-4E-BP1, consistent with mTOR-independentphosphorylation of 4E-BP1 during mitosis. The 293 cells failedto arrest in G2 with RO-3306 and could not be examined.
The 4E-BP1 δ Isoform Is Induced in Mitosis During Normal Cell Cycling.Nocodazole-arrest experiments suggest that δ-4E-BP1 accumu-lates during mitosis even in the absence of MCV sT expression.To confirm this in the absence of drug treatment, 293 cells weresynchronized by double-thymidine block and release, harvested
A
p4E-BP1S65/S101
total 4E-BP1
p4E-BP1T37/T46
Empty sT
Tubulin
sT
Empty sT
Basic Acidic Acidic Basic
B
total 4E-BP1
0 2 4 6 12 24
Tubulin
p4E-BP1T37/T46
sT
p4E-BP1S65/S101
PP242 (h)
Empty sT sTmLSD
0 2 4 6 12 24 0 2 4 6 12 24
Fig. 2. MCV sT induces cellular 4E-BP1 hyperphosphorylation. (A) MCV sTinduces 4E-BP1T37/T46 and 4E-BP1S65/S101 phosphorylation. 4E-BP1 phospho-species are named α through δ according to molecular mass. Higher molec-ular mass isoforms, particularly β–δ, were increased following sT expressionin 293 cells and include authentic phosphorylation sites as detected byphospho-specific antibodies. A 2D gel fractionation of these same lysates(pH 3–6 isoelectric focusing/SDS/PAGE) is aligned to the 1D gel. Arrowheadsindicate new 4E-BP1 isoelectric focusing spots after sT expression detectedby p4E-BP1T37/T46, p4E-BP1S65/S101, and total 4E-BP1 antibodies. (B) MCVsT-induced 4E-BP1 phosphorylation is partially resistant to mTOR inhibition.The 293 cells were transfected with MCV sT, sTmLSD, or empty vector ex-pression plasmids for 48 h; treated with the mTOR inhibitor PP242; andharvested at indicated time points. MCV sT depends on an intact LSD regionto maintain PP242-resistant 4E-BP1 phosphorylation. Representative resultsare shown from three independent experiments.
Shuda et al. PNAS | May 12, 2015 | vol. 112 | no. 19 | 5877
CELL
BIOLO
GY
INAUGURA
LART
ICLE
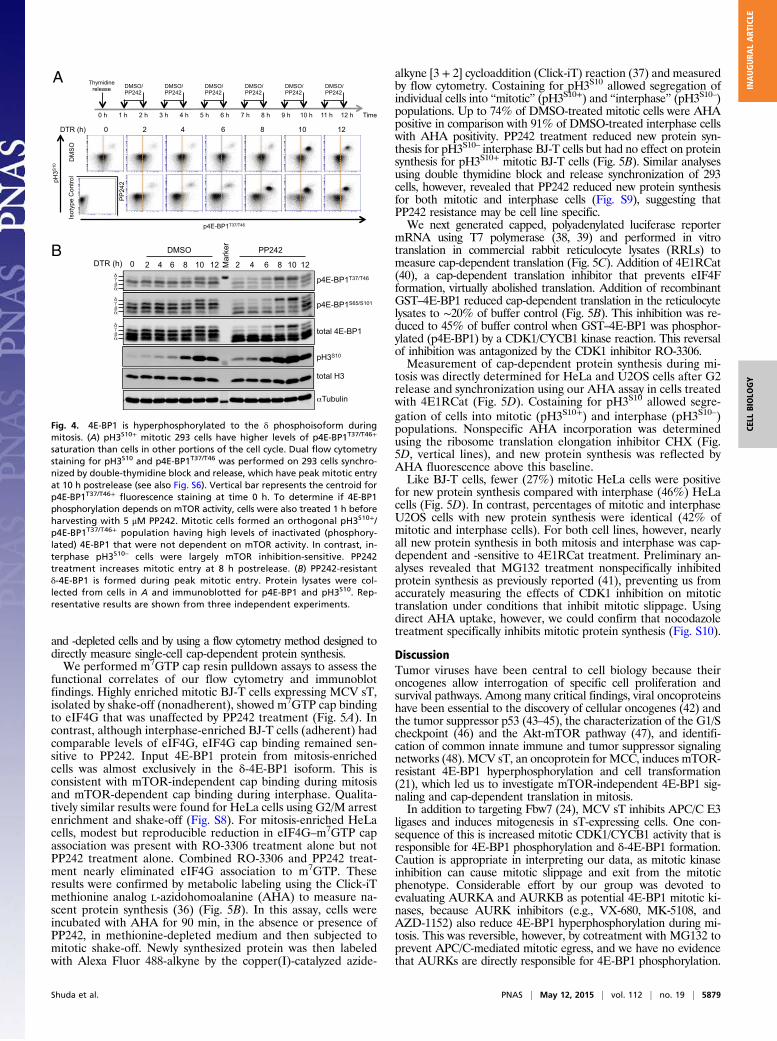
at sequential time points, and immunostained for pH3S10 andp4E-BP1T37/T46 (Fig. 4A). For each time point after release, cellswere pretreated with PP242 or DMSO vehicle control 1 h beforeharvesting.Flow cytometry showed peak pH3S10+ mitotic entry occurring
reproducibly at 10 h, which began to diminish by 12 h after re-lease (Fig. 4A and Fig. S6). This same pattern occurred withPP242 pretreatment, although mitotic entry was more abundantat 8 h postrelease. Unexpectedly, pH3S10+ mitotic 293 cells formedan orthogonal population with the highest per-cell saturation levelsof p4E-BP1T37/T46 compared with any other stage of the cell cycle.PP242 pretreatment reduced p4E-BP1T37/T46+ staining for in-terphase cells at 2–8 h (note leftward shift for p4E-BP1T37/T46+
staining among pH3S10- cells) consistent with mTOR regulation of4E-BP1. At peak mitotic entry (8–10 h postrelease), however,
pH3S10+ cells were resistant to loss of p4E-BP1T37/T46+ stainingwith PP242 treatment.Immunoblots performed on these same cell fractions at each
time point (Fig. 4B) showed prominent α-γ 4E-BP1 phosphory-lation at early time points (0–6 h), which was sensitive to mTORinhibition. The δ isoform emerged 8–12 h after release, corre-sponding to maximum pH3S10+ and p4E-BP1T37/T46+ staining,and was resistant to PP242 inhibition. Similar results, but with aless abundant orthogonal pH3S10+/p4E-BP1T37/T46+ cell population,were seen in U2OS cells (Fig. S7).
CDK1/CYCB1 Activates Cap-Dependent Translation During Mitosis.According to the existing model for 4E-BP1–regulated proteinsynthesis, high levels of p4E-BP1T37/T46 are predicted to promotecap-dependent translation during pH3S10+mitosis (35). We directlyexamined this by using cap-binding assays for mitosis-enriched
GST-4E-BP1 + + + + + + Mitotic lysate - + + + + + ATP (200 µM) - - + + + +
p4E-BP1T37/T46
p4E-BP1S65/S101
p4E-BP1T70
total 4E-BP1 CYCB1
Tubulin
- + + + CDK1/CYCB1 - - + + ATP (200 µM) - - - + RO-3306 (5 µM)
p4E-BP1T37/T46
p4E-BP1S65/S101
p4E-BP1T70
total 4E-BP1
C
B A
D
Nocodazole MimosineAsynchronous
p4E-BP1T37/T46
p4E-BP1T70
total 4E-BP1
p4E-BP1S65/S101
Tubulin MCV sT
total S6pS6S235/S236
total cdc25C
total H3pH3S10
CYCB1
RO-3306
Moc
k
PP
242
Moc
k P
P24
2
Moc
k
PP
242
Moc
k
PP
242
sTEmpty sTEmptyRO-3306
Moc
k
PP
242
Moc
k P
P24
2
Moc
k
PP
242
Moc
k
PP
242
sTEmpty sTEmptyRO-3306
Moc
k
PP
242
Moc
k P
P24
2
Moc
k
PP
242
Moc
k
PP
242
sTEmpty sTEmpty
p4E-BP1T70
Tubulin
p4E-BP1S65/S101
total S6
total 4E-BP1
p4E-BP1T37/T46
pS6S235/S236
PP242RO-3306 release (h)
Mock0.5 1 2 0 0.5 1 2 0
DMSO/ PP242
Time0 h 21 h 24 h
HarvestRO-3306 Release from G2 arrest
26 h25 h24.5 h
PP242/RO-3306MG132Cell cycle arrest
DMSO/Nocodazole/Mimosine
Time0 h 24 h 39.5 h 44 h
HarvestTransfection Kinase inhibition
40 h
Fig. 3. CDK1/CYCB1 phosphorylates 4E-BP1 during mitosis. (A) CDK1 inhibition in mitotic lysates reduces 4E-BP1 phosphorylation. Mitotic HeLa cell lysates(10 μg) enriched by nocodazole arrest were mixed with 0.2 μg GST–4E-BP1, reacted for 30 min at 30 °C in the presence or absence of 5 μMmTOR (PP242), CDK1(RO-3306), or AURK (VX-680) kinase inhibitors and then immunoblotted with antibodies as shown. ATP-dependent 4E-BP1 phosphorylation was sensitive toCDK1 inhibitor but resistant to mTOR and AURK inhibitors. Equal loading of total 4E-BP1, CYCB1, and α-tubulin is shown. Representative results are shownfrom three independent experiments. (B) Recombinant CDK1/CYCB1 kinase phosphorylates GST–4E-BP1 at the known regulatory residues T70, S65/S101, andT37/T46. CDK1/CYCB1 (20 units) was mixed with bacterial-expressed GST–4E-BP1 in kinase reaction buffer for 30 min at 30 °C and immunoblotted withphospho-specific antibodies. ATP-dependent 4E-BP1 phosphorylation by CDK1/CYCB1 occurred at phospho-specific sites and was sensitive to the CDK1 activesite inhibitor RO-3306. Representative results are shown from two independent experiments. (C) δ-4E-BP1 is induced during mitosis and inhibited by a CDK1inhibitor. The 293 cells were transfected with empty vector or MCV sT and arrested for 20 h with DMSO (asynchronous), nocodazole (prometaphase), andmimosine (late G1). Cells were treated at 16 h with kinase inhibitors (5 μM PP242 or 10 μM RO-3306 + 10 μM MG132) as indicated. MCV sT induces δ-4E-BP1 inasynchronous cells sensitive to RO-3306 but not PP242. Nocodazole arrest induces similarly RO-3306–sensitive and PP242-resistant δ-4E-BP1 even in the ab-sence of sT, whereas δ-4E-BP1 is only weakly induced by sT in mimosine-arrested cells. Markers for mitosis (pH3S10, CYCB1), a CDK1 substrate (cdc25C), and anmTORC1 downstream substrate (pS6S235/S236) showed active drug treatments. Representative results are shown from two independent experiments. (D) δ-4E-BP1 phosphorylation during mitosis occurs in the absence of active mTOR. U2OS cells were arrested at the G2/M boundary with 10 μM RO-3306 for 24 h,released by washing, and harvested at the time points shown. Cells were treated for 3 h prerelease with DMSO or 5 μM PP242. In the absence of mTORinhibition, no δ-4E-BP1 is found at 0 h but accumulates, together with β and γ isoforms, during mitotic transit. During PP242 inhibition, δ-4E-BP1 still ac-cumulates during mitosis, but lower molecular mass (β–γ) isoforms are reduced. Results shown are from a single experiment.
5878 | www.pnas.org/cgi/doi/10.1073/pnas.1505787112 Shuda et al.
and -depleted cells and by using a flow cytometry method designed todirectly measure single-cell cap-dependent protein synthesis.We performed m7GTP cap resin pulldown assays to assess the
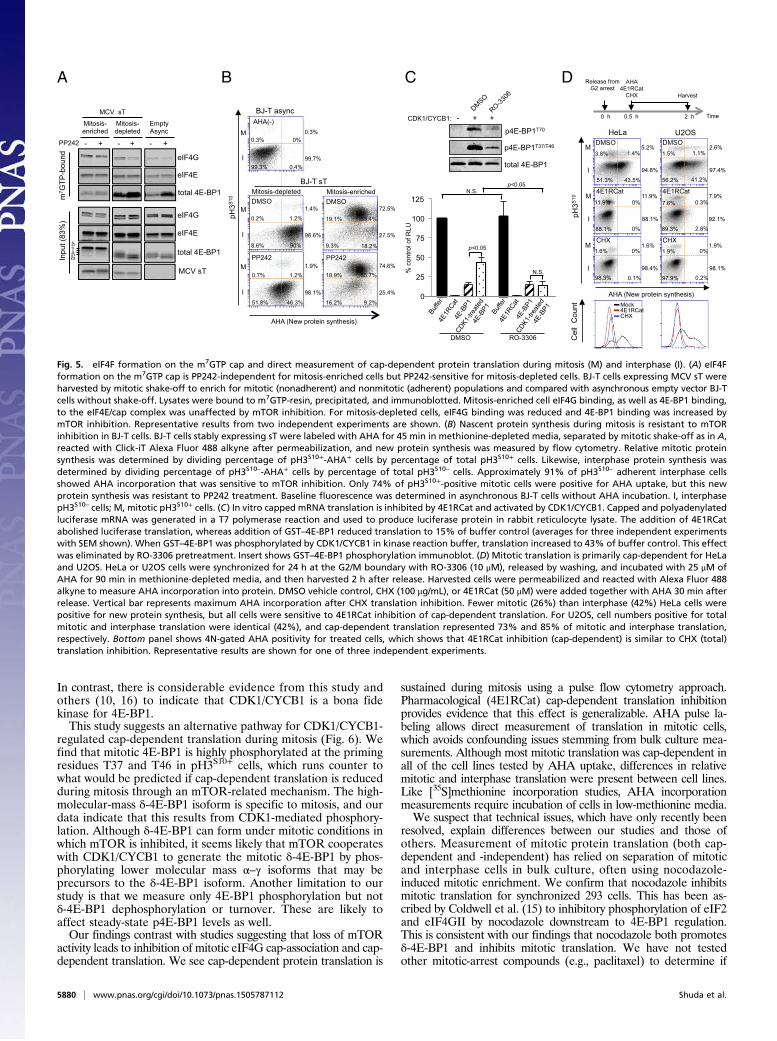
functional correlates of our flow cytometry and immunoblotfindings. Highly enriched mitotic BJ-T cells expressing MCV sT,isolated by shake-off (nonadherent), showed m7GTP cap bindingto eIF4G that was unaffected by PP242 treatment (Fig. 5A). Incontrast, although interphase-enriched BJ-T cells (adherent) hadcomparable levels of eIF4G, eIF4G cap binding remained sen-sitive to PP242. Input 4E-BP1 protein from mitosis-enrichedcells was almost exclusively in the δ-4E-BP1 isoform. This isconsistent with mTOR-independent cap binding during mitosisand mTOR-dependent cap binding during interphase. Qualita-tively similar results were found for HeLa cells using G2/M arrestenrichment and shake-off (Fig. S8). For mitosis-enriched HeLacells, modest but reproducible reduction in eIF4G–m7GTP capassociation was present with RO-3306 treatment alone but notPP242 treatment alone. Combined RO-3306 and PP242 treat-ment nearly eliminated eIF4G association to m7GTP. Theseresults were confirmed by metabolic labeling using the Click-iTmethionine analog L-azidohomoalanine (AHA) to measure na-scent protein synthesis (36) (Fig. 5B). In this assay, cells wereincubated with AHA for 90 min, in the absence or presence ofPP242, in methionine-depleted medium and then subjected tomitotic shake-off. Newly synthesized protein was then labeledwith Alexa Fluor 488-alkyne by the copper(I)-catalyzed azide-
alkyne [3 + 2] cycloaddition (Click-iT) reaction (37) and measuredby flow cytometry. Costaining for pH3S10 allowed segregation ofindividual cells into “mitotic” (pH3S10+) and “interphase” (pH3S10–)populations. Up to 74% of DMSO-treated mitotic cells were AHApositive in comparison with 91% of DMSO-treated interphase cellswith AHA positivity. PP242 treatment reduced new protein syn-thesis for pH3S10– interphase BJ-T cells but had no effect on proteinsynthesis for pH3S10+ mitotic BJ-T cells (Fig. 5B). Similar analysesusing double thymidine block and release synchronization of 293cells, however, revealed that PP242 reduced new protein synthesisfor both mitotic and interphase cells (Fig. S9), suggesting thatPP242 resistance may be cell line specific.We next generated capped, polyadenylated luciferase reporter
mRNA using T7 polymerase (38, 39) and performed in vitrotranslation in commercial rabbit reticulocyte lysates (RRLs) tomeasure cap-dependent translation (Fig. 5C). Addition of 4E1RCat(40), a cap-dependent translation inhibitor that prevents eIF4Fformation, virtually abolished translation. Addition of recombinantGST–4E-BP1 reduced cap-dependent translation in the reticulocytelysates to ∼20% of buffer control (Fig. 5B). This inhibition was re-duced to 45% of buffer control when GST–4E-BP1 was phosphor-ylated (p4E-BP1) by a CDK1/CYCB1 kinase reaction. This reversalof inhibition was antagonized by the CDK1 inhibitor RO-3306.Measurement of cap-dependent protein synthesis during mi-
tosis was directly determined for HeLa and U2OS cells after G2release and synchronization using our AHA assay in cells treatedwith 4E1RCat (Fig. 5D). Costaining for pH3S10 allowed segre-gation of cells into mitotic (pH3S10+) and interphase (pH3S10–)populations. Nonspecific AHA incorporation was determinedusing the ribosome translation elongation inhibitor CHX (Fig.5D, vertical lines), and new protein synthesis was reflected byAHA fluorescence above this baseline.Like BJ-T cells, fewer (27%) mitotic HeLa cells were positive
for new protein synthesis compared with interphase (46%) HeLacells (Fig. 5D). In contrast, percentages of mitotic and interphaseU2OS cells with new protein synthesis were identical (42% ofmitotic and interphase cells). For both cell lines, however, nearlyall new protein synthesis in both mitosis and interphase was cap-dependent and -sensitive to 4E1RCat treatment. Preliminary an-alyses revealed that MG132 treatment nonspecifically inhibitedprotein synthesis as previously reported (41), preventing us fromaccurately measuring the effects of CDK1 inhibition on mitotictranslation under conditions that inhibit mitotic slippage. Usingdirect AHA uptake, however, we could confirm that nocodazoletreatment specifically inhibits mitotic protein synthesis (Fig. S10).
DiscussionTumor viruses have been central to cell biology because theironcogenes allow interrogation of specific cell proliferation andsurvival pathways. Among many critical findings, viral oncoproteinshave been essential to the discovery of cellular oncogenes (42) andthe tumor suppressor p53 (43–45), the characterization of the G1/Scheckpoint (46) and the Akt-mTOR pathway (47), and identifi-cation of common innate immune and tumor suppressor signalingnetworks (48). MCV sT, an oncoprotein for MCC, induces mTOR-resistant 4E-BP1 hyperphosphorylation and cell transformation(21), which led us to investigate mTOR-independent 4E-BP1 sig-naling and cap-dependent translation in mitosis.In addition to targeting Fbw7 (24), MCV sT inhibits APC/C E3
ligases and induces mitogenesis in sT-expressing cells. One con-sequence of this is increased mitotic CDK1/CYCB1 activity that isresponsible for 4E-BP1 phosphorylation and δ-4E-BP1 formation.Caution is appropriate in interpreting our data, as mitotic kinaseinhibition can cause mitotic slippage and exit from the mitoticphenotype. Considerable effort by our group was devoted toevaluating AURKA and AURKB as potential 4E-BP1 mitotic ki-nases, because AURK inhibitors (e.g., VX-680, MK-5108, andAZD-1152) also reduce 4E-BP1 hyperphosphorylation during mi-tosis. This was reversible, however, by cotreatment with MG132 toprevent APC/C-mediated mitotic egress, and we have no evidencethat AURKs are directly responsible for 4E-BP1 phosphorylation.
A
B
pH3S10
Tubulin
total 4E-BP1
p4E-BP1T37/T46
p4E-BP1S65/S101
total H3
DTR (h) 12 0 2 4 6 8 12 2 4 6 8
PP242 DMSO
10 10 Mar
ker
p4E-BP1T37/T46
pH3S
10
Isot
ype
Con
trol
DM
SO
2 4 6 8 10 12 0 DTR (h)
Thymidine release
Time11 h4 h 8 h 10 h 12 h2 h
DMSO/ PP242
DMSO/ PP242
0 h 1 h 3 h 7 h 9 h6 h5 h
DMSO/ PP242
DMSO/ PP242
DMSO/ PP242
DMSO/ PP242
PP
242
Fig. 4. 4E-BP1 is hyperphosphorylated to the δ phosphoisoform duringmitosis. (A) pH3S10+ mitotic 293 cells have higher levels of p4E-BP1T37/T46+
saturation than cells in other portions of the cell cycle. Dual flow cytometrystaining for pH3S10 and p4E-BP1T37/T46 was performed on 293 cells synchro-nized by double-thymidine block and release, which have peak mitotic entryat 10 h postrelease (see also Fig. S6). Vertical bar represents the centroid forp4E-BP1T37/T46+ fluorescence staining at time 0 h. To determine if 4E-BP1phosphorylation depends on mTOR activity, cells were also treated 1 h beforeharvesting with 5 μM PP242. Mitotic cells formed an orthogonal pH3S10+/p4E-BP1T37/T46+ population having high levels of inactivated (phosphory-lated) 4E-BP1 that were not dependent on mTOR activity. In contrast, in-terphase pH3S10– cells were largely mTOR inhibition-sensitive. PP242treatment increases mitotic entry at 8 h postrelease. (B) PP242-resistantδ-4E-BP1 is formed during peak mitotic entry. Protein lysates were col-lected from cells in A and immunoblotted for p4E-BP1 and pH3S10. Rep-resentative results are shown from three independent experiments.
Shuda et al. PNAS | May 12, 2015 | vol. 112 | no. 19 | 5879
CELL
BIOLO
GY
INAUGURA
LART
ICLE
In contrast, there is considerable evidence from this study andothers (10, 16) to indicate that CDK1/CYCB1 is a bona fidekinase for 4E-BP1.This study suggests an alternative pathway for CDK1/CYCB1-
regulated cap-dependent translation during mitosis (Fig. 6). Wefind that mitotic 4E-BP1 is highly phosphorylated at the primingresidues T37 and T46 in pH3S10+ cells, which runs counter towhat would be predicted if cap-dependent translation is reducedduring mitosis through an mTOR-related mechanism. The high-molecular-mass δ-4E-BP1 isoform is specific to mitosis, and ourdata indicate that this results from CDK1-mediated phosphory-lation. Although δ-4E-BP1 can form under mitotic conditions inwhich mTOR is inhibited, it seems likely that mTOR cooperateswith CDK1/CYCB1 to generate the mitotic δ-4E-BP1 by phos-phorylating lower molecular mass α–γ isoforms that may beprecursors to the δ-4E-BP1 isoform. Another limitation to ourstudy is that we measure only 4E-BP1 phosphorylation but notδ-4E-BP1 dephosphorylation or turnover. These are likely toaffect steady-state p4E-BP1 levels as well.Our findings contrast with studies suggesting that loss of mTOR
activity leads to inhibition of mitotic eIF4G cap-association and cap-dependent translation. We see cap-dependent protein translation is
sustained during mitosis using a pulse flow cytometry approach.Pharmacological (4E1RCat) cap-dependent translation inhibitionprovides evidence that this effect is generalizable. AHA pulse la-beling allows direct measurement of translation in mitotic cells,which avoids confounding issues stemming from bulk culture mea-surements. Although most mitotic translation was cap-dependent inall of the cell lines tested by AHA uptake, differences in relativemitotic and interphase translation were present between cell lines.Like [35S]methionine incorporation studies, AHA incorporationmeasurements require incubation of cells in low-methionine media.We suspect that technical issues, which have only recently been
resolved, explain differences between our studies and those ofothers. Measurement of mitotic protein translation (both cap-dependent and -independent) has relied on separation of mitoticand interphase cells in bulk culture, often using nocodazole-induced mitotic enrichment. We confirm that nocodazole inhibitsmitotic translation for synchronized 293 cells. This has been as-cribed by Coldwell et al. (15) to inhibitory phosphorylation of eIF2and eIF4GII by nocodazole downstream to 4E-BP1 regulation.This is consistent with our findings that nocodazole both promotesδ-4E-BP1 and inhibits mitotic translation. We have not testedother mitotic-arrest compounds (e.g., paclitaxel) to determine if
A B D C
- + + CDK1/CYCB1:
p4E-BP1T70
p4E-BP1T37/T46
total 4E-BP1
- + - + - +
total 4E-BP1
total 4E-BP1
PP242
eIF4E
MCV sT
eIF4E
eIF4G
eIF4G
Inpu
t (83
%)
Mitosis-depleted
Mitosis-enriched
MCV sT
Empty Async
m7 G
TP-b
ound
Cel
l C
ount 4E1RCat
CHX
Mock
AHA (New protein synthesis)
CHX
DMSO
4E1RCat
U2OS
2.8%
0.3%
89.3%
7.6%
0.2%
0%
97.9%
1.9%
41.2%
1.1%
56.2%
1.5%
HeLa
pH3S
10
CHX
DMSO
4E1RCat
I
M
88.1%
11.9%
98.3%
1.6%
51.3%
3.8%
0%
0%
0.1%
0%
43.5%
1.4% 5.2%
94.8%
11.9%
88.1%
1.6%
98.4% 98.1%
1.9%
7.9%
92.1%
2.6%
97.4%
I
M
I
M
N.S.
0
25
50
75
100
125
% c
ontro
l of R
LU
DMSO RO-3306
N.S.p<0.05
p<0.05
Time
Release from G2 arrest
2 h0 h 0.5 h
AHA 4E1RCat
CHX Harvest
pH3S
10
BJ-T sT
99.3%
0.3%
0.4%
0%
I
M 0.3%
99.7%
BJ-T async
16.2%
18.9%
8.6%
0.2%
9.3%
19.1%
PP242
DMSO DMSO
51.8%
0.7%
PP242
46.3%
1.2%
9.2%
55.7%
90%
1.2%
18.2%
53.4%
74.6%
25.4% I
M
72.5%
27.5%
1.9%
98.1%
I
M 1.4%
98.6%
Mitosis-enriched
AHA(-)
AHA (New protein synthesis)
Mitosis-depleted
Fig. 5. eIF4F formation on the m7GTP cap and direct measurement of cap-dependent protein translation during mitosis (M) and interphase (I). (A) eIF4Fformation on the m7GTP cap is PP242-independent for mitosis-enriched cells but PP242-sensitive for mitosis-depleted cells. BJ-T cells expressing MCV sT wereharvested by mitotic shake-off to enrich for mitotic (nonadherent) and nonmitotic (adherent) populations and compared with asynchronous empty vector BJ-Tcells without shake-off. Lysates were bound to m7GTP-resin, precipitated, and immunoblotted. Mitosis-enriched cell eIF4G binding, as well as 4E-BP1 binding,to the eIF4E/cap complex was unaffected by mTOR inhibition. For mitosis-depleted cells, eIF4G binding was reduced and 4E-BP1 binding was increased bymTOR inhibition. Representative results from two independent experiments are shown. (B) Nascent protein synthesis during mitosis is resistant to mTORinhibition in BJ-T cells. BJ-T cells stably expressing sT were labeled with AHA for 45 min in methionine-depleted media, separated by mitotic shake-off as in A,reacted with Click-iT Alexa Fluor 488 alkyne after permeabilization, and new protein synthesis was measured by flow cytometry. Relative mitotic proteinsynthesis was determined by dividing percentage of pH3S10+-AHA+ cells by percentage of total pH3S10+ cells. Likewise, interphase protein synthesis wasdetermined by dividing percentage of pH3S10–-AHA+ cells by percentage of total pH3S10– cells. Approximately 91% of pH3S10– adherent interphase cellsshowed AHA incorporation that was sensitive to mTOR inhibition. Only 74% of pH3S10+-positive mitotic cells were positive for AHA uptake, but this newprotein synthesis was resistant to PP242 treatment. Baseline fluorescence was determined in asynchronous BJ-T cells without AHA incubation. I, interphasepH3S10– cells; M, mitotic pH3S10+ cells. (C) In vitro capped mRNA translation is inhibited by 4E1RCat and activated by CDK1/CYCB1. Capped and polyadenylatedluciferase mRNA was generated in a T7 polymerase reaction and used to produce luciferase protein in rabbit reticulocyte lysate. The addition of 4E1RCatabolished luciferase translation, whereas addition of GST–4E-BP1 reduced translation to 15% of buffer control (averages for three independent experimentswith SEM shown). When GST–4E-BP1 was phosphorylated by CDK1/CYCB1 in kinase reaction buffer, translation increased to 43% of buffer control. This effectwas eliminated by RO-3306 pretreatment. Insert shows GST–4E-BP1 phosphorylation immunoblot. (D) Mitotic translation is primarily cap-dependent for HeLaand U2OS. HeLa or U2OS cells were synchronized for 24 h at the G2/M boundary with RO-3306 (10 μM), released by washing, and incubated with 25 μM ofAHA for 90 min in methionine-depleted media, and then harvested 2 h after release. Harvested cells were permeabilized and reacted with Alexa Fluor 488alkyne to measure AHA incorporation into protein. DMSO vehicle control, CHX (100 μg/mL), or 4E1RCat (50 μM) were added together with AHA 30 min afterrelease. Vertical bar represents maximum AHA incorporation after CHX translation inhibition. Fewer mitotic (26%) than interphase (42%) HeLa cells werepositive for new protein synthesis, but all cells were sensitive to 4E1RCat inhibition of cap-dependent translation. For U2OS, cell numbers positive for totalmitotic and interphase translation were identical (42%), and cap-dependent translation represented 73% and 85% of mitotic and interphase translation,respectively. Bottom panel shows 4N-gated AHA positivity for treated cells, which shows that 4E1RCat inhibition (cap-dependent) is similar to CHX (total)translation inhibition. Representative results are shown for one of three independent experiments.
5880 | www.pnas.org/cgi/doi/10.1073/pnas.1505787112 Shuda et al.
they have similar limitations. A second technical challenge is thatmitotic cells represent a small fraction of the total cell popula-tion. Contamination with interphase cells is nearly inevitable inmitotic enrichment protocols and will dramatically alter conclu-sions, such as the role of mTOR in regulating 4E-BP1 duringmitosis. In our experience, flow cytometry can help to resolve thisdilemma by directly measuring mitotic status (pH3S10 or pMPM2status) in cells while simultaneously determining translationregulator status, such as p4E-BP1T37/T46. Finally, newly developedclasses of cap-dependent translation inhibitors such as 4E1RCatnow allow direct determination of cap-dependent translation. Whenused in combination with AHA incorporation, direct measure-ment of mitotic cap-dependent translation can be determined.Both nocodazole and PP242 are nonetheless important in-
hibitors to measure 4E-BP1 phosphorylation and translationduring mitosis. As indicated, nocodazole does not interfere withδ-4E-BP1 formation and is useful for accentuating mitotic reg-ulation of 4E-BP1. mTOR regulates translation through ribo-somal biosynthesis as well as direct phosphorylation of trans-lation machinery components downstream from 4E-BP1, such aseIF4B (49) and eEF2 elongation factor (50). Further, eIF4Bregulation by 14-3-3σ may also play a role in later stages of mi-totic protein translation and may be missed in our study of earlymitosis (51). Thus, PP242 may affect mitotic translation by actingdownstream to 4E-BP1. We also find evidence that in most cellsmTOR typically acts in concert with CDK1/CYCB1 to promotemitotic cap-dependent translation.Cap-dependent translation of preformed mRNAs provides
rapid regulation of gene expression that may be required forshort-lived cellular responses, such as transit through mitosis.These changes generally cannot be accurately measured bystandard mRNA expression techniques. Mounting evidencesuggests that dysregulated cap-dependent translation from ab-errant PI3K–Akt–mTOR and MEF–RAF–MEK–ERK signalingcontributes to cancer cell transformation (3, 52). Regardless ofthe contribution of activated cap-dependent translation to can-cer cell transformation, such as in MCV-positive MCC, ourfindings point toward the possibility that combined mTOR andCDK1/CYCB1 inhibition may prove useful for cancer treatment,particularly for mTOR inhibitor-resistant cancers.
Materials and MethodsPlasmids, antibodies, primers, and standard methods are described in SIMaterials and Methods.
2D Electrophoresis. The 293 cells were lysed using lysis buffer (50 mM Tris∙HCl,pH 7.4, 0.15 M NaCl, 1% Triton X-100, 2 mM Na3VO4, 2 mM NaF) supplementedwith protease inhibitors (Roche). Clarified lysates were focused using immobi-lized pH 3–6 gradient strips (Bio-Rad) with linear voltage ramping for 2 h at200 V, 2 h at 500 V, and 16 h at 800 V. Focused proteins were then subjected toSDS/PAGE for 2D resolution and detected by immunoblotting.
Flow Cytometry. The 293 and BJ-T cells were trypsinized and fixed in 70%(vol/vol) ethanol for DNA staining or in 10% (vol/vol) buffered formalin forAHA incorporation assays. Fixed cells were washed with PBS containing 1% FBSand permeabilized with 0.25% Triton X-100 for 30 min on ice. For cell cycleanalysis, cells were resuspended in PI/RNase staining solution (0.05 mg/mLPI, 0.1 mg/mL RNase A in 1× PBS) and incubated for 30 min at room tem-perature. For phospho-histone H3S10 and phospho–4E-BP1T37/T46 analysis, cellswere incubated with the corresponding fluorophore-conjugated antibodiesfor 2 h at room temperature.
Cell Cycle Synchronization and Mitotic Cell Enrichment. The 293 cells weretreated with medium containing 0.5 μM nocodazole or 0.5 mM L-mimosinefor 16 h to induce mitotic arrest or G1 arrest, respectively. Mitotic cells wereenriched by double-thymidine block (2 mM) and release using 293 and U2OScells or by mitotic shake-off (53) using BJ-T cells stably expressing wild-typeMCV sT. To block the cell cycle at late G2, HeLa and U2OS cells were in-cubated in medium containing CDK1 inhibitor RO-3306 (10 μM) for 24 h. Cellcycle entry from G2 to mitosis was induced by RO-3306 washout. Cellsarrested by nocodazole and released from RO-3306 arrest were treated with10 μM of proteasome inhibitor MG132 for 30 min before kinase inhibitortreatment to retain cells in mitosis.
Kinase Inhibitors. The following active-site kinase inhibitors were dissolved inDMSO and used for in vivo kinase inhibition and in vitro phosphorylationexperiments: mTORkinase inhibitor PP242 (Selleckchem), CDK1 kinase inhibitorRO-3306 (Calbiochem), and pan Aurora kinase inhibitor VX-680 (Selleckchem).
In Vitro Phosphorylation Assays. Recombinant GST–4E-BP1 (0.2 μg) (Signal-Chem) was incubated in a 24-μL reaction containing 1× protein kinase buffer(NEB) and 20 units of recombinant CDK1/CYCB1 (NEB) or 10 μg of mitoticHeLa cell lysate, supplemented with 200 μM ATP and/or 5 μM active sitekinase inhibitors, for 30 min at 30 °C. HeLa cells were arrested in mitosis bytreatment with 0.5 μM nocodazole for 16 h and enriched by mechanicalshake-off for lysis in nondenaturing lysis buffer (50 mM Tris∙HCl, pH 7.4, 0.15 MNaCl, 1% Triton X-100, 2 mM Na3VO4, and 2 mM NaF). The reactions werestopped by adding 5× SDS sample buffer to 1× concentration and boiling for5 min. Reaction samples were then subjected to SDS/PAGE and immuno-blotting. For in vitro protein dephosphorylation, 293 cell extracts were in-cubated with lambda phosphatase in protein metallophosphatase reactionbuffer (NEB) supplemented with 2 mM MnCl2 for 30 min at 37 °C. Reactionswere stopped by adding 2× SDS sample buffer and then subjected to SDS/PAGE and immunoblotting.
m7GTP Cap-Binding Assay. Shake-off (mitosis-enriched) and adherent cells(mitotic-depleted) from MCV sT-transduced BJ-T cells or asynchronous BJ-Tcells were lysed in buffer (50 mM Tris·HCl, pH 7.4, 0.15 M NaCl, 1% TritonX-100, 2 mM Na3VO4, and 2mM NaF) supplemented with protease inhibitors(Roche). Lysates (30 μg of total protein) were incubated with 5.0 μL of m7GTPSepharose beads (GE Healthcare) overnight at 4 °C. Beads were collected,washed with lysis buffer, and subjected to SDS/PAGE and immunoblotting.We loaded 25 μg of total protein as input control (83%).
In Vitro mRNA Synthesis and Translation. Capped firefly-luciferase (FLuc) re-portermRNAwas synthesized by theMessageMAXT7ARCA-Cappedmessagetranscription kit (Cell Script) using 1 μg pCD-V5-FLuc linearized by MscI astemplate. pCD-V5-Fluc was constructed by ligating FLuc from pGL3 topCDNA6/V5-HisB between Hind II and XbaI. Purified RNA was polyadenylatedusing the A-Plus Poly (A) polymerase tailing kit (Cell Script). Translation re-actions were performed in a final volume of 10 μL consisting of 7 μL ofnuclease-treated RRL (Promega), 0.8 pmol of capped and polyadenylated re-porter mRNAs, and an amino acid mixture (50 μM each). GST–4E-BP1 was in-cubated with either CDK1 or 1 μg/mL BSA in the presence of DMSO or 10 μMRO-3306 (see reaction setup for previous section). As a control, PBS alone wasincubated with the same amount of either DMSO or 10 μM RO-3306. Eitherbuffer or pretreated GST–4E-BP1 (12.4 μL) was added to the RRL reactionmixture. The prepared RRL mixture was incubated for 15 min at 30 °C. The
Cap-dependent translation
CDK1/CYCB
Interphase 4E-BP1
mTOR
Raptor
4E-BP1
P
P
P
P - 4E-BP1
(PP242-sensitive)
Mitosis4E-BP1
4E-BP1
P P
P
4E-BP1 (PP242-resistant)
P
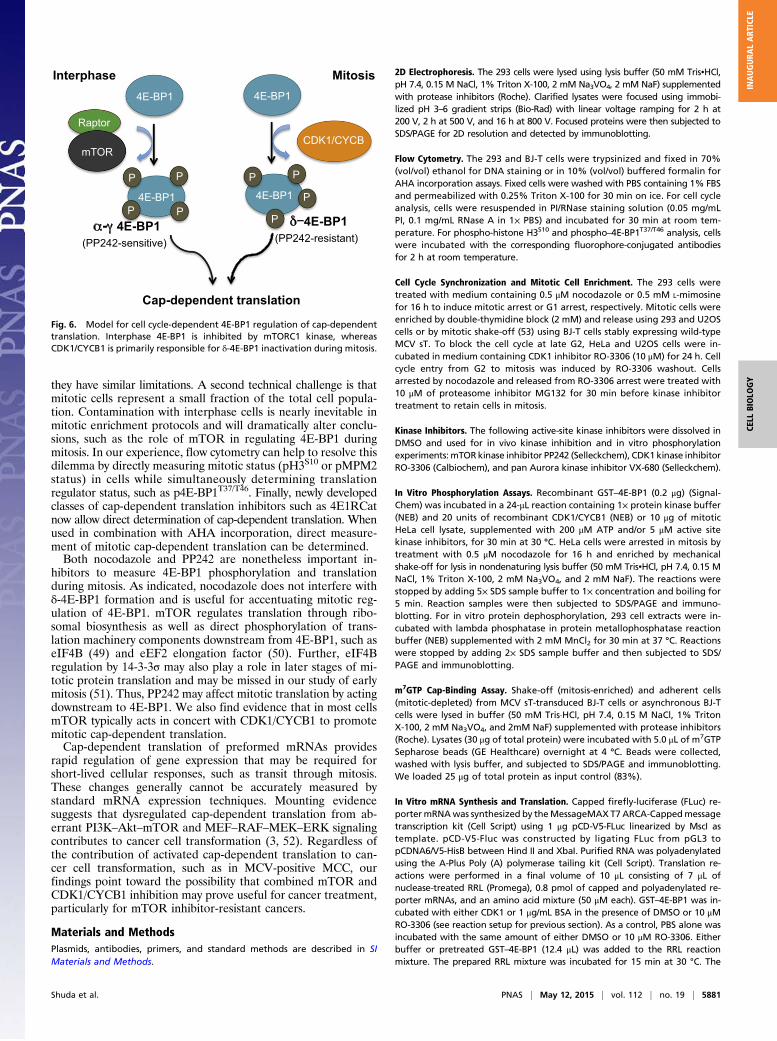
Fig. 6. Model for cell cycle-dependent 4E-BP1 regulation of cap-dependenttranslation. Interphase 4E-BP1 is inhibited by mTORC1 kinase, whereasCDK1/CYCB1 is primarily responsible for δ-4E-BP1 inactivation during mitosis.
Shuda et al. PNAS | May 12, 2015 | vol. 112 | no. 19 | 5881
CELL
BIOLO
GY
INAUGURA
LART
ICLE
reaction was then stopped by adding 10 μL of luciferase lysis buffer to themixture. Translation was measured as firefly luciferase activity.
Nascent Protein Synthesis Analysis. BJ-T sT stable cells were labeled with anazide-linked methionine analog AHA (Life Technologies) at 25 μM for 45 minin the presence or absence of PP242 (5 μM), followed by mitotic shake-off toseparate mitotic cells and interphase cells. To analyze mitotic cap-dependenttranslation in U2OS and HeLa cells, cells were arrested at the G2/M boundaryby 10 μM RO-3306 treatment for 24 h (34). After 30 min of RO-3306 removal,cells were labeled with AHA (25 μM) for 90 min in methionine-depletedDMEM (Corning Cellgro) after optimization of preexperiments. Translationinhibitors [4E1RCat (50 μM) or CHX (100 μg/mL)] or DMSO (0.1%) were addedto cells with AHA. Cells were trypsinized and fixed in 10% (vol/vol) formalinfor 5 min. Fixed cells were permeabilized in PBS containing 0.1% saponinand 1% FBS for 30 min at room temperature. Cells were harvested and la-beled with the Alexa Fluor 488 alkyne using the Click-iT cell reaction bufferkit (Life Technologies). AHA incorporation in cells was analyzed by flowcytometry as a measure for nascent protein synthesis in interphase andmitotic cells.
Statistic Analysis. One-sided t test was performed for densitometric analysisof m7GTP pulldown assays and two-sided t test (unequal variances) for invitro translation assays. A P value less than 0.05 was considered to besignificant.
ACKNOWLEDGMENTS. We thank Susanne Lens and Rutger Hengeveld foraccess to unpublished aurora kinase analyses, and Ioanna Tzani, GaryLoughran, and John Atkins, University of Cork, for access to unpublishedribosomal profiling studies. The authors also thank Susanne Lens, NahumSonenberg, and Chris Bakkenist for helpful scientific suggestions; Wei Qianfor technical assistance; Jing Hu for providing reagents for cap-dependenttranslation analysis; Nahum Sonenberg for providing 4E-BP1 knockout MEFsused in unpublished comparative studies; and Joe Zawinul and Missy Mazzoli forhelp in writing the manuscript. This work was supported by NIH National CancerInstitute Grants R01CA136806, CA136363, and CA170354 and American CancerSociety Professorships (to P.S.M. and Y.C.). M.S. was supported in part byUniversity of Pittsburgh Skin Cancer Specialized Program of Research Excellence(SPORE) Grant CA12197305. Flow cytometry was performed in the University ofPittsburgh Cancer Institute (UPCI) Cytometry Facility, which is supported in partby NIH Grant P30CA047904.
1. Mamane Y, Petroulakis E, LeBacquer O, Sonenberg N (2006) mTOR, translation initi-ation and cancer. Oncogene 25(48):6416–6422.
2. Hsieh AC, et al. (2010) Genetic dissection of the oncogenic mTOR pathway revealsdruggable addiction to translational control via 4EBP-eIF4E. Cancer Cell 17(3):249–261.
3. She QB, et al. (2010) 4E-BP1 is a key effector of the oncogenic activation of the AKT andERK signaling pathways that integrates their function in tumors. Cancer Cell 18(1):39–51.
4. Wang X, Proud CG (2011) mTORC1 signaling: What we still don’t know. J Mol Cell Biol3(4):206–220.
5. Armengol G, et al. (2007) 4E-binding protein 1: A key molecular “funnel factor” inhuman cancer with clinical implications. Cancer Res 67(16):7551–7555.
6. Sabatini DM (2006) mTOR and cancer: Insights into a complex relationship. Nat RevCancer 6(9):729–734.
7. Burnett PE, Barrow RK, Cohen NA, Snyder SH, Sabatini DM (1998) RAFT1 phosphor-ylation of the translational regulators p70 S6 kinase and 4E-BP1. Proc Natl Acad SciUSA 95(4):1432–1437.
8. Gingras AC, et al. (2001) Hierarchical phosphorylation of the translation inhibitor4E-BP1. Genes Dev 15(21):2852–2864.
9. Herbert TP, Tee AR, Proud CG (2002) The extracellular signal-regulated kinase pathwayregulates the phosphorylation of 4E-BP1 at multiple sites. J Biol Chem 277(13):11591–11596.
10. Heesom KJ, Gampel A, Mellor H, Denton RM (2001) Cell cycle-dependent phosphor-ylation of the translational repressor eIF-4E binding protein-1 (4E-BP1). Curr Biol11(17):1374–1379.
11. Shang ZF, et al. (2012) 4E-BP1 participates in maintaining spindle integrity and ge-nomic stability via interacting with PLK1. Cell Cycle 11(18):3463–3471.
12. Shin S, et al. (2014) Glycogen synthase kinase-3β positively regulates protein synthesisand cell proliferation through the regulation of translation initiation factor 4E-binding protein 1. Oncogene 33(13):1690–1699.
13. Prescott DM, Bender MA (1962) Synthesis of RNA and protein during mitosis inmammalian tissue culture cells. Exp Cell Res 26:260–268.
14. Konrad CG (1963) Protein synthesis and Rna synthesis during mitosis in animal cells.J Cell Biol 19:267–277.
15. Coldwell MJ, et al. (2013) Phosphorylation of eIF4GII and 4E-BP1 in response to no-codazole treatment: A reappraisal of translation initiation during mitosis. Cell Cycle12(23):3615–3628.
16. Greenberg VL, Zimmer SG (2005) Paclitaxel induces the phosphorylation of the eu-karyotic translation initiation factor 4E-binding protein 1 through a Cdk1-dependentmechanism. Oncogene 24(30):4851–4860.
17. Feng H, Shuda M, Chang Y, Moore PS (2008) Clonal integration of a polyomavirus inhuman Merkel cell carcinoma. Science 319(5866):1096–1100.
18. Schrama D, Ugurel S, Becker JC (2012) Merkel cell carcinoma: Recent insights and newtreatment options. Curr Opin Oncol 24(2):141–149.
19. Chang Y, Moore PS (2012) Merkel cell carcinoma: A virus-induced human cancer.Annu Rev Pathol 7:123–144.
20. Spurgeon ME, Lambert PF (2013) Merkel cell polyomavirus: A newly discovered hu-man virus with oncogenic potential. Virology 435(1):118–130.
21. Shuda M, Kwun HJ, Feng H, Chang Y, Moore PS (2011) Human Merkel cell poly-omavirus small T antigen is an oncoprotein targeting the 4E-BP1 translation regula-tor. J Clin Invest 121(9):3623–3634.
22. Shuda M, Chang Y, Moore PS (2014) Merkel cell polyomavirus-positive Merkel cellcarcinoma requires viral small T-antigen for cell proliferation. J Invest Dermatol134(5):1479–1481.
23. Kwun HJ, et al. (2015) Restricted protein phosphatase 2A targeting by Merkel cellpolyomavirus small T antigen. J Virol 89(8):4191–4200.
24. Kwun HJ, et al. (2013) Merkel cell polyomavirus small T antigen controls viral repli-cation and oncoprotein expression by targeting the cellular ubiquitin ligase SCFFbw7.Cell Host Microbe 14(2):125–135.
25. Verhaegen ME, et al. (2014) Merkel cell polyomavirus small T antigen is oncogenic intransgenic mice. J Invest Dermatol, 10.1038/jid.2014.446.
26. Gingras AC, et al. (1999) Regulation of 4E-BP1 phosphorylation: A novel two-stepmechanism. Genes Dev 13(11):1422–1437.
27. Kanie T, et al. (2012) Genetic reevaluation of the role of F-box proteins in cyclin D1degradation. Mol Cell Biol 32(3):590–605.
28. Gingras AC, Kennedy SG, O’Leary MA, Sonenberg N, Hay N (1998) 4E-BP1, a repressorof mRNA translation, is phosphorylated and inactivated by the Akt(PKB) signalingpathway. Genes Dev 12(4):502–513.
29. Feldman ME, et al. (2009) Active-site inhibitors of mTOR target rapamycin-resistantoutputs of mTORC1 and mTORC2. PLoS Biol 7(2):e38.
30. Tyler RK, Shpiro N, Marquez R, Eyers PA (2007) VX-680 inhibits Aurora A and Aurora Bkinase activity in human cells. Cell Cycle 6(22):2846–2854.
31. Vassilev LT, et al. (2006) Selective small-molecule inhibitor reveals critical mitoticfunctions of human CDK1. Proc Natl Acad Sci USA 103(28):10660–10665.
32. Chung J, Kuo CJ, Crabtree GR, Blenis J (1992) Rapamycin-FKBP specifically blocksgrowth-dependent activation of and signaling by the 70 kd S6 protein kinases. Cell69(7):1227–1236.
33. Magnuson B, Ekim B, Fingar DC (2012) Regulation and function of ribosomal proteinS6 kinase (S6K) within mTOR signalling networks. Biochem J 441(1):1–21.
34. Vassilev LT (2006) Cell cycle synchronization at the G2/M phase border by reversibleinhibition of CDK1. Cell Cycle 5(22):2555–2556.
35. Pyronnet S, Pradayrol L, Sonenberg N (2000) A cell cycle-dependent internal ribosomeentry site. Mol Cell 5(4):607–616.
36. Kiick KL, Saxon E, Tirrell DA, Bertozzi CR (2002) Incorporation of azides into re-combinant proteins for chemoselective modification by the Staudinger ligation. ProcNatl Acad Sci USA 99(1):19–24.
37. Wang Q, et al. (2003) Bioconjugation by copper(I)-catalyzed azide-alkyne [3 + 2] cy-cloaddition. J Am Chem Soc 125(11):3192–3193.
38. Nielsen DA, Shapiro DJ (1986) Preparation of capped RNA transcripts using T7 RNApolymerase. Nucleic Acids Res 14(14):5936.
39. Stepinski J, Waddell C, Stolarski R, Darzynkiewicz E, Rhoads RE (2001) Synthesis andproperties of mRNAs containing the novel “anti-reverse” cap analogs 7-methyl(3′-O-methyl)GpppG and 7-methyl (3′-deoxy)GpppG. RNA 7(10):1486–1495.
40. Cencic R, et al. (2011) Reversing chemoresistance by small molecule inhibition of thetranslation initiation complex eIF4F. Proc Natl Acad Sci USA 108(3):1046–1051.
41. Mazroui R, Di Marco S, Kaufman RJ, Gallouzi IE (2007) Inhibition of the ubiquitin-proteasome system induces stress granule formation. Mol Biol Cell 18(7):2603–2618.
42. Stehelin D, Varmus HE, Bishop JM, Vogt PK (1976) DNA related to the transforming gene(s)of avian sarcoma viruses is present in normal avian DNA. Nature 260(5547):170–173.
43. Lane DP, Crawford LV (1979) T antigen is bound to a host protein in SV40-trans-formed cells. Nature 278(5701):261–263.
44. Linzer DI, Levine AJ (1979) Characterization of a 54K dalton cellular SV40 tumorantigen present in SV40-transformed cells and uninfected embryonal carcinoma cells.Cell 17(1):43–52.
45. Werness BA, Levine AJ, Howley PM (1990) Association of human papillomavirus types16 and 18 E6 proteins with p53. Science 248(4951):76–79.
46. DeCaprio JA, et al. (1988) SV40 large tumor antigen forms a specific complex with theproduct of the retinoblastoma susceptibility gene. Cell 54(2):275–283.
47. Chang HW, et al. (1997) Transformation of chicken cells by the gene encoding thecatalytic subunit of PI 3-kinase. Science 276(5320):1848–1850.
48. Moore PS, Chang Y (1998) Antiviral activity of tumor-suppressor pathways: Clues frommolecular piracy by KSHV. Trends Genet 14(4):144–150.
49. Shahbazian D, et al. (2006) The mTOR/PI3K and MAPK pathways converge on eIF4B tocontrol its phosphorylation and activity. EMBO J 25(12):2781–2791.
50. Wang X, et al. (2001) Regulation of elongation factor 2 kinase by p90(RSK1) and p70S6 kinase. EMBO J 20(16):4370–4379.
51. Wilker EW, et al. (2007) 14-3-3sigma controls mitotic translation to facilitate cytoki-nesis. Nature 446(7133):329–332.
52. Boussemart L, et al. (2014) eIF4F is a nexus of resistance to anti-BRAF and anti-MEKcancer therapies. Nature 513(7516):105–109.
53. Terasima T, Tolmach LJ (1963) Growth and nucleic acid synthesis in synchronouslydividing populations of HeLa cells. Exp Cell Res 30:344–362.
5882 | www.pnas.org/cgi/doi/10.1073/pnas.1505787112 Shuda et al.


![Review Article Regulation of the Ras-MAPK and PI3K-mTOR ... · Cytosolic kinase SK Tumor suppressor/oncogenic isoforms, activates/inhibits mTORC. Breast, lung [ , ] Cytosolic kinase](https://img.pdfslide.us/doc/110x75/6080c0d51308b03b786a8817/review-article-regulation-of-the-ras-mapk-and-pi3k-mtor-cytosolic-kinase-sk.jpg)