Embed Size (px)
Citation preview

CD EquisearchPv
Equities Derivatives Commoditie
Aegis Logistics Ltd.
No. of shares (m) 334.0
Mkt cap (Rs crs/$m) 6328/977.7
Current price (Rs/$) 189/2.9
Price target (Rs/$) 224/3.5
52 W H/L (Rs.) 219/112
Book Value (Rs/$) 18/0.3
Beta 1.3
Daily volume (avg. monthly) 198750
P/BV (FY18e/19e) 7.1/6.2
EV/EBITDA (FY18e/19e) 25.0/20.3
P/E (FY18e/19e) 43.1/33.8
EPS growth (FY17/18e/19e) 6.1/22.1/27.6
OPM (FY17/18e/19e) 5.3/4.4/4.2
ROE (FY17/18e/19e) 22.3/19.9/19.7
ROCE(FY17/18e/19e) 18.1/16.7/16.6
D/E ratio (FY17/18e/19e) 0.5/0.3/0.2
BSE Code 500003
NSE Code AEGISCHEM
Bloomberg AGIS IN
Reuters AEGS.BO
Shareholding pattern %
Promoters 61.5
MFs / Banks / FIIs/FIs 2.6
Foreign Portfolio Investors 12.3
Govt. Holding 0.0
Public & Others 23.6
Total 100.0
As on March 31, 2017
Recommendation
ACCUMULATE
Phone: + 91 (33) 4488 0055
E- mail: [email protected]
Consolidated (Rs crs)
Income from operations
Other Income
EBITDA (other income included)
PAT after MI and EO EPS(Rs)
EPS growth (%)
Pvt Ltd
ities Distribution of Mutual Funds Dist
FY15
FY16
FY17
3916.00 2213.22 3932.81
42.25 8.44 5.21
185.69 193.78 212.14
79.04 113.33 120.26
2.37 3.39 3.60
29.5 43.4 6.1
Quarterly Highlights • In the last quarter, Aegis posted a rise of 29.9% in LPG volume
400,000 MT vs 308,000 MT in Q4FY16 and 15.3% rise in LPG volume
(distribution) - 15,000 MT (vs 13,000 MT). Segment revenue went up by
207.4% y-o-y. The annual revenue for the liquid
Rs 153.88 crs ($22.9m) and Rs 3778.93 crs ($563.3m)
• Even with a hefty growth of 190.1% in revenue in
it reported PAT of Rs 29.77 crs ($4.4m); a de growth of 5.6% over the same
period last year mainly on account of low gas division margins
marred OPM to 4.1% in the last quarter vs 11.5% in Q4FY16.
• Aegis Logistics has entered into a Share Subscription Agreement with its
wholly owned subsidiary, Hindustan Aegis LPG Company Ltd. (HALPG)
and Itochu Petroleum Co. (Singapore) Pte Ltd., a subsidiary
Corporation of Japan for expansion of LPG business in India; for a total
amount of Rs 250 crs ($38.6m), representing 19.7%
will be used for developing two LPG import terminal
the west coast of India. The deal is expected to be completed by July 2017.
• Utilization capacity at its Pipavav terminal still remains weak
as witnessed in the last few quarters, on account of discontinuation of
alcohol movement mainly from a client in Brazil, coupled with les
chemical traffic. To get more petroleum traffic into Pipavav, Aegis has
secured an agreement in principle with Gujarat Pipavav Port Ltd. for
construction of railway gantry to handle petroleum in the area which
should revive the capacity utilization and revenue
• The stock currently trades at 43.1x FY18e EPS of Rs 4.39 and 33.8x FY19e
EPS of Rs 5.61. The oil, gas and chemical logistics business in India
continues to show good potential, and Aegis
facilities and continuing its incessant expansion plans, is well poised to take
advantage of this growth. Implementation of GST gives a positive outlook
for the logistics industry. JV with ITOCHU
terminals and strong margins should bolster its reven
(24.8% CAGR over next two years). Robust growth potential coupled with
low debt (D/E ~0.5) and industry leading return on capital support
premium valuation. However, underperformance of Pipavav
terminal may have a dampening effect. O
previous “Accumulate” rating with a target price of Rs 224 (previous target
Rs 167) based on 40x FY19e earnings over a period of 6 to 9 months
(peg:1.6).
July 6, 2017
istribution of Life Insurance
FY18e
FY19e
5746.77 7457.16
6.62 7.17
261.99 323.59
146.80 187.32
4.39 5.61
22.1 27.6
In the last quarter, Aegis posted a rise of 29.9% in LPG volume (logistics) -
400,000 MT vs 308,000 MT in Q4FY16 and 15.3% rise in LPG volume
15,000 MT (vs 13,000 MT). Segment revenue went up by
liquid and gas division stood at
($563.3m) respectively.
revenue in Q4FY17 on a y-o-y basis,
; a de growth of 5.6% over the same
last year mainly on account of low gas division margins which
d OPM to 4.1% in the last quarter vs 11.5% in Q4FY16.
Aegis Logistics has entered into a Share Subscription Agreement with its
wholly owned subsidiary, Hindustan Aegis LPG Company Ltd. (HALPG)
and Itochu Petroleum Co. (Singapore) Pte Ltd., a subsidiary of ITOCHU
for expansion of LPG business in India; for a total
representing 19.7% stake in HALPG which
LPG import terminals, most likely along
is expected to be completed by July 2017.
Pipavav terminal still remains weak- below 20%,
as witnessed in the last few quarters, on account of discontinuation of
alcohol movement mainly from a client in Brazil, coupled with less
chemical traffic. To get more petroleum traffic into Pipavav, Aegis has
secured an agreement in principle with Gujarat Pipavav Port Ltd. for
construction of railway gantry to handle petroleum in the area which
evenue of the terminal.
43.1x FY18e EPS of Rs 4.39 and 33.8x FY19e
The oil, gas and chemical logistics business in India
, and Aegis by operating its established
ontinuing its incessant expansion plans, is well poised to take
advantage of this growth. Implementation of GST gives a positive outlook
for the logistics industry. JV with ITOCHU for funding LPG import
should bolster its revenue and earnings
(24.8% CAGR over next two years). Robust growth potential coupled with
low debt (D/E ~0.5) and industry leading return on capital support
premium valuation. However, underperformance of Pipavav liquid
nal may have a dampening effect. On balance, we maintain our
previous “Accumulate” rating with a target price of Rs 224 (previous target
over a period of 6 to 9 months

CD EquisearchPvt Ltd
Equities Derivatives Commoditie
Outlook & Recommendation
Indian Logistics Industry
E-commerce penetration, economy revival, proposed GST implementation
India”, National Integrated Logistic Policy, 100% FDI in warehouses and food storage facilities, etc.
logistics industry to grow at a CAGR of 15-20% during FY16
India’s GDP growth, it expects the logistics indust
economic activity.
CARE posits that the logistics industry will get a leg up from revival of manufacturing and mining activities, further helping
the companies to have better credibility. It expects
proposed GST implementation which would lead to enormous savings in terms of time and money for
services; however, the problem of persisting high logistic costs could only be resolved by development of logistics
infrastructure.
Source: CARE Ratings Source: CARE Ratings
CARE believes that the long-term outlook of the companies operating in Indian logistics industry is favorable on expectation
of implementation of GST, successful commissioning of the infrastructure projects (especially
increase in participation and investment of international logistics players and adoption of global standards of tracking and
tracing mechanism. It expects that steady growth in consumer durables, FMCG, pharmaceutical, engineer
industries will keep the near-term outlook for the logistics companies stable.
investments from international logistic players through FDI, JVs or acquisitions, which in turn
march towards the developed market standards of LPI.
According to the World Bank’s bi-annual measure of international supply chain efficiency, called Logistics Performance
Index (LPI), which analyses countries across six parameters
quality of logistics services, efficiency of customs and border management clearance, ease of arranging competitively priced
shipments, ability to track and trace consignments and frequenc
or expected delivery time, India’s ranking has jumped from 54 in 2014 to 35 in 2016
economies like Portugal and New Zealand, demonstrating GOI’s commitment t
Expansion Plans
In light of increased demand for LPG driven by increasing penetration into the rural areas, Aegis is implementing two fully
refrigerated tanks (part of LPG terminal) with total static capacity of 25,
utilization at Haldia. The capex of Rs 250 crs ($38.6m)
(also at Haldia) has been financed through inte
of the current fiscal. Aegis has also signed a MoU of 20 years with a large public sector unit at the current market through
rates as the anchor customer for use of this terminal.
2
CD EquisearchPvt Ltd
ities Distribution of Mutual Funds Dist
commerce penetration, economy revival, proposed GST implementation coupled with government initiatives like “Make in
India”, National Integrated Logistic Policy, 100% FDI in warehouses and food storage facilities, etc.
20% during FY16-FY20, reckons CARE Ratings. Furthermore, with respect to
the logistics industry to grow at 1-1.5x as logistics business is directly correlated with
industry will get a leg up from revival of manufacturing and mining activities, further helping
the companies to have better credibility. It expects logistics costs to trim by upto 20% from the current levels, thanks to the
ed GST implementation which would lead to enormous savings in terms of time and money for
persisting high logistic costs could only be resolved by development of logistics
Source: CARE Ratings Source: CARE Ratings Source: CARE Ratings
term outlook of the companies operating in Indian logistics industry is favorable on expectation
of implementation of GST, successful commissioning of the infrastructure projects (especially in road, railways and ports),
increase in participation and investment of international logistics players and adoption of global standards of tracking and
tracing mechanism. It expects that steady growth in consumer durables, FMCG, pharmaceutical, engineer
term outlook for the logistics companies stable. Furthermore, the se
from international logistic players through FDI, JVs or acquisitions, which in turn would propel
march towards the developed market standards of LPI.
annual measure of international supply chain efficiency, called Logistics Performance
countries across six parameters viz. quality of trade and transport infrastructure, competence and
quality of logistics services, efficiency of customs and border management clearance, ease of arranging competitively priced
shipments, ability to track and trace consignments and frequency with which shipments reach consignees within scheduled
India’s ranking has jumped from 54 in 2014 to 35 in 2016 (see table above), ahead of some leading
economies like Portugal and New Zealand, demonstrating GOI’s commitment to make it easy to do business in India.
increased demand for LPG driven by increasing penetration into the rural areas, Aegis is implementing two fully
with total static capacity of 25,000 MT and throughput capacity of 2.5m MT at full
($38.6m) for LPG terminal at Haldia and Rs 25 crs ($3.9m)
has been financed through internal accruals and the projects are expected to be completed by second quarter
of the current fiscal. Aegis has also signed a MoU of 20 years with a large public sector unit at the current market through
rates as the anchor customer for use of this terminal.
2
CD EquisearchPvt Ltd
istribution of Life Insurance
government initiatives like “Make in
India”, National Integrated Logistic Policy, 100% FDI in warehouses and food storage facilities, etc. would result in the Indian
Furthermore, with respect to
1.5x as logistics business is directly correlated with
industry will get a leg up from revival of manufacturing and mining activities, further helping
logistics costs to trim by upto 20% from the current levels, thanks to the
ed GST implementation which would lead to enormous savings in terms of time and money for delivery of goods and
persisting high logistic costs could only be resolved by development of logistics
Source: CARE Ratings
term outlook of the companies operating in Indian logistics industry is favorable on expectation
in road, railways and ports),
increase in participation and investment of international logistics players and adoption of global standards of tracking and
tracing mechanism. It expects that steady growth in consumer durables, FMCG, pharmaceutical, engineering and other
Furthermore, the sector would also attract
would propel the industry to
annual measure of international supply chain efficiency, called Logistics Performance
viz. quality of trade and transport infrastructure, competence and
quality of logistics services, efficiency of customs and border management clearance, ease of arranging competitively priced
y with which shipments reach consignees within scheduled
(see table above), ahead of some leading
o make it easy to do business in India.
increased demand for LPG driven by increasing penetration into the rural areas, Aegis is implementing two fully
000 MT and throughput capacity of 2.5m MT at full
($3.9m) for LPG bottling plant
expected to be completed by second quarter
of the current fiscal. Aegis has also signed a MoU of 20 years with a large public sector unit at the current market throughput

CD EquisearchPvt Ltd
Equities Derivatives Commoditie
[
The company has almost completed debottlenecking of Mumbai LPG terminal
LPG pipeline which will result in the same static capacity of
(incremental 0.4 m MT). The project is expected to cost Rs 15 crs
be completed by H1FY18. The brownfield capacity expansion at Pipavav with throughput
Rs 75 crs ($11.6m) is expected to be completed by the end of H1
new customer relationships.
Greenfield liquid terminal expansion at Kandla Port wi
greenfield expansion at Mangalore Port with a capacity of 25,000 KL
FY18 and are likely to grow revenues for the liquid division. Brownf
of 25,000 KL - cost of Rs 15 crs ($2.3m) financed through internal accruals wa
first quarter of the current fiscal.
Unrivalled expansion plans of Aegis will doubtlessly buttress its expertise in terminalling and handling of liquids and gases
help it build a necklace of terminals around the coastline of India. Higher rates
of the growing oil, gas and chemical sector of the country.
Financials & Valuations
Aegis recorded a hefty growth of 77.7% in its income from operations
9.8% in its liquid terminal division because of underperformance of Pipavav liquid terminal. The liquid terminal saw an EBIT
Rs 74.82 crs/$11.2 m (decline by 13.5% y-o-y) while gas terminal posted a rise of 28.4% (Rs 144.15 crs/$21.5 m vs Rs 112.30
crs/$17.2 m in FY16). LPG throughput volume was 1.35m MT vs 0.979m MT in FY16
recorded a humungous growth of 101% y-o-y. PAT increased by 6.1% to Rs 120.26 crs ($17.9m) from the previous year figure of
Rs 113.33 crs ($17.3m).
Aegis expects two new capacities- Pipavav expansion in the gas terminal division of six new LPG spheres with a total static
capacity of 10,200 MT (to be commissioned by H1FY18) and the Haldia project to drive revenue growth from the next quar
the current fiscal. After having followed aggressive expansion plans coupled with proposed deal with ITOCHU, we expect
Aegis to boast of increase in throughput volumes, revenues and margins over the next two years
segment should increase at a CAGR of 15.0% and 38.6%
3
CD EquisearchPvt Ltd
ities Distribution of Mutual Funds Dist
has almost completed debottlenecking of Mumbai LPG terminal by connecting it to the Uran
n the same static capacity of 20,000 MT but increased throughput capacity
(incremental 0.4 m MT). The project is expected to cost Rs 15 crs ($2.3m) which will be funded through internal accruals and will
be completed by H1FY18. The brownfield capacity expansion at Pipavav with throughput capacity of ~ 0.8m MT and a capex of
to be completed by the end of H1FY18. Throughput volume is likely to grow through existing and
Greenfield liquid terminal expansion at Kandla Port with a capacity of 100,000 KL - capex of Rs 75 crs
with a capacity of 25,000 KL- capex of Rs 18 crs ($2.8m) are expected to be completed by
are likely to grow revenues for the liquid division. Brownfield liquid terminal expansion at Haldia Port
nced through internal accruals was expected to be commissioned by the end of the
Unrivalled expansion plans of Aegis will doubtlessly buttress its expertise in terminalling and handling of liquids and gases
help it build a necklace of terminals around the coastline of India. Higher rates of capacity utilization will help it take advantage
of the growing oil, gas and chemical sector of the country.
Aegis recorded a hefty growth of 77.7% in its income from operations– 85% growth in gas terminal division and a de growt
9.8% in its liquid terminal division because of underperformance of Pipavav liquid terminal. The liquid terminal saw an EBIT
y) while gas terminal posted a rise of 28.4% (Rs 144.15 crs/$21.5 m vs Rs 112.30
crs/$17.2 m in FY16). LPG throughput volume was 1.35m MT vs 0.979m MT in FY16- a rise of 37.9%. Sourcing volume for gas
y. PAT increased by 6.1% to Rs 120.26 crs ($17.9m) from the previous year figure of
Pipavav expansion in the gas terminal division of six new LPG spheres with a total static
capacity of 10,200 MT (to be commissioned by H1FY18) and the Haldia project to drive revenue growth from the next quar
the current fiscal. After having followed aggressive expansion plans coupled with proposed deal with ITOCHU, we expect
Aegis to boast of increase in throughput volumes, revenues and margins over the next two years-
nt should increase at a CAGR of 15.0% and 38.6% with PBT rising at a CAGR of 23.7%.
3
CD EquisearchPvt Ltd
istribution of Life Insurance
by connecting it to the Uran-Chakan/Shikrapur
increased throughput capacity of 1.1m MT
which will be funded through internal accruals and will
capacity of ~ 0.8m MT and a capex of
FY18. Throughput volume is likely to grow through existing and
capex of Rs 75 crs ($11.6m) along with
are expected to be completed by
ield liquid terminal expansion at Haldia Port with capacity
s expected to be commissioned by the end of the
Unrivalled expansion plans of Aegis will doubtlessly buttress its expertise in terminalling and handling of liquids and gases and
of capacity utilization will help it take advantage
85% growth in gas terminal division and a de growth of
9.8% in its liquid terminal division because of underperformance of Pipavav liquid terminal. The liquid terminal saw an EBIT of
y) while gas terminal posted a rise of 28.4% (Rs 144.15 crs/$21.5 m vs Rs 112.30
a rise of 37.9%. Sourcing volume for gas
y. PAT increased by 6.1% to Rs 120.26 crs ($17.9m) from the previous year figure of
Pipavav expansion in the gas terminal division of six new LPG spheres with a total static
capacity of 10,200 MT (to be commissioned by H1FY18) and the Haldia project to drive revenue growth from the next quarter of
the current fiscal. After having followed aggressive expansion plans coupled with proposed deal with ITOCHU, we expect
revenues from liquid and gas

CD EquisearchPvt Ltd
Equities Derivatives Commoditie
Trade receivables increased drastically from Rs 97.21 crs ($14.7 m) in FY16
in amount of gas sold from 0.5m tonnes in FY16 to `~1m tonne in FY17, resulting in back
credit for LPG sourcing business resulted in a huge increase in short term bor
46.46 crs/$7 m), thus increasing the total debt by 52.1%. The company is planning to set up two LPG terminals along the west
coast of the country- negotiations for the same are still on with marketing and oil
stations in 7 states and network of 97 commercial distributors in 8 states in LPG segment along with terminals at key ports
Mumbai, Kochi, Haldia, Pipav, and road, rail and pipeline connectivity under the liquid
integrated supply chain management.
The stock currently trades at 43.1x FY18e EPS of Rs 4.39 and 33.8x FY19e EPS of Rs 5.61
build a nationwide port infrastructure and distribut
energy demand can pave way for higher profitability
for resurrecting capacity utilization in Pipavav
value chain in the gas division starting from sourcing, terminalling to retail distribution of LPG along with several project
line for both liquid and gas terminals- greenfield expansion at Haldia, brownfield expansion at Pipavav, debottlenecking of
Mumbai terminal, to name a few, should have a
LPG business and help become a leading LPG sourcing player in India.
“Accumulate” with a target price of Rs 224 (previous
(peg :1.6). For more info, refer to our December repo
4
CD EquisearchPvt Ltd
ities Distribution of Mutual Funds Dist
Trade receivables increased drastically from Rs 97.21 crs ($14.7 m) in FY16 to Rs 705.86 crs ($108.8 m) in FY17 because of rise
in amount of gas sold from 0.5m tonnes in FY16 to `~1m tonne in FY17, resulting in back-to-back credit of one month. Buyer’s
credit for LPG sourcing business resulted in a huge increase in short term borrowings by 281.9% (Rs 177.44 crs/$ 27.4 m vs Rs
46.46 crs/$7 m), thus increasing the total debt by 52.1%. The company is planning to set up two LPG terminals along the west
negotiations for the same are still on with marketing and oil companies. With a network of 106 auto gas
stations in 7 states and network of 97 commercial distributors in 8 states in LPG segment along with terminals at key ports
Mumbai, Kochi, Haldia, Pipav, and road, rail and pipeline connectivity under the liquid segment, Aegis has a strong
43.1x FY18e EPS of Rs 4.39 and 33.8x FY19e EPS of Rs 5.61. Aegis’ unrivalled expansion plans to
nationwide port infrastructure and distribution network in the oil and gas sector coupled with the country’s growing
energy demand can pave way for higher profitability over the next two years. Its negotiation with Gujarat Pipavav Port Ltd.
in Pipavav liquid terminal would bear fruit but not before FY19.
value chain in the gas division starting from sourcing, terminalling to retail distribution of LPG along with several project
greenfield expansion at Haldia, brownfield expansion at Pipavav, debottlenecking of
should have a positive impact on its business. Its JV with ITOCHU will help it expand its
LPG sourcing player in India. On balance, we reaffirm our previous rating of
“Accumulate” with a target price of Rs 224 (previous target Rs 167) based on FY19e earnings over a per
(peg :1.6). For more info, refer to our December report.
4
CD EquisearchPvt Ltd
istribution of Life Insurance
to Rs 705.86 crs ($108.8 m) in FY17 because of rise
back credit of one month. Buyer’s
rowings by 281.9% (Rs 177.44 crs/$ 27.4 m vs Rs
46.46 crs/$7 m), thus increasing the total debt by 52.1%. The company is planning to set up two LPG terminals along the west
companies. With a network of 106 auto gas
stations in 7 states and network of 97 commercial distributors in 8 states in LPG segment along with terminals at key ports-
segment, Aegis has a strong
Aegis’ unrivalled expansion plans to
ion network in the oil and gas sector coupled with the country’s growing
over the next two years. Its negotiation with Gujarat Pipavav Port Ltd.
liquid terminal would bear fruit but not before FY19. Its complete logistics
value chain in the gas division starting from sourcing, terminalling to retail distribution of LPG along with several projects in
greenfield expansion at Haldia, brownfield expansion at Pipavav, debottlenecking of
Its JV with ITOCHU will help it expand its
On balance, we reaffirm our previous rating of
FY19e earnings over a period of 6 to 9 months
CD EquisearchPvt Ltd
Equities Derivatives Commoditie
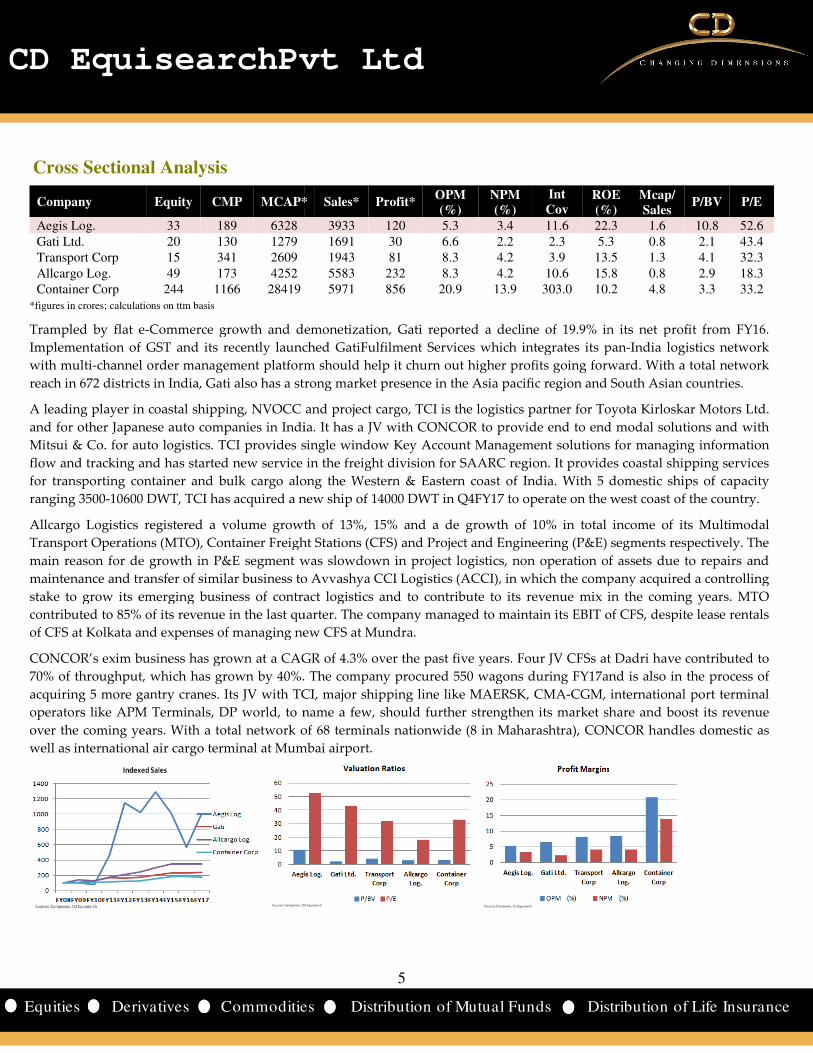
Cross Sectional Analysis
Company Equity CMP MCAP*
Aegis Log. 33 189 6328
Gati Ltd. 20 130 1279
Transport Corp 15 341 2609
Allcargo Log. 49 173 4252
Container Corp 244 1166 28419 *figures in crores; calculations on ttm basis
Trampled by flat e-Commerce growth and demonetization, Gati reported a decline of 19.9% in its net profit from FY16.
Implementation of GST and its recently launched GatiFulfilment Services which integrates its pan
with multi-channel order management platform should help it churn out
reach in 672 districts in India, Gati also has a strong market presence in the Asia pacific
A leading player in coastal shipping, NVOCC and project cargo, TCI is the logistics partner for Toyota Kirloskar Motors Ltd.
and for other Japanese auto companies in India. It has a JV with CONCOR to provide end to end modal solutions and with
Mitsui & Co. for auto logistics. TCI provides single window
flow and tracking and has started new service in the freight division for SAARC region.
for transporting container and bulk cargo along th
ranging 3500-10600 DWT, TCI has acquired a new ship of 14000 DWT in
Allcargo Logistics registered a volume growth of 13%, 15
Transport Operations (MTO), Container Freight S
main reason for de growth in P&E segment was slowdown in project logistics,
maintenance and transfer of similar business to
stake to grow its emerging business of contract logistics and to contribute to its revenue mix in t
contributed to 85% of its revenue in the last quarter. The company managed to maintain its EBIT of CFS, despite lease rentals
of CFS at Kolkata and expenses of managing new CFS at Mundra.
CONCOR’s exim business has grown at a CAGR of
70% of throughput, which has grown by 40%. The company procured 550 wagons during FY17and is also in the process of
acquiring 5 more gantry cranes. Its JV with TCI, major shipping lin
operators like APM Terminals, DP world, to name a few, should further strengthen its market share and boost its revenue
over the coming years. With a total network of 68 terminals nationwide (8 in Maharashtra), CONCOR handles domestic as
well as international air cargo terminal at Mumbai airport.
5
CD EquisearchPvt Ltd
ities Distribution of Mutual Funds Dist
MCAP* Sales* Profit* OPM (%)
NPM (%)
Int Cov
ROE (%)
3933 120 5.3 3.4 11.6 22.3
1691 30 6.6 2.2 2.3 5.3
1943 81 8.3 4.2 3.9 13.5
5583 232 8.3 4.2 10.6 15.8
5971 856 20.9 13.9 303.0 10.2
Commerce growth and demonetization, Gati reported a decline of 19.9% in its net profit from FY16.
Implementation of GST and its recently launched GatiFulfilment Services which integrates its pan
order management platform should help it churn out higher profits going forward. With a total network
reach in 672 districts in India, Gati also has a strong market presence in the Asia pacific region and South Asian countries.
l shipping, NVOCC and project cargo, TCI is the logistics partner for Toyota Kirloskar Motors Ltd.
and for other Japanese auto companies in India. It has a JV with CONCOR to provide end to end modal solutions and with
rovides single window Key Account Management solutions for managing information
flow and tracking and has started new service in the freight division for SAARC region. It provides coastal shipping services
for transporting container and bulk cargo along the Western & Eastern coast of India. With 5 domestic ships of capacity
has acquired a new ship of 14000 DWT in Q4FY17 to operate on the west coast of the country.
growth of 13%, 15% and a de growth of 10% in total income of its Multimodal
Container Freight Stations (CFS) and Project and Engineering (P&E) s
was slowdown in project logistics, non operation of assets
transfer of similar business to Avvashya CCI Logistics (ACCI), in which the company acquired a controlling
stake to grow its emerging business of contract logistics and to contribute to its revenue mix in t
contributed to 85% of its revenue in the last quarter. The company managed to maintain its EBIT of CFS, despite lease rentals
of CFS at Kolkata and expenses of managing new CFS at Mundra.
CONCOR’s exim business has grown at a CAGR of 4.3% over the past five years. Four JV CFSs at Dadri have contributed to
70% of throughput, which has grown by 40%. The company procured 550 wagons during FY17and is also in the process of
acquiring 5 more gantry cranes. Its JV with TCI, major shipping line like MAERSK, CMA-CGM, international port terminal
operators like APM Terminals, DP world, to name a few, should further strengthen its market share and boost its revenue
With a total network of 68 terminals nationwide (8 in Maharashtra), CONCOR handles domestic as
well as international air cargo terminal at Mumbai airport.
5
CD EquisearchPvt Ltd
istribution of Life Insurance
ROE (%)
Mcap/ Sales
P/BV P/E
22.3 1.6 10.8 52.6
5.3 0.8 2.1 43.4
13.5 1.3 4.1 32.3
15.8 0.8 2.9 18.3
10.2 4.8 3.3 33.2
Commerce growth and demonetization, Gati reported a decline of 19.9% in its net profit from FY16.
Implementation of GST and its recently launched GatiFulfilment Services which integrates its pan-India logistics network
profits going forward. With a total network
region and South Asian countries.
l shipping, NVOCC and project cargo, TCI is the logistics partner for Toyota Kirloskar Motors Ltd.
and for other Japanese auto companies in India. It has a JV with CONCOR to provide end to end modal solutions and with
Key Account Management solutions for managing information
rovides coastal shipping services
With 5 domestic ships of capacity
Q4FY17 to operate on the west coast of the country.
growth of 10% in total income of its Multimodal
) segments respectively. The
tion of assets due to repairs and
), in which the company acquired a controlling
stake to grow its emerging business of contract logistics and to contribute to its revenue mix in the coming years. MTO
contributed to 85% of its revenue in the last quarter. The company managed to maintain its EBIT of CFS, despite lease rentals
4.3% over the past five years. Four JV CFSs at Dadri have contributed to
70% of throughput, which has grown by 40%. The company procured 550 wagons during FY17and is also in the process of
CGM, international port terminal
operators like APM Terminals, DP world, to name a few, should further strengthen its market share and boost its revenue
With a total network of 68 terminals nationwide (8 in Maharashtra), CONCOR handles domestic as

CD EquisearchPvt Ltd
Equities Derivatives Commoditie
Financials
Consolidated Quarterly Results
Q4FY17
Income From Operations 1267.78
Other Income 1.43
Total Income 1269.21
Total Expenditure 1215.85EBITDA (other income
included) 53.36
Interest 4.09
Depreciation 5.95
PBT 43.32
Tax 11.15
PAT 32.17
Minority Interest 2.40
PAT after MI 29.77
EO -
Adjusted Net Profit 29.77
EPS(Rs) 0.89
Segment Results
Q4FY17
Segment Revenue
Liquid Terminal Division 39.81
Gas Terminal Division 1227.97
Segment Revenue 1267.78
Segment EBIT
Liquid Terminal Division 20.70
Gas Terminal Division 36.01
Sub Total 56.71
Finance Cost 4.09
Other Un-allocable Expenditure (net) 9.93
Interest Income 0.63
PBT 43.32
6
CD EquisearchPvt Ltd
ities Distribution of Mutual Funds Dist
Consolidated Quarterly Results Figures in Rs crs
Q4FY17 Q4FY16 % chg. FY17 FY16
1267.78 436.97 190.1 3932.81 2213.22
1.43 2.60 -45.0 5.21 8.44
1269.21 439.57 188.7 3938.02 2221.65
1215.85 386.73 214.4 3725.88 2027.88
53.36 52.84 1.0 212.14 193.78
4.09 4.38 -6.6 16.14 17.68
5.95 6.03 -1.3 24.30 23.42
43.32 42.43 2.1 171.70 152.67
11.15 8.47 31.6 37.70 26.53
32.17 33.96 -5.3 134.00 126.14
2.40 2.42 -0.8 13.74 12.81
29.77 31.54 -5.6 120.26 113.33
- - - -
29.77 31.54 -5.6 120.26 113.33
0.89 0.94 -5.6 3.60 3.39
Figures in Rs crs
Q4FY17 Q4FY16 % chg. FY17 FY16
39.81 37.50 6.2 153.88 170.60
1227.97 399.47 207.4 3778.93 2042.62
1267.78 436.97 190.1 3932.81 2213.22
20.70 16.19 27.9 74.82 86.50
36.01 39.44 -8.7 144.15 112.30
56.71 55.63 1.9 218.97 198.80
4.09 4.38 -6.6 16.14 17.68
9.93 10.13 -2.0 33.82 33.94
0.63 1.31 -51.9 2.69 5.49
43.32 42.43 2.1 171.70 152.67
6
CD EquisearchPvt Ltd
istribution of Life Insurance
Figures in Rs crs
% chg.
77.7
-38.2
77.3
83.7
9.5
-8.7
3.7
12.5
42.1
6.2
7.3
6.1
-
6.1
6.1
Figures in Rs crs
% chg.
-9.8
85.0
77.7
-13.5
28.4
10.1
-8.7
-0.4
-51.0
12.5

CD EquisearchPvt Ltd
Equities Derivatives Commoditie
Financials
Consolidated Income Statement
Income From Operations
Growth (%)
Other Income
Total Income
Total Expenditure
EBITDA (other income included)
Interest
Depreciation
PBT
Tax
PAT
Minority Interest
PAT after MI
EO
Adjusted Net Profit
EPS (Rs)
Segment Results
Segment Revenue
Liquid Terminal Division
Gas Terminal Division
Segment Revenue
Segment EBIT
Liquid Terminal Division
Gas Terminal Division
Sub Total
Finance Cost
Other Unallocable Exp. (net)
Interest Income
PBT
7
CD EquisearchPvt Ltd
ities Distribution of Mutual Funds Dist
Consolidated Income Statement Figures in Rs crs
FY15 FY16 FY17 FY18e FY19e
3916.00 2213.22 3932.81 5746.77 7457.16
-22.2 -43.5 77.7 46.1
42.25 8.44 5.21 6.62
Total Income 3958.25 2221.65 3938.02 5753.39 7464.32
Total Expenditure 3772.57 2027.88 3725.88 5491.40 7140.73
EBITDA (other income included) 185.69 193.78 212.14 261.99 323.59
20.50 17.68 16.14 18.87 18.34
22.96 23.42 24.30 33.55 42.80
PBT 142.23 152.67 171.70 209.57 262.46
Tax 29.91 26.53 37.70 46.11 57.74
PAT 112.31 126.14 134.00 163.47 204.72
8.90 12.81 13.74 16.67 17.39
103.41 113.33 120.26 146.80 187.32
24.37 - - -
Adjusted Net Profit 79.04 113.33 120.26 146.80 187.32
EPS (Rs) 2.37 3.39 3.60 4.39
Segment Results Figures in Rs crs
FY15 FY16 FY17 FY18e
153.40 170.60 153.88 169.55
3762.60 2042.62 3778.93 5577.21
3916.00 2213.22 3932.81 5746.77
81.85 86.50 74.82 83.08
71.79 112.30 144.15 189.63
153.64 198.80 218.97 272.71
20.50 17.68 16.14 18.87
-0.87 33.94 33.82 48.85
8.21 5.49 2.69 4.58
142.23 152.67 171.70 209.57
7
CD EquisearchPvt Ltd
istribution of Life Insurance
Figures in Rs crs
FY19e
7457.16
29.8
7.17
7464.32
7140.73
323.59
18.34
42.80
262.46
57.74
204.72
17.39
187.32
-
187.32
5.61
Figures in Rs crs
FY19e
203.48
7253.68
7457.16
103.77
246.63
350.40
18.34
74.57
4.97
262.46

CD EquisearchPvt Ltd
Equities Derivatives Commoditie
Consolidated Balance Sheet
Sources of Funds
Share Capital
Reserves
Total Shareholders' Funds
Minority Interest
Long Term Debt
Total Liabilities
Application of Funds
Gross Block
Less: Accumulated Depreciation
Net Block
Capital Work in Progress
Investments
Current Assets, Loans and Advances
Inventory
Trade receivables
Cash and Bank Short term loans (inc. other current assets)
Total CA
Current Liabilities
Provisions-Short term
Total Current Liabilities
Net Current Assets
Net Deferred Tax Liability
Net long term assets ( net of liabilities)
Total Assets
*estimated
8
CD EquisearchPvt Ltd
ities Distribution of Mutual Funds Dist
Figures in Rs crs
FY15 FY16 FY17 FY18e
33.40 33.40 33.40 33.40
393.93 471.09 568.75 853.38
427.34 504.49 602.16 886.79
26.44 39.25 28.53 95.05
131.52 109.11 77.45 46.45
585.29 652.86 708.14 1028.28
667.73 708.84 730.72* 1229.15
213.88 237.10 261.40 294.95
453.86 471.74 469.32 934.20
33.93 73.37 314.43 30.00
21.28 0.36 0.19 0.19
Current Assets, Loans and Advances
20.37 11.53 21.77 32.76
201.17 97.21 705.86 1086.14
105.40 96.70 60.54 49.50
33.93 41.91 50.26 57.55
360.87 247.35 838.43 1225.94
309.61 194.89 965.22 1203.24
4.54 6.58 11.56 12.72
314.15 201.47 976.78 1215.95
46.72 45.88 -138.35 10.00
-18.93 -22.91 -27.60 -36.84
Net long term assets ( net of liabilities) 48.43 84.42 90.14 90.74
585.29 652.86 708.14 1028.28
8
CD EquisearchPvt Ltd
istribution of Life Insurance
Figures in Rs crs
FY19e
33.40
986.43
1019.83
112.44
15.45
1147.72
1259.15
337.74
921.41
200.00
0.19
43.75
1342.29
64.97
65.95
1516.96
1529.41
13.99
1543.40
-26.44
-37.74
90.30
1147.72
CD EquisearchPvt Ltd
Equities Derivatives Commoditie
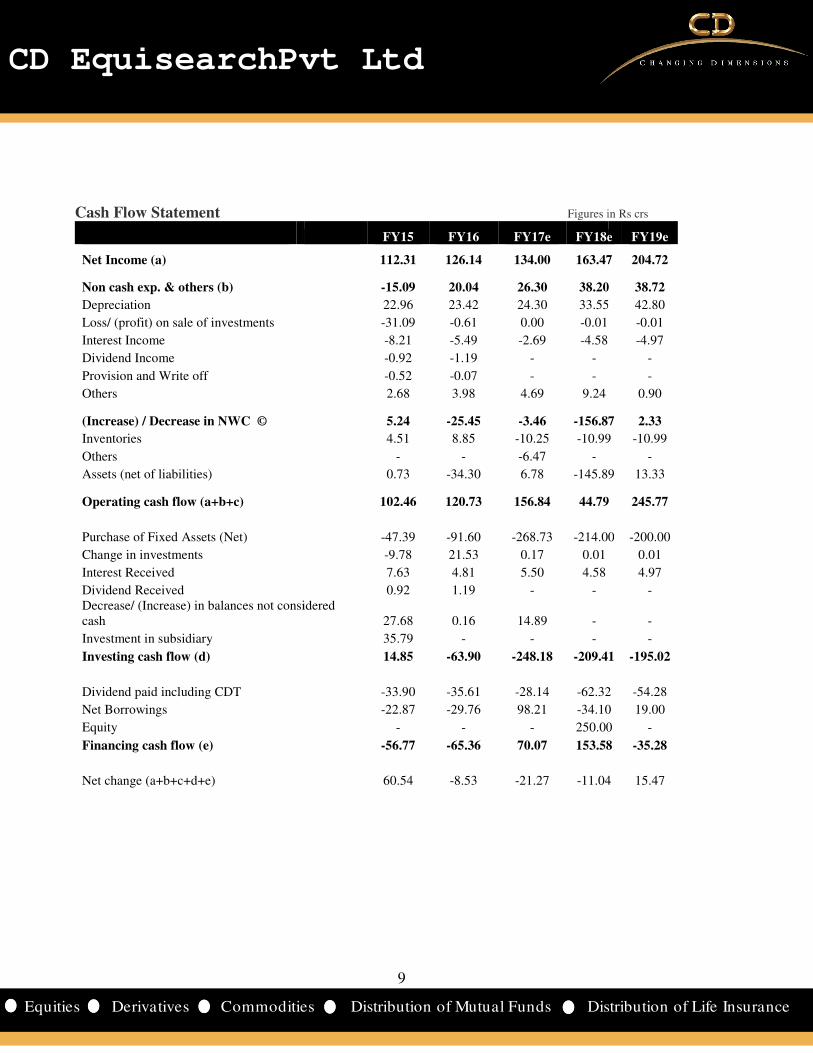
Cash Flow Statement
Net Income (a)
Non cash exp. & others (b)
Depreciation
Loss/ (profit) on sale of investments
Interest Income
Dividend Income
Provision and Write off
Others
(Increase) / Decrease in NWC ©
Inventories
Others
Assets (net of liabilities)
Operating cash flow (a+b+c)
Purchase of Fixed Assets (Net)
Change in investments
Interest Received
Dividend Received Decrease/ (Increase) in balances not considered cash
Investment in subsidiary
Investing cash flow (d)
Dividend paid including CDT
Net Borrowings
Equity
Financing cash flow (e)
Net change (a+b+c+d+e)
9
CD EquisearchPvt Ltd
ities Distribution of Mutual Funds Dist
Cash Flow Statement Figures in Rs crs
FY15 FY16 FY17e FY18e
112.31 126.14 134.00 163.47
-15.09 20.04 26.30 38.20
22.96 23.42 24.30 33.55
-31.09 -0.61 0.00 -0.01
-8.21 -5.49 -2.69 -4.58
-0.92 -1.19 - -
-0.52 -0.07 - -
2.68 3.98 4.69 9.24
5.24 -25.45 -3.46 -156.87
4.51 8.85 -10.25 -10.99
- - -6.47 -
0.73 -34.30 6.78 -145.89
102.46 120.73 156.84 44.79
-47.39 -91.60 -268.73 -214.00
-9.78 21.53 0.17 0.01
7.63 4.81 5.50 4.58
0.92 1.19 - - Decrease/ (Increase) in balances not considered
27.68 0.16 14.89 -
35.79 - - -
14.85 -63.90 -248.18 -209.41
-33.90 -35.61 -28.14 -62.32
-22.87 -29.76 98.21 -34.10
- - - 250.00
-56.77 -65.36 70.07 153.58
60.54 -8.53 -21.27 -11.04
9
CD EquisearchPvt Ltd
istribution of Life Insurance
Figures in Rs crs
FY18e FY19e
163.47 204.72
38.20 38.72
33.55 42.80
-0.01
-4.97
-
-
0.90
156.87 2.33
10.99 -10.99
-
145.89 13.33
44.79 245.77
214.00 -200.00
0.01
4.97
-
-
-
209.41 -195.02
62.32 -54.28
34.10 19.00
250.00 -
153.58 -35.28
11.04 15.47
CD EquisearchPvt Ltd
Equities Derivatives Commoditie
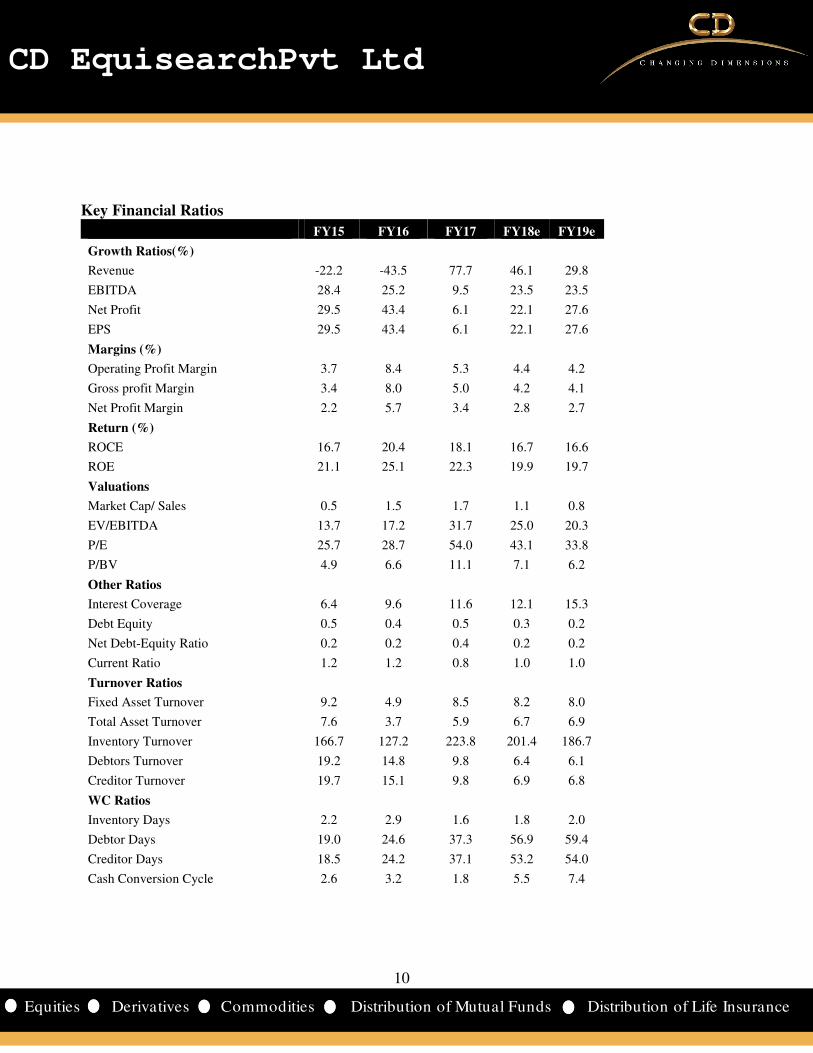
Key Financial Ratios
Growth Ratios(%)
Revenue
EBITDA
Net Profit
EPS
Margins (%)
Operating Profit Margin
Gross profit Margin
Net Profit Margin
Return (%)
ROCE
ROE
Valuations
Market Cap/ Sales
EV/EBITDA
P/E
P/BV
Other Ratios
Interest Coverage
Debt Equity
Net Debt-Equity Ratio
Current Ratio
Turnover Ratios
Fixed Asset Turnover
Total Asset Turnover
Inventory Turnover
Debtors Turnover
Creditor Turnover
WC Ratios
Inventory Days
Debtor Days
Creditor Days
Cash Conversion Cycle
10
CD EquisearchPvt Ltd
ities Distribution of Mutual Funds Dist
FY15 FY16 FY17 FY18e FY19e
-22.2 -43.5 77.7 46.1 29.8
28.4 25.2 9.5 23.5 23.5
29.5 43.4 6.1 22.1 27.6
29.5 43.4 6.1 22.1 27.6
3.7 8.4 5.3 4.4 4.2
3.4 8.0 5.0 4.2 4.1
2.2 5.7 3.4 2.8 2.7
16.7 20.4 18.1 16.7 16.6
21.1 25.1 22.3 19.9 19.7
0.5 1.5 1.7 1.1 0.8
13.7 17.2 31.7 25.0 20.3
25.7 28.7 54.0 43.1 33.8
4.9 6.6 11.1 7.1 6.2
6.4 9.6 11.6 12.1 15.3
0.5 0.4 0.5 0.3 0.2
0.2 0.2 0.4 0.2 0.2
1.2 1.2 0.8 1.0 1.0
9.2 4.9 8.5 8.2 8.0
7.6 3.7 5.9 6.7 6.9
166.7 127.2 223.8 201.4 186.7
19.2 14.8 9.8 6.4 6.1
19.7 15.1 9.8 6.9 6.8
2.2 2.9 1.6 1.8 2.0
19.0 24.6 37.3 56.9 59.4
18.5 24.2 37.1 53.2 54.0
2.6 3.2 1.8 5.5 7.4
10
CD EquisearchPvt Ltd
istribution of Life Insurance

CD EquisearchPvt Ltd
Equities Derivatives Commoditie
Cumulative Financial Data FY08
Liquid Terminal Division 220
Gas Terminal Division 860
Income from operations** 1081
Operating profit 195
EBIT 166
PBT 138
PAT after MI 109
Dividends 34
OPM (%) 18.1
NPM (%) 10.1
ROE (%) 26.3
ROCE (%) 18.6
Interest Coverage 6.0
Debt Equity* 0.7
Fixed asset turnover 2.4
Debtors turnover 15.6
Inventory turnover 35.0
Creditors turnover 9.9
Debtor days 23.4
Inventory days 10.4
Creditor days 36.8
Cash conversion -3.0
Dividend payout ratio (%) 31.4
FY8-10 implies three year period ending fiscal 10;*as on terminal year
PAT in FY11-13 declined by 8.3% compared to FY8
FY12 which got magnified to Rs 100 crs in FY13 due to lower purchases by national oil companies in second half of FY13
and rise in other expenses by 63.2%. Aegis posted a scant growth of only 7.
period compared to the previous three years on account of
respectively. This steep decline was due t
registration of AGI as an international vendor. Distribution volumes
diversion of subsidized LPG to this sector.
capacities in both the liquid and gas segments should drive up total income from operations of the company by 53.6
FY17-19e period.
Although the company has managed its working capital
gas sold (1m tonne in FY17 vs 0.5m tonne in FY16)
borrowings increased by 281.9% from FY16 on account of buyer’s credit fo
policy to not take long term debt for expansion
period FY17-19e should improve to 0.2. Higher capacity utilization (apart from Pipavav
Kandla Port, Mangalore Port and Haldia , and gas division expansion at Haldia and Pipavav along with debottlenecking in
Mumbai should increase its throughput and sourcing volume and strengthen
2.9% and return ratio –ROCE to 17.1% (see table).
11
CD EquisearchPvt Ltd
ities Distribution of Mutual Funds Dist
FY08-10 FY11-13 FY14-16 FY17-19e
220 287 455 527
860 9970 10705 16610
1081 10257 11160 17137
195 -22 436 779
166 269 401 697
138 155 344 644
109 100 253 454
34 37 80 145
18.1 -0.2 3.9 4.5
10.1 1.0 2.5 2.9
26.3 14.2 21.5 20.1
18.6 12.6 16.3 17.1
6.0 2.4 7.1 13.1
0.7 1.1 0.4 0.2
2.4 13.9 10.1 8.3
15.6 21.4 18.9 7.9
35.0 236.6 237.8 197.3
9.9 22.1 19.7 8.6
23.4 17.0 19.4 46.0
10.4 1.5 1.5 1.9
36.8 16.5 18.5 42.5
3.0 2.1 2.4 5.3
31.4 37.5 29.0 31.9
terminal year; ** includes other operating income
13 declined by 8.3% compared to FY8-10 despite tenfold rise in revenues due to operating loss of Rs 3.8 crs in
FY12 which got magnified to Rs 100 crs in FY13 due to lower purchases by national oil companies in second half of FY13
Aegis posted a scant growth of only 7.4% in its gas terminal
period compared to the previous three years on account of plunge in sales by 23.2% and 45.7% in FY15 and FY16
respectively. This steep decline was due to fall in international LPG prices and sourcing volumes due to delay in the
registration of AGI as an international vendor. Distribution volumes declined further in FY16 on account of
diversion of subsidized LPG to this sector. However, a rise in gas terminal revenue by 85% in FY17 and expansion of
capacities in both the liquid and gas segments should drive up total income from operations of the company by 53.6
its working capital well, receivables increased sharply due to
gas sold (1m tonne in FY17 vs 0.5m tonne in FY16) last fiscal, resulting in back to back credit of one month. Short term
borrowings increased by 281.9% from FY16 on account of buyer’s credit for LPG sourcing business. But w
policy to not take long term debt for expansion - capex to be funded through internal accruals, debt equity ratio for the
19e should improve to 0.2. Higher capacity utilization (apart from Pipavav plant), liquid capacity expansion at
Kandla Port, Mangalore Port and Haldia , and gas division expansion at Haldia and Pipavav along with debottlenecking in
Mumbai should increase its throughput and sourcing volume and strengthen its profit margins
(see table).
11
CD EquisearchPvt Ltd
istribution of Life Insurance
10 despite tenfold rise in revenues due to operating loss of Rs 3.8 crs in
FY12 which got magnified to Rs 100 crs in FY13 due to lower purchases by national oil companies in second half of FY13
terminal revenues in FY14-16
23.2% and 45.7% in FY15 and FY16
o fall in international LPG prices and sourcing volumes due to delay in the
declined further in FY16 on account of illegal
as terminal revenue by 85% in FY17 and expansion of
capacities in both the liquid and gas segments should drive up total income from operations of the company by 53.6% in
, receivables increased sharply due to sharp rise in amount of
resulting in back to back credit of one month. Short term
r LPG sourcing business. But with the company’s
capex to be funded through internal accruals, debt equity ratio for the
plant), liquid capacity expansion at
Kandla Port, Mangalore Port and Haldia , and gas division expansion at Haldia and Pipavav along with debottlenecking in
its profit margins- OPM to 4.5%, NPM to

CD EquisearchPvt Ltd
Equities Derivatives Commoditie
Financial Summary- US Dollar denominated million $ FY15
Equity capital
Shareholders' funds 66.1
Total debt 34.8
Net fixed assets (incl. CWIP) 75.7
Investments
Net current assets
Total assets 91.3
Revenues 640.4
EBITDA 25.3
EBDT 22.0
PBT 18.2
PAT 12.9
EPS($) 0.04
Book value ($) 0.20
Operating cash flow 16.4
Investing cash flow
Financing cash flow -
Income statement figures translated at average rates; balance sheet All dollar denominated figures are adjusted for extraordinary items.
12
CD EquisearchPvt Ltd
ities Distribution of Mutual Funds Dist
US Dollar denominated FY15 FY16 FY17 FY18e FY19e
5.3 5.0 5.2 5.2 5.2
66.1 74.0 90.5 136.8 157.4
34.8 28.4 44.2 39.0 41.9
75.7 80.1 120.7 148.8 173.1
3.4 0.1 0.0 0.0 0.0
7.5 6.9 -23.5 1.5 -4.1
91.3 96.4 106.9 158.7 177.1
640.4 338.1 586.2 887.9 1152.2
25.3 29.6 31.6 40.5 50.0
22.0 26.9 29.2 37.6 47.2
18.2 23.3 25.6 32.4 40.6
12.9 17.3 17.9 22.7 28.9
0.04 0.05 0.05 0.07 0.09
0.20 0.22 0.27 0.41 0.47
16.4 18.2 24.2 6.9 38.0
2.4 -9.6 -38.3 -32.4 -30.1
-9.1 -9.9 10.8 23.7 -5.5
tes; balance sheet at year end rates; projections at current rates (Rs 64.72/$).All dollar denominated figures are adjusted for extraordinary items.
12
CD EquisearchPvt Ltd
istribution of Life Insurance
projections at current rates (Rs 64.72/$).

CD EquisearchPvt Ltd
Equities Derivatives Commoditie
Disclosure & Disclaimer CD Equisearch Private Limited (hereinafter referred to as
Limited, Bombay Stock Exchange Limited and Metropolitan Stock Exchange of India Limited (Formerly known as MCX Stock Exchange
Limited). CD Equi is also registered as Depository Participant with
CD Equi are engaged in activities relating to NBFC
CD Equi is registered under SEBI (Research Analysts) Regulations,
hereby declares that –
• No disciplinary action has been taken against CD Equi by any of the regulatory authorities.
• CD Equi/its associates/research analysts do not have any financial interest/be
conflict of interest in the subject company(s)
• CD Equi/its associates/research analysts have not received any compensation from the subject company(s) during the past twel
months.
• CD Equi/its research analysts has not served as an officer, director or employee of company covered by analysts and has not b
engaged in market making activity of the company covered by analysts
This document is solely for the personal information of the recipient and must not be singularly used as the basis of any investment
decision. Nothing in this document should be construed as investment or financial advice. Each recipient of this document sho
such investigations as they deem necessary to arrive at an independent evaluation of an investment in the securities of the companies
referred to in this document (including the merits and risks involved) and should consult their own advisors to determine the
risks of such an investment.
Reports based on technical and derivative analysis center on studying charts of a stock's price movement, outstanding positio
trading volume, as opposed to focusing on a company's fundamentals and as such, may not match with a report on a
fundamentals.
The information in this document has been printed on the basis of publicly available information, internal data and other rel
believed to be true but we do not represent that it is accurate or complete and it should
general guidance only. CD Equi or any of its affiliates/group companies shall not be in any way responsible for any loss or d
may arise to any person from any inadvertent error in the information
the information contained within this document. Accordingly, we cannot testify nor make any representation or warranty, expre
implied, to the accuracy, contents or data contained wit
While, CD Equi endeavors to update on a reasonable basis the information discussed in this material, there may be regulatory
or other reasons that prevent us from doing so.
This document is being supplied to you solely for
redistributed or passed on, directly or indirectly. Neither, CD Equi nor its directors, employees or affiliates shall be liab
damage that may arise from or in connection with the use of this information.
CD Equisearch Private Limited (CIN: U67120WB1995PTC071521)
Registered Office: 37, Shakespeare Sarani, 3rd Floor, Kolkata
10, Vasawani Mansion, 5th Floor, Dinshaw Wachha Road, Churchgate, Mumbai
2283, 2276 Website: www.cdequi.com; Email: [email protected]
buy: >20% accumulate: >10% to ≤20% hold:
Exchange Rates Used- Indicative
Rs/$ FY14 FY15
Average 60.5 61.15
Year end 60.1 62.59
All $ values mentioned in the write-up translated at the average rate of the respective quarter/ year as
current exchange rate. Cumulative dollar figure is the sum of respective yearly dollar value
13
CD EquisearchPvt Ltd
ities Distribution of Mutual Funds Dist
CD Equisearch Private Limited (hereinafter referred to as ‘CD Equi’) is a Member registered with National Stock Exchange of India
Limited, Bombay Stock Exchange Limited and Metropolitan Stock Exchange of India Limited (Formerly known as MCX Stock Exchange
Limited). CD Equi is also registered as Depository Participant with CDSL and AMFI registered Mutual Fund Advisor. The associates of
CD Equi are engaged in activities relating to NBFC-ND - Financing and Investment, Commodity Broking, Real Estate, etc.
CD Equi is registered under SEBI (Research Analysts) Regulations, 2014 with SEBI Registration no INH300002274. Further, CD Equi
No disciplinary action has been taken against CD Equi by any of the regulatory authorities.
CD Equi/its associates/research analysts do not have any financial interest/beneficial interest of more than one percent/material
conflict of interest in the subject company(s) (kindly disclose if otherwise).
CD Equi/its associates/research analysts have not received any compensation from the subject company(s) during the past twel
CD Equi/its research analysts has not served as an officer, director or employee of company covered by analysts and has not b
engaged in market making activity of the company covered by analysts.
rmation of the recipient and must not be singularly used as the basis of any investment
decision. Nothing in this document should be construed as investment or financial advice. Each recipient of this document sho
ecessary to arrive at an independent evaluation of an investment in the securities of the companies
referred to in this document (including the merits and risks involved) and should consult their own advisors to determine the
Reports based on technical and derivative analysis center on studying charts of a stock's price movement, outstanding positio
trading volume, as opposed to focusing on a company's fundamentals and as such, may not match with a report on a
The information in this document has been printed on the basis of publicly available information, internal data and other rel
believed to be true but we do not represent that it is accurate or complete and it should not be relied on as such, as this document is for
general guidance only. CD Equi or any of its affiliates/group companies shall not be in any way responsible for any loss or d
may arise to any person from any inadvertent error in the information contained in this report. CD Equi has not independently verified all
the information contained within this document. Accordingly, we cannot testify nor make any representation or warranty, expre
implied, to the accuracy, contents or data contained within this document.
While, CD Equi endeavors to update on a reasonable basis the information discussed in this material, there may be regulatory
This document is being supplied to you solely for your information and its contents, information or data may not be reproduced,
redistributed or passed on, directly or indirectly. Neither, CD Equi nor its directors, employees or affiliates shall be liab
onnection with the use of this information.
CD Equisearch Private Limited (CIN: U67120WB1995PTC071521)
Floor, Kolkata – 700 017; Phone: +91(33) 4488 0000; Fax: +91(33) 2289 2557 Corporate Office:
Floor, Dinshaw Wachha Road, Churchgate, Mumbai – 400 020. Phone: +91(22) 2283 0652/0653; Fax: +91(22)
2283, 2276 Website: www.cdequi.com; Email: [email protected]
hold: ≥-10% to ≤10% reduce: ≥-20% to <-10% sell:
FY16 FY17
65.46 67.09
66.33 64.84
up translated at the average rate of the respective quarter/ year as applicable. Projections converted at
current exchange rate. Cumulative dollar figure is the sum of respective yearly dollar value.
13
CD EquisearchPvt Ltd
istribution of Life Insurance
) is a Member registered with National Stock Exchange of India
Limited, Bombay Stock Exchange Limited and Metropolitan Stock Exchange of India Limited (Formerly known as MCX Stock Exchange
CDSL and AMFI registered Mutual Fund Advisor. The associates of
Financing and Investment, Commodity Broking, Real Estate, etc.
2014 with SEBI Registration no INH300002274. Further, CD Equi
neficial interest of more than one percent/material
CD Equi/its associates/research analysts have not received any compensation from the subject company(s) during the past twelve
CD Equi/its research analysts has not served as an officer, director or employee of company covered by analysts and has not been
rmation of the recipient and must not be singularly used as the basis of any investment
decision. Nothing in this document should be construed as investment or financial advice. Each recipient of this document should make
ecessary to arrive at an independent evaluation of an investment in the securities of the companies
referred to in this document (including the merits and risks involved) and should consult their own advisors to determine the merits and
Reports based on technical and derivative analysis center on studying charts of a stock's price movement, outstanding positions and
trading volume, as opposed to focusing on a company's fundamentals and as such, may not match with a report on a company's
The information in this document has been printed on the basis of publicly available information, internal data and other reliable sources
not be relied on as such, as this document is for
general guidance only. CD Equi or any of its affiliates/group companies shall not be in any way responsible for any loss or damage that
contained in this report. CD Equi has not independently verified all
the information contained within this document. Accordingly, we cannot testify nor make any representation or warranty, express or
While, CD Equi endeavors to update on a reasonable basis the information discussed in this material, there may be regulatory compliance
your information and its contents, information or data may not be reproduced,
redistributed or passed on, directly or indirectly. Neither, CD Equi nor its directors, employees or affiliates shall be liable for any loss or
700 017; Phone: +91(33) 4488 0000; Fax: +91(33) 2289 2557 Corporate Office:
400 020. Phone: +91(22) 2283 0652/0653; Fax: +91(22)
sell: <-20%
applicable. Projections converted at