Embed Size (px)
Citation preview

CCS-3
PAL
CESC, April 2005, Washington DC
Performance Modeling of Extreme-Scale Systems and Applications
Adolfy Hoisie
work with: Kevin Barker, Kei Davis, Darren Kerbyson, Greg Johnson, Mike Lang, Scott Pakin, Fabrizio Petrini
www.c3.lanl.gov/par_arch
Performance and Architecture Lab (PAL)Computer and Computational Sciences Division
Los Alamos National Laboratory
Work funded by ASC, Office of Science, DARPA
CCS-3
PAL
CESC, April 2005, Washington DC
Outline
Performance modeling
Comparison of systems
Performance prediction for advanced architectures
Summary/Tentative conclusions
CCS-3
PAL
CESC, April 2005, Washington DC
Performance and Architecture Lab (PAL)
Performance/Architecture team at Los Alamos– Modeling– Measurement, system software R&D, simulation
Application-centric performance modeling
Analyze existing systems (or near-to-market systems) – e.g. Cray X1, Earth Simulator, BlueGene/L …
Examine possible future systems– e.g. IBM PERCS (DARPA HPCS), BlueGene/P, … ?
Recent work includes:– Modeling and optimization of ASCI Q – Comparison of: Cray X1, Earth Simulator, ASCI Q– Scalability analysis of BlueGene/L – Initial analysis of BlueGene/P
CCS-3
PAL
CESC, April 2005, Washington DC
Why Performance Modeling? Other performance analysis methods fall short in either accuracy or practicality:
» Simulation Greatest architectural flexibility but takes too long for real applications
» Trace-driven experiments Results often lack generality
» Stochastic System-wide/throughput analysis
» Benchmarking Limited to current implementation of the code Limited to currently-available architecturesDifficult to distinguish between real performance and machine idiosyncrasies

CCS-3
PAL
CESC, April 2005, Washington DC
Performance Modeling Process
Basic approach:
“Fundamental Equation of Modeling”Trun = Tcomputation + Tcommunication – Toverlap
Trun = f (T1-CPU , Scalability)
where T1-CPU is the single processor time
We are not using first principles to model single-processor computation time.
– Rely on measurements for T1-CPU. May be:» time per subgrid, » time per cell,» calculated using measured rate and # of FLOPS per subgrid

CCS-3
PAL
CESC, April 2005, Washington DC
What is a performance model?A model encapsulates the understanding of:– What resources an application uses during execution(i.e. a functional description)
This is coupled with a system model: – how long it takes to satisfy various resource requirements
Parameterized:
PerformancePrediction
CodeModel
SystemModel
+
Code
System
+Execution
problem
configuration

CCS-3
PAL
CESC, April 2005, Washington DC
Modeling Successes
Machines: – ASCI Q, – ASCI BlueMountain, – ASCI White, – ASCI Red, – CRAY T3E, – Earth Simulator, – Various clusters (AMD, IA-
64, Alphas, Xeon-64, etc),– BlueGene/L,– BlueGene/P,– CRAY X-1,– CRAY XD-1,– IBM PERCS (early designs)– Red Storm
Codes: – SWEEP3D, – SAGE, – Partisn,– LBMHD,– HYCOM– MCNP, – POP,– TYCHO,– UMT2K,– RAGE (in progress), – RF-CTH (in progress),– CICE (in progress)

CCS-3
PAL
CESC, April 2005, Washington DC
Outline
Performance modeling
Comparison of systems
An experiment-ahead for advanced architectures
Tentative conclusions

CCS-3
PAL
CESC, April 2005, Washington DC
Application Performance1) Sweep3D
3-D spatial grid, partitioned in 2-D
Pipelined wavefront processing– Dependency in ‘sweep’ direction
Parallel Characteristics:– logical neighbors in X and Y – Small message sizes: 100’s bytes (typical)– Number of processors determines pipeline length (PX + PY)
Sweep3D model: Int. Journal High Performance Computing Applications, 2000
2-D example:

CCS-3
PAL
CESC, April 2005, Washington DC
Application Performance2) SAGE
Adaptive Mesh Refinement (AMR) hydro-code
3 repeated phases – Gather data (including processor boundary data)– Compute– Scatter data (send back results)
3-D spatial grid, partitioned in 1-D
Parallel characteristics– Message sizes vary, typically 10 - 100’s Kbytes– Distance between neighbors increases with scale
SAGE model: Supercomputing 2001, Denver

CCS-3
PAL
CESC, April 2005, Washington DC
BlueGene/Light OverviewNode– Dual Core Embedded PowerPC 440– 256MB or 512MB memory
700MHz (500MHz prototype)Network– 3-D torus (point-to-point) & Tree network (broadcast, …)
4 floating-point per cycle– 2.8 GFlops per processor core
Use either 1 PE or 2 PEs per nodeLargest system - Lawrence Livermore, 2005 (ASC)– 32 x 32 x 64 nodes (64K nodes, 128K processor cores)– Peak performance: 360 Tflops
Small physical footprint– 2 nodes per compute card, 16 cards per board, 32 boards per rack

CCS-3
PAL
CESC, April 2005, Washington DC
RedStorm Overview
Node– Single AMD Opteron– 1-8 GB main memory
2.0GHz, 2.4GHz Network– 3-D torus (in two dimensions at Sandia) – SeaStar Network processor (uses embedded PowerPC)
2 floating-point per cycle– 4 GFlops per processor
Largest system - Sandia, 2005 (ASC)– 27 x 16 x 24 nodes (10,368 nodes)– Peak performance: 41.5 Tflops

CCS-3
PAL
CESC, April 2005, Washington DC
System Comparison
2.0GB/s2-3µs
3D-torus
4.0 GF/s
2.0GHz10,368
10,368
AMD Opteron
41.5 Tflops
RedStorm
160MB/s3µs
3D-torus
2.8 GF/s
0.7GHz131,072
65,536
PowerPC 440
360 Tflops
BlueGene/L
2.5 GF/sProcessor Peak
300MB/sMPI network Bandwidth6µsMPI network Latency
Fat-treeTopology
1.25GHzProcessor Speed8,192Processor Count
2,048Node Count
Alpha EV68Processor Type
20 TflopsSystem Peak
ASCI Q
Notes: BlueGene/L based on Lawrence Livermore installationRedStorm based on Sandia installationASCI Q production machine at Los Alamos (2002)
CCS-3
PAL
CESC, April 2005, Washington DC
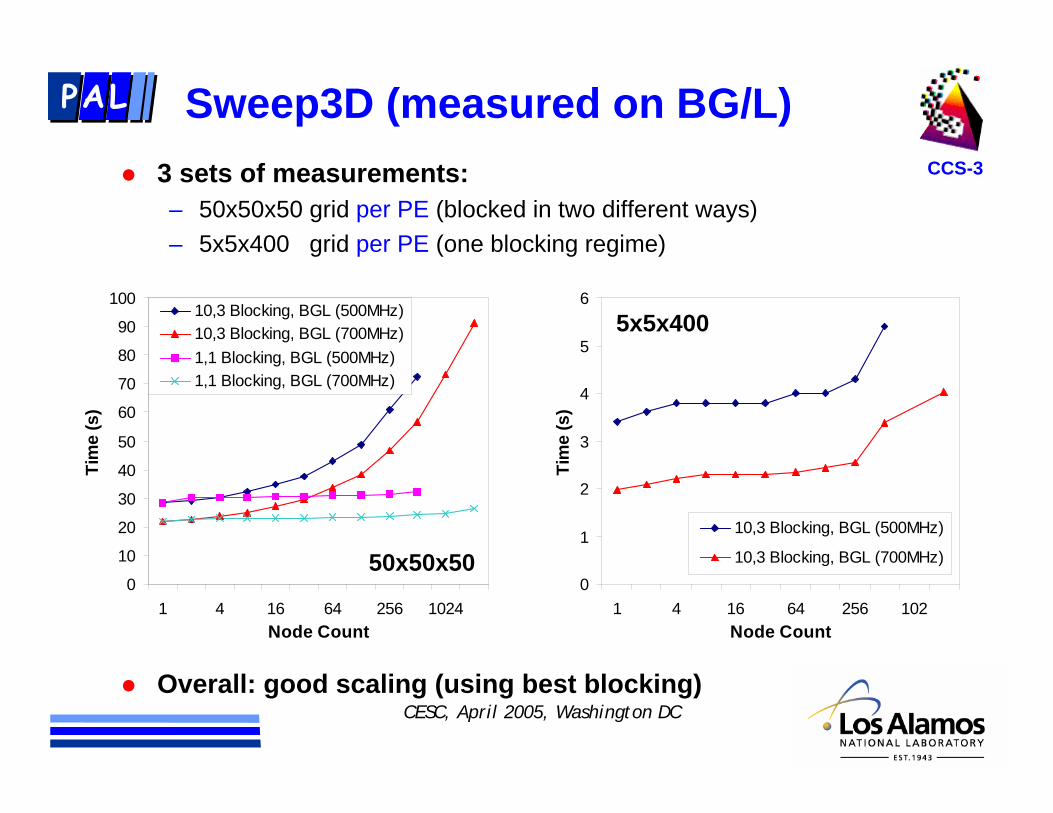
Sweep3D (measured on BG/L)
0
10
20
30
40
50
60
70
80
90
100
1 4 16 64 256 1024Node Count
Tim
e (s
)
10,3 Blocking, BGL (500MHz)10,3 Blocking, BGL (700MHz)1,1 Blocking, BGL (500MHz)1,1 Blocking, BGL (700MHz)
0
1
2
3
4
5
6
1 4 16 64 256 102Node Count
Tim
e (s
)
10,3 Blocking, BGL (500MHz)
10,3 Blocking, BGL (700MHz)
3 sets of measurements:– 50x50x50 grid per PE (blocked in two different ways)– 5x5x400 grid per PE (one blocking regime)
Overall: good scaling (using best blocking)
50x50x50
5x5x400

CCS-3
PAL
CESC, April 2005, Washington DC
Sweep3D Model Validation (BG/L)
700MHz
Model prediction error:– 7.2% (maximum)– 1.7% (average)
0
10
20
30
40
50
60
70
80
90
100
1 4 16 64 256 1024Node Count
Tim
e (s
)
50x50x50 (10,3) Model
50x50x50 (1,1) Model5x5x400 (10,3) Model
50x50x50 (10,3) Measured
50x50x50 (1,1) Measured5x5x400 (10,3) Measured
NB: VNM vs. COP mode (using 2 vs 1 PEs per node) :– Factor of ~1.9x higher performance

CCS-3
PAL
CESC, April 2005, Washington DC
Relative performanceBG/L and RedStorm to ASCI Q
2 regions in graph:– equal processor count (up to 8,192 processors)– ASCI Q fixed size (above 8,192 processors)
Equal PE count:BG/L is ~0.42x speed of QRedStorm is 1.25x - 2x faster than Q
Full-sized system:BG/L is ~5.5x faster than QRedStorm is ~1.85x faster than Q
(5x5x400 sub-grids with best blocking)0.0
0.5
1.0
1.5
2.0
2.5
3.0
3.5
4.0
4.5
5.0
5.5
6.0
1 2 4 8 16 32 64 128
256
512
1024
2048
4096
8192
1036
1638
3276
6553
1310
BG/L Processor Count
Rel
ativ
e Pe
rfor
man
ce (t
o A
SCI Q
) BlueGene/L (Equal PE count)
BlueGene/L (ASCI Q fixed at 8,192)
RedStorm (Equal PE count)
RedStorm (ASCI Q fixed at 8,192)
CCS-3
PAL
CESC, April 2005, Washington DC
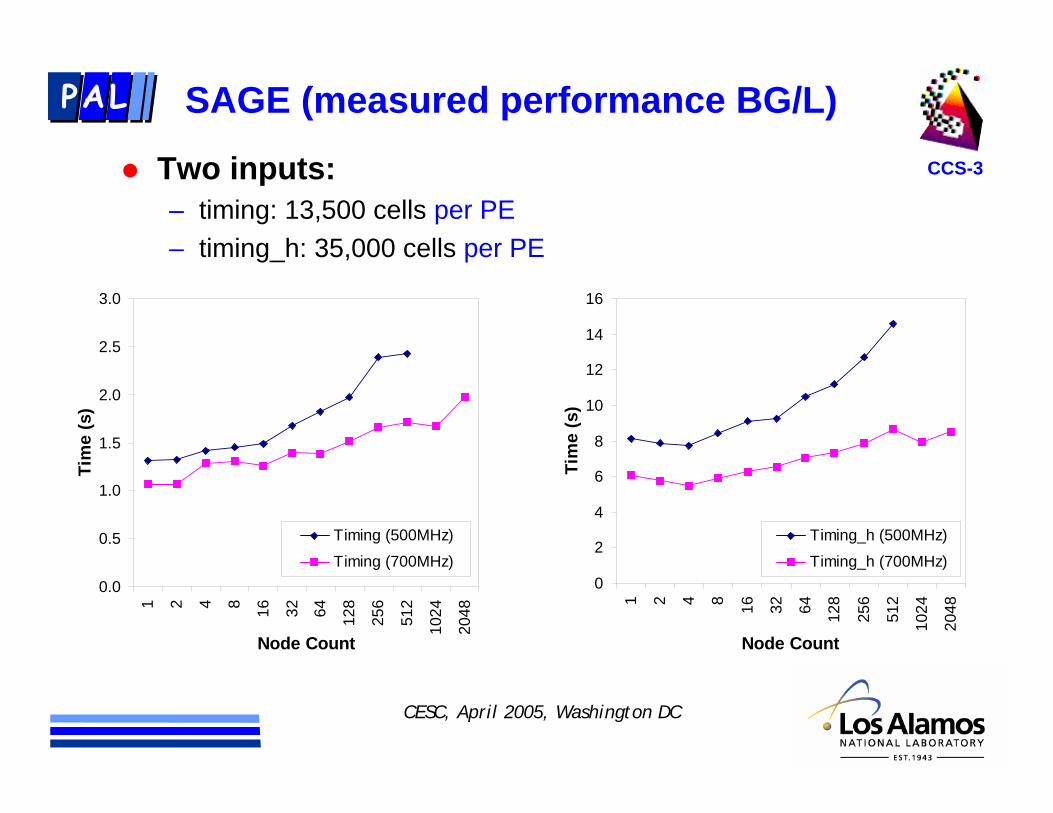
SAGE (measured performance BG/L)
0
2
4
6
8
10
12
14
16
1 2 4 8 16 32 64 128
256
512
1024
2048
Node Count
Tim
e (s
)
Timing_h (500MHz)
Timing_h (700MHz)
Two inputs:– timing: 13,500 cells per PE– timing_h: 35,000 cells per PE
0.0
0.5
1.0
1.5
2.0
2.5
3.0
1 2 4 8 16 32 64 128
256
512
1024
2048
Node Count
Tim
e (s
)
Timing (500MHz)
Timing (700MHz)
CCS-3
PAL
CESC, April 2005, Washington DC
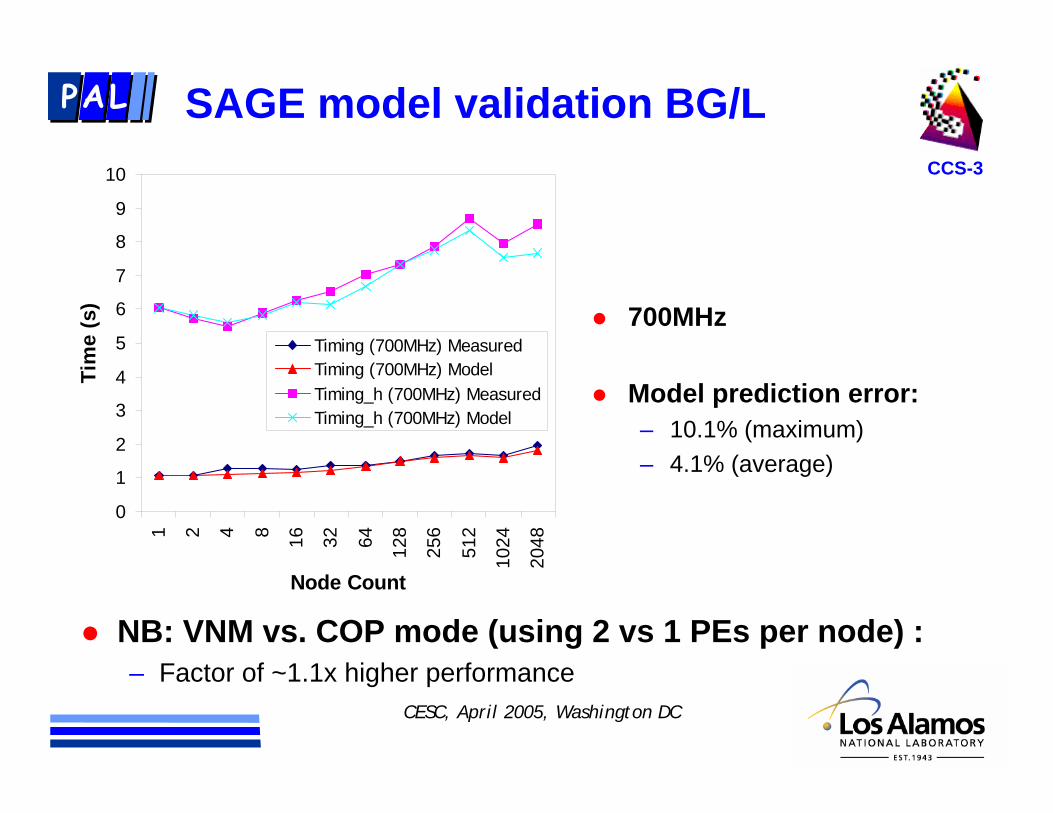
SAGE model validation BG/L
700MHz
Model prediction error:– 10.1% (maximum)– 4.1% (average)
NB: VNM vs. COP mode (using 2 vs 1 PEs per node) :– Factor of ~1.1x higher performance
0
1
2
3
4
5
6
7
8
9
101 2 4 8 16 32 64 128
256
512
1024
2048
Node Count
Tim
e (s
)
Timing (700MHz) MeasuredTiming (700MHz) ModelTiming_h (700MHz) MeasuredTiming_h (700MHz) Model

CCS-3
PAL
CESC, April 2005, Washington DC
Outline
Performance modeling
Applications of modeling: rational system integration, large-scale system comparison, performance prediction, system design
Performance predictions for advanced architectures
Tentative conclusions

CCS-3
PAL
CESC, April 2005, Washington DC
1641Network Bandwidth (GB/s)
134Network Latency (µs)
50208Processor Peak (Gflop/s)
200820062004
• Processor roadmap based on Moore’s law
• Network bandwidth based on projected Infiniband for 2008
• Network latency based on current lowest value, with a small assumed improvement over time
An Experiment-Ahead for PetaflopArchitectures – The “Racehorse”

CCS-3
PAL
CESC, April 2005, Washington DC
• What would the Racehorse look like?
20,00020,00012,500Processor Count
1.00.40.1System Peak (Pflops)
200820062004
• What would the input deck for the app look like?
50,00025,00016,000cells size per processor
1x1095x1082x108Total problem size
200820062004
An Experiment-Ahead for Petaflop Architectures

CCS-3
PAL
CESC, April 2005, Washington DC
• Use expected system characteristics and problem sizes
• Use PAL’s performance models
• Provide expected performance improvements over time
• Assume we well get same % of peak on a single CPU
An Experiment-Ahead for PetaflopArchitectures

CCS-3
PAL
CESC, April 2005, Washington DC
Performance improvements relative to ASCI Q
0
5
10
15
20
25
30
35
40
45
50
2004 2006 2008Year
Perfo
rman
ce Im
prov
emen
t (F
utur
e vs
ASC
I Q)
S N Transport(S weep3D )Hydro (S A GE )
100T f
400T f
1P f

CCS-3
PAL
CESC, April 2005, Washington DC
•Workload assuming 80% Sn transport and 20% Hydro
Performance improvements relative toASCI Q
0
5
1 0
1 5
2 0
2 5
3 0
3 5
4 0
4 5
5 0
2 0 0 4 2 0 0 6 2 0 0 8Y e a r
Perfo
rman
ce Im
prov
emen
t
(Fut
ure
vs A
SCI Q
)
W o r k lo a d ( 8 0 % S nt r a n s p o r t , 2 0 % H y d r o )
1 0 0 T f4 0 0 T f
1 P f
CCS-3
PAL
CESC, April 2005, Washington DC
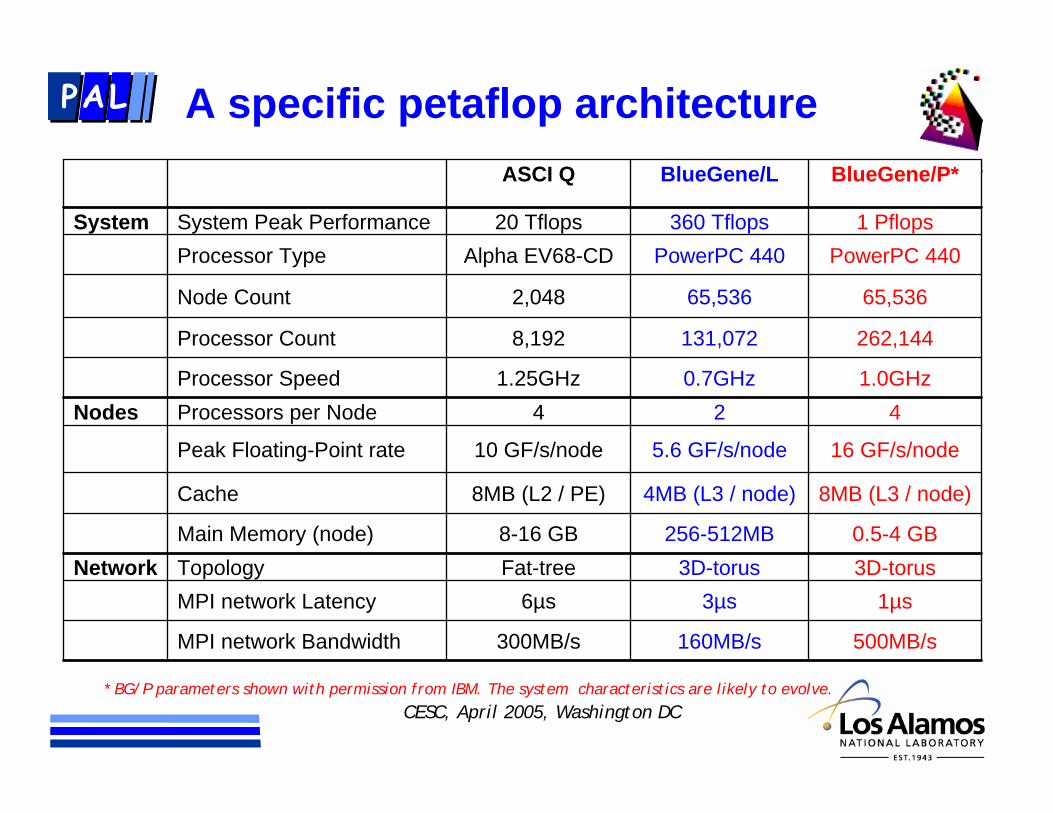
A specific petaflop architecture
300MB/s
6µsFat-tree8-16 GB
8MB (L2 / PE)
10 GF/s/node
41.25GHz
8,192
2,048
Alpha EV68-CD20 Tflops
ASCI Q
160MB/s
3µs3D-torus
256-512MB
4MB (L3 / node)
5.6 GF/s/node
20.7GHz
131,072
65,536
PowerPC 440360 Tflops
BlueGene/L
16 GF/s/nodePeak Floating-Point rate
500MB/sMPI network Bandwidth
1µsMPI network Latency3D-torusTopologyNetwork0.5-4 GBMain Memory (node)
8MB (L3 / node)Cache
4Processors per NodeNodes1.0GHzProcessor Speed
262,144Processor Count
65,536Node Count
PowerPC 440Processor Type1 PflopsSystem Peak PerformanceSystem
BlueGene/P*
* BG/P parameters shown with permission from IBM. The system characteristics are likely to evolve.

CCS-3
PAL
CESC, April 2005, Washington DC
BG/P Performance characteristics (assumed)
No hardware available for measurement – Use assumed hardware performance characteristics
network latency: 1.0 µsnetwork bandwidth: 500 MB/sachievable processor speed: 3.75% of peak (single node)
Optimistic view
2 types of analysis:– 1) Sensitivity analysis– 2) Expected performance
Sweep3D : 10K cells per processor (5x5x400 sub-grid size)

CCS-3
PAL
CESC, April 2005, Washington DC
Expected Performance improvementSweep3D
Comparison with ASCI Q - 2 regions in graph– Equal processor count (up to 8,192 processors)– ASCI Q fixed size (above 8192 processors)
0
2
4
6
8
10
12
14
16
18
1 100 10000 1000000
Processor Count
Rel
ativ
e Pe
rfor
man
ce(to
ASC
I Q)
BG/P (4-way,1GHz)BG/L (2-way,700MHz)
Equal PEcount
Q fixedat 8192
Up to 8192 PEs:BG/L is ~0.42x speed of QBG/P is ~0.62x speed of Q
Full-sized system:BG/L is 5.3x faster than QBG/P is 16.7x faster than Q

CCS-3
PAL
CESC, April 2005, Washington DC
Expected Performance improvementSAGE
0
5
10
15
20
25
1 100 10000 1000000N o d e C o u n t
Rel
ativ
e Pe
rform
ance
(to
ASC
I Q)
B G/P (4-w ay, 1GHz )B G/L (2-w ay, 700MHz )
• Performance depends on the problem, distance between communicating neighbors, and size of each dimension on the 3-D torus• Mapping assumed is a default one (may be pessimistic)• Kinks in the curve are a result of this mapping with changing PE count

CCS-3
PAL
CESC, April 2005, Washington DC
Tentative conclusions
80% Sweep + 20% Sage: BG/P would be faster by a factor of 18 on the full BG/P configuration – the Racehorse was 19 X…We ended up in the same place!Is it a new law of nature?We are chasing the technology (the Racehorse) or we are throwing more (less powerful) resources at the problem.The 2 approaches are very similar in nature – and the interplay between surface-to-volume and resources just happened to end up at the same pointWe are falling behind in efficiencyDid not consider important issues such as system software, power, footprint, etc

CCS-3
PAL
CESC, April 2005, Washington DC
Summary
Accurate performance models of entire applications developed by PAL based on novel methodologyMultiple uses of modeling in the system and application areasModels can be used to predict performance on future architectures, and conversely, design future systems for a workload of interestPerformance analysis of BG/L and RedStorm, compared against QPoint design studies for a hypothetical and a specific petafloparchitectureDisclaimer: other applications will result in different performance!

CCS-3
PAL
CESC, April 2005, Washington DC
AcknowledgementsThanks to:
– IBM BlueGene Team, especially: » George Almasi, Manish Gupta, Jose Moreira, Bob Walkup
– Sandia RedStorm Team, especially:
» Jim Tomkins, Sue Kelly
– US Department of Energy through Los Alamos National Laboratory contract W-7405-ENG-36
– Work funded by the ASC program

CCS-3
PAL
CESC, April 2005, Washington DC
The End