Embed Size (px)
Citation preview
India City Competitiveness Report 2013

India City Competitiveness Report 2013
PREFACE The India City Competitiveness Report (ICCR) has being in publication since 2008, and we are happy to release the Sixth Edition of the Report in November 2013. Similar to the previous years, the report evaluates the 50 Indian cities. The report deeply studies, understands and highlights the strong and weak areas of these cities via its city competitiveness index. It also provides an understanding of their present performance with respect to their previous year competitiveness levels. The report offers broad recommendations for government officials, corporations, investors and residents to steer the future of cities with timely action. The report begins with an introduction on competitiveness, explaining about the framework and touching upon India’s competitiveness levels. This was followed by methodological framework used to analyse the data points and ranking of 50 Indian cities on individual pillars and sub-‐indices. The remaining chapters provide insights about the lesser-‐known facts about the Indian cities in terms of their positives and negatives and then, address the attractiveness level of Indian cities on an international platform. Lastly, it also underlines the steps required to redefine the future of the Indian cities.
EXECUTIVE SUMMARY The India City Competitiveness 2013 report evaluates the competitiveness level of 50 Indian cities, which are the building blocks of the nation. The Microeconomic Competitiveness – Diamond Model given by Michael E. Porter, a renowned Harvard Business School Professor has been the basis of the competitiveness index. It consists of four major pillars used to assess the cities from different and various dimensions to establish the imperatives for growth. The set of 50 Indian cities were evaluated on the above pillars and sub pillars to comprehensively understand their domains and accordingly come up with amicable and practical solutions. According to the city competitiveness index, Delhi is the most competitive city in the country. It has been stable on the numero uno position since 2010 because of few obvious reasons such as good governance, high GDP and better infrastructure. Like last year, Mumbai is constant on its 2nd position further followed by Chennai on 3rd, Hyderabad on 4th, Kolkata on 5th, Gurgaon on 6th, Noida on 7th, Bengaluru on 8th, Pune on 9th and Ahmedabad on 10th position. Much more is now expected from the small Indian cities classified as ‘Y’ (according to the sixth central pay commission). Some of cities like Kochi, Surat, Nashik, Jaipur and Indore have performed well on the city competitiveness index and are fast running upwards on the index. They have exhibited good functioning on some crucial pillars. As a result, they are way ahead with good competitiveness rankings in comparison to other cities of the same nature. It is thus vital to enhance the local competition existent in between the cities. It will not only make them more stable and unique but will also help them to join the league of international cities. Hence the city competitiveness index comes into the picture. It serves as a tool to help the cities grow in a sustainable manner, complementing their own inherent strengths and developing a clear vision for their future.
TABLE OF CONTENTS PREFACE EXECUTIVE SUMMARY 1.0 SUMMARIZING THE VITAL CONCEPTS OF COMPETITIVENESS……………………1
1.1 Overview…………………………………………………………………………………………..2 1.2 Factors of Competitiveness……………………………………………………………….3 1.3 Some of the salient features……………………………………………………………..5 1.4 India’s Competitiveness…………………………………………………………………….7 1.5 A look at the Competitiveness of regions & cities in India………………….9 1.6 Urbanization: A Phenomenon w.r.t. India……………………………..…………10 1.7 Classification of Indian cities…………………………………………………………….13 1.8 Increase in the number of Metropolitan areas…………………………………14
2.0 METHODOLOGICAL FRAMEWORK………………………………………………………..…19
2.1 Unit of Analysis……………………………………………………………………………….20 2.2 Data sources & their quality……………………………………………………………23 2.3 About City Competitiveness Index 2013……………………………………….…24 2.4 Analysis the data indicators………………………………………………………..…..25 2.5 Steps undertaken………………………………………………………………………..….25 2.6 The 50 Indian cities addressed…………………………………………………..……27
3.0 RANKINGS…………………………………………………………….…………………………………...28
3.1 The top achievers: Most competitive cities in India………………………...29 3.2 The 11-‐20 positions: Holding immense potential…………………………….30 3.3 The 21-‐30 positions: On the growth path………………………………………..30 3.4 The 31-‐40 positions: Seeking new opportunities……………………………..31 3.5 The 41-‐50 positions: In a developing state……………………………………….31 [Tables] ………………………………………………………………………………………………...32
4.0 PROFILE OF 50 INDIAN CITIES……………………………………………………………………49
5.0 THRIVING INDIAN CITIES: FACE OF THE COUNTRY…………………………………..100
5.1 Unfolding the lesser known facts of the most competitive cities of India……………………………………………………………………………………………….101
5.2 Examining the city competitiveness index………………………………………102 5.3 Potential of small cities classified as ‘Y’ & ‘Z’…………………………………..104 5.4 Poverty in urban India…………………………………………………………………....105 5.5 Doing Business in India……………………………………………………………………106 5.6 Growth of Urban clusters in India…………………………………………………..107
5.7 Urban Mobility System…………………………………………………………………..108 5.8 Smart and Sustainable cities…………………………………………………………..109
6.0 WAYS TO ENHANCE THE CITY COMPETITIVENESS……………………………………111
6.1 The role of governance & inclusive issues……………………………………….112 6.2 Key areas of focus for future Indian cities……………………………………….113 6.3 Critical success factors for city competitiveness………………………………115 6.4 A note on Urban agglomeration, cities and regions………………………..116 6.5 Ideas to shape Indian cities for future…………………………………………….117
7.0 CONTRIBUTIONS……………………………………………………………………………………..119
8.0 REFERENCES…………………………………………………………………………………………….134 APPENDIX
Boxes Box 1: Confusion around the concept of competitiveness……………………………….3 Box 2: Success story of the Indian IT City Bengaluru…………………………………….….9 Box 3: Population density: Urban Change turning into an urban challenge…….11 Box 4: Boundless NCR…………………………………………………………………………………….16 Box 5: A different side of Kolkata – Slums and misery…………………………………...105 Box 6: Ecocabs: Dial-‐A-‐Rickshaw Scheme……………………………………………………….108 Box 7: Delhi Metro: The lifeline of the city and nearby area…………………………..109 Box 8: PPPs in India’s Infrastructure Development -‐ Airport project……………...114
Graphs Graph 1: India on Global Competitiveness Index…………………………………….……….8
Diagrams Diagram 1: Influences of Competitiveness…………………………………………………..…3 Diagram 2: Microeconomic Competitiveness: The Diamond Model…………..…..4 Map Map 1: Snapshot of urban India in 2011……………………………………………………….12 Map 2: Automobile cluster in India………………………………………………………...…..107
Tables Table 1: Population of UAs/Towns as per Census of India 2011…………………...22 Table 2: Number of UAs, Towns, Out Growths (OGs) and villages…………….…..23 Table 3: Classification of pillar and sub-‐indices……………………………………….…….24

1
1.0 SUMMARIZING THE VITAL CONCEPTS OF COMPETITIVENESS
2
1.1 Overview During the financial year 2012-‐13, Indian economy grew at the slowest pace for the first time in a decade. Even the current year does not seem to be much promising. There are talks and discussions amongst intellectuals that India will soon regain its lost glory, but some of the people also have certain apprehensions. Now, one of the world’s fastest growing developing country looks in a state of turmoil with various missing elements of growth. Undoubtedly, India has a very important role to play in the global economy, and it has to realize the fact sooner than later. India with a population base of 1.2 billion can do wonders if it finds ways to improve its competitiveness levels. It has to work upon creating job opportunities and better infrastructure, building social capital, providing basic amenities and implementing a stable policy environment. In other words, Competitiveness is defined as ‘the set of institutions, policies and factors that determine the level of productivity in a country.’
Today the poor infrastructure, investment barriers and lack of innovative ideas are acting as a caveat in the growth of the country. So the drivers of competitiveness should be reconsidered in order to create more business opportunities, enhance the social infrastructure and become more competitive. Thus, India has a long way to go to enter the league of competitive countries of the world. The Institute for Competitiveness, India is thus trying to illustrate the true picture of the country by mapping its ‘powerhouse’ cities and with the help of competitiveness index and analysis. The index is a robust and credible tool to study the competitiveness of Indian cities as it is based on the work of Professor Michael E.
What Determines Competitiveness? Competitiveness depends on the productivity with which a location uses its human, capital, and natural resources.
§ Productivity sets the sustainable standard of living (wages, return on capital, returns on natural resources)
§ It is not what industries a nation competes in that matters for prosperity, but how it competes in those industries
§ Productivity in a nation is a reflection of what both domestic and foreign firms choose to do in that location. The location of ownership is secondary for national prosperity.
Source: Michael E. Porter, 2008
3
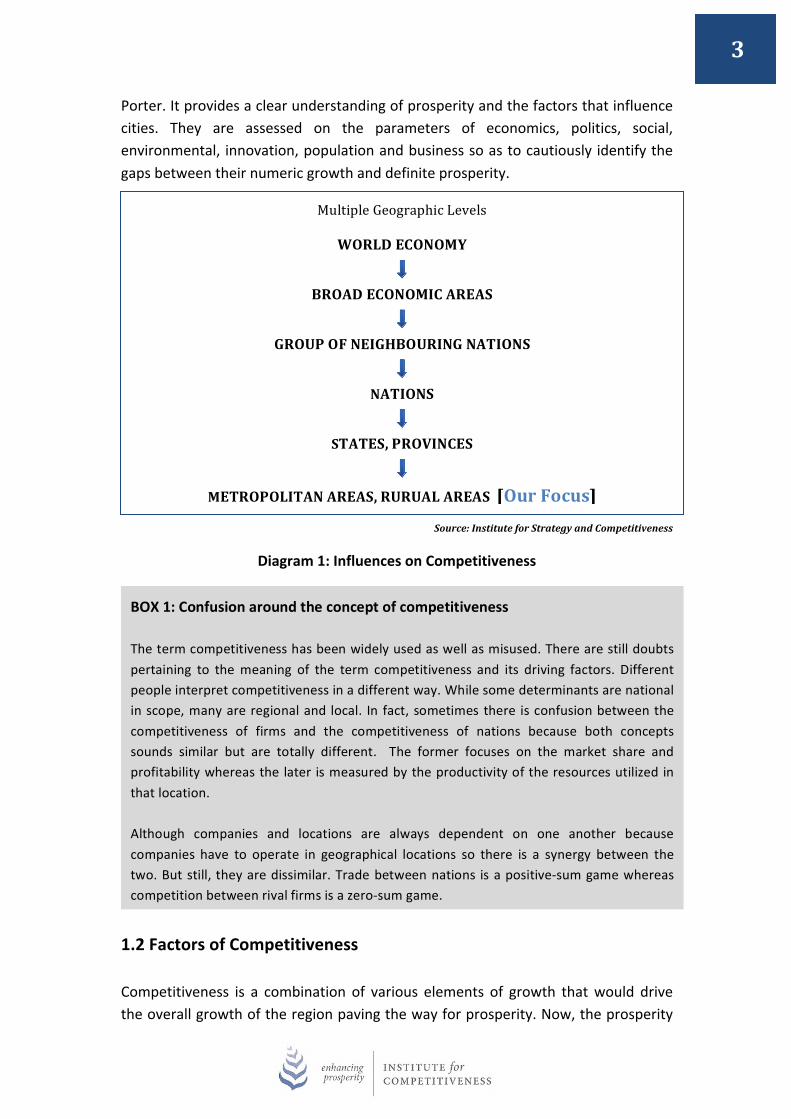
Porter. It provides a clear understanding of prosperity and the factors that influence cities. They are assessed on the parameters of economics, politics, social, environmental, innovation, population and business so as to cautiously identify the gaps between their numeric growth and definite prosperity.
Source: Institute for Strategy and Competitiveness
Diagram 1: Influences on Competitiveness
1.2 Factors of Competitiveness Competitiveness is a combination of various elements of growth that would drive the overall growth of the region paving the way for prosperity. Now, the prosperity
BOX 1: Confusion around the concept of competitiveness The term competitiveness has been widely used as well as misused. There are still doubts pertaining to the meaning of the term competitiveness and its driving factors. Different people interpret competitiveness in a different way. While some determinants are national in scope, many are regional and local. In fact, sometimes there is confusion between the competitiveness of firms and the competitiveness of nations because both concepts sounds similar but are totally different. The former focuses on the market share and profitability whereas the later is measured by the productivity of the resources utilized in that location. Although companies and locations are always dependent on one another because companies have to operate in geographical locations so there is a synergy between the two. But still, they are dissimilar. Trade between nations is a positive-‐sum game whereas competition between rival firms is a zero-‐sum game.
Multiple Geographic Levels
WORLD ECONOMY
BROAD ECONOMIC AREAS
GROUP OF NEIGHBOURING NATIONS
NATIONS
STATES, PROVINCES
METROPOLITAN AREAS, RURUAL AREAS [Our Focus]
4
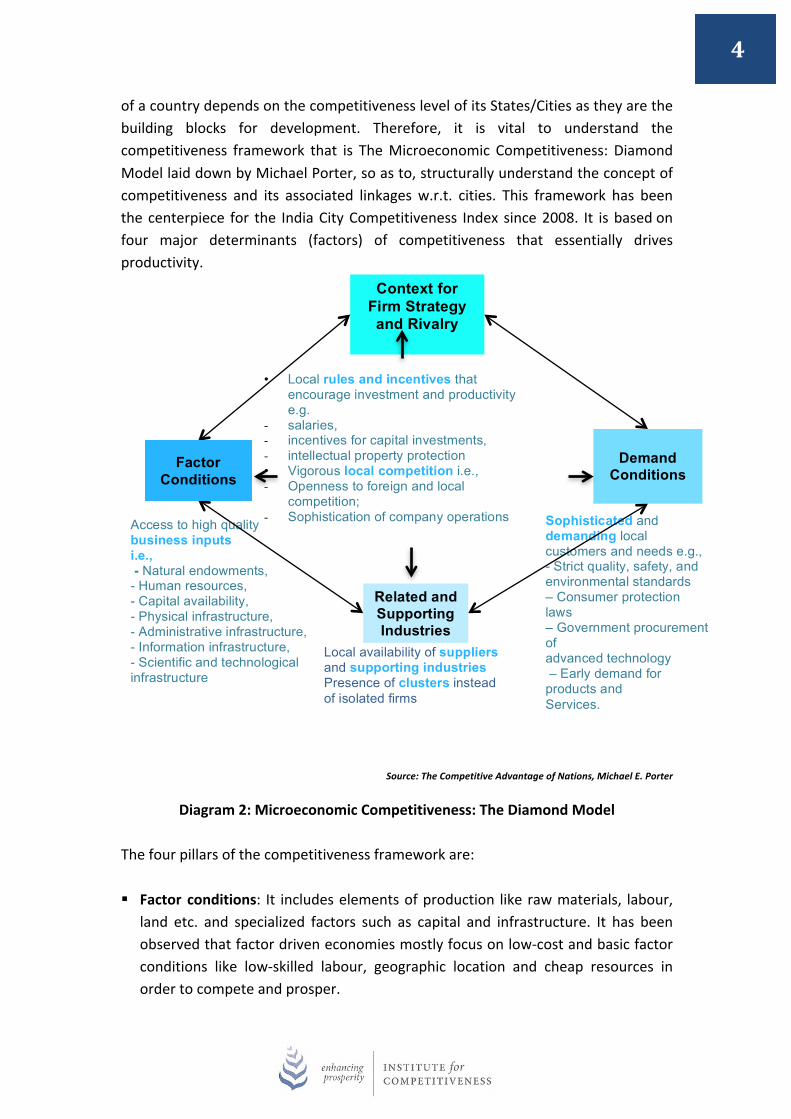
of a country depends on the competitiveness level of its States/Cities as they are the building blocks for development. Therefore, it is vital to understand the competitiveness framework that is The Microeconomic Competitiveness: Diamond Model laid down by Michael Porter, so as to, structurally understand the concept of competitiveness and its associated linkages w.r.t. cities. This framework has been the centerpiece for the India City Competitiveness Index since 2008. It is based on four major determinants (factors) of competitiveness that essentially drives productivity.
Source: The Competitive Advantage of Nations, Michael E. Porter
Diagram 2: Microeconomic Competitiveness: The Diamond Model The four pillars of the competitiveness framework are: § Factor conditions: It includes elements of production like raw materials, labour,
land etc. and specialized factors such as capital and infrastructure. It has been observed that factor driven economies mostly focus on low-‐cost and basic factor conditions like low-‐skilled labour, geographic location and cheap resources in order to compete and prosper.
Context for Firm Strategy and Rivalry
Related and Supporting Industries
Demand Conditions
• Local rules and incentives that encourage investment and productivity e.g.
- salaries, - incentives for capital investments, - intellectual property protection • Vigorous local competition i.e., - Openness to foreign and local
competition; - Sophistication of company operations
Local availability of suppliers and supporting industries Presence of clusters instead of isolated firms
Sophisticated and demanding local customers and needs e.g., - Strict quality, safety, and environmental standards – Consumer protection laws – Government procurement of advanced technology – Early demand for products and Services.
Access to high quality business inputs i.e., - Natural endowments, - Human resources, - Capital availability, - Physical infrastructure, - Administrative infrastructure, - Information infrastructure, - Scientific and technological infrastructure
Factor Conditions
5
§ Demand conditions: These take into consideration the needs, preferences and demands of consumers in an economy. In other words, what product or service does consumers want and what is their affordability ratio in terms of income etc. So the firms, those are better able to understand their consumer in sync with their increasing or decreasing demand for better and innovative product or services that would eventually become more competitive.
§ Context for firm strategy and rivalry: In this competitive environment, firms are
driven to work by increasing their productivity and invention in and around the area. Today, the market is inundated with many local and international companies, which are competing to gain profits, and remain sustainable in the long run. Although, nurturing domestic clusters of competition and encouraging healthy international competition is always a difficult balance. The local rules of taxation and incentives can be beneficial for the growth and prosperity of the businesses. On top of that, role of regulation and industry promotion is also important for sustainable growth.
§ Supporting and related industries: The Diamond model supports a value chain
perspective where the presence of supporting clusters facilitates the exchange of resources and knowledge. Certainly, cluster of firms would exhibit improved productivity levels than isolated firms. It offers better proximity to upstream as well as downstream industries, impacting the dynamism of business activities.
All the four pillars are not mutually exclusive instead they are closely knitted with one another, so there is a high level of dependency among all. For instance, literacy levels in a city (in factor conditions) and population (in demand conditions) influence the talent capacity of firms and its operation (in the context for firm strategy and rivalry) and the sophistication of demand and market potential. Each pillar is a weighted average of many different variables wherein each variable evaluates a different dimension of competitiveness. So, the Diamond model integrates all the determinants and brings a holistic approach to understand and measure the concept of competitiveness.
1.3 Some of the salient features
President and Distinguished Professor of the Santa Fe Institute, Geoffrey West with his team had founded that the all cities share common underlying dynamics. They can be believed as scaled versions of one another. In addition, according to his results a city starts doubling when there is an increase in the economic productivity of a person by nearly 15%. Clearly, indicating that cities are wealth creators, social
6
accelerators and innovation bedrock. Cities keep on competing and collaborating simultaneously to meet he future targets. Even the Indian cities are growing rapidly, and the aggregation of their impact is acting as a growth booster for the Indian economy. Some of the leading Indian cities such as Delhi, Mumbai, and Bengaluru etc. have changed the entire outlook of the country. It has helped India to emerge as the desirable destination on the parameters like, economical stability, human capital, cultural diversity and physical capital. Therefore, it is important to track them, understand them and measure their current performance levels. Now the work becomes easy with the competitiveness rankings of Institute for Competitiveness, India. The India City Competitiveness rankings are vital in nature because they highlight the strengths that should be build and the challenges that must be addressed.
The India City Competitiveness Report 2013 focuses on the concepts that is known to many but understood by few. They are Moving towards urbanization: Indeed, India is urbanizing fast. More than 30% of the Indian population is today residing in urban areas, and if estimates have to be believed then close to 600 million people will reside in the Indian urban areas by 2031. However, there lies a huge demand supply gap between expectations and
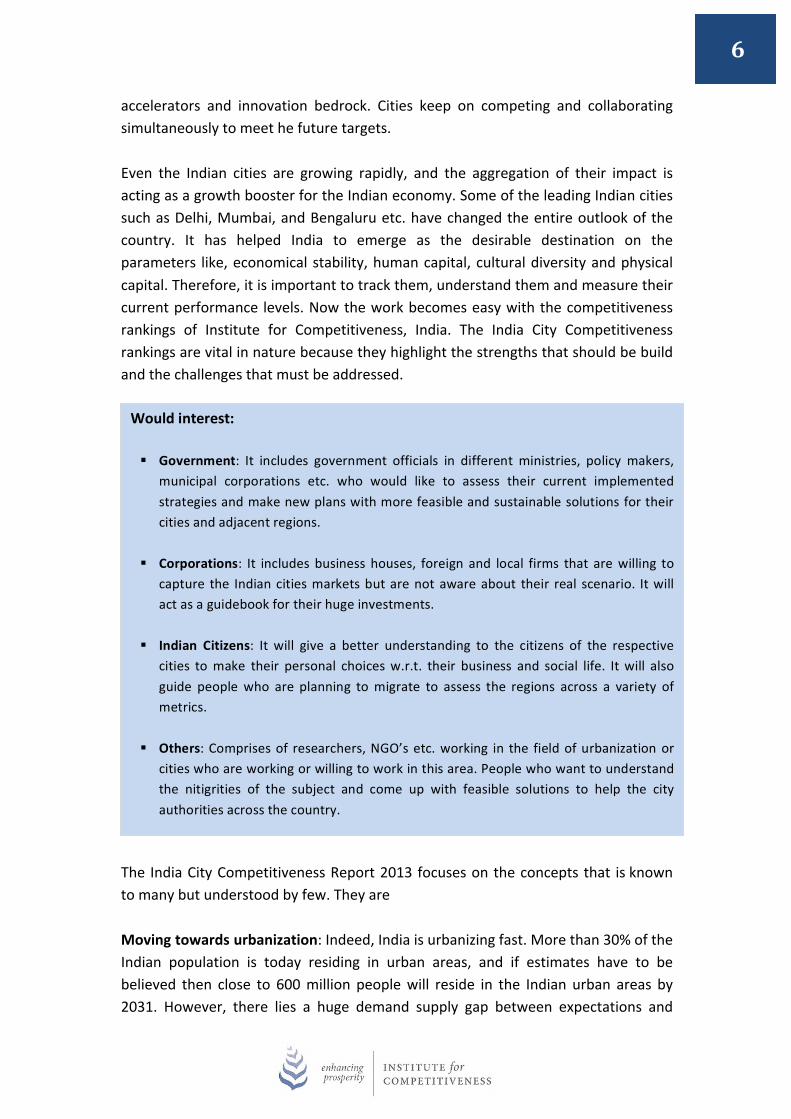
Would interest: § Government: It includes government officials in different ministries, policy makers,
municipal corporations etc. who would like to assess their current implemented strategies and make new plans with more feasible and sustainable solutions for their cities and adjacent regions.
§ Corporations: It includes business houses, foreign and local firms that are willing to capture the Indian cities markets but are not aware about their real scenario. It will act as a guidebook for their huge investments.
§ Indian Citizens: It will give a better understanding to the citizens of the respective
cities to make their personal choices w.r.t. their business and social life. It will also guide people who are planning to migrate to assess the regions across a variety of metrics.
§ Others: Comprises of researchers, NGO’s etc. working in the field of urbanization or
cities who are working or willing to work in this area. People who want to understand the nitigrities of the subject and come up with feasible solutions to help the city authorities across the country.
7
reality. Thus to move up the competitiveness levels, the potential of the urban areas should be harnessed resourcefully.
Reality of Indian cities: Indian cities are fascinating. They are the real game changer and the prospering ground for the country to boom further. Although, they seem to be well equipped from a distance, but they are scathing from inside. They lack certain important qualities such as inadequate infrastructure, dearth of basic amenities, poor governance etc. If we take care of these parameters then, undoubtedly they can emerge as one of the best cities of the world and compete with the international cities.
Role of Government: Government is the key authority that is responsible for the development of a region in all dimensions. It plays an inevitable role at all levels (central, state and district) so as to look after the prosperity levels of a region. Although due to complex hierarchy, physical implementation of rules and regulation takes time. Thus affecting the operations of a region and slowing down its progress.
Competitiveness leading to holistic growth: Competitiveness is a complex concept and is understood differently by different people. In simpler terms, it determines the efficiency between two entities by gauging their productivity levels through different parameters. Thus, it is a holistic approach to assess the growth of a region.
Mutual efforts needed: There is an urgent need for strong collaboration between government at all levels, institutions, corporate organizations and public. Active participation is required from all players that directly or indirectly influence the development of the region. Now, building competitiveness should be their primary concern, so as to, not only become competitive w.r.t. Indian cities but also have a footprint on a global platform.
1.4 India’s Competitiveness
India is losing its charm on the global front as every year it is scoring low on the Global Competitiveness Index (GCI). Clearly, demonstrating its low level of competitiveness w.r.t. other countries. From 2009 to 2012, the ranking of India has dropped by ten. This ranking transformation illustrates the poor performance of the country on several pillars. If the decline of the country is traced frontward on the Global Competitiveness Report 2012-‐13, then India stood on 49 rank in 2009-‐10, moved to 51 in 2010-‐11, 56 in 2011-‐12 and finally touched 59 in 2012-‐13. It is still stuck in its first stage of development and is tagged as one of the factor-‐driven economies.
8
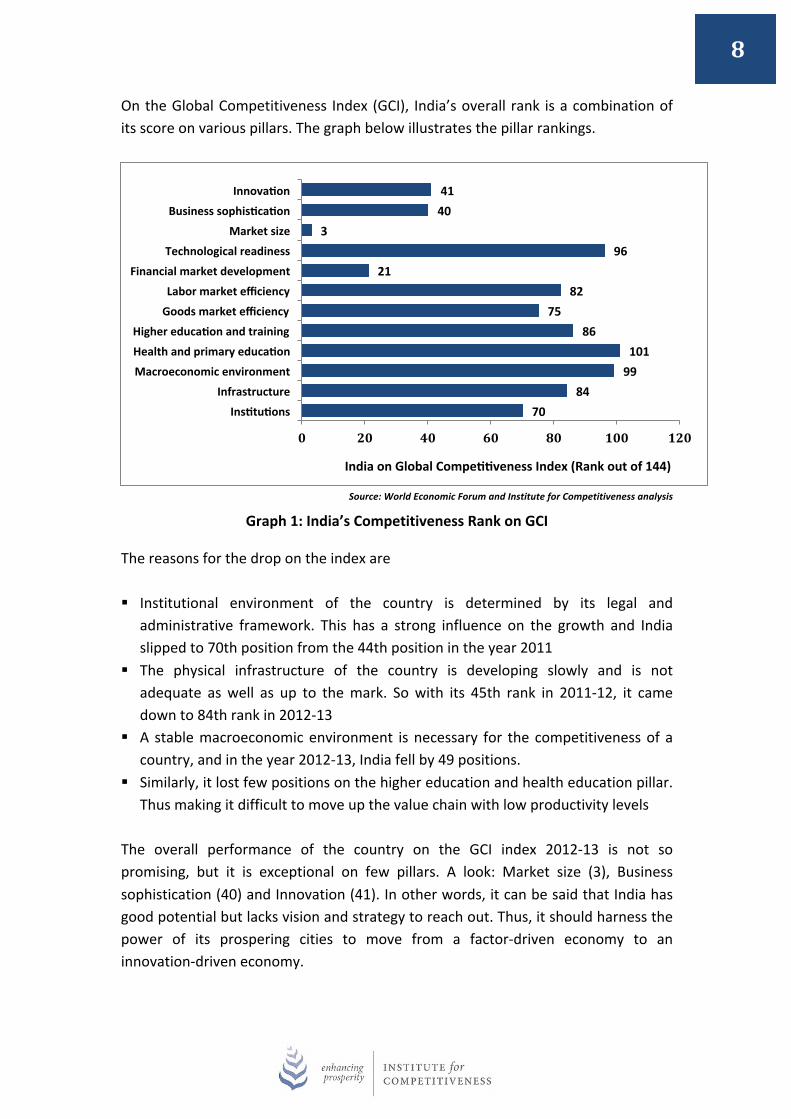
On the Global Competitiveness Index (GCI), India’s overall rank is a combination of its score on various pillars. The graph below illustrates the pillar rankings.
Source: World Economic Forum and Institute for Competitiveness analysis
Graph 1: India’s Competitiveness Rank on GCI
The reasons for the drop on the index are
§ Institutional environment of the country is determined by its legal and administrative framework. This has a strong influence on the growth and India slipped to 70th position from the 44th position in the year 2011
§ The physical infrastructure of the country is developing slowly and is not adequate as well as up to the mark. So with its 45th rank in 2011-‐12, it came down to 84th rank in 2012-‐13
§ A stable macroeconomic environment is necessary for the competitiveness of a country, and in the year 2012-‐13, India fell by 49 positions.
§ Similarly, it lost few positions on the higher education and health education pillar. Thus making it difficult to move up the value chain with low productivity levels
The overall performance of the country on the GCI index 2012-‐13 is not so promising, but it is exceptional on few pillars. A look: Market size (3), Business sophistication (40) and Innovation (41). In other words, it can be said that India has good potential but lacks vision and strategy to reach out. Thus, it should harness the power of its prospering cities to move from a factor-‐driven economy to an innovation-‐driven economy.
70 84
99 101
86 75
82 21
96 3
40 41
0 20 40 60 80 100 120
Insatuaons
Infrastructure
Macroeconomic environment
Health and primary educaaon
Higher educaaon and training
Goods market efficiency
Labor market efficiency
Financial market development
Technological readiness
Market size
Business sophisacaaon
Innovaaon
India on Global Compeaaveness Index (Rank out of 144)
9
1.5 A look at the competitiveness of regions & cities in India
The importance of the role played by regions and its associated factors in the development of the country has been documented long back. Urban regions and cities share a mutual relationship in influencing the prosperity of the national economy. The developmental pace of a country depends on the economy of its regions and cities as successful ‘regional drivers’ and not the other way round. Many indispensable levels of competitiveness exist at the regional level. They not only contribute economically but also provide better quality of life via product and service innovation and technology. To exemplify, the cities of Gujarat have attracted a large number of people because they are providing better residential space, more industrial opportunities and have good governance structure. Cities like Ahmedabad and Surat are acting as most desirable destinations for citizens and investors. They are also competing and collaborating consequently to become highly competitive which is evident by the growth of the State. It is thus necessary that regions and cities compete with each other to improve the overall competitiveness of the nation.
Building up competitiveness is a solution to the various challenges that are encountered by Indian cities. If worked upon vigilantly and prudently then these future cities might also become the best cities of the world.
There is no single policy or step to achieve competitiveness. It is a step-‐by-‐step process, which might take a number of years to build upon and improve.
BOX 2: Success Story of the Indian IT city Bengaluru Preeminent pace with which Bengaluru has risen aloft and emerged as one of the most vibrant, important and successful city is incredible. The Silicon Valley of India has come a long way from being just an education hub in South India to appear as the technology center of the country, centered with the best talent pool. Forbes magazine has titled the city as one of the “Next Decade’s Fastest-‐Growing Cities” because of its phenomenal economic growth of 10.3%, good infrastructure and for being the business center for various kinds of enterprise and trade purposes. It is a city which is packed with good economic growth, fitted with multicultural society, provide steady infrastructure facilities and a lot of opportunities to study and work further. It is also apt for business alliances and has a rich green environment. In the words of Harvard University’s Edward Glaeser – “Bangalore is a model of how an urban agglomeration can bring prosperity to a poor country.” In spite of facing the same set of problems like other cities, the city has projected itself as a successful city. The city is a true urban face of India which has and will constantly make the country proud in future.
10
Each parameter including, education, infrastructure, efficient capital markets, skilled workforce and favorable environment are crucial and required to improve the competitiveness of the region.
1.6 Urbanization: A Phenomenon in context to India Urbanization is a continuous and an inevitable part of the economic development and social change. In India, urbanization is taking place mainly because of the rapid increase in population and partially due to the increase in migration of people from rural to urban areas. These people are coming to cities in search of better opportunities, to have good living conditions and working environment. According to the urban growth statistics of India, the pace of urbanization has slowed during the past 20 years. The urban growth rate was 46% in between the period of 1971 and 1981, which fell to 36% from 1981 to 2001 and then moved to 31.8% from 2001 to 2011. It might look a bit confusing, but the average urban growth rate of the country has increased in comparison to its average growth rate of the rural population, which is a good sign. The urban-‐rural divide in India was 31.16% and 64.84% as measured by the Government of India in Census 2011.
The pace of urbanization in India has been relatively slow when compared to many other developing countries. Only 31.16% of India’s population can be classified as urban. Also, the populous country of the world, China has 45% of its population under the bracket of urbanization. Still, the country is clearly trying its limited
Definition: ‘Urban areas’ in India All the statutory places with a Municipal Corporation, Cantonment Board, or Notified town Area Committee, and all places satisfying the following three criteria simultaneously:
(i) A minimum population of 5000 (ii) At least 75% of male working population engaged in non-‐agricultural; pursuits (iii) A population density of at least 400 per sq. km (1000 per sq. mile)
In addition, some areas falling in the vicinity of city or town are also considered as urban areas if they are treated as the out growths (OGs) of the main urban unit. Such OGs are shown as urban agglomerations. As per the census definition, Urban Agglomeration is a continuous urban spread constituting a town and its adjoining urban outgrowths (OGs) or two or more physical contiguous town together and any adjoining urban out growths of such towns.
Source: Census of India 2011 Press Release: Rural – Urban distribution of Population
11
resource base and trying to fill the existent gap between the demand and supply of resources. It is a proven fact that cities are the drivers of urbanization, so they are affected with the positive as well as with the negative side of this phenomenon. Cities with their charismatic features such as accessibility of resources and easy availability of opportunities help them to accelerate their density levels and growth trajectory. In short, attracting a pool of people and further creating problems, especially in reference to India because in conjunction with people, comes pool of challenges. Even small problems like water supply, roads, transportation system, street lighting etc. create additional challenges for the citizens and the authority of the region.
BOX 3: Population density: Urban change turning into an urban challenge While India accounts for a meager 2.4% of the world surface area, it supports and sustains a whopping 17.5% of the world population. In other words, with a surface area of just 135.79 million square km it is a home for 1.241 billion which makes the population density (per sq. km) of the country to 382 per sq. km in 2011. Comparing with the figures of 2001, it was observed that there was an increase of 57 people on every square kilometer. As evident, India is reckoned as one of the most populous countries of the world. In terms of population density, it is only second to Bangladesh which is the country with the highest population density. In Bangladesh, nearly 964 people reside on every square kilometer as reported by Bangladesh Bureau of Statistics in 2011. The increasing population density of the country is certainly a matter of concern for many people. It adversely affects the entire country in terms of degrading the quality of life and by putting pressure on the natural resources and existing infrastructural services. It is especially problematic for the authorities in the urban areas where managing resources and people become a huge challenge. Densely populated cities are a common feature in India. The top five densely populated cities have a population of 10,000 and above. In the sequence they can be listed as Chennai, (26903), Kolkata (24252), Mumbai (20925), Hyderabad (18480) and Delhi (11297). These cities are bedrocks of prosperity that continuously attract people from rural areas and thus leading to rapid population boom. As a result, majority of the people living in these cities are born in their native places but brought up in these populated cities. Thus, cities with high densities can act as a blessing or a curse wherein the bad effects are known to all. If the resources are in abundance and policies are in place, then the planned structure of the city can lead to the growth of prosperous regions.
12
To tackle this incredible wave of change, the Indian cities have to incorporate several dimensions in their present structure so as to exhibit overall development. It is gauged that cities need an integrated urban mobility system, 70% new employees to fill in the vacancies at various positions, 1.2 trillion capital investments etc. to serve the 91 million households of the middle class that is currently 22 million. Hence, the cities are going to grow exceptionally fast and would also need adequate resources at the same pace. It is also believed that the emerging India of the future will not be known by its major metros like Delhi, Mumbai and Kolkata etc. but the new and middle class dominated cities like Pune, Ahmedabad, Bengaluru will become the face of the nation. Thus, it will require implementation of thoughtful policies and careful urban planning.
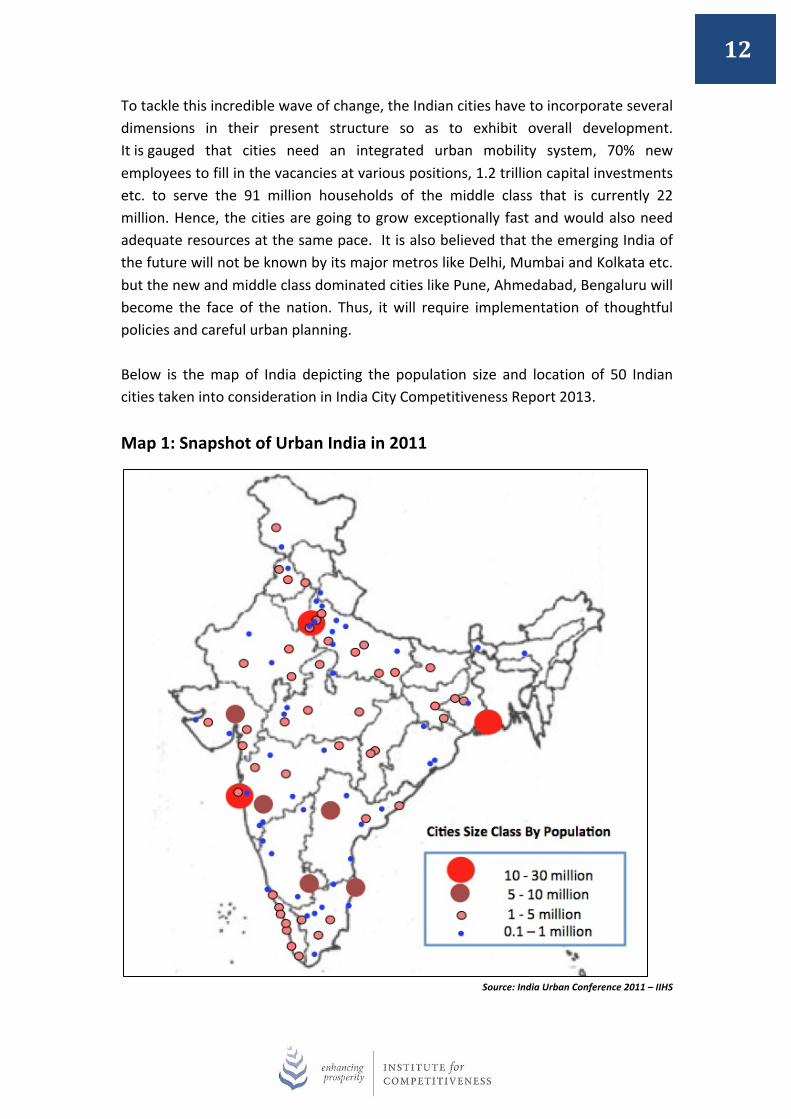
Below is the map of India depicting the population size and location of 50 Indian cities taken into consideration in India City Competitiveness Report 2013. Map 1: Snapshot of Urban India in 2011
Source: India Urban Conference 2011 – IIHS
13
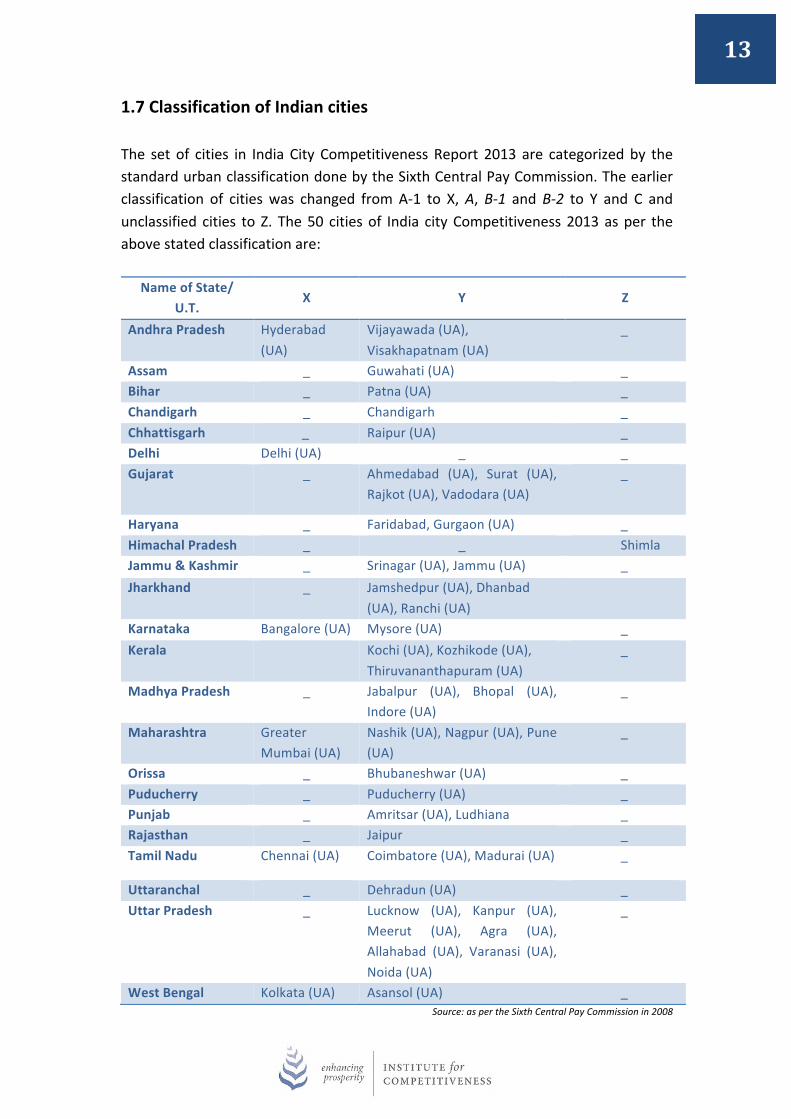
1.7 Classification of Indian cities
The set of cities in India City Competitiveness Report 2013 are categorized by the standard urban classification done by the Sixth Central Pay Commission. The earlier classification of cities was changed from A-‐1 to X, A, B-‐1 and B-‐2 to Y and C and unclassified cities to Z. The 50 cities of India city Competitiveness 2013 as per the above stated classification are:
Name of State/ U.T.
X Y Z
Andhra Pradesh Hyderabad (UA)
Vijayawada (UA), Visakhapatnam (UA)
_
Assam _ Guwahati (UA) _ Bihar _ Patna (UA) _ Chandigarh _ Chandigarh _ Chhattisgarh _ Raipur (UA) _ Delhi Delhi (UA) _ _ Gujarat _ Ahmedabad (UA), Surat (UA),
Rajkot (UA), Vadodara (UA) _
Haryana _ Faridabad, Gurgaon (UA) _ Himachal Pradesh _ _ Shimla Jammu & Kashmir _ Srinagar (UA), Jammu (UA) _ Jharkhand _ Jamshedpur (UA), Dhanbad
(UA), Ranchi (UA)
Karnataka Bangalore (UA) Mysore (UA) _ Kerala Kochi (UA), Kozhikode (UA),
Thiruvananthapuram (UA) _
Madhya Pradesh _ Jabalpur (UA), Bhopal (UA), Indore (UA)
_
Maharashtra Greater Mumbai (UA)
Nashik (UA), Nagpur (UA), Pune (UA)
_
Orissa _ Bhubaneshwar (UA) _ Puducherry _ Puducherry (UA) _ Punjab _ Amritsar (UA), Ludhiana _ Rajasthan _ Jaipur _ Tamil Nadu Chennai (UA) Coimbatore (UA), Madurai (UA) _
Uttaranchal _ Dehradun (UA) _ Uttar Pradesh _ Lucknow (UA), Kanpur (UA),
Meerut (UA), Agra (UA), Allahabad (UA), Varanasi (UA), Noida (UA)
_
West Bengal Kolkata (UA) Asansol (UA) _ Source: as per the Sixth Central Pay Commission in 2008
14
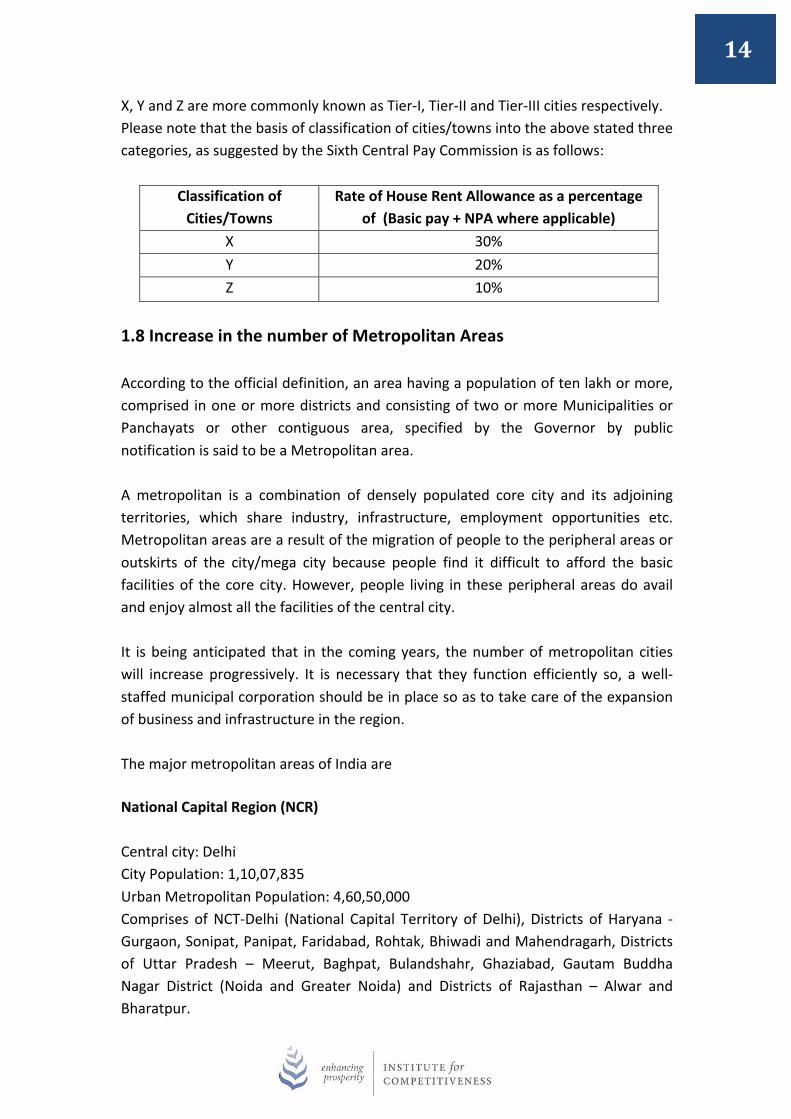
X, Y and Z are more commonly known as Tier-‐I, Tier-‐II and Tier-‐III cities respectively. Please note that the basis of classification of cities/towns into the above stated three categories, as suggested by the Sixth Central Pay Commission is as follows:
Classification of Cities/Towns
Rate of House Rent Allowance as a percentage of (Basic pay + NPA where applicable)
X 30% Y 20% Z 10%
1.8 Increase in the number of Metropolitan Areas According to the official definition, an area having a population of ten lakh or more, comprised in one or more districts and consisting of two or more Municipalities or Panchayats or other contiguous area, specified by the Governor by public notification is said to be a Metropolitan area.
A metropolitan is a combination of densely populated core city and its adjoining territories, which share industry, infrastructure, employment opportunities etc. Metropolitan areas are a result of the migration of people to the peripheral areas or outskirts of the city/mega city because people find it difficult to afford the basic facilities of the core city. However, people living in these peripheral areas do avail and enjoy almost all the facilities of the central city.
It is being anticipated that in the coming years, the number of metropolitan cities will increase progressively. It is necessary that they function efficiently so, a well-‐staffed municipal corporation should be in place so as to take care of the expansion of business and infrastructure in the region. The major metropolitan areas of India are National Capital Region (NCR) Central city: Delhi City Population: 1,10,07,835 Urban Metropolitan Population: 4,60,50,000 Comprises of NCT-‐Delhi (National Capital Territory of Delhi), Districts of Haryana -‐ Gurgaon, Sonipat, Panipat, Faridabad, Rohtak, Bhiwadi and Mahendragarh, Districts of Uttar Pradesh – Meerut, Baghpat, Bulandshahr, Ghaziabad, Gautam Buddha Nagar District (Noida and Greater Noida) and Districts of Rajasthan – Alwar and Bharatpur.
15
Mumbai Metropolitan Region (MMR) Central city: Mumbai, Maharashtra City Population: 1,24,78,447 Urban Metropolitan population: 1,84,14,288 Comprises of Ambernath, Badalapur, Kalyan and Dombivili, Mira and Bhayander, Mumbai and Navi Mumbai, Thane and Ulhasnagar Kolkata Metropolitan Area (KMA) Central city: Kolkata, West Bengal City Population: 44,86,679 Urban Metropolitan population: 1,46,17,882 Comprises of North 24 Parganas, South 24 Parganas, Howrah, Hooghly and Nadia Chennai Metropolitan Area (CMA) Central city: Chennai, Tamil Nadu City Population: 46,81,087 Urban Metropolitan population: 89,17,749 Comprises of Chennai district, Thiruvallur district and Kancheepuram district Bangalore Metropolitan Area Central city: Bengaluru, Karnataka City Population: 84,25,970 Urban Metropolitan population: 87,28,906 Comprises of Hosur, Yeswanthpur, Yelahanka, Anekal, Hebbal, Marathalli etc. Hyderabad Metropolitan Area Central city: Hyderabad City Population: 68,09,970 Urban Metropolitan population: 77,49,334 Comprises of Secunderabad, Bhongir, Kondapur, Medchal etc. Ahmedabad Metropolitan Area Central city: Ahmedabad, Gujarat City Population: 55,70,585 Urban Metropolitan population: 63,52,254
16
Comprises of Gandhinagar, Anand, Kheda, Kadi, Jambusar, Viramgam with other towns and villages Pune Metropolitan Area Central city: Pune, Maharashtra City Population: 31,15,431 Urban Metropolitan population: 50,49,968 Comprises of Pune city and Pimpri-‐Chinchwad town Surat Metropolitan Area Central city: Surat, Gujarat City Population: 44,62,002 Urban Metropolitan population: 45,85,367 Comprises of Surat and its satellite towns
BOX 4: Boundless NCR
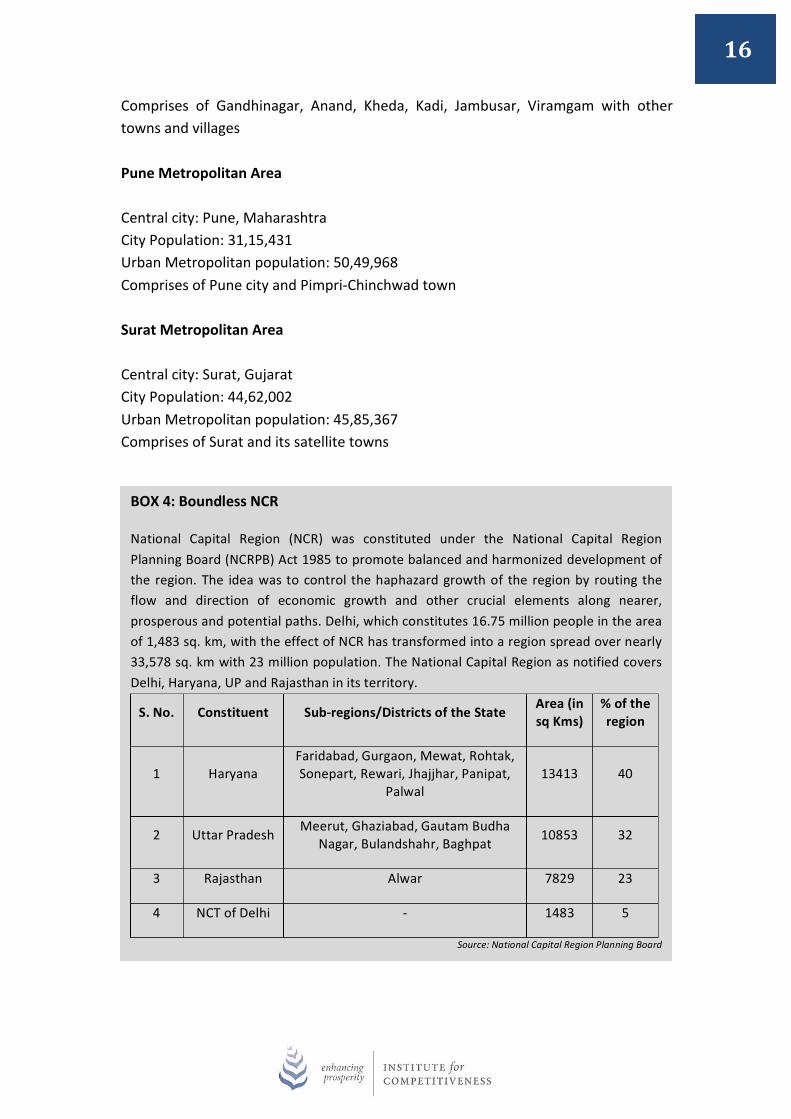
National Capital Region (NCR) was constituted under the National Capital Region Planning Board (NCRPB) Act 1985 to promote balanced and harmonized development of the region. The idea was to control the haphazard growth of the region by routing the flow and direction of economic growth and other crucial elements along nearer, prosperous and potential paths. Delhi, which constitutes 16.75 million people in the area of 1,483 sq. km, with the effect of NCR has transformed into a region spread over nearly 33,578 sq. km with 23 million population. The National Capital Region as notified covers Delhi, Haryana, UP and Rajasthan in its territory.
S. No. Constituent Sub-‐regions/Districts of the State Area (in sq Kms)
% of the region
1 Haryana Faridabad, Gurgaon, Mewat, Rohtak, Sonepart, Rewari, Jhajjhar, Panipat,
Palwal 13413 40
2 Uttar Pradesh Meerut, Ghaziabad, Gautam Budha Nagar, Bulandshahr, Baghpat 10853 32
3 Rajasthan Alwar 7829 23
4 NCT of Delhi -‐ 1483 5
Source: National Capital Region Planning Board
17
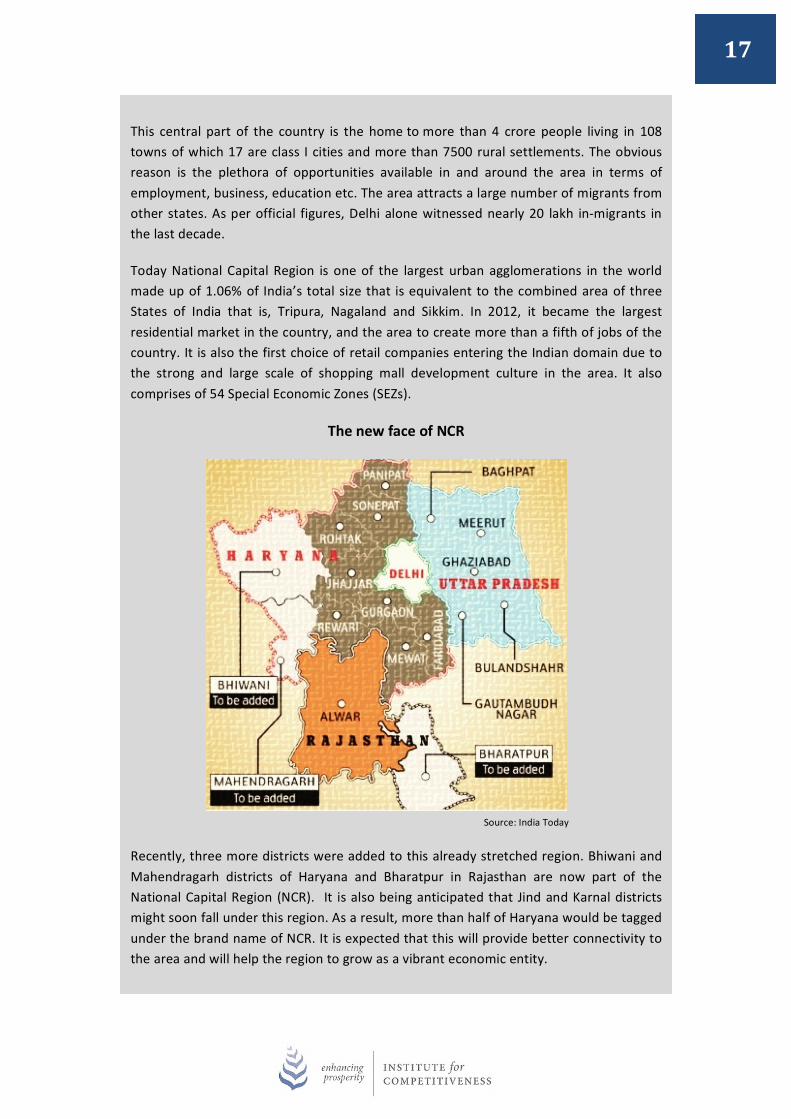
This central part of the country is the home to more than 4 crore people living in 108 towns of which 17 are class I cities and more than 7500 rural settlements. The obvious reason is the plethora of opportunities available in and around the area in terms of employment, business, education etc. The area attracts a large number of migrants from other states. As per official figures, Delhi alone witnessed nearly 20 lakh in-‐migrants in the last decade.
Today National Capital Region is one of the largest urban agglomerations in the world made up of 1.06% of India’s total size that is equivalent to the combined area of three States of India that is, Tripura, Nagaland and Sikkim. In 2012, it became the largest residential market in the country, and the area to create more than a fifth of jobs of the country. It is also the first choice of retail companies entering the Indian domain due to the strong and large scale of shopping mall development culture in the area. It also comprises of 54 Special Economic Zones (SEZs).
The new face of NCR
Source: India Today
Recently, three more districts were added to this already stretched region. Bhiwani and Mahendragarh districts of Haryana and Bharatpur in Rajasthan are now part of the National Capital Region (NCR). It is also being anticipated that Jind and Karnal districts might soon fall under this region. As a result, more than half of Haryana would be tagged under the brand name of NCR. It is expected that this will provide better connectivity to the area and will help the region to grow as a vibrant economic entity.
18
It is noted that the NCR region is doing fairly well on many economical parameters. The per capita income, rate of growth of both GDP and per capita income have consistently been higher in comparison to the rest of the country. In other words, NCR can be labeled as a crucial hub of economic activity in the country.
Although the capital of the country, Delhi, which is the locus of the entire region, is said to be bearing all the load. People in NCR rely more on the facilities of the capital because their cities/regions are not yet well versed and are in a developing stage. Delhi is always under pressure for better health, education and economic infrastructure even though when it is getting better with every passing year. The dependency of the nearby regions on the capital city is unknowingly affecting the prosperity levels of the city. It is being said that NCR is getting bigger so that the infrastructure pressure on Delhi can be reduced. However, it is an indirect invitation to people living in adjoining districts of NCR to come and settle in this boundless region.
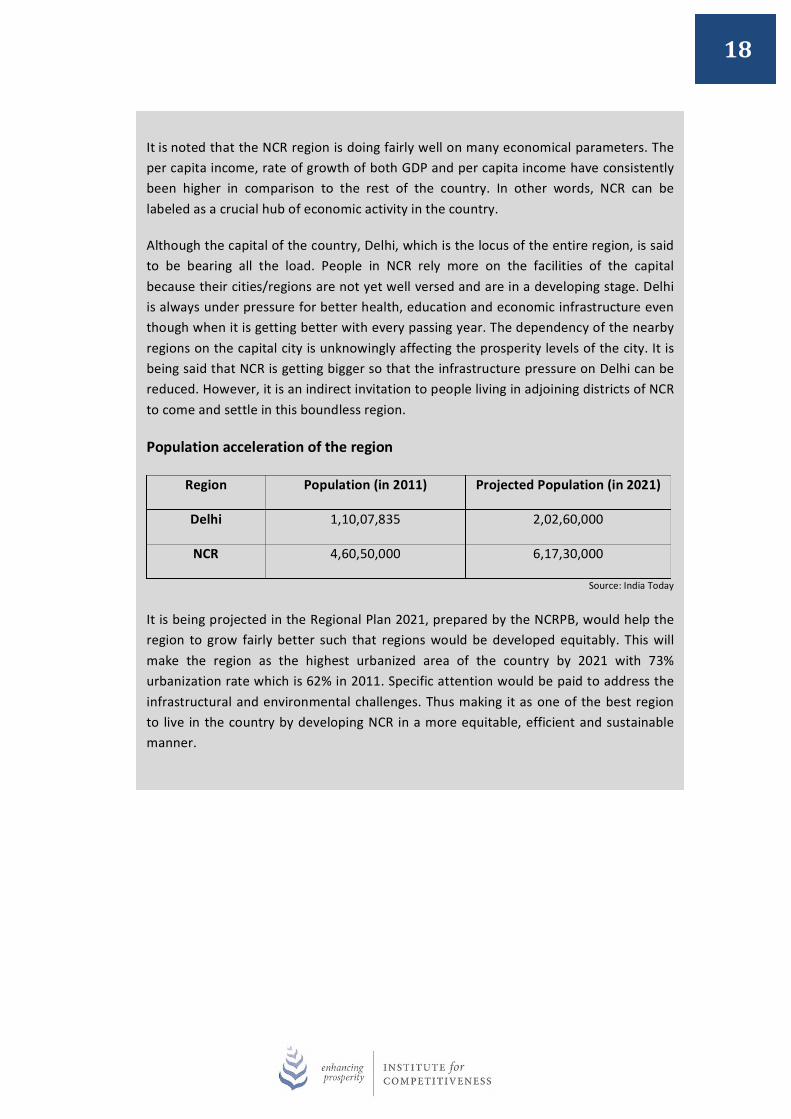
Population acceleration of the region
Region Population (in 2011) Projected Population (in 2021)
Delhi 1,10,07,835 2,02,60,000
NCR 4,60,50,000 6,17,30,000
Source: India Today
It is being projected in the Regional Plan 2021, prepared by the NCRPB, would help the region to grow fairly better such that regions would be developed equitably. This will make the region as the highest urbanized area of the country by 2021 with 73% urbanization rate which is 62% in 2011. Specific attention would be paid to address the infrastructural and environmental challenges. Thus making it as one of the best region to live in the country by developing NCR in a more equitable, efficient and sustainable manner.

19
2.0 METHODOLOGICAL FRAMEWORK
20
Edward Glaeser, an urban economist at Harvard in his book “The triumph of the cities” has stated “Urban density offers the shortest route from misery to prosperity as a result, cities are growing at a high rate in developing countries. Indeed, cities today play a vital role for humans. They have always been an epicenter for economic growth and for technological innovations. They are a reason behind the prosperity of a region as they offer all essential commodities for survival, though with certain constraints. In addition, they are productive, fitted with better opportunities, have higher GDP and are happier than corresponding less urban regions”. Similar is the scenario in India. Indian cities such as Delhi, Mumbai etc. have turned out to be advanced cities that are also the major contributors in the Indian economic growth. Following their footsteps, every decade new set of cities are emerging in the country which might be unnoticed right now but are all packed to create their identity in the Indian arena. Every year, the India City Competitiveness Report, takes into consideration 50 prosperous Indian cities to gauge their competitiveness levels with respect to one another. The rankings on the competitiveness index provide a snapshot of their overall performance and information w.r.t. their financial, social, business performance. 2.1 Unit of Analysis It is frequently observed that there exists a lack of clarification in between the terms such as city, urban agglomeration etc. A common man is not well versed with the difference between these terms. Thus, it is crucial to understand the terms and their definitions firstly in order to get a clear picture of India City Competitiveness 2013. The explanation of the terms as per the Government of India, Census 2011: Towns According to the Government of India, Census 2011, it is:
1. All places with a municipality, corporation, cantonment board or notified town area committee, etc.
2. All other places which satisfied the following criteria: a) A minimum population of 5,000 b) At least 75 per cent of the male main working population engaged in non-‐agricultural pursuits c) A density of the population of at least 400 persons per sq. km. etc.
21
The first category of urban units is known as Statutory Towns. These towns are notified under the law by the concerned State/UT Government and have local bodies like municipal corporations, municipalities, municipal committees, etc., irrespective of their demographic characteristics as reckoned on 31st December 2009. Examples: Vadodara (Municipal Corporation), Shimla (Municipal Corporation) etc. The second category of Towns (as in item 2 above) is known as Census Town. These were identified on the basis of Census 2001 data. City According to the Census of India, a city is essentially a town that constitutes a population of nearly 1,00,000 or above. So, essentially city can be defined in terms of town as well. Urban Local Body The city body appointed by the government and responsible for maintaining and resolving the governance issues in the city is termed as Urban Local Body (ULB). It is also known as Municipal Corporation (MC). ULBs are appointed for those cities that are huge in size and are constantly growing such that, the nearby areas are also flourishing and mistaken as a part of the region. MC is only responsible to take care of the planned area of the city. It also varies from one city to another. To exemplify, Mumbai and Suburban Mumbai are two separate areas adjacent to one another but are taken care by the same governance body. Urban Agglomeration (UA) An urban agglomeration is a continuous urban spread constituting a town and its adjoining outgrowths (OGs), or two or more physically contiguous towns together with or without outgrowths of such towns. An Urban Agglomeration must consist of at least a statutory town and its total population (i.e. all the constituents put together) should not be less than 20,000 as per the 2001 Census. In varying local conditions, there were similar other combinations which have been treated as urban agglomerations satisfying the basic condition of contiguity. Examples: Greater Mumbai UA, Delhi UA, etc.
22
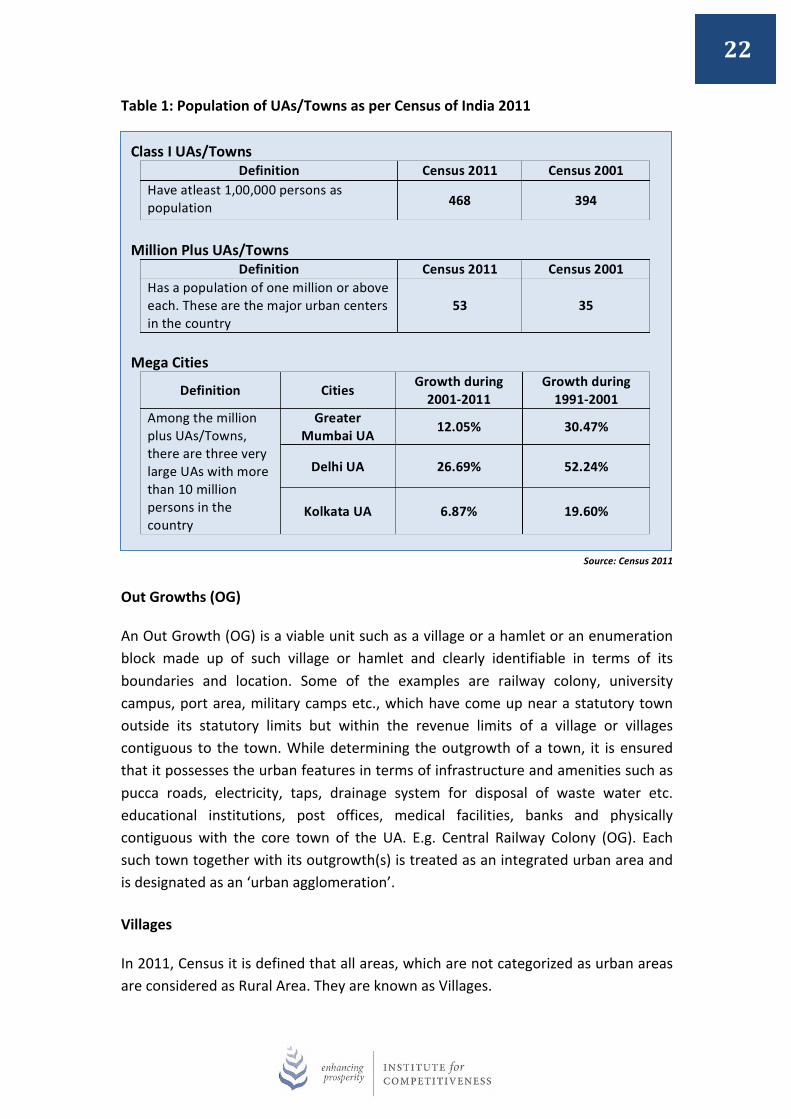
Table 1: Population of UAs/Towns as per Census of India 2011
Source: Census 2011
Out Growths (OG)
An Out Growth (OG) is a viable unit such as a village or a hamlet or an enumeration block made up of such village or hamlet and clearly identifiable in terms of its boundaries and location. Some of the examples are railway colony, university campus, port area, military camps etc., which have come up near a statutory town outside its statutory limits but within the revenue limits of a village or villages contiguous to the town. While determining the outgrowth of a town, it is ensured that it possesses the urban features in terms of infrastructure and amenities such as pucca roads, electricity, taps, drainage system for disposal of waste water etc. educational institutions, post offices, medical facilities, banks and physically contiguous with the core town of the UA. E.g. Central Railway Colony (OG). Each such town together with its outgrowth(s) is treated as an integrated urban area and is designated as an ‘urban agglomeration’. Villages In 2011, Census it is defined that all areas, which are not categorized as urban areas are considered as Rural Area. They are known as Villages.
Class I UAs/Towns Definition Census 2011 Census 2001
Have atleast 1,00,000 persons as population 468 394
Million Plus UAs/Towns
Definition Census 2011 Census 2001 Has a population of one million or above each. These are the major urban centers in the country
53 35
Mega Cities
Definition Cities Growth during 2001-‐2011
Growth during 1991-‐2001
Among the million plus UAs/Towns, there are three very large UAs with more than 10 million persons in the country
Greater Mumbai UA 12.05% 30.47%
Delhi UA 26.69% 52.24%
Kolkata UA 6.87% 19.60%
23
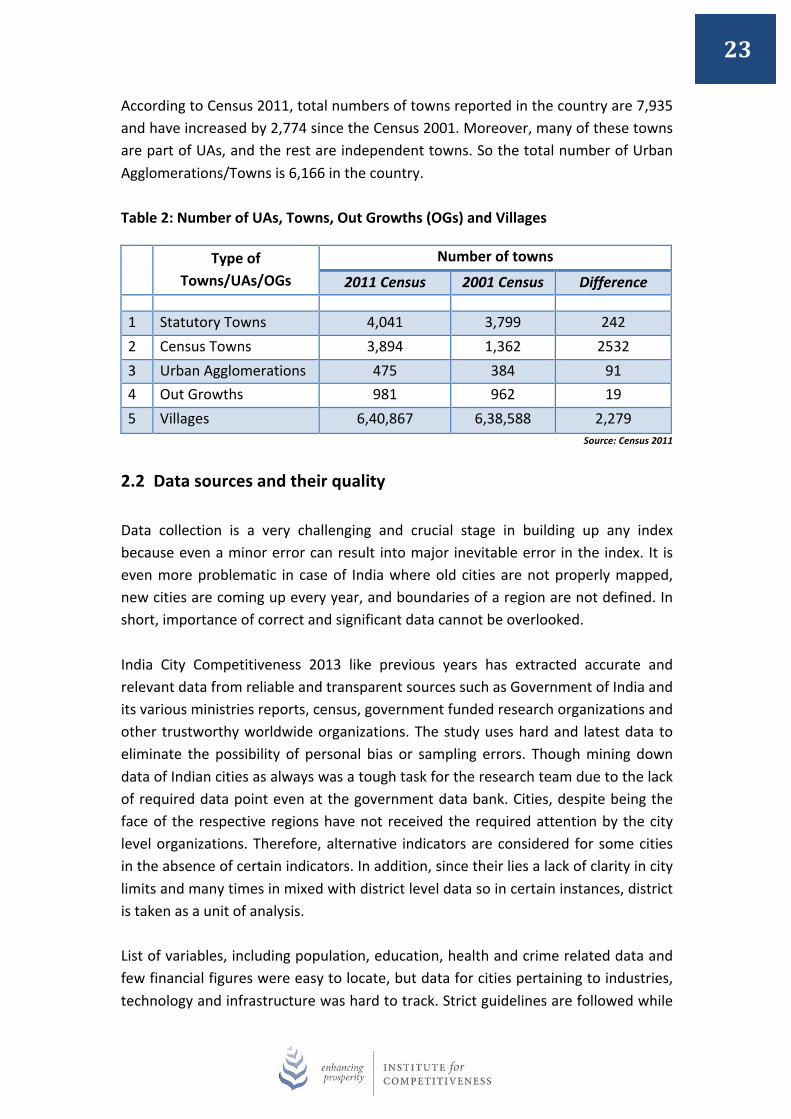
According to Census 2011, total numbers of towns reported in the country are 7,935 and have increased by 2,774 since the Census 2001. Moreover, many of these towns are part of UAs, and the rest are independent towns. So the total number of Urban Agglomerations/Towns is 6,166 in the country. Table 2: Number of UAs, Towns, Out Growths (OGs) and Villages
Type of Towns/UAs/OGs
Number of towns
2011 Census 2001 Census Difference
1 Statutory Towns 4,041 3,799 242 2 Census Towns 3,894 1,362 2532 3 Urban Agglomerations 475 384 91 4 Out Growths 981 962 19 5 Villages 6,40,867 6,38,588 2,279
Source: Census 2011
2.2 Data sources and their quality Data collection is a very challenging and crucial stage in building up any index because even a minor error can result into major inevitable error in the index. It is even more problematic in case of India where old cities are not properly mapped, new cities are coming up every year, and boundaries of a region are not defined. In short, importance of correct and significant data cannot be overlooked. India City Competitiveness 2013 like previous years has extracted accurate and relevant data from reliable and transparent sources such as Government of India and its various ministries reports, census, government funded research organizations and other trustworthy worldwide organizations. The study uses hard and latest data to eliminate the possibility of personal bias or sampling errors. Though mining down data of Indian cities as always was a tough task for the research team due to the lack of required data point even at the government data bank. Cities, despite being the face of the respective regions have not received the required attention by the city level organizations. Therefore, alternative indicators are considered for some cities in the absence of certain indicators. In addition, since their lies a lack of clarity in city limits and many times in mixed with district level data so in certain instances, district is taken as a unit of analysis. List of variables, including population, education, health and crime related data and few financial figures were easy to locate, but data for cities pertaining to industries, technology and infrastructure was hard to track. Strict guidelines are followed while
24
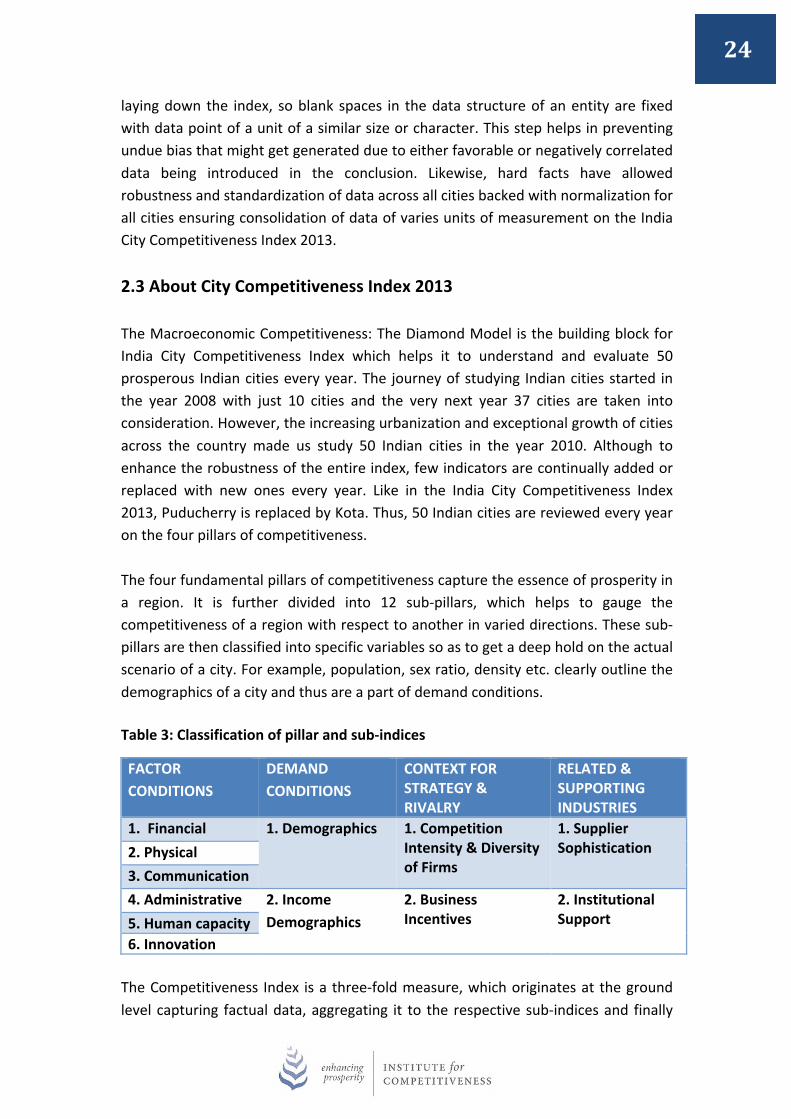
laying down the index, so blank spaces in the data structure of an entity are fixed with data point of a unit of a similar size or character. This step helps in preventing undue bias that might get generated due to either favorable or negatively correlated data being introduced in the conclusion. Likewise, hard facts have allowed robustness and standardization of data across all cities backed with normalization for all cities ensuring consolidation of data of varies units of measurement on the India City Competitiveness Index 2013. 2.3 About City Competitiveness Index 2013 The Macroeconomic Competitiveness: The Diamond Model is the building block for India City Competitiveness Index which helps it to understand and evaluate 50 prosperous Indian cities every year. The journey of studying Indian cities started in the year 2008 with just 10 cities and the very next year 37 cities are taken into consideration. However, the increasing urbanization and exceptional growth of cities across the country made us study 50 Indian cities in the year 2010. Although to enhance the robustness of the entire index, few indicators are continually added or replaced with new ones every year. Like in the India City Competitiveness Index 2013, Puducherry is replaced by Kota. Thus, 50 Indian cities are reviewed every year on the four pillars of competitiveness. The four fundamental pillars of competitiveness capture the essence of prosperity in a region. It is further divided into 12 sub-‐pillars, which helps to gauge the competitiveness of a region with respect to another in varied directions. These sub-‐pillars are then classified into specific variables so as to get a deep hold on the actual scenario of a city. For example, population, sex ratio, density etc. clearly outline the demographics of a city and thus are a part of demand conditions. Table 3: Classification of pillar and sub-‐indices
FACTOR CONDITIONS
DEMAND CONDITIONS
CONTEXT FOR STRATEGY & RIVALRY
RELATED & SUPPORTING INDUSTRIES
1. Financial 1. Demographics 1. Competition Intensity & Diversity of Firms
1. Supplier Sophistication 2. Physical
3. Communication 4. Administrative 2. Income
Demographics 2. Business Incentives
2. Institutional Support 5. Human capacity
6. Innovation The Competitiveness Index is a three-‐fold measure, which originates at the ground level capturing factual data, aggregating it to the respective sub-‐indices and finally
25
shaping the data structure in the form of a composite index at the city level. So, the step-‐by-‐step integration of data points provides a holistic picture of Indian cities.
2.4 Analysis of data indicators Similar to the data collection, data analysis, which is apparently the last stage of indexing, is crucial because it can distort the composite index and produce meaningless results with false numbers. The database consists of variables from varied socioeconomic dimensions so a good understanding of analysis, and a methodical approach has to be followed to run the analysis. It then gets possible to gain a better realization about the Indian cities and their competitiveness level.
The variables are synchronized and validated with the Microeconomic Competitiveness – The Diamond Model pillar and sub-‐pillars to arrive at the final index for competitiveness. Weights are assigned to each indicator (variable) after a comprehensive and meticulous research. To prevent multicollinearity among different indicators in the index, the concept of Principal Component Analysis is applied. The modified analysis clearly explains the relationship of one indicator with another and also its overall impact on the competitiveness index. The measure also determines the reliability and transparency enabling and aiding strategy formulation and policy execution.
India City Competitiveness Report 2013 thus combines all the significant information about the selected 50 Indian cities and brings the competitiveness ranking. It presents the actual situation of Indian cities; identifies individual city’s strong and weak areas and their respective level of supremacy on different dimensions of competitiveness. It is not merely a report; instead it is a guide which can allow its readers to curate new scenarios, identify and modify settings for each city for further discovery.
2.5 Steps Undertaken
While preparing India City Competitiveness Report, we at the Institute for Competitiveness, India follows a very methodological and standardized process. It is described as follows:
STEP 1: Developing a framework
Following the systematic guidelines, the first step is to understand and use the Microeconomic Competitiveness: The Diamond Model to measure the
26
competitiveness of different regions. It is a well-‐known and accepted model to measure the regional competitiveness.
STEP 2: Identifying the relevant variables
Competitiveness is a broad term, comprising of several factors that in a particular way impact the state of an entity. Therefore, depending on the respective sub-‐pillar, the indicators are chosen so as to come up with feasible result. In the index, the central variables are interpreted with quantitative data so that the city can be accurately portrayed and assessed reasonably.
STEP 3: Collection of data points
Building the data bank for the index is a difficult but critical task, especially in the case of Indian cities. So, data is collected cautiously from reliable sources such as government sources. Special attention is paid on making the data set more robust by incorporating recent updates so as to build an authentic index that represents the true nature of a city.
STEP 4: Analyzing Factor Conditions
The factor conditions are mainly defined by sub-‐indices such as financial market, physical conditions, communication modes, administration process, human capacity of the region and degree of innovation. These should be carefully reviewed to understand the cross-‐linkages between them and to measure the level of influence.
STEP 5: Exploring Demand Conditions
The sub-‐pillars of demand conditions are demographics and the distribution of income within the region. It is useful for many investors seeking to understand the patterns of changes in a set time frame.
STEP 6: Examining Business Opportunities
Business opportunities are mainly defined by the context for rivalry and firm level strategy. This information is of vital use for the business houses to identify competition intensity and business incentives of a region, which would eventually benefit the residents of the city directly or indirectly in the long run.
STEP 7: Investigating the scope of Threat and Opportunities
27
The index on the context of rivalry and strategy pillar provides detail about the supplier sophistication and institutional support. It centers on the internal (local control of the city) and external (resources used for the city’s development) factors that influence the performance of business and other operations in the city.
STEP 8: Computing the Competitiveness Index The various indicators on all the four pillars are aggregated so as to come up with a composite index. The process involves basic computation on the basis of the weights of sub-‐pillars which then totals up to the main pillars. Thus, data is monitored analytically to present the real scenario prevailing across the Indian cities. 2.6 The 50 Indian cities addressed
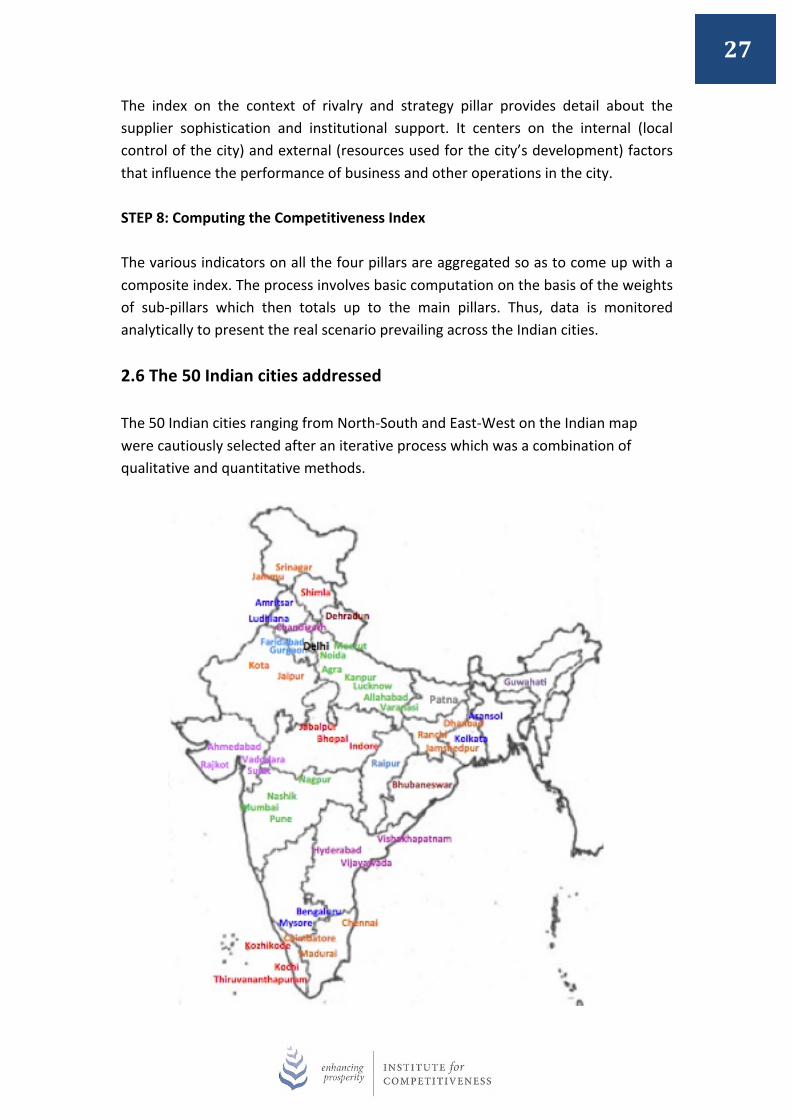
The 50 Indian cities ranging from North-‐South and East-‐West on the Indian map were cautiously selected after an iterative process which was a combination of qualitative and quantitative methods.

28
3.0 RANKINGS

29
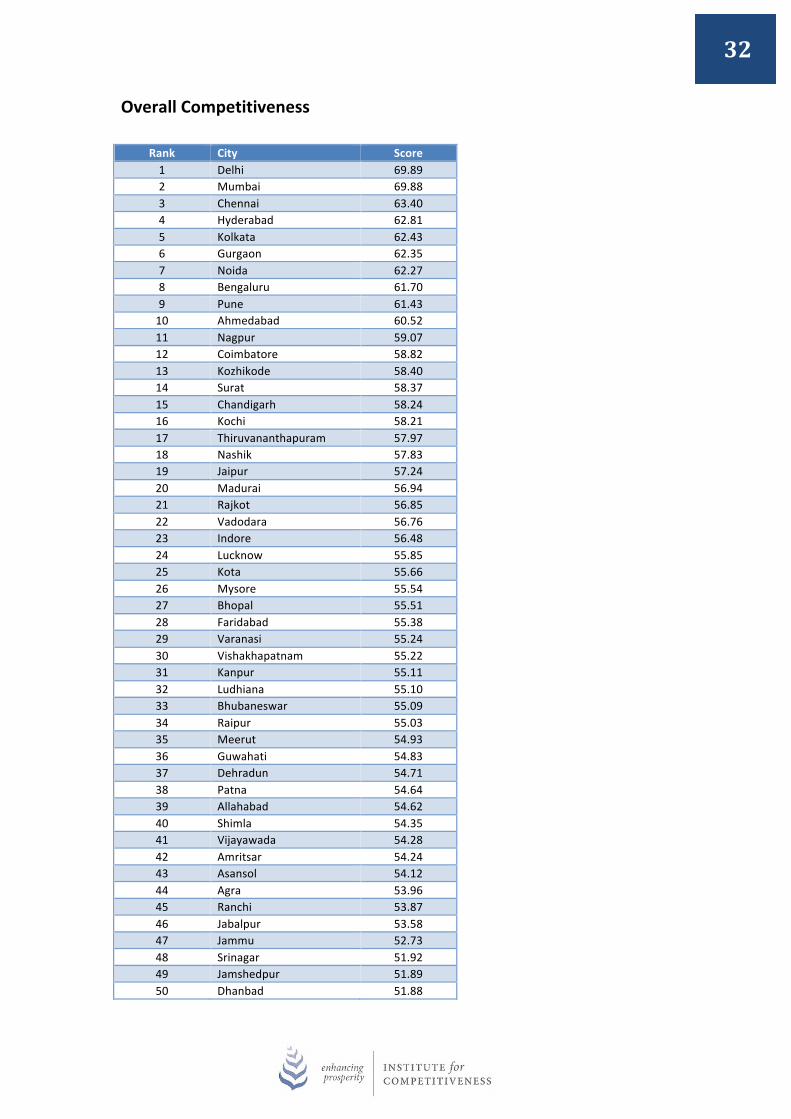
Earlier cities were merely cited as the engines of national growth, but now they have become the hotspots of talent, innovation and prosperity. They play a crucial role in influencing the development and competitiveness of their national economies and are of utmost importance. Therefore, it is important to keep in mind that cities have their own limits and should not be pressurized beyond a certain level, instead, work should be done on their weak areas. Resources should be equally made accessible to other cities. Developmental policies should be put in place so as to connect the missing links of these cities and then, giving them more space to grow. It thus becomes imperative to assess the present state of these cities and nurture them accordingly. The India City Competitiveness Report 2013 thus makes the task easy and brings the competitiveness rankings of 50 Indian cities. According to the competitiveness Index 2013, Delhi has emerged as the most competitive city in the country. It is closely followed by Mumbai, which has successfully maintained its last year’s position. However, there are small changes in the rankings of the rest of the cities, in comparison to their rankings on competitiveness index in 2012. Thus, reflecting the growth of one city with respect to another. 3.1 The Top 10 achievers: Most Competitive cities in India As expected, New Delhi has again emerged as the most competitive city. It is stable on the numero UNO position since the last four years. Even Mumbai maintained its position by capturing the title of the second most competitive city in India. It has retained its 2nd position consecutively for three years now (in 2011, 2012 and 2013). Chennai holds the 3rd position and is stable at its place as it was in the city competitiveness index 2012. The much talked about the city of this year Hyderabad is spotted at the 4th place. Kolkata is stable at 5th position on the index. Followed by, Gurgaon at the 6th position as it was in the city competitiveness index 2012. One shift evident in the top ten ranking is, Noida and Bengaluru have swapped their positions. Noida has moved one position upwards and is spotted at 7th position, and Bengaluru has slipped one place and is now at 8th position. Pune is also stable with its 9th position on the competitiveness index 2013. Similarly, The Manchester of East, Ahmedabad is steady at 10th position. In order of merit, the following cities are India’s top ten: Delhi, Mumbai, Chennai, Hyderabad, Kolkata, Gurgaon, Noida, Bengaluru, Pune, and Ahmedabad. These cities are also the most livable and desirable for work, live, play and learn. These cities are the most competitive with high growth potential and micro-‐economic resilience. All of them influence their respective States both economically and politically. Certainly, they will contribute significantly in enhancing the prosperity of the nation and
30
the overall competitiveness. 3.2 The 11-‐20 Positions: Holding immense potential This slot is dominated by the so-‐called small cities. The city at the 11th position is Nagpur and is stable at its position since last year. Coimbatore has moved two places upward and is spotted at the 12th position. Two cities of Kerala, Kozhikode and Thiruvananthapuram were successful in moving up the competitiveness index at 13th and 17th position respectively. On the other hand, Kochi another city from Kerala has dropped one position and is now at 16th position. The city known for its diamonds, Surat has jumped two places and holds the 14th position. Chandigarh has dropped three places and is now at 15th position. Nashik has dropped one place and is at 18th position. Jaipur has moved down to 19th position. Madurai at 20th position is a new entrant in the top 20 competitiveness rankings. Competition in this tier of Indian cities is highly intensive as they are constantly seeking to outdo each other in the category. While competing with one another in this league, these cities benchmark against the first ten and are indeed challenging the achiever cities. The growth potential of these cities attracts younger talent and a new breed of stakeholders. The cities in order of their rankings are Nagpur, Coimbatore, Kozhikode, Surat, Chandigarh, Kochi, Thiruvananthapuram, Nashik, Jaipur and Madurai. These cities have the capacity to succeed if they deploy the right strategy that capitalizes on their resources, flaws and limits. 3.3 The 21-‐30 Positions: On the growth path The city that holds the number one rank in this slot (21-‐30) is Rajkot. It has jumped three places upwards to grab the 21st position. Vadodara is spotted at 22nd position. Followed by Indore at the 23rd position. The capital city of Uttar Pradesh, Lucknow has moved one place upwards and is at 24th position. The new city included in the competitiveness index 2013, Kota is spotted at 25th position. Mysore has dropped five places since last year and is now at 26th position. Bhopal is stable at 27th position. Faridabad has moved upward to 28th position. Two new cities have entered this slot of cities moving on the growth path. Varanasi has grabbed the 29th position, and Vishakhapatnam has grabbed the 30th position. These cities may seem to be lacking in some fundamentals, but they have just embarked their journey towards the 21st century and therefore open to new ideas and external investment. These cities may develop the “x factor”, which will help them to ascend the ladder of competitiveness in the future. The cities in this category in order of their merit are Rajkot, Vadodara, Indore, Lucknow, Kota,
31
Mysore, Bhopal, Faridabad, Varanasi and Vishakhapatnam. 3.4 The 31-‐40 Positions: Seeking new opportunities Kanpur holds the top position in this slot and holds the 31st position. Followed by Ludhiana at 32nd position and Bhubaneswar at 33rd position, both the cities dropped from their last year’s rank. Raipur is spotted at 34th position. Meerut moved four places upwards and is at 35th position. Guwahati has dropped and is now at 36th position. Dehradun moved upwards to 37th position. Patna at 38th dropped three places. Allahabad and Shimla entered this slot (31-‐40) and are spotted at 39th and 40th position respectively. These cities while locally popular are hardly known internationally. This category consists of Groundfield (old cities with significant legacy infrastructures) and Greenfield cities (newly planned cities). Some cities have stagnated and so continue in this category. Others are new cities that have slower growth rates and are bidding their time move up to the next league. Cities in this category would need to identify strengths and pursue a consistent direction to achieve better results. The list of cities in this category includes Kanpur, Ludhiana, Bhubaneswar, Raipur, Meerut, Guwahati, Dehradun, Patna, Allahabad and Shimla. 3.5 The 41-‐50 Positions: In a developing state Vijayawada is the city at 41st position has drastically dropped from its last year’s position. Amritsar has gained four places and now holds the 42nd position. Asansol has dropped and is at 43rd position. Similarly, Agra declined to 44th position, Ranchi to 45th position and Jabalpur to 46th position. Jammu is stable and holds the 47th position. Srinagar has beaten Dhanbad to grab the spot of 48th position. Thus, Dhanbad now is at 50th position and Jamshedpur at 49th position. It is perceived that cities that have secured lower scores are less competitive, not so prosperous and lagging behind in the growth race. However all cities have their unique strengths and are part of the overall urban ecosystem in India. They are Vijayawada, Amritsar, Asansol, Agra, Ranchi, Jabalpur, Jammu, Srinagar, Jamshedpur and Dhanbad. All cities in India contribute towards India’s national competitiveness and are inter-‐networked. The geospatial distribution of cities and their international linkages become critical both to the region and the world.
32
Overall Competitiveness
Rank City Score 1 Delhi 69.89 2 Mumbai 69.88 3 Chennai 63.40 4 Hyderabad 62.81 5 Kolkata 62.43 6 Gurgaon 62.35 7 Noida 62.27 8 Bengaluru 61.70 9 Pune 61.43 10 Ahmedabad 60.52 11 Nagpur 59.07 12 Coimbatore 58.82 13 Kozhikode 58.40 14 Surat 58.37 15 Chandigarh 58.24 16 Kochi 58.21 17 Thiruvananthapuram 57.97 18 Nashik 57.83 19 Jaipur 57.24 20 Madurai 56.94 21 Rajkot 56.85 22 Vadodara 56.76 23 Indore 56.48 24 Lucknow 55.85 25 Kota 55.66 26 Mysore 55.54 27 Bhopal 55.51 28 Faridabad 55.38 29 Varanasi 55.24 30 Vishakhapatnam 55.22 31 Kanpur 55.11 32 Ludhiana 55.10 33 Bhubaneswar 55.09 34 Raipur 55.03 35 Meerut 54.93 36 Guwahati 54.83 37 Dehradun 54.71 38 Patna 54.64 39 Allahabad 54.62 40 Shimla 54.35 41 Vijayawada 54.28 42 Amritsar 54.24 43 Asansol 54.12 44 Agra 53.96 45 Ranchi 53.87 46 Jabalpur 53.58 47 Jammu 52.73 48 Srinagar 51.92 49 Jamshedpur 51.89 50 Dhanbad 51.88

33
Factor Conditions Rank City Score 1 Mumbai 69.06 2 Delhi 66.76 3 Kolkata 62.57 4 Chennai 62.48 5 Noida 61.59 6 Gurgaon 60.69 7 Bengaluru 60.52 8 Ahmedabad 60.42 9 Hyderabad 60.16 10 Kozhikode 60.01 11 Pune 59.88 12 Shimla 59.63 13 Thiruvananthapuram 59.12 14 Coimbatore 59.11 15 Chandigarh 58.70 16 Surat 58.58 17 Dehradun 57.96 18 Raipur 57.84 19 Indore 57.80 20 Vadodara 57.23 21 Mysore 57.09 22 Guwahati 57.05 23 Kochi 56.88 24 Rajkot 56.87 25 Madurai 56.68 26 Bhopal 56.66 27 Bhubaneswar 56.56 28 Jaipur 56.47 29 Jammu 56.10 30 Nagpur 55.99 31 Kota 55.87 32 Nashik 55.84 33 Ludhiana 55.42 34 Allahabad 55.14 35 Varanasi 54.97 36 Lucknow 54.90 37 Amritsar 54.75 38 Vishakhapatnam 54.57 39 Ranchi 54.46 40 Patna 54.42 41 Kanpur 54.07 42 Asansol 54.02 43 Faridabad 53.90 44 Srinagar 53.28 45 Meerut 53.26 46 Jabalpur 53.16 47 Vijayawada 52.80 48 Dhanbad 52.44 49 Jamshedpur 51.84 50 Agra 51.59

34
Financial Rank City Score 1 Mumbai 78.56 2 Pune 65.77 3 Delhi 65.02 4 Gurgaon 63.37 5 Ahmedabad 62.67 6 Kolkata 62.61 7 Noida 62.36 8 Thiruvananthapuram 61.65 9 Kochi 61.60 10 Shimla 61.13 11 Indore 61.11 12 Coimbatore 60.29 13 Rajkot 59.77 14 Chennai 59.57 15 Nashik 59.50 16 Raipur 59.26 17 Kota 59.10 18 Vadodara 59.04 19 Hyderabad 58.90 20 Surat 58.14 21 Mysore 57.93 22 Chandigarh 57.28 23 Bengaluru 57.17 24 Asansol 57.14 25 Vijayawada 57.13 26 Kozhikode 56.71 27 Patna 56.49 28 Ludhiana 56.46 29 Dehradun 56.44 30 Amritsar 56.30 31 Bhopal 56.24 32 Bhubaneswar 56.09 33 Nagpur 55.72 34 Jammu 55.48 35 Jaipur 54.82 36 Vishakhapatnam 54.69 37 Faridabad 53.53 38 Jabalpur 53.31 39 Madurai 53.23 40 Lucknow 53.17 41 Varanasi 52.40 42 Kanpur 52.22 43 Meerut 52.19 44 Allahabad 51.07 45 Guwahati 51.03 46 Ranchi 50.34 47 Agra 49.86 48 Jamshedpur 49.83 49 Dhanbad 48.22 50 Srinagar 45.25

35
Physical Rank City Score 1 Kozhikode 70.44 2 Kochi 67.48 3 Delhi 65.45 4 Thiruvananthapuram 64.98 5 Shimla 63.00 6 Coimbatore 61.84 7 Mumbai 61.63 8 Dehradun 60.27 9 Chennai 59.43 10 Kolkata 59.36 11 Raipur 59.28 12 Noida 59.21 13 Vijayawada 58.67 14 Madurai 58.57 15 Hyderabad 58.49 16 Guwahati 58.46 17 Nashik 58.06 18 Mysore 58.05 19 Chandigarh 57.61 20 Pune 57.53 21 Jammu 57.44 22 Vishakhapatnam 57.43 23 Jaipur 57.34 24 Asansol 57.30 25 Kota 56.51 26 Bengaluru 56.25 27 Allahabad 56.08 28 Jamshedpur 55.93 29 Nagpur 55.79 30 Agra 55.63 31 Ludhiana 55.62 32 Amritsar 55.37 33 Bhopal 55.36 34 Patna 55.25 35 Gurgaon 55.03 36 Bhubaneswar 54.99 37 Ranchi 54.83 38 Varanasi 54.77 39 Kanpur 54.54 40 Indore 54.51 41 Jabalpur 53.92 42 Meerut 53.69 43 Lucknow 53.60 44 Faridabad 52.26 45 Dhanbad 52.20 46 Ahmedabad 52.00 47 Rajkot 51.83 48 Surat 51.57 49 Vadodara 51.20 50 Srinagar 51.09
36
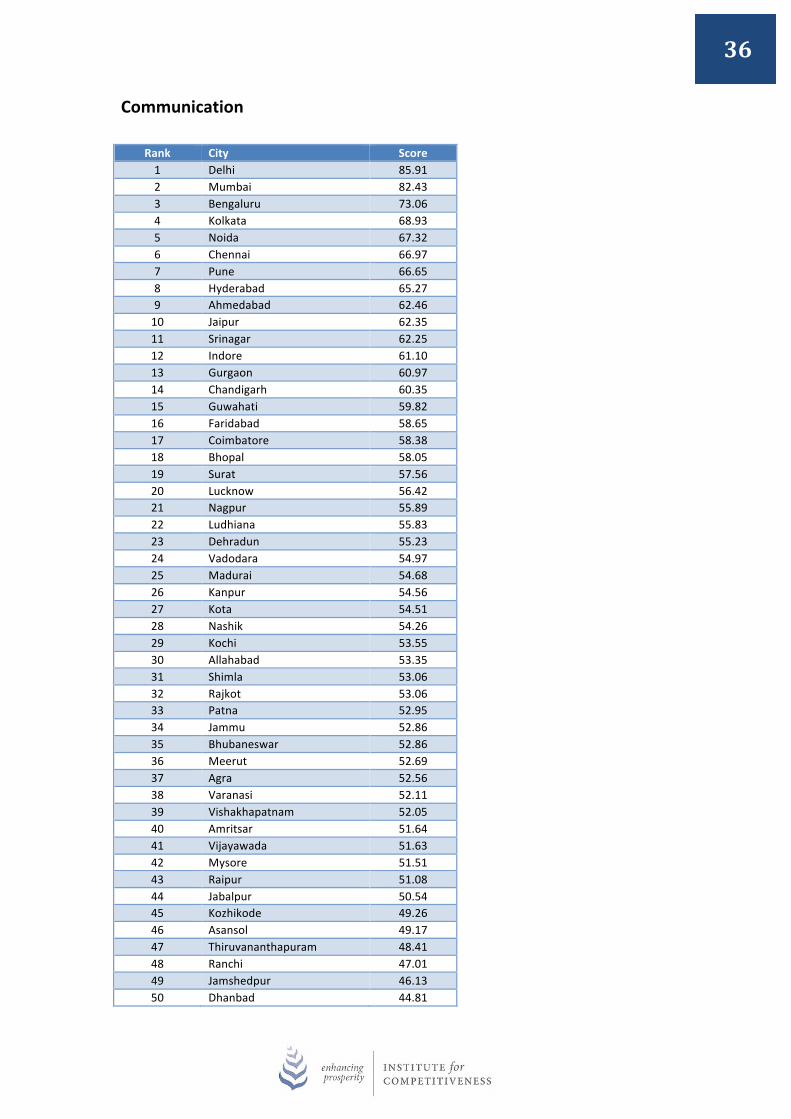
Communication Rank City Score 1 Delhi 85.91 2 Mumbai 82.43 3 Bengaluru 73.06 4 Kolkata 68.93 5 Noida 67.32 6 Chennai 66.97 7 Pune 66.65 8 Hyderabad 65.27 9 Ahmedabad 62.46 10 Jaipur 62.35 11 Srinagar 62.25 12 Indore 61.10 13 Gurgaon 60.97 14 Chandigarh 60.35 15 Guwahati 59.82 16 Faridabad 58.65 17 Coimbatore 58.38 18 Bhopal 58.05 19 Surat 57.56 20 Lucknow 56.42 21 Nagpur 55.89 22 Ludhiana 55.83 23 Dehradun 55.23 24 Vadodara 54.97 25 Madurai 54.68 26 Kanpur 54.56 27 Kota 54.51 28 Nashik 54.26 29 Kochi 53.55 30 Allahabad 53.35 31 Shimla 53.06 32 Rajkot 53.06 33 Patna 52.95 34 Jammu 52.86 35 Bhubaneswar 52.86 36 Meerut 52.69 37 Agra 52.56 38 Varanasi 52.11 39 Vishakhapatnam 52.05 40 Amritsar 51.64 41 Vijayawada 51.63 42 Mysore 51.51 43 Raipur 51.08 44 Jabalpur 50.54 45 Kozhikode 49.26 46 Asansol 49.17 47 Thiruvananthapuram 48.41 48 Ranchi 47.01 49 Jamshedpur 46.13 50 Dhanbad 44.81

37
Administrative Rank City Score 1 Shimla 68.44 2 Dehradun 66.32 3 Guwahati 64.48 4 Surat 63.88 5 Ranchi 63.81 6 Bhubaneswar 63.80 7 Gurgaon 63.74 8 Raipur 63.49 9 Thiruvananthapuram 62.97 10 Kozhikode 62.90 11 Srinagar 62.76 12 Mysore 62.69 13 Noida 62.69 14 Dhanbad 62.12 15 Kota 62.06 16 Ahmedabad 61.53 17 Vadodara 61.45 18 Jammu 60.85 19 Varanasi 60.50 20 Chennai 60.24 21 Rajkot 60.14 22 Allahabad 59.25 23 Amritsar 57.84 24 Chandigarh 57.65 25 Ludhiana 57.15 26 Mumbai 57.02 27 Madurai 56.86 28 Meerut 56.22 29 Hyderabad 55.73 30 Coimbatore 55.35 31 Nagpur 55.12 32 Lucknow 54.08 33 Bengaluru 53.78 34 Bhopal 53.52 35 Jamshedpur 53.29 36 Kolkata 53.14 37 Asansol 52.97 38 Faridabad 52.90 39 Vishakhapatnam 52.80 40 Agra 52.55 41 Kanpur 52.41 42 Indore 51.12 43 Jaipur 50.02 44 Patna 49.91 45 Delhi 49.73 46 Nashik 49.43 47 Pune 48.83 48 Jabalpur 48.77 49 Kochi 48.04 50 Vijayawada 40.82

38
Human Capacity
Rank City Score 1 Delhi 74.66 2 Mumbai 72.04 3 Ahmedabad 67.47 4 Bengaluru 67.46 5 Surat 64.85 6 Jaipur 64.72 7 Kolkata 63.58 8 Indore 62.62 9 Hyderabad 62.35 10 Chennai 62.34 11 Chandigarh 61.70 12 Noida 61.04 13 Vadodara 60.11 14 Gurgaon 60.09 15 Kota 60.08 16 Rajkot 59.37 17 Bhopal 59.16 18 Pune 58.71 19 Lucknow 58.40 20 Jabalpur 58.35 21 Faridabad 58.11 22 Jammu 57.01 23 Patna 56.93 24 Kanpur 56.92 25 Kozhikode 56.71 26 Nagpur 56.29 27 Nashik 55.94 28 Raipur 55.86 29 Coimbatore 55.68 30 Thiruvananthapuram 55.36 31 Ranchi 53.95 32 Guwahati 53.80 33 Ludhiana 53.79 34 Allahabad 53.78 35 Varanasi 53.63 36 Mysore 53.43 37 Jamshedpur 52.81 38 Amritsar 52.08 39 Vishakhapatnam 51.95 40 Srinagar 51.79 41 Madurai 51.67 42 Dhanbad 51.50 43 Meerut 51.43 44 Kochi 51.35 45 Vijayawada 50.91 46 Bhubaneswar 50.90 47 Dehradun 49.46 48 Asansol 49.30 49 Shimla 48.37 50 Agra 47.33

39
Innovation Rank City Score 1 Chennai 70.29 2 Delhi 68.04 3 Madurai 66.26 4 Mumbai 65.94 5 Pune 64.92 6 Hyderabad 63.59 7 Coimbatore 63.19 8 Bengaluru 61.49 9 Gurgaon 60.82 10 Bhopal 60.24 11 Kozhikode 60.21 12 Kolkata 59.79 13 Indore 59.72 14 Chandigarh 59.40 15 Ahmedabad 58.98 16 Vijayawada 58.97 17 Nashik 58.48 18 Bhubaneswar 58.36 19 Vishakhapatnam 58.28 20 Nagpur 57.96 21 Rajkot 57.15 22 Allahabad 57.09 23 Vadodara 57.07 24 Surat 56.96 25 Shimla 56.85 26 Jabalpur 56.72 27 Patna 56.28 28 Noida 56.12 29 Thiruvananthapuram 56.12 30 Kochi 56.02 31 Asansol 55.98 32 Lucknow 55.74 33 Mysore 55.57 34 Kanpur 55.50 35 Varanasi 55.35 36 Dehradun 55.10 37 Ranchi 54.94 38 Raipur 54.27 39 Dhanbad 54.18 40 Amritsar 52.76 41 Jaipur 52.75 42 Guwahati 52.49 43 Meerut 52.09 44 Jamshedpur 52.09 45 Ludhiana 51.83 46 Kota 51.46 47 Jammu 50.33 48 Agra 49.42 49 Faridabad 48.81 50 Srinagar 45.16

40
Demand Conditions Rank City Score 1 Mumbai 73.85 2 Bengaluru 72.98 3 Delhi 71.80 4 Chennai 67.36 5 Hyderabad 66.22 6 Gurgaon 64.62 7 Kolkata 62.75 8 Ahmedabad 61.50 9 Pune 61.16 10 Chandigarh 60.60 11 Surat 60.40 12 Jaipur 59.27 13 Lucknow 58.30 14 Nagpur 57.93 15 Kozhikode 57.41 16 Rajkot 57.27 17 Faridabad 56.97 18 Thiruvananthapuram 56.74 19 Dehradun 56.72 20 Amritsar 56.59 21 Kota 56.36 22 Kochi 56.19 23 Srinagar 56.12 24 Nashik 55.85 25 Indore 55.51 26 Bhopal 55.50 27 Guwahati 55.34 28 Vishakhapatnam 55.08 29 Ludhiana 55.04 30 Vadodara 54.92 31 Noida 54.66 32 Madurai 54.45 33 Vijayawada 54.43 34 Jammu 54.10 35 Ranchi 54.01 36 Meerut 53.86 37 Asansol 53.70 38 Mysore 53.65 39 Agra 53.25 40 Coimbatore 53.15 41 Patna 53.08 42 Bhubaneswar 52.89 43 Jamshedpur 52.88 44 Raipur 52.56 45 Jabalpur 52.47 46 Shimla 52.46 47 Dhanbad 52.20 48 Varanasi 51.63 49 Kanpur 51.39 50 Allahabad 49.96

41
Demographics
Rank City Score 1 Mumbai 82.60 2 Delhi 78.77 3 Bengaluru 77.22 4 Chennai 74.17 5 Hyderabad 72.49 6 Kolkata 66.47 7 Ahmedabad 63.24 8 Gurgaon 61.74 9 Pune 61.59 10 Lucknow 59.13 11 Surat 58.95 12 Jaipur 58.61 13 Indore 58.55 14 Raipur 57.71 15 Kozhikode 57.69 16 Nagpur 57.23 17 Coimbatore 56.98 18 Bhopal 56.83 19 Madurai 56.71 20 Thiruvananthapuram 56.09 21 Vishakhapatnam 55.88 22 Faridabad 55.56 23 Noida 55.42 24 Mysore 55.40 25 Dehradun 54.63 26 Vijayawada 54.53 27 Ranchi 54.51 28 Kochi 54.42 29 Patna 54.37 30 Vadodara 53.86 31 Nashik 53.83 32 Guwahati 53.78 33 Rajkot 53.33 34 Srinagar 53.32 35 Kota 52.97 36 Jabalpur 52.79 37 Varanasi 52.72 38 Meerut 52.67 39 Chandigarh 52.67 40 Agra 52.19 41 Kanpur 52.07 42 Jamshedpur 51.76 43 Bhubaneswar 51.46 44 Allahabad 51.35 45 Asansol 51.15 46 Amritsar 51.14 47 Dhanbad 50.95 48 Ludhiana 50.57 49 Jammu 49.80 50 Shimla 45.26
42
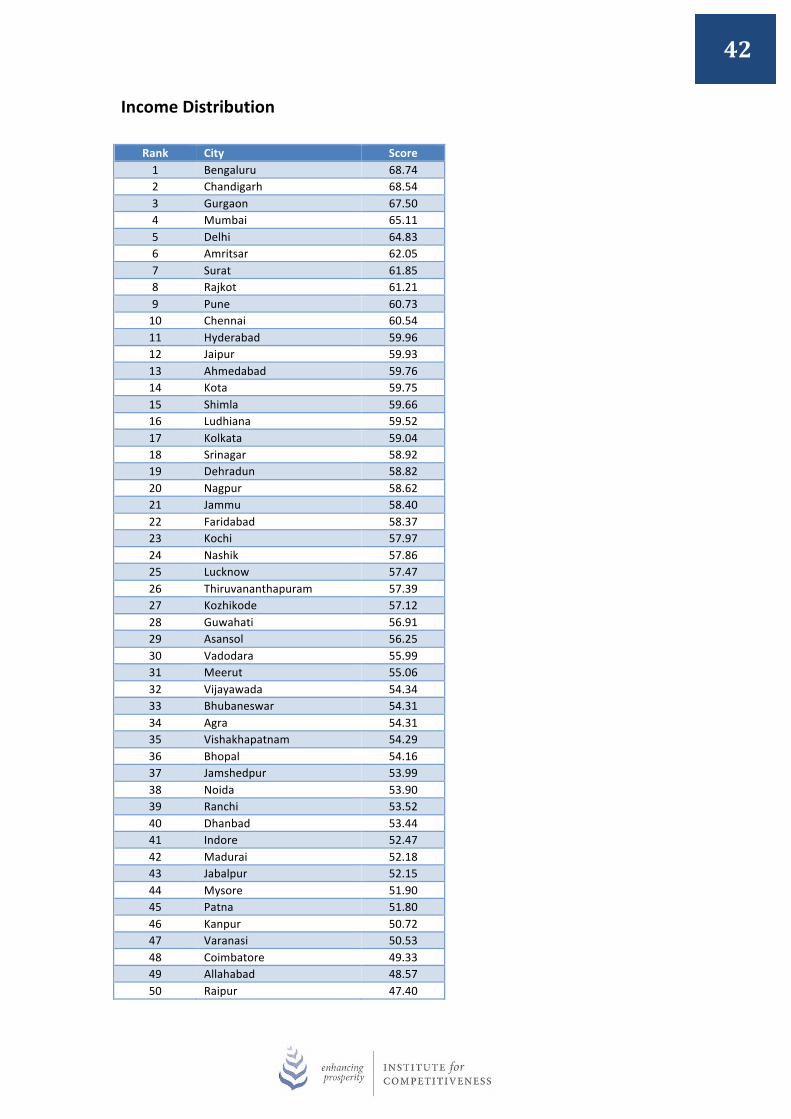
Income Distribution Rank City Score 1 Bengaluru 68.74 2 Chandigarh 68.54 3 Gurgaon 67.50 4 Mumbai 65.11 5 Delhi 64.83 6 Amritsar 62.05 7 Surat 61.85 8 Rajkot 61.21 9 Pune 60.73 10 Chennai 60.54 11 Hyderabad 59.96 12 Jaipur 59.93 13 Ahmedabad 59.76 14 Kota 59.75 15 Shimla 59.66 16 Ludhiana 59.52 17 Kolkata 59.04 18 Srinagar 58.92 19 Dehradun 58.82 20 Nagpur 58.62 21 Jammu 58.40 22 Faridabad 58.37 23 Kochi 57.97 24 Nashik 57.86 25 Lucknow 57.47 26 Thiruvananthapuram 57.39 27 Kozhikode 57.12 28 Guwahati 56.91 29 Asansol 56.25 30 Vadodara 55.99 31 Meerut 55.06 32 Vijayawada 54.34 33 Bhubaneswar 54.31 34 Agra 54.31 35 Vishakhapatnam 54.29 36 Bhopal 54.16 37 Jamshedpur 53.99 38 Noida 53.90 39 Ranchi 53.52 40 Dhanbad 53.44 41 Indore 52.47 42 Madurai 52.18 43 Jabalpur 52.15 44 Mysore 51.90 45 Patna 51.80 46 Kanpur 50.72 47 Varanasi 50.53 48 Coimbatore 49.33 49 Allahabad 48.57 50 Raipur 47.40
43
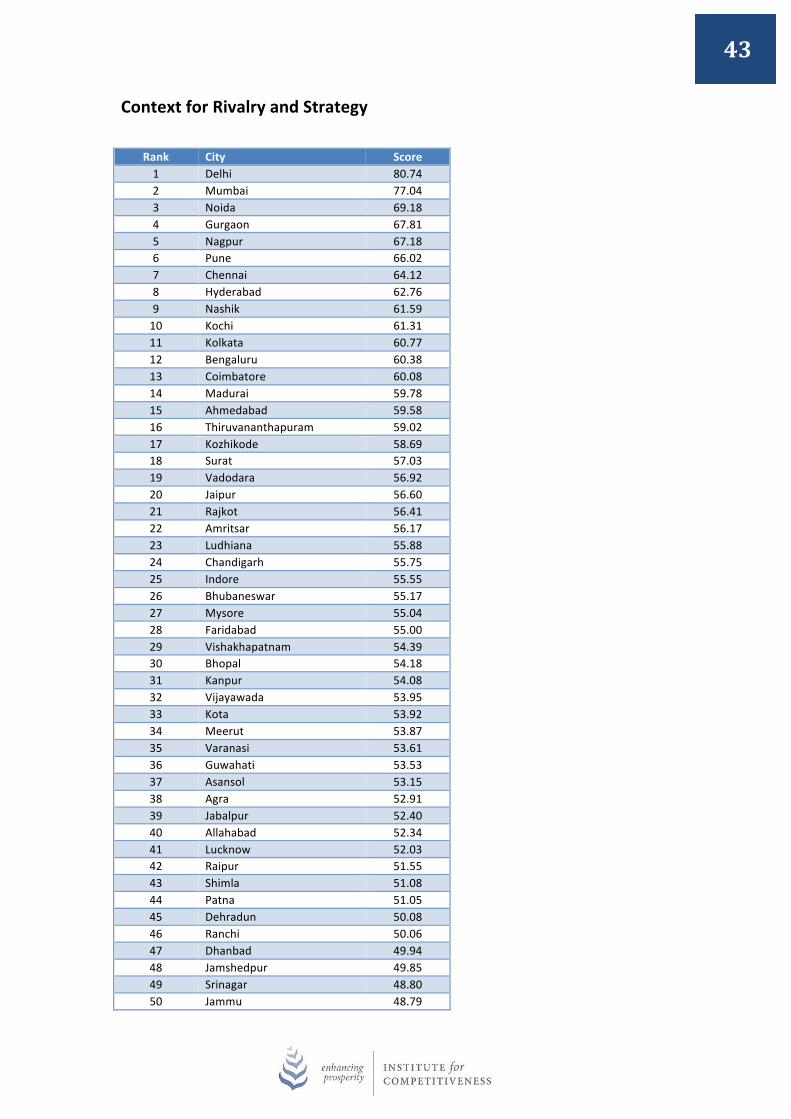
Context for Rivalry and Strategy Rank City Score 1 Delhi 80.74 2 Mumbai 77.04 3 Noida 69.18 4 Gurgaon 67.81 5 Nagpur 67.18 6 Pune 66.02 7 Chennai 64.12 8 Hyderabad 62.76 9 Nashik 61.59 10 Kochi 61.31 11 Kolkata 60.77 12 Bengaluru 60.38 13 Coimbatore 60.08 14 Madurai 59.78 15 Ahmedabad 59.58 16 Thiruvananthapuram 59.02 17 Kozhikode 58.69 18 Surat 57.03 19 Vadodara 56.92 20 Jaipur 56.60 21 Rajkot 56.41 22 Amritsar 56.17 23 Ludhiana 55.88 24 Chandigarh 55.75 25 Indore 55.55 26 Bhubaneswar 55.17 27 Mysore 55.04 28 Faridabad 55.00 29 Vishakhapatnam 54.39 30 Bhopal 54.18 31 Kanpur 54.08 32 Vijayawada 53.95 33 Kota 53.92 34 Meerut 53.87 35 Varanasi 53.61 36 Guwahati 53.53 37 Asansol 53.15 38 Agra 52.91 39 Jabalpur 52.40 40 Allahabad 52.34 41 Lucknow 52.03 42 Raipur 51.55 43 Shimla 51.08 44 Patna 51.05 45 Dehradun 50.08 46 Ranchi 50.06 47 Dhanbad 49.94 48 Jamshedpur 49.85 49 Srinagar 48.80 50 Jammu 48.79

44
CI & Diversity of Firms Rank City Score 1 Delhi 92.24 2 Hyderabad 69.85 3 Mumbai 66.99 4 Pune 66.63 5 Ahmedabad 64.71 6 Chennai 64.26 7 Nagpur 63.13 8 Surat 62.81 9 Noida 61.89 10 Vadodara 61.60 11 Rajkot 61.49 12 Gurgaon 60.13 13 Bengaluru 60.08 14 Kolkata 59.85 15 Coimbatore 59.78 16 Kochi 59.74 17 Jaipur 59.60 18 Madurai 59.35 19 Kota 59.07 20 Bhubaneswar 58.50 21 Chandigarh 58.09 22 Ludhiana 58.04 23 Thiruvananthapuram 58.00 24 Amritsar 57.96 25 Kozhikode 57.03 26 Mysore 55.92 27 Faridabad 54.72 28 Nashik 54.62 29 Asansol 54.45 30 Indore 54.18 31 Bhopal 53.77 32 Vijayawada 53.51 33 Vishakhapatnam 53.51 34 Raipur 53.38 35 Jabalpur 53.25 36 Lucknow 52.52 37 Ranchi 52.16 38 Varanasi 51.88 39 Agra 51.86 40 Kanpur 51.86 41 Patna 51.73 42 Meerut 51.69 43 Jamshedpur 51.41 44 Dhanbad 51.39 45 Guwahati 50.66 46 Shimla 49.19 47 Dehradun 48.45 48 Allahabad 47.49 49 Srinagar 46.36 50 Jammu 46.35
45
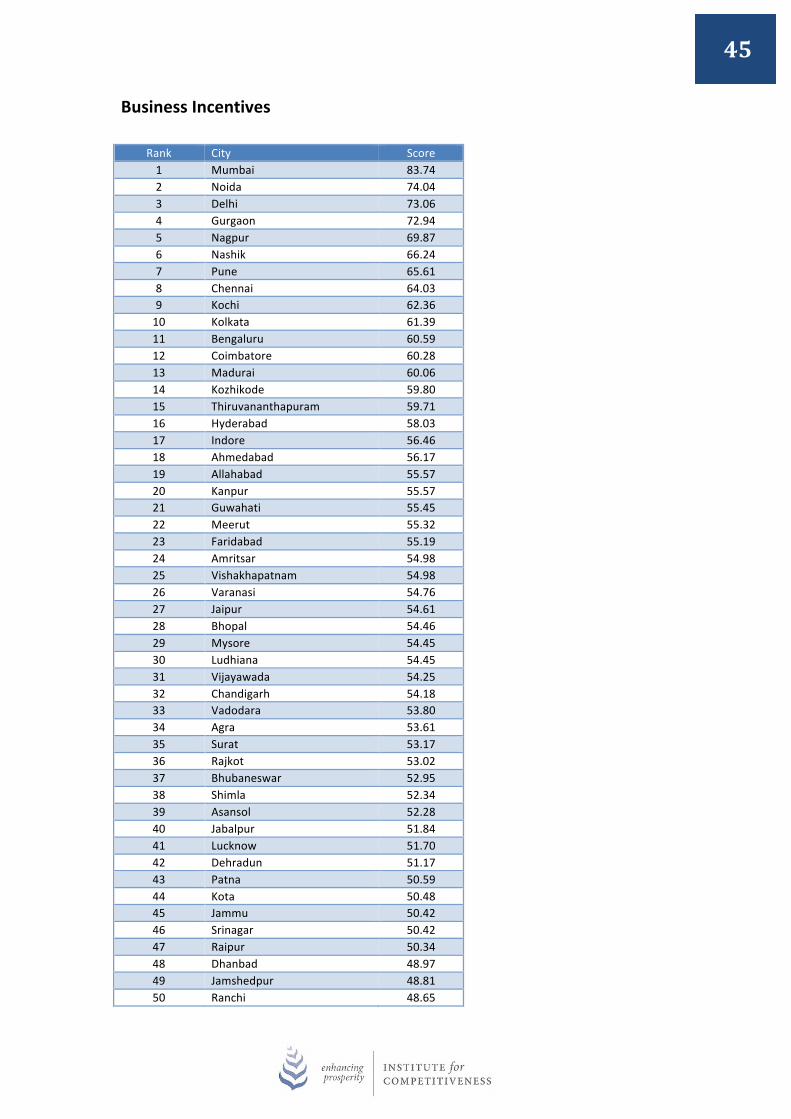
Business Incentives Rank City Score 1 Mumbai 83.74 2 Noida 74.04 3 Delhi 73.06 4 Gurgaon 72.94 5 Nagpur 69.87 6 Nashik 66.24 7 Pune 65.61 8 Chennai 64.03 9 Kochi 62.36 10 Kolkata 61.39 11 Bengaluru 60.59 12 Coimbatore 60.28 13 Madurai 60.06 14 Kozhikode 59.80 15 Thiruvananthapuram 59.71 16 Hyderabad 58.03 17 Indore 56.46 18 Ahmedabad 56.17 19 Allahabad 55.57 20 Kanpur 55.57 21 Guwahati 55.45 22 Meerut 55.32 23 Faridabad 55.19 24 Amritsar 54.98 25 Vishakhapatnam 54.98 26 Varanasi 54.76 27 Jaipur 54.61 28 Bhopal 54.46 29 Mysore 54.45 30 Ludhiana 54.45 31 Vijayawada 54.25 32 Chandigarh 54.18 33 Vadodara 53.80 34 Agra 53.61 35 Surat 53.17 36 Rajkot 53.02 37 Bhubaneswar 52.95 38 Shimla 52.34 39 Asansol 52.28 40 Jabalpur 51.84 41 Lucknow 51.70 42 Dehradun 51.17 43 Patna 50.59 44 Kota 50.48 45 Jammu 50.42 46 Srinagar 50.42 47 Raipur 50.34 48 Dhanbad 48.97 49 Jamshedpur 48.81 50 Ranchi 48.65
46
Related & Supporting Industry Rank City Score 1 Delhi 65.09 2 Hyderabad 65.04 3 Kolkata 63.34 4 Mumbai 63.09 5 Noida 62.40 6 Chennai 61.95 7 Ahmedabad 60.83 8 Coimbatore 60.76 9 Pune 60.41 10 Kanpur 59.82 11 Gurgaon 59.29 12 Nashik 59.19 13 Varanasi 59.16 14 Meerut 59.09 15 Kochi 59.08 16 Agra 59.03 17 Lucknow 58.94 18 Patna 58.79 19 Allahabad 58.39 20 Nagpur 58.21 21 Chandigarh 58.09 22 Surat 57.91 23 Bengaluru 57.86 24 Jaipur 57.75 25 Faridabad 57.09 26 Vishakhapatnam 57.02 27 Vadodara 56.98 28 Rajkot 56.90 29 Vijayawada 56.80 30 Madurai 56.60 31 Kota 56.30 32 Kozhikode 56.17 33 Thiruvananthapuram 56.04 34 Ranchi 55.88 35 Jabalpur 55.85 36 Indore 55.69 37 Asansol 55.33 38 Raipur 54.82 39 Bhopal 54.73 40 Mysore 54.62 41 Ludhiana 54.00 42 Bhubaneswar 53.98 43 Jamshedpur 53.01 44 Dhanbad 52.33 45 Dehradun 52.01 46 Guwahati 52.01 47 Amritsar 50.45 48 Srinagar 49.73 49 Jammu 49.66 50 Shimla 49.66
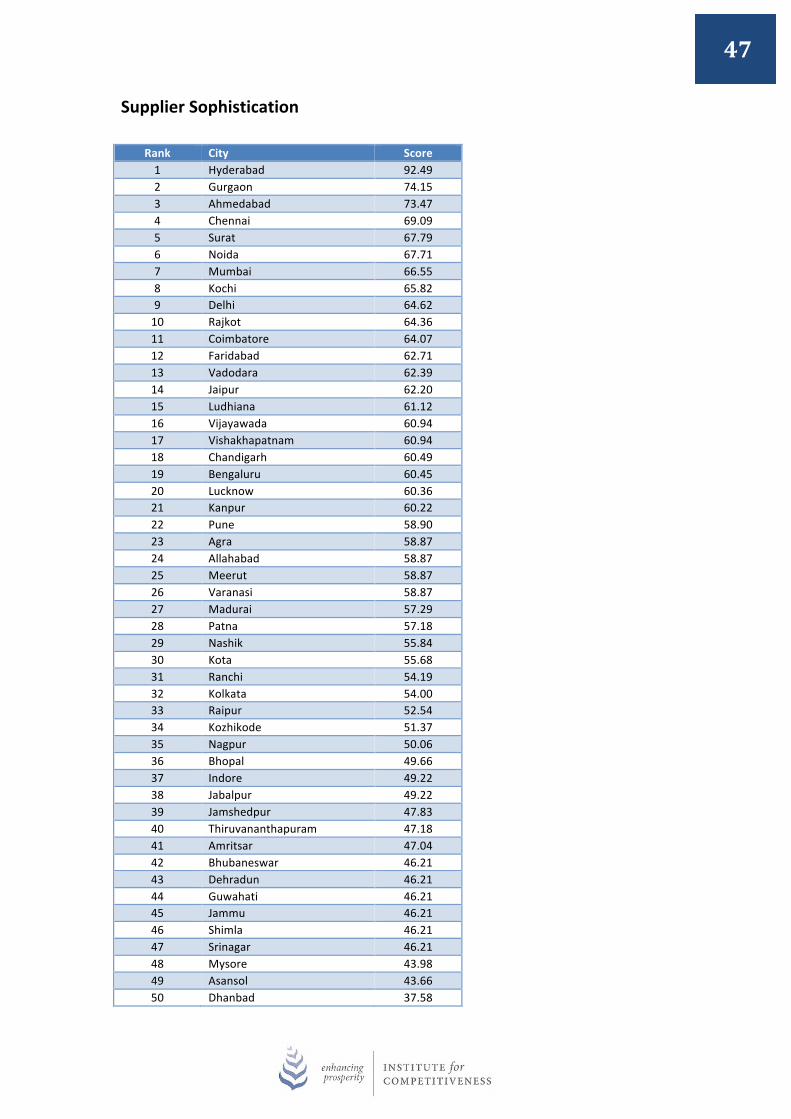
47
Supplier Sophistication Rank City Score 1 Hyderabad 92.49 2 Gurgaon 74.15 3 Ahmedabad 73.47 4 Chennai 69.09 5 Surat 67.79 6 Noida 67.71 7 Mumbai 66.55 8 Kochi 65.82 9 Delhi 64.62 10 Rajkot 64.36 11 Coimbatore 64.07 12 Faridabad 62.71 13 Vadodara 62.39 14 Jaipur 62.20 15 Ludhiana 61.12 16 Vijayawada 60.94 17 Vishakhapatnam 60.94 18 Chandigarh 60.49 19 Bengaluru 60.45 20 Lucknow 60.36 21 Kanpur 60.22 22 Pune 58.90 23 Agra 58.87 24 Allahabad 58.87 25 Meerut 58.87 26 Varanasi 58.87 27 Madurai 57.29 28 Patna 57.18 29 Nashik 55.84 30 Kota 55.68 31 Ranchi 54.19 32 Kolkata 54.00 33 Raipur 52.54 34 Kozhikode 51.37 35 Nagpur 50.06 36 Bhopal 49.66 37 Indore 49.22 38 Jabalpur 49.22 39 Jamshedpur 47.83 40 Thiruvananthapuram 47.18 41 Amritsar 47.04 42 Bhubaneswar 46.21 43 Dehradun 46.21 44 Guwahati 46.21 45 Jammu 46.21 46 Shimla 46.21 47 Srinagar 46.21 48 Mysore 43.98 49 Asansol 43.66 50 Dhanbad 37.58
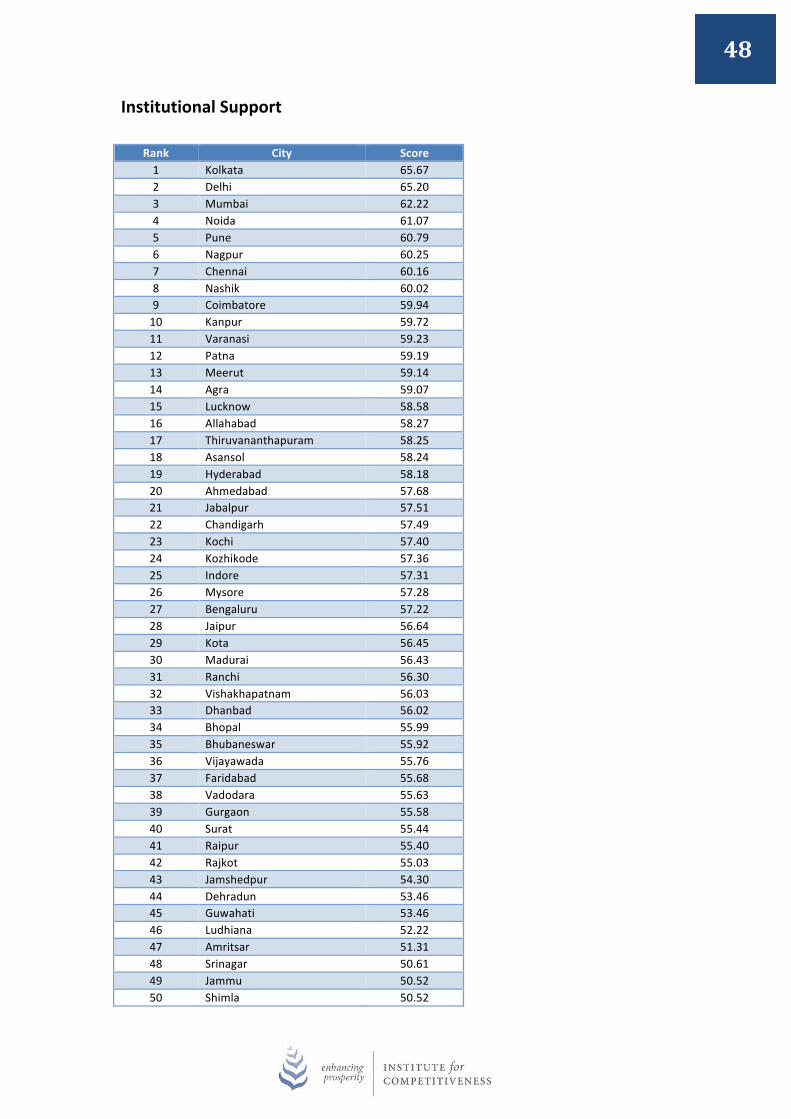
48
Institutional Support Rank City Score 1 Kolkata 65.67 2 Delhi 65.20 3 Mumbai 62.22 4 Noida 61.07 5 Pune 60.79 6 Nagpur 60.25 7 Chennai 60.16 8 Nashik 60.02 9 Coimbatore 59.94 10 Kanpur 59.72 11 Varanasi 59.23 12 Patna 59.19 13 Meerut 59.14 14 Agra 59.07 15 Lucknow 58.58 16 Allahabad 58.27 17 Thiruvananthapuram 58.25 18 Asansol 58.24 19 Hyderabad 58.18 20 Ahmedabad 57.68 21 Jabalpur 57.51 22 Chandigarh 57.49 23 Kochi 57.40 24 Kozhikode 57.36 25 Indore 57.31 26 Mysore 57.28 27 Bengaluru 57.22 28 Jaipur 56.64 29 Kota 56.45 30 Madurai 56.43 31 Ranchi 56.30 32 Vishakhapatnam 56.03 33 Dhanbad 56.02 34 Bhopal 55.99 35 Bhubaneswar 55.92 36 Vijayawada 55.76 37 Faridabad 55.68 38 Vadodara 55.63 39 Gurgaon 55.58 40 Surat 55.44 41 Raipur 55.40 42 Rajkot 55.03 43 Jamshedpur 54.30 44 Dehradun 53.46 45 Guwahati 53.46 46 Ludhiana 52.22 47 Amritsar 51.31 48 Srinagar 50.61 49 Jammu 50.52 50 Shimla 50.52

49
4.0 PROFILE OF 50 INDIAN CITIES
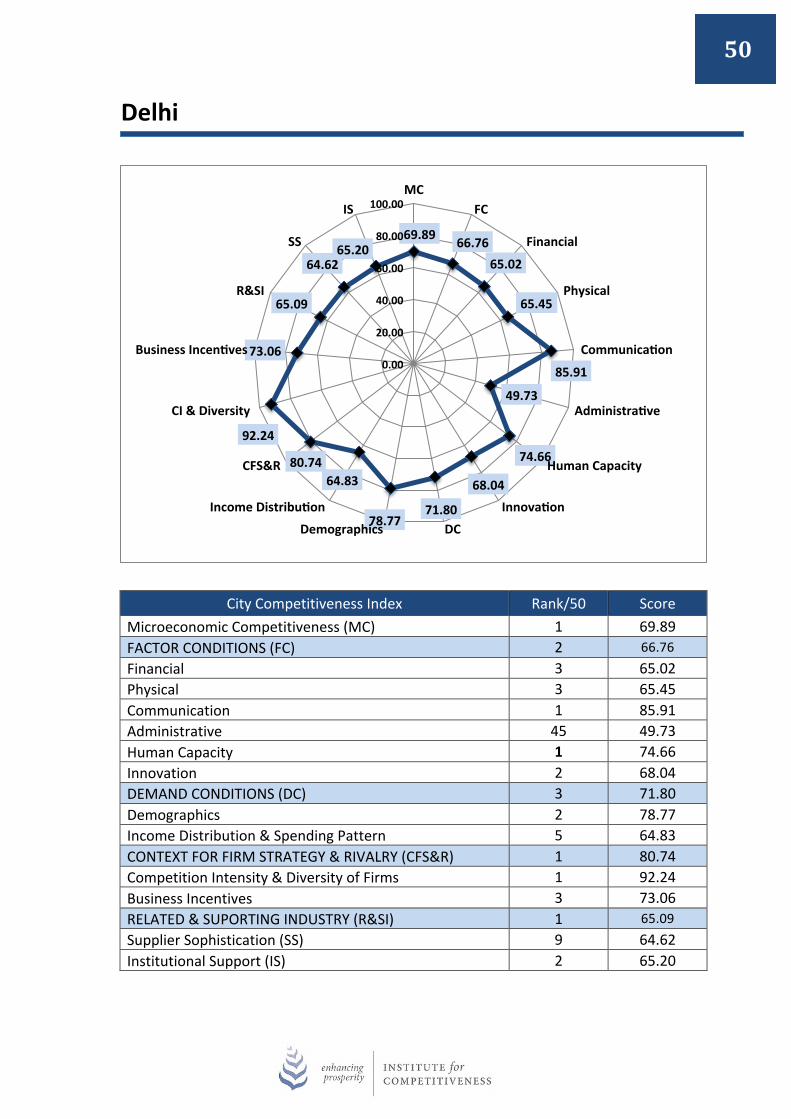
50
Delhi
City Competitiveness Index Rank/50 Score Microeconomic Competitiveness (MC) 1 69.89 FACTOR CONDITIONS (FC) 2 66.76 Financial 3 65.02 Physical 3 65.45 Communication 1 85.91 Administrative 45 49.73 Human Capacity 1 74.66 Innovation 2 68.04 DEMAND CONDITIONS (DC) 3 71.80 Demographics 2 78.77 Income Distribution & Spending Pattern 5 64.83 CONTEXT FOR FIRM STRATEGY & RIVALRY (CFS&R) 1 80.74 Competition Intensity & Diversity of Firms 1 92.24 Business Incentives 3 73.06 RELATED & SUPORTING INDUSTRY (R&SI) 1 65.09 Supplier Sophistication (SS) 9 64.62 Institutional Support (IS) 2 65.20
69.89 66.76 65.02
65.45
85.91
49.73
74.66
68.04
71.80 78.77
64.83 80.74
92.24
73.06
65.09
64.62 65.20
0.00
20.00
40.00
60.00
80.00
100.00 MC
FC
Financial
Physical
Communicaaon
Administraave
Human Capacity
Innovaaon
DC Demographics
Income Distribuaon
CFS&R
CI & Diversity
Business Incenaves
R&SI
SS
IS
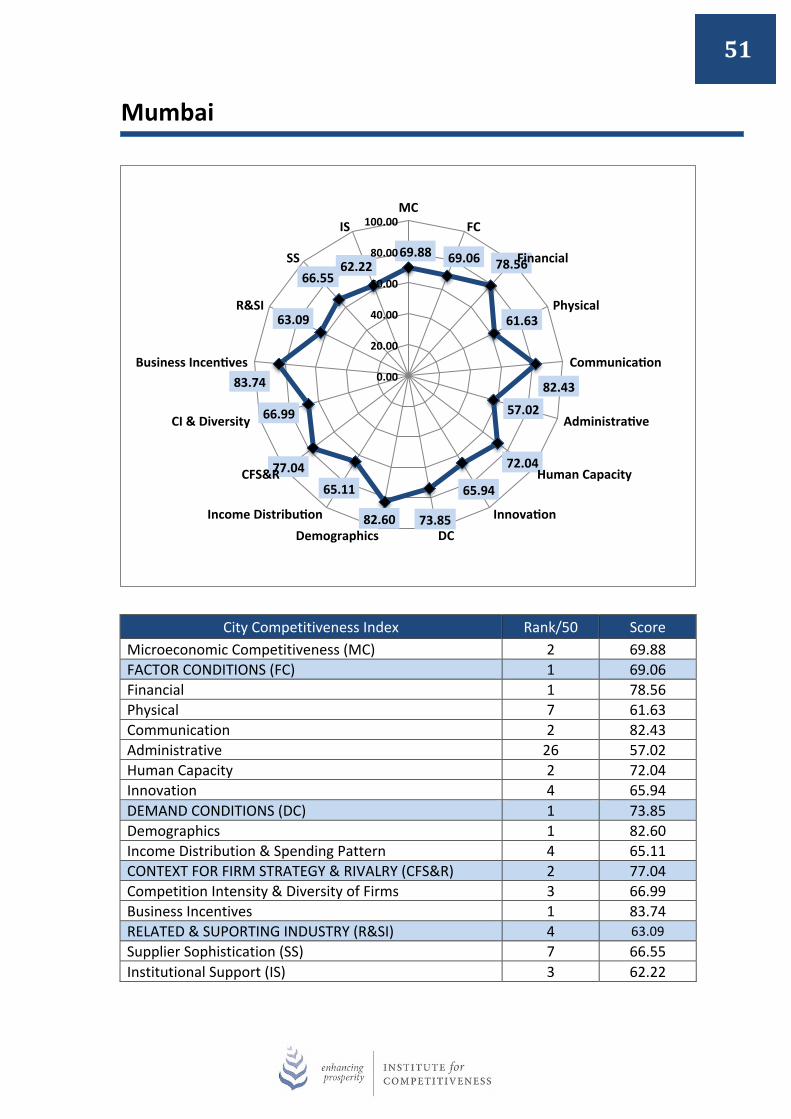
51
Mumbai
City Competitiveness Index Rank/50 Score Microeconomic Competitiveness (MC) 2 69.88 FACTOR CONDITIONS (FC) 1 69.06 Financial 1 78.56 Physical 7 61.63 Communication 2 82.43 Administrative 26 57.02 Human Capacity 2 72.04 Innovation 4 65.94 DEMAND CONDITIONS (DC) 1 73.85 Demographics 1 82.60 Income Distribution & Spending Pattern 4 65.11 CONTEXT FOR FIRM STRATEGY & RIVALRY (CFS&R) 2 77.04 Competition Intensity & Diversity of Firms 3 66.99 Business Incentives 1 83.74 RELATED & SUPORTING INDUSTRY (R&SI) 4 63.09 Supplier Sophistication (SS) 7 66.55 Institutional Support (IS) 3 62.22
69.88 69.06 78.56
61.63
82.43
57.02
72.04
65.94
73.85 82.60
65.11 77.04
66.99
83.74
63.09
66.55 62.22
0.00
20.00
40.00
60.00
80.00
100.00 MC
FC
Financial
Physical
Communicaaon
Administraave
Human Capacity
Innovaaon DC Demographics
Income Distribuaon
CFS&R
CI & Diversity
Business Incenaves
R&SI
SS
IS
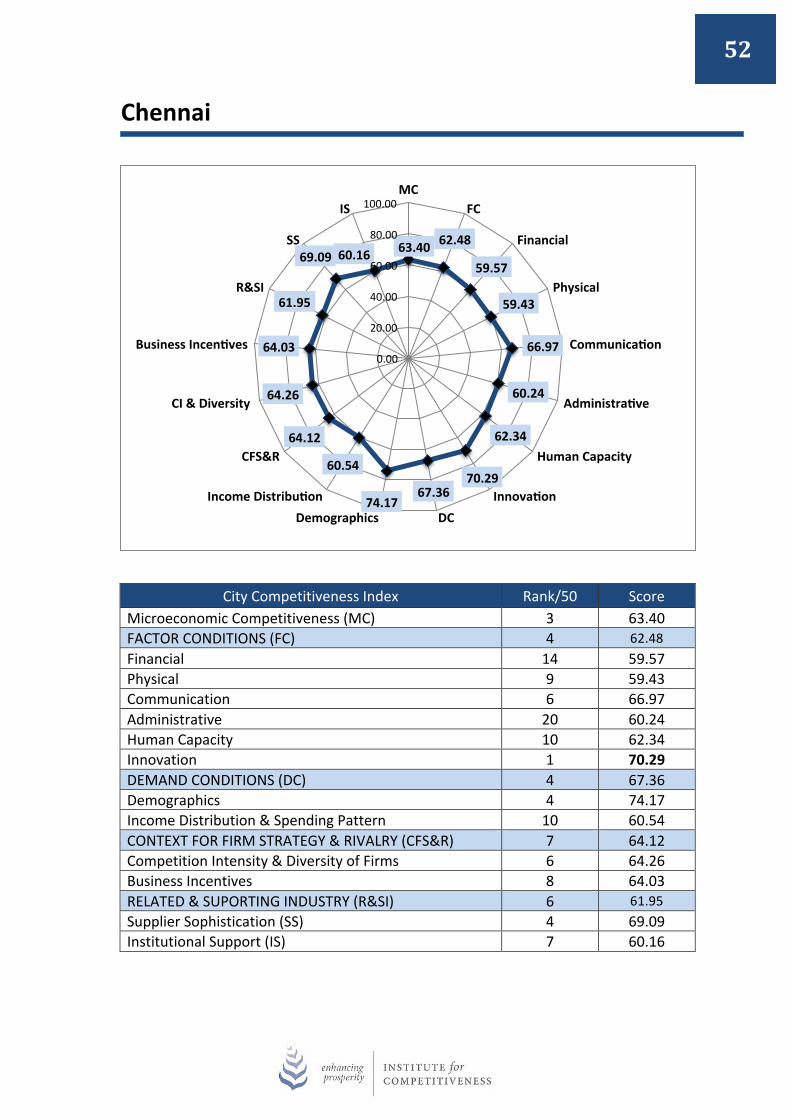
52
Chennai
City Competitiveness Index Rank/50 Score Microeconomic Competitiveness (MC) 3 63.40 FACTOR CONDITIONS (FC) 4 62.48 Financial 14 59.57 Physical 9 59.43 Communication 6 66.97 Administrative 20 60.24 Human Capacity 10 62.34 Innovation 1 70.29 DEMAND CONDITIONS (DC) 4 67.36 Demographics 4 74.17 Income Distribution & Spending Pattern 10 60.54 CONTEXT FOR FIRM STRATEGY & RIVALRY (CFS&R) 7 64.12 Competition Intensity & Diversity of Firms 6 64.26 Business Incentives 8 64.03 RELATED & SUPORTING INDUSTRY (R&SI) 6 61.95 Supplier Sophistication (SS) 4 69.09 Institutional Support (IS) 7 60.16
63.40 62.48
59.57
59.43
66.97
60.24
62.34
70.29 67.36
74.17
60.54
64.12
64.26
64.03
61.95
69.09 60.16
0.00
20.00
40.00
60.00
80.00
100.00 MC
FC
Financial
Physical
Communicaaon
Administraave
Human Capacity
Innovaaon DC Demographics
Income Distribuaon
CFS&R
CI & Diversity
Business Incenaves
R&SI
SS
IS
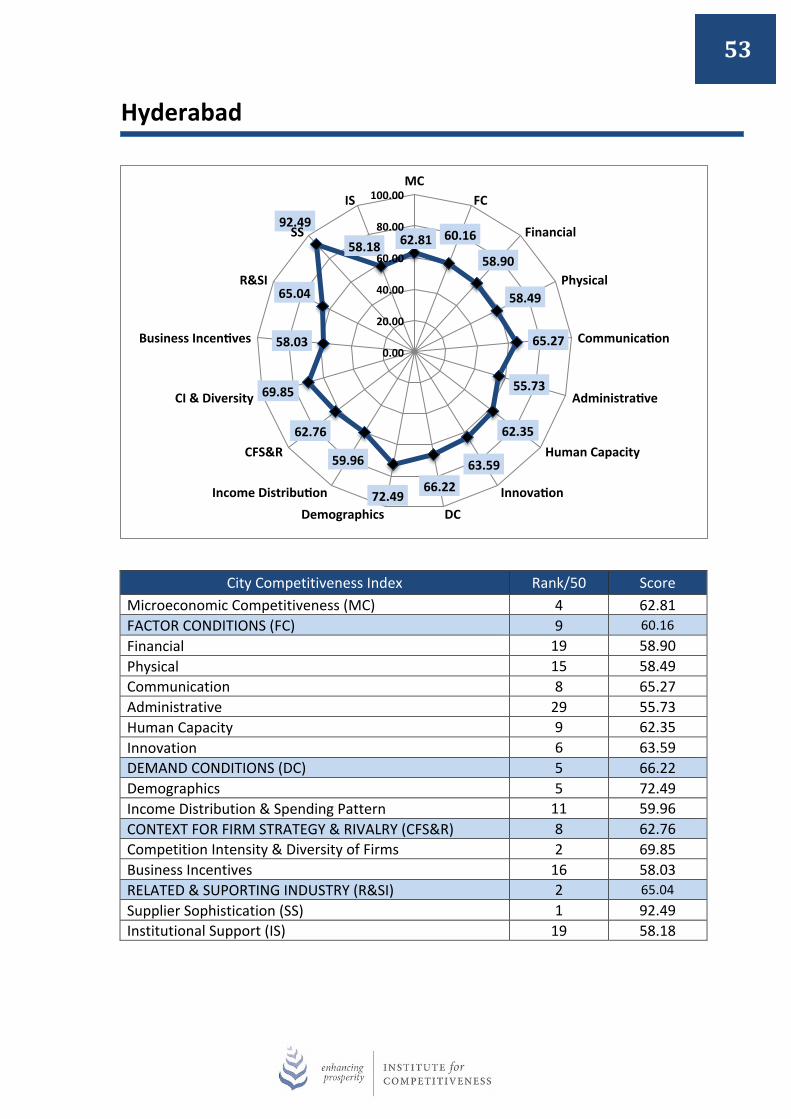
53
Hyderabad
City Competitiveness Index Rank/50 Score Microeconomic Competitiveness (MC) 4 62.81 FACTOR CONDITIONS (FC) 9 60.16 Financial 19 58.90 Physical 15 58.49 Communication 8 65.27 Administrative 29 55.73 Human Capacity 9 62.35 Innovation 6 63.59 DEMAND CONDITIONS (DC) 5 66.22 Demographics 5 72.49 Income Distribution & Spending Pattern 11 59.96 CONTEXT FOR FIRM STRATEGY & RIVALRY (CFS&R) 8 62.76 Competition Intensity & Diversity of Firms 2 69.85 Business Incentives 16 58.03 RELATED & SUPORTING INDUSTRY (R&SI) 2 65.04 Supplier Sophistication (SS) 1 92.49 Institutional Support (IS) 19 58.18
62.81 60.16
58.90
58.49
65.27
55.73
62.35
63.59 66.22
72.49
59.96
62.76
69.85
58.03
65.04
92.49
58.18
0.00
20.00
40.00
60.00
80.00
100.00 MC
FC
Financial
Physical
Communicaaon
Administraave
Human Capacity
Innovaaon DC Demographics
Income Distribuaon
CFS&R
CI & Diversity
Business Incenaves
R&SI
SS
IS
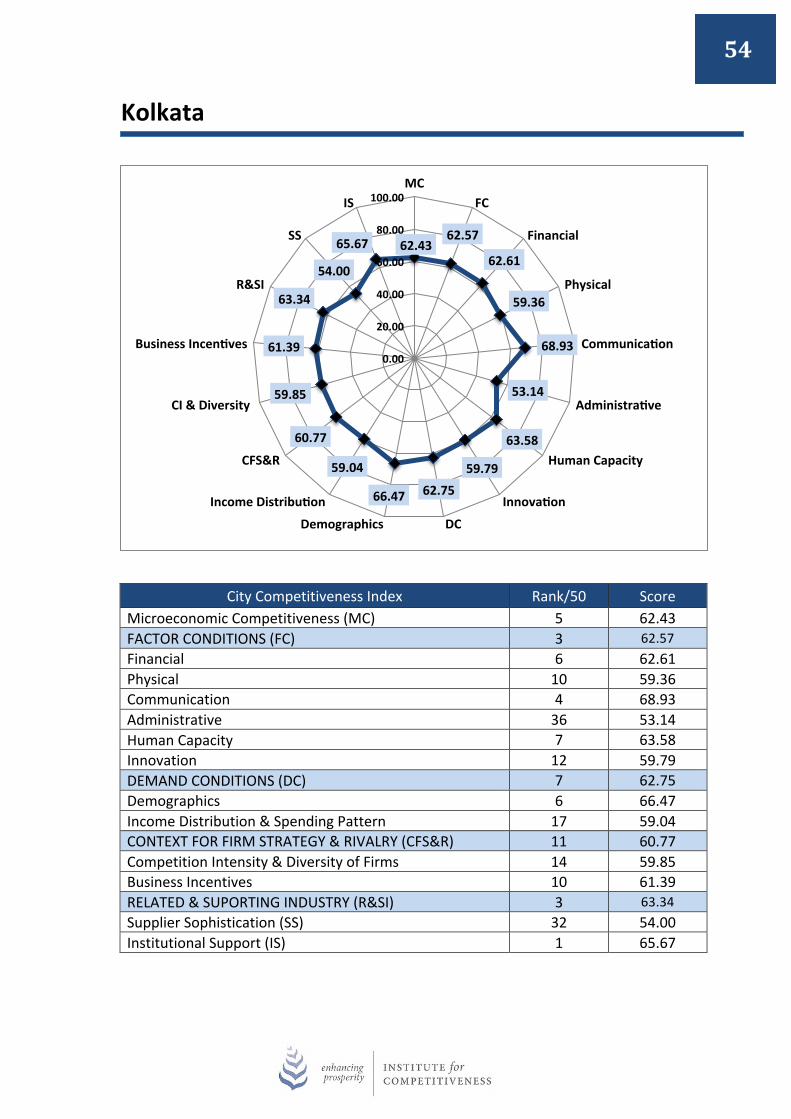
54
Kolkata
City Competitiveness Index Rank/50 Score Microeconomic Competitiveness (MC) 5 62.43 FACTOR CONDITIONS (FC) 3 62.57 Financial 6 62.61 Physical 10 59.36 Communication 4 68.93 Administrative 36 53.14 Human Capacity 7 63.58 Innovation 12 59.79 DEMAND CONDITIONS (DC) 7 62.75 Demographics 6 66.47 Income Distribution & Spending Pattern 17 59.04 CONTEXT FOR FIRM STRATEGY & RIVALRY (CFS&R) 11 60.77 Competition Intensity & Diversity of Firms 14 59.85 Business Incentives 10 61.39 RELATED & SUPORTING INDUSTRY (R&SI) 3 63.34 Supplier Sophistication (SS) 32 54.00 Institutional Support (IS) 1 65.67
62.43 62.57
62.61
59.36
68.93
53.14
63.58
59.79 62.75 66.47
59.04
60.77
59.85
61.39
63.34
54.00
65.67
0.00
20.00
40.00
60.00
80.00
100.00 MC
FC
Financial
Physical
Communicaaon
Administraave
Human Capacity
Innovaaon
DC Demographics
Income Distribuaon
CFS&R
CI & Diversity
Business Incenaves
R&SI
SS
IS
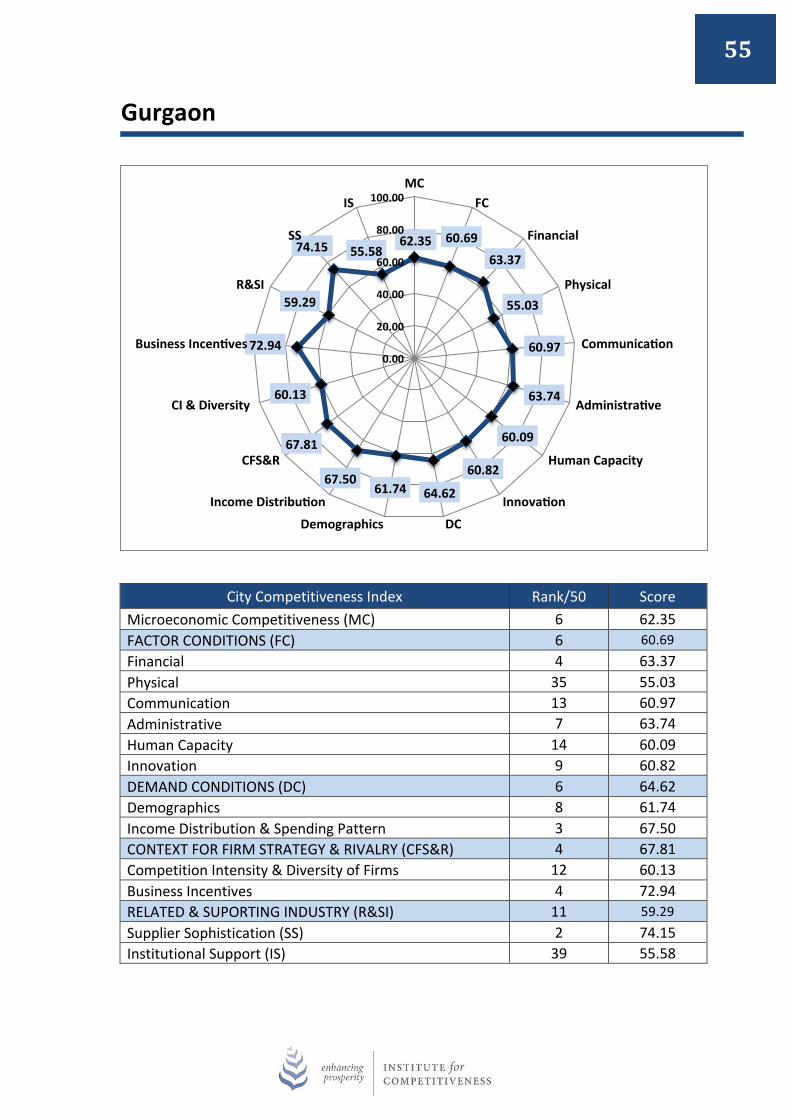
55
Gurgaon
City Competitiveness Index Rank/50 Score Microeconomic Competitiveness (MC) 6 62.35 FACTOR CONDITIONS (FC) 6 60.69 Financial 4 63.37 Physical 35 55.03 Communication 13 60.97 Administrative 7 63.74 Human Capacity 14 60.09 Innovation 9 60.82 DEMAND CONDITIONS (DC) 6 64.62 Demographics 8 61.74 Income Distribution & Spending Pattern 3 67.50 CONTEXT FOR FIRM STRATEGY & RIVALRY (CFS&R) 4 67.81 Competition Intensity & Diversity of Firms 12 60.13 Business Incentives 4 72.94 RELATED & SUPORTING INDUSTRY (R&SI) 11 59.29 Supplier Sophistication (SS) 2 74.15 Institutional Support (IS) 39 55.58
62.35 60.69 63.37
55.03
60.97
63.74
60.09
60.82
64.62 61.74 67.50
67.81
60.13
72.94
59.29
74.15 55.58
0.00
20.00
40.00
60.00
80.00
100.00 MC
FC
Financial
Physical
Communicaaon
Administraave
Human Capacity
Innovaaon
DC Demographics
Income Distribuaon
CFS&R
CI & Diversity
Business Incenaves
R&SI
SS
IS
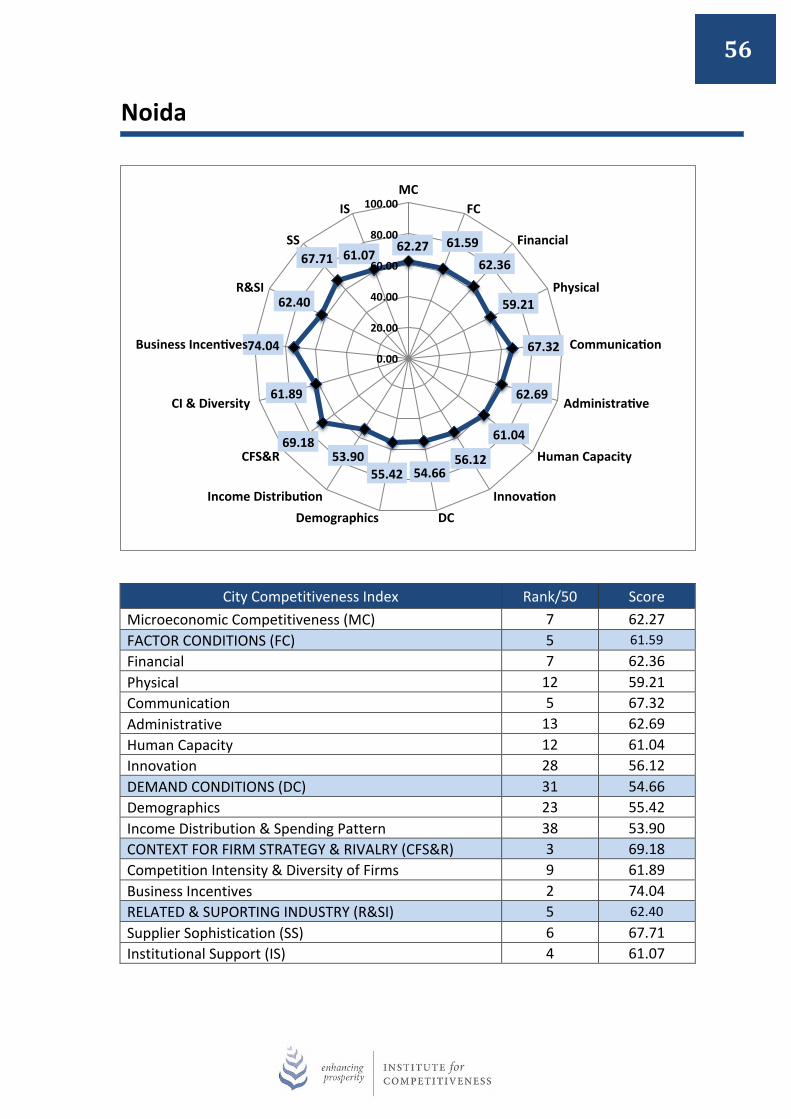
56
Noida
City Competitiveness Index Rank/50 Score Microeconomic Competitiveness (MC) 7 62.27 FACTOR CONDITIONS (FC) 5 61.59 Financial 7 62.36 Physical 12 59.21 Communication 5 67.32 Administrative 13 62.69 Human Capacity 12 61.04 Innovation 28 56.12 DEMAND CONDITIONS (DC) 31 54.66 Demographics 23 55.42 Income Distribution & Spending Pattern 38 53.90 CONTEXT FOR FIRM STRATEGY & RIVALRY (CFS&R) 3 69.18 Competition Intensity & Diversity of Firms 9 61.89 Business Incentives 2 74.04 RELATED & SUPORTING INDUSTRY (R&SI) 5 62.40 Supplier Sophistication (SS) 6 67.71 Institutional Support (IS) 4 61.07
62.27 61.59
62.36
59.21
67.32
62.69
61.04
56.12 54.66 55.42
53.90 69.18
61.89
74.04
62.40
67.71 61.07
0.00
20.00
40.00
60.00
80.00
100.00 MC
FC
Financial
Physical
Communicaaon
Administraave
Human Capacity
Innovaaon DC Demographics
Income Distribuaon
CFS&R
CI & Diversity
Business Incenaves
R&SI
SS
IS
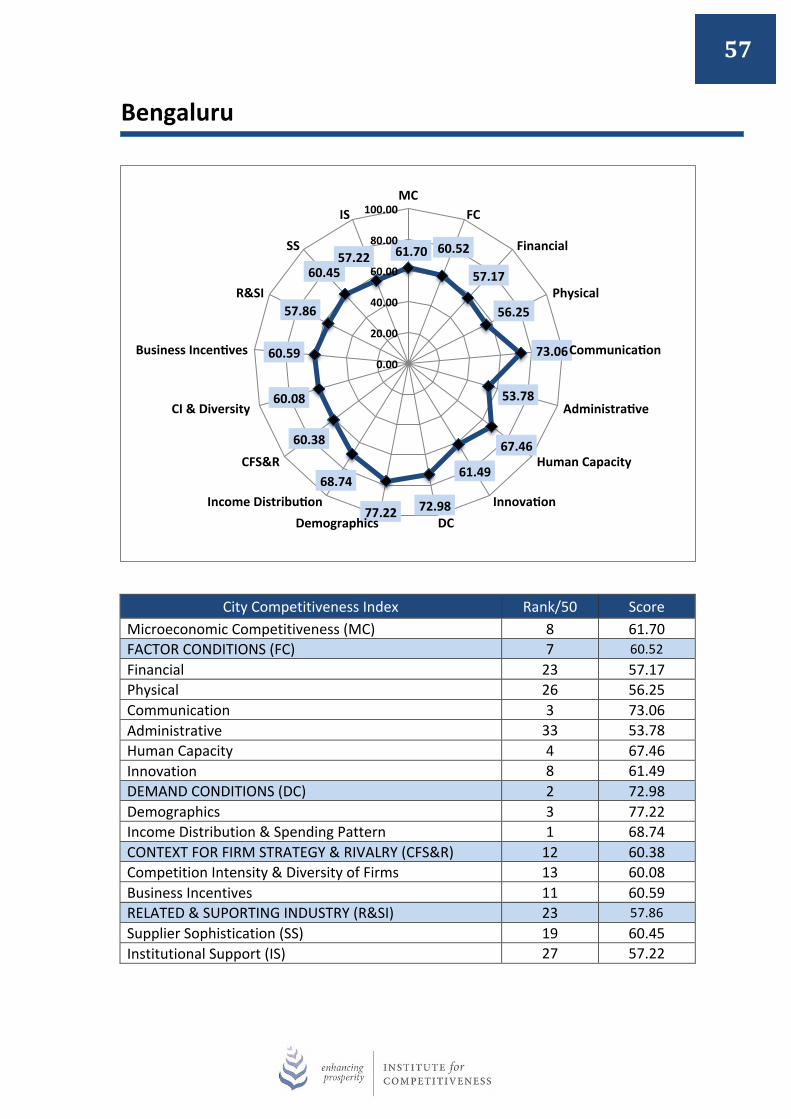
57
Bengaluru
City Competitiveness Index Rank/50 Score Microeconomic Competitiveness (MC) 8 61.70 FACTOR CONDITIONS (FC) 7 60.52 Financial 23 57.17 Physical 26 56.25 Communication 3 73.06 Administrative 33 53.78 Human Capacity 4 67.46 Innovation 8 61.49 DEMAND CONDITIONS (DC) 2 72.98 Demographics 3 77.22 Income Distribution & Spending Pattern 1 68.74 CONTEXT FOR FIRM STRATEGY & RIVALRY (CFS&R) 12 60.38 Competition Intensity & Diversity of Firms 13 60.08 Business Incentives 11 60.59 RELATED & SUPORTING INDUSTRY (R&SI) 23 57.86 Supplier Sophistication (SS) 19 60.45 Institutional Support (IS) 27 57.22
61.70 60.52
57.17
56.25
73.06
53.78
67.46
61.49
72.98 77.22
68.74
60.38
60.08
60.59
57.86
60.45 57.22
0.00
20.00
40.00
60.00
80.00
100.00 MC
FC
Financial
Physical
Communicaaon
Administraave
Human Capacity
Innovaaon DC Demographics
Income Distribuaon
CFS&R
CI & Diversity
Business Incenaves
R&SI
SS
IS

58
Pune
City Competitiveness Index Rank/50 Score Microeconomic Competitiveness (MC) 9 61.43 FACTOR CONDITIONS (FC) 11 59.88 Financial 2 65.77 Physical 20 57.53 Communication 7 66.65 Administrative 47 48.83 Human Capacity 18 58.71 Innovation 5 64.92 DEMAND CONDITIONS (DC) 9 61.16 Demographics 9 61.59 Income Distribution & Spending Pattern 9 60.73 CONTEXT FOR FIRM STRATEGY & RIVALRY (CFS&R) 6 66.02 Competition Intensity & Diversity of Firms 4 66.63 Business Incentives 7 65.61 RELATED & SUPORTING INDUSTRY (R&SI) 9 60.41 Supplier Sophistication (SS) 22 58.90 Institutional Support (IS) 5 60.79
61.43 59.88 65.77
57.53
66.65
48.83
58.71
64.92 61.16 61.59
60.73
66.02
66.63
65.61
60.41
58.90 60.79
0.00
20.00
40.00
60.00
80.00
100.00 MC
FC
Financial
Physical
Communicaaon
Administraave
Human Capacity
Innovaaon DC Demographics
Income Distribuaon
CFS&R
CI & Diversity
Business Incenaves
R&SI
SS
IS
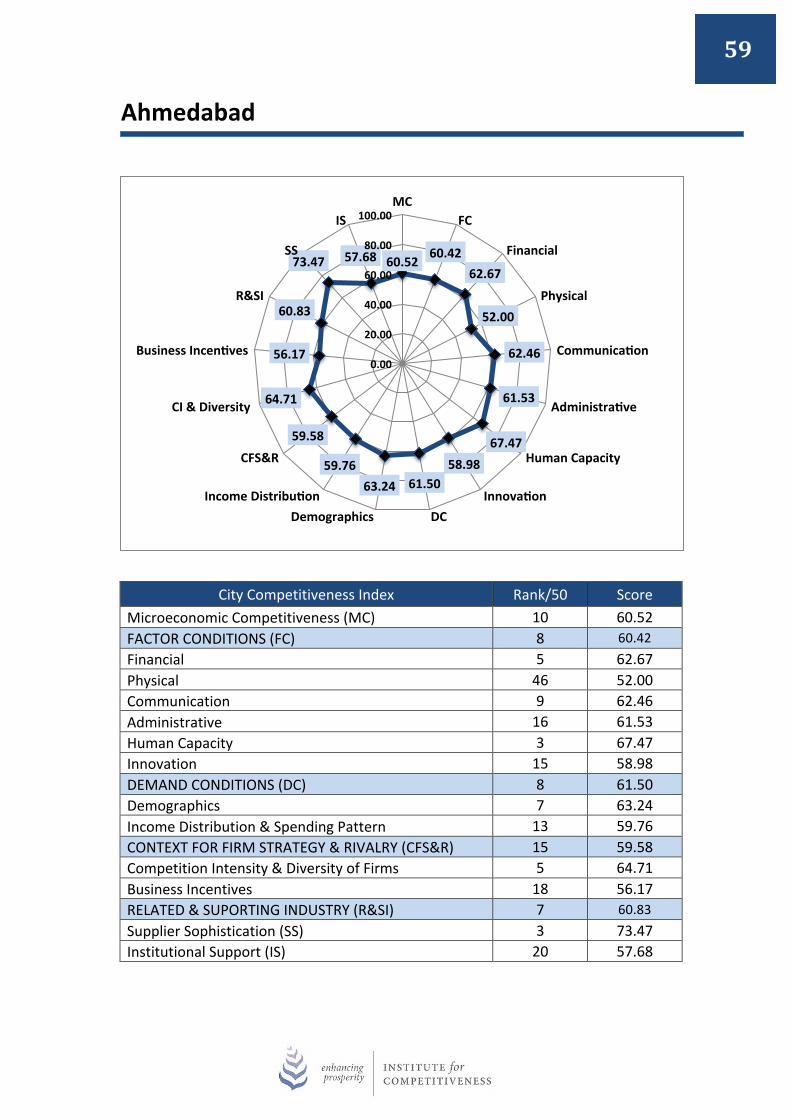
59
Ahmedabad
City Competitiveness Index Rank/50 Score Microeconomic Competitiveness (MC) 10 60.52 FACTOR CONDITIONS (FC) 8 60.42 Financial 5 62.67 Physical 46 52.00 Communication 9 62.46 Administrative 16 61.53 Human Capacity 3 67.47 Innovation 15 58.98 DEMAND CONDITIONS (DC) 8 61.50 Demographics 7 63.24 Income Distribution & Spending Pattern 13 59.76 CONTEXT FOR FIRM STRATEGY & RIVALRY (CFS&R) 15 59.58 Competition Intensity & Diversity of Firms 5 64.71 Business Incentives 18 56.17 RELATED & SUPORTING INDUSTRY (R&SI) 7 60.83 Supplier Sophistication (SS) 3 73.47 Institutional Support (IS) 20 57.68
60.52 60.42
62.67
52.00
62.46
61.53
67.47 58.98
61.50 63.24 59.76
59.58
64.71
56.17
60.83
73.47 57.68
0.00
20.00
40.00
60.00
80.00
100.00 MC
FC
Financial
Physical
Communicaaon
Administraave
Human Capacity
Innovaaon DC Demographics
Income Distribuaon
CFS&R
CI & Diversity
Business Incenaves
R&SI
SS
IS

60
Nagpur
City Competitiveness Index Rank/50 Score Microeconomic Competitiveness (MC) 11 59.07 FACTOR CONDITIONS (FC) 30 55.99 Financial 33 55.72 Physical 29 55.79 Communication 21 55.89 Administrative 31 55.12 Human Capacity 26 56.29 Innovation 20 57.96 DEMAND CONDITIONS (DC) 14 57.93 Demographics 16 57.23 Income Distribution & Spending Pattern 20 58.62 CONTEXT FOR FIRM STRATEGY & RIVALRY (CFS&R) 5 67.18 Competition Intensity & Diversity of Firms 7 63.13 Business Incentives 5 69.87 RELATED & SUPORTING INDUSTRY (R&SI) 20 58.21 Supplier Sophistication (SS) 35 50.06 Institutional Support (IS) 6 60.25
59.07 55.99
55.72
55.79
55.89
55.12
56.29
57.96 57.93 57.23
58.62 67.18
63.13
69.87
58.21
50.06
60.25
0.00
20.00
40.00
60.00
80.00
100.00 MC
FC
Financial
Physical
Communicaaon
Administraave
Human Capacity
Innovaaon DC Demographics
Income Distribuaon
CFS&R
CI & Diversity
Business Incenaves
R&SI
SS
IS

61
Coimbatore
City Competitiveness Index Rank/50 Score Microeconomic Competitiveness (MC) 12 58.82 FACTOR CONDITIONS (FC) 14 59.11 Financial 12 60.29 Physical 6 61.84 Communication 17 58.38 Administrative 30 55.35 Human Capacity 29 55.68 Innovation 7 63.19 DEMAND CONDITIONS (DC) 40 53.15 Demographics 17 56.98 Income Distribution & Spending Pattern 48 49.33 CONTEXT FOR FIRM STRATEGY & RIVALRY (CFS&R) 13 60.08 Competition Intensity & Diversity of Firms 15 59.78 Business Incentives 12 60.28 RELATED & SUPORTING INDUSTRY (R&SI) 8 60.76 Supplier Sophistication (SS) 11 64.07 Institutional Support (IS) 9 59.94
58.82 59.11
60.29
61.84
58.38
55.35
55.68
63.19 53.15 56.98
49.33 60.08
59.78
60.28
60.76
64.07 59.94
0.00
20.00
40.00
60.00
80.00
100.00 MC
FC
Financial
Physical
Communicaaon
Administraave
Human Capacity
Innovaaon DC Demographics
Income Distribuaon
CFS&R
CI & Diversity
Business Incenaves
R&SI
SS
IS

62
Kozhikode
City Competitiveness Index Rank/50 Score Microeconomic Competitiveness (MC) 13 58.40 FACTOR CONDITIONS (FC) 10 60.01 Financial 26 56.71 Physical 1 70.44 Communication 45 49.26 Administrative 10 62.90 Human Capacity 25 56.71 Innovation 11 60.21 DEMAND CONDITIONS (DC) 15 57.41 Demographics 15 57.69 Income Distribution & Spending Pattern 27 57.12 CONTEXT FOR FIRM STRATEGY & RIVALRY (CFS&R) 17 58.69 Competition Intensity & Diversity of Firms 25 57.03 Business Incentives 14 59.80 RELATED & SUPORTING INDUSTRY (R&SI) 32 56.17 Supplier Sophistication (SS) 34 51.37 Institutional Support (IS) 24 57.36
58.40 60.01
56.71
70.44
49.26
62.90
56.71
60.21 57.41 57.69
57.12
58.69
57.03
59.80
56.17
51.37
57.36
0.00
20.00
40.00
60.00
80.00
100.00 MC
FC
Financial
Physical
Communicaaon
Administraave
Human Capacity
Innovaaon DC Demographics
Income Distribuaon
CFS&R
CI & Diversity
Business Incenaves
R&SI
SS
IS
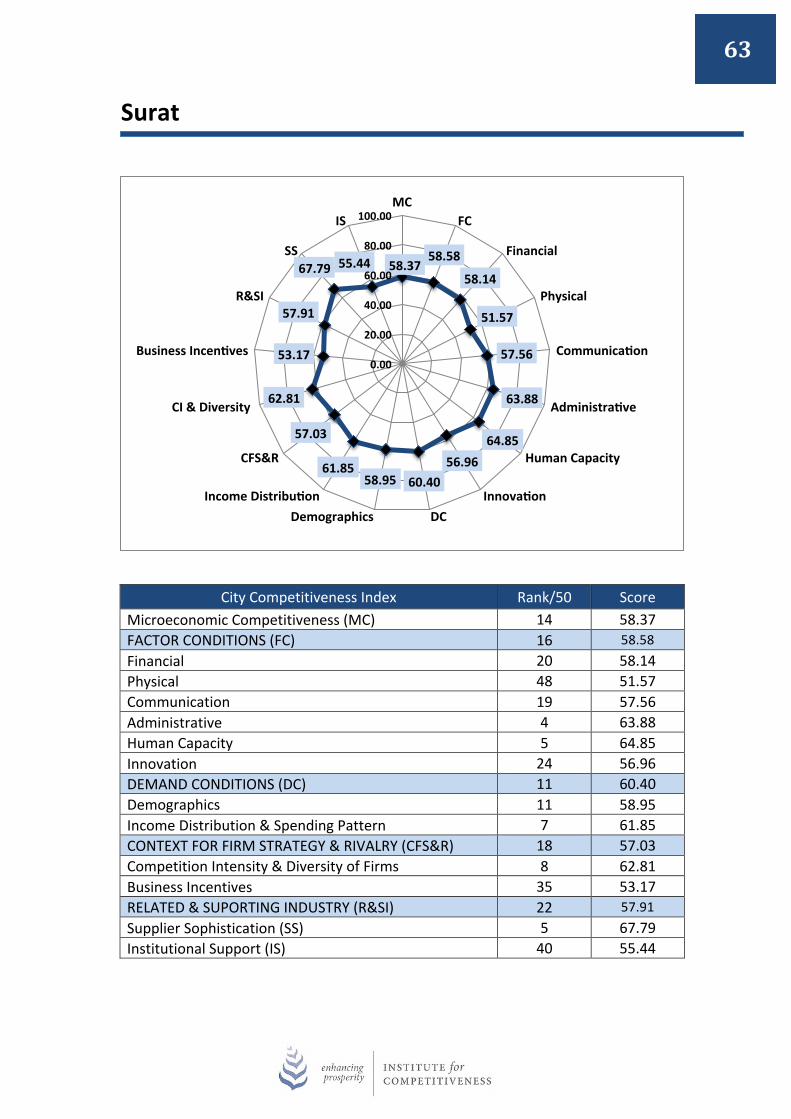
63
Surat
City Competitiveness Index Rank/50 Score Microeconomic Competitiveness (MC) 14 58.37 FACTOR CONDITIONS (FC) 16 58.58 Financial 20 58.14 Physical 48 51.57 Communication 19 57.56 Administrative 4 63.88 Human Capacity 5 64.85 Innovation 24 56.96 DEMAND CONDITIONS (DC) 11 60.40 Demographics 11 58.95 Income Distribution & Spending Pattern 7 61.85 CONTEXT FOR FIRM STRATEGY & RIVALRY (CFS&R) 18 57.03 Competition Intensity & Diversity of Firms 8 62.81 Business Incentives 35 53.17 RELATED & SUPORTING INDUSTRY (R&SI) 22 57.91 Supplier Sophistication (SS) 5 67.79 Institutional Support (IS) 40 55.44
58.37 58.58
58.14
51.57
57.56
63.88
64.85 56.96
60.40 58.95 61.85
57.03
62.81
53.17
57.91
67.79 55.44
0.00
20.00
40.00
60.00
80.00
100.00 MC
FC
Financial
Physical
Communicaaon
Administraave
Human Capacity
Innovaaon DC Demographics
Income Distribuaon
CFS&R
CI & Diversity
Business Incenaves
R&SI
SS
IS
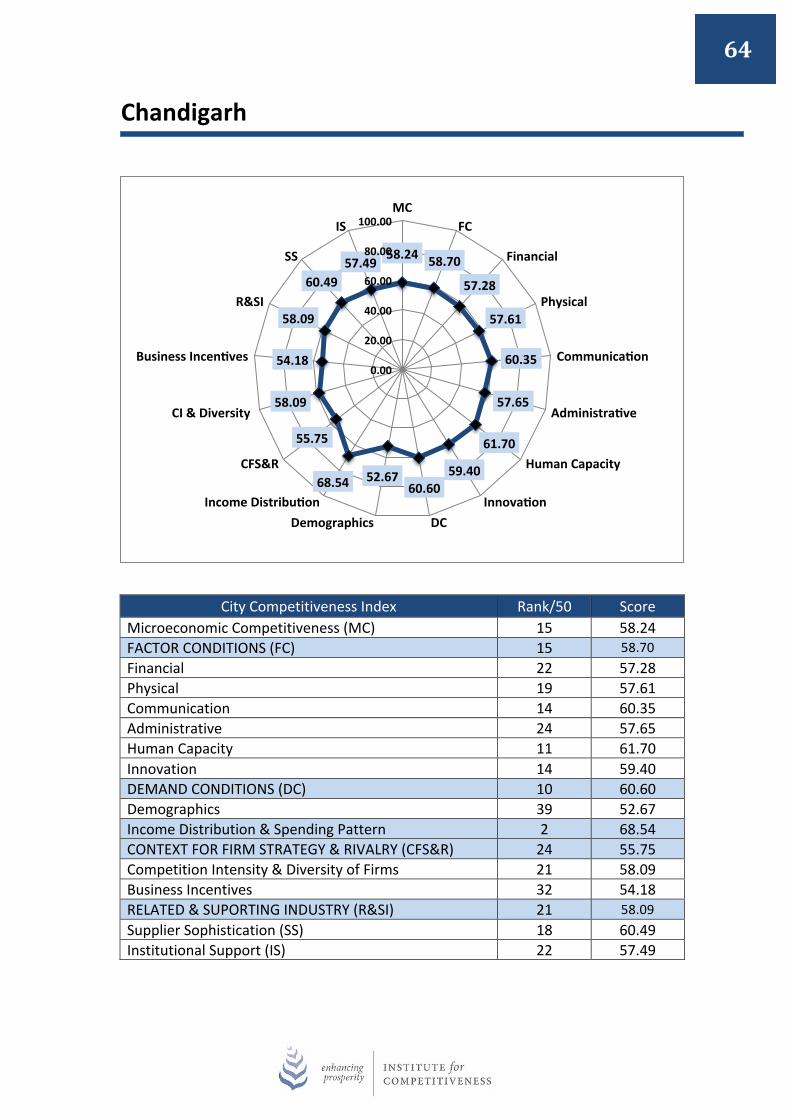
64
Chandigarh
City Competitiveness Index Rank/50 Score Microeconomic Competitiveness (MC) 15 58.24 FACTOR CONDITIONS (FC) 15 58.70 Financial 22 57.28 Physical 19 57.61 Communication 14 60.35 Administrative 24 57.65 Human Capacity 11 61.70 Innovation 14 59.40 DEMAND CONDITIONS (DC) 10 60.60 Demographics 39 52.67 Income Distribution & Spending Pattern 2 68.54 CONTEXT FOR FIRM STRATEGY & RIVALRY (CFS&R) 24 55.75 Competition Intensity & Diversity of Firms 21 58.09 Business Incentives 32 54.18 RELATED & SUPORTING INDUSTRY (R&SI) 21 58.09 Supplier Sophistication (SS) 18 60.49 Institutional Support (IS) 22 57.49
58.24 58.70
57.28
57.61
60.35
57.65
61.70
59.40 60.60
52.67 68.54
55.75
58.09
54.18
58.09
60.49 57.49
0.00
20.00
40.00
60.00
80.00
100.00 MC
FC
Financial
Physical
Communicaaon
Administraave
Human Capacity
Innovaaon DC Demographics
Income Distribuaon
CFS&R
CI & Diversity
Business Incenaves
R&SI
SS
IS

65
Kochi
City Competitiveness Index Rank/50 Score Microeconomic Competitiveness (MC) 16 58.21 FACTOR CONDITIONS (FC) 23 56.88 Financial 9 61.60 Physical 2 67.48 Communication 29 53.55 Administrative 49 48.04 Human Capacity 44 51.35 Innovation 30 56.02 DEMAND CONDITIONS (DC) 22 56.19 Demographics 28 54.42 Income Distribution & Spending Pattern 23 57.97 CONTEXT FOR FIRM STRATEGY & RIVALRY (CFS&R) 10 61.31 Competition Intensity & Diversity of Firms 16 59.74 Business Incentives 9 62.36 RELATED & SUPORTING INDUSTRY (R&SI) 15 59.08 Supplier Sophistication (SS) 8 65.82 Institutional Support (IS) 23 57.40
58.21 56.88 61.60
67.48
53.55
48.04
51.35
56.02 56.19 54.42
57.97
61.31
59.74
62.36
59.08
65.82 57.40
0.00
20.00
40.00
60.00
80.00
100.00 MC
FC
Financial
Physical
Communicaaon
Administraave
Human Capacity
Innovaaon DC Demographics
Income Distribuaon
CFS&R
CI & Diversity
Business Incenaves
R&SI
SS
IS

66
Thiruvananthapuram
City Competitiveness Index Rank/50 Score Microeconomic Competitiveness (MC) 17 57.97 FACTOR CONDITIONS (FC) 13 59.12 Financial 8 61.65 Physical 4 64.98 Communication 47 48.41 Administrative 9 62.97 Human Capacity 30 55.36 Innovation 29 56.12 DEMAND CONDITIONS (DC) 18 56.74 Demographics 20 56.09 Income Distribution & Spending Pattern 26 57.39 CONTEXT FOR FIRM STRATEGY & RIVALRY (CFS&R) 16 59.02 Competition Intensity & Diversity of Firms 23 58.00 Business Incentives 15 59.71 RELATED & SUPORTING INDUSTRY (R&SI) 33 56.04 Supplier Sophistication (SS) 40 47.18 Institutional Support (IS) 17 58.25
57.97 59.12 61.65
64.98
48.41
62.97
55.36
56.12 56.74 56.09
57.39
59.02
58.00
59.71
56.04
47.18
58.25
0.00
20.00
40.00
60.00
80.00
100.00 MC
FC
Financial
Physical
Communicaaon
Administraave
Human Capacity
Innovaaon DC Demographics
Income Distribuaon
CFS&R
CI & Diversity
Business Incenaves
R&SI
SS
IS
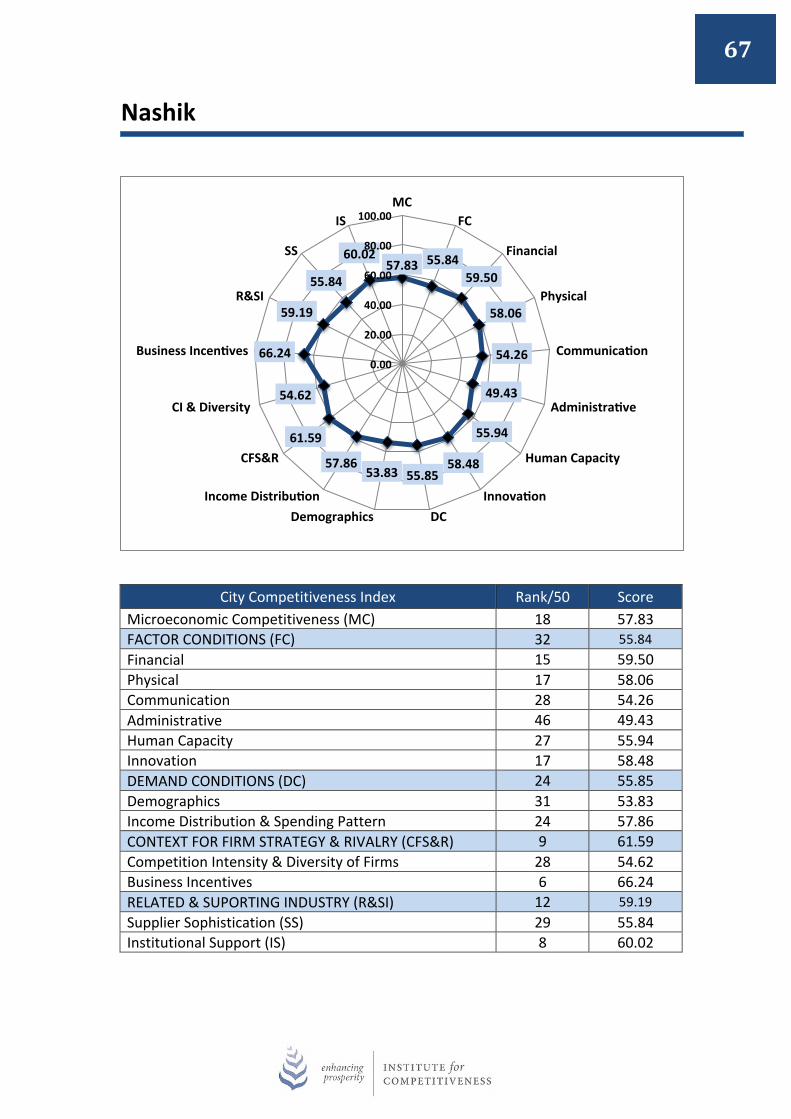
67
Nashik
City Competitiveness Index Rank/50 Score Microeconomic Competitiveness (MC) 18 57.83 FACTOR CONDITIONS (FC) 32 55.84 Financial 15 59.50 Physical 17 58.06 Communication 28 54.26 Administrative 46 49.43 Human Capacity 27 55.94 Innovation 17 58.48 DEMAND CONDITIONS (DC) 24 55.85 Demographics 31 53.83 Income Distribution & Spending Pattern 24 57.86 CONTEXT FOR FIRM STRATEGY & RIVALRY (CFS&R) 9 61.59 Competition Intensity & Diversity of Firms 28 54.62 Business Incentives 6 66.24 RELATED & SUPORTING INDUSTRY (R&SI) 12 59.19 Supplier Sophistication (SS) 29 55.84 Institutional Support (IS) 8 60.02
57.83 55.84 59.50
58.06
54.26
49.43
55.94
58.48 55.85 53.83
57.86
61.59
54.62
66.24
59.19
55.84
60.02
0.00
20.00
40.00
60.00
80.00
100.00 MC
FC
Financial
Physical
Communicaaon
Administraave
Human Capacity
Innovaaon DC Demographics
Income Distribuaon
CFS&R
CI & Diversity
Business Incenaves
R&SI
SS
IS
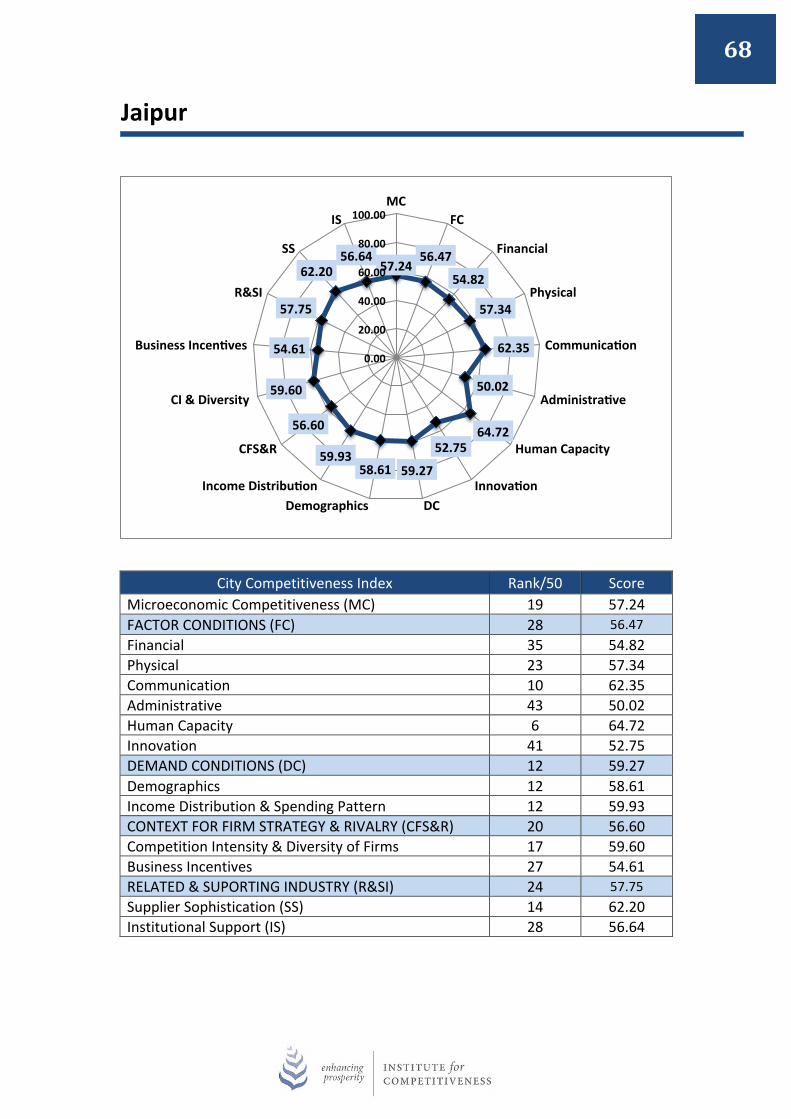
68
Jaipur
City Competitiveness Index Rank/50 Score Microeconomic Competitiveness (MC) 19 57.24 FACTOR CONDITIONS (FC) 28 56.47 Financial 35 54.82 Physical 23 57.34 Communication 10 62.35 Administrative 43 50.02 Human Capacity 6 64.72 Innovation 41 52.75 DEMAND CONDITIONS (DC) 12 59.27 Demographics 12 58.61 Income Distribution & Spending Pattern 12 59.93 CONTEXT FOR FIRM STRATEGY & RIVALRY (CFS&R) 20 56.60 Competition Intensity & Diversity of Firms 17 59.60 Business Incentives 27 54.61 RELATED & SUPORTING INDUSTRY (R&SI) 24 57.75 Supplier Sophistication (SS) 14 62.20 Institutional Support (IS) 28 56.64
57.24 56.47
54.82
57.34
62.35
50.02
64.72 52.75
59.27 58.61 59.93
56.60
59.60
54.61
57.75
62.20 56.64
0.00
20.00
40.00
60.00
80.00
100.00 MC
FC
Financial
Physical
Communicaaon
Administraave
Human Capacity
Innovaaon DC Demographics
Income Distribuaon
CFS&R
CI & Diversity
Business Incenaves
R&SI
SS
IS
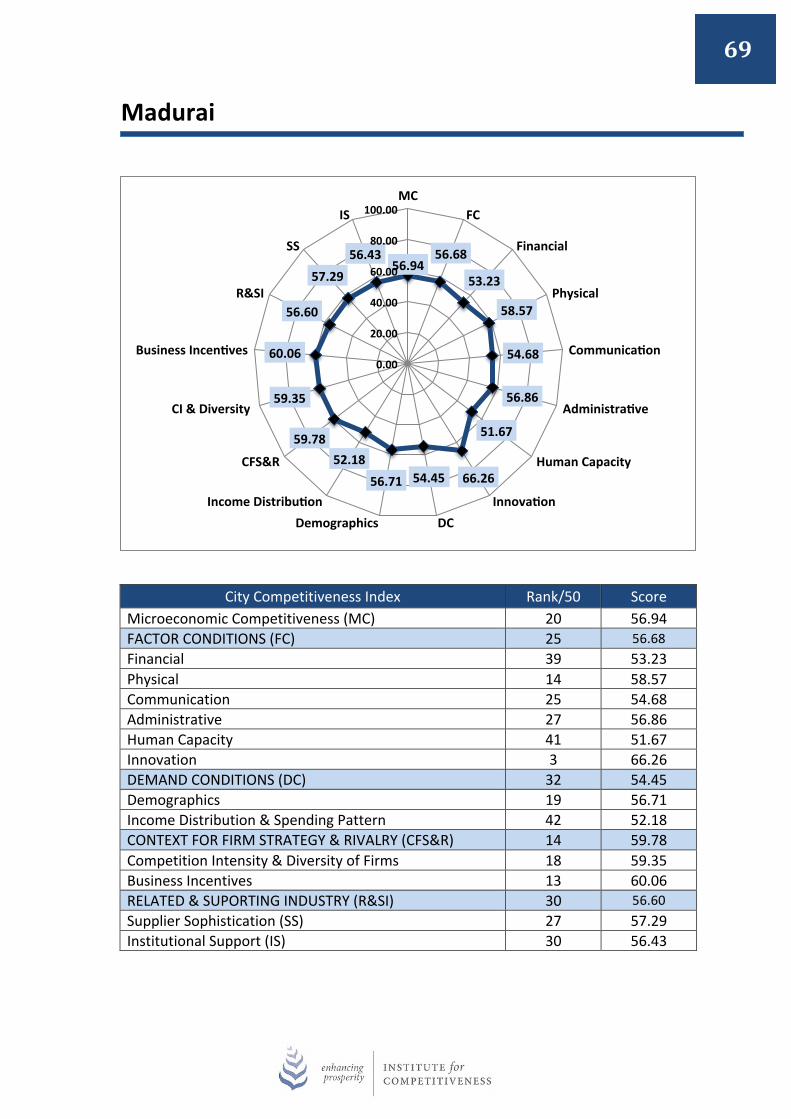
69
Madurai
City Competitiveness Index Rank/50 Score Microeconomic Competitiveness (MC) 20 56.94 FACTOR CONDITIONS (FC) 25 56.68 Financial 39 53.23 Physical 14 58.57 Communication 25 54.68 Administrative 27 56.86 Human Capacity 41 51.67 Innovation 3 66.26 DEMAND CONDITIONS (DC) 32 54.45 Demographics 19 56.71 Income Distribution & Spending Pattern 42 52.18 CONTEXT FOR FIRM STRATEGY & RIVALRY (CFS&R) 14 59.78 Competition Intensity & Diversity of Firms 18 59.35 Business Incentives 13 60.06 RELATED & SUPORTING INDUSTRY (R&SI) 30 56.60 Supplier Sophistication (SS) 27 57.29 Institutional Support (IS) 30 56.43
56.94 56.68
53.23
58.57
54.68
56.86
51.67
66.26 54.45 56.71 52.18
59.78
59.35
60.06
56.60
57.29 56.43
0.00
20.00
40.00
60.00
80.00
100.00 MC
FC
Financial
Physical
Communicaaon
Administraave
Human Capacity
Innovaaon DC Demographics
Income Distribuaon
CFS&R
CI & Diversity
Business Incenaves
R&SI
SS
IS

70
Rajkot
City Competitiveness Index Rank/50 Score Microeconomic Competitiveness (MC) 21 56.85 FACTOR CONDITIONS (FC) 24 56.87 Financial 13 59.77 Physical 47 51.83 Communication 32 53.06 Administrative 21 60.14 Human Capacity 16 59.37 Innovation 21 57.15 DEMAND CONDITIONS (DC) 16 57.27 Demographics 33 53.33 Income Distribution & Spending Pattern 8 61.21 CONTEXT FOR FIRM STRATEGY & RIVALRY (CFS&R) 21 56.41 Competition Intensity & Diversity of Firms 11 61.49 Business Incentives 36 53.02 RELATED & SUPORTING INDUSTRY (R&SI) 28 56.90 Supplier Sophistication (SS) 10 64.36 Institutional Support (IS) 42 55.03
56.85 56.87 59.77
51.83
53.06
60.14
59.37
57.15 57.27 53.33 61.21
56.41
61.49
53.02
56.90
64.36 55.03
0.00
20.00
40.00
60.00
80.00
100.00 MC
FC
Financial
Physical
Communicaaon
Administraave
Human Capacity
Innovaaon DC Demographics
Income Distribuaon
CFS&R
CI & Diversity
Business Incenaves
R&SI
SS
IS

71
Vadodara
City Competitiveness Index Rank/50 Score Microeconomic Competitiveness (MC) 22 56.76 FACTOR CONDITIONS (FC) 20 57.23 Financial 18 59.04 Physical 49 51.20 Communication 24 54.97 Administrative 17 61.45 Human Capacity 13 60.11 Innovation 23 57.07 DEMAND CONDITIONS (DC) 30 54.92 Demographics 30 53.86 Income Distribution & Spending Pattern 30 55.99 CONTEXT FOR FIRM STRATEGY & RIVALRY (CFS&R) 19 56.92 Competition Intensity & Diversity of Firms 10 61.60 Business Incentives 33 53.80 RELATED & SUPORTING INDUSTRY (R&SI) 27 56.98 Supplier Sophistication (SS) 13 62.39 Institutional Support (IS) 38 55.63
56.76 57.23 59.04
51.20
54.97
61.45
60.11
57.07 54.92 53.86
55.99
56.92
61.60
53.80
56.98
62.39 55.63
0.00
20.00
40.00
60.00
80.00
100.00 MC
FC
Financial
Physical
Communicaaon
Administraave
Human Capacity
Innovaaon DC Demographics
Income Distribuaon
CFS&R
CI & Diversity
Business Incenaves
R&SI
SS
IS

72
Indore
City Competitiveness Index Rank/50 Score Microeconomic Competitiveness (MC) 23 56.48 FACTOR CONDITIONS (FC) 19 57.80 Financial 11 61.11 Physical 40 54.51 Communication 12 61.10 Administrative 42 51.12 Human Capacity 8 62.62 Innovation 13 59.72 DEMAND CONDITIONS (DC) 25 55.51 Demographics 13 58.55 Income Distribution & Spending Pattern 41 52.47 CONTEXT FOR FIRM STRATEGY & RIVALRY (CFS&R) 25 55.55 Competition Intensity & Diversity of Firms 30 54.18 Business Incentives 17 56.46 RELATED & SUPORTING INDUSTRY (R&SI) 36 55.69 Supplier Sophistication (SS) 37 49.22 Institutional Support (IS) 25 57.31
56.48 57.80 61.11
54.51
61.10
51.12
62.62
59.72 55.51 58.55
52.47
55.55
54.18
56.46
55.69
49.22
57.31
0.00
20.00
40.00
60.00
80.00
100.00 MC
FC
Financial
Physical
Communicaaon
Administraave
Human Capacity
Innovaaon DC Demographics
Income Distribuaon
CFS&R
CI & Diversity
Business Incenaves
R&SI
SS
IS

73
Lucknow
City Competitiveness Index Rank/50 Score Microeconomic Competitiveness (MC) 24 55.85 FACTOR CONDITIONS (FC) 36 54.90 Financial 40 53.17 Physical 43 53.60 Communication 20 56.42 Administrative 32 54.08 Human Capacity 19 58.40 Innovation 32 55.74 DEMAND CONDITIONS (DC) 13 58.30 Demographics 10 59.13 Income Distribution & Spending Pattern 25 57.47 CONTEXT FOR FIRM STRATEGY & RIVALRY (CFS&R) 41 52.03 Competition Intensity & Diversity of Firms 36 52.52 Business Incentives 41 51.70 RELATED & SUPORTING INDUSTRY (R&SI) 17 58.94 Supplier Sophistication (SS) 20 60.36 Institutional Support (IS) 15 58.58
55.85 54.90
53.17
53.60
56.42
54.08
58.40
55.74 58.30 59.13
57.47
52.03
52.52
51.70
58.94
60.36 58.58
0.00
20.00
40.00
60.00
80.00
100.00 MC
FC
Financial
Physical
Communicaaon
Administraave
Human Capacity
Innovaaon DC Demographics
Income Distribuaon
CFS&R
CI & Diversity
Business Incenaves
R&SI
SS
IS
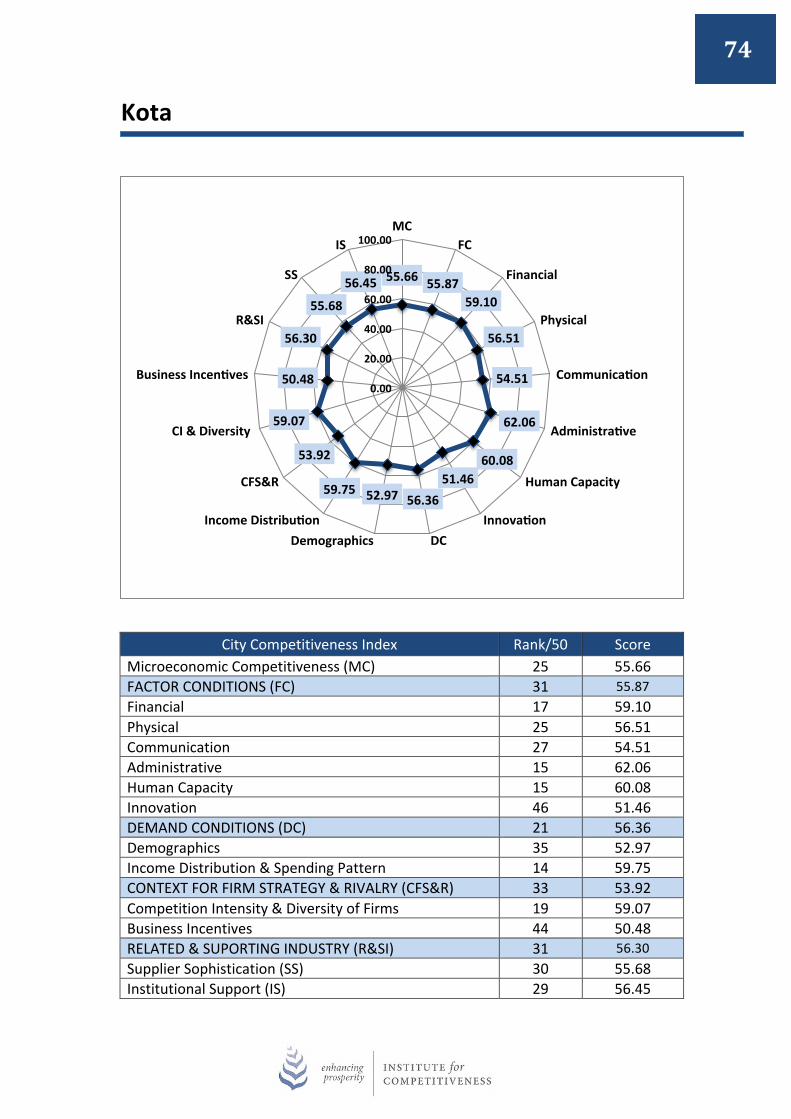
74
Kota
City Competitiveness Index Rank/50 Score Microeconomic Competitiveness (MC) 25 55.66 FACTOR CONDITIONS (FC) 31 55.87 Financial 17 59.10 Physical 25 56.51 Communication 27 54.51 Administrative 15 62.06 Human Capacity 15 60.08 Innovation 46 51.46 DEMAND CONDITIONS (DC) 21 56.36 Demographics 35 52.97 Income Distribution & Spending Pattern 14 59.75 CONTEXT FOR FIRM STRATEGY & RIVALRY (CFS&R) 33 53.92 Competition Intensity & Diversity of Firms 19 59.07 Business Incentives 44 50.48 RELATED & SUPORTING INDUSTRY (R&SI) 31 56.30 Supplier Sophistication (SS) 30 55.68 Institutional Support (IS) 29 56.45
55.66 55.87 59.10
56.51
54.51
62.06
60.08 51.46
56.36 52.97 59.75
53.92
59.07
50.48
56.30
55.68
56.45
0.00
20.00
40.00
60.00
80.00
100.00 MC
FC
Financial
Physical
Communicaaon
Administraave
Human Capacity
Innovaaon DC Demographics
Income Distribuaon
CFS&R
CI & Diversity
Business Incenaves
R&SI
SS
IS
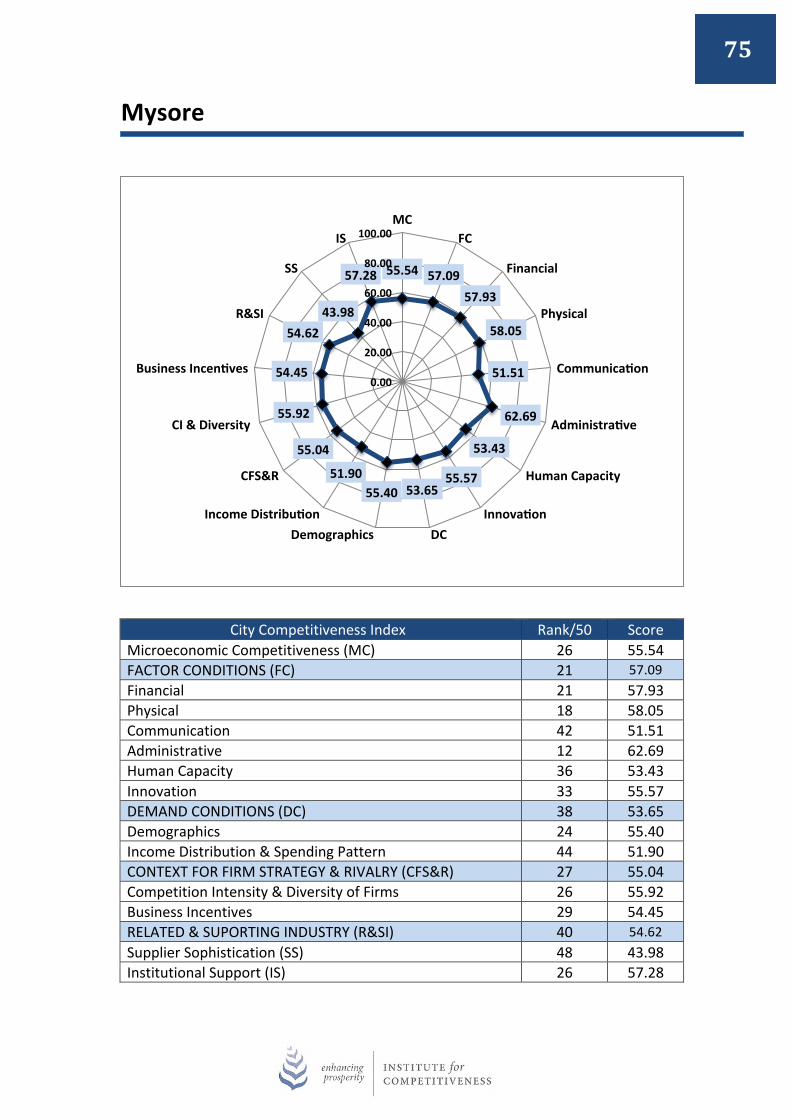
75
Mysore
City Competitiveness Index Rank/50 Score Microeconomic Competitiveness (MC) 26 55.54 FACTOR CONDITIONS (FC) 21 57.09 Financial 21 57.93 Physical 18 58.05 Communication 42 51.51 Administrative 12 62.69 Human Capacity 36 53.43 Innovation 33 55.57 DEMAND CONDITIONS (DC) 38 53.65 Demographics 24 55.40 Income Distribution & Spending Pattern 44 51.90 CONTEXT FOR FIRM STRATEGY & RIVALRY (CFS&R) 27 55.04 Competition Intensity & Diversity of Firms 26 55.92 Business Incentives 29 54.45 RELATED & SUPORTING INDUSTRY (R&SI) 40 54.62 Supplier Sophistication (SS) 48 43.98 Institutional Support (IS) 26 57.28
55.54 57.09 57.93
58.05
51.51
62.69
53.43
55.57 53.65 55.40
51.90
55.04
55.92
54.45
54.62 43.98
57.28
0.00
20.00
40.00
60.00
80.00
100.00 MC
FC
Financial
Physical
Communicaaon
Administraave
Human Capacity
Innovaaon DC Demographics
Income Distribuaon
CFS&R
CI & Diversity
Business Incenaves
R&SI
SS
IS

76
Bhopal
City Competitiveness Index Rank/50 Score Microeconomic Competitiveness (MC) 27 55.51 FACTOR CONDITIONS (FC) 26 56.66 Financial 31 56.24 Physical 33 55.36 Communication 18 58.05 Administrative 34 53.52 Human Capacity 17 59.16 Innovation 10 60.24 DEMAND CONDITIONS (DC) 26 55.50 Demographics 18 56.83 Income Distribution & Spending Pattern 36 54.16 CONTEXT FOR FIRM STRATEGY & RIVALRY (CFS&R) 30 54.18 Competition Intensity & Diversity of Firms 31 53.77 Business Incentives 28 54.46 RELATED & SUPORTING INDUSTRY (R&SI) 39 54.73 Supplier Sophistication (SS) 36 49.66 Institutional Support (IS) 34 55.99
55.51 56.66
56.24
55.36
58.05
53.52
59.16
60.24 55.50 56.83
54.16
54.18
53.77
54.46
54.73
49.66
55.99
0.00
20.00
40.00
60.00
80.00
100.00 MC
FC
Financial
Physical
Communicaaon
Administraave
Human Capacity
Innovaaon DC Demographics
Income Distribuaon
CFS&R
CI & Diversity
Business Incenaves
R&SI
SS
IS

77
Faridabad
City Competitiveness Index Rank/50 Score Microeconomic Competitiveness (MC) 28 55.38 FACTOR CONDITIONS (FC) 43 53.90 Financial 37 53.53 Physical 44 52.26 Communication 16 58.65 Administrative 38 52.90 Human Capacity 21 58.11 Innovation 49 48.81 DEMAND CONDITIONS (DC) 17 56.97 Demographics 22 55.56 Income Distribution & Spending Pattern 22 58.37 CONTEXT FOR FIRM STRATEGY & RIVALRY (CFS&R) 28 55.00 Competition Intensity & Diversity of Firms 27 54.72 Business Incentives 23 55.19 RELATED & SUPORTING INDUSTRY (R&SI) 25 57.09 Supplier Sophistication (SS) 12 62.71 Institutional Support (IS) 37 55.68
55.38 53.90
53.53
52.26
58.65
52.90
58.11 48.81
56.97 55.56 58.37
55.00
54.72
55.19
57.09
62.71 55.68
0.00
20.00
40.00
60.00
80.00
100.00 MC
FC
Financial
Physical
Communicaaon
Administraave
Human Capacity
Innovaaon DC Demographics
Income Distribuaon
CFS&R
CI & Diversity
Business Incenaves
R&SI
SS
IS
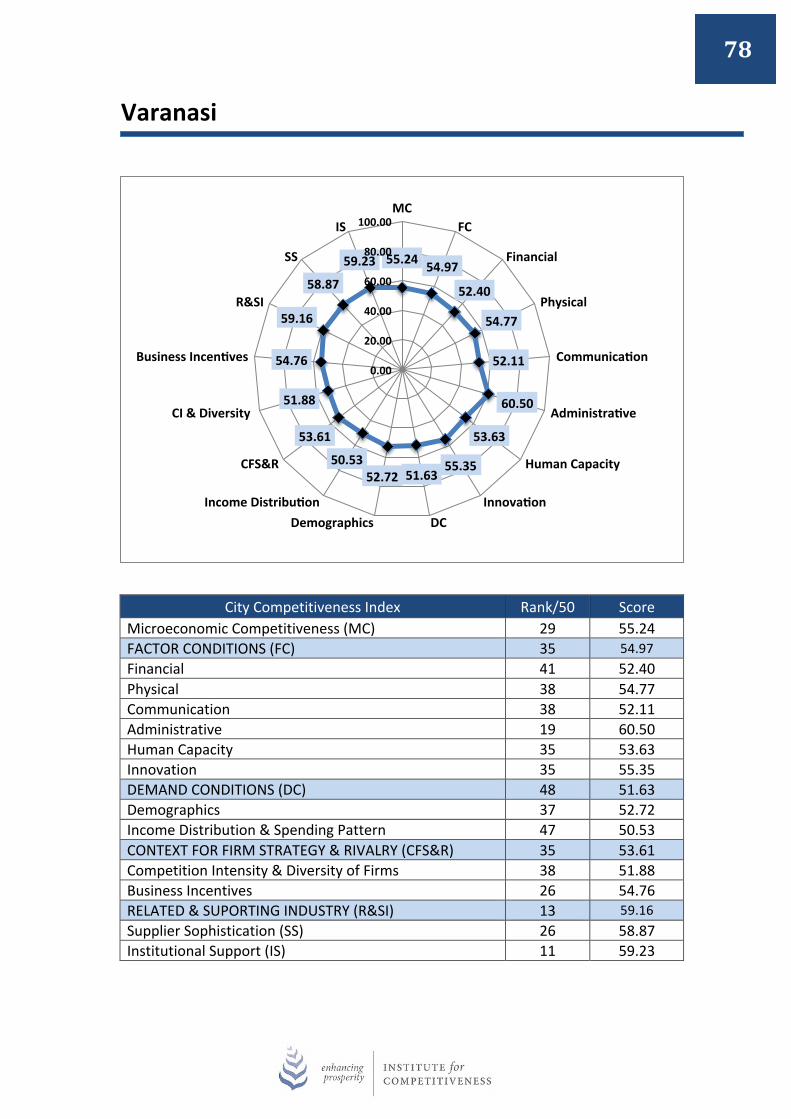
78
Varanasi
City Competitiveness Index Rank/50 Score Microeconomic Competitiveness (MC) 29 55.24 FACTOR CONDITIONS (FC) 35 54.97 Financial 41 52.40 Physical 38 54.77 Communication 38 52.11 Administrative 19 60.50 Human Capacity 35 53.63 Innovation 35 55.35 DEMAND CONDITIONS (DC) 48 51.63 Demographics 37 52.72 Income Distribution & Spending Pattern 47 50.53 CONTEXT FOR FIRM STRATEGY & RIVALRY (CFS&R) 35 53.61 Competition Intensity & Diversity of Firms 38 51.88 Business Incentives 26 54.76 RELATED & SUPORTING INDUSTRY (R&SI) 13 59.16 Supplier Sophistication (SS) 26 58.87 Institutional Support (IS) 11 59.23
55.24 54.97
52.40
54.77
52.11
60.50
53.63
55.35 51.63 52.72
50.53
53.61
51.88
54.76
59.16
58.87
59.23
0.00
20.00
40.00
60.00
80.00
100.00 MC
FC
Financial
Physical
Communicaaon
Administraave
Human Capacity
Innovaaon DC Demographics
Income Distribuaon
CFS&R
CI & Diversity
Business Incenaves
R&SI
SS
IS
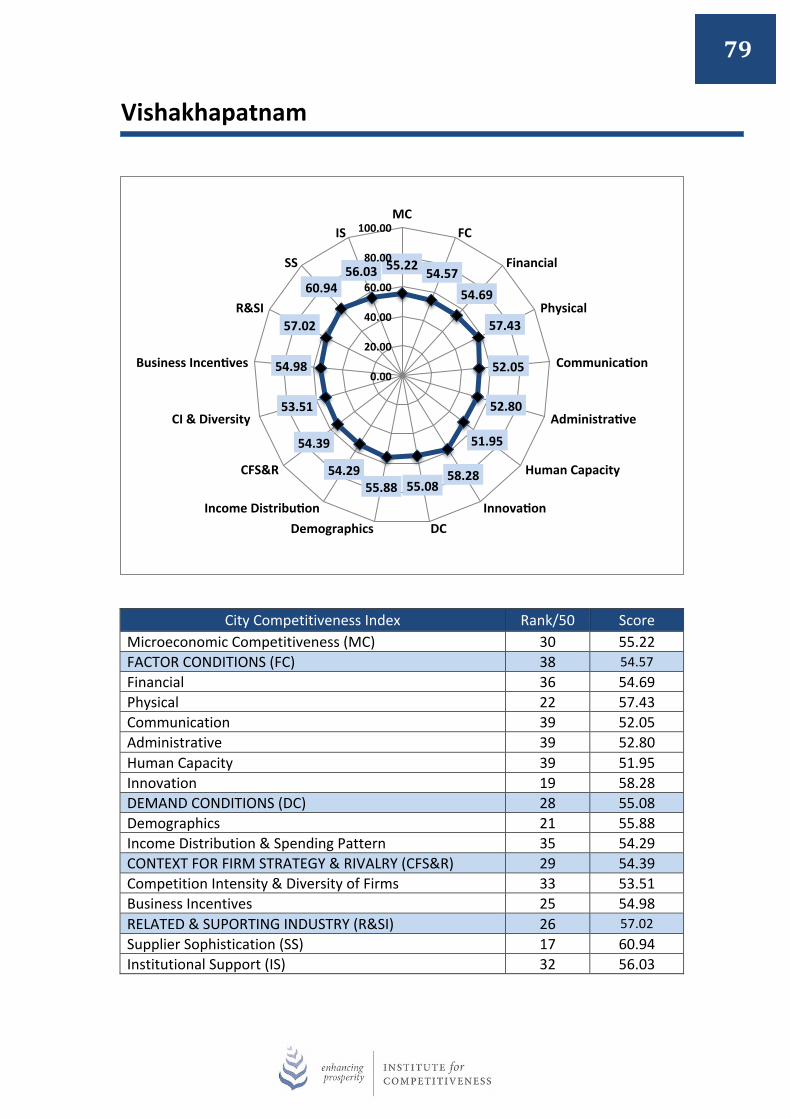
79
Vishakhapatnam
City Competitiveness Index Rank/50 Score Microeconomic Competitiveness (MC) 30 55.22 FACTOR CONDITIONS (FC) 38 54.57 Financial 36 54.69 Physical 22 57.43 Communication 39 52.05 Administrative 39 52.80 Human Capacity 39 51.95 Innovation 19 58.28 DEMAND CONDITIONS (DC) 28 55.08 Demographics 21 55.88 Income Distribution & Spending Pattern 35 54.29 CONTEXT FOR FIRM STRATEGY & RIVALRY (CFS&R) 29 54.39 Competition Intensity & Diversity of Firms 33 53.51 Business Incentives 25 54.98 RELATED & SUPORTING INDUSTRY (R&SI) 26 57.02 Supplier Sophistication (SS) 17 60.94 Institutional Support (IS) 32 56.03
55.22 54.57 54.69
57.43
52.05
52.80
51.95
58.28 55.08 55.88
54.29
54.39
53.51
54.98
57.02
60.94 56.03
0.00
20.00
40.00
60.00
80.00
100.00 MC
FC
Financial
Physical
Communicaaon
Administraave
Human Capacity
Innovaaon DC Demographics
Income Distribuaon
CFS&R
CI & Diversity
Business Incenaves
R&SI
SS
IS
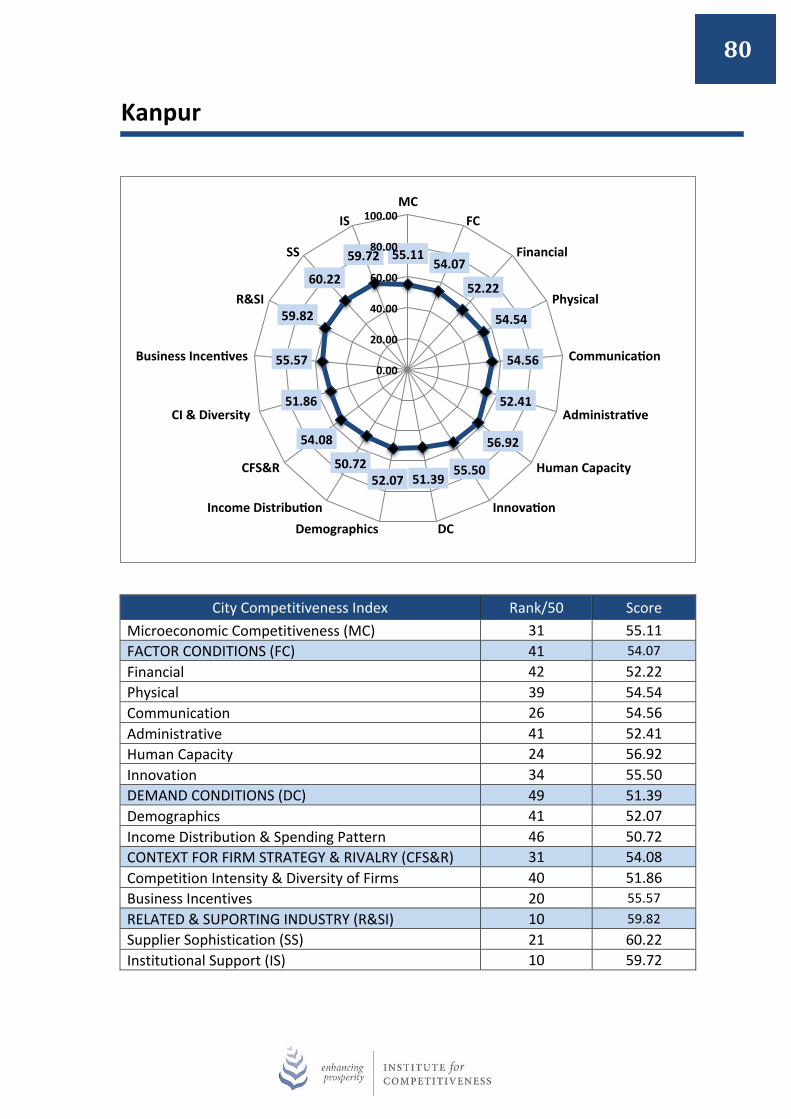
80
Kanpur
City Competitiveness Index Rank/50 Score Microeconomic Competitiveness (MC) 31 55.11 FACTOR CONDITIONS (FC) 41 54.07 Financial 42 52.22 Physical 39 54.54 Communication 26 54.56 Administrative 41 52.41 Human Capacity 24 56.92 Innovation 34 55.50 DEMAND CONDITIONS (DC) 49 51.39 Demographics 41 52.07 Income Distribution & Spending Pattern 46 50.72 CONTEXT FOR FIRM STRATEGY & RIVALRY (CFS&R) 31 54.08 Competition Intensity & Diversity of Firms 40 51.86 Business Incentives 20 55.57 RELATED & SUPORTING INDUSTRY (R&SI) 10 59.82 Supplier Sophistication (SS) 21 60.22 Institutional Support (IS) 10 59.72
55.11 54.07
52.22
54.54
54.56
52.41
56.92
55.50 51.39 52.07
50.72
54.08
51.86
55.57
59.82
60.22
59.72
0.00
20.00
40.00
60.00
80.00
100.00 MC
FC
Financial
Physical
Communicaaon
Administraave
Human Capacity
Innovaaon DC Demographics
Income Distribuaon
CFS&R
CI & Diversity
Business Incenaves
R&SI
SS
IS
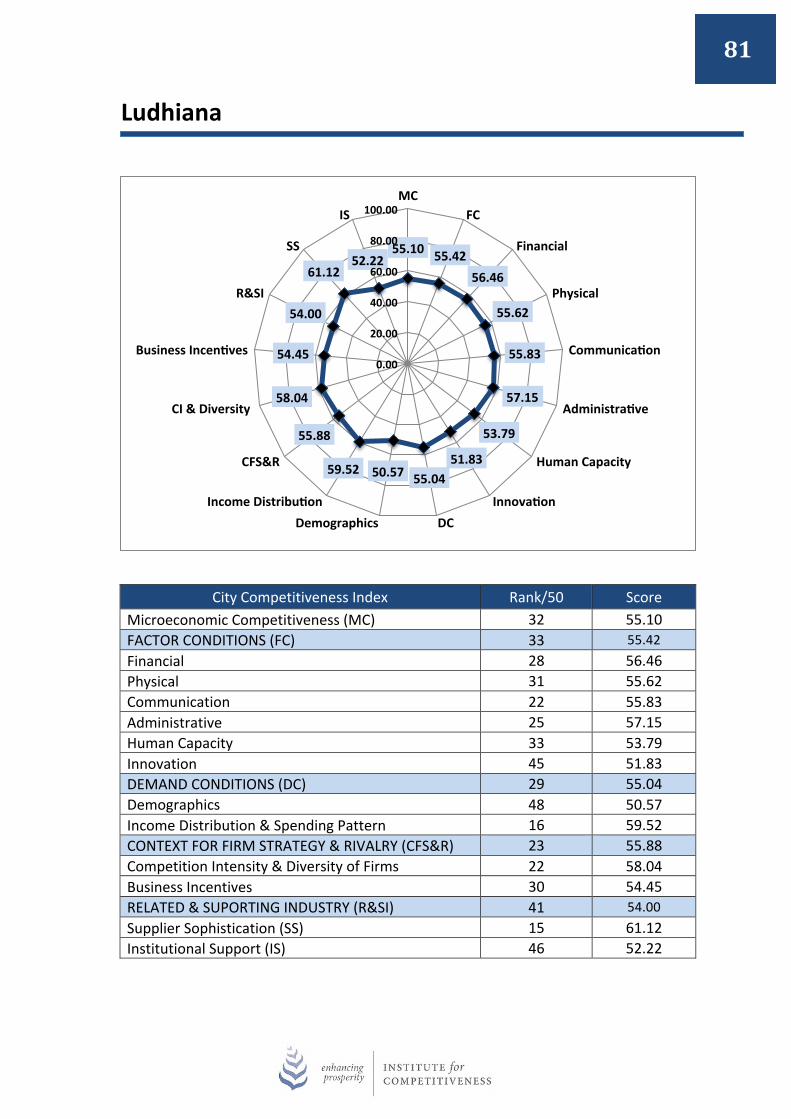
81
Ludhiana
City Competitiveness Index Rank/50 Score Microeconomic Competitiveness (MC) 32 55.10 FACTOR CONDITIONS (FC) 33 55.42 Financial 28 56.46 Physical 31 55.62 Communication 22 55.83 Administrative 25 57.15 Human Capacity 33 53.79 Innovation 45 51.83 DEMAND CONDITIONS (DC) 29 55.04 Demographics 48 50.57 Income Distribution & Spending Pattern 16 59.52 CONTEXT FOR FIRM STRATEGY & RIVALRY (CFS&R) 23 55.88 Competition Intensity & Diversity of Firms 22 58.04 Business Incentives 30 54.45 RELATED & SUPORTING INDUSTRY (R&SI) 41 54.00 Supplier Sophistication (SS) 15 61.12 Institutional Support (IS) 46 52.22
55.10 55.42 56.46
55.62
55.83
57.15
53.79
51.83 55.04 50.57 59.52
55.88
58.04
54.45
54.00
61.12 52.22
0.00
20.00
40.00
60.00
80.00
100.00 MC
FC
Financial
Physical
Communicaaon
Administraave
Human Capacity
Innovaaon DC Demographics
Income Distribuaon
CFS&R
CI & Diversity
Business Incenaves
R&SI
SS
IS
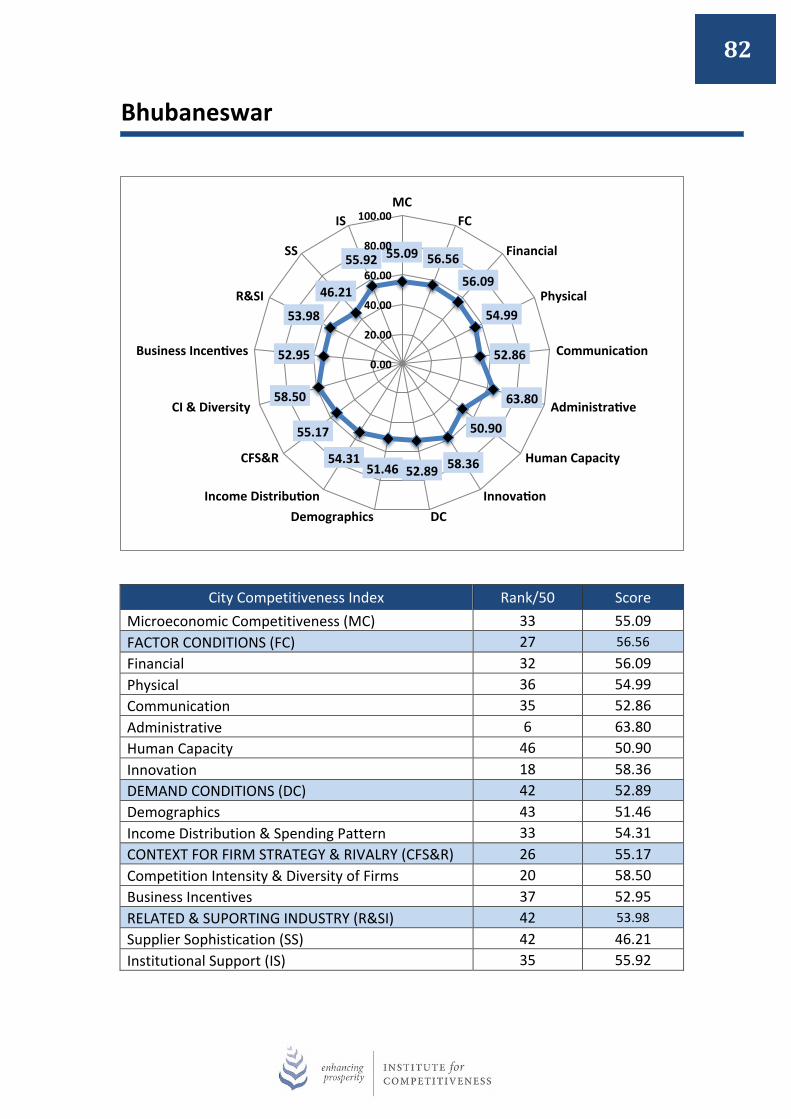
82
Bhubaneswar
City Competitiveness Index Rank/50 Score Microeconomic Competitiveness (MC) 33 55.09 FACTOR CONDITIONS (FC) 27 56.56 Financial 32 56.09 Physical 36 54.99 Communication 35 52.86 Administrative 6 63.80 Human Capacity 46 50.90 Innovation 18 58.36 DEMAND CONDITIONS (DC) 42 52.89 Demographics 43 51.46 Income Distribution & Spending Pattern 33 54.31 CONTEXT FOR FIRM STRATEGY & RIVALRY (CFS&R) 26 55.17 Competition Intensity & Diversity of Firms 20 58.50 Business Incentives 37 52.95 RELATED & SUPORTING INDUSTRY (R&SI) 42 53.98 Supplier Sophistication (SS) 42 46.21 Institutional Support (IS) 35 55.92
55.09 56.56
56.09
54.99
52.86
63.80
50.90
58.36 52.89 51.46 54.31
55.17
58.50
52.95
53.98
46.21
55.92
0.00
20.00
40.00
60.00
80.00
100.00 MC
FC
Financial
Physical
Communicaaon
Administraave
Human Capacity
Innovaaon DC Demographics
Income Distribuaon
CFS&R
CI & Diversity
Business Incenaves
R&SI
SS
IS
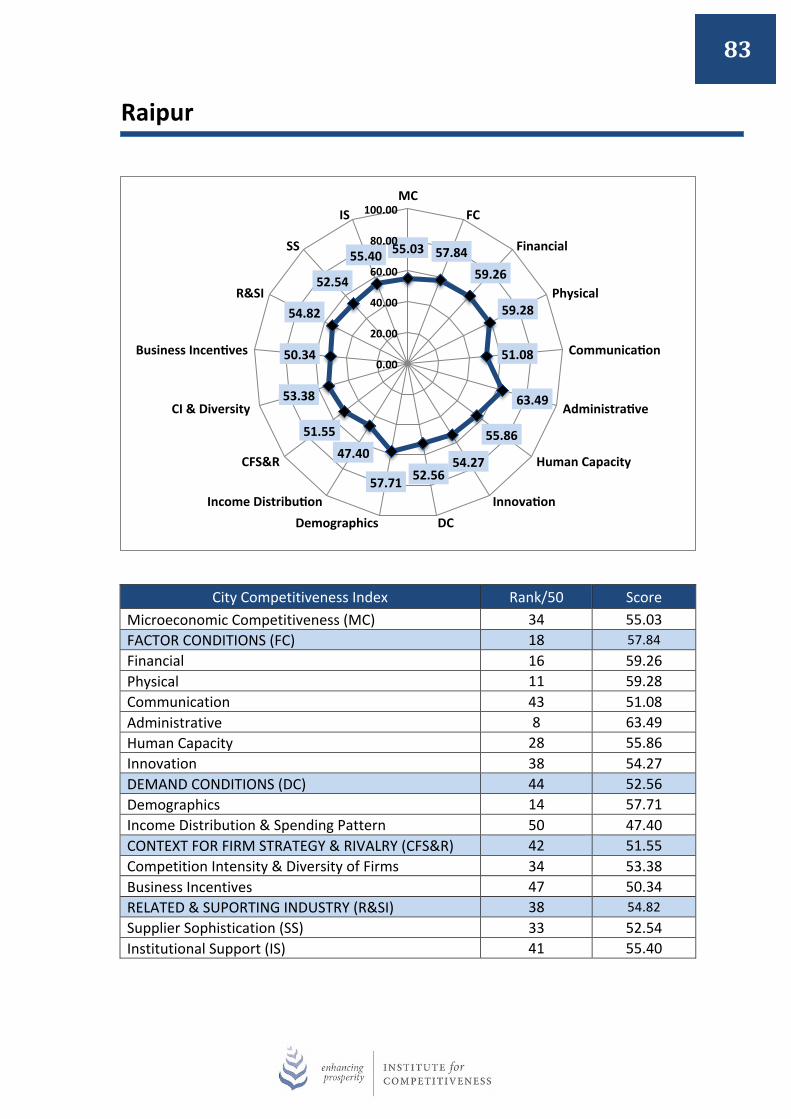
83
Raipur
City Competitiveness Index Rank/50 Score Microeconomic Competitiveness (MC) 34 55.03 FACTOR CONDITIONS (FC) 18 57.84 Financial 16 59.26 Physical 11 59.28 Communication 43 51.08 Administrative 8 63.49 Human Capacity 28 55.86 Innovation 38 54.27 DEMAND CONDITIONS (DC) 44 52.56 Demographics 14 57.71 Income Distribution & Spending Pattern 50 47.40 CONTEXT FOR FIRM STRATEGY & RIVALRY (CFS&R) 42 51.55 Competition Intensity & Diversity of Firms 34 53.38 Business Incentives 47 50.34 RELATED & SUPORTING INDUSTRY (R&SI) 38 54.82 Supplier Sophistication (SS) 33 52.54 Institutional Support (IS) 41 55.40
55.03 57.84 59.26
59.28
51.08
63.49
55.86
54.27 52.56 57.71
47.40 51.55
53.38
50.34
54.82
52.54
55.40
0.00
20.00
40.00
60.00
80.00
100.00 MC
FC
Financial
Physical
Communicaaon
Administraave
Human Capacity
Innovaaon DC Demographics
Income Distribuaon
CFS&R
CI & Diversity
Business Incenaves
R&SI
SS
IS
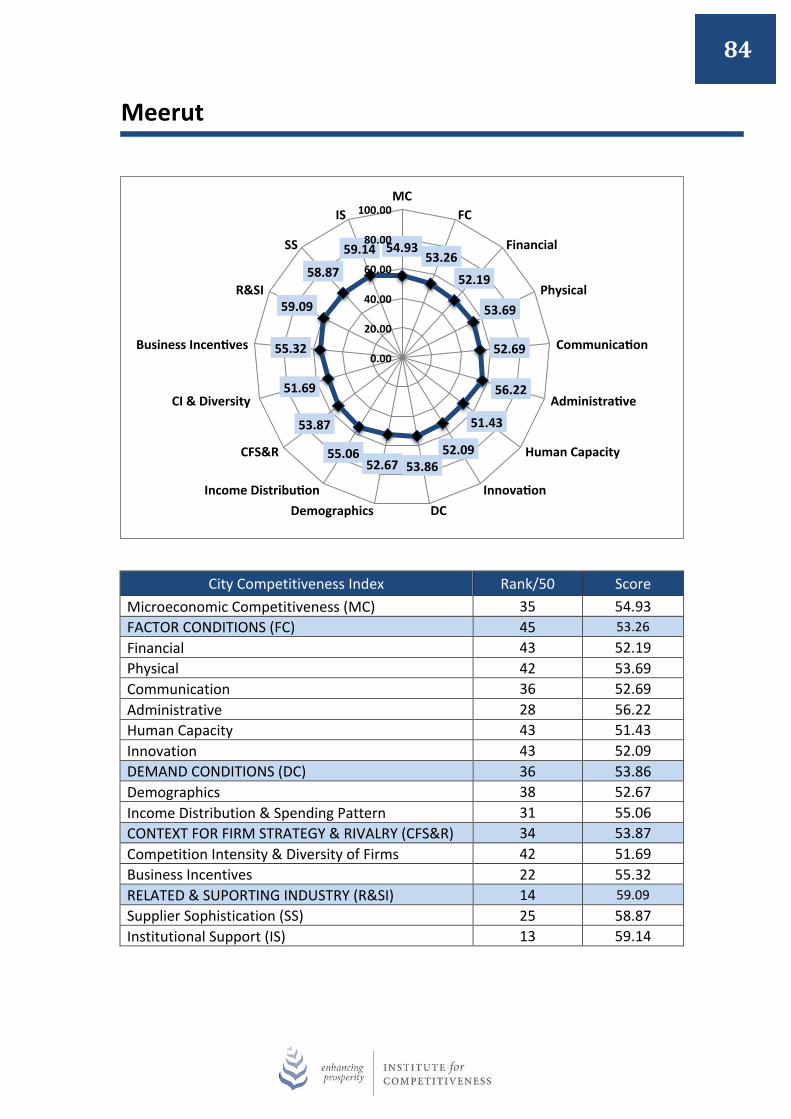
84
Meerut
City Competitiveness Index Rank/50 Score Microeconomic Competitiveness (MC) 35 54.93 FACTOR CONDITIONS (FC) 45 53.26 Financial 43 52.19 Physical 42 53.69 Communication 36 52.69 Administrative 28 56.22 Human Capacity 43 51.43 Innovation 43 52.09 DEMAND CONDITIONS (DC) 36 53.86 Demographics 38 52.67 Income Distribution & Spending Pattern 31 55.06 CONTEXT FOR FIRM STRATEGY & RIVALRY (CFS&R) 34 53.87 Competition Intensity & Diversity of Firms 42 51.69 Business Incentives 22 55.32 RELATED & SUPORTING INDUSTRY (R&SI) 14 59.09 Supplier Sophistication (SS) 25 58.87 Institutional Support (IS) 13 59.14
54.93 53.26
52.19
53.69
52.69
56.22
51.43
52.09 53.86 52.67
55.06
53.87
51.69
55.32
59.09
58.87
59.14
0.00
20.00
40.00
60.00
80.00
100.00 MC
FC
Financial
Physical
Communicaaon
Administraave
Human Capacity
Innovaaon DC Demographics
Income Distribuaon
CFS&R
CI & Diversity
Business Incenaves
R&SI
SS
IS

85
Guwahati
City Competitiveness Index Rank/50 Score Microeconomic Competitiveness (MC) 36 54.83 FACTOR CONDITIONS (FC) 22 57.05 Financial 45 51.03 Physical 16 58.46 Communication 15 59.82 Administrative 3 64.48 Human Capacity 32 53.80 Innovation 42 52.49 DEMAND CONDITIONS (DC) 27 55.34 Demographics 32 53.78 Income Distribution & Spending Pattern 28 56.91 CONTEXT FOR FIRM STRATEGY & RIVALRY (CFS&R) 36 53.53 Competition Intensity & Diversity of Firms 45 50.66 Business Incentives 21 55.45 RELATED & SUPORTING INDUSTRY (R&SI) 46 52.01 Supplier Sophistication (SS) 44 46.21 Institutional Support (IS) 45 53.46
54.83 57.05
51.03
58.46
59.82
64.48
53.80
52.49 55.34 53.78
56.91
53.53
50.66
55.45
52.01
46.21
53.46
0.00
20.00
40.00
60.00
80.00
100.00 MC
FC
Financial
Physical
Communicaaon
Administraave
Human Capacity
Innovaaon DC Demographics
Income Distribuaon
CFS&R
CI & Diversity
Business Incenaves
R&SI
SS
IS

86
Dehradun
City Competitiveness Index Rank/50 Score Microeconomic Competitiveness (MC) 37 54.71 FACTOR CONDITIONS (FC) 17 57.96 Financial 29 56.44 Physical 8 60.27 Communication 23 55.23 Administrative 2 66.32 Human Capacity 47 49.46 Innovation 36 55.10 DEMAND CONDITIONS (DC) 19 56.72 Demographics 25 54.63 Income Distribution & Spending Pattern 19 58.82 CONTEXT FOR FIRM STRATEGY & RIVALRY (CFS&R) 45 50.08 Competition Intensity & Diversity of Firms 47 48.45 Business Incentives 42 51.17 RELATED & SUPORTING INDUSTRY (R&SI) 45 52.01 Supplier Sophistication (SS) 43 46.21 Institutional Support (IS) 44 53.46
54.71 57.96
56.44
60.27
55.23
66.32
49.46
55.10 56.72 54.63
58.82
50.08
48.45
51.17
52.01
46.21
53.46
0.00
20.00
40.00
60.00
80.00
100.00 MC
FC
Financial
Physical
Communicaaon
Administraave
Human Capacity
Innovaaon DC Demographics
Income Distribuaon
CFS&R
CI & Diversity
Business Incenaves
R&SI
SS
IS

87
Patna
City Competitiveness Index Rank/50 Score Microeconomic Competitiveness (MC) 38 54.64 FACTOR CONDITIONS (FC) 40 54.42 Financial 27 56.49 Physical 34 55.25 Communication 33 52.95 Administrative 44 49.91 Human Capacity 23 56.93 Innovation 27 56.28 DEMAND CONDITIONS (DC) 41 53.08 Demographics 29 54.37 Income Distribution & Spending Pattern 45 51.80 CONTEXT FOR FIRM STRATEGY & RIVALRY (CFS&R) 44 51.05 Competition Intensity & Diversity of Firms 41 51.73 Business Incentives 43 50.59 RELATED & SUPORTING INDUSTRY (R&SI) 18 58.79 Supplier Sophistication (SS) 28 57.18 Institutional Support (IS) 12 59.19
54.64 54.42 56.49
55.25
52.95
49.91
56.93
56.28 53.08 54.37
51.80
51.05
51.73
50.59
58.79
57.18
59.19
0.00
20.00
40.00
60.00
80.00
100.00 MC
FC
Financial
Physical
Communicaaon
Administraave
Human Capacity
Innovaaon DC Demographics
Income Distribuaon
CFS&R
CI & Diversity
Business Incenaves
R&SI
SS
IS
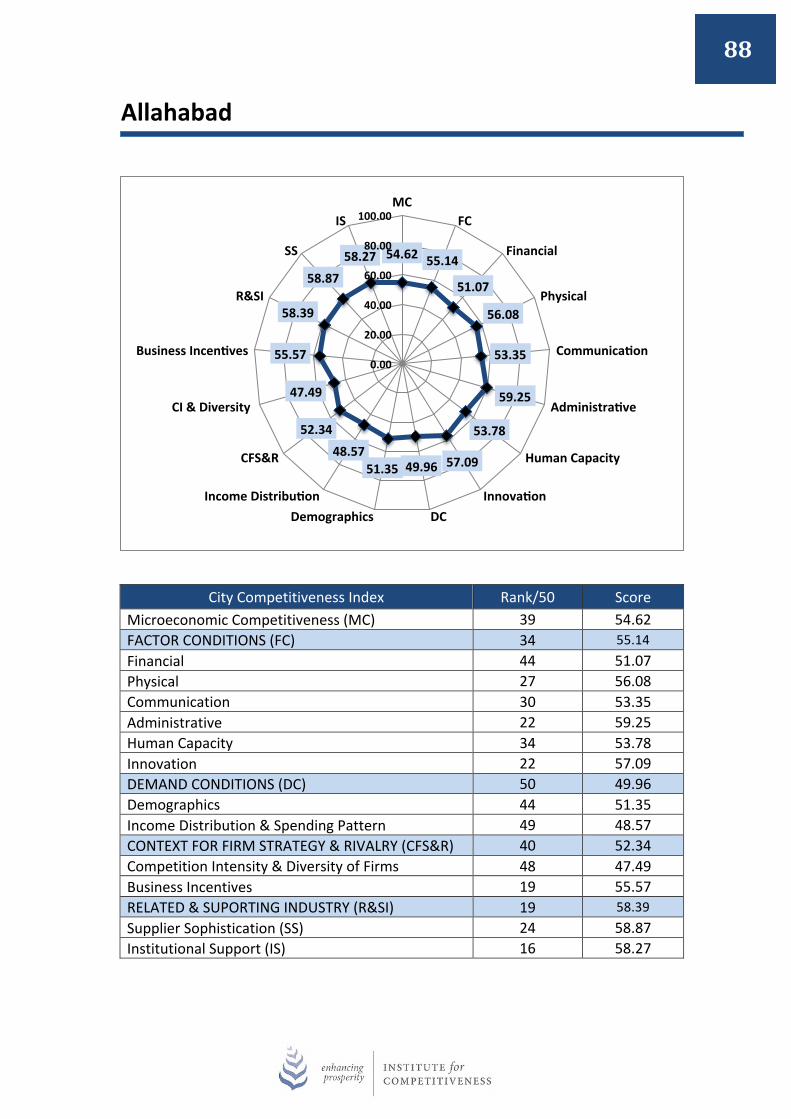
88
Allahabad
City Competitiveness Index Rank/50 Score Microeconomic Competitiveness (MC) 39 54.62 FACTOR CONDITIONS (FC) 34 55.14 Financial 44 51.07 Physical 27 56.08 Communication 30 53.35 Administrative 22 59.25 Human Capacity 34 53.78 Innovation 22 57.09 DEMAND CONDITIONS (DC) 50 49.96 Demographics 44 51.35 Income Distribution & Spending Pattern 49 48.57 CONTEXT FOR FIRM STRATEGY & RIVALRY (CFS&R) 40 52.34 Competition Intensity & Diversity of Firms 48 47.49 Business Incentives 19 55.57 RELATED & SUPORTING INDUSTRY (R&SI) 19 58.39 Supplier Sophistication (SS) 24 58.87 Institutional Support (IS) 16 58.27
54.62 55.14
51.07
56.08
53.35
59.25
53.78
57.09 49.96 51.35 48.57
52.34
47.49
55.57
58.39
58.87 58.27
0.00
20.00
40.00
60.00
80.00
100.00 MC
FC
Financial
Physical
Communicaaon
Administraave
Human Capacity
Innovaaon DC Demographics
Income Distribuaon
CFS&R
CI & Diversity
Business Incenaves
R&SI
SS
IS

89
Shimla
City Competitiveness Index Rank/50 Score Microeconomic Competitiveness (MC) 40 54.35 FACTOR CONDITIONS (FC) 12 59.63 Financial 10 61.13 Physical 5 63.00 Communication 31 53.06 Administrative 1 68.44 Human Capacity 49 48.37 Innovation 25 56.85 DEMAND CONDITIONS (DC) 46 52.46 Demographics 50 45.26 Income Distribution & Spending Pattern 15 59.66 CONTEXT FOR FIRM STRATEGY & RIVALRY (CFS&R) 43 51.08 Competition Intensity & Diversity of Firms 46 49.19 Business Incentives 38 52.34 RELATED & SUPORTING INDUSTRY (R&SI) 50 49.66 Supplier Sophistication (SS) 46 46.21 Institutional Support (IS) 50 50.52
54.35 59.63
61.13
63.00
53.06
68.44
48.37
56.85 52.46
45.26 59.66
51.08
49.19
52.34
49.66
46.21
50.52
0.00
20.00
40.00
60.00
80.00
100.00 MC
FC
Financial
Physical
Communicaaon
Administraave
Human Capacity
Innovaaon DC Demographics
Income Distribuaon
CFS&R
CI & Diversity
Business Incenaves
R&SI
SS
IS

90
Vijayawada
City Competitiveness Index Rank/50 Score Microeconomic Competitiveness (MC) 41 54.28 FACTOR CONDITIONS (FC) 47 52.80 Financial 25 57.13 Physical 13 58.67 Communication 41 51.63 Administrative 50 40.82 Human Capacity 45 50.91 Innovation 16 58.97 DEMAND CONDITIONS (DC) 33 54.43 Demographics 26 54.53 Income Distribution & Spending Pattern 32 54.34 CONTEXT FOR FIRM STRATEGY & RIVALRY (CFS&R) 32 53.95 Competition Intensity & Diversity of Firms 32 53.51 Business Incentives 31 54.25 RELATED & SUPORTING INDUSTRY (R&SI) 29 56.80 Supplier Sophistication (SS) 16 60.94 Institutional Support (IS) 36 55.76
54.28 52.80
57.13
58.67
51.63
40.82
50.91
58.97 54.43 54.53
54.34
53.95
53.51
54.25
56.80
60.94 55.76
0.00
20.00
40.00
60.00
80.00
100.00 MC
FC
Financial
Physical
Communicaaon
Administraave
Human Capacity
Innovaaon DC Demographics
Income Distribuaon
CFS&R
CI & Diversity
Business Incenaves
R&SI
SS
IS

91
Amritsar
City Competitiveness Index Rank/50 Score Microeconomic Competitiveness (MC) 42 54.24 FACTOR CONDITIONS (FC) 37 54.75 Financial 30 56.30 Physical 32 55.37 Communication 40 51.64 Administrative 23 57.84 Human Capacity 38 52.08 Innovation 40 52.76 DEMAND CONDITIONS (DC) 20 56.59 Demographics 46 51.14 Income Distribution & Spending Pattern 6 62.05 CONTEXT FOR FIRM STRATEGY & RIVALRY (CFS&R) 22 56.17 Competition Intensity & Diversity of Firms 24 57.96 Business Incentives 24 54.98 RELATED & SUPORTING INDUSTRY (R&SI) 47 50.45 Supplier Sophistication (SS) 41 47.04 Institutional Support (IS) 47 51.31
54.24 54.75 56.30
55.37
51.64
57.84
52.08
52.76 56.59 51.14 62.05
56.17
57.96
54.98
50.45
47.04
51.31
0.00
20.00
40.00
60.00
80.00
100.00 MC
FC
Financial
Physical
Communicaaon
Administraave
Human Capacity
Innovaaon DC Demographics
Income Distribuaon
CFS&R
CI & Diversity
Business Incenaves
R&SI
SS
IS

92
Asansol
City Competitiveness Index Rank/50 Score Microeconomic Competitiveness (MC) 43 54.12 FACTOR CONDITIONS (FC) 42 54.02 Financial 24 57.14 Physical 24 57.30 Communication 46 49.17 Administrative 37 52.97 Human Capacity 48 49.30 Innovation 31 55.98 DEMAND CONDITIONS (DC) 37 53.70 Demographics 45 51.15 Income Distribution & Spending Pattern 29 56.25 CONTEXT FOR FIRM STRATEGY & RIVALRY (CFS&R) 37 53.15 Competition Intensity & Diversity of Firms 29 54.45 Business Incentives 39 52.28 RELATED & SUPORTING INDUSTRY (R&SI) 37 55.33 Supplier Sophistication (SS) 49 43.66 Institutional Support (IS) 18 58.24
54.12 54.02 57.14
57.30
49.17
52.97
49.30
55.98 53.70 51.15 56.25
53.15
54.45
52.28
55.33 43.66
58.24
0.00
20.00
40.00
60.00
80.00
100.00 MC
FC
Financial
Physical
Communicaaon
Administraave
Human Capacity
Innovaaon DC Demographics
Income Distribuaon
CFS&R
CI & Diversity
Business Incenaves
R&SI
SS
IS
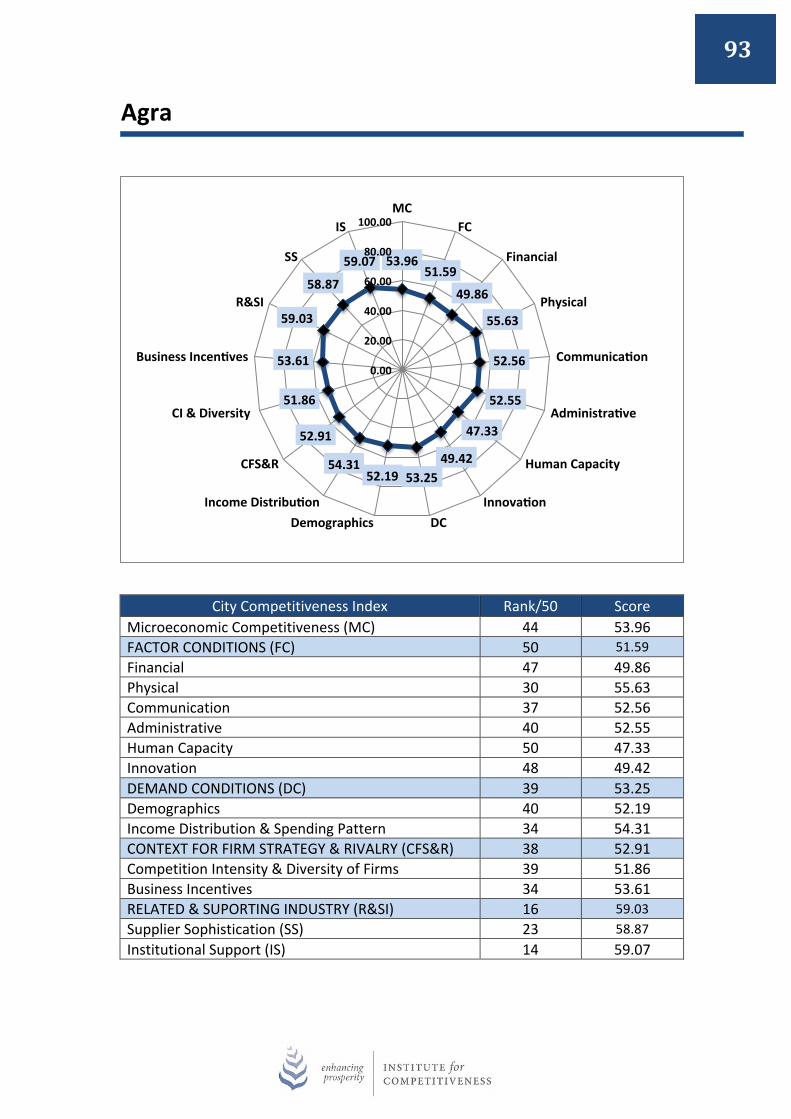
93
Agra
City Competitiveness Index Rank/50 Score Microeconomic Competitiveness (MC) 44 53.96 FACTOR CONDITIONS (FC) 50 51.59 Financial 47 49.86 Physical 30 55.63 Communication 37 52.56 Administrative 40 52.55 Human Capacity 50 47.33 Innovation 48 49.42 DEMAND CONDITIONS (DC) 39 53.25 Demographics 40 52.19 Income Distribution & Spending Pattern 34 54.31 CONTEXT FOR FIRM STRATEGY & RIVALRY (CFS&R) 38 52.91 Competition Intensity & Diversity of Firms 39 51.86 Business Incentives 34 53.61 RELATED & SUPORTING INDUSTRY (R&SI) 16 59.03 Supplier Sophistication (SS) 23 58.87 Institutional Support (IS) 14 59.07
53.96 51.59
49.86
55.63
52.56
52.55
47.33
49.42 53.25 52.19
54.31
52.91
51.86
53.61
59.03
58.87
59.07
0.00
20.00
40.00
60.00
80.00
100.00 MC
FC
Financial
Physical
Communicaaon
Administraave
Human Capacity
Innovaaon DC Demographics
Income Distribuaon
CFS&R
CI & Diversity
Business Incenaves
R&SI
SS
IS

94
Ranchi
City Competitiveness Index Rank/50 Score Microeconomic Competitiveness (MC) 45 53.87 FACTOR CONDITIONS (FC) 39 54.46 Financial 46 50.34 Physical 37 54.83 Communication 48 47.01 Administrative 5 63.81 Human Capacity 31 53.95 Innovation 37 54.94 DEMAND CONDITIONS (DC) 35 54.01 Demographics 27 54.51 Income Distribution & Spending Pattern 39 53.52 CONTEXT FOR FIRM STRATEGY & RIVALRY (CFS&R) 46 50.06 Competition Intensity & Diversity of Firms 37 52.16 Business Incentives 50 48.65 RELATED & SUPORTING INDUSTRY (R&SI) 34 55.88 Supplier Sophistication (SS) 31 54.19 Institutional Support (IS) 31 56.30
53.87 54.46
50.34
54.83
47.01
63.81
53.95
54.94 54.01 54.51
53.52
50.06
52.16
48.65
55.88
54.19
56.30
0.00
20.00
40.00
60.00
80.00
100.00 MC
FC
Financial
Physical
Communicaaon
Administraave
Human Capacity
Innovaaon DC Demographics
Income Distribuaon
CFS&R
CI & Diversity
Business Incenaves
R&SI
SS
IS

95
Jabalpur
City Competitiveness Index Rank/50 Score Microeconomic Competitiveness (MC) 46 53.58 FACTOR CONDITIONS (FC) 46 53.16 Financial 38 53.31 Physical 41 53.92 Communication 44 50.54 Administrative 48 48.77 Human Capacity 20 58.35 Innovation 26 56.72 DEMAND CONDITIONS (DC) 45 52.47 Demographics 36 52.79 Income Distribution & Spending Pattern 43 52.15 CONTEXT FOR FIRM STRATEGY & RIVALRY (CFS&R) 39 52.40 Competition Intensity & Diversity of Firms 35 53.25 Business Incentives 40 51.84 RELATED & SUPORTING INDUSTRY (R&SI) 35 55.85 Supplier Sophistication (SS) 38 49.22 Institutional Support (IS) 21 57.51
53.58 53.16 53.31
53.92
50.54
48.77
58.35
56.72 52.47 52.79
52.15
52.40
53.25
51.84
55.85
49.22
57.51
0.00
20.00
40.00
60.00
80.00
100.00 MC
FC
Financial
Physical
Communicaaon
Administraave
Human Capacity
Innovaaon DC Demographics
Income Distribuaon
CFS&R
CI & Diversity
Business Incenaves
R&SI
SS
IS

96
Jammu
City Competitiveness Index Rank/50 Score Microeconomic Competitiveness (MC) 47 52.73 FACTOR CONDITIONS (FC) 29 56.10 Financial 34 55.48 Physical 21 57.44 Communication 34 52.86 Administrative 18 60.85 Human Capacity 22 57.01 Innovation 47 50.33 DEMAND CONDITIONS (DC) 34 54.10 Demographics 49 49.80 Income Distribution & Spending Pattern 21 58.40 CONTEXT FOR FIRM STRATEGY & RIVALRY (CFS&R) 50 48.79 Competition Intensity & Diversity of Firms 50 46.35 Business Incentives 45 50.42 RELATED & SUPORTING INDUSTRY (R&SI) 49 49.66 Supplier Sophistication (SS) 45 46.21 Institutional Support (IS) 49 50.52
52.73 56.10
55.48
57.44
52.86
60.85
57.01 50.33
54.10 49.80 58.40
48.79
46.35
50.42
49.66
46.21
50.52
0.00
20.00
40.00
60.00
80.00
100.00 MC
FC
Financial
Physical
Communicaaon
Administraave
Human Capacity
Innovaaon DC Demographics
Income Distribuaon
CFS&R
CI & Diversity
Business Incenaves
R&SI
SS
IS
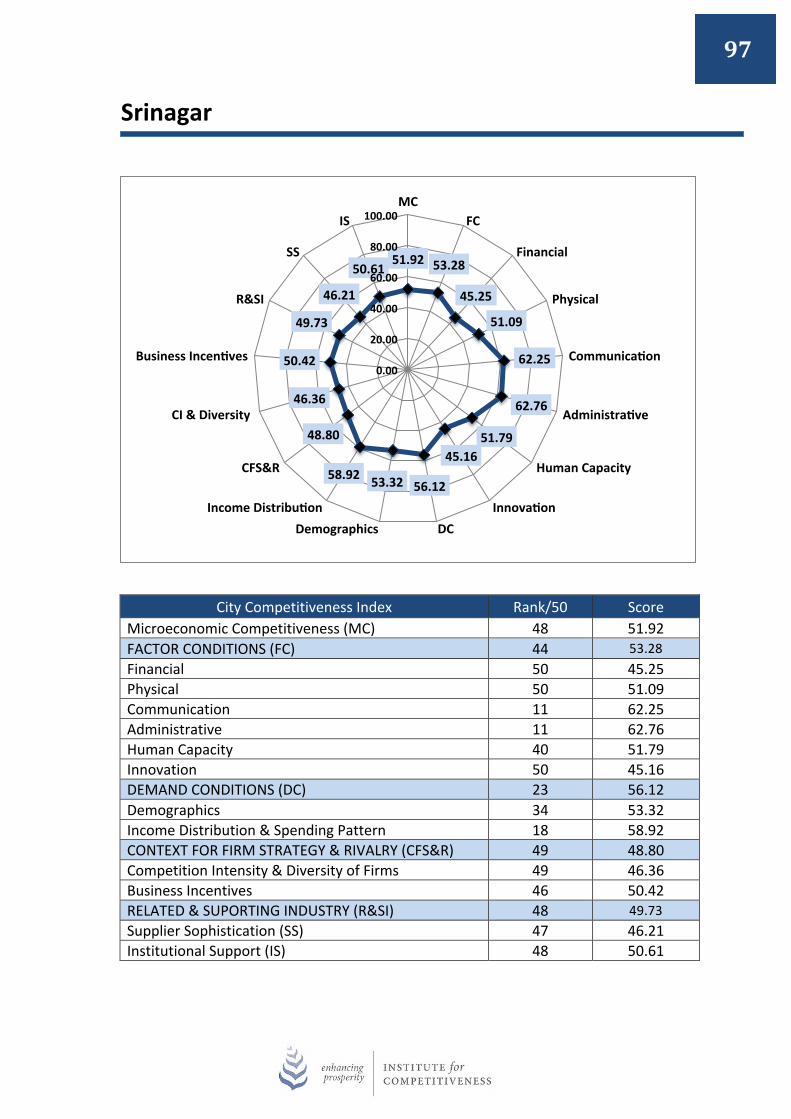
97
Srinagar
City Competitiveness Index Rank/50 Score Microeconomic Competitiveness (MC) 48 51.92 FACTOR CONDITIONS (FC) 44 53.28 Financial 50 45.25 Physical 50 51.09 Communication 11 62.25 Administrative 11 62.76 Human Capacity 40 51.79 Innovation 50 45.16 DEMAND CONDITIONS (DC) 23 56.12 Demographics 34 53.32 Income Distribution & Spending Pattern 18 58.92 CONTEXT FOR FIRM STRATEGY & RIVALRY (CFS&R) 49 48.80 Competition Intensity & Diversity of Firms 49 46.36 Business Incentives 46 50.42 RELATED & SUPORTING INDUSTRY (R&SI) 48 49.73 Supplier Sophistication (SS) 47 46.21 Institutional Support (IS) 48 50.61
51.92 53.28
45.25
51.09
62.25
62.76
51.79 45.16
56.12 53.32 58.92
48.80
46.36
50.42
49.73
46.21
50.61
0.00
20.00
40.00
60.00
80.00
100.00 MC
FC
Financial
Physical
Communicaaon
Administraave
Human Capacity
Innovaaon DC Demographics
Income Distribuaon
CFS&R
CI & Diversity
Business Incenaves
R&SI
SS
IS
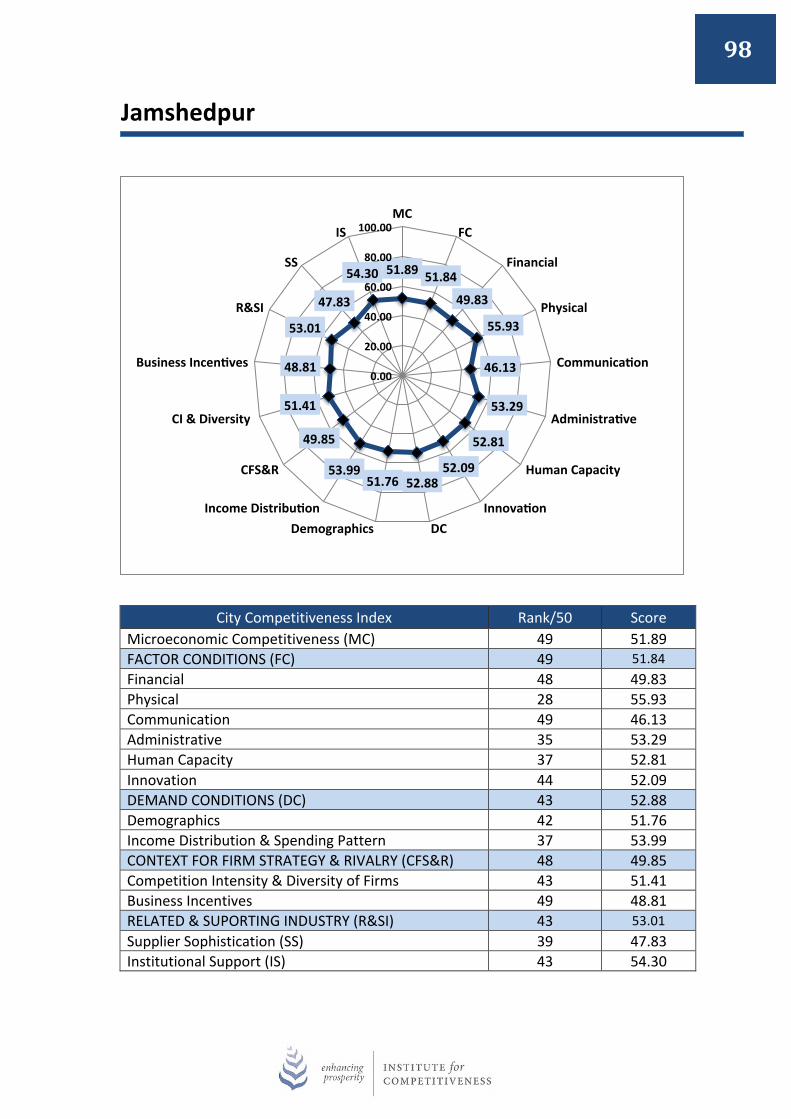
98
Jamshedpur
City Competitiveness Index Rank/50 Score Microeconomic Competitiveness (MC) 49 51.89 FACTOR CONDITIONS (FC) 49 51.84 Financial 48 49.83 Physical 28 55.93 Communication 49 46.13 Administrative 35 53.29 Human Capacity 37 52.81 Innovation 44 52.09 DEMAND CONDITIONS (DC) 43 52.88 Demographics 42 51.76 Income Distribution & Spending Pattern 37 53.99 CONTEXT FOR FIRM STRATEGY & RIVALRY (CFS&R) 48 49.85 Competition Intensity & Diversity of Firms 43 51.41 Business Incentives 49 48.81 RELATED & SUPORTING INDUSTRY (R&SI) 43 53.01 Supplier Sophistication (SS) 39 47.83 Institutional Support (IS) 43 54.30
51.89 51.84
49.83
55.93
46.13
53.29
52.81
52.09 52.88 51.76
53.99
49.85
51.41
48.81
53.01
47.83
54.30
0.00
20.00
40.00
60.00
80.00
100.00 MC
FC
Financial
Physical
Communicaaon
Administraave
Human Capacity
Innovaaon DC Demographics
Income Distribuaon
CFS&R
CI & Diversity
Business Incenaves
R&SI
SS
IS

99
Dhanbad
City Competitiveness Index Rank/50 Score Microeconomic Competitiveness (MC) 50 51.88 FACTOR CONDITIONS (FC) 48 52.44 Financial 49 48.22 Physical 45 52.20 Communication 50 44.81 Administrative 14 62.12 Human Capacity 42 51.50 Innovation 39 54.18 DEMAND CONDITIONS (DC) 47 52.20 Demographics 47 50.95 Income Distribution & Spending Pattern 40 53.44 CONTEXT FOR FIRM STRATEGY & RIVALRY (CFS&R) 47 49.94 Competition Intensity & Diversity of Firms 44 51.39 Business Incentives 48 48.97 RELATED & SUPORTING INDUSTRY (R&SI) 44 52.33 Supplier Sophistication (SS) 50 37.58 Institutional Support (IS) 33 56.02
51.88 52.44
48.22
52.20
44.81
62.12
51.50
54.18 52.20 50.95
53.44
49.94
51.39
48.97
52.33 37.58
56.02
0.00
20.00
40.00
60.00
80.00
100.00 MC
FC
Financial
Physical
Communicaaon
Administraave
Human Capacity
Innovaaon DC Demographics
Income Distribuaon
CFS&R
CI & Diversity
Business Incenaves
R&SI
SS
IS

100
5.0 THRIVING INDIAN CITIES: FACE OF THE COUNTRY
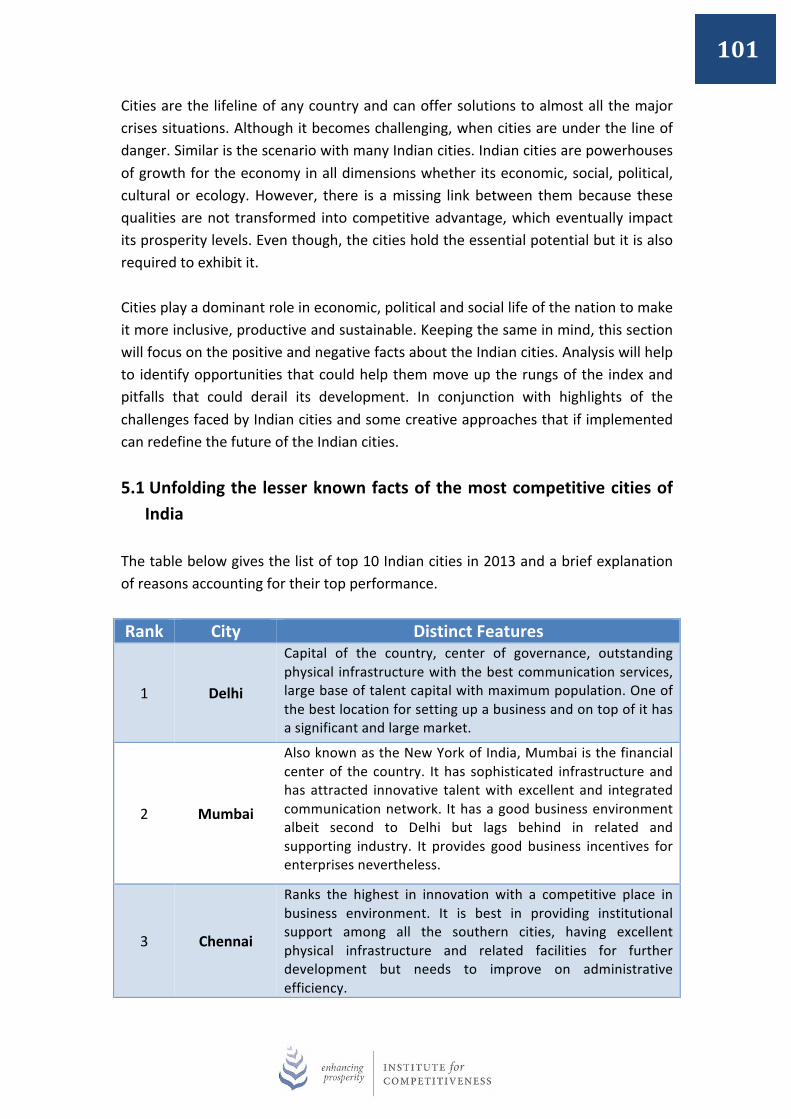
101
Cities are the lifeline of any country and can offer solutions to almost all the major crises situations. Although it becomes challenging, when cities are under the line of danger. Similar is the scenario with many Indian cities. Indian cities are powerhouses of growth for the economy in all dimensions whether its economic, social, political, cultural or ecology. However, there is a missing link between them because these qualities are not transformed into competitive advantage, which eventually impact its prosperity levels. Even though, the cities hold the essential potential but it is also required to exhibit it. Cities play a dominant role in economic, political and social life of the nation to make it more inclusive, productive and sustainable. Keeping the same in mind, this section will focus on the positive and negative facts about the Indian cities. Analysis will help to identify opportunities that could help them move up the rungs of the index and pitfalls that could derail its development. In conjunction with highlights of the challenges faced by Indian cities and some creative approaches that if implemented can redefine the future of the Indian cities. 5.1 Unfolding the lesser known facts of the most competitive cities of
India The table below gives the list of top 10 Indian cities in 2013 and a brief explanation of reasons accounting for their top performance.
Rank City Distinct Features
1 Delhi
Capital of the country, center of governance, outstanding physical infrastructure with the best communication services, large base of talent capital with maximum population. One of the best location for setting up a business and on top of it has a significant and large market.
2 Mumbai
Also known as the New York of India, Mumbai is the financial center of the country. It has sophisticated infrastructure and has attracted innovative talent with excellent and integrated communication network. It has a good business environment albeit second to Delhi but lags behind in related and supporting industry. It provides good business incentives for enterprises nevertheless.
3 Chennai
Ranks the highest in innovation with a competitive place in business environment. It is best in providing institutional support among all the southern cities, having excellent physical infrastructure and related facilities for further development but needs to improve on administrative efficiency.
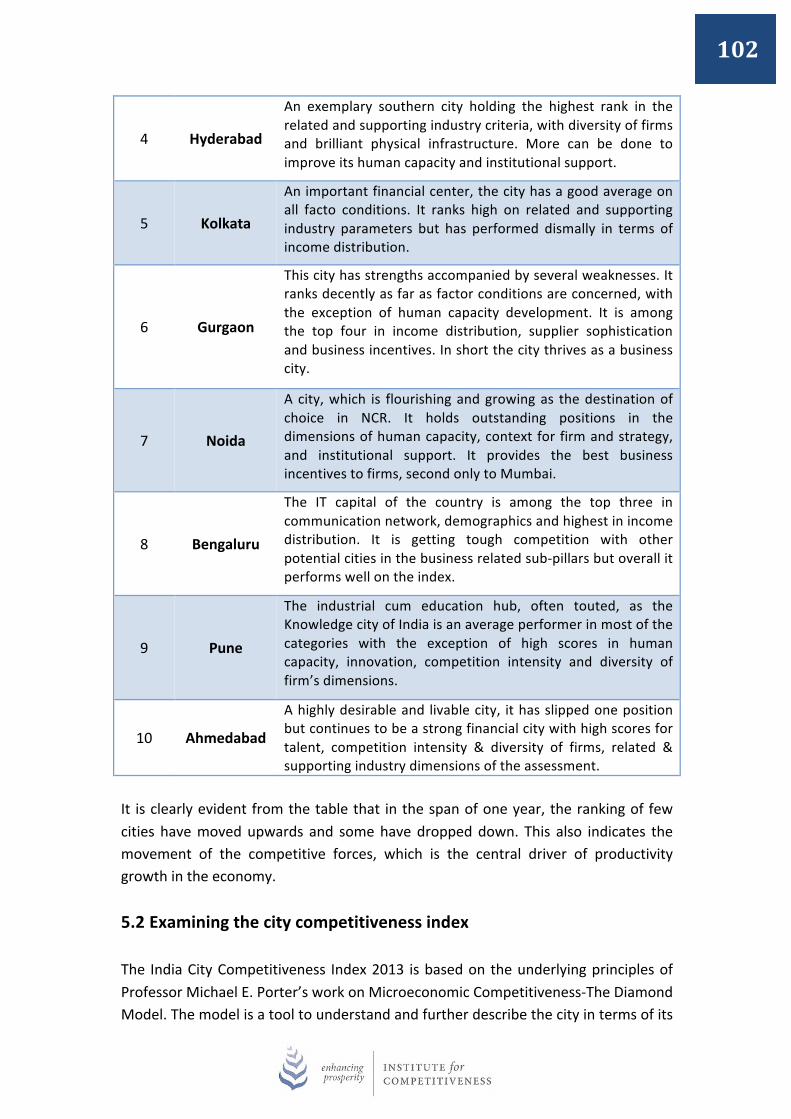
102
4 Hyderabad
An exemplary southern city holding the highest rank in the related and supporting industry criteria, with diversity of firms and brilliant physical infrastructure. More can be done to improve its human capacity and institutional support.
5 Kolkata
An important financial center, the city has a good average on all facto conditions. It ranks high on related and supporting industry parameters but has performed dismally in terms of income distribution.
6 Gurgaon
This city has strengths accompanied by several weaknesses. It ranks decently as far as factor conditions are concerned, with the exception of human capacity development. It is among the top four in income distribution, supplier sophistication and business incentives. In short the city thrives as a business city.
7 Noida
A city, which is flourishing and growing as the destination of choice in NCR. It holds outstanding positions in the dimensions of human capacity, context for firm and strategy, and institutional support. It provides the best business incentives to firms, second only to Mumbai.
8 Bengaluru
The IT capital of the country is among the top three in communication network, demographics and highest in income distribution. It is getting tough competition with other potential cities in the business related sub-‐pillars but overall it performs well on the index.
9 Pune
The industrial cum education hub, often touted, as the Knowledge city of India is an average performer in most of the categories with the exception of high scores in human capacity, innovation, competition intensity and diversity of firm’s dimensions.
10 Ahmedabad
A highly desirable and livable city, it has slipped one position but continues to be a strong financial city with high scores for talent, competition intensity & diversity of firms, related & supporting industry dimensions of the assessment.
It is clearly evident from the table that in the span of one year, the ranking of few cities have moved upwards and some have dropped down. This also indicates the movement of the competitive forces, which is the central driver of productivity growth in the economy. 5.2 Examining the city competitiveness index The India City Competitiveness Index 2013 is based on the underlying principles of Professor Michael E. Porter’s work on Microeconomic Competitiveness-‐The Diamond Model. The model is a tool to understand and further describe the city in terms of its

103
competitiveness level by categorically evaluating the city on individual dimension. The city scores on the 2013 index brings the actual scenario of 50 cities with respect to one another. It thus in turn helps to re-‐examine and plan the strategies for overall development. Indian history articulates that cities have grown immensely over time. On one, hand major and known cities have expanded beyond their horizons. On another, rapid urbanization and population explosion has resulted into a new set of vibrant cities, which are now playing a crucial role in the development of the economy. Now, looking at the city competitiveness index 2013 it is clearly evident that some cities have done better than others because of their socioeconomic history, better governance practices, improved infrastructure and strategic location. In short, they always had and will have a competitive advantage over their neighboring cities. If we take NOIDA as a case in point, then undoubtedly NOIDA is way ahead in comparison to Lucknow, apparently, which is the capital of the same State (U.P.). The obvious reason is its proximity to the National Capital, planned and well implemented infrastructure etc. Thus though it is a new and a developing city but being a well-‐managed city with a unique ‘x-‐factor’ it is above Lucknow on the city index. In other words, it is not always necessary that State’s capital are at an upper hand in comparison to the other cities of the State. In addition, the old trend continues in the 2013 index that, almost all the metro cities (Gurgaon, Noida, Pune) performed better on composite as well as individual parameters. These cities indeed appear stable. They are the preferred locations for investments, offer better quality of life and are thus attracting skilled labour from all walks of life. In other words, they truly offer a wide pool of opportunities. The cities, which are in the top 15 ranks on the index, represent clear leadership in the financial, physical, communication, business incentives, demographics and institutional support dimensions. Likewise, cities that hold a low competitiveness score show negligence by government and its people. These cities require immediate attention as they have the potential but lack correct strategies. In the index, each pillar is linked with other and their composite strength accounts for strong scores. Apart from few, no major changes are recorded in the rankings of the cities. The shift illustrates that the level of competitiveness is relatively less or more than the previous year. The reason can be the lack of clear vision for the future and a strategy in place. As a result, cities are not able to utilize and thrive on their distinct characteristics. To exemplify, Indian cities are always made to replicate a model of an international city. Efforts are being made but in the wrong direction due to which they start losing their inbuilt uniqueness. Therefore, strategies to rebuild the Indian cities should be based on their inherent strengths and weaknesses so that
104
they have their own unique value proposition. They could also further become role models for international cities. Thus, cities should be aligned with their own competitive edge so that it is suitable for the city’s growth and hence the economy. 5.3 Potential of small cities classified as ‘Y’ & ‘Z’ It is observed that some metro cities have or are about to reach their saturation point. Therefore, the investors and citizens are exploring new options in cities classifies as ‘Y’ & ‘Z’ by the Sixth Central Pay Commission. These cities have myriad benefits including, good properties (commercial and residential) at affordable prices, special initiatives taken by the regional government, creation of SEZs etc. which is transforming them into future business centers and attractive locations to reside. Many of these cities today have gathered new visibility and are already competing with the cities ‘X’ of the country. Cities like Bhopal, Kochi, etc. which falls under the city ‘Y’ and ‘Z’ have set new plans in place to redefine their ancient legacies. They are all set to explore new possibilities. Many such cities have benefitted under the Government’s initiative of Jawaharlal Nehru National Urban Renewal Mission (JNNURM). A scheme which was started in 2005 with the agenda of modernizing the city and look for future growth opportunities. More and more companies and real estate firms are choosing these cities to set up their business and provide affordable housing options to the people respectively. So it is being predicted that a skilled workforce, which today has to migrate to another city, will then start getting absorbed in these cities itself. As a result, income will start flowing in, quality of living will be influenced, and the city will start developing towards a positive and welcoming change. Many local and international firms have established their base in these places, which are in their nascent stages of development. For instance, Meerut is considered to be a “golden egg” owing to its proximity to the National Capital and having been a strong center of trade and development. Educational institutions have blossomed in the city, nurturing talent and training manpower for industries. In short, since there are many cities ‘Y’ and ‘Z’ in India, so the future prospect seems to be promising. Today these cities are not essentially adding to the economy of the country, but in the near future they can be if continuous development takes place under the guidance of the local government. Under a study conducted by Cushman & Wakefield (a global real estate solution providers) on the growth these cities-‐ Ahmedabad, Bhubaneswar, Chandigarh, Coimbatore and Jaipur came out to be the top 5 emerging cities of India. The
105
reasons are immense opportunities for business centers, new markets to explore and availability of the talent pool at a lower cost. As cities ‘Y’ and ‘Z’ have lower entry barriers, greater access to land and opportunities as compared to city ‘X’, so they are always on the foci of foreign investors. In addition, these smaller and “middleweight” cities are nimble and have the capacity to avoid pitfalls experienced by megacities. Thus, the national growth of the Indian economy is equally dependent on the development of these small cities as much as it is on the first tier cities. 5.4 Poverty in urban India It is contemplated that India is urbanizing rapidly, but only 30% of India’s population can be referred to as ‘Urban’. This urbanization has influenced many cities on the Indian landscape in a negative as well as positive manner. The consequences are quiet evident an increase of 91 million people in urban areas was noted from 2001 to 2011, which interestingly is even greater than the overall population of Germany in 2011. According to experts, it is a result of migration, natural increase and inclusion of new areas, which are now defined as urban and so on.
People usually move to urban areas to have better opportunities in terms of employment, living conditions etc. However, this is followed by newer and tougher challenges and increase in the cost of living. The poor section of the society is adversely affected by this phenomenon which makes them live in miserable condition where they are forced to survive in slums where sanitation, water, health and education facilities are almost absent. These urban poor mostly dwell in unrecognized squatter-‐settlements, pavements, construction sites and urban fringes
Box 5: A different side of Kolkata -‐ Slums and misery In Kolkata, almost one third of the population resides in the slum areas. Similar to other slum areas, people find it difficult to live with handful money and unhygienic conditions. The inappropriate infrastructure of the city and the migration of people from nearby area have added numerous slums and illegal settlements. A large section of this population remains homeless, living on pavements and temporary shelters along drains and under bridges. It is estimated that about 20% of the population of Howrah live in slums and various unauthorized settlements. These slums and settlements while scattered throughout are highly concentrated along the western and northern parts of the city. These people don’t have an identity proofs like aadhar or voter’s card and thus find it difficult to take advantage of the government schemes.
Source: Development of Slum -‐ Asha Bhavan Centre

106
and part of the floating population. Thus, a large percentage of slums in India are illegal and go unlisted in official records. Urban poverty in India is at a dire condition. Apart from the slums of Mumbai, places like Bihar, Madhya Pradesh, Orissa and Uttar Pradesh are also known for their widespread urban poverty. Indian Government via its urban poverty alleviation programmes like Swarna Jayanti Shahari Raozgar Yojana (SJSRY), Jawaharlal Nehru National Urban Renewal Mission (JNNURM), Integrated Housing and Slum Development Programme, The Rajiv Awas Yojana (RAY) et al took few initial steps. The central objective of all these programs was to ensure that the urban poor have access to basic services, but they target different set of challenges altogether. These programs have marginally helped to deal with the unpleasant situation of urban poor. Therefore, it is now required that Indian Government took corrective measures to ensure that urban planning includes the poor people and their needs so as to uplift the urban poor. 5.5 Doing Business in India Being a developing country, India is counted as a favorable place for corporates in terms of business opportunities, skilled human power and pool of other resources. Foreign investors look at India as an attractive destination, which is quite evident with the entry of Starbucks, IKEA etc. entering the Indian landscape. The Industrial Policy of India also offers tremendous opportunities and freedom to the corporates houses and entrepreneurs to ease their process of decision-‐making w.r.t. investments. Today, India is home to many big business houses, ranging from IT-‐to-‐Automobiles-‐to-‐FMCG-‐to-‐Fast food destinations-‐to-‐Apparels etc. It is speculated that India’s demand conditions will make it even more attractive in the near future as it will enjoy a sustained demographic dividend. Therefore, Indian Government continues to put in efforts to make its cities safe, friendly and resourceful investment destination so as to attract more and more venture capitalists to explore the region. The success mantra for doing business in India will thus be to understand the diversity of the Indian market and act accordingly because one-‐formula cannot fit for all in India. Secondly, to chose the right location in terms of infrastructure, required skill-‐set and customers. In this competitive environment, it is also essential that the companies engage themselves in constant innovation by doing investment in R&D. Lastly, new entrants need to have patience and keep coming with new ideas and products coupled with new strategies.
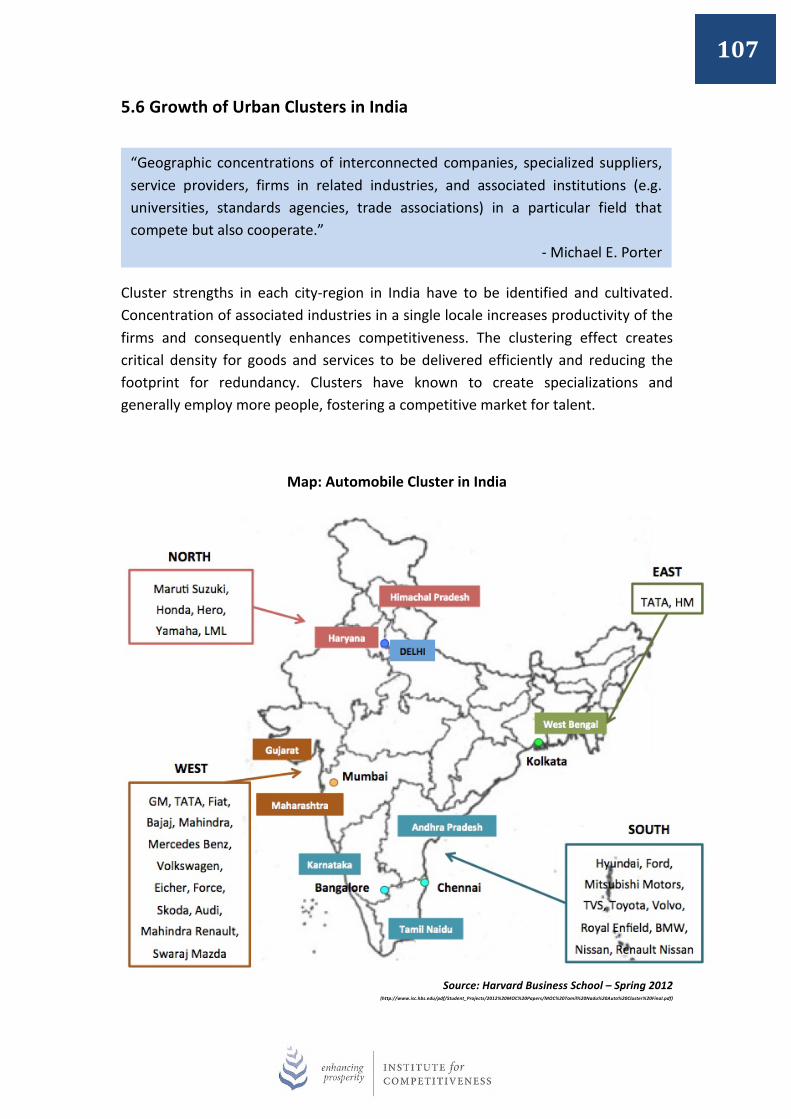
107
5.6 Growth of Urban Clusters in India
Cluster strengths in each city-‐region in India have to be identified and cultivated. Concentration of associated industries in a single locale increases productivity of the firms and consequently enhances competitiveness. The clustering effect creates critical density for goods and services to be delivered efficiently and reducing the footprint for redundancy. Clusters have known to create specializations and generally employ more people, fostering a competitive market for talent.
Map: Automobile Cluster in India
Source: Harvard Business School – Spring 2012
(http://www.isc.hbs.edu/pdf/Student_Projects/2012%20MOC%20Papers/MOC%20Tamil%20Nadu%20Auto%20Cluster%20Final.pdf)
“Geographic concentrations of interconnected companies, specialized suppliers, service providers, firms in related industries, and associated institutions (e.g. universities, standards agencies, trade associations) in a particular field that compete but also cooperate.”
-‐ Michael E. Porter
108
In the words of Asia Development Bank, cluster based city economic development connects knowledge with practice, provides strategic entry points of public-‐private partnership, and can be a good decision-‐making tool for policy makers (or private sector investors) to have better-‐informed decisions on investments. 5.7 Urban Mobility System The transportation system of most of the Indian cities is in a depilated state. A traffic jam-‐packed road is a common phenomenon, which is getting even worse with an increase in the number of road accidents, poor connectivity and unsustainable mode of transportation. Today, Indian cities are getting transformed into “automobile dependent” cities, and this is leading to a newer set of problems. According to records, population has increased in six major metropolises by 1.9 times from 1981-‐201, and in the same time span, motor vehicles have increased by 7.75 times. There exists a huge gap between travel demand and supply of the transportation services. Indian cities face tremendous challenges to take the route of sustainable mobility w.r.t. policy framework, awareness, capacity building, fuel crisis etc. It can be because of the urban mobility system is still not an integrated part of the city’s vision and lacks a unified approach. Therefore it is required that the government takes immediate action in this regard.
Cities should improve their mobility networks, especially for vehicles in order to create more vibrant, livable and sustainable cities. This will not only lead to a high quality and accessibility of life to the citizens but will also aid in economic
Box 6: Ecocabs: Dial-‐A-‐Rickshaw Scheme Earlier only cab and taxi service were readily available on phone call but now the model has been a bit twisted and even a cycle rickshaw services is just a phone away. Such a model has been implemented in a town, Fazilka which is located in Punjab (India). It is not just an innovative concept but also the first of its kind in the country as well as the world. The scheme has helped to put in place the unorganized cycle rickshaw transport system in the region. In addition, it has provided an affordable means of mobility to the city residents in conjunction with giving employment to the weaker section of the society. All these positives have made the scheme a success and now it is being applauded, nationally as well as internationally.
Source: Improving Informal Transport: Case studies from Asia, Africa and Latin Africa
109
development and greener environment. Implementation of a systematic approach will help the country in promotion of sustainable urban mobility which can then focus on the issues like public transport service, parking, provision of alternative modes to motorized transport, higher taxation on private cars etc. directly.
5.8 Smart and Sustainable Cities Cities are a place for a majority of the world's population. They are magical places to live in, but they can also be frightening places if they crumble to the increasing population. People living in cities appreciate open spaces, green parks and clean air. Cities should be build in a way so that they are able to sustain themselves for the future. They not only have to be attractive places to live in, but also, affordable to the citizens. Because of the increase of urbanization which is closely related to the high population density, the dependence on energy to perform various day-‐to-‐day activities has also increased. Therefore, cities are now being built on the principles of New Urbanism. Smart and sustainable city have an urban center which is clean, green, safe, resourceful and connected with all the necessary amenities like power, water, transportation, via integrated technology networks. There is a perfect blend of technology solutions and sustainable practices to enhance and ease the life of its residents and streamline all the communication and other activities. This will also assure environmental sustainability and social inclusiveness. Though it requires implementation of a wide range of policies, practices and collaboration between the citizens and the government. There are proposals to build seven new smart cities in India. These cities will come up in between Delhi and Mumbai as a part of the Delhi-‐Mumbai Industrial Corridor,
Box 7: Delhi Metro: The lifeline of the city and nearby area Delhi metro completed its successful 10 years last year and is one of the best initiatives in the area of sustainable urban transportation in the country. Delhi Metro was planned as an integral component of a larger multi-‐modal transport system for the city and was launched in different phases. Today is serves more than 1.5 million passengers per day and is a widely used mass mobility option for Delhi’s citizens. The current network length is nearly 156 km which in near future will be stretched to 415 km. Initiatives such as an automatic fare collection system/smart card technology and the development of a feeder bus network have helped to maintain an operable network that would satisfy the public and promote ridership.
Source: Global Report on Human Settlements 2013

110
(DMIC) and each city is going to be a home to nearly two million people. Japan is investing about $ 100 billion on this project. Cities will have well-‐managed and related subsystems of recycling units, airports, power generation units, water management ventures etc. These cities are considered to be world-‐class manufacturing hubs with the best of technology integration.

111
6.0 WAYS TO ENHANCE THE CITY COMPETITIVENESS
112
After independence, there is clear evidence of the demographic changes and rapid shift towards urbanization. The increase in the level of urbanization within the country has transformed these urban centers into crucial economic hubs. These are the real engines of the country that are driving the country in the right direction. To exemplify, Mumbai and its surrounding regions contribute over 35% of the state’s GDP. In other words, cities are irreversibly taking the center stage and might eventually surpass the GDP of their countries. However, these growing hubs are not much paid due attention and are in a miserable state, apart from a few. There are many reasons for the same but the most visible is, negligence of the designated authorities. As more and more cities are getting developed and growing, it becomes important that the administrative structure is in place and working efficiently. Cities are the epicenter and no longer the epiphenomenon of the country. They are going through a phase of serious hardship in the areas of social, demographic, economic, environmental and governance domains. So if the cities have to become competitive, then all the issues have to be fixed. They also have to establish themselves as a sustainable city in all major areas. The only solution that comes up is the mutual effort of citizen, civil bodies and government authorities to build a road map of good governance. 6.1 The role of governance & inclusive issues The governance structure in India is very complex and is always debatable. As a result, there are a lot of discussions on the concepts of governance of either national, state or central government. Focus is laid on the processes and institutions so that the citizens can actively communicate and contribute to make a better society. Unfortunately, enough attention is not given to urban governance in the country because of which there is unstructured planning and wide communication gap between the government bodies and between government and society.
Urban Governance It is defined as “The sum of the many ways individuals and institutions, public and private, plan and manage the common affairs of the city. It is a continuing process through which conflicting and diverse interest may be accommodated and cooperative action can be taken. It includes formal institutions as well as informal arrangements and social capital of the citizens”.
Source: JnNURM, Regional Capacity Building Hub, Module1
113
There is an urgent need of good urban governance in the country. Today urban India requires huge investments and reforms. It is only possible by having the Urban Local Bodies (ULBs) in place because they are the primary level of governance for urban areas. Though according to the 74th amendment, power and responsibilities were transformed from states to the local and metropolitan bodies, but they are still in a dismal state. In addition, the relative roles of the country’s metropolitan and municipal corporation should be clearly defined to successfully manage the large urban areas. Urban governance is critical for growth and development. It is required, not only to improve the quality of life of the citizens but also to ensure that the urban areas become the face of the country. Urban policies and urban initiatives are required to increase the national rate of economic growth and also to move the nation upwards on the competitiveness ladder. Today, urban areas need to have a broader vision and an effectual institutional support. This would help in better coordination, resolving conflict and sharing the responsibilities between the jurisdictions and the agencies. This is due to the increase in the number of urban areas in the country which would turn cumbrous if steps are not taken immediately. Therefore, Indian cities need not only a sound governance structure but also one that works well. 6.2 Key areas of focus for future Indian Cities Cities in order to become competitive need to manage the provision of quality services to their residents by offering them essential urban public services. They also have to simultaneously respond to the changing dynamics of businesses in sync with their pace of requirements. Thus to do so, growing cities should focus on following areas: Public-‐private partnerships: Nowadays, it is essential that city governance create an enabling environment for private sector to design, finance and operate urban infrastructures and services. It acts as a viable option in developing the infrastructure projects in a region and deliver quality output despite economic challenges. To support and encourage the foreign and private players, Indian government offers incentives and other allowances to them. In addition, special schemes and reliefs are made available in the form of special economic zones, high-‐tech zones and other important business centers. PPP solves the dual purpose. The private sector takes responsibility for functions such as operation and management whereas government tracks the flow of funds
114
and comes up with ways to serve the common man. The mutual efforts of the two parties increase the ease of doing business and introduce new ideas. It is seen that public-‐private partnerships (PPPs) have been successful in the past in almost all the sectors, whether transport, energy, urban infrastructure, real estate etc. The reasons can be that firstly urban local government does not have to invest upfront and secondly, contracting out services result in greater efficiency and better service delivery. Hence there is an increase in the dependency on public-‐private partnerships, which is also, is evident from the growing number of projects that are being taken up every year.
Dealing with urbanization: The urban areas of the country are not a result of ‘pull’ factor but of ‘push’. It is a result of the exploding population, a bit of a development and the movement of people in search of better opportunities to urban areas. Instead of leading the regions towards prosperity, this trend is setting across a new set of challenges with unworkable solutions. Therefore, it is necessary to understand the challenges that a city faces and simultaneously strategize the developmental plans for the city. Cities need to be aware about its do's and don’ts. In this crucial phase, cities must put a stable physical infrastructure, good and operational basic amenities, better employment opportunities, transportation connectivity, superior business environment and policies to deal with social conflict. In other words, cities have to manage both their internal as well as external environments so as to ensure a positive symbiosis. Urban poverty: One of the major and visible consequences of urbanization and its associated components like urban poverty has been the multiplication of urban slums. Because of the expansion of the cities the slum population has also increased at a fast rate. People who fall in the category of urban poor are domestic helps, rickshaw pullers, daily wagers, hawkers etc. were always a part of the city and are
BOX 8: PPPs in India’s Infrastructure Development -‐ Airport project Delhi International Airport Ltd (DIAL) was made in partnership between GMR Group, Airport Authority of India (AAI) and Fraport & Eraman Malaysia. The project, which started its operations in 2006, had successfully completed the construction of integrated passenger terminal (Terminal 3). The first phase of the airport has a capacity to handle 60 million passengers per annum and shall be able to hold a capacity of 100 million passengers per annum in future. It is the first airport in the country to be awarded the Leadership Energy and Environment Design (LEED) ‘Gold’ rating. It can be accessed by a 6-‐lane approach road and also by a dedicated high speed Metro line that can be easily accessed from the city center. The new terminal is a gem in the crown in all respect and with its success story, it definitely is best way to develop in the civil aviation sector.
Source: GMR Group website
115
going to be. Therefore, it is required that cities provide low cost housing, create micro-‐finance opportunities, ensure access to low cost health care and allow social mobility to them. As per records, these people make a major contribution to the economy and cannot be ignored. Also, the mass in-‐migration of these people should be managed by exploring the concept of rurbanisation (rural-‐urban development). Cities need to plan beyond their sketched boundaries and include the rural economy into the chain of urban development. Otherwise, the increase of slum population and hence the informal settlements will result into enormous strains on urban infrastructure. Transparency & civic engagement: It is indeed very vital to engage the major stakeholders in all the work done pertaining to the development of city-‐regions. It strengthens public decisions and contributes towards an inclusive city. It also creates positive synergy between government and civil society thus promoting transparency, accountability, equity and leads to a strong city functioning. In other words, nothing can build consensus and a deepening of true democracy better in a city than civic engagement. Other overlooked areas: To attain a good economic growth of the country, it is necessary that all sections of the society are developed and taken care. Therefore, amenities such as proper transportation facilities, medical services, administrative processes and issues of cleanliness should be tackled to create a competitive environment. 6.3 Critical success factors for city competitiveness The vital elements that should be adopted by the Indian cities to stay competitive are: Shared Vision: Vision is an important element for a city to become successful and competitive. It should be understood and supported by most of the citizens so that the vision becomes a collective desire and a shared value system for the future. It thus acts as a change agent and accelerates social learning within the community. A vision shapes the identity of the city by branding its historical, cultural, social, economic and physical strengths. Social and Environmental Entrepreneurship: Even in the past, entrepreneurship has acted as an effective vehicle to resolve many complicated social problems. It has helped to create an environment where creative and innovative individuals and organizations gather, grow and prosper together with their society to bring successful cities of the future. It is rightly said "If Indian entrepreneurs are able to
116
build a strong base of social and environmental entrepreneurship then Indian cities would certainly supersede other world class cities over time". Specialization: Though many cities have their commonalities, but it is not a good approach in the long term. It is necessary that all municipal corporations create a unique value proposition because every city has its own set of advantages and disadvantages.. Therefore, “particularity” should be identified so that cities are able to leverage on their specialized assets (people and infrastructure) to gain a competitive advantage. Social Inclusion and Cohesion: Indian cities have a history of social fractures arising from class segmentation and due to the heterogeneity of the existent people. On top of that, variation of income levels and in-‐migration of people across these cities due to the combined impact of globalization and urbanization has excavated the social landscape of the Indian cities. In addition, the influx of foreign talent and the return of the diaspora had placed new pressures on the governance structure and standards of living. Therefore, creative city planning is required in the Indian cities so as to shape them for a multi-‐cultural and inclusive future. Integrated and Innovative Governance: In developing cities, the complexity of governance and its structure in union with the lack of leadership activities especially in Indian cities is a major cause of concern. Now and in coming years, ability of city leadership in coordinating and facilitating integration of cross-‐institutional services are predicted as the key of success for future cities. In addition, the pace of integrating innovation to address some of the key issues of/in the cities will certainly give them the competitive advantage. Local governing bodies need to include experts, environmentalists and respectable leaders in the society to city level audits etc. so that the outcomes are not biased. The results can then be made transparent to the public and on a performance basis; these governing bodies can be awarded. In addition, cities could be better advised by city-‐wise institutions to ensure better accountability. Indian being a democratic country has a huge scope to use governance as a tool for self-‐correction and build cities of the future. 6.4 A note on urban agglomerations, cities and regions ‘Urban agglomeration’ as a concept was introduced to represent the integrated urban areas and assess the patterns of urbanization towards contiguous areas of cities and towns. Since then it has become an inseparable part of every city, irrespective big or small. It is believed that it addresses not only the challenges faced but also ensures the delivery of service and protection of the environment in the Indian cities. In other words, urbanization to a large extent implies development.
117
Presently, over 285 million Indians are living in urban areas out of which 22 million are middle class urban households distributed over 193 cities. The growth rate of urban population in India, which is at present 31.8% according to the 2011 Census, is expected to increase by 40% by 2030. This super fast urbanization pattern require careful urban planning at the same rate.
Now, there are approximately 35 Indian cities with a population of nearly million and above. Although the exploding population is a cause of concern, but on another hand it is also acting as beneficial and potential market. These cities are the country’s new bet because the metropolises like Delhi and Mumbai have almost reached their saturation point. These cities are the preferable location for people to live in and corporates to invest in. According to records, India’s urban GDP accounts for about 60% of India’s GDP. So it becomes even more critical to enhance their overall strategy so that they can gain the competitive edge by maintaining their unique proposition. 6.5 Ideas to shape Indian cities for future Cities are the epitome of a country's progress. Every citizen of its country wants its cities to be livable, competitive and sustainable, but this cannot happen without the support of the government. In case of a failure, only the government is blamed and scrutinized. All the stakeholders step back when it comes to taking responsibility which is simply unacceptable. Initiatives taken for the development of Indian cities have to be driven by a unified vision that includes wise support of all the stakeholders, transparency in the system, accountability of the activities and multi-‐disciplinary engagement. Every Indian city is like a linear equation with its own set of positives and negatives so the multiplication of resources or its division into provinces should be done cautiously. It is vital to take every step constructively so as to come up with a judicious outcome. The ranking clearly defines the areas of improvement for the cities, but there is always a scope of development, which can revise their competitiveness levels. The following recommendations might help to improve the prosperity levels of the Indian cities because a small step taken now can ease their development journey in the future. Design a City Development Strategy: An integrated strategy with a clear objective and critical success factors is needed at the initial stage. It should be well knit and include areas such as livelihood, environmental sustainability, spatial form and its

118
infrastructure, financial assets, and government structure. Livelihood should include elements such as employment, household income, ease of doing business and human resource development factors. Environmental sustainability points to energy efficiency, usage of scarce resources, quality of environmental components like air, water etc. Spatial form and infrastructure concerns land-‐use and physical plans and financial assets refer to the local government budgets and consumption of financial resources. If a structured governance model is in place, then it helps to effectively administer and deploy resources for effective learning, communication and management. Participation of Private sector in city building: It is a challenging task for the local government of the city to bring in the evolutional change. Therefore, the participation of private sector is essential to provide an effective framework to drive inclusive and sustainable urbanization in India. Even the estimate conveys that the creation of new cities by the private sector can help to provide proper infrastructure to nearly 600 million people over the 4 decade. Exploration of new dimensions: The competitiveness index is a useful guide for city mayors, people from public/private sector and civil society to take affirmative action. The assessment from the index can provide interesting insights about the city. It can help the corporates to invest, and government authorities to take strategic decisions. It can also serve as a practical tool for international foundations like, the Bill and Melinda Gates Foundation, Carnegie Foundation, Asia Foundation et al who are interested in investing in developing countries like India. Increasing Transparency and involvement of citizens: Participation of citizens in each city leads to a well-‐informed and transparent community. They can then provide proposals to the authorities in the form of concepts and ideas etc. Policymakers can eventually address them so as to come up with a city where people want to work, live and travel. Implementation of fresh and innovative ideas: Indian cities have the capacity to develop practical and good solutions according to their environment. So they should not follow western cities blindly and develop their own solutions. At most, they can facilitate sharing and deploy solutions that are successful in other cities and modify them in their city innovation centers. It will then lead to a city, which will act as a model for future cities of the world.

119
7.0 CONTRIBUTIONS
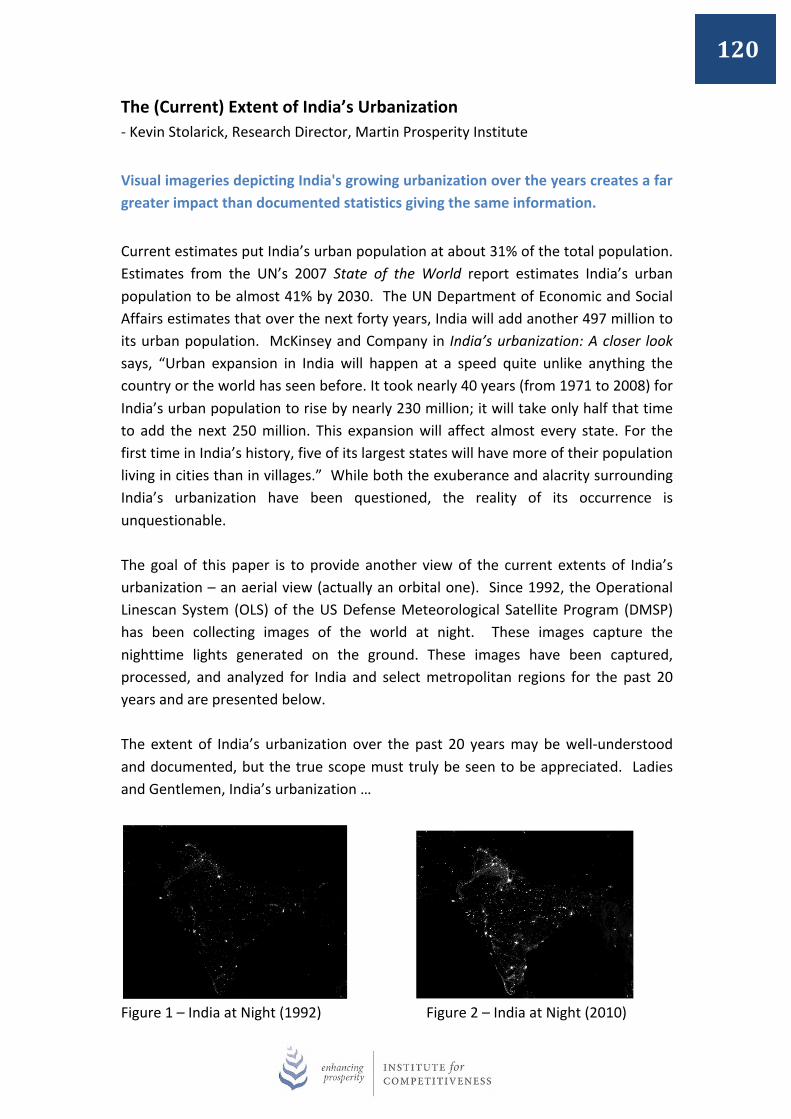
120
The (Current) Extent of India’s Urbanization -‐ Kevin Stolarick, Research Director, Martin Prosperity Institute Visual imageries depicting India's growing urbanization over the years creates a far greater impact than documented statistics giving the same information. Current estimates put India’s urban population at about 31% of the total population. Estimates from the UN’s 2007 State of the World report estimates India’s urban population to be almost 41% by 2030. The UN Department of Economic and Social Affairs estimates that over the next forty years, India will add another 497 million to its urban population. McKinsey and Company in India’s urbanization: A closer look says, “Urban expansion in India will happen at a speed quite unlike anything the country or the world has seen before. It took nearly 40 years (from 1971 to 2008) for India’s urban population to rise by nearly 230 million; it will take only half that time to add the next 250 million. This expansion will affect almost every state. For the first time in India’s history, five of its largest states will have more of their population living in cities than in villages.” While both the exuberance and alacrity surrounding India’s urbanization have been questioned, the reality of its occurrence is unquestionable. The goal of this paper is to provide another view of the current extents of India’s urbanization – an aerial view (actually an orbital one). Since 1992, the Operational Linescan System (OLS) of the US Defense Meteorological Satellite Program (DMSP) has been collecting images of the world at night. These images capture the nighttime lights generated on the ground. These images have been captured, processed, and analyzed for India and select metropolitan regions for the past 20 years and are presented below. The extent of India’s urbanization over the past 20 years may be well-‐understood and documented, but the true scope must truly be seen to be appreciated. Ladies and Gentlemen, India’s urbanization …
Figure 1 – India at Night (1992) Figure 2 – India at Night (2010)

121
Figure 1 shows the nighttime lights for India and surrounding countries from 1992. Figure 2 shows exactly the same geography but 18 years later. While the bright spots of Delhi and Kolkata and the Mumbai-‐Pune combination and the Hyderabad, Bangalore, Chennai triangle are all clearly visible in 1992, they have all increased in intensity and size by 2010. And, a whole series of new constellations have been added to the subcontinent. It’s not just those few bright spots getting bigger and brighter – it’s also a whole new collection of cities and towns increasing their visibility at night which not only means increased electrification but also larger and more economically prosperous populations. Figures 3 and 4 show the nighttime lights for the Delhi region from 1992 to 2010. Figures 3a and 4a show exactly the same but with a colour spectrum used to show the intensity of the light instead of just black and white. A more detailed discussion of the growth of urbanization of Delhi will be presented below, but the transition from black and white to coloured mapping should be explained first. The instrument used to collect the nighttime light data is actually designed to collect the reflection of moon and starlight off of clouds (it is a meteorological satellite). As a result, the instrument is tuned to detect very low levels of light and is quickly saturated by the light output of most major cities on cloudless nights. The red areas in 3a and 4a which correspond to the brightest white areas of 3 and 4 are areas where saturation has occurred. However, since the instrument can detect lower levels of light, the fringes of urbanized areas are detected. These areas are difficult to see on a greyscale map since there is little difference between very dark grey and black. However, when a colour spectrum is used, those areas can be made more easily seen. The blue areas of Figures 3a and 4a are places where no nighttime light was collected, but everywhere else shows where there are fairly significant sources of light at night. As the spectrum runs from blue to cyan to green to yellow to orange to red, the amount of visible light detected by the satellite increases from total darkness to total saturation.
Figure 3 – Delhi (1992) Figure 4 – Delhi (2010)
Figure 3a – Delhi (1992) Figure 4a – Delhi (2010)
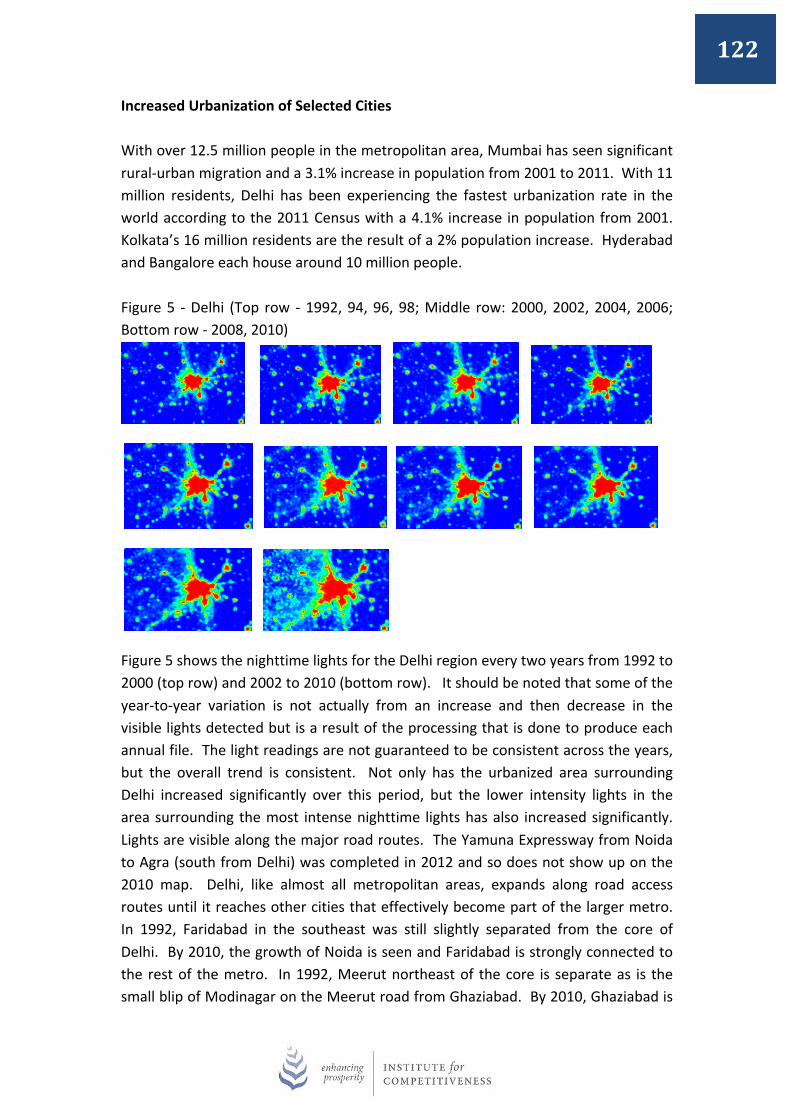
122
Increased Urbanization of Selected Cities With over 12.5 million people in the metropolitan area, Mumbai has seen significant rural-‐urban migration and a 3.1% increase in population from 2001 to 2011. With 11 million residents, Delhi has been experiencing the fastest urbanization rate in the world according to the 2011 Census with a 4.1% increase in population from 2001. Kolkata’s 16 million residents are the result of a 2% population increase. Hyderabad and Bangalore each house around 10 million people. Figure 5 -‐ Delhi (Top row -‐ 1992, 94, 96, 98; Middle row: 2000, 2002, 2004, 2006; Bottom row -‐ 2008, 2010)
Figure 5 shows the nighttime lights for the Delhi region every two years from 1992 to 2000 (top row) and 2002 to 2010 (bottom row). It should be noted that some of the year-‐to-‐year variation is not actually from an increase and then decrease in the visible lights detected but is a result of the processing that is done to produce each annual file. The light readings are not guaranteed to be consistent across the years, but the overall trend is consistent. Not only has the urbanized area surrounding Delhi increased significantly over this period, but the lower intensity lights in the area surrounding the most intense nighttime lights has also increased significantly. Lights are visible along the major road routes. The Yamuna Expressway from Noida to Agra (south from Delhi) was completed in 2012 and so does not show up on the 2010 map. Delhi, like almost all metropolitan areas, expands along road access routes until it reaches other cities that effectively become part of the larger metro. In 1992, Faridabad in the southeast was still slightly separated from the core of Delhi. By 2010, the growth of Noida is seen and Faridabad is strongly connected to the rest of the metro. In 1992, Meerut northeast of the core is separate as is the small blip of Modinagar on the Meerut road from Ghaziabad. By 2010, Ghaziabad is
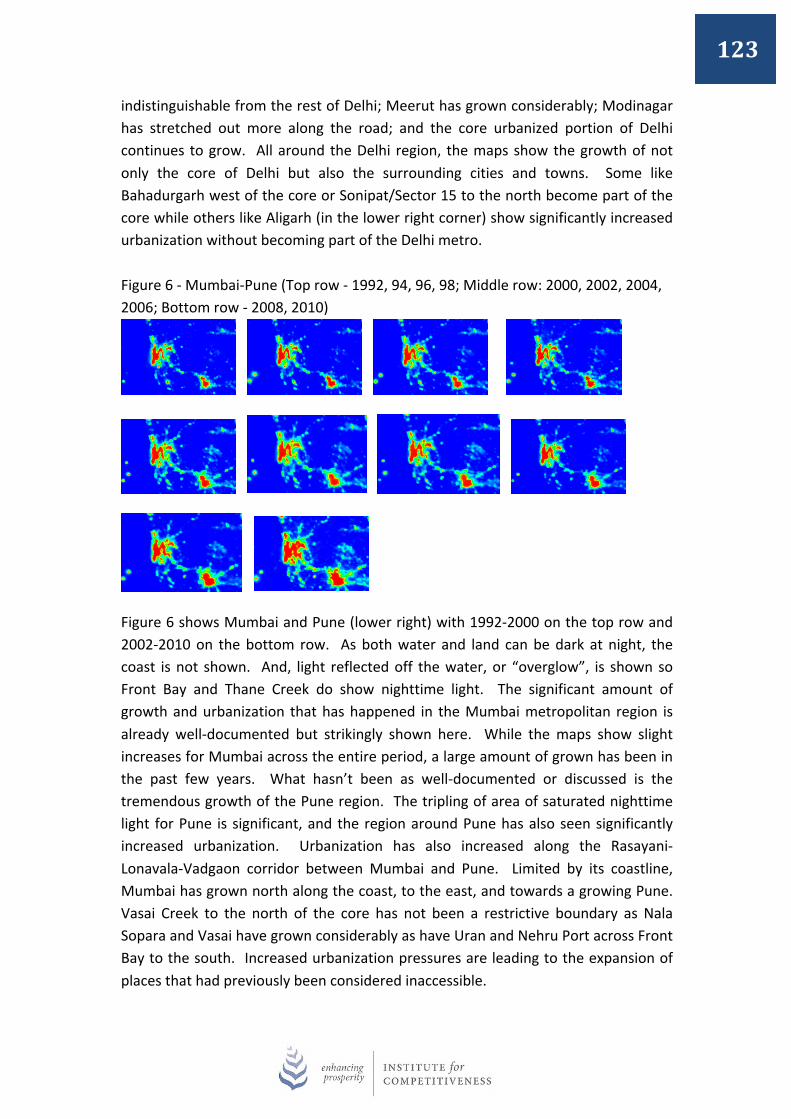
123
indistinguishable from the rest of Delhi; Meerut has grown considerably; Modinagar has stretched out more along the road; and the core urbanized portion of Delhi continues to grow. All around the Delhi region, the maps show the growth of not only the core of Delhi but also the surrounding cities and towns. Some like Bahadurgarh west of the core or Sonipat/Sector 15 to the north become part of the core while others like Aligarh (in the lower right corner) show significantly increased urbanization without becoming part of the Delhi metro. Figure 6 -‐ Mumbai-‐Pune (Top row -‐ 1992, 94, 96, 98; Middle row: 2000, 2002, 2004, 2006; Bottom row -‐ 2008, 2010)
Figure 6 shows Mumbai and Pune (lower right) with 1992-‐2000 on the top row and 2002-‐2010 on the bottom row. As both water and land can be dark at night, the coast is not shown. And, light reflected off the water, or “overglow”, is shown so Front Bay and Thane Creek do show nighttime light. The significant amount of growth and urbanization that has happened in the Mumbai metropolitan region is already well-‐documented but strikingly shown here. While the maps show slight increases for Mumbai across the entire period, a large amount of grown has been in the past few years. What hasn’t been as well-‐documented or discussed is the tremendous growth of the Pune region. The tripling of area of saturated nighttime light for Pune is significant, and the region around Pune has also seen significantly increased urbanization. Urbanization has also increased along the Rasayani-‐Lonavala-‐Vadgaon corridor between Mumbai and Pune. Limited by its coastline, Mumbai has grown north along the coast, to the east, and towards a growing Pune. Vasai Creek to the north of the core has not been a restrictive boundary as Nala Sopara and Vasai have grown considerably as have Uran and Nehru Port across Front Bay to the south. Increased urbanization pressures are leading to the expansion of places that had previously been considered inaccessible.
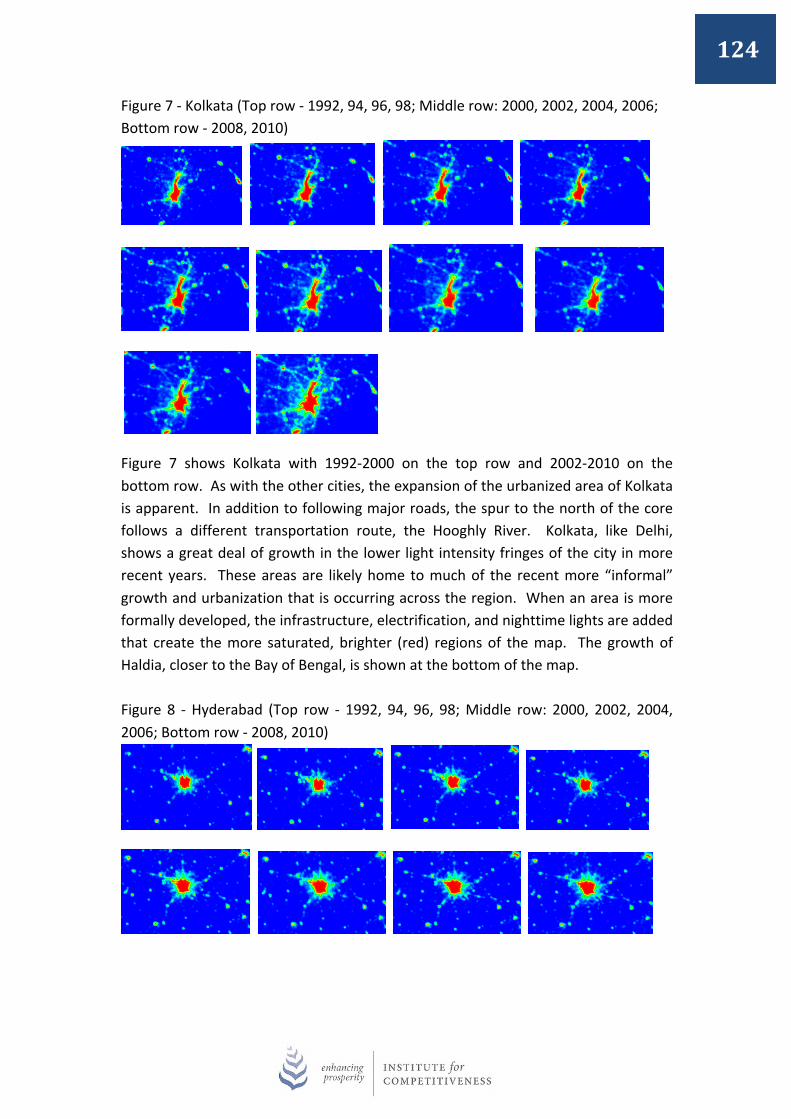
124
Figure 7 -‐ Kolkata (Top row -‐ 1992, 94, 96, 98; Middle row: 2000, 2002, 2004, 2006; Bottom row -‐ 2008, 2010)
Figure 7 shows Kolkata with 1992-‐2000 on the top row and 2002-‐2010 on the bottom row. As with the other cities, the expansion of the urbanized area of Kolkata is apparent. In addition to following major roads, the spur to the north of the core follows a different transportation route, the Hooghly River. Kolkata, like Delhi, shows a great deal of growth in the lower light intensity fringes of the city in more recent years. These areas are likely home to much of the recent more “informal” growth and urbanization that is occurring across the region. When an area is more formally developed, the infrastructure, electrification, and nighttime lights are added that create the more saturated, brighter (red) regions of the map. The growth of Haldia, closer to the Bay of Bengal, is shown at the bottom of the map. Figure 8 -‐ Hyderabad (Top row -‐ 1992, 94, 96, 98; Middle row: 2000, 2002, 2004, 2006; Bottom row -‐ 2008, 2010)
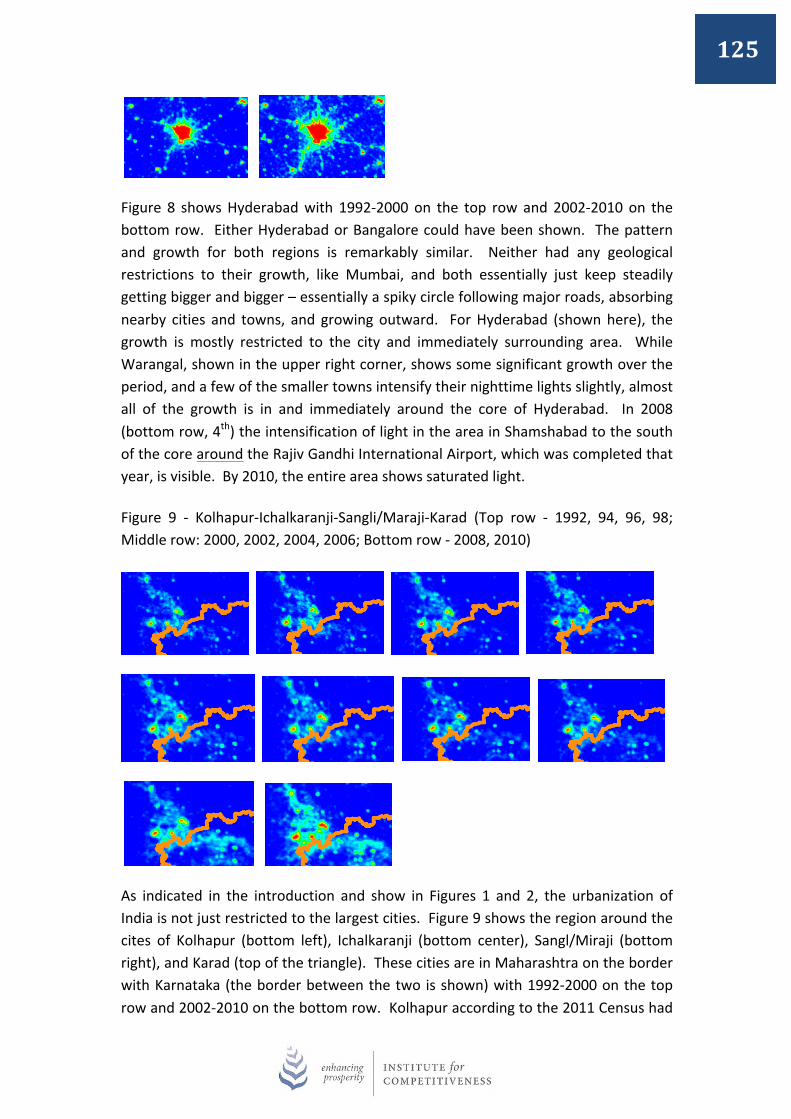
125
Figure 8 shows Hyderabad with 1992-‐2000 on the top row and 2002-‐2010 on the bottom row. Either Hyderabad or Bangalore could have been shown. The pattern and growth for both regions is remarkably similar. Neither had any geological restrictions to their growth, like Mumbai, and both essentially just keep steadily getting bigger and bigger – essentially a spiky circle following major roads, absorbing nearby cities and towns, and growing outward. For Hyderabad (shown here), the growth is mostly restricted to the city and immediately surrounding area. While Warangal, shown in the upper right corner, shows some significant growth over the period, and a few of the smaller towns intensify their nighttime lights slightly, almost all of the growth is in and immediately around the core of Hyderabad. In 2008 (bottom row, 4th) the intensification of light in the area in Shamshabad to the south of the core around the Rajiv Gandhi International Airport, which was completed that year, is visible. By 2010, the entire area shows saturated light. Figure 9 -‐ Kolhapur-‐Ichalkaranji-‐Sangli/Maraji-‐Karad (Top row -‐ 1992, 94, 96, 98; Middle row: 2000, 2002, 2004, 2006; Bottom row -‐ 2008, 2010)
As indicated in the introduction and show in Figures 1 and 2, the urbanization of India is not just restricted to the largest cities. Figure 9 shows the region around the cites of Kolhapur (bottom left), Ichalkaranji (bottom center), Sangl/Miraji (bottom right), and Karad (top of the triangle). These cities are in Maharashtra on the border with Karnataka (the border between the two is shown) with 1992-‐2000 on the top row and 2002-‐2010 on the bottom row. Kolhapur according to the 2011 Census had
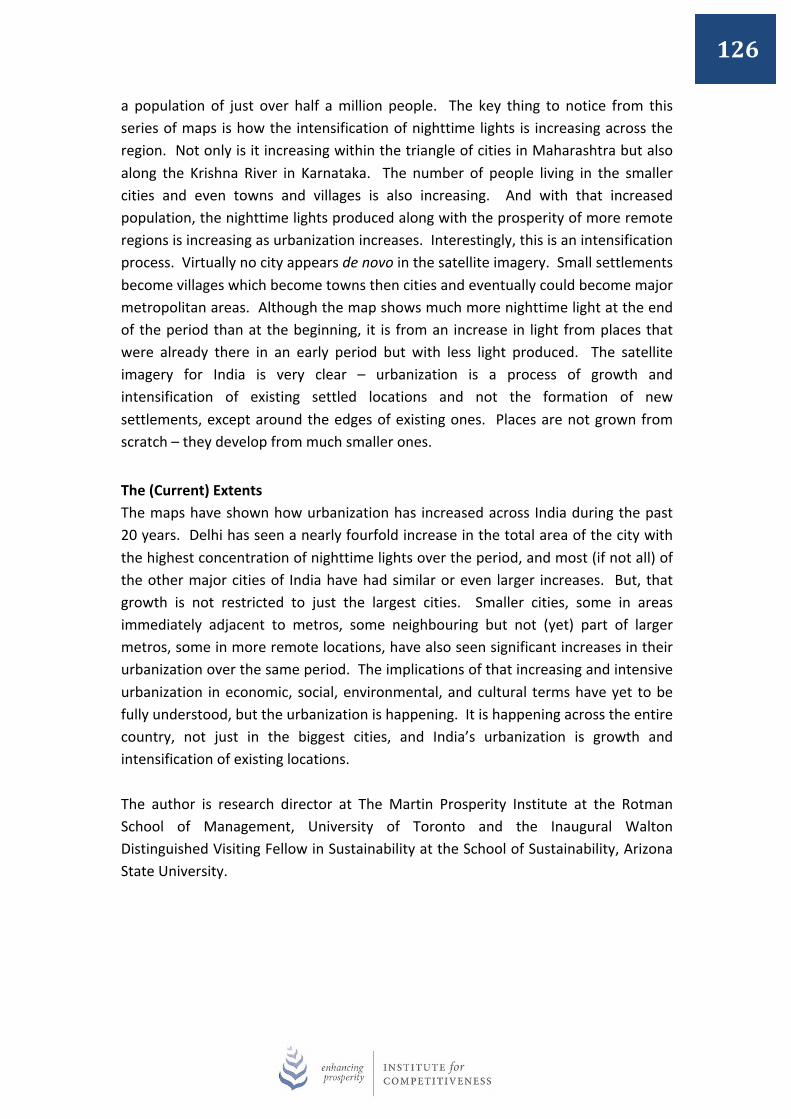
126
a population of just over half a million people. The key thing to notice from this series of maps is how the intensification of nighttime lights is increasing across the region. Not only is it increasing within the triangle of cities in Maharashtra but also along the Krishna River in Karnataka. The number of people living in the smaller cities and even towns and villages is also increasing. And with that increased population, the nighttime lights produced along with the prosperity of more remote regions is increasing as urbanization increases. Interestingly, this is an intensification process. Virtually no city appears de novo in the satellite imagery. Small settlements become villages which become towns then cities and eventually could become major metropolitan areas. Although the map shows much more nighttime light at the end of the period than at the beginning, it is from an increase in light from places that were already there in an early period but with less light produced. The satellite imagery for India is very clear – urbanization is a process of growth and intensification of existing settled locations and not the formation of new settlements, except around the edges of existing ones. Places are not grown from scratch – they develop from much smaller ones. The (Current) Extents The maps have shown how urbanization has increased across India during the past 20 years. Delhi has seen a nearly fourfold increase in the total area of the city with the highest concentration of nighttime lights over the period, and most (if not all) of the other major cities of India have had similar or even larger increases. But, that growth is not restricted to just the largest cities. Smaller cities, some in areas immediately adjacent to metros, some neighbouring but not (yet) part of larger metros, some in more remote locations, have also seen significant increases in their urbanization over the same period. The implications of that increasing and intensive urbanization in economic, social, environmental, and cultural terms have yet to be fully understood, but the urbanization is happening. It is happening across the entire country, not just in the biggest cities, and India’s urbanization is growth and intensification of existing locations. The author is research director at The Martin Prosperity Institute at the Rotman School of Management, University of Toronto and the Inaugural Walton Distinguished Visiting Fellow in Sustainability at the School of Sustainability, Arizona State University.
127
References Chen, X., Nordhaus, W. D. (2011) Using luminosity data as a proxy for economic Statistics, Proceedings of the National Academy of Sciences, 108(21), pp. 8589-‐8594. Doll, C. N. H., Muller, J. P., Elvidge, C. D. (2000) Night-‐Time Imagery as a Tool for Global Mappingo of Socio-‐Economic Parameters and Greenhouse Gas Emissions, Ambio, 29, pp. 157-‐162. Elvidge, C. D., Baugh, K. E., Kihn, E. A., Kroehl, H. W., Davis, E. R. (1997a) Mapping of City Lights Using DMSP Operational Linescan System Data, Photogrammetric Engineering and Remote Sensing, 63, pp 727-‐34. Elvidge, C. D., Baugh, K. E., Kihn, E. A., Kroehl, H. W., Davis, E. R. (1997b) Relation between satellite observed visible-‐near infrared emissions, population, and energy consumption, International Journal of Remote Sensing, 18, pp. 1373-‐1379. Elvidge, C. D., Baugh, K. E., Dietz, J. B., Bland, T., Sutton, P. C., Kroehl, H. W. (1999) Radiance Calibration of DMSP-‐OLS Low-‐light Imaging Data of Human Settlements, Remote Sensing of Environment, 68(1), pp. 77-‐88. Elvidge, C. D., Sutton, P. C., Ghosh, T., Tuttle, B. T., Baugh, K. E., Bhanduri, B., Bright, E. (2009) A Global Poverty Map Derived from Satellite Data, Computers & Geosciences, 35(8), pp. 1652-‐1660. Florida, R., Gulden, T., Mellander, C. (2008) The Rise of the Mega-‐Region, Cambridge Journal of Regions, Economy and Society, 1, pp. 459-‐476. Florida, R., Mellander, C., Gulden, T. (2012) Global metropolis: assessing economic activity in urban centers based on nighttime satellite images, Professional Geographer 64(2), pp. 178–187. Henderson, V., Storeygard, A., Weil, D. N. (2011) A Bright Idea for Measuring Economic Growth, The American Economic Review, 101(3), pp. 194-‐199. Imhoff, M. L., Lawrence, W. T., Stutzer, D. C., Elvidge, C. D. (1997) A Technique for Using Composite DMSP/OLS “City Lights” Satellite Data to Map Urban Area, Remote Sensing of Environment, 3, pp. 361-‐370. Letu, H., Hara, M. Yagi, H., Naoki, K., Tana, G., Nishio, F., Shuhei, O. (2010) Estimating Energy Consumption from Night-‐Time DMSP/OLS Imagery after Correction for Saturation Effects, International Journal of Remote Sensing, 31(16), pp. 4443-‐4458.
128
Small, C., Elvidge, C. D., Balk, D., Montgomery, M. (2011) Spatial Scaling of Stable Night Lights, Remote Sensing of Environment, 115, pp. 269-‐280 Sutton, P., Roberts, C. Elvidge, C., Meij, H. (1997) A Comparison of Nighttime Satellite Imagery and Population Density for the Continental United States, Photogrammetric Engineering and Remote Sensing 63 (11), pp. 1303-‐1313. Sutton, P., Roberts, C. Elvidge, C., Baugh, K. (2001) Census from Heaven: An Estimate of the Global Human Population Using Night-‐Time Satellite Imagery, International Journal of Remote Sensing, 22(16), pp. 3061-‐3076. Sutton, P., Elvidge, C., Obremski, T. (2003) Building and Evaluating Models to Estimate Ambient Population Density, Photogrammetric Engineering & Remote Sensing, 69(5), pp. 545-‐553. Sutton, P., Elvidge, C., Ghosh, T. (2007) Estimation of Gross Domestic Product at Sub-‐National Scales using Nighttime Satellite Imagery, International Journal of Ecological Economics & Statistics, 8, pp. 5-‐21. Townsend, A.C., Bruce, D.A. (2010) The use of night-‐time lights satellite imagery as a measure of Australia’s regional electricity consumption and population distribution, International Journal of Remote Sensing, 31(16), pp.4459–4480. Zhang, Q., Schaaf, C., Seto, K. C. (2013) The Vegetation Adjusted NTL Urban Index: A New Approach to Reduce Saturation and Increase Variation in Nighttime Luminosity, Remote Sensing of Environment, 129, pp. 32-‐41. Zhuo, L., Ichinose, T., Zheng, J., Chen, J., Shi, P. J., Li, X. (2009) Modeling the population density of China at the pixel level based on DMSP/OLS non-‐radiance-‐calibrated night-‐time light images, International Journal of Remote Sensing, 30(4), pp. 1003-‐1018.
129
Moving the economy -‐ Susan Zielinski, Managing Director of SMART Opportunities for India in the emerging global new mobility industry A multitude of new services, products, technologies, and infrastructures has been bubbling up over the past decade or so to supply the next generation of transportation for an increasingly complex and urbanizing world.
This evolution is highly diversified; information technology (IT)-‐driven; and service-‐oriented, creating unique business opportunities (both for local application and export) in sectors as wide ranging as telecommunications, manufacturing, energy, utilities, service and retail, tourism, real estate, logistics, urban design, infrastructure and more. This emerging "new mobility market" is already generating new meta-‐opportunities to provide seamless door-‐to-‐door transportation systems for moving people, moving goods, and moving less, customized to just about any region or community.
On first glance it may appear that India, with its growing and increasingly congested cities, sits on the demand side -‐-‐ not the solution or supply side – of the new mobility continuum. But on closer examination the situation may be quite the opposite. India may well be endowed with key elements of a robust new mobility industry cluster -‐ both in the big business and the entrepreneurial space, and poised to accelerate the array of opportunities.
Building on early global new mobility cluster work by Moving the Economy in 2002, and in the context of a Rockefeller Foundation-‐supported project by SMART at the University of Michigan, Dr. Amit Kapoor and Dr. Sankalp Sharma have recently explored emerging opportunities for India to play a key role new mobility industry cluster leadership.
This brief offers a status update on the rapidly evolving global new mobility industry, related new business models (big and small), public-‐private innovation and new integration models, and new narratives and policy architectures around the future of transportation and the economy that supplies it. It then shifts the focus to innovation and leadership opportunities for Indian industry and enterprise. What does New Mobility Look Like? New Integration Models and Public-‐Private Innovation Imagine a day when from steps of your door, or even from inside your home or office, you could enter a vital network or grid of new mobility points, places that
130
connect any of a range of transport amenities including buses, trains, streetcars, clean fuel taxis, auto rickshaws and car share or bike share vehicles, and in some cases, day care, satellite offices, cafes, shops and entertainment. At its most basic level, a new mobility grid is simply a network of places across a community where transportation modes and services physically connect. At the next level up, this is all brought together and enhanced by a telecommunications framework that offers real-‐time information on arrival and departure times and availability (either through kiosks at hubs or through mobile phones), as well as access to other information. The telecommunications framework also allows you to quickly and easily pay for these affordable modes and services with a single click or a wave past the reader through a mobile phone or a card or a kiosk. This way you can transfer seamlessly from one mode of transportation to the other, informed of schedules and options as you go, using the best mode for the purpose, gaining access to car share at one hub, and dropping it off at another to pick up a waiting bus or train. In practice, it’s much like a customized communications portfolio, in which laptop or tablet connects to desktop, camera, TV, printer, search engine, and more, all talking to each other seamlessly regardless of brand. It doesn’t mean abandoning your desktop computer—it just means merging it with a more diverse and connected portfolio, allowing you to choose the best option for each task. For the user, it’s easy, convenient, affordable and accessible. For government leaders, this begins to address social, environmental, and economic goals, fostering livability, social equity, green industry and green jobs. See “Connecting and Transforming the Future of Transportation”: http://deepblue.lib.umich.edu/handle/2027.42/85216 What New Business Models Will Support the Transformation? Some of the greatest benefits of the burgeoning New Mobility will be economic. For example, established players have already begun to mine the opportunities offered by the fast-‐growing next-‐generation transportation market: witness the urban mobility initiative of Ford Motor Company, as well as smart city businesses of Ashok Leyland, Infosys, Cisco Systems, IBM, Siemens, and more. Meanwhile innovative small enterprises are already beginning to grow up around the new mobility ecosystem. For example, companies that offer fractional-‐ use services such as car share, bike share, and customized shuttles, as well as mobile-‐phone journey-‐planning apps and multimodal fare-‐payment technologies, are
131
finding innovative ways to profit from the new-‐mobility grid. Examples of such innovative enterprise in India include Red Bus, Eco-‐Cabs Dial A Rickshaw, G-‐Auto, SMV Wheels Pvt., Transparent Chennai, Ideophone, Yo Bykes, Jan Bas, and more. Taken together, as industry clusters that cater to the emerging global transportation market are nurtured, they can enhance regional competitiveness and spur job creation. For this to be most effective, a culture of “Public Private Innovation” is emerging in some of the more successful regions, engaging and convening public sector, private sector, and non profit entities early and often to refine the new mobility use cases as they benefit people, cities and economies. As urban complexity and traffic volume increases, the “surface area” between the major movers in the new mobility space needs to increase in support of multi-‐faceted solutions that meet a range of needs. New Narratives, New Policy Landscapes, and New Supporting Platforms Recent studies have begun to show a slight decline in interest in car ownership by the younger generation known as “millenials” – aged 18 – 35. While the jury is still out, this trend is attributed to a number of social and economic factors including a preference for IT over automobile ownership. As such a new narrative (with related business opportunity) seems to be arising featuring a next generation that seeks access to mobility without the necessity of ownership.
At the same time, technology and innovation have begun to outpace the capacity to make policies that apply to them. As such new policy landscapes are emerging to be more nimble and dynamic, with less emphasis on heavy and capital intensive approaches to infrastructure, decision making and financing. In some cases frameworks and incentives aim to reduce or replace detailed regulation with collaborative, multi-‐stakeholder, integrated, and regionally customized solutions.
New public sector roles are in some cases opening up to include convening, incenting, open system framework-‐setting, and the building of big data platforms and professional networks that serve not only transportation users, but also transportation leaders and new mobility businesses and enterprises alike. Through the Rockefeller Foundation-‐supported work on catalyzing the new mobility in cities, the Mobi Prize and platform was developed to crowdsource, profile, link and support new mobility entrepreneurs worldwide (see www.mobiprize.com). New skills and capacities are also needed specific to implementing integrated systems and innovating sustainable and exportable solutions.
Outlook for India: The Way Ahead in India and Beyond
132
According to Dr. Amit Kapoor and Dr. Sankalp Sharma of the Competitiveness Institute: “One could say that the quality of life plus efficiency of travel would define the future of travel in India” They recently developed a white paper focused specifally on India entitled “State of the New Mobility Industry in India” to support understanding of the growth and trajectory of the urban mobility clusters in India and the shape of things to come in the future. In a nutshell they found that: “.. the opportunities exist on many fronts be it mobility solutions for urban poor (whose volumes are massive) or IT solutions for the mobility platforms (GIS/ GPS for tracking MRTS system) to having an IT blueprint of a city. The urban mobility clusters would also create a huge number of jobs, which would promote a more robust and inclusive economic growth.” They also offer important context for proactive industry cluster development in India, highlighting the following points: − India has significant metropolitanization in addition to rapid urbanization − There are many newer smaller cities that are growing faster − There is a growing number and size of cities − Technology is driving change − Solutions need to be customized − There is an increase in smaller cars, longer weekend drives, demand for transit,
more transport options − High productivity losses are due to transportation − The city cannot afford to cater to private cars and two wheelers − Much needs to be done if public transport (and other options) are to play a
significant role − Spending on transport is driven by political prestige − There is a lack of adequate policies for urban transportation − The Indian auto industry is “glocal”, powerful, and evolving and needs to be
integrated into new mobility industry cluster development − Service orientation and the power of IT in transportation is increasing − The new urban mobility could serve a range of classes of consumers − A combination of awareness, marketing, technology and policy could help scale
emerging innovative enterprises − Enabling infrastructure is needed
133
− There is a need for skilling the labour force for integrated project operations & implementation
− Testing facilities are needed − IT and new transit solutions are having an effect − The future of the new mobility cluster in India is exciting In summary: “India has been at the forefront of technology development (at least since 1993 for this specific industry) and has been able to keep down the costs and deliver superior performance to customers. At present urban mobility is severely hampered in India due to improper planning and development. Investments in transportation technology will hold the key for a new urban transportation cluster. Sustainable technology for transportation could show the way for other countries. If India focuses only on fossil fuel technologies the movement away from these would have significant barriers, which will be difficult to break … The agglomeration factors for a cluster arises primarily from knowledge spillovers and lead to enhanced productivity and faster innovation cycles, which help the region grow and prosper. The primary focus is to enhance design and innovation capacity to achieve international competitiveness” The author is managing director of SMART (Sustainable Mobility & Accessibility Research & Transformation), a unique global new mobility tech transfer / applied research initiative of the University of Michigan. Just before joining SMART, Susan was awarded a Harvard Loeb Fellowship based on her trailblazing work in sustainable transportation systems and in naming, framing, and advancing the emerging new mobility cluster through public-‐private innovation.

134
8.0 REFERENCES
135
Articles, Books and Papers § Competitive Cities: Five keys to success, Professor John S. Ratcliffe, University of
Salford § Metropolitan Urban Governance Approaches and Models: Some Implications for
Indian Cities, Ramakrishna Nallathinga (2008) § Report on Municipal Finance in India: An Assessment, Department of Economic
Analysis and Policy, Reserve Bank of India, Mumbai (2007) § Report on India Urban Infrastructure and Services
Institutions, Government Ministries et al. § Airport Authority of India § Central Bureau of Health Intelligence, Government of India § Census of India 2011 and 2001 § CSO, Compendium of Environment & Statistic § Department of Scientific and Industrial Research § District Information Secondary Education § District Report Cards 2007-‐08 § Doing Business in India § Global Competitiveness Report 2011-‐12
§ India Air Transport Statistics § Indian hotel Industry survey § Indian State of Forest report § India Urban Conference, 2011: Evidence & experience § Institute of Public Enterprise Database § Marketing Whitebook 2010-‐11 § Ministry of Communications & IT § Ministry of Labour & Employment § Ministry of Road Transport and Highway § Ministry of Statistics and Programme Implementation § National Crime Records Bureau § National Highway Authority of India § National Institute of Public Finance and Policy, New Delhi § Nielsen Upper Middle & Rich Survey – 2009 § Reserve Bank of India § Selected Socio-‐Economic Statistics, India, 2011

1
2
About the Institute for Competitiveness Institute for Competitiveness, India is the Indian knot in the global network of the Institute for Strategy and Competitiveness at Harvard Business School. Institute for Competitiveness, India is an international initiative centered in India, dedicated to enlarging and purposeful disseminating of the body of research and knowledge on competition and strategy, as pioneered over the last 25 years by Professor Michael Porter of the Institute for Strategy and Competitiveness at Harvard Business School. Institute for Competitiveness, India conducts and supports indigenous research, offers academic and executive courses, and provides advisory services to the Corporate and the Governments. The institute studies competition and its implications for company strategy; the competitiveness of nations, regions & cities and thus generate guidelines for businesses and those in governance; and suggests and provides solutions for socio-‐economic problems. (http://competitiveness.in)

3
www.competitiveness.in