Embed Size (px)
Citation preview

0
Competition Policy and Global Value Chains
Richard Bolwijn
UNCTAD
Division on Investment and Enterprise
Geneva, 7 July 2014
UNCTAD Ad Hoc Expert Meeting: the role of competition law and policy in fostering sustainable development and trade
The views expressed are those of the author and do not necessarily reflect the views of UNCTAD
1
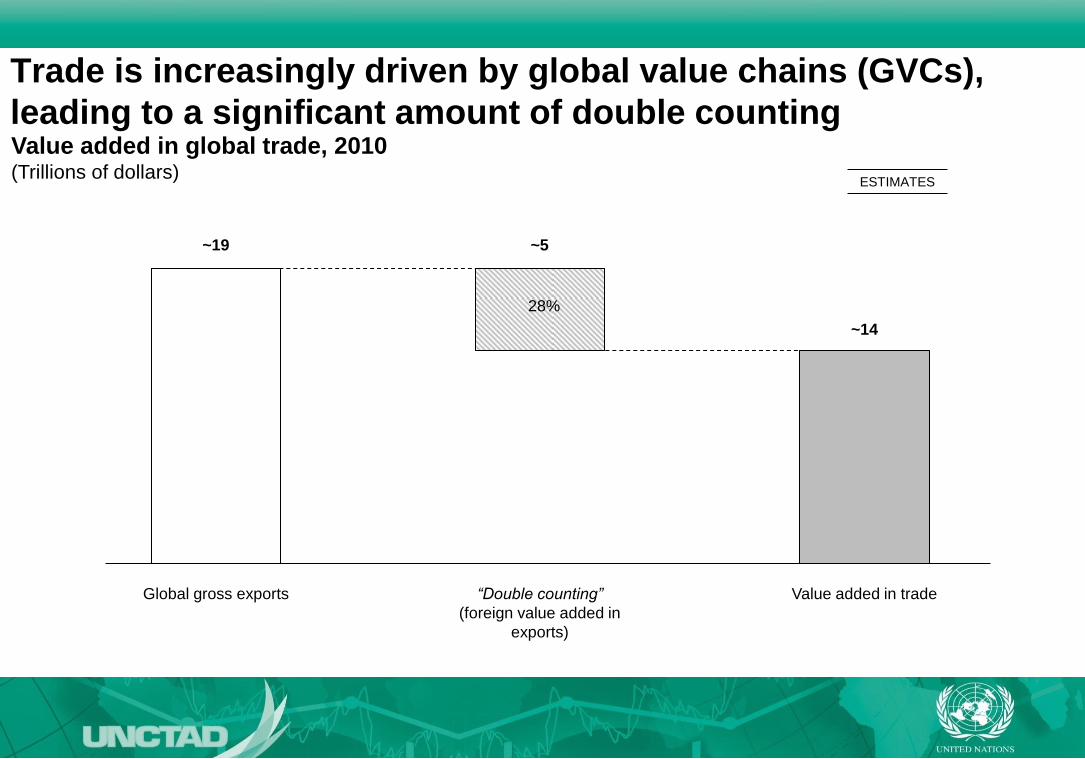
Trade is increasingly driven by global value chains (GVCs),
leading to a significant amount of double counting
Global gross exports “Double counting”
(foreign value added in
exports)
Value added in trade
~19 ~5
~14
28%
ESTIMATES
Value added in global trade, 2010 (Trillions of dollars)

2
The importance of GVCs in domestic economies is significant Domestic value added in trade as a share of GDP, by region, 2010 (Per cent)
30%
14%
27%
22%
16%
37%
18%
24%
25%
30%
28%
13%
12%
26%
18%
22%
Least Developed Countries
Memorandum item:
Transition Economies
South America
Caribbean
Central America
Latin America and Caribbean
West Asia
South Asia
East and South - East Asia
Asia
Africa
Developing Economies
Japan
United States
EU
Developed Economies
Global
Developing country average
26%
3
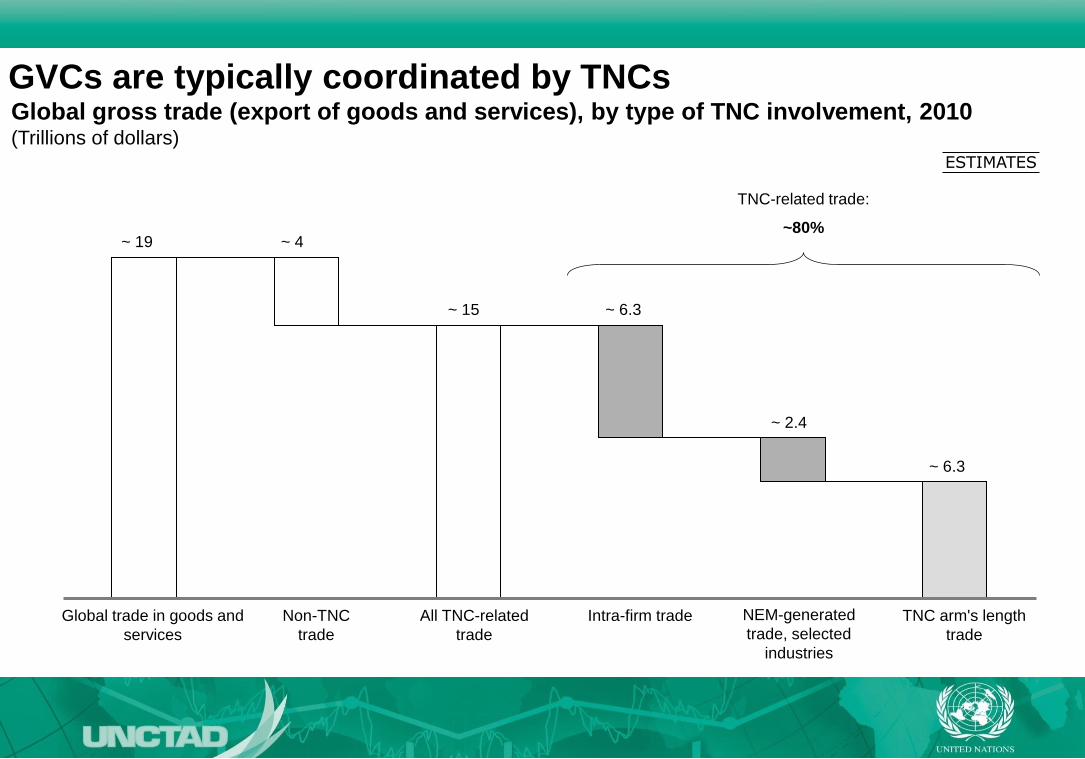
GVCs are typically coordinated by TNCs
Global trade in goods and
services
Non-TNC
trade
All TNC-related
trade
Intra-firm trade TNC arm's length
trade
TNC-related trade:
~80%
ESTIMATES
NEM-generated
trade, selected
industries
Global gross trade (export of goods and services), by type of TNC involvement, 2010 (Trillions of dollars)
~ 19 ~ 4
~ 15 ~ 6.3
~ 2.4
~ 6.3
4
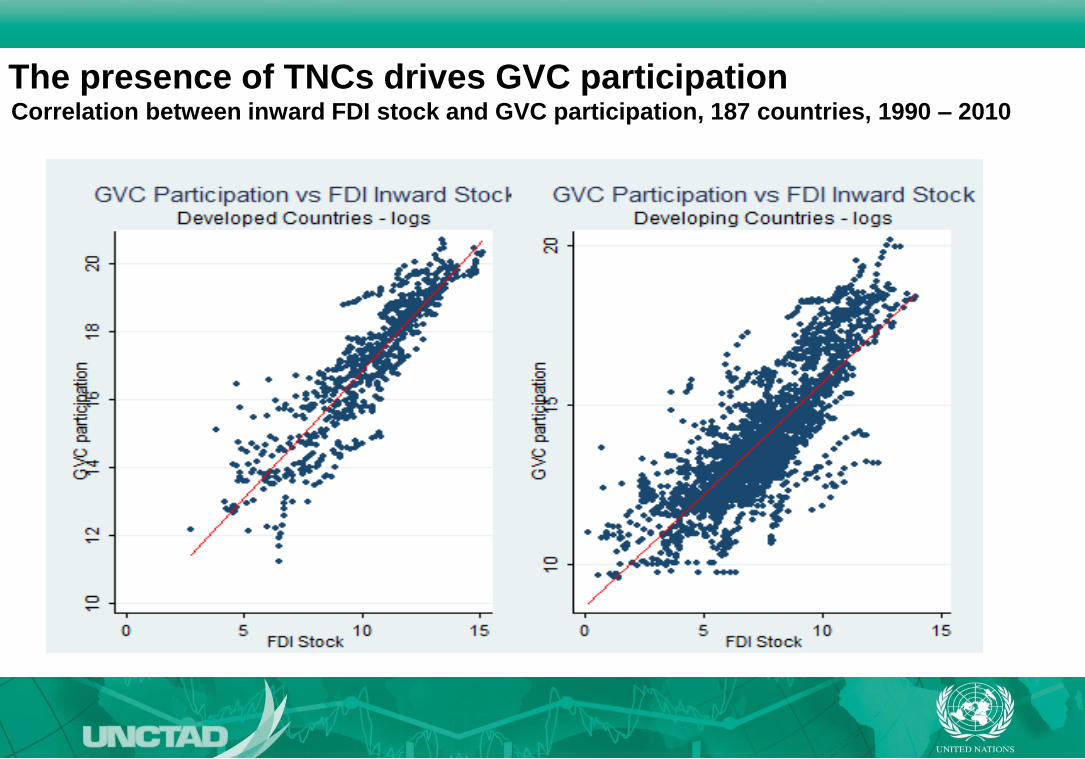
The presence of TNCs drives GVC participation Correlation between inward FDI stock and GVC participation, 187 countries, 1990 – 2010
5
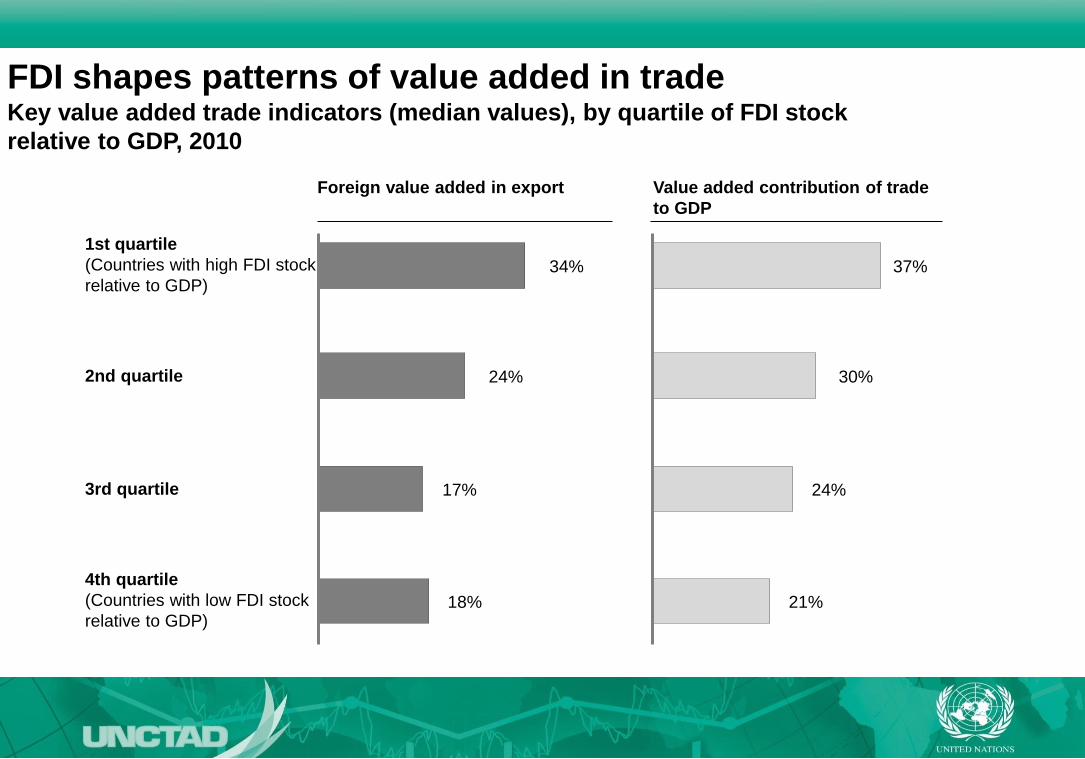
FDI shapes patterns of value added in trade Key value added trade indicators (median values), by quartile of FDI stock
relative to GDP, 2010
1st quartile
(Countries with high FDI stock
relative to GDP)
2nd quartile
3rd quartile
4th quartile
(Countries with low FDI stock
relative to GDP)
Foreign value added in export
18%
17%
24%
34%
Value added contribution of trade
to GDP
21%
24%
30%
37%

6
Value capture in GVCs depends on several factors Value capture in GVCs: value added trade shares by component, developing country
average
7
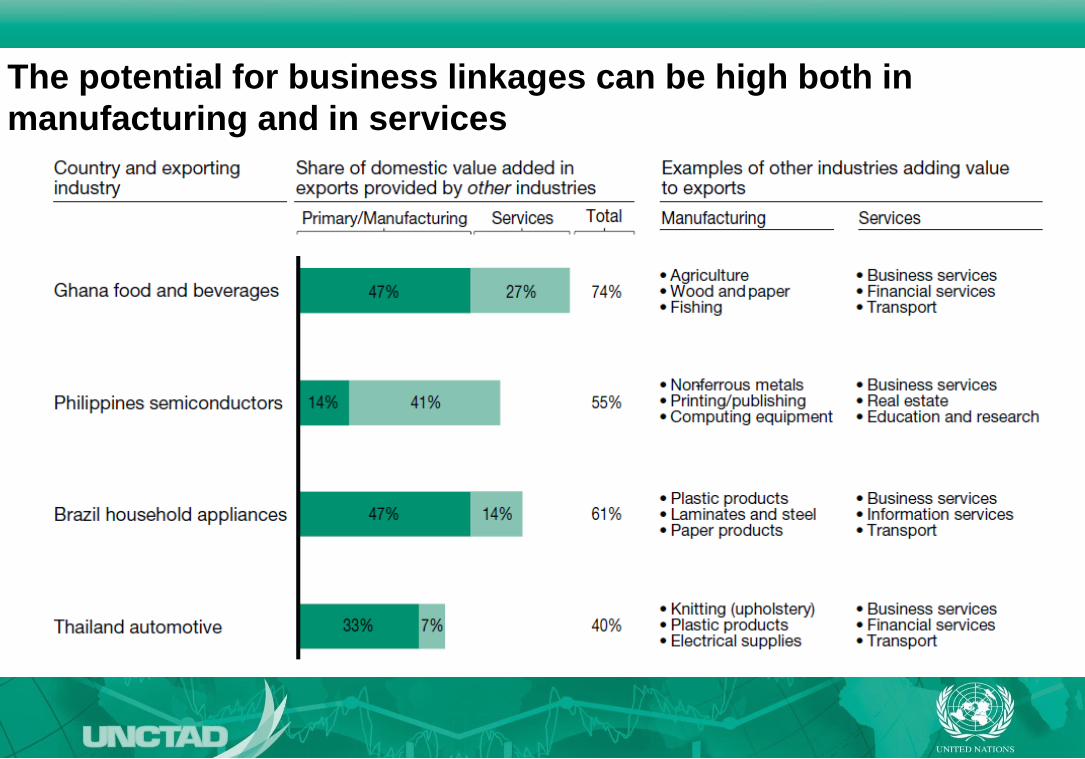
The potential for business linkages can be high both in
manufacturing and in services
8
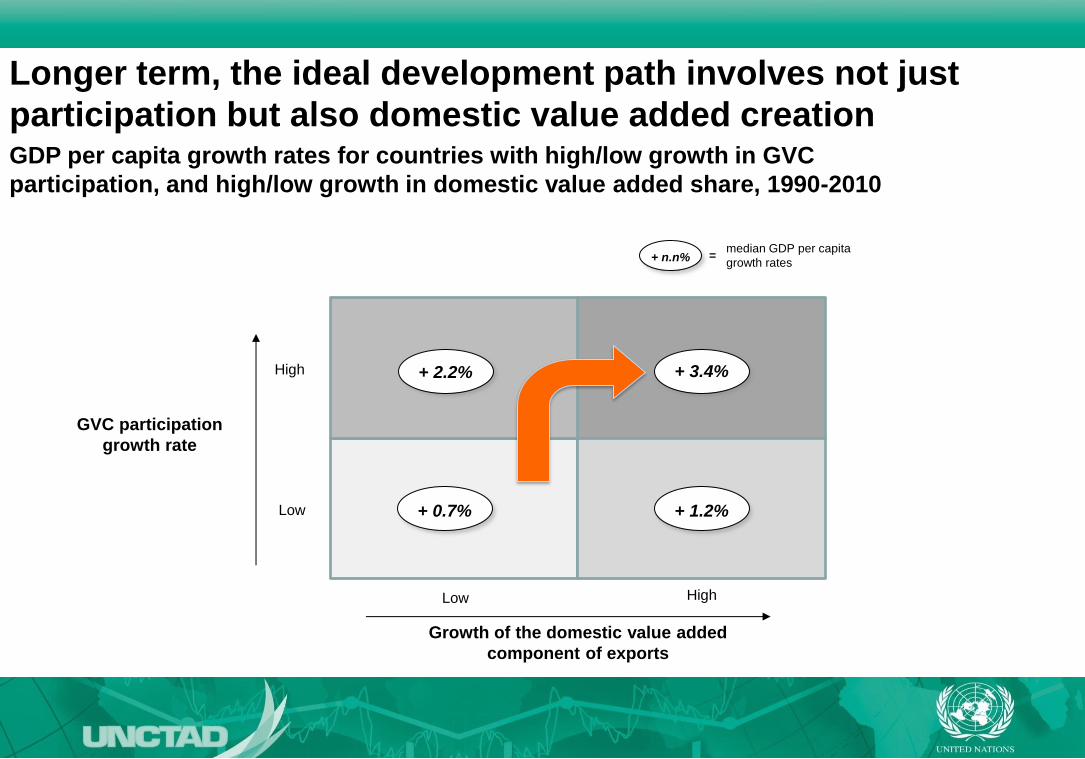
Longer term, the ideal development path involves not just
participation but also domestic value added creation GDP per capita growth rates for countries with high/low growth in GVC
participation, and high/low growth in domestic value added share, 1990-2010
GVC participation
growth rate
Growth of the domestic value added
component of exports
Low
Low
High
High
+ 2.2% + 3.4%
+ 0.7% + 1.2%
+ n.n% median GDP per capita
growth rates =

9
For most developing countries an increase in participation in
GVCs implied a reduction in domestic value added share GVC Development Paths: country examples

10
The links between competition policy and GVCs
Enabling
Upgrading
Enabling Value
Capture
Enabling Participation
1
2
3
11
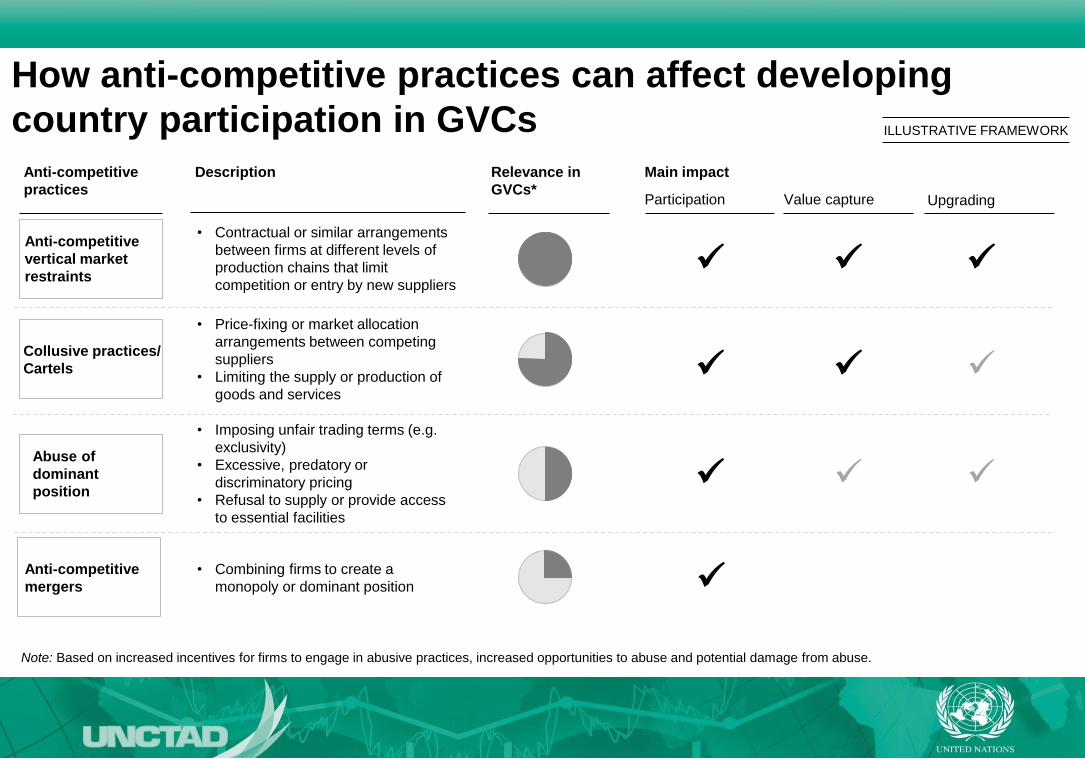
How anti-competitive practices can affect developing
country participation in GVCs
Anti-competitive
practices
Relevance in
GVCs*
Main impact
Participation Value capture Upgrading
Description
C
C Anti-competitive
mergers
Abuse of
dominant
position
• Imposing unfair trading terms (e.g.
exclusivity)
• Excessive, predatory or
discriminatory pricing
• Refusal to supply or provide access
to essential facilities
• Combining firms to create a
monopoly or dominant position
C
Anti-competitive
vertical market
restraints
• Contractual or similar arrangements
between firms at different levels of
production chains that limit
competition or entry by new suppliers
C Collusive practices/
Cartels
• Price-fixing or market allocation
arrangements between competing
suppliers
• Limiting the supply or production of
goods and services
Note: Based on increased incentives for firms to engage in abusive practices, increased opportunities to abuse and potential damage from abuse.
ILLUSTRATIVE FRAMEWORK

12
Visit UNCTAD websites:
www.unctad.org/diae
and
www.unctad.org/wir
www.unctad.org/fdistatistics
Thank You!
26