Embed Size (px)
DESCRIPTION
Liquefied natural gas (LNG) exports from the west coast of Canada have been heralded as economic salvation for the province of British Columbia. This report undertakes a reality check that reveals several major problems with this narrative, both in the stewardship of finite non-renewable resources by provincial and federal governments, and in the environmental implications of large-scale development.
Citation preview

A Clear Look at BC LNG Energy security, environmental implications and economic potential
LNG
Rea
lity
Che
ck S
erie
s
by J. David Hughes
MAY 2015

1400 – 207 West Hastings StreetVancouver BC V6B 1H7604.801.5121 | [email protected]
www.policyalternatives.ca
A CLEAR LOOK AT BC LNGEnergy security, environmental implications and economic potential
May 2015
by J. David Hughes
This paper is part of the Climate Justice Project, a research alliance led by the CCPA-BC. The Climate Justice Project studies the social and economic impacts of climate change, and develops innovative green solutions that are both effective and equitable. Thanks to Vancity for its support of the project, and special thanks to the Vancouver Foundation for its financial support of the LNG Reality Check series.
ACKNOWLEDGEMENTS
The author would like to thank CCPA-BC staff and the anonymous peer reviewers who provided feedback on earlier drafts of this paper. The Canadian Shield Foundation assisted in covering the cost of the subscription to Drillinginfo used to calculate the number of wells required.
The opinions and recommendations in this report, and any errors, are those of the author, and do not necessarily reflect the views of the publishers and the funders of this report.
This report is available under limited copyright protection. You may download, distribute, photocopy, cite or excerpt this document provided it is properly and fully credited and not used for commercial purposes. Photographs may not be reproduced separately without permission of the photographer.
Copyedit: Maja Grip Layout and design: Paula Grasdal, CGD
ISBN: 978-1-77125-203-4
Contents
SUMMARY ..................................................................................................................... 5
A CLEAR LOOK AT BC LNG ............................................................................................. 5
INTRODUCTION ........................................................................................................... 8
CANADIAN GAS PRODUCTION ...................................................................................... 9
NATIONAL ENERGY BOARD FORECASTS OF FUTURE GAS PRODUCTION ...................... 12
NATIONAL ENERGY BOARD LNG PERMITTING ............................................................. 15
BC GAS SUPPLY ............................................................................................................ 18
Two scenarios: Export requirements based on domestic growth or stable production ................................................................. 20
NEW WELLS REQUIRED ................................................................................................ 22
WATER REQUIREMENTS AND LAND DISTURBANCE ...................................................... 29
LIFE-CYCLE GREENHOUSE GAS EMISSIONS .................................................................. 38
ECONOMICS AND REVENUE POTENTIAL ...................................................................... 43
CONCLUSION AND IMPLICATIONS ............................................................................. 45
REFERENCES ................................................................................................................ 47
APPENDIX A: GLOSSARY OF TERMS .............................................................................. 49

4
A B O U T T H E A U T H O R
DAV I D H U G H E S is a geoscientist who has studied the energy resources of Canada and the US for four decades, including 32 years with the Geological Survey of Canada as a scientist and research manager, where he headed unconventional gas and coal research. His research focus is on unconventional fuels, primarily shale gas and tight oil, but also coalbed methane and other unconventional sources, including oil sands, coal gasification and gas hydrates. Hughes is currently President of Global Sustainability Research Inc, a consultancy dedicated to research on energy and sustainability issues. Clients include a range of energy companies, investment firms and non-profits.
Hughes has published widely in the scientific literature and his work has been featured in Nature, The Economist, LA Times, Bloomberg, USA Today and Canadian Business, as well as other press, radio, and television. Most recently he published Drilling Deeper: A Reality Check on U.S. Government Forecasts of a Lasting Shale Gas and Tight Oil Boom, which is an in-depth review of major U.S. shale gas and tight oil plays, including forecasts of future production. This was preceded by Drilling California: A Reality Check on the Monterey Shale, which critically examined the U.S. Energy Information Administration’s (EIA) estimates of technically recover-able tight oil in the Monterey Shale, and predicted the subsequent 96% downgrade of tight oil resources. In early 2013, Hughes authored Drill, Baby, Drill: Can Unconventional Fuels Usher in a New Era of Energy Abundance?, which took a far-ranging look at the prospects for various unconventional fuels to provide energy abundance for the United States in the 21st century. Over the past decade, he has researched and lectured widely on global energy and sustain-ability issues in North America and internationally.

A CLEAR LOOK AT BC LNG: ENERGY SECURITY, ENVIRONMENTAL IMPLICATIONS AND ECONOMIC POTENTIAL 5
Liquefied natural gas (LNG) exports from the west coast of Canada have been heralded as eco-nomic salvation for the province of British Columbia. This report undertakes a reality check that reveals several major problems with this narrative, both in the stewardship of finite non-renewable resources by provincial and federal governments, and in the environmental implications of large-scale development.
Canada’s long-term energy security may be compromised by LNG export plans:
• The National Energy Board has a mandate to ensure Canadian domestic supplies are met before approving exports, but is failing to do its job.
• The NEB has, to date, approved 12 terminals with a total capacity of 251 trillion cubic feet (tcf) of LNG exports over 20-25 years. However, the NEB’s own modeling shows that only a small percentage of that amount — 18 tcf — is available for export, even with a three-fold ramp-up in BC production.
• Medium to high levels of LNG exports from BC would require Canada to become a net importer of natural gas, simply to meet domestic needs.
The BC government’s claims of available gas supplies for export are greatly exaggerated:
• The BC Oil and Gas Commission estimates BC’s raw gas reserves at 42.3 tcf, with a total “marketable resource” of 442 tcf. (Reserves have been proven through drilling or are close to drilled areas, and are considered recoverable with current technology and economic conditions. Resources are much less certain, as they are probabilistic estimates based on broad extrapolations with limited drilling.)
• The BC government has publicly stated that marketable resources are six times higher than the Commission’s estimate: 2,900 tcf available for export. This is not a credible claim.
• The amount of gas that must be produced at the well head is considerably greater than the amount that would be sold, due to losses in the conversion of raw gas to
S U M M A R Y
A Clear Look at BC LNGEnergy security, environmental implications and economic potential

6 A CLEAR LOOK AT BC LNG: ENERGY SECURITY, ENVIRONMENTAL IMPLICATIONS AND ECONOMIC POTENTIAL
marketable gas, and to gas consumed in the extraction, liquefaction and transporta-tion processes. About 1.44 units of raw gas must be extracted to deliver 1 unit to Asia.
Were the BC government to realize its hoped-for export target, the scale-up in drilling and associ-ated infrastructure required would be massive, and would fundamentally alter the landscape of northern BC:
• The gas required for export would come mainly from fracked wells in BC’s Northeast. (Almost all of BC’s future gas production is expected to involve fracking, which requires much more water and produces much more greenhouse gas emissions than conventional drilling).
• An extraordinary 37,800 to 43,700 new wells would need to be drilled by 2040, more than doubling to nearly tripling the number of wells drilled since 1954 in northeast BC.
• BC gas production would need to increase by four to five times. This would require the production of between 4.1 and 4.6 times BC’s current proven raw gas reserves of 42.3 tcf by 2040.
A major public concern is the amount of water and the chemicals and other additives used in the fracking process, as well as the potential for contamination of surface water through surface casing failures and improper disposal of fracking wastewater:
• The rate of water consumption is a function of the play (area) the wells are drilled in. About 25 million gallons of water per well are required in the Horn River Basin, from which a large portion of BC gas will be sourced.
• This requires some 2,300 truck trips per well, followed by a further 700 truck trips to remove the fracking waste water produced in the process.
• In the BC government’s proposed export target, water consumed in the ramp-up phase of drilling would equal about 22,000 Olympic-sized swimming pools per year, or about half of the annual consumption of Vancouver or Calgary.
• While the BC government has argued that water use will be a very small amount of the total runoff in northern BC, actual water use will be much more localized and therefore comprise a much larger proportion of available surface water in each drilling area.
• Water supply impacts can vary markedly with the seasons, with increased stress during dry periods or droughts.
The BC government is understating the amount and intensity of land disturbance and water consumption in the development of upstream supply for LNG exports:
• Land use disturbance is significant, and includes well pads, roads, pipelines and facilities. It also includes seismic impacts.
• The target export scenario would see 4.2 per cent of the land area in the Horn River and Montney plays disturbed.
• As with water, land disturbance will be concentrated in the plays being exploited, and not spread out over the entire northeastern BC landscape.
About 25 million gallons of water per well are required in
the Horn River Basin, from which a large
portion of BC gas will be sourced.

A CLEAR LOOK AT BC LNG: ENERGY SECURITY, ENVIRONMENTAL IMPLICATIONS AND ECONOMIC POTENTIAL 7
Exporting BC LNG will not reduce global greenhouse gas emissions:
• LNG is an energy-intensive way to move gas, requiring some 20 per cent of the gas to be consumed in the liquefaction, transport and regasification process (assuming gas-drive facilities which are the most common).
• From wellhead to final combustion, there are substantial leakages of methane, a much more potent greenhouse gas than CO2. Given this, liquefied fracked gas from BC actually has GHG emission rates similar to coal.
• Contrary to the notion that BC LNG would be “doing the world a favor” by dis-placing coal use in Asia, BC LNG exports to China would increase GHG emissions over at least the next fifty years, compared to building state-of-the-art coal plants. Considered on a 100-year basis, burning imported LNG would provide only a mar-ginal improvement compared to best technology coal.
There are considerable risks to companies entering BC’s nascent LNG industry.
• Chief among them are the potential for rising domestic gas prices and lowering international prices, eliminating the arbitrage needed to pay off the multi-billion dollar investments required.
• The structure of BC’s LNG Tax, recently halved, means that British Columbians, the public owners of the resource, will not see peak revenue flows until these capital investments are paid off, making them the back stoppers of these risks, as well as the recipients of the impacts on public infrastructure and the environment.
• It is unlikely that anything close to the revenue projected by the BC government for its coffers will ever be realized.
Oil and gas represent a one-time legacy that underpins virtually every aspect of modern society. Notwithstanding the desirability of replacing fossil fuels with lower emitting alternatives, it is highly likely that fossil fuels will be needed at some level for the foreseeable future. Canada and British Columbia have adopted a de facto strategy of liquidating these resources as quickly as possible in the name of the economic prospects of the government of the day. These resources are precious, non-renewable and come with collateral environmental impacts. They demand more balanced stewardship in view of the needs of future generations of Canadians.
Oil and gas represent a one-time legacy that underpins virtually every aspect of modern society.

8 A CLEAR LOOK AT BC LNG: ENERGY SECURITY, ENVIRONMENTAL IMPLICATIONS AND ECONOMIC POTENTIAL
P A R T 1
Introduction
LIQUEFIED NATURAL GAS (LNG) exports from the west coast of Canada have been heralded as economic salvation for the province of British Columbia, with promises that they will generate a $100 billion “prosperity fund,” pay off the provincial debt and generate tens of thousands of jobs. Gas would be sourced primarily from known and emerging shale and tight gas plays1 in northeastern BC and northwestern Alberta. Hundreds of kilometres of new pipelines would be constructed and existing pipelines expanded to deliver the gas to newly constructed LNG terminals spread from Port Alberni and Campbell River on Vancouver Island through Kitimat and Prince Rupert to as far north as Stewart.
How realistic is this dream? And what are the long-term energy security implications of liquidating a non-renewable resource as fast as possible and the environmental ramifications of doing so? The following analysis examines the National Energy Board (NEB) gas production forecasts and its LNG permitting process in the light of its mandate to safeguard energy supply for Canadians. It also looks at the scale of drilling and the environmental implications of several LNG develop-ment scenarios in terms of water consumption and surface land disturbance as well as full-cycle greenhouse gas emissions. Finally, it addresses the economic risk to producers and the potential revenue to be gained by government from LNG developments.
1 “Play” refers to a prospective region for oil and/or gas typically confined to one stratigraphic rock unit. “Shale gas” refers to very low permeability reservoir rock that has been rendered commercially viable through the application of high-volume hydraulic fracturing and horizontal drilling. “Tight gas” is also low permeability although somewhat higher than shale, and typically occurs in coarser grained siltstones and sandstones; it can be produced with less intensive drilling and completion technologies than shale gas although hydraulic fracturing and horizontal drilling are commonly used.
How realistic is this dream? And what are the long-term
energy security implications of
liquidating a non-renewable
resource as fast as possible and the
environmental ramifications of doing so?

A CLEAR LOOK AT BC LNG: ENERGY SECURITY, ENVIRONMENTAL IMPLICATIONS AND ECONOMIC POTENTIAL 9
P A R T 2
Canadian gas production
Canadian gas production has fallen 19 per cent since its all-time peak in 2002, despite near record high gas prices as recently as 2008 (Figure 1). Two-thirds of Canadian gas is produced in Alberta, with BC accounting for an additional 28 per cent and the remainder of Canada just 6 per cent. The Western Canadian Sedimentary Basin, of which Alberta and BC comprise the largest part, is a mature petroleum region with nearly 800,000 wells drilled, of which 25,890 are in BC.
The great hope in expanding Canadian gas production in the future lies in the development of im-permeable shale and other tight reservoirs made accessible by the advent of multi-stage hydraulic fracturing (“fracking”) in combination with horizontal drilling. Fracking has greatly expanded both gas and oil production from shale in the US, although the fundamental characteristics of this production (steep well- and field-production declines and the variable quality of plays) suggest that such gains will be relatively short-lived.2 Principal shale and tight gas plays of interest in BC and Alberta include the Horn River and Montney, which have already had considerable explora-tion effort, and the Cordova Bay and Liard, which have seen only limited development.
2 Hughes, J.D. 2014.

0
2
4
6
8
10
12
14
16
18
20
2000 2002 2004 2006 2008 2010 2012 2014
Billi
on c
ubic
feet
per
day
British Columbia Alberta NWT & Yukon Saskatchewan Ontario New Brunswick Nova Scotia
Down 19% from peak
Peak May 2002
66%
28%
10 A CLEAR LOOK AT BC LNG: ENERGY SECURITY, ENVIRONMENTAL IMPLICATIONS AND ECONOMIC POTENTIAL
Figure 1: Marketable gas production by province from 2000 through 2014.3
Note: Three-month trailing moving average.
Source: National Energy Board, 2014.
Optimistic estimates of the Montney play, for example, suggest that 449 trillion cubic feet (tcf) of marketable gas resources are contained in this formation in Alberta and British Columbia (the “NEB et al. study”; see map in Figure 2 for the location of these plays).4 This amounts to 71 per cent of the remaining recoverable gas resources in the Western Canada Sedimentary Basin (WCSB), which contains most of Canada’s gas resources, with a further 78 tcf, or 12 per cent of remaining recoverable WCSB gas, in the Horn River Basin.5 This estimate is poorly constrained in that no estimate is made of the number of wells and the amount of capital that would be required to recover the resource, or of the rate at which it could be produced. Furthermore, the authors state:
No study has been undertaken to determine the economics for marketable resources and the determination of what is economic is based on the view of the Agencies.
A similarly poorly constrained estimate by a consultant to the US Department of Energy put the unconventional gas resources of Alberta and BC at 536.8 tcf, including all potential plays,6 which is comparable to the 527 tcf sum of the Horn River and Montney plays in the NEB et al. study. Again these numbers come with no price estimate nor any estimate of what it might take to recover the resources in terms of the number of wells, time and capital input.
3 National Energy Board. Retrieved November 29, 2014. At: https://www.neb-one.gc.ca/nrg/sttstc/ntrlgs/stt/mrktblntrlgsprdctn-eng.html.
4 National Energy Board et al. November 2013. Note that in a separate report published at the same time (https://www.neb-one.gc.ca/nrg/ntgrtd/ftr/index-eng.html), the NEB states that remaining marketable gas resources in the WCSB are 861 tcf, not 632 tcf, even though these two reports were published by the NEB within days of each other.
5 Ibid. 6 US Energy Information Administration. June 2013.

© Hughes GSR Inc, 2015
Fort St. John
Horn River 200 km
Montney
Edmonton Prince George
Figure 2: Location of the Montney and Horn River plays in northeastern BC and northwestern Alberta
A CLEAR LOOK AT BC LNG: ENERGY SECURITY, ENVIRONMENTAL IMPLICATIONS AND ECONOMIC POTENTIAL 11
Note: Red dots are existing Montney wells and black dots are Horn River wells.7 The approximate limits of the plays are indicated; however, the prospectivity within those limits is by no means uniform across the area.
7 Well locations are from the Drillinginfo Inc. database and are current to December 2014.

12 A CLEAR LOOK AT BC LNG: ENERGY SECURITY, ENVIRONMENTAL IMPLICATIONS AND ECONOMIC POTENTIAL
P A R T 3
National Energy Board forecasts of future gas production
In 2013, the NEB published its latest “Energy Future” document, which forecasts energy supply and demand in Canada based on assumptions of economic growth, commodity prices and the availability of resources. It includes three cases based on commodity prices: high price, low price and reference price. The reference-price case is its “most likely” forecast. In this document, the NEB projects that, although Canadian gas production is declining now, it will begin to increase by 2017 and rise to the level of the all-time 2002 peak of Canadian production by 2035.8 The NEB assumes that there will be some LNG exports in its forecast, but nowhere near the export levels envisaged by the BC government. Figure 3 illustrates the reference case projection from this report. This forecast is for Canadian gas production to ramp up by 55 per cent from 2018 to 2035, and that the bulk of this growth will come from BC, which will grow to provide 61 per cent of Canadian gas production in 2035. The NEB suggests this increase in production will occur with a drilling rate of just one-sixth of the number of wells drilled at the peak rate in 2005, and that prices will remain below $6.25/MMbtu out to 2035. Given an assessment of the cost and fundamentals of shale plays, this price forecast seems wishful thinking indeed.9
8 National Energy Board. November 2013.9 Hughes, J.D. 2014.

0
5,000
10,000
15,000
20,000
25,000
0
2
4
6
8
10
12
14
16
18
20
2000 2005 2010 2015 2020 2025 2030 2035
Wel
ls d
rille
d pe
r yea
r
Billi
on c
ubic
feet
per
day
2017 Trough
Peak May 2002
38%
61%
Renaissance
BC +224% 2014−2035
Rest of CanadaSaskatchewanBritish Columbia AlbertaWells drilled per year
A CLEAR LOOK AT BC LNG: ENERGY SECURITY, ENVIRONMENTAL IMPLICATIONS AND ECONOMIC POTENTIAL 13
Figure 3: NEB reference case forecast for Canadian gas production by province through 2035 10
Note: Also illustrated are the projected annual drilling rates to achieve the forecast.
Source: National Energy Board Energy Futures, November 2013.
Nonetheless, given that the Energy Future report is NEB’s best-considered opinion of future gas supply in Canada, one might ask how much gas is available for export, given the NEB’s forecasts of Canadian domestic demand. Figure 4 illustrates the net exports available in each of the three NEB cases out to 2035, both with and without the LNG exports assumed by the NEB. If the NEB LNG exports are included (which would meet the needs of just one large terminal), Canada would become a net natural gas importer by 2017 in the low case and by 2020 in the reference case. In the high and reference cases, Canada has 30.9 tcf and 0.7 tcf available for additional exports, respectively, over the period from 2016 to 2035. In the low case, Canada would need to import 33 tcf of gas by 2035 to meet its own requirements and the NEB’s assumed LNG exports.
To put this in perspective, the BC government’s highest estimate for LNG exports, which assumes the construction of five LNG terminals, would require the production and export of an additional 70 tcf of marketable gas by 2035 over and above the NEB’s assumed exports. If the NEB’s produc-tion forecasts were to prove accurate, this would see Canada importing between 39 and 103 tcf of gas by 2035 (depending on which NEB case is used) in order to meet this level of LNG exports (70 tcf of imports, which would be the reference case requirement, is equivalent to roughly 13 years of current Canadian production).
10 National Energy Board. November 2013.
This forecast is for Canadian gas production to ramp up by 55 per cent from 2018 to 2035, and that the bulk of this growth will come from BC, which will grow to provide 61 per cent of Canadian gas production in 2035.

-8
-6
-4
-2
0
2
4
6
8
10
12
2000 2005 2010 2015 2020 2025 2030 2035
Billi
on c
ubic
feet
per
day
High case less NEB LNG export assumption High case Low case less NEB LNG export assumption Low case Reference case less NEB LNG export assumption Reference case
48.0 tcf
17.9 tcf
-15.9 tcf
30.9 tcf
0.7 tcf
-33.0 tcf
14 A CLEAR LOOK AT BC LNG: ENERGY SECURITY, ENVIRONMENTAL IMPLICATIONS AND ECONOMIC POTENTIAL
Figure 4: Natural gas available for export in the three cases in the NEB Energy Future report 11
Note: The cumulative net production available for export between 2016 and 2035 in each case for both no exports and NEB’s assumed exports is also shown. In the low case, Canada becomes a net importer of gas in 2017 without any LNG exports. If the NEB’s assumed exports are included (which would meet the requirements of just one large terminal), Canada would have essentially no gas available for additional exports in the reference case and would need to import 33 tcf to meet its own needs in the low case over the period to 2035.
Source: National Energy Board Energy Futures 2013 and NEB personal communication, December 2014.
11 National Energy Board. November 2013. The net natural gas available for export is illustrated in Figure 6.5 of the NEB report, and the NEB provided a spreadsheet of the data for this figure on December 29, 2014 (email communication from Matthew Hansen of NEB). The actual primary demand data in the NEB report cannot be used to calculate the net available for export by subtracting from forecast supply as they contain a “producer consumption” factor that is not defined in the report and is not included in the NEB forecasts of natural gas supply. The exports NEB assumed are 1 bcf/d by 2019, 2 bcf/d by 2021 and 3 bcf/d by 2023 and thereafter (see p. 17 of the NEB energy future report).
To put this in perspective, the
BC government’s highest estimate for LNG exports,
which assumes the construction of
five LNG terminals, would require
the production and export of an additional 70 tcf
of marketable gas by 2035 over and
above the NEB’s assumed exports.

A CLEAR LOOK AT BC LNG: ENERGY SECURITY, ENVIRONMENTAL IMPLICATIONS AND ECONOMIC POTENTIAL 15
P A R T 4
National Energy Board LNG permitting
As indicated in Table 1, the NEB has approved ten LNG export terminals in BC and two in Oregon for a total export capacity of 23.9 billion cubic feet per day (bcf/d). This is nine more terminals in BC than included in the NEB Energy Future report and 21 bcf/d more than its assumed LNG exports. To put this in perspective, Canada’s total gas production in December 2014 was 14.43 bcf/d, so the NEB has approved the export of 66 per cent more gas than Canada currently produces in total. There are a further seven proposals under the NEB’s consideration, which, if approved, could see the export of an additional 20.7 bcf/d for a total of 44.6 bcf/d, or roughly three times Canada’s current production.
Table 1: West Coast LNG export terminals approved/under review by NEB, May 2015 12
BC LNG export terminals approved
OperatorTotal
exports (bcf)
Annual capacity
(bcf)
Daily capacity (bcf/d)
In service Company Location
KM LNG Operating General Partnership 9,360 468 1.28 Chevron, Apache Bish Cove,
Kitimat
BC LNG Export Co-operative LLC 1,691 85 0.23
First Nations, AltagasLicense Revoked 5/3/15
Barge, Kitimat Arm
LNG Canada Development Inc. 32,950 1,180 3.23 2019 Shell, Mitsubishi,
Korea Gas, PetroChina Kitimat
Pacific NorthWest LNG Ltd. 28,203 1,001 2.74 2018 Progress Energy, Petronas, Japex
Prince Rupert, Lelu Island
12 National Energy Board. Retrieved May 19, 2015. Some information from http://engage.gov.bc.ca/lnginbc/lng-projects/.

16 A CLEAR LOOK AT BC LNG: ENERGY SECURITY, ENVIRONMENTAL IMPLICATIONS AND ECONOMIC POTENTIAL
BC LNG export terminals approved cont.
WCC LNG Ltd. 38,935 1,461 4.00 2023 Imperial Oil, Exxon Mobil
Prince Rupert or Kitimat
Prince Rupert LNG Exports Limited 29,108 1,062 2.91 2019 British Gas Group Prince Rupert,
Ridley Island
Woodfibre LNG Export Pte. Ltd. 3,019 105 0.29 2017 Pacific Oil and Gas
Singapore Squamish
Triton LNG Limited Partnership 3,308 115 0.32 2017 Altagas and Idemitsu Barge, Kitimat
or Prince Rupert
Aurora Liquefied Natural Gas Ltd. 29,999 1,134 3.11 2021 Nexen/CNOOC,
Inpex, JGC Corp.Grassy Point, Prince Rupert
Woodside Energy Holdings Pty Ltd 25,550 1,022 2.80 2021 Woodside Energy
Holdings Pty Ltd.Grassy Point, Prince Rupert
WesPac 3,650 146 0.40 2016 WesPac Midstream LLC
Tilbury Island, Delta
Total Approved West Coast BC 205,773 7,694 21.08 Cumulative exports from
2020 through 2040 = 139 tcf
USA terminals approved
Jordan Cove LNG LP 15,627 566 1.55 Veresen Inc. Coos Bay, Oregon
Oregon LNG Marketing Company LLC 29,999 473 1.30 2019 Leucadia Corp. Warrenton,
Oregon
Total approved USA (Oregon) 45,625 1,039 2.85
Grand total approved 251,398 8,733 23.93
Terminals under review
Discovery LNG 26,098 1,044 2.86 2021 Quicksilver Resources Canada Inc. Campbell River
Cedar LNG Export Development Ltd. 21,900 876 2.40 2020 Haisla FN plus other;
incomplete application Kitimat
Kitsault Energy Ltd. 18,980 949 2.60 2018 Kitsault Energy Ltd. Kitsault
Steelhead LNG Ltd. 36,500 1,460 4.00 2019 Steelhead LNG and Huu-ay-aht FN Port Alberni
Orca LNG Ltd. 29,200 1,168 3.20 2019 Orca LNG Ltd. Floating, Prince Rupert
Canada Stewart Energy Group Ltd. 36,500 1,460 4.00 2017 Canada Stewart
Energy Group Ltd. Stewart
New Times Energy Ltd. 14,600 584 1.60 2019 New Times Energy Ltd.
Floating, Prince Rupert
Total under review West Coast BC 183,778 7,541 20.66
Grand total approved and under review 435,176 16,274 44.59

A CLEAR LOOK AT BC LNG: ENERGY SECURITY, ENVIRONMENTAL IMPLICATIONS AND ECONOMIC POTENTIAL 17
A key responsibility of the National Energy Board is defined in Section 118 of the National Energy Board Act, which states:13
On an application for a licence to export oil or gas, the Board shall satisfy itself that the quantity of oil or gas to be exported does not exceed the surplus remaining after due allowance has been made for the reasonably foreseeable requirements for use in Canada, having regard to the trends in the discovery of oil or gas in Canada.
NEB acceptance letters for the approved LNG export projects reveal that the information to address Section 118 of the act for most of the Canadian proposals was provided by two consult-ants — Ziff Energy and former NEB chair Roland Priddle.
Ziff Energy provided two reports that are frequently mentioned in the applications.14,15 Both predict a rosy future for gas production from shale, but the uncertain nature of the forecasts is highlighted by the reduction in the Canadian supply estimate by 20 per cent in year 2045 between the first and second reports, despite the two reports being only six weeks apart. Ziff suggested LNG exports would be 8.7 bcf/d in one report and 4.9 bcf/d in the second six weeks later (both of these estimates are considerably below the high estimate of exports of the BC government). Priddle also provided documents painting an optimistic picture of future gas sup-plies for Canadians.16
The NEB used the Ziff and Priddle reports to demonstrate that the requirements of Section 118 had been met for several projects, despite the fact that its own forecasts, published later in 2013, after the submission and approval of these projects, contradicted the notion of abundant gas for export. Furthermore, the NEB seems to have considered each application in isolation, as if the other applications it had approved didn’t exist. So it ended up approving 23.9 bcf/d of exports, or 66 per cent more gas than Canada currently produces.
To put it politely, the NEB, as Canada’s energy regulator, does not appear to be doing its job and is putting Canadian domestic energy security needs at risk. It has approved 251 tcf of exports over the 20-25 year life of these projects (see Table 1), yet its own reference case forecast shows that just 17.9 tcf will be available in Canada from 2016 through 2035. In its high case, the NEB suggests only 48 tcf will be available; in its low case, it suggests 15.9 tcf will have to be imported over this period.
Notwithstanding the fact that the purported bonanza of surplus gas for export may not exist, or that it may be difficult to develop at the required production rates, what are some of the other considerations in developing a BC LNG export industry? These centre on the realities of attempt-ing to supply the gas in the light of Canadian needs and the environmental implications of doing so, the alleged environmental benefits of LNG exports and the economic viability of the proposed plants in the face of global competition. A final consideration is the amount of revenue that would be generated for the owners of the resource — the Canadian public.
13 National Energy Board. 2012.14 Ziff Energy. June 2013. 15 Ziff Energy. July 22, 2013.16 Priddle, Roland. July 23, 2013.
To put it politely, the NEB, as Canada’s energy regulator, does not appear to be doing its job and is putting Canadian domestic energy security needs at risk.

Figure 5: BC raw gas production by play from 2000 – 2014
0
0.5
1
1.5
2
2.5
3
3.5
4
4.5
5
2000 2002 2004 2006 2008 2010 2012 2014
Gas
pro
duct
ion
(bill
ion
cubi
c fe
et p
er d
ay)
43%
Rest of BC Peaks in 2002
46%
11%
Cumulative recovery since 1954 Raw gas = 34.8tcf
Marketable gas = 30.3tcf
Proven raw gas reserves = 40.2 tcf
Exports approved to 2040 = 161tcf
Horn RiverMontneyOther BC
18 A CLEAR LOOK AT BC LNG: ENERGY SECURITY, ENVIRONMENTAL IMPLICATIONS AND ECONOMIC POTENTIAL
P A R T 5
BC gas supply
Assuming LNG export terminals will be built, the question becomes where will this gas be sourced from, and what will be the environmental implications of producing it? The great hope in increas-ing BC gas production lies in the Montney and Horn River plays as discussed earlier, with some longer-term potential for the Liard and Cordova Bay plays (to the west and east of the Horn River play, respectively, in Figure 2). These are shale and tight gas plays requiring the application of high volume, multi-stage, hydraulic fracturing of horizontal wells. Figure 5 illustrates gas produc-tion from the Montney and Horn River along with production from all other sources in BC. As can be seen, BC gas production outside the Montney and Horn River is in decline and comprises just 43 per cent of total production.
Note: Twelve-month trailing moving average. Fifty-seven percent of BC gas production now comes from the Montney and Horn River plays. The remainder of BC gas production is in overall decline.
Source: Drillinginfo, December 2014, for production through August 2014.

Table 2: BC raw gas reserves, resources and wells used for estimates, 2012
A CLEAR LOOK AT BC LNG: ENERGY SECURITY, ENVIRONMENTAL IMPLICATIONS AND ECONOMIC POTENTIAL 19
Nearly 26,000 wells have been drilled in BC since 1954, of which 9,423 were producing in August 2014. Of these, 2,060 wells were producing from the Montney and 210 from the Horn River.17 As shown in Figure 5, gas from these two plays collectively dominates BC production, at 57 per cent of the total. The BC Oil and Gas Commission has produced atlases of maps for the Horn River18 and Montney19 illustrating their location and the distribution of key parameters controlling well quality and production. Going forward, an even larger proportion of BC gas production can be expected to be derived from these plays.
Shale gas production from plays like the Horn River and Montney exhibits characteristics in com-mon with shale gas plays in the US,20 where development is generally more advanced. High well- and field-production decline rates mandate high rates of drilling to maintain and/or grow production. Wells require high volumes of water, proppants (sand and/or ceramics used to “prop” open the induced fractures) and other additives. Furthermore, the geology of shale plays is far from uniform. They typically exhibit sweet spots with high productivity and much larger areas of lower quality reservoir rock (the BC Oil and Gas Commission atlases do a good job of illustrating the variability in geology for the Montney and Horn River plays).
The BC Oil and Gas Commission estimates a raw-gas reserve for all of BC of 42.3 trillion cubic feet (tcf)21 and a potentially marketable resource of 442 tcf (of which 416 tcf remains given production to date). Of these, 63 per cent of reserves and 79 per cent of “marketable resources” are in the Montney and Horn River plays. Table 2 illustrates the tally of reserves and resources by play as of 2013. The “reserve” estimates have the highest level of certainty as they have been proven through drilling or are adjacent to drilled lands, and the gas is estimated to be recoverable with current technology and economic conditions. The “marketable resources” for all plays, on the other hand, are highly uncertain, and are inferred to exist only through broad extrapolations of key parameters based on limited drilling.
Play Reserves* (tcf) Marketable resources** (tcf) Wells used in estimate
Horn River 10.7 78 328
Montney 15.6 271 1,440
Liard 0.1 21 3
Cordova Bay 0.2 20 26
Conventional 14.4 52
Deep Basin Cadomin 1.4
Total 42.3 442 (416 remaining)
* BC Oil and Gas Commission. 2013. Hydrocarbon and by-product reserves in British Columbia.
** Montney, Horn River and conventional marketable resources are from Energy briefing note: The ultimate potential of unconventional petroleum from the Montney Formation of British Columbia and Alberta, 2013, at: http://www.empr.gov.bc.ca/OG/Documents/Report%20-%20The%20Ultimate%20Potential%20for%20Unconventional%20Petroleum%20from%20the%20Montney%20Formation%20of%20British%20Columbia%20and%20Alberta.pdf. Marketable resources for the Liard and Cordova Bay plays are calculated assuming that 10 per cent of the gas in-place numbers cited by the BC Oil and Gas Commission in its reserve estimates (see note 21) are recoverable. The remaining marketable resources are 416 tcf, which reflects the 25.8 trillion cubic feet produced from 1954 to the present.
17 From Drillinginfo as of August 2014. Retrieved December 2014.18 BC Oil and Gas Commission. 2014. Horn River Basin play atlas.19 BC Oil and Gas Commission. 2012. Montney Formation play atlas. 20 Hughes, J.D. 2014. 21 BC Oil and Gas Commission. 2013. Hydrocarbon and by-product reserves in British Columbia.
Nearly 26,000 wells have been drilled in BC since 1954, of which 9,423 were producing in August 2014.

20 A CLEAR LOOK AT BC LNG: ENERGY SECURITY, ENVIRONMENTAL IMPLICATIONS AND ECONOMIC POTENTIAL
Notwithstanding the large uncertainties in the estimates reported for marketable resources, the BC government has inflated these numbers by a factor of six in its publicity for LNG:22
British Columbia’s natural gas supply is estimated at over 2,933 trillion cubic feet. To put it in perspective, each year industry extracts about 4 trillion cubic feet of natural gas. Based on the amount of gas industry is able to recover and increased activity, British Columbia has over 150 years worth of natural gas supply. And, new discoveries are being made all the time.
This is a false and irresponsible statement, considering the data from the province’s own BC Oil and Gas Commission. Even the existing numbers quoted are uncertain, let alone 2,933 tcf, which is 70 times actual proven reserves (the BC government later at the same link states that BC has more than 2,900 tcf of “marketable shale gas reserves” which would be more than triple the remaining marketable “resources” of the entire Western Canada Sedimentary Basin, both conventional and unconventional, according to the NEB23).
Two scenarios: Export requirements based on domestic growth or stable production
As noted in Figure 4 above, the NEB reference case projections show that only 17.9 tcf of surplus capacity is available from 2016 through 2035 for exports from Canada, even with a 224 per cent ramp-up in BC gas production. To assess the amount of drilling required to meet the production levels needed for various levels of LNG exports as well as the impact of these exports on future Canadian energy security, two scenarios are utilized:
Scenario 1: The gas supply developed for export is incremental to growth in BC production needed to cover Canadian domestic requirements in the NEB reference case forecast. This is the most aggressive scenario in terms of the amount production would have to rise to supply needed export volumes and the number of wells required to do so.
Scenario 2: The gas supply developed for export is incremental to current BC gas production levels, and all growth in BC production is exported. This is the most conservative scenario and compares the impacts of growing production for export to simply maintaining current BC gas production levels.
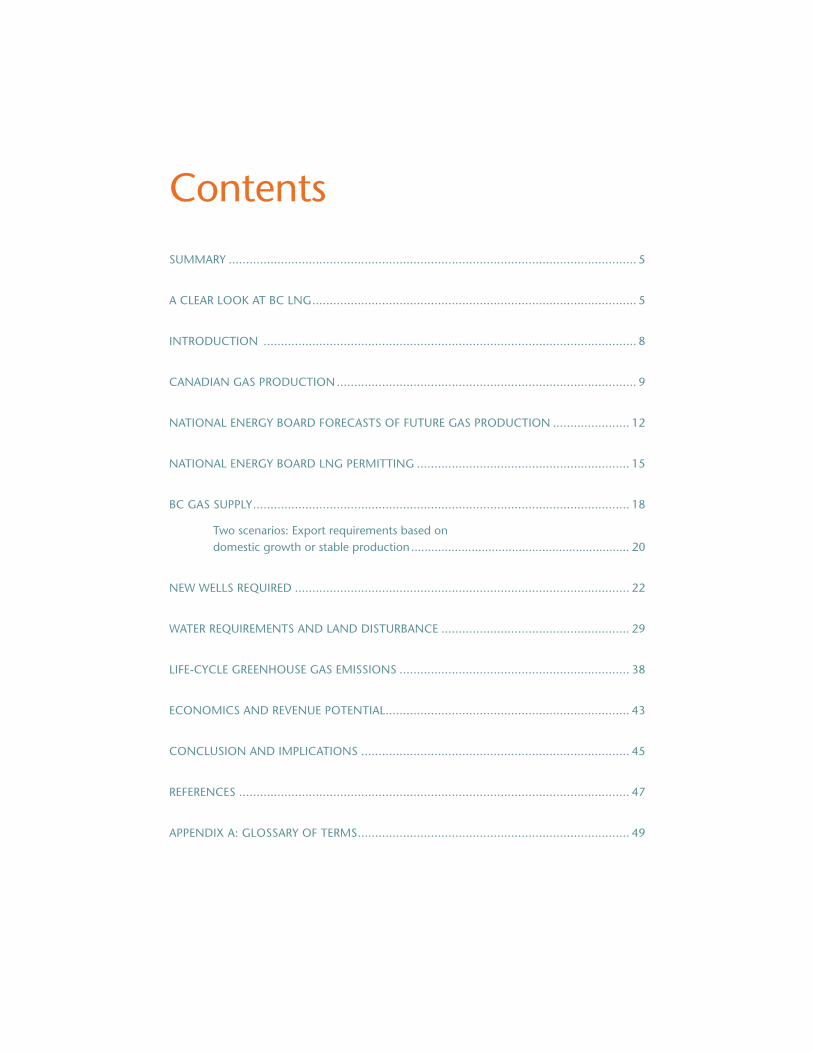
Figure 6 illustrates gas production required for Scenario 1 in order to meet the “high” BC gov-ernment LNG export case of five terminals exporting 82 million tonnes of LNG per year.24 Gas production would have to be ramped up by 542 per cent from current levels if all exports were to come from BC, or by 382 per cent if 25 per cent of exports were to come from Alberta. By 2035, 48 per cent of 2035 Canadian production would go for LNG exports.
22 BC Government. Trade and Invest British Columbia. 23 National Energy Board. November 2013. See p. 50.24 BC Government. August 2014. The “high” BC government case is five terminals exporting 82 megatonnes
of LNG per year.
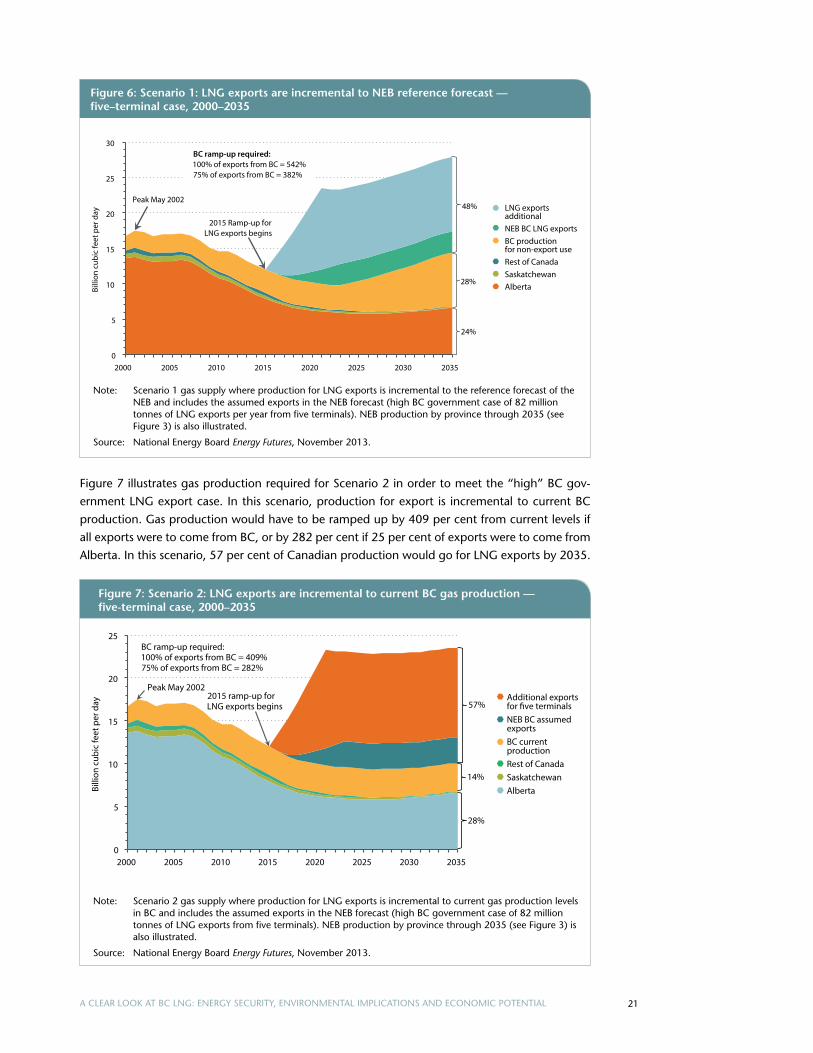
Figure 7: Scenario 2: LNG exports are incremental to current BC gas production — five-terminal case, 2000–2035
0
5
10
15
20
25
2000 2005 2010 2015 2020 2025 2030 2035
Billi
on c
ubic
feet
per
day
2015 ramp-up for LNG exports begins
Peak May 2002
28%
14%
57%
BC ramp-up required: 100% of exports from BC = 409% 75% of exports from BC = 282%
Additional exports for �ve terminalsNEB BC assumed exportsBC current productionRest of CanadaSaskatchewanAlberta
0
5
10
15
20
25
30
2000 2005 2010 2015 2020 2025 2030 2035
Billi
on c
ubic
feet
per
day
2015 Ramp-up for LNG exports begins
Peak May 2002
24%
28%
48%
BC ramp-up required: 100% of exports from BC = 542% 75% of exports from BC = 382%
LNG exports additionalNEB BC LNG exportsBC productionfor non-export useRest of CanadaSaskatchewanAlberta
Figure 6: Scenario 1: LNG exports are incremental to NEB reference forecast — five–terminal case, 2000–2035
A CLEAR LOOK AT BC LNG: ENERGY SECURITY, ENVIRONMENTAL IMPLICATIONS AND ECONOMIC POTENTIAL 21
Note: Scenario 1 gas supply where production for LNG exports is incremental to the reference forecast of the NEB and includes the assumed exports in the NEB forecast (high BC government case of 82 million tonnes of LNG exports per year from five terminals). NEB production by province through 2035 (see Figure 3) is also illustrated.
Source: National Energy Board Energy Futures, November 2013.
Figure 7 illustrates gas production required for Scenario 2 in order to meet the “high” BC gov-ernment LNG export case. In this scenario, production for export is incremental to current BC production. Gas production would have to be ramped up by 409 per cent from current levels if all exports were to come from BC, or by 282 per cent if 25 per cent of exports were to come from Alberta. In this scenario, 57 per cent of Canadian production would go for LNG exports by 2035.
Note: Scenario 2 gas supply where production for LNG exports is incremental to current gas production levels in BC and includes the assumed exports in the NEB forecast (high BC government case of 82 million tonnes of LNG exports from five terminals). NEB production by province through 2035 (see Figure 3) is also illustrated.
Source: National Energy Board Energy Futures, November 2013.

22 A CLEAR LOOK AT BC LNG: ENERGY SECURITY, ENVIRONMENTAL IMPLICATIONS AND ECONOMIC POTENTIAL
P A R T 6
New wells required
The question of how many wells would have to be drilled to maintain and grow gas production to meet the demands of a number of LNG export terminals is fundamental in determining the socio-economic and environmental impacts on the area from which the gas is to be sourced. An analysis of well production data from the Horn River, Montney and the remainder of BC allowed the determination of well- and field-decline rates, average well quality, the number of wells that need to be drilled to make up for field decline and the number of wells that would be required to grow production to the levels needed to for various LNG export cases. This analysis utilized a commercial database of well production data obtained from Drillinginfo Inc., which contains production and a wide variety of other data updated on a monthly basis for all oil and gas wells in Western Canada. Table 3 illustrates the key fundamentals determined from this analysis used in projecting future well requirements.
Play
August 2014
raw gas production (bcf/day)
% of total
production
Cumulative production
(tcf)
Number of currently
producing wells
Total number of wells
since 1954
3-year well
decline (%)
Annual field
decline (%)
2013 First year Average
production (mcf/day)
New wells per year
needed to stay flat
Horn River horizontal 0.47 10.37 0.72 210 259 70.67 23.00 5,590 19
Montney horizontal 2.21 48.38 2.54 1526 1,788 62.39 21.05 2,418 193
Other BC 1.83 40.11 30.87 7153 22,550 69.49 7.82 1,878 76
BC total 4.56 100.00 34.84 9423 25,890 66.39 14.36 2,413 288
Key fundamentals of well and field decline used in calculating the number of new wells that will need to be drilled to meet various scenarios of LNG exports. Note that vertical Montney wells, which amount to 1.1 per cent of current BC gas production, are not shown because vertical wells are unlikely to be a significant part of future production growth.
Table 3: Well and field decline calculations

A CLEAR LOOK AT BC LNG: ENERGY SECURITY, ENVIRONMENTAL IMPLICATIONS AND ECONOMIC POTENTIAL 23
As shown in Table 3, if BC is merely to maintain current gas production levels, 288 new wells must be drilled each year. The first factor in determining how much additional gas must be produced to fuel a new LNG export industry is the question of how many LNG terminals will be built. At the time of writing (May 2015), no company had committed funds for construction, so this question is still open. In August 2014, the BC government suggested two scenarios, with 50 million and 82 million metric tonnes of export capacity by 2020.25 An earlier document (May 2014) commissioned by the BC government from KPMG assumed two scenarios of 34 million and 82 million tonnes per annum.26 In April 2014, the Canadian Centre for Policy Alternatives (CCPA) had produced a report on expected revenues from LNG development and used three scenarios of 17.7 million, 43.3 million and 82 million tonnes per annum.27 None of these scenarios assumes that more than five large LNG terminals will be built of the 12 that NEB has approved, let alone the additional seven terminals that are under review.
A second factor in how much gas must be produced is the issue of shrinkage due to impurities in the raw gas in its conversion to marketable gas. In 2012, the shrinkage factor for the Horn River and Montney plays averaged 13 per cent, meaning that whatever gas was produced at the wellhead would be reduced by 13 per cent through processing and cleanup by the time it was ready for sale.28
A third factor in determining the amount of gas that must be produced is the energy-intensive nature of the LNG supply chain itself. CO2 emissions from the combustion of gas from the well-head to the final point of use amount to 25.8 per cent of the total emissions the gas will emit after it is burned to generate electricity (Table 4). Assuming that the domestic portion of the supply chain is accounted for in the shrinkage factor (gas extraction, processing and domestic transport), the LNG portion of the supply chain consumes 20.4 per cent of the marketable gas produced (assuming gas is used as the power source for liquefaction and regasification and that boil-off gas is reused as fuel during tanker transport). This means that considerably more marketable gas must be produced than is actually delivered to the point-of-use in order to account for the 20.4 per cent used to fuel the LNG supply chain.
25 BC Government. August 2014. 26 KPMG. May 2014.27 Lee, M. April 2014. 28 BC Government. 2013. Average shrinkage factor reported for Horn River and Montney plays.

24 A CLEAR LOOK AT BC LNG: ENERGY SECURITY, ENVIRONMENTAL IMPLICATIONS AND ECONOMIC POTENTIAL
Prince Rupert to Shanghai, China
CO2 kg/MWh CO2 (%) per MWh
Natural gas extraction 4.5 0.8
Natural gas processing 20.7 3.7
Domestic pipeline transport 5.3 0.9
Liquefaction 64.7 11.5
Tanker/rail transport 42.4 7.5
Tanker berthing & deberthing 1.5 0.3
LNG regasification 6.2 1.1
Power plant operations 414.7 73.7
Electricity T&D 2.8 0.5
Total 562.8 100.0
Domestic portion 30.5 5.4
LNG portion 114.8 20.4
Power plant and T&D 417.5 74.2
Approximately 20.4 per cent of the marketable gas produced is consumed in the LNG supply chain before delivery to the end user.
Putting this all together, for every unit of gas delivered at a power plant in China via LNG, approximately 1.44 units of raw gas have to be produced at the wellhead in northeast BC or northwestern Alberta.
The number of wells required to produce the gas for export also depends on which play the gas will be sourced from. Horn River–class wells are more than twice as productive as Montney-class wells (Table 3), but the Montney likely has much more recoverable gas than the Horn River (Table 2). The following estimates of the number of wells required assume that 30 per cent of new production comes from Horn River–class wells and 70 per cent comes from Montney-class wells.29
29 “Horn River–class” refers to wells of high productivity — they may also be drilled in the Liard or Cordova Bay plays. Similarly, wells of Montney-class productivity may be drilled in the Alberta portion of the Montney or other BC plays.
Table 4: The CO2 portion of GHG emissions attributable to combustion of natural gas during the wellhead to power plant LNG life cycle

Case
Million tonnes LNG
per year delivered
Bcf/day LNG
delivered
Marketable gas before LNG losses (bcf/day)
Raw gas production
needed (bcf/day)
Peak drilling rate in 2021
(wells/year)
Maintain production
2022–2040
(wells/year)
Total wells 2014–2040
Raw gas production
2014–2040 (tcf)
Times historical
production (1954–2014)
Times proven
reserves as of 2013
BC govthigh
82.0 10.8 13.5 15.6 2,153 1,452–1,806 43,773 196 6.0 4.6
BC govt medium
50.0 6.6 8.3 9.5 1,436 1,007–1,454 32,136 146 4.5 3.5
CCPA medium 43.3 5.7 7.2 8.2 1,282 912–
1,359 29,642 136 4.2 3.2
KPMG medium 34.0 4.5 5.6 6.5 1,078 785–
1,232 26,317 121 3.7 2.9
CCPA low 17.7 2.3 2.9 3.4 702 552–988 20,221 95 2.9 2.2
No terminals 0 0.0 4.0–
8.44.6–9.7 309 309–
756 13,848 68 2.1 1.6
Number of wells required per year in Scenario 1 for various LNG export cases at peak drilling rates in 2021 and wells required to maintain production after reaching needed production levels (note that wells required to maintain production escalate after 2021 due to the fact that production for domestic requirements is also growing in the NEB forecast). Also shown are the total number of new wells required over 2014–2040 and the cumulative amount of raw gas produced for each case. The ratio of cumulative production required for each export case to the total production of BC to date, and to current BC proven raw gas reserves, is also illustrated, along with a “no terminals” case, which is the number of wells and production needed to meet the NEB reference forecast even if no terminals are built.
Table 5: Scenario 1: Production needed for LNG exports is incremental to NEB reference case production forecast without LNG exports
A CLEAR LOOK AT BC LNG: ENERGY SECURITY, ENVIRONMENTAL IMPLICATIONS AND ECONOMIC POTENTIAL 25
Table 5 illustrates, for Scenario 1 above, the number of wells that need to be drilled at peak rates during the ramp-up to production levels required for various cases of LNG exports and the number of wells that need to be drilled to maintain production each year after the required production levels are reached. In order to meet export requirements, somewhere between close to double and nearly triple the number of gas wells drilled in BC from 1954 to the present would need to be drilled by 2040 to meet the various LNG export cases. Depending on the LNG export case, cumulative gas production through 2040 will need to be between 2.9 and 6.0 times the total gas production of BC from 1954 to present, and 2.2 to 4.6 times the current known proven BC raw gas reserves (42.3 tcf—see Table 2).

-14
-12
-10
-8
-6
-4
-2
0
2
4
6
8
10
12
2000 2005 2010 2015 2020 2025 2030 2035
Billi
on c
ubic
feet
per
day
-18.2 tcf -0.6 tcf
-35.1 tcf
17.9 tcf
-27.9 tcf
-68.8 tcf
Cumulative 2016–2035 surplus/de�cit illustrated
CCPA lowKPMG mediumCCPA mediumBC government mediumBC government highNEB reference case without exports
Figure 8: Scenario 1: Net natural gas available for export, 2000–2035
26 A CLEAR LOOK AT BC LNG: ENERGY SECURITY, ENVIRONMENTAL IMPLICATIONS AND ECONOMIC POTENTIAL
Figure 8 illustrates the cumulative surplus/deficit of Canadian net export capacity in the various LNG export cases shown in Table 5, as well as the production rate differentials that would be required to produce needed volumes for export. If there are no LNG exports and BC achieves the production growth forecast in the NEB reference case, for example, Canada would have a cumulative surplus of net export capacity amounting to 17.9 tcf over the period 2016–2035. This is the “no terminals” case in Table 5, which would still require a significant ramp-up in drilling to meet forecast BC growth, such that 13,800 new wells would be needed by 2040.
One large LNG export terminal, as in the “CCPA low” case, would effectively eliminate any surplus Canadian net export capacity in this scenario and necessitate drilling 20,200 new wells by 2040 (the NEB reference case starting point in Figure 8 assumes no exports). In the “BC government high” case, which assumes five terminals exporting 82 megatonnes of LNG per year, Canadian net export capacity would be in a deficit of 68.8 tcf compared to the NEB forecast, which would require increasing production by up to 12 bcf/d over the 2016–2035 period to offset. To eliminate this deficit and meet NEB production projections, 43,700 new wells would need to be drilled by 2040. In this case, 48 per cent of all Canadian production would be dedicated to LNG exports by 2035 (Figure 6).
Note: Canadian net export capacity in the LNG export cases illustrated in Table 5 relative to the NEB refer-ence case without assumed exports. The cumulative surplus/deficit of Canadian net export capacity for the various cases is shown over the 2016–2035 period, as well as the production rate differential that would be required to make up needed gas volumes.
Source: National Energy Board Energy Futures 2013 and NEB personal communication, December 2014.
Table 6 illustrates, for Scenario 2 above, the number of wells that need to be drilled at peak rates during the ramp-up to production levels required for various cases of LNG exports and the number of wells that need to be drilled to maintain production each year after the required production levels are reached. In this scenario, it is assumed that current levels of production would be maintained for domestic use but that all increases in BC production noted in the NEB reference case forecast would go for export. Between 14,248 and 37,800 wells will need to be drilled by 2040 to meet the various LNG export cases. Cumulative gas production through 2040
One large LNG export terminal, as in the “CCPA
low” case, would effectively eliminate
any surplus Canadian net export capacity
in this scenario and necessitate
drilling 20,200 new wells by 2040

Table 6: Number of wells required per year in Scenario 2
Case
Million tonnes LNG
per year delivered
Bcf/day LNG
delivered
Marketable gas before LNG losses (bcf/day)
Raw gas production
needed (bcf/day)
Peak drilling Rate in 2021
(wells/year)
Maintain production
2022–2040
(wells/year)
Total wells 2014–2040
Raw gas production
2014–2040 (tcf)
Times historical
production (1954–2014)
Times proven
reserves as of 2013
BC govt high 82.0 10.8 13.5 15.6 2,137 1,435 37,800 173 5.3 4.1
BC govt medium 50.0 6.6 8.3 9.5 1,419 991 26,163 123 3.8 2.9
CCPA medium 43.3 5.7 7.2 8.2 1,266 895 23,669 113 3.5 2.7
KPMG medium 34.0 4.5 5.6 6.5 1,061 768 20,344 98 3.0 2.3
CCPA low 17.7 2.3 2.9 3.4 685 536 14,248 72 2.2 1.7
No terminals 0 0.0 4.0 4.6 292 292 7,875 45 1.4 1.1
Number of wells required per year in Scenario 2 for various LNG export cases at peak drilling rates in 2021 and wells required to maintain production after reaching needed production levels. Also shown are the total number of new wells required over 2014–2040 and the cumulative amount of raw gas produced for each case. This scenario is relative to simply maintaining the current level of gas production in BC and assumes the NEB reference case for all other provinces. The ratio of cumulative production required for each export case to the total production of BC to date and current BC proven raw gas reserves is also illustrated, along with the number of wells and production needed to maintain current BC production levels (“no terminals” case).
A CLEAR LOOK AT BC LNG: ENERGY SECURITY, ENVIRONMENTAL IMPLICATIONS AND ECONOMIC POTENTIAL 27
will need to be between 2.2 and 5.3 times the total gas production of BC from 1954 to present, and 1.7 to 4.1 times the current known proven BC gas reserves.
Figure 9 illustrates the cumulative surplus/deficit of Canadian net export capacity for Scenario 2 (i.e. relative to flat BC production) in the various LNG export cases shown in Table 6. Also shown are the production rate differentials that would be required to produce needed volumes for export. In this scenario, Canada would retain a small surplus of supply over demand out to 2028 if there are no LNG exports. This is the “no terminals” case in Table 6, which would still require drilling 7,875 new wells by 2040 to maintain current production levels.
LNG exports would necessitate a major ramp-up in drilling, ranging from 14,200 wells in the “CCPA low” case (one large terminal) to 37,800 wells in the “BC government high” case (five terminals), by 2040. In the “BC government high” case, Canadian net export capacity would be in a deficit of 82.5 tcf over the 2016–2035 period compared to simply maintaining current production, which would require increasing production by up to 14 bcf/d over the 2016–2035 period to overcome. In this case, 57 per cent of all Canadian production by 2035 would be dedicated to LNG exports (Figure 7).

-16
-14
-12
-10
-8
-6
-4
-2
0
2
4
6
8
10
12
2000 2005 2010 2015 2020 2025 2030 2035
Billi
on c
ubic
feet
per
day
-32.0 tcf -14.3 tcf
-48.8 tcf
4.1 tcf
-41.6 tcf
-82.5 tcf
Cumulative 2016-2035 surplus/de�cit illustrated
CCPA lowKPMG mediumCCPA mediumBC government mediumBC government highNEB reference case with �at BC production
Figure 9 Scenario 2: Net natural gas available for export, 2000–2035
28 A CLEAR LOOK AT BC LNG: ENERGY SECURITY, ENVIRONMENTAL IMPLICATIONS AND ECONOMIC POTENTIAL
Note: Canadian net export capacity in the LNG export cases illustrated in Table 6 assuming that BC production will be maintained at current levels and using the NEB reference case for all other provinces. The cumulative surplus/deficit of Canadian net export capacity for the various cases is shown over the 2016–2035 period, as well as the production rate differential that would be required to make up needed gas volumes.
Source: National Energy Board Energy Futures 2013 and NEB personal communication, December 2014
By any measure, the LNG exports planned by the BC government are extremely aggressive, and they are based on tenuous assumptions of available gas resources and the ability of the industry to ramp up and sustain production at the levels required. They also raise serious questions for long-term Canadian energy security, as any supply shortfalls once LNG terminals are built and export volumes committed would need to be made up by imports.
Can industry increase Canadian production by 12 bcf/d over and above the already aggressive growth forecast in the NEB’s reference case to meet the BC government’s hopes? Assuming so implies, in the high case, that nearly five times currently known BC gas reserves will be proved and produced by 2040, which would represent six times as much gas as has been recovered in BC’s entire oil and gas history. It also implies that the capital will be there to drill the wells and develop the infrastructure to move the gas to market (hundreds of billions of dollars of investment) and that environmental and other impacts are surmountable or without consequence. Although it is certain that additional reserves will be proven through drilling unproved resources, how much, where and at what cost remains uncertain. Assuming this could be done, what are the collateral environmental impacts of doing so?

A CLEAR LOOK AT BC LNG: ENERGY SECURITY, ENVIRONMENTAL IMPLICATIONS AND ECONOMIC POTENTIAL 29
P A R T 7
Water requirements and land disturbance
A major public concern in some parts of the US is the amount of water and the chemicals and other additives used in the fracking process, as well as the potential for contamination of surface water through both surface casing failures and improper disposal of fracking waste water. The amount of water consumed depends on the play but is generally about five million gallons per well in the US. Approximately 30 per cent of this water is returned to the surface and must be disposed of, usually through injection in deep disposal wells. The BC Oil and Gas Commission reports that the average Horn River and Montney wells used 16.9 million and 2.4 million US gallons of water, respectively, in 2012.30 A review of randomly selected 2014 wells illustrated in Table 7 reveals that this has increased more recently to 25.6 million gallons for the Horn River and 3.5 million gallons for the Montney. Conventional wells in other northeastern BC fields have much lower water requirements.
30 BC Oil and Gas Commission. 2012. Hydrocarbon and by-product reserves in British Columbia.

30 A CLEAR LOOK AT BC LNG: ENERGY SECURITY, ENVIRONMENTAL IMPLICATIONS AND ECONOMIC POTENTIAL
Table 7: Water consumption in randomly selected 2014 wells in the Horn River and Montney plays.31
Well ID Play Operator Completion date
Water m3 US gallons
HZ Komie C-N001-J/094-O-08 Horn River Nexen 13/08/2014 67,406 17,806,722
HZ Komie C-H001-J/094-O-08 Horn River Nexen 25/08/2014 52,859 13,963,815
HZ Komie C-P001-J/094-O-08 Horn River Nexen 21/08/2014 66,674 17,613,218
HZ Kiwigana C-F031-A/094-O-06 Horn River Encana 25/02/2014 97,878 25,856,458
HZ Kiwigana C-E031-A/094-O-06 Horn River Encana 28/02/2014 113,752 30,049,866
HZ Kiwigana C-D031-A/094-O-06 Horn River Encana 12/06/2014 134,252 35,465,219
HZ Kiwigana C-C031-A/094-O-06 Horn River Encana 28/02/2014 100,534 26,557,961
HZ Kiwigana C-B031-A/094-O-06 Horn River Encana 28/02/2014 141,255 37,315,386
Horn River average 96,826 25,578,581
HZ Town D-055-H/094-B-16 Montney Progress 08/09/2014 22,742 6,007,833
HZ Caribou A-B080-G/094-G-07 Montney Progress 25/08/2014 16,608 4,387,335
HZ W Beg B-073-E/094-G-01 Montney Progress 16/08/2014 18,351 4,847,810
HZ Sunset C01-12-080-18 Montney Tourmaline 10/07/2014 8,123 2,145,745
HZ Sundown B15-32-077-17 Montney Murphy 06/09/2014 7,391 1,952,507
HZ Groundbirch N07-27-080-20 Montney Shell 11/06/2014 9,506 2,511,253
HZ Groundbirch L07-27-080-20 Montney Shell 28/06/2014 10,148 2,680,824
Montney average 13,267 3,504,758
The rate of water consumption is thus a function of the play the wells are drilled in. Figure 10 illustrates the number of wells projected to be drilled in the Horn River, Montney and the rest of BC over the period 2014–2040 (30 per cent of new production is assumed to come from the Horn River and 70 per cent from the Montney). Drilling is assumed to start ramping up in 2016 and reach a peak rate in 2021 when the required production rate is reached. Although the estimate illustrated in Figure 10 is for Scenario 1 and the high export case, the drilling rates for all cases, including drilling rates if no LNG terminals are constructed, are given for both scenarios in tables
31 Fracfocus database. Retrieved December 27, 2014. Fracfocus is a database of the water, proppants and chemicals used for hydraulically fractured wells. Industry participation is voluntary.

A CLEAR LOOK AT BC LNG: ENERGY SECURITY, ENVIRONMENTAL IMPLICATIONS AND ECONOMIC POTENTIAL 31
5 and 6. Peak drilling rate is 2,153 wells per year in 2021 and falls thereafter to 1,450 wells per year before slowly rising to about 1,800 wells per year as BC gas production not intended for LNG exports grows. The peak drilling rate is similar to the BC Oil and Gas Commission’s estimate of 2100 wells per year in 2019,32 but the drilling rate is higher in later years, reflecting the ramp-up in non-export BC production in the NEB reference case. To put this in perspective, the drilling rate in the current shale oil boom in North Dakota is about 2,000 wells per year.33 Depending on the LNG export case, actual peak drilling rates will range from 702 to 2,153 wells per year for Scenario 1 and from 685 to 2,137 wells per year for Scenario 2.
Note: The total number of wells and cumulative production by play over the 2014–2040 period is also illustrated. Depending on the LNG export case, actual peak drilling rates will range from 702 to 2,153 wells per year for Scenario 1 and from 685 to 2,137 wells per year for Scenario 2.
Source: National Energy Board Energy Futures, November 2013.
High volume hydraulically fractured horizontal wells such as those in the Horn River bear little resemblance to the conventional vertical wells drilled in earlier years. To supply an average of 25 million gallons of water per well, 2,300 truck trips are required, followed by a further 700 truck trips to remove the fracking waste water produced in the process.34 In addition, Horn River wells use 3,700 tons of sand35 and/or other proppants per well along with other chemical additives that must be hauled. Montney wells are much less intensive but still require more than 400 truck trips to deliver and dispose of water plus additional trips to haul the 1,500 tons of sand and other additives required per well.
The rate of water consumption required for drilling in the high LNG export case is illustrated in Figure 11. A maximum consumption rate of 55 million cubic metres per year is reached at peak drilling rates in 2021, which is equivalent to 22,000 Olympic-sized swimming pools, or roughly half the consumption rate of the cities of Vancouver or Calgary. The BC government speculates
32 BC Government. August 2014.33 Hughes, J.D. 2014.34 This assumes water is delivered by very large water trucks holding 11,000 US gallons per load and that 30
per cent of the injected frackwater is returned to the surface for disposal or treatment.35 BC Oil and Gas Commission. 2012. Hydrocarbon and by-product reserves in British Columbia.
Figure 10: Drilling rates for Scenario 1 by play assuming the high export case (five terminals exporting 82 megatonnes per year)
0
500
1,000
1,500
2,000
2,500
2014 2019 2024 2029 2034 2039
Dril
ling
rate
(wel
ls p
er y
ear)
Peak drilling rate 2021
Total = 35,236 Production = 128 tcf (65%)
Total = 6,485 Production = 50 tcf (26%)
Total = 2052 Production = 18 tcf (9%)
Total wells = 43,773 Total production = 196 tcf
Montney horizontal wellsHorn River horizontal wellsOther BC wells

Figure 11: Water consumption for two LNG export cases
City of VancouverCity of CalgaryScenario 1: High caseScenario 2: High caseScenario 1: Low caseScenario 2: Low case
0
20
40
60
80
100
120
2014 2019 2024 2029 2034 2039
Wat
er c
onsu
mpt
ion
(mill
ion
cubi
c m
etre
s pe
r yea
r)
City of Calgary
High case
Low case
City of Vancouver
32 A CLEAR LOOK AT BC LNG: ENERGY SECURITY, ENVIRONMENTAL IMPLICATIONS AND ECONOMIC POTENTIAL
that some of this water would be recovered from deep saline sources and from recycling, such that only two-thirds would be from surface water, and that one-quarter of the wells might be drilled in adjacent Alberta, further reducing the draw on BC resources. It also suggests that the water requirement is a very small part of the total runoff in northeastern BC (0.04 per cent).36 However, comparing fracking water requirements to total northeast BC runoff is irrelevant, for water will be sourced as close to the point of use as possible to reduce trucking costs and the area where drilling will focus is only about 10 per cent of the total area of northeastern BC. Water use will thus be much more localized and hence comprise a much larger proportion of available surface water in drilling areas than implied in BC government literature. Furthermore, water sup-ply varies considerably over the seasons, hence demand as a portion of available supply will be higher during cyclical dry periods or times of drought.
Note: Water consumption for two LNG export cases (the “CCPA low” case and the “BC government high” case) and the two scenarios over 2014–2040 compared for scale to water consumption in the City of Vancouver (630,000 residents) and the City of Calgary (1.15 million residents). Depending on the LNG export case, peak water consumption ranges from 16 million to 55 million cubic metres per year in Scenario 1 (Table 9) and 15 million to 54 million cubic metres per year in Scenario 2 (Table 10).
Source: National Energy Board Energy Futures, November 2013.
Land use disturbance from drilling includes the area cleared for well pads and the roads and pipelines required to connect the well pads to the main gathering infrastructure. Other impacts are land cleared for facilities and seismic work.37 The BC government suggests that up to 16 wells per pad are possible in the Horn River and up to 20 wells per pad are possible in the Montney.38 A review of recent drilling data in both the Horn River and Montney suggests that such well densities are certainly not typical in the current development of these plays.39
36 BC Government. August 2014.37 “Seismic work” refers to the clearing of right-of-ways to collect data on the configuration of subsurface
strata through seismic testing.38 BC Oil and Gas Commission. 2012. Hydrocarbon and by-product reserves in British Columbia.39 Review of all wells in the Horn River and Montney plays drilled to September 2014 in the Drillinginfo
database for northeastern BC.

A CLEAR LOOK AT BC LNG: ENERGY SECURITY, ENVIRONMENTAL IMPLICATIONS AND ECONOMIC POTENTIAL 33
The BC government provided a table of oil and gas land disturbance data to the Treaty 8 First Nations in September 2014, which is reproduced in Table 8. These data suggest that well pads make up just 8.5 per cent of the area of total disturbance associated with oil and gas develop-ment, roads and pipelines make up 23.9 per cent and 6.4 per cent, respectively, and seismic disturbance makes up 60.7 per cent. The BC government points out that because much of the area has been covered with seismic lines this portion of the land disturbance equation will be much reduced in the future.
Table 8: Surface land disturbance attributable to oil and gas development on Treaty 8 First Nations lands through 2013 and projected to 2025 40
Treaty 8 First Nation
Total disturbance to 2013 (square kilometres)
Disturbance to 2013 (%)
BC government disturbance 2013–2025
(sq. km)
BC government
total disturbance to 2025 (%)
Area Well pads Pipelines Roads Facilities Seismic Total
Blueberry 19,717 89.1 39.5 182 3.0 403.4 717.0 3.6 16.8 3.7
Dene Tha A 18,758 39.2 28.4 160.8 1.6 247.6 477.6 2.5 3.0 2.6
Dene Tha B2 20,923 33.4 21.9 131.8 3.3 319.5 509.9 2.4 18.9 2.5
Doig 15,553 105.1 59.7 196.9 1.8 368.4 731.9 4.7 4.6 4.7
Fort Nelson 75,779 71.2 56.1 316.3 5.3 877.3 1,326.2 1.8 25.6 1.8
Halfway 81,163 43.8 28.8 107.1 2.9 297.8 480.4 0.6 19.5 0.6
McLeod Lake 52,589 52.1 58.6 125.2 4.6 375.7 616.2 1.2 35.2 1.2
Prophet 48,484 56.3 38.3 192.7 2.3 585.7 875.3 1.8 4.7 1.8
Saulteau 51,372 56.7 57.2 137.5 4.9 407.2 663.5 1.3 36.4 1.4
West Moberly 74,302 60 63.9 147.3 5.4 432.0 708.6 1.0 40.7 1.0
Total 45,8640 606.9 452.4 1697.6 35.1 4,314.6 7,106.6 1.5 205.4 1.6
% of total disturbance 8.5 6.4 23.9 0.5 60.7 100.0 2.8
40 BC Government. LNG future scenarios. Document provided to LNG Project First Nation Working Group members September 22, 2014.

60 km
Northern Montney 4200 square km
Heritage Montney 7800 square km Horn River ‘A’ Pool
5000 square km
30 km
34 A CLEAR LOOK AT BC LNG: ENERGY SECURITY, ENVIRONMENTAL IMPLICATIONS AND ECONOMIC POTENTIAL
The land use impacts of increased natural gas production will be concentrated in areas deemed to be prospective from drilling to date, and not visited on the entire northeastern BC region as im-plied in the surface land use disturbance calculations of the BC government.41 Figure 12 illustrates the main areas of drilling in the Horn River and Montney plays. Together these areas amount to about 17,000 square kilometres, or less than 10 per cent of the total area of northeastern BC.
Some drilling will certainly occur outside of these areas, but most will occur in the area of proven potential shown.
Figure 12: Prospective area & pool outlines for the Montney & Horn River plays 42
Note: The combined area of these plays is about 17,000 square kilometres.
Table 9 illustrates land disturbance from 2014 through 2040 for Scenario 1 in the various LNG export cases, along with the required rates of water consumption, assuming 10 wells will be drilled per well pad and that drilling in the Montney is in BC only. This assumes each well pad would occupy four hectares and that three kilometres of new roads and 3.5 kilometres of new pipelines will be associated with each new well pad.43 The “high” LNG export case would see 4.2 per cent of the land area in the Horn River and Montney plays disturbed, assuming there would be no impact from further seismic activity or land clearing for other facilities, and it does not include historical disturbance to date. Even if no export terminals are built, simply ramping up BC production to meet the NEB reference case forecast would require disturbing 1.3 per cent of the land and the consumption of up to one-third of the peak water requirement of the high export case. In this scenario, meeting the requirements of the various LNG export cases would require increasing land disturbance by between 46 per cent and 216 per cent and increasing peak water consumption by between 128 per cent and 223 per cent over simply meeting the NEB reference case forecast growth without exports.
41 BC Government. August 2014.42 BC Oil and Gas Commission. 2012, 2014. Montney Formation and Horn River Basin play atlases. 43 BC Oil and Gas Commission. December 23, 2014. Roads and pipelines are assumed to have, respectively,
20-metre-wide and 18-metre-wide right-of-ways.

A CLEAR LOOK AT BC LNG: ENERGY SECURITY, ENVIRONMENTAL IMPLICATIONS AND ECONOMIC POTENTIAL 35
Case
Million tonnes LNG
per year delivered
Number of wells
2014–2040
Well pads (sq. km)
Roads (sq. km)
Pipelines (sq. km)
Total disturbance
(sq. km)
Disturbance of high
potential areas 2014–
2040 (%)
Peak water use in 2021 (million
cubic metres
per year)
Water use 2022–2040
(million cubic
metres per year)
BC government high 82.0 43,773 175.1 262.6 275.8 713.5 4.2 54.6 36.4–48.5
BC government medium 50.0 32,136 128.5 192.8 202.5 523.8 3.1 35.4 24.2–36.3
CCPA medium 43.3 29,642 118.6 177.9 186.7 483.2 2.8 31.2 21.6–33.7
KPMG medium 34.0 26,317 105.3 157.9 165.8 429.0 2.5 25.7 18.1–30.2
CCPA low 17.7 20,221 80.9 121.3 127.4 329.6 1.9 15.7 11.8–23.9
No terminals 0 13,848 55.4 83.1 87.2 225.7 1.3 5.1 5.1–16.9
Scenario 1: land disturbance for 2014–2040 development in various LNG export cases assuming that 10 wells will be drilled per pad Also indicated are the number of wells to be drilled and the rates of water consumption required. A “no terminals” case is also included, illustrating the land disturbance and water consumption impacts of ramping up BC gas production to meet the NEB reference forecast.
Table 10 illustrates land disturbance from 2014 through 2040 for Scenario 2 in the various LNG export cases, along with the required rates of water consumption, assuming 10 wells will be drilled per well pad. In the “high” LNG export case, 3.6 per cent of the land area in the Horn River and Montney plays would be disturbed, assuming there would be no impact from further seismic activity or land clearing for other facilities. If no export terminals are built, maintaining current BC production would require disturbing 0.8 per cent of the land and the consumption of less than one-tenth of the water needed in the high export case at peak requirements. In this scenario, meeting the requirements of the various LNG export cases would require increasing land disturbance by between 81 per cent and 380 per cent and increasing peak water consumption by between 227 per cent and 1,066 per cent over simply maintaining current BC production.
Table 9 Scenario 1: Production needed for LNG exports is incremental to NEB reference case production

36 A CLEAR LOOK AT BC LNG: ENERGY SECURITY, ENVIRONMENTAL IMPLICATIONS AND ECONOMIC POTENTIAL
In summary, the NEB reference case forecast of increasing BC production by 224 per cent by 2035, which assumes the development of one LNG export terminal, is very aggressive and such a production increase would have substantial impacts. A further ramp-up in production to meet a five-terminal export case would have correspondingly higher impacts. Compared to maintaining BC production at current levels, meeting both the NEB growth forecast and the various LNG ex-port cases would require increasing land disturbance by between 157 per cent and 456 per cent and increasing water consumption at peak rates by between 415 per cent and 1,076 per cent.
The literature offered by the BC government to the public is somewhat disingenuous when it comes to estimating the amount and intensity of land disturbance and water consumption in the development of upstream supply for LNG exports:44
• It states that all well pads developed in northeastern BC through 2013 occupy just 308.9 square kilometres, whereas in a separate submission to the First Nations it states that well pads occupy 606.9 square kilometres just in First Nations territory alone (see Table 8), which is only one-quarter of the area it ascribed to northeastern BC.
44 BC Government. August 2014.
Case
Million tonnes LNG
per year delivered
Number of wells
2014–2040
Well pads (sq. km)
Roads (sq. km)
Pipelines (sq. km)
Total disturbance
(sq. km)
Disturbance of high
potential areas 2014–
2040 (%)
Peak water use in 2021
(million cubic
metres per year)
Water use 2022–2040
(million cubic
metres per year)
BC government high
82.0 37,800 151.2 226.8 238.1 616.1 3.6 54.2 35.9
BC government medium
50.0 26,163 104.7 157.0 164.8 426.5 2.5 34.9 23.7
CCPA medium 43.3 23,669 94.7 142.0 149.1 385.8 2.3 30.8 21.1
KPMG medium 34.0 20,344 81.4 122.1 128.2 331.6 2.0 25.3 17.7
CCPA low 17.7 14,248 57.0 85.5 89.8 232.2 1.4 15.2 11.3
No terminals 0 7,875 31.5 47.3 49.6 128.4 0.8 4.6 4.6
Scenario 2: land disturbance for 2014–2040 development in various LNG export cases assuming that 10 wells will be drilled per pad. Also indicated are the number of wells to be drilled and the rates of water consumption required. A “no terminals” case is also included, illustrat-ing the land disturbance and water consumption impacts of simply maintaining BC gas production at current rates.
Table 10 Scenario 2: Production needed for LNG exports is incremental to current BC production

A CLEAR LOOK AT BC LNG: ENERGY SECURITY, ENVIRONMENTAL IMPLICATIONS AND ECONOMIC POTENTIAL 37
• It includes only well pads and ignores the impact of roads, pipelines, seismic activ-ities and facilities development in its representation of land disturbance, whereas in its separate submission to First Nations well pads are stated to be less than 10 per cent of total disturbance (Table 8).
• It represents land disturbance to 2025 only and suggests that well pads will occupy less than 1 per cent of the Montney play and 0.2 per cent of the Horn River play by then, presumably also including historical disturbance. In fact, LNG projects require a life of 20+ years for justification, hence will be active through 2040. Also, drilling will be concentrated in the most prospective areas, which constitute about 17,000 square kilometres for both plays. If roads and pipelines are included, land disturb-ance impact will be between 3.6 per cent and 4.2 per cent of this region by 2040 in the high LNG export case — over and above historical disturbance.
• It represents water consumption as a draw on the total runoff in northeastern BC. In fact, development will occur in a small portion of northeastern BC and water will be sourced locally as much as possible given the cost of transport, making the proportional impact on local surface water much higher. Water consumption at the peak rate in the high case represents a ten-fold increase over current rates. Water supply also varies with the seasons, and increased stress will occur in dry seasons and times of drought.

38 A CLEAR LOOK AT BC LNG: ENERGY SECURITY, ENVIRONMENTAL IMPLICATIONS AND ECONOMIC POTENTIAL
P A R T 8
Life-cycle greenhouse gas emissions
One of the selling points of the BC government’s LNG plan is that it will reduce greenhouse gas (GHG) emissions in Asia compared to burning coal and thus contribute to a climate change solu-tion. Certainly if one looks at burner-tip emissions only (meaning GHG emissions at the point of combustion), natural gas has roughly half the CO2 emissions of coal. However, there are consider-able additional sources of emissions in the LNG supply chain because it is a very energy-intensive way to move gas.
The US National Energy Technology Laboratory (NETL) published a study in early 2014 comparing US LNG exports to China versus the comparable emissions of burning coal for power generation it would displace.45 This report looks at GHG emissions from extraction, processing, pipeline trans-port, liquefaction, tanker transport, regasification and combustion. An important consideration is the emissions of methane over the extraction and transportation portion of the supply chain, as methane according to the latest IPCC assessment has a GHG impact of 30 times CO2 when considered on a 100-year time frame and 85 times when considered on a 20-year time frame.
Table 11 illustrates the NETL study comparison between burning LNG imported from New Orleans or Prince Rupert in Shanghai and burning local Chinese coal.46 Comparing burning coal in China versus burning LNG imported from New Orleans, the NETL study found a 39 per cent GHG reduction on a 100-year basis and a 25 per cent reduction on a 20-year basis.
45 Skone, T. J., et al. May 2014. 46 Skone, T. J., et al. May 2014. See Table A.4. BC emissions for transport are reduced by 14% per cent from
the New Orleans case owing to the shorter transport distance.
There are considerable
additional sources of emissions in the LNG supply chain
because it is a very energy-intensive
way to move gas.

Table 11: GHG emissions by process for LNG transport to China for electricity generation versus generating the same electricity from domestic Chinese coal assuming low upstream methane emissions and old-technology coal plants
Process
Kg CO2e/MWh assuming existing technology and low methane emissions
New Orleans to Shanghai, China Prince Rupert to Shanghai, China
100 years 20 years 100 years 20 years
New Orleans to Shanghai,
China
Chinese regional
coal
New Orleans to Shanghai,
China
Chinese regional
coal
Prince Rupert to Shanghai,
China
Chinese regional
coal
Prince Rupert to Shanghai,
China
Chinese regional
coal
Natural gas/coal extraction 34.5 7.8 90.2 13.6 34.5 7.8 90.2 13.6
Natural gas processing 35.1 n/a 61.4 n/a 35.1 n/a 61.4 n/a
Domestic pipeline transport 32.9 n/a 82.9 n/a 32.9 n/a 82.9 n/a
Liquefaction 64.7 n/a 64.7 n/a 64.7 n/a 64.7 n/a
Tanker/rail transport 52.9 14.4 60.1 15.3 45.5 14.4 51.7 15.3
Tanker berthing and deberthing 1.5 n/a 1.6 n/a 1.5 n/a 1.6 n/a
LNG regasification 20.0 n/a 45.3 n/a 20.0 n/a 45.3 n/a
Power plant operations 414.7 1,063.0 415.3 1,063.7 414.7 1,063.0 415.3 1,063.7
Electricity T&D 3.4 3.4 2.5 2.5 3.4 3.4 2.5 2.5
Total 659.6 1,088.6 824.0 1,095.1 652.3 1,088.6 815.6 1,095.1
Improvement LNG vs. coal (%) 39.4 24.8 40.1 25.5
Transport emissions from Prince Rupert are reduced compared to New Orleans due to the shorter transport distance (4,642 nautical miles from Prince Rupert to Shanghai versus 5,398 nautical miles from New Orleans to Shanghai), whereas other parts of the supply chain are comparable given that both represent the latest in LNG technology.
A CLEAR LOOK AT BC LNG: ENERGY SECURITY, ENVIRONMENTAL IMPLICATIONS AND ECONOMIC POTENTIAL 39

40 A CLEAR LOOK AT BC LNG: ENERGY SECURITY, ENVIRONMENTAL IMPLICATIONS AND ECONOMIC POTENTIAL
However, the NETL study points out that the comparison is very sensitive to the upstream meth-ane leakage assumptions made as well as the downstream efficiency of coal plants that would allegedly be displaced by the imported LNG burned in new gas-fired generation capacity. NETL suggests that if its worst-case upstream methane emissions are compared to its best-case coal efficiency, burning imported LNG in China would be worse for GHG emissions than burning domestic Chinese coal when considered on a 20-year timeline.47
A closer look at the assumptions made by NETL reveal that its “expected” case assumed 1.4 per cent upstream emissions from gas used in LNG export facilities and that Chinese coal plants would operate at just 33 per cent efficiency. These are both underestimates, particularly if unconventional gas is used as a source of supply as is planned in BC. Howarth (2014) reports upstream methane leakage from unconventional gas is as high as 3.3 per cent, and that the US Environmental Protection Administration assumes upstream emissions from unconventional gas average 3 per cent.48 Another consideration is that new coal plants being built in China use ultra-supercritical technology, with 46 per cent thermal efficiency, compared to the 33 per cent efficiency assumed in the NETL study.49 Building in realistic upstream rates of methane emissions (3 per cent as estimated by US EPA) and assuming only best-technology coal plants will be built in China, burning imported BC LNG in China would produce 27 per cent more GHG emissions from the various processes in the LNG supply chain on a 20-year time frame and 7 per cent fewer on a 100-year time frame (Table 12). A final point is that shale gas produced from the Horn River Basin of northeast BC, a principal source of gas supply, has a CO2 content of 10 per cent to 12 per cent,50 which is not considered in the NETL study or in Table 12; this gas is typically vented, increasing the GHG burden of the LNG supply chain yet more from the figures shown. Thus the BC government’s argument that exporting LNG will significantly reduce GHG emissions in China is implausible at best.
47 Skone, T. J., et al. May 2014. See Table 6-1 and Figure 6-9. 48 Howarth, R.W. 2014. 49 Yuhuan 1,000MW ultra-supercritical pressure boilers, China. Power Technology. Accessed December 9,
2014. At: http://www.power-technology.com/projects/yuhuancoal/.50 BC Oil and Gas Commission. 2014. Horn River Basin play atlas.

Table 12: Kg CO2e/MWh assuming realistic upstream emissions and state-of-the-art new coal plants
Process
New Orleans to Shanghai, China Prince Rupert to Shanghai, China
100 years 20 years 100 years 20 years
New Orleans to Shanghai,
China
Chinese regional
coal
New Orleans to Shanghai,
China
Chinese regional
coal
Prince Rupert to Shanghai,
China
Chinese regional
coal
Prince Rupert to Shanghai,
China
Chinese regional
coal
Natural gas/coal extraction 67.9 7.8 177.6 13.6 67.9 7.8 177.6 13.6
Natural gas processing 49.8 n/a 87.2 n/a 49.8 n/a 87.2 n/a
Domestic pipeline transport 63.5 n/a 159.9 n/a 63.5 n/a 159.9 n/a
Liquefaction 64.7 n/a 64.7 n/a 64.7 n/a 64.7 n/a
Tanker/rail transport 52.9 14.4 60.1 15.3 45.5 14.4 51.7 15.3
Tanker berthing and deberthing 1.5 n/a 1.6 n/a 1.5 n/a 1.6 n/a
LNG regasification 20.0 n/a 45.3 n/a 20.0 n/a 45.3 n/a
Power plant operations 414.7 762.6 415.3 763.1 414.7 762.6 415.3 763.1
Electricity T&D 3.4 3.4 2.5 2.5 3.4 3.4 2.5 2.5
Total 738.4 788.2 1,014.1 794.5 731.0 788.2 1,005.7 794.5
Improvement LNG vs. coal 6.3 -27.6 7.3 -26.6
A CLEAR LOOK AT BC LNG: ENERGY SECURITY, ENVIRONMENTAL IMPLICATIONS AND ECONOMIC POTENTIAL 41
GHG emissions from the full-cycle LNG supply chain assuming EPA upstream methane emissions from unconventional gas of 3 per cent (instead of 1.4 per cent as in the NETL “expected” case in Table 11) compared to burning Chinese coal using best-in-class technology (ultra-supercritical at 46 per cent efficiency instead of old technology at 33 per cent as assumed in Table 11).51
51 The NETL study assumed average efficiency of gas plants for “power plant operations” of 46.4 per cent. Gas may be burned in either single-cycle plants at 36–42 per cent efficiency for peaking and to balance intermittent loads such as wind and solar, or in combined-cycle plants at 54 per cent efficiency for base load (see http://en.wikipedia.org/wiki/Combined_cycle). Gas would likely be used for both of these applications, hence 46.4 per cent efficiency is a reasonable assumption on average. If it is assumed that all of the imported gas would be used only in state-of-the-art combined-cycle plants for base load at 54 per cent efficiency, imported BC LNG would produce 19 per cent more GHG emissions than coal on a 20-year basis and 15 per cent fewer on a 100-year basis.
42 A CLEAR LOOK AT BC LNG: ENERGY SECURITY, ENVIRONMENTAL IMPLICATIONS AND ECONOMIC POTENTIAL
Taken together, these realities suggest that, from a life-cycle GHG emissions point of view, build-ing modern coal plants in China is likely to be superior on a 20-year timeline to building new gas plants to burn imported BC LNG. Even on a 100-year timeline, the GHG emissions improvement using LNG is marginal at 7 per cent. So burning imported LNG from BC would in fact increase global GHG emissions for at least the next 50 years compared to burning coal.
The BC government commissioned a study by Globe Advisors (published in 2014) that claimed significant benefits to displacing thermal coal use in Asia, as well as other sources of gas, with imported BC LNG.52 A close look at this study, however, shows that it assumes that electricity from renewable sources would be used instead of natural gas at the LNG facilities, and that other emissions might be sequestered using carbon capture and storage. The cost of doing this at scale is not mentioned in the study and thus remains purely theoretical. Furthermore, in displacing coal in Asia, the report presents only a lump-sum saving from BC LNG, stating the calculation was based on a comparison of combustion only, evidently not including the full cycle emissions of transporting the gas from the wellhead to Asia. Given this, and the lack of backup provided for its assumptions of emissions along the supply chain, this report lacks credibility.
52 Globe Advisors. February 2014.

A CLEAR LOOK AT BC LNG: ENERGY SECURITY, ENVIRONMENTAL IMPLICATIONS AND ECONOMIC POTENTIAL 43
P A R T 9
Economics and revenue potential
The lure of LNG exports is the difference between low North American domestic natural gas prices and high Asian prices, particularly in Japan, South Korea and China. As of this writing, however, there had been no corporate commitment to actually go ahead with any of the 12 approved export terminals. Given that building a large export terminal involves the capital outlay of $10 billion or more and additional expenditures on pipelines and upstream production infrastructure, this lack of corporate commitment is understandable given the risks involved. Principal among these risks are:
• The need to secure 20- to 25-year contracts from buyers that will maintain the arbi-trage required to recover costs. Large volumes of new capacity coming on stream worldwide make LNG in Asia more of a buyer’s market, and current practices such as linking LNG to the price of oil, which have kept prices relatively high, are being reconsidered.
• The risk that North American gas prices will move higher in the medium and longer term, eliminating arbitrage after costs of moving LNG overseas are considered.
• The fact that shale gas developments in northeastern BC are relatively high cost, especially the Horn River, compared to shale gas developments in the US, and par-ticularly compared to the costs of some other suppliers in Australia and the Middle East.
• The fact that the principal sources envisaged for gas supply are untested at scale — which in the high case would require BC to produce nearly six times as much gas as it has produced to date by 2040. There are just 210 producing wells in the Horn River play at present, of which only 11 have exceeded the 7 billion cubic feet of cumulative gas production that 6,485 Horn River wells would have to average, in the high case, to recover the required amount of gas by 2040. Similarly,
Given that building a large export terminal involves the capital outlay of $10 billion or more and additional expenditures on pipelines and upstream production infrastructure, this lack of corporate commitment is understandable given the risks involved.

44 A CLEAR LOOK AT BC LNG: ENERGY SECURITY, ENVIRONMENTAL IMPLICATIONS AND ECONOMIC POTENTIAL
35,236 wells in the Montney would have to average 3.6 billion cubic feet — but only 141 of 2,082 producing wells have achieved this threshold to date.53
The cost of liquefaction, transport and regasification in moving LNG to China or Japan from Canada’s west coast is estimated by the Canadian Energy Research Institute (CERI) as US$4.50 to $7.00 per million BTUs (MMbtu).54 The high estimate is for the Canada LNG project and the low estimate for Kitimat LNG, although CERI points out that the Kitimat estimate may be outdated and therefore unrealistically low. Assuming an average cost of $6.00 to move the gas and a domestic gas price of $4.00, market conditions have already eliminated the arbitrage, as landed LNG prices in Japan and Korea were estimated at $7.45 per MMbtu in June 2015 and $7.30 in China.55 China has also recently secured long-term gas supply commitments via pipeline from Russia, which will dampen upward movement in LNG prices there. The recent drop in oil prices may also affect the profitability of oil-linked LNG contracts, especially if it continues in the longer term.
Meanwhile, domestic gas prices could easily rise to $6.00 or higher in the medium term, as sweet spots in US shale gas plays are drilled off and production must come from lower quality, higher cost regions.56 A move to just $6.00 would worsen the losses from LNG exports at current international prices (North American prices were over $10 as recently as June 2008, and spot prices were over $20 in the northeastern US in January 2014).
A final question is the amount of revenue that would be returned to the province in the form of LNG taxes and royalties from a large-scale selloff of the province’s finite gas resources. The CCPA analyzed this in the light of the preliminary taxation regime announced by the BC government in early 2014.57 Given the proposed tax regime at that time, CCPA determined that likely revenues over a 30-year period would be considerably less than required to establish the $100 billion “prosperity fund” projected by the BC government. Subsequent to the CCPA report, the BC government halved its “LNG tax” from 7 per cent to 3.5 per cent after capital expenditures are recovered, so the potential for meeting the prosperity fund goal is now considerably worse.58 Furthermore, the smaller the arbitrage between BC and international prices, the longer it takes to pay off capital costs before the maximum LNG tax rate is invoked and the smaller the returns to government. Hence the BC public absorbs much of the downside risk through reduced rev-enues. The additional cuts to corporate taxes through accelerated capital cost allowances for LNG terminals recently announced by the Harper government will further reduce the public’s take.59
53 Data from Drillinginfo. Retrieved December 2014.54 Canadian Energy Research Institute. 2013. 55 US Federal Energy Regulatory Commission. 56 Hughes, J.D. 2014.57 Lee, M. April 2014.58 Lee, M. October 2014.59 Globe and Mail. February 25, 2015.
The recent drop in oil prices may also
affect the profitability of oil-linked LNG
contracts, especially if it continues in the longer term.

A CLEAR LOOK AT BC LNG: ENERGY SECURITY, ENVIRONMENTAL IMPLICATIONS AND ECONOMIC POTENTIAL 45
P A R T 1 0
Conclusion and implications
This analysis of the BC government’s plans to create an LNG industry and associated revenue bonanza reveals several key problems, both in the stewardship of finite non-renewable resources at the provincial and federal levels and in the promised environmental and financial benefits. These include:
• Long-term energy security of Canadians may be compromised. Canadian gas production is declining. NEB’s reference case projections, even with a three-fold ramp-up in BC production, show that Canada will have just 17.9 tcf available for exports over the 2016–2035 period. Yet the high case BC government LNG forecast requires the production of 104 tcf of marketable gas for export by 2040, in addi-tion to Canada’s increasing needs over this period. Notwithstanding its own supply projections, the NEB has approved 12 LNG terminals with 251 tcf of collective LNG export capacity over planned project lives.
• Gas resources in BC that are recoverable at the low prices required to make LNG exports profitable are highly uncertain and likely seriously overestimated. Loosely constrained estimates of BC “marketable resources” published by the NEB in con-junction with the BC Oil and Gas Commission have been overstated by six-fold in BC government literature. The shale gas plays where this gas will purportedly be sourced are in an early phase of development, and the well performance and number of drilling locations needed to recover the gas are by no means assured.
• The massive scale-up in drilling and associated infrastructure required is extremely optimistic. In the high export case, between 37,800 and 43,700 wells would need to be drilled by 2040, more than doubling to nearly tripling the number drilled since 1954 in northeastern BC. Gas production would need to grow by between four and five times over current BC output. This would require the production of between 4.1 and 4.6 times BC’s current proven raw gas reserves of 42.3 tcf by 2040.
This analysis of the BC government’s plans to create an LNG industry and associated revenue bonanza reveals several key problems, both in the stewardship of finite non-renewable resources at the provincial and federal levels and in the promised environmental and financial benefits

46 A CLEAR LOOK AT BC LNG: ENERGY SECURITY, ENVIRONMENTAL IMPLICATIONS AND ECONOMIC POTENTIAL
• Water consumption required in the high case during the ramp-up phase of drilling would equal about half of the rate of consumption of the cities of Vancouver or Calgary, and about a third of each city’s rate of consumption thereafter to maintain gas output rates. It would represent a ten-fold ramp-up from water use needed to maintain current production. Although this is likely to be possible given that north-eastern BC is not prone to droughts, impact on water resources will be concentrated in areas being actively developed rather than on the total runoff of northeastern BC as depicted in BC government literature. Furthermore, water supply can vary markedly with the seasons, with increased stress during dry periods.
• BC government literature downplays land-use disturbance by focusing only on well pads and ignoring ancillary disturbance from roads, pipelines, facilities and seismic activities. As with water use, land disturbance will be concentrated in the plays being exploited and not visited on the total northeastern BC landscape.
• The emissions reduction benefits touted by the BC government of replacing coal in Asia with imported BC LNG are illusory at best. LNG is energy intensive to move, requiring about 20 per cent of the gas to be consumed in the liquefaction, transport and regasification process. Coupled with life-cycle emissions of methane, which is a much more potent greenhouse gas than CO2, BC LNG imports to China would exacerbate emissions over at least the next 50 years compared to building state-of-the-art coal plants. Considered on a 100-year basis, burning imported LNG would provide only a marginal improvement compared to best-technology coal.
• Companies investing in LNG terminals, pipelines and upstream production infra-structure face considerable risks. Long-term supplies of gas at low prices are by no means assured, hence neither are the profits necessary to reimburse the very large capital investments required. Large amounts of new LNG capacity coming on stream from suppliers with lower costs (e.g. Australia) and alternative sources of gas for large potential customers (e.g. China’s new pipeline contracts with Russia) make competition fierce.
• The revenues projected by the BC government for its $100 billion “Prosperity Fund” are very unlikely to be realized. The revenues due the owners of the resource — the Canadian public — are most at risk as these are largely paid after corporate costs are recovered. The public must also absorb the impacts of development on public infrastructure as well as on the land and water — and the long-term consequences of liquidating finite resources now at the expense of future energy security. Although much is made of revenue from royalties from producing gas, these royalties would accrue when the gas was ultimately produced, regardless of whether the gas was exported or not.
Oil and gas represent a one-time legacy that underpins virtually every aspect of modern society. Notwithstanding the desirability of replacing fossil fuels with lower-emissions alternatives, it is highly likely that fossil fuels will continue to be needed at some level for the foreseeable future. Canada and British Columbia have adopted a de facto strategy of liquidating these resources as quickly as possible in the name of the economic prospects of the government of the day. These resources are precious, non-renewable and come with collateral environmental impacts. They demand more balanced stewardship in view of the needs of future generations of Canadians.
Water consumption required in the high
case during the ramp-up phase of
drilling would equal about half of the rate
of consumption of the cities of Vancouver or
Calgary, and about a third of each city’s rate of consumption
thereafter to maintain gas output rates.

A CLEAR LOOK AT BC LNG: ENERGY SECURITY, ENVIRONMENTAL IMPLICATIONS AND ECONOMIC POTENTIAL 47
References
BC Government. 2014. 2013 Detailed Gas Reserves by Field and Pool. At: https://www.bcogc.ca/2012-detailed-gas-reserves-field-and-pool-excel.
BC Government. August 2014. LNG Forecast Scenario. At: https://www.bcogc.ca/lng-forecast-scenario.
BC Government. “Trade and Invest British Columbia.” Retrieved December 19, 2014. At: http://www.britishcolumbia.ca/invest/industry-sectors/natural-gas.aspx.
BC Oil and Gas Commission. 2012. Hydrocarbon and By-Product Reserves in British Columbia. At: http://www.bcogc.ca/node/11111/download.
BC Oil and Gas Commission. 2012. Montney Formation Play Atlas NEBC. At: http://www.bcogc.ca/node/8131/download.
BC Oil and Gas Commission. 2014. Horn River Basin Unconventional Shale Gas Play Atlas. At: http://www.bcogc.ca/node/11238/download.
BC Oil and Gas Commission. December 23, 2014. Email correspondence from James O’Hanley.
Canadian Energy Research Institute. 2013. Global LNG: Now, Never or Later? At: http://www.ceri.ca/index.php?option=com_content&view=article&id=103:ceri-study-131-global-lng-now-never-or-later&catid=36:publication-pages.
Globe Advisors. February 2014. British Columbia LNG greenhouse gas (GHG) life cycle analysis. Discussion draft. At: http://www2.gov.bc.ca/gov/DownloadAsset?assetId=63E636239264473999EF9032145643EA&filename=british_columbia_lng_greenhouse_gas_ghg_life_cycle_analysis.pdf.
Globe and Mail. February 25, 2015. “Harper government looks to tax break to gas up BC LNG.” At: http://www.theglobeandmail.com/globe-debate/editorials/harper-government-looks-to-tax-break-to-gas-up-bc-lng/article23207117/.
Howarth, R.W. 2014. A Bridge to Nowhere: Methane Emissions and the Greenhouse Gas Footprint of Natural Gas. Energy Science and Engineering, Open Access. At: http://www.eeb.cornell.edu/howarth/publications/Howarth_2014_ESE_methane_emissions.pdf.
Hughes, J.D. 2014. Drilling Deeper: A Reality Check on the U.S. Government’s Forecasts for a Lasting Tight Oil & Shale Gas Boom. At: http://www.postcarbon.org/wp-content/uploads/2014/10/Drilling-Deeper_FULL.pdf.
KPMG. May 2014. British Columbia LNG Workforce Occupation Forecast. At: http://www.workbc.ca/WorkBC/media/WorkBC/Documents/Docs/KPMG-LNG-Forecast.pdf.

48 A CLEAR LOOK AT BC LNG: ENERGY SECURITY, ENVIRONMENTAL IMPLICATIONS AND ECONOMIC POTENTIAL
Lee, M. April 2014. Path to Prosperity? A Closer Look at British Columbia’s Natural Gas Royalties and Proposed LNG Income Tax. Vancouver: Canadian Centre for Policy Alternatives. At: https://www.policyalternatives.ca/sites/default/files/uploads/publications/BC%20Office/2014/04/CCPA-BC-Path-To-Prosperity.pdf.
Lee, M. October 2014. “A BC Framework for LNG, Part Two: The LNG Income Tax.” Vancouver: Canadian Centre for Policy Alternatives. At: http://www.policynote.ca/a-bc-framework-for-lng-part-two-the-lng-income-tax/.
National Energy Board. 2012. “NEB Consultation: Oil and Gas Exports and Imports.” At: https://www.neb-one.gc.ca/bts/ctrg/gnnb/xprtsndmprt/archive/2012-09-20nbl-eng.html.
National Energy Board. November 2013. “Canada’s Energy Future 2013—Energy Supply And Demand Projections To 2035—An Energy Market Assessment.” At: https://www.neb-one.gc.ca/nrg/ntgrtd/ftr/2013/index-eng.html
National Energy Board. “LNG Export and Import License Applications.” Retrieved May 20, 2015. At: https://www.neb-one.gc.ca/pplctnflng/mjrpp/lngxprtlcnc/index-eng.html.
National Energy Board et al. November 2013. Energy Briefing Note: The Ultimate Potential for Unconventional Petroleum Production from the Montney Formation of British Columbia and Alberta. At: https://www.neb-one.gc.ca/nrg/sttstc/ntrlgs/rprt/ltmtptntlmntnyfrmtn2013/ltmtptntlmntnyfrmtn2013-eng.pdf.
Priddle, Roland. July 23, 2013. Application for a Gas Export Licence of the National Energy Board: Observations on export impact and surplus evaluation pursuant to the National Energy Board Act s. 118. At: https://docs.neb-one.gc.ca/ll-eng/llisapi.dll/fetch/2000/90466/94153/552726/977416/977417/977584/A3J4D0_-_Schedule_C%2C_Priddle_Report%2C_July_23%2C_2013.pdf?nodeid=977317&vernum=-2.
Skone, T.J. et al. May 2014. Life Cycle Greenhouse Gas Perspective on Exporting Liquefied Natural Gas from the United States. DOE/NETL-2014/1649. At: http://www.energy.gov/sites/prod/files/2014/05/f16/Life%20Cycle%20GHG%20Perspective%20Report.pdf.
US Energy Information Administration. June 2013. Technically Recoverable Shale Oil and Shale Gas Resources: An Assessment of 137 Shale Formations in 41 Countries Outside the United States. At: http://www.eia.gov/analysis/studies/worldshalegas/.
US Federal Energy Regulatory Commission. World LNG estimated June 2015 landed prices. At: http://www.ferc.gov/market-oversight/mkt-gas/overview/ngas-ovr-lng-wld-pr-est.pdf.
Ziff Energy. June 2013. Natural Gas Supply and Demand to 2050, North America and Canada. At: https://docs.neb-one.gc.ca/ll-eng/llisapi.dll/fetch/2000/90466/94153/552726/963926/977286/963718/A3I5K5_-_Appendix_A_-_Natural_Gas_Supply_and_Demand_Forecast_to_2050_North_America_and_Canada_-_Ziff_Energy_G.pdf?nodeid=963719&vernum=-2.
Ziff Energy. July 22, 2013. Natural Gas Supply and Demand Forecast to 2046, North America and Canada. At: https://docs.neb-one.gc.ca/ll-eng/llisapi.dll/fetch/2000/90466/94153/552726/977416/977417/977584/A3J4C9_-_Schedule_B%2C_Ziff_Report%2C_July_23%2C_2013.pdf?nodeid=977314&vernum=-2.

A CLEAR LOOK AT BC LNG: ENERGY SECURITY, ENVIRONMENTAL IMPLICATIONS AND ECONOMIC POTENTIAL 49
A P P E N D I X A : G L O S S A R Y O F T E R M S
bcf/d: Billion cubic feet per day. 1 bcf/d = 0.365 tcf/year.
Marketable gas: Saleable gas that has been processed to remove impurities.
mcf: Thousand cubic feet. A common metric for natural gas.
MMbtu: Million British thermal units. Also a common metric for measuring gas and is typically approximately equal to 1 mcf (1 mcf = 1,025,000 btu but can vary slightly depending on the composition of the gas).
mtpa: Million tonnes (megatonnes) per annum. 1 megatonne/year = 0.1315 bcf/d = 0.048 tcf/year.
Play: A prospective region for oil and/or gas, typically confined to one stratigraphic rock unit.
Raw gas: Gas produced from the wellhead, which contains impurities that must be stripped from the gas before sale. Impurities may include non-combustible gases like carbon dioxide or natural gas liquids, condensate and other combustible gases.
Shrinkage: The reduction in volume of raw gas as impurities are removed by processing to make a saleable product (marketable gas). Shrinkage is typically about 13 per cent by volume in northeastern BC plays.
tcf: Trillion cubic feet.

50
The Canadian Centre for Policy Alternatives is an independent, non-partisan research institute concerned with issues of social, economic and environmental justice. Founded in 1980, it is one of Canada’s leading progressive voices in public policy debates. The CCPA is a registered non-profit charity and depends on the support of its more than 10,000 members across Canada.
1400 – 207 West Hastings StreetVancouver, BC V6B [email protected]
www.policyalternatives.ca