Embed Size (px)
Citation preview

September/October 2011ConcreteConcrete A PUBLICATION OF THE NATIONAL READY MIXED CONCRETE ASSOCIATION
Pervious Concrete and ADA Compliance-A Good Combination
Variation in Variation in Concrete Performance Concrete Performance
Due to AggregatesDue to AggregatesPart VII of Concrete Part VII of Concrete
Quality SeriesQuality Series

538313_BASF.indd 1 7/2/11 1:16:28 PM 395767_Holcim.indd 1 10/10/08 1:56:54 PM

538313_BASF.indd 1 7/2/11 1:16:28 PM 395767_Holcim.indd 1 10/10/08 1:56:54 PM
FIRESTORM HEATER
FIRED TANK
HOT OIL HEATER
FUEL TANK
CHILLER
HOT OIL PIPE COILS
FOR
CONCRETEPRODUCERS
PRODUCTS
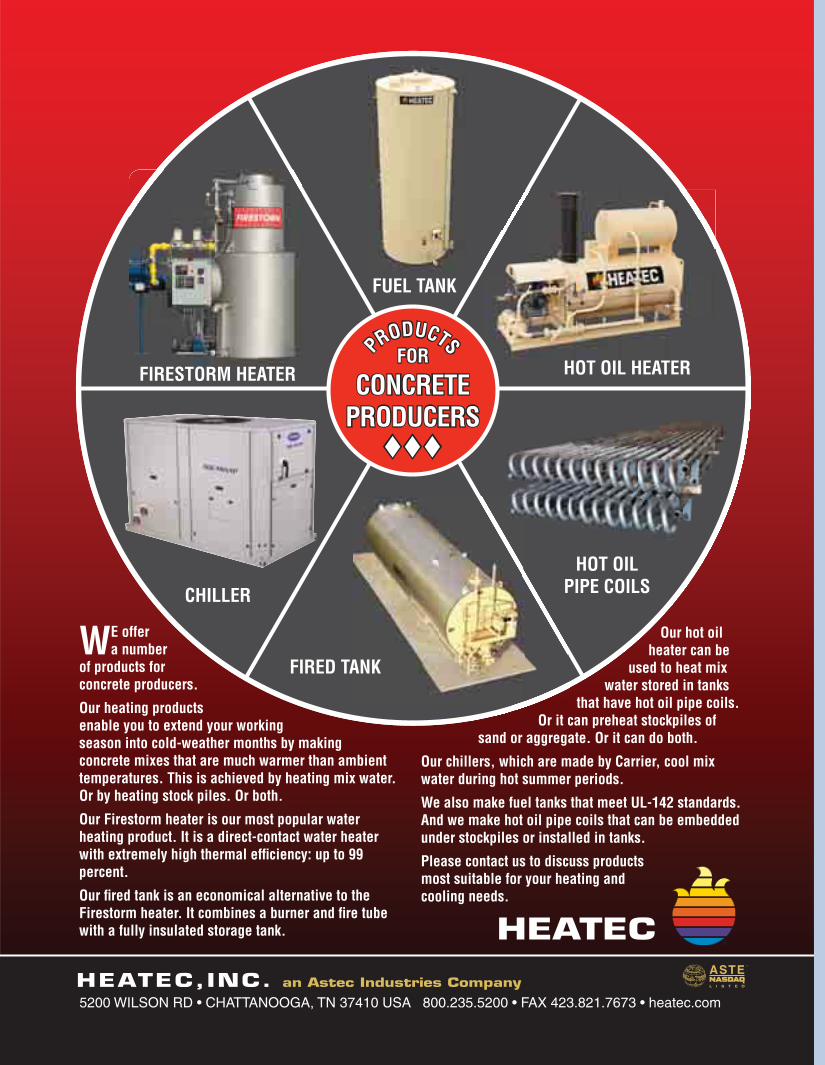
WE offer a number
of products for concrete producers.
Our heating products enable you to extend your working season into cold-weather months by making concrete mixes that are much warmer than ambient temperatures. This is achieved by heating mix water. Or by heating stock piles. Or both.
Our Firestorm heater is our most popular water heating product. It is a direct-contact water heater with extremely high thermal effi ciency: up to 99 percent.
Our fi red tank is an economical alternative to the Firestorm heater. It combines a burner and fi re tube with a fully insulated storage tank.
Our hot oil heater can be
used to heat mix water stored in tanks
that have hot oil pipe coils. Or it can preheat stockpiles of
sand or aggregate. Or it can do both.
Our chillers, which are made by Carrier, cool mix water during hot summer periods.
We also make fuel tanks that meet UL-142 standards. And we make hot oil pipe coils that can be embedded under stockpiles or installed in tanks.
Please contact us to discuss products most suitable for your heating and cooling needs.
HEATEC,INC. an Astec Industries Company
5200 WILSON RD • CHATTANOOGA, TN 37410 USA 800.235.5200 • FAX 423.821.7673 • heatec.com
®HEATEC
506345_Heatec.indd 1 3/9/11 4:50:13 PM

f e a tu re s7 Pervious Concrete and ADA Compliance-A
Good Combination
9 Variation in Concrete PerformanceDue to AggregatesPart VII of Concrete Quality Series
16 Designing for Sustainable Pavements
d e p a r tm e n ts15 Quality Corner: Is the Loader Operator a Member of Your
Quality Control Team?
18 Index to Advertisers
Visit our Buyers’ Guide online at NRMCA.OfficialBuyersGuide.net
Concrete infocus is published for:National Ready Mixed Concrete Association 900 Spring Street Silver Spring, Maryland 20910Phone: (301) 587 1400Fax: (301) 585 4219www.nrmca.org
President: Robert A. Garbini, P.E.
Managing Editor: Kathleen Carr-Smith
Association Editor: Frank Cavaliere
Published by:
Naylor, LLC5950 NW 1st PlaceGainesville, Florida 32607Phone: (800) 369-6220Fax: (352) 331-3525www.naylor.com
Publisher: Jill Andreu
Editor: Sean Garrity
Project Manager: Katie Usher
Marketing Research: Amanda Niklaus
Advertising Director:Maureen Hays
Account Representatives: Lou Brandow, Ryan Griffi n, Norbert Musial, Christine Ricci, Rick Sauers, Jamie Williams, Chris Zabel
Layout & Design:Preeti Pandey
©2011 Naylor, LLC. All rights reserved.
The contents of this publication may
not be reproduced by any means, in
whole or in part, without the prior
written consent of the publisher.
PUBLISHED AUGUST 2011NRC-S0411-6087
September/October 2011, Vol. 10, No. 5infocusConcrete
conten ts
CONCRETE in focus ı 5
Please visit the electronic version of Concrete Infocus at http://www.nrmca.org/news/connections/for bonus features, including Environmental Scene, Education Matters and Corporate Suite.
506345_Heatec.indd 1 3/9/11 4:50:13 PM

Two (2) NEW Portable Concrete Plants:
Falcon - New super heavy plant
Mustang - New low-profi le portable
The Mustang plant will be exhibited at the ConExpo Show
NEW Stephens RCC Mixer:
The new mixer will allow an existing dry batch plant to be
transformed into an RCC or central mix plant.
The New RCC mixer will be exhibited at the World of Concrete Show and
The ConExpo Show.
NEW Stephens/Inventure Reversing Drum Mixer:
Stephens has acquired the exclusive rights to manufacture and supply
the Inventure Reversing Mixers in Canada and the USA. The new design
and updated frames will make the mixer even more maintenance friendly.
The NEW Stephens/Inventure Reversing Mixer will be exhibited at the
ConExpo Show.
• Standard frame will support up to two 1000 bbl silos
• Standard frame will support up to 200 ton agg bins
• Optional frame will support up to 400 ton agg bins
• Plant can be designed with 36” belt, water batcher
and holding tank for 200 yph production
• Central dust collector can also mount on plant
to save yard space
• Standard frame to be designed to typical
zone 1 seismic calculations
• Standard frame will support up to two 1000 bbl silos
Standard frame will support up to 200 ton agg bins
New heavy portable Falcon
Petaluma, California Soilland Zone 4 Siesmic\
New low-profi le Mustang• 400 bbl in truss silo
• 70 ton agg bin
• 30” transfer belt
• Two (2) 10” screws
• Optional: in truss central dust
collector available
• Standard frame designed to
typical zone 2 seismic
calculations
“We have used these tough economical
times to expand our product list.”
1-800-626-0200 www.stephensmfg.com1-800-626-0200
ble
Sicoma MAO-6000 twin shaft mixer42” transfer belt with 50 hp motor400 amp 3rd party UL approved power panelOptional: Hydraulic Leveling Jacks
Hydraulic Conveyor FoldHydraulic Truck Collection Hop-per Fold
Unique Features:The newly designed frame will make clean-up
and maintenance easier, and the new design will
allow for a water hose or broom to easily clean
under the mixer.
The patented “swing out” hinged charging chute
also allows for quick and easy access inside the
mixer.
Stephens has added several other options as
standard equipment.
The new Stephens/lnventure mixer will be exhibited
at the ConExpo Show, booth# S707.
Sicoma MAO 6000 twin shaft mixer
New RCC Mixer Includes:
Stephens Mfg.Quality Products
Since 1957
537303_STEPHENS.indd 1 7/25/11 3:48:54 PM

CONCRETE in focus ı 7
By Jon Hansen, Senior National Resource Director, NRMCA
In January 1990, the 101st Congress passed the “Americans with Disabilities Act of 1990” (ADA), which was then signed by
President George Bush in July. Then as now, anytime there is change to the way we build is mandated, the entire construction industry’s collective response is “It’s going to cost more to build”. The reaction is the same now with today’s greener and sustain-able building methods. Nothing in the con-struction industry changes easily.
Let’s set the record straight on one key issue right from the start: ADA does not approve anything. Well intentioned market-ing people would want you to believe that a host of products are ADA approved, but they are not. Properly installed, most will be ADA compliant, but there is no “group” or process that approves or disapproves any material or product.
So what is ADA compliant? Following the ADA Act of 1990, the Department of Justice published the ADA Standards for Accessible Design, a construction document design guide on how accessible construction should be built. Th e design guide has been updated many times, to cover a number of added applications, but the 1994 update remains the most used reference for build-ing walkway surfaces and is very favorable to pervious concrete-like surfaces.
For example, in Section 4.5 of the guide, the general overall requirements for ground and fl oor surfaces states: Ground and fl oor surfaces along accessible routes and in acces-sible rooms and spaces including fl oors, walks, ramps, stairs, and curb ramps, shall be stable, fi rm, slip-resistant. What better way to build a stable, fi rm, slip-resistance surface than with
either broom fi nish plain concrete or pervious concrete?
In addition, in Section 4.8.8-Outdoor Conditions it states: Outdoor ramps and their approaches shall be designed so that water will not accumulate on walking surfaces. Once again, pervious fi ts the requirements.
Questions have also been asked about the open voids on the surface of pervious con-crete. Th e closest reference to surface voids is addressed in Section 4.5.4-Gratings, which is very clear on the size and direction of allow-able voids in the surface and says the surface should have spaces no greater than 1/2 in (13 mm) wide in one direction. All pervious con-crete as we know it would have no problem meeting these requirements.
All other design requirements for ADA compliance, like surface off set, cross slope and incline of surface, apply to pervious concrete
placement just as it does to plain concrete and other walking/wheelchair surface mate-rial. Th ose guidelines can be found in Section 4.5.2 and basically say that if you have an off -set in the walking surface that is greater than one quarter inch you need to correct the off set as outlined in Section 4.7, which will instruct you on how to construct a transition ramp.
To download a free copy of the current (2010) guide, go to www.ADA.gov.
For the specifi c sections mentioned in this article, go to http://www.access-board.gov/adaag/html/adaag.htm#4.1.6(3)(a)
From the Author:I was keenly interested in the ADA move-
ment in 1990 for a couple of reasons. Th e fi rst was growing up with my cousin Jackie, born with spinal bifi da and spent her entire life in a wheelchair. I remember bouncing
featur e
Pervious Concrete and
A Good CombinationADA Compliance-
537303_STEPHENS.indd 1 7/25/11 3:48:54 PM
8 ı SEPTEMBER/OCTOBER 2011
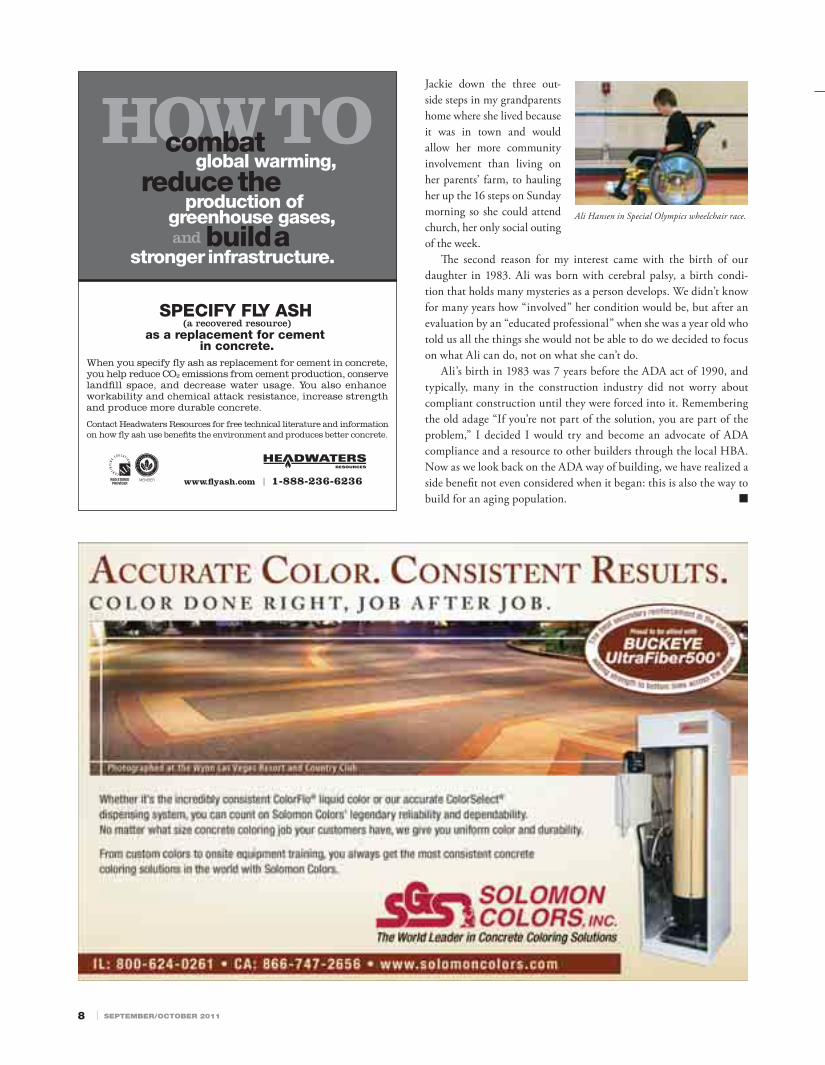
Jackie down the three out-side steps in my grandparents home where she lived because it was in town and would allow her more community involvement than living on her parents’ farm, to hauling her up the 16 steps on Sunday morning so she could attend church, her only social outing of the week.
Th e second reason for my interest came with the birth of our daughter in 1983. Ali was born with cerebral palsy, a birth condi-tion that holds many mysteries as a person develops. We didn’t know for many years how “involved” her condition would be, but after an evaluation by an “educated professional” when she was a year old who told us all the things she would not be able to do we decided to focus on what Ali can do, not on what she can’t do.
Ali’s birth in 1983 was 7 years before the ADA act of 1990, and typically, many in the construction industry did not worry about compliant construction until they were forced into it. Remembering the old adage “If you’re not part of the solution, you are part of the problem,” I decided I would try and become an advocate of ADA compliance and a resource to other builders through the local HBA. Now as we look back on the ADA way of building, we have realized a side benefi t not even considered when it began: this is also the way to build for an aging population. ■
Ali Hansen in Special Olympics wheelchair race.
HOWTOcombatreducethe
global warming,
production ofgreenhouse gases,
buildastronger infrastructure.
and
Contact Headwaters Resources for free technical literature and informationon how fly ash use benefits the environment and produces better concrete.
When you specify fly ash as replacement for cement in concrete,you help reduce CO2 emissions from cement production, conservelandfill space, and decrease water usage. You also enhanceworkability and chemical attack resistance, increase strengthand produce more durable concrete.
SPECIFY FLY ASH (a recovered resource)
as a replacement for cementin concrete.
www.flyash.com I 1-888-236-6236MEMBER
373895_Headwaters.indd 1 3/13/08 4:32:44 PM
540122_Solomon.indd 1 7/7/11 12:46:10 AM
CONCRETE in focus ı 9
Parts I and II of the Concrete Quality series1,2 discussed that a good mea-sure and benchmark of concrete
quality is the Standard Deviation (SD) of compressive strength test results. The pri-mary factors that impact the SD are vari-ability associated with materials, production and testing. In order to reduce the strength standard deviation the concrete producer needs to manage those aspects of variability that can be controlled. This article discusses concrete strength variability due to varia-tion of aggregate from a single source.
Variability of Aggregate from a Single Source
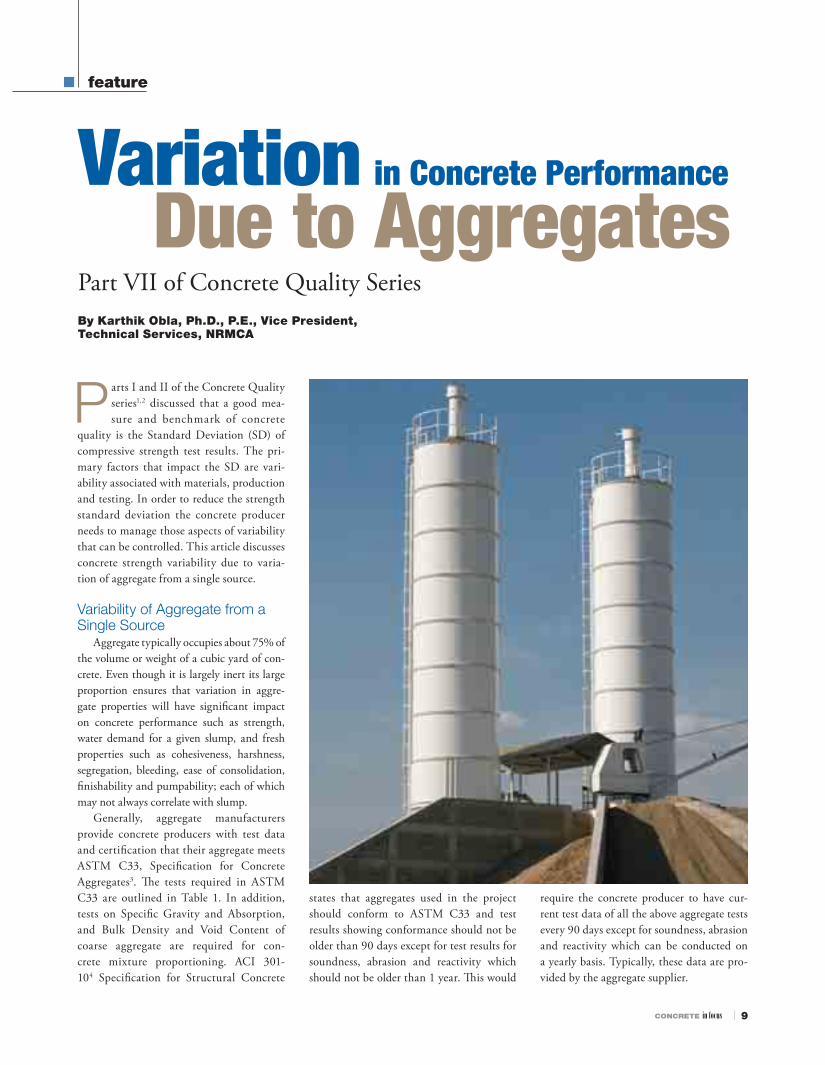
Aggregate typically occupies about 75% of the volume or weight of a cubic yard of con-crete. Even though it is largely inert its large proportion ensures that variation in aggre-gate properties will have signifi cant impact on concrete performance such as strength, water demand for a given slump, and fresh properties such as cohesiveness, harshness, segregation, bleeding, ease of consolidation, fi nishability and pumpability; each of which may not always correlate with slump.
Generally, aggregate manufacturers provide concrete producers with test data and certifi cation that their aggregate meets ASTM C33, Specifi cation for Concrete Aggregates3. Th e tests required in ASTM C33 are outlined in Table 1. In addition, tests on Specifi c Gravity and Absorption, and Bulk Density and Void Content of coarse aggregate are required for con-crete mixture proportioning. ACI 301-104 Specifi cation for Structural Concrete
By Karthik Obla, Ph.D., P.E., Vice President,Technical Services, NRMCA
Part VII of Concrete Quality Series
states that aggregates used in the project should conform to ASTM C33 and test results showing conformance should not be older than 90 days except for test results for soundness, abrasion and reactivity which should not be older than 1 year. Th is would
require the concrete producer to have cur-rent test data of all the above aggregate tests every 90 days except for soundness, abrasion and reactivity which can be conducted on a yearly basis. Typically, these data are pro-vided by the aggregate supplier.
feature
Variation in Concrete Performance
Due to Aggregates

10 ı SEPTEMBER/OCTOBER 2011
Depending on aggregate production vol-umes at the quarry for internal QC, aggre-gate manufacturers conduct daily or weekly testing of certain aggregate property tests. Table 2 adapted from ACI 221R4 shows a typical quality control program listing the routine control tests to be conducted by both the aggregate and the concrete produc-ers. Only a smaller number of tests as com-pared to Table 1 are included here. Th is is due to the following reasons:1. It is impractical to do all of the tests at
the stated frequency.2. Depending on the source, some of the
aggregate properties do not change as much and so it is adequate to do quality control tests more frequently on proper-ties that tend to change more often.Th e reader is directed to ACI 221R4 and
ASTM STP 169D (chapters 29, 30 and 31) for a detailed discussion of aggregate tests and eff ects that the aggregates have on concrete performance. Th e following sec-tion briefl y discusses how the aggregate test results aff ect concrete mixture proportion-ing and performance.
Specific Gravity and Absorption of the Aggregate
Specific gravity (SG) and absorp-tion of the aggregate tested according to ASTM C127 and C128 for coarse and fine aggregate, respectively, are unlikely to vary significantly. SG of the aggregate is used in concrete mixture proportioning
and changes in SG will change the volu-metric composition of the mixture and likely result in discrepancies in yield of concrete batches. Absorption is used to calculate the batch water content of the concrete and using incorrect values can lead to inaccurate mixing water amounts, incorrect w/cm and therefore variations in strength and other concrete properties impacted by water content. High varia-tion in specific gravity speaks to the lack of source control and will need frequent concrete mixture adjustments.
Aggregate Moisture ContentAggregate moisture content should be
measured and batch water corrected as discussed in Part V of this article series6. An attempt should be made to maintain a uniform aggregate moisture content when batching concrete. Th is is accomplished in fi ne aggregates by adopting good drain-ing storage practices and ensuring that the fi ne aggregate stockpiles have been inactive long enough. While fi ne aggregates with a round smooth shape can drain within 12 hours fi ne aggregate that have angular/fl at particles may take up to a week. While wet sand generally contributes more free mois-ture to a concrete batch, moisture content of coarse aggregate should not be ignored or assumed. Moisture probes that are well calibrated frequently and connected to con-trol systems that allow for automated water adjustment can considerably improve the
batch to batch uniformity of concrete for fresh and hardened properties.
Void Content in Coarse Aggregates
Aggregate bulk density and void con-tent (ASTM C29), also known as the Dry Rodded Unit Weight (DRUW), is recom-mended for coarse aggregates. Th e DRUW is used in concrete mixture proportioning to establish the amount of coarse aggregate in a concrete mixture. Th e void content determined is a function of the aggregate particle shape, texture and grading. If the DRUW test is conducted on a fi xed grading the void content will depend on the coarse aggregate shape and texture - with rounded aggregates with smoother texture resulting in lower void contents. Th e coarse aggregate void content determined in accordance with C29 in as-received grading will not diff er much from that determined at a fi xed grad-ing as long as there is not an excess amount of aggregates in the fi ner particles sizes.
Based on an large experimental study, Bloem and Gaynor (1963)7 reported that when diff erent coarse aggregate sources were used with a single source of fi ne aggregate to make concrete every 1 percent increase in coarse aggregate void content determined according to ASTM C29 (fi xed grading) led to an average increase in mix-ing water content of 0.5 gal/yd3 for a con-crete slump of 2 to 3 in. Wills (1967)8 tested nine gravels and found the coarse aggregate void contents determined according to ASTM C29 (fi xed grading) correlated very well with the mixing water demand (i.e. mixing water quantity required for a fi xed slump). Th e void contents varied from 33 to 42 percent and the corresponding water demand for concrete with a control fi ne aggregate ranged by about 33 lb/yd3. Large amounts of fl at and elongated particles as measured according to ASTM D47919 can make concrete mixtures too harsh for some placement methods resulting in voids, hon-eycombing or pump blockages.
Void Content of Fine AggregatesASTM C1252 describes the determina-
tion of the uncompacted void content of fi ne aggregate. If the test is conducted on an as-received aggregate grading (Method C), the void content is infl uenced by particle shape, surface texture and grading. If the test is conducted on a standard aggregate grading
Don’t let hot water shortages slow you down, ensure your hot water supply keeps up with
YOUR demand.
To schedule an on-site plant analysis or for information contact Kemco Systems
800.633.7055
KEMCO SYSTEMS
RM99Direct Contact Water Heater
Kemco Systems is a proud memberand supporter of the NRMCA
STOP
The RM99 Direct Contact Water Heater • 99.7% fuel efficient • Instantaneous hot water • Stainless steel, non-pressurized unit • Convenient 4-point connection
LOSING BUSINESS!
254429_Kemco.indd 1 1/6/11 11:42:08 AM

CONCRETE in focus ı 11
(Method A), the void content depends on the aggregate shape and texture – with rounded aggregates with smoother texture giving lower void contents. Fine aggregate shape and texture infl uences the water demand and concrete workability more than coarse aggregate.
Wills (1967)8 tested 9 fi ne aggregates and found that the void content measured using a fi xed grading – similar to ASTM C1252 (Method A) – correlated very well with the mixing water demand. Th e void contents of sands varied from 39 to 50 per-cent; the corresponding water demand for concrete with a control gravel at a target slump ranged by about 50 lb/yd3 (Figure 1); and the compressive strength ranged by about 2000 psi (Figure 2). Gray and Bell (1964)9 recommended a maximum void content in manufactured fi ne aggregate of 53 percent (Method B in C1252) and noted that this value restricts the use of screen-ings that almost invariably have poor par-ticle shape, uncontrolled grading and are usually troublesome.
After reviewing various studies Gaynor and Meininger (1983)10 reported that every 1 percent increase in fi ne aggregate void con-tent (measured at a fi xed grading) resulted in an increase in mixing water content of 3 to 8 lb/ yd3 for a target slump – the higher value would apply when diff erent aggregate sources are compared and the smaller value would apply when changes in processing changes particle shape at a single source.
Aggregate GradingTh e aggregate sieve analysis, conducted
in accordance with ASTM C136, and the fi neness modulus (FM) must be deter-mined for both coarse and fi ne aggregates. Th e fi neness modulus (FM) is an empiri-cal number related to the aggregate grading with higher FMs corresponding to aggre-gates that are coarser. However, aggregates with the same FM can have diff erent grad-ing. ASTM C33 has requirements on the grading of coarse and fi ne aggregates and places limits on the FM of fi ne aggregates. ASTM C33 requires concrete fi ne aggre-gate to have an FM between 2.3 and 3.1. As a control on same source uniformity, it indicates that the FM should not vary by more than 0.20 from the base FM. In the ACI 211 mixture proportioning procedure, the FM of the fi ne aggregate is used in con-junction with the DRUW of the coarse
aggregate to determine the aggregate pro-portions in concrete mixtures. Finer sands (lower FM) result in increased coarse aggre-gate content at the same nominal maxi-mum size of coarse aggregates. Changes in fi ne aggregate FM over a range as much as 1.0 have been noted in a day’s production5. If the fi ne aggregate FM changes more than 0.20 then the relative proportions of coarse and fi ne aggregate amounts must be adjusted, as recommended by ACI 211. An increase in the sand FM by 0.20 will reduce the coarse aggregate quantity by about 60 lb/yd3 with similar increase in the weight of fi ne aggregate. Another option is to change the coarse and fi ne aggregate amounts such that the FM of the combined aggregate stays the same even though the FM of the coarse or fi ne aggregate has changed.
Fine aggregate grading infl uences con-crete performance more than coarse aggre-gate. Apart from FM it is useful to track the percent retained on each (or selected) sieve size, particularly for the fi ne aggregate, on a control chart for the following reasons:1. In fi ne aggregate the amount of mate-
rial passing the 300-μm (No. 50) sieve should be 15 to 30% for good pumpability5.
2. Gaynor (1977) has reported that increased minus 75-μm (No. 200) or 150-μm (No. 100) sieve size material in fi ne aggregate material require an increased dosage of air entraining admixture to obtain required air content. It is also reported12 that an increase in the fi ne aggregate particles between 600-μm and 150-μm sieves entraps more air than either fi ner or coarser particles.
3. Th e amount of fi ne aggregate pass-ing the 300-μm (No. 50) and 150-μm (No. 100) sieve have a great infl uence on workability, fi nishability, stickiness, potential for segregation and bleeding of concrete. Th e total amount of fi nes that includes the cementitious materi-als and that from aggregates should be evaluated when workability is adversely eff ected. Hand fi nishing may require higher fi nes content as opposed to machine fi nishing.ACI 304R provides good practices for
handling aggregates at the concrete plant to prevent segregation, contamination, varia-tion in moisture content and degradation resulting in more fi nes. Some of the impor-tant recommendations are:
• Build stockpiles, where necessary, in horizontal or gently sloping layers. Avoid conical stockpiles or any unloading pro-cedure involving dumping of aggregates down sloping sides of piles.
• Keep trucks, bulldozers and wheel load-ers off stockpiles to prevent degradation and contamination.
• Prevent overlap of the diff erent aggregate sizes by suitable walls or ample spacing between piles.
• Protect dry fi ne aggregate by the wind using tarps or windbreaks.
• Fine aggregate transported over wet, unimproved haul roads can become con-taminated with clay lumps that is usu-ally accumulated between the tires and on mud fl aps and gets dislodged during dumping of the transportation unit. To remove this, place a scalping screen over the batch plant bin.
• If possible, separate aggregates into indi-vidual sizes and batch separately to mini-mize segregation.
• If aggregate degradation is likely, rescreen coarse aggregate as it is charged to the bins at the concrete plant to maintain undersized materials (minus No. 4 sieve) to as low as 2%.
• Aggregate stockpiles should be built on a base that minimizes ground contami-nation when aggregates are removed for intra-plant movement.
Material Finer than75-μm (No. 200)
Aggregate particles that are fi ner than the 75-μm sieve (No. 200) are measured by ASTM C117 and are generally composed of silt and clay for natural sands or grav-els5. For crushed stone or manufactured sand, the fi nes are predominantly com-posed of dust of fracture. ASTM C33 has limits on material fi ner than 75-μm (No. 200) sieve for both coarse and fi ne aggre-gates. A higher amount of material fi ner than the No. 200 sieve will typically result in increased water demand and reduced air content. Th is is more signifi cant when the fi nes are largely composed of clay and/or shale as opposed to being primarily dust of fracture from crushing. A variation on the material fi ner than the No. 200 sieve can result in variation in water demand and air content. Th e variation on the material fi ner than No. 200 sieve can occur due to the following reasons:

12 ı SEPTEMBER/OCTOBER 2011
Table 1. Aggregates Tests Required in ASTM C33
Aggregate Type Required Tests
Both coarse and fi ne aggregates
Grading and Fineness Modulus (ASTM C136), Amount of material fi ner than 0.075-mm (No. 200) sieve (C117), Coal and Lignite (C123), Chert (C123 and if necessary C295), Clay Lumps and Friable Particles (C142), Sulfate Soundness* (C88), Alkali Silica Reactivity* (C1260, and C1293).
Coarse only Abrasion* (C131 or C535)
Fine only Organic impurities (C40 and if necessary C87)
Table 2. Suggested Quality Control Program for Aggregates (Adapted from ACI 221R)
Test Test Method Minimum Test Frequency
Aggregate Plant Samples
Coarse aggregate
Grading and FM ASTM C136 Once per day
Cleanliness ASTM C117 Once per day
Void Content ASTM C29 Once per week
Specifi c Gravity and Absorption ASTM C127 Once per 90 days
Fine aggregate
Grading and FM ASTM C136 Once per day
Cleanliness ASTM C117 Once per day
Void Content (fi xed grading) ASTM C1252 (Meth A) Twice per week
Specifi c Gravity and Absorption ASTM C128 Once per 90 days
Sand equivalency ASTM D2419 Twice per week*
Concrete Plant Samples
Coarse aggregate
Grading and FM ASTM C136 Once per 2 weeks
Cleanliness ASTM C117 Once per week
Void Content (fi xed grading) ASTM C29 Once per week
Specifi c Gravity and Absorption ASTM C127 Once per year
Fine aggregate
Grading and FM ASTM C136 Once per week
Cleanliness ASTM C117 Once per week
Void Content (fi xed grading) ASTM C1252 (Met A) Twice per week
Sand equivalent ASTM D2419 Once per week*
Specifi c Gravity and Absorption ASTM C128 Once per year
All aggregates for the tests should be sampled according to ASTM D75 and if necessary the sample size reduced according to ASTM C702.ASTM C33 has limits on all of the tests; for chert there is limit only on coarse aggregate; for fi neness modulus there is limit only on fi ne aggregate.*ACI 301 requires that results of these tests should not be older than 1 year. Results of all other tests should not be older than 90 days.
*Frequency should reduce to once per 90 days if the aggregate is known to typically pass this test.Aggregate moisture testing is discussed in Part V of the article series.

CONCRETE in focus ı 13
1. Poor quality control in washing of aggre-gates at the pit or quarry which can result in dirty aggregates with coatings.
2. Aggregates stockpiled in a wet condition can collect wind-borne dust and passing traffi c.
3. Improper practices by loader operator when stockpiling and removing materials from stockpiles.Aggregate surface coatings can also prevent
the cement paste from adhering to the aggre-gate particle, causing strength problems and may chemically react and stain the concrete.
In mixtures with higher cement factors, the cement fi nes tend to provide cohesion
and the presence of higher amounts of aggregate material fi ner than No. 200 sieve can lead to further increase in stickiness and related workability problems. In lower cement factor mixtures workability and cohesion can be improved by the presence of higher amounts of aggregate material passing the No. 200 sieve. Self consolidat-ing concrete has been successfully devel-oped using mineral fi ller (fi nes) to improve the stability (resistance to segregation) of fresh concrete. A decrease in the material passing the No. 200 may not always lead to improved workability. What is clear is it will lead to a change in workability.
Sand equivalencyTh e sand equivalent test (ASTM D2419)
indicates the relative proportions of clay-like or plastic fi nes and dust in fi ne aggregate that pass the 4.75-mm (No. 4) sieve. Specifi cations typically require a minimum sand equiva-lency (SE) of 70 or 75 in this test. A low SE value suggests more clay-like or plastic fi nes and therefore the water demand and fresh properties of concrete can be aff ected. After testing about 150 fi ne aggregate sources Gaynor and Meininger (1983)11 reported that several aggregates passing the ASTM C33 limits on material fi ner than No. 200 sieve still failed the typical limits set for the SE test. Th erefore, the SE test should be conducted at a greater frequency for such aggregates. A methylene blue test13 may be an even better indicator of the presence of clay in the aggre-gate. Diff erent type forms of clay minerals absorb methylene blue indicator to diff er-ent degrees, so the type of clay in aggregates needs to be known.
Using Aggregate Test ResultsConcrete producers should develop rela-
tionships with aggregate manufacturers so that the tests required by ASTM C33 (Table 1) and the tests conducted by aggregate manufactur-ers for quality control (Table 2) are received at the stated frequency. ACI 221R states that the aggregate producer should test the material as it is loaded out of the aggregate producer’s stockpiles to be shipped to the customer; Th e concrete producer then assumes responsibility for grading variations generated between the point of materials load-out and use in concrete. Concrete producers should take aggregate samples for testing as close to the batching pro-cess as possible, understanding that aggregate grading changes every time it is moved.
Table 1 test results
Th e fi rst thing is to ensure that the aggre-gates that are supplied meet ASTM C33 requirements as required by ACI 301. Most of the test results are required every 90 days except for soundness, abrasion and reactivity which are required on a yearly basis. As soon as the test results are available the concrete producer should ensure that the test results meet the requirements of ASTM C33.
Table 2 test results – Tests conducted by the
Aggregate Producer
Th e aggregate producer should carefully look at the grading and FM results to ensure
240
260
280
300
320
340
38 40 42 44 46 48 50 52Fine Aggregate, % Voids
Mix
Wat
er, l
b/yd
3Figure 1. Mixing Water Demand for Concrete made with diff erent fi ne aggregates and
control gravel
Figure 2. Compressive Strength of Concrete made with diff erent fi ne aggregates and control gravel
3000
4000
5000
6000
7000
38 40 42 44 46 48 50 52Fine Aggregate, % Voids
Com
pres
sive
Stre
ngth
, psi
+

14 ı SEPTEMBER/OCTOBER 2011
that the percent passing each sieve meets grad-ing limits set in ASTM C33. It may be accept-able to have one in fi ve consecutive grading test results fall outside the limits. Moving average of 5 test results shows trends in the grading results not otherwise apparent. Th e aggregate producer can use that to adjust the aggregate plant to maintain a certain average value. If the grading is controlled the FM is likely to vary in a narrow range (±0.2 from the base FM) as required by ASTM C33 for fi ne aggregate. Th e aggregate producer should look at the void contents of the coarse and fi ne aggregates which are primarily infl uenced by aggregate shape and texture. If the results fl uctuate by more than ±1.0 percent from the base value then the producer should undertake process changes to ensure that the shape and texture does not vary signifi cantly. On the contrary, the aggregate producer can use control charts of moving average of 5 void content test results to adjust the aggregate plant to maintain a certain average value. Th e aggregate producer can use similar control charts for cleanliness test results to adjust the aggregate plant so that the material stays within ASTM C33 limits and certain aver-age values are maintained. SE test results are valid for certain fi ne aggregate sources and when required to be tested by local authori-ties as discussed earlier. For those sources the aggregate producer can use control charts for SE test results to adjust the aggregate plant so that the material consistently has SE values over 70 percent and certain average values are maintained
Th e concrete producer should make appro-priate adjustments to concrete mixture propor-tions based on the specifi c gravity, absorption and dry rodded unit weight of coarse aggregate and grading and FM of sand results that the aggregate producer supplies every 90 days. In addition, the concrete producer should care-fully look at the grading, FM, void content, cleanliness and SE test results, and make sure that the aggregate plant is making eff orts to produce a material that is consistent enough to help attain low variability concrete.
Table 2 test results – Tests conducted by the
Concrete Producer
Th e concrete producer establishes credibil-ity of the test reports from each aggregate source by conducting verifi cation tests on specifi c gravity and absorption (possibly other proper-ties) on an annual basis. Th e results should be
sent to the aggregate producer and signifi cant variations (if any) should be discussed.
Th e fi ne aggregate grading and void content tests are conducted at a higher frequency than that for coarse aggregates to refl ect the greater infl uence fi ne aggregate grading, shape, and tex-ture has on concrete performance. Void content tests for both coarse and fi ne aggregates should be conducted at a fi xed grading to identify the eff ect of aggregate shape and texture. Th ere are no specifi cation requirements for this. If the test results between consecutive shipments vary by more than 1.0% then concrete performance can be infl uenced as discussed earlier and there-fore suitable changes to concrete mixture pro-portions may be needed. Moving average of 5 test results shows trends in the results not other-wise apparent. If there is a noticeable trend or if the results fl uctuate by more than ±1.0 percent from the base value the producer can share the results with the aggregate producer and have discussions to ensure that the aggregate shape and texture do not vary substantially.
If the grading test results show a greater variation than that obtained from the aggre-gate producer it is clear that the stockpiling and handling practices at the concrete plant may have to be improved. If the grading test results exceed ASTM C33 requirements then the results should be shared with the aggregate producer and a check test made. As discussed earlier the percent passing the fi ner sieves for the fi ne aggregates can signifi cantly infl uence the concrete performance. So if signifi cant changes are noted in those sieve sizes concrete mixture adjustments (if allowed) can be made. To get an overall eff ect of grading FM values can be used. If the fi ne aggregate FM changes more than 0.20 then the coarse aggregate and fi ne aggregate amounts must be changed as rec-ommended by ACI 211. If the coarse aggregate FM changes more than 0.20 the coarse and fi ne aggregate amounts must be adjusted such that the combined aggregate FM stays the same.
Cleanliness test results should be plotted on a control chart. If the results exceed ASTM C33 requirements then the results should be shared with the aggregate producer and a check test made. Stockpiling and handling practices should also be scrutinized to see if fi nes are inadvertently being incorporated. If the test results between consecutive ship-ments vary by more than 0.5% then concrete performance can be infl uenced as discussed earlier. Suitable adjustments to concrete mix-ture proportions may be needed. Moving
average of 5 test results shows trends in the results not otherwise apparent.
SE test results should be plotted on a control chart. If the results decrease below 75 percent the aggregate producer should be asked to increase the results. If the results decrease below 70 percent a dif-ferent fi ne aggregate source may have to be considered until this source decreases below 70 percent. ■
*To read parts I-IV or the Concrete Quality
Series, visit www.nrmca.org.
References1.Obla, K.H., “How Good is your QC – Part I of
Concrete Quality Series”, Concrete InFocus, May-June 2010, Vol. 9, No. 3, NRMCA, pp. 17-18.
2.Obla, K.H., “Sources of Concrete Strength Variation – Part II of Concrete Quality Series”, Concrete InFocus, July-August 2010, Vol. 9, No. 4, NRMCA, pp. 21-23.
3.ASTM C29, C33, C40, C87, C88, C117, C123, C127, C128, C131, C136, C142, C295, C1260, C1293, C535, C702, C1252 Annual Book of ASTM Standards, American Society of Testing Materials, Volume 4.02, Concrete and Aggregates, ASTM International, West Conshohocken, PA, 2010, www.astm.org.
4.ACI 301, 221R, 211.1, 304R, ACI Manual of Concrete Practice, American Concrete Institute, Farmington Hills, MI, www.concrete.org.
5.Signifi cance of Tests and Properties of Concrete and Concrete-Making Materials, ASTM STP 169D, edited by Lamond, J.F., and Pielert, J.H., May 2006, American Society of Testing Materials, West Conshohocken, PA, www.astm.org.
6.Obla, K.H. and Lobo, C.L., “Mixing Water Control – Part V of Concrete Quality Series”, Concrete InFocus, March-April 2010, Vol. 10, No. 2, NRMCA, pp. 23-27.
7.Bloem, D.L., and Gaynor, R.D., “Eff ect of Properties on Strength of Concrete, Journal of the American Concrete Institute, Vol. 60, No. 10, October 1963, pp. 1429-1456.
8.Wills, M.H., Jr., “How Aggregate Particle Shape Infl uences Concrete Mixing Water Requirement and Strength”, Journal of Materials, Published by ASTM, Vol. 2, No. 4, December 1967, pp. 843-865.
9.ASTM D75, D2419, D4791 Annual Book of ASTM Standards, American Society of Testing Materials, Volume 4.03, Road and Paving Materials; Vehicle Pavement Systems, www.astm.org.
10Gray, J.E., and Bell, J.E, “Stone Sand”, Engineering Bulletin, No. 13, National Crushed Stone Association, Washington D.C., 1964, 70 pgs.
11.Gaynor R.D., and Meininger, R.C., “Evaluating Concrete Sands: Five Tests to Determine Quality”, Concrete International, Vol. 5, No. 12, December 1983, pp. 53-60.
12.Kosmatka, S.H., Kerhoff , B., and Panarese, W.C., “Design and Control of Concrete Mixtures”, Fourteenth Edition, Portland Cement Association, 2002, www.cement.org, 358 pgs.
13.AASHTO TP57-99, Standard Test Method for Methylene Blue Value of Clays Mineral Fillers, and Fines. AASHTO Standards. American Association of State Highway and Transportation Offi cials, Washington, D.C., 2000.

CONCRETE in focus ı 15
Quality Corner
How many ready mixed concrete producers consider the load opera-tor as a part of the production
team? Probably most of us! I would argue that the loader operator is a lso a very important member of the quality control/quality assurance team. The loader opera-tor is a QC technician! The production of good quality concrete starts (and unfor-tunately may end) with the loader opera-tor. The entire day’s production of good, high quality concrete is controlled by the loader operator.
Th e loader operator’s day should start with performing regular preventative maintenance on the asset. Th e loader oper-ator must ensure the loader will function throughout the day without any interrup-tions due to maintenance malfunctions. Any problems with the loader will certainly create a gap in delivery of concrete in a timely manner. We all know that interrup-tions can cause cold joints, loss of slump or even accelerated set time issues. Th e worse possible scenario is that the concrete contractor will send you back-charges due to the delays. Th erefore, the loader should be “greased” on a regular basis and “fueled up” before production begins for the day. Th e bucket should be cleaned and free of deleterious material.
Prior to beginning daily production, the quality control technician will need the assistance of the loader operator in order to expose the aggregate in the stockpiles so that they can collect a representative sample. Th e technician can then perform a moisture content test on the sample col-lected. Th e loader operator can certainly move the aggregates easier and more eff ec-tively than a technician with a shovel. It is
By Fernando Rodriguez
vital to collect a representative sample for the moisture content test, in order that the batchman can properly adjust the required mixing water for each batch of concrete.
A well trained loader operator under-stands the importance of the moisture
on the aggregates. For example, the well trained loader operator will avoid the stand-ing water in the aggregate bins. Th eoretically, the aggregate bins have been constructed in such a manner that the standing water will
Is the Loader Operator
continued on page 18
a Member of Your Quality Control Team?

Concrete Sustainability Hub@MIT – Special Research Brief
Designing for Sustainable Pavements Problem Increasing the sustainability of our infrastructure is accomplished in ways other than just developing better materials and more efficient processes: it is also about employing the right designs. For pave-ments, overdesign causes excess materials to be used during construction, leading to higher econom-ic costs and environmental impacts. Optimizing design thicknesses for prescribed service lives, cli-mates, and traffic conditions allows pavement engi-neers to create structures with minimal waste.
Approach Advancements in design techniques allow for such optimizations. Pavement design tools, such as the National Cooperative Highway Research Program’s Mechanistic-Empirical Pavement Design Guide (MEPDG), use embedded models to forecast the propagation of various pavement distresses for combinations of materials properties and external parameters. MIT has developed three case studies to demonstrate the effect that design optimization can have on costs and CO2 emissions. Convention-al designs are compared against MEPDG designs for sample low-volume, medium-volume, and high-volume highways in California. The designs are evaluated over a 50-year analysis period using life-cycle assessment (LCA) and life-cycle cost analysis (LCCA) principles.
FindingsOptimized designs can provide significant economic and environmental benefits. For the three case stud-ies, the optimized designs reduce agency net present cost (NPC) by roughly 40–50% and CO2 emissions by roughly 30%. These are likely to be conservative estimates, as other life-cycle implications, such as shorter construction times and reduced transporta-tion, are not considered in the current demonstrations studies. User costs due to traffic delay may also be reduced using optimized design thicknesses.
Using optimized designs helps reduce both embodied CO2 emissions and net present value (NPC)
The use of optimized design thicknesses helps reduce costs and CO2 emissions by minimizing the materials needed to construct a pavement. The economic and environmental benefits are significant and can help transportation agencies reduce their carbon footprint while working within tight budgetary constraints.
More The research presented here is a part of an ongoing project by the pavements LCA team at the MIT Concrete Sustainability Hub. More information onthe MEPDG model can be found at <http://www.trb.org/mepdg/>.
The MIT Concrete Sustainability Hub is co-funded equally by the Ready Mixed Concrete (RMC) Research & Educa�on Founda�on and Portland Cement Associa�on. NRMCA is providing technical advice and will play a key role in the technology transfer of the results and informa�on coming from the MIT CSH. To view addi�onal briefs on the progress of the Life Cycle Assessment and Concrete Science research pla�orms of the Hub, you can link from the Founda�on’s home page at www.rmc-founda�on.org or go to h�p://web.mit.edu/cshub/index.html.
Impact
8Sustainable.indd 1 8/3/11 11:01:04 PM
PRODUCT AND SERVICES Marketplace
CONCRETE in focus ı 17
Reason #42 - Increase Productivity
Reason #18 - Improve Concrete Properties
Reason #1 - Reinforce Your Bottom Line
The Euclid Chemical Company has been providing field-proven concreteadmixtures for over 100 years. Our century-old dedication to continued researchand development of cutting edge admixture productsputs us on the forefront of concrete technology.
It comes down to one thing, you need a companythat has been there, and will continue to be there.
1-800-321-7628
www.euclidchemical.com
Admixtures
ONE SOURCE. Hundreds of Reasons.
yre productsology.
mpanye there.
100 YEARSof
E X P E R I E N C E
491241_TheEuclid.indd 1 8/18/10 11:47:03 PM
Direct Contact Water Heating reduces annualoperating costs while increasing productivity
Advantages:• 99.8% Combustion Efficiency
• Sizes from 20 Gpm to 600 Gpm
• Temperatures to 180˚ Fahrenheit
• Constant temperature
• 30% to 40% Fuel savings
Features:• Welded to ASME standards
• Non pressure vessel
• All Stainless steel construction
• Packaged systems
• Interfaces with your existing water system
Ludell Manufacturing5200 West State StreetMilwaukee,WI 53208(800) 558-0800(414) 476-9864 (fax)[email protected]
457841_ludell.indd 1 2/18/10 8:08:28 AM
Instant Steam GeneratorDesigned specifically for heating water and
aggregates, all with the one unit.
Fuel savings up to 50%
Low carbon monoxide levels
Full bore steam in 15 seconds
No stationary engineer required
No chemical treatment of water
for More infoCall: 1-800-388-1339
or visit: www.steamengineering.ca
“Will not make aggregate MUSHY”
419624_Steam.indd 1 2/12/09 8:51:46 PM
8Sustainable.indd 1 8/3/11 11:01:04 PM

18 ı SEPTEMBER/OCTOBER 2011
drain away from the aggregates. After a recent rainstorm in Baltimore, the loader operator at our plant spent a few minutes pushing the aggregates up the stockpile. He was attempting to allow the coarse aggre-gate to drain the excessive water. In order to not collect the standing water, the bucket should be positioned about six inches from the bottom of the bin. Not only will he avoid collecting the water, but the ultra fi nes (non representative material) will not be picked up.
At our plant, we have instructed our loader operator, James Jennings, to stay on one side of the stockpile and let the dump trucks bringing in fresh material, place it on the other side of the stockpile. The idea is to keep the new aggregates that are being delivered to the plant on one side of the stockpile and not use it for production. The new material may have different moisture contents than the aggregates in the stockpile. By pulling aggregates from the same side, the mois-ture will be somewhat constant. A mem-ber of the quality control team will need to perform another moisture content test (with the assistance of the loader opera-tor) on the new aggregates and give those numbers to the batchman.
A well trained loader operator should be careful not to contaminate the over-head bins. How much time is lost when you have to stop in the middle of the day to drain your coarse aggregate bin because it was contaminated with sand? The loader operator must be conscious of moving the conveyor belt before sending up another aggregate.
A well trained loader operator will notify the QC or management personnel when he or she notices major differences in the aggregates. Mr. Jennings is constantly informing us of changes in the color of the fine aggregates. He has also informed us of contamination issues with the stone. Remember that the dump truck drivers sometimes back-haul other products and their beds may be contaminated with dif-ferent types of material. Recently, we had a dump truck that was back hauling coal. James noticed the black dust on the sand and he immediately contacted us. The sand vendor sent us a new load of material to replace the contaminated sand and we returned the contaminated sand. Thanks to Mr. Jennings, we averted a potentially major issue. Had we used that sand, there is no telling what effects the carbon dust may have had on any air-entrained con-crete mixtures, not to mention color, set-ting time and strength issues.
In our operations, the loader operator is a key member of the quality control group. Th e loader operator can put an extra set of eyes on the aggregates in the bins as well as the aggre-gates that are being delivered. An experienced, well trained loader operator can be the fi rst line of defense for the QC department. A cubic yard of concrete is made up of approximately 70-75% by volume of aggregates. Th erefore, a high quality cubic yard of concrete starts with a good design and good aggregates. Your loader operator controls 70-75% of the material going into your concrete. A good loader operator is worth his or her weight in…… “aggregates”. ■
For more information, contact Mr. Rodriguez at
continued fron page 15
StephensMFC. CO., INC.P.O. Box 488Tompkinsville, KY 42167Phone: (270) 487-6774Fax: (270) 487-8368Toll free: 800-626-0200E-mail: [email protected]: www.stephensmfg.comWe used this tough economic climate to expand both our services and equipment—we have two new portable concrete plants (Falcon and Mus-tang) and a New Portable RCC Mixer. We are now the exclusive manufacturer for the Inventure Reversing Drum Mixer in Canada and the USA. The NEW Falcon Plant is an extremely large portable plant. The NEW Mustang plant is a mobile in truss silo style plant. We consciously have chosen to guarantee our customers that every plant made by Stephens MFG will meet the local seismic, and wind loads for their job site.
ADMIXTURES
BASF Construction Chemicals ..... Inside Front Cover
www.basf-admixtures.com
Solomon Colors ......................................................8
www.solomoncolors.com
The Euclid Chemical Company .............................17
www.euclidchemical.com
BATCH PLANTS
Stephens Manufacturing Co., Inc. .....................6/18
www.stephensmfg.com
CEMENT
Holcim ....................................................................3
www.holcim.us
CONCRETE CHIPPING
Coast 2 Coast .......................................................18
www.c2c-chipping.com
CONCRETE CURING EQUIPMENT
Kemco Systems, Inc. ............................................10
www.kemcosystems.com
CONCRETE PUMPS & PLACING BOOMS
Sany America inc. ........................Inside Back Cover
www.sanyamerica.com
FLY ASH
Headwaters Resources ..........................................8
www.fl yash.com
TRANSMISSIONS (TRUCK/AUTOMATIC)
Allison Transmission ................. Outside Back Cover
www.allisontransmission.com
WATER HEATING EQUIPMENT
Heatec, Inc. ............................................................4
www.heatec.com
Kemco Systems, Inc. ............................................10
www.kemcosystems.com
Ludell Manufacturing ...........................................17
www.ludellmanufacturing.com
Steam Engineering ...............................................17
www.steamengineering.ca
advertisers’ index/advertiser.com
536690_Coast.indd 1 6/29/11 1:50:35 PM
508927_Stephens.indd 1 12/31/10 9:42:46 AM
525950_Sany.indd 1 4/7/11 9:54:57 AM

Class Z.
100 World Dr. Suite 218, Peachtree City, GA 30269Tel: 678-251-2869 Fax: 770-631-7731Email: [email protected]
The Shapes of Things to Come. SANY...Investing in America.
525950_Sany.indd 1 4/7/11 9:54:57 AM

allisontransmission.com
No other “automatic” transmissions have put in the miles and years in the construction business to even come close to the proven productivity and reliability of Allison Automatics.
On the jobsite, Allison Automatics deliver the controlled power and traction to keep your trucks rolling through
challenging ground conditions.
On the highway, Allison Automatics provide superior acceleration to speed up your duty cycles. The more work
your trucks accomplish, the more you deliver to your bottom line.
And when it comes to low maintenance and high uptime, nothing beats an Allison Automatic.
If you want your trucks to do more work and have the rugged endurance to do it, specify Allison Automatics.
®
ALLISON AUTOMATICS.
PROVEN RELIABLEON-ROAD, OFF-ROAD
AND ON PAPER.
524830_Allison.indd 1 4/30/11 6:08:40 PM

CONCRETE in focus ı 21
environmental scene
W e would all assume that all concrete plants have all the necessary environmental permits that they need from their applicable regulatory agencies, and for the over-
whelming majority of concrete producers this is a true statement. However, it still amazes me to find that there are still those out there that lack some pretty basic regulatory requirements. One of the answers I hear when I ask why this is, is that due to the economy the producer is trying to save money and hoping that they can “fly under the radar”. Yes, this still happens (and the concrete industry is not alone in this, it happens in most industries).
Th e wisdom of hoping to fl y under the radar aside, is this truly a sound fi nancial policy? Is this a policy that would be recommended for a successful business? Let’s take a look at two potential scenarios, using some modest (and realistic) numbers.
Non-compliant Plant “A” has avoided a relatively simple regula-tory requirement, such as the need to have an appropriate NPDES (National Pollutant Discharge Elimination System) Stormwater Discharge Permit. However, after a plant audit, the facility has been identifi ed by regulatory offi cials as lacking this permit, and now faces enforcement action. Assume the following: 1) Th e permit fee is $500, which must be paid. 2) Th e facility now must engage professionals to assist in addressing this problem, perhaps including legal fees and professional consultants. Assume these fees as in the range of $10,000 to $25,000. 3) Presume that this facility has fi ned by the regulatory agency $25,000, a fairly modest sum in these days (recent penalties levied for similar infractions within the concrete industry have been well in the six fi gure range). Th e total cost of non-compliance for this facility? Somewhere in the neighborhood of $35,500 and $50,500. Th at’s a lot of money. Especially in these challenging economic times when most ready mixed concrete producers have signifi cantly slashed expenses just to ensure the survival of their company.
Now, let’s look at compliant Plant “B”. Th is plant has the necessary NPDES permit, and has had it for years. Assume the following: 1) Th e permit fee remains at $500. 2) Professional fees should be much lower, which we will estimate at $5,000 (no legal fees likely needed!). 3) Th e facility has had no fi ne. Th e total cost of compliance at this facility under this scenario is $5,500, considerably less than the non-compliant plant.
The True Costs of Environmental ComplianceBy Douglas E. Ruhlin, CCPf, LEED Green Associate, Environmental / Sustainability Consultant, Resource Management Associates
Factor Non-Compliant Plant Compliant Plant
Permit Fees $500 $500
Professional Fees $10,000 - $25,000 $5,000
Fine $25,000 $0
Total = $35,500 - $50,500 $5,500
Yes, but the non-compliant plant saved a lot of money over the years not paying anything, right? Assuming a minimum savings of $30,000 from the table above comparing the minimum cost of non-compliance versus the cost of compliance, you can see that the cost equals out after 60 years of non-compliance, and “fl ying under the radar” (what is the chance of that for 60 years?). And, this does not include higher fi nes, additional fi nes should other regulatory requirements be missed, etc. Also, get in a real jam, and your professional fees and fi nes would likely be a lot higher.
And don’t believe the numbers above? Substitute your own fi gures – I doubt you’ll be able to justify any scenario where non-compliance pays off . Th e fi gures won’t lie – non-compliance just doesn’t make good business sense, regardless of the economic conditions.
Non-compliance also carries certain less tangible costs. For one thing, this can certainly damage your reputation, with the regulatory agency, neighbors, stockholders. Not good. For example, regulators will certainly make sure to inspect a non-compliant plant more closely in the future (adding a greater risk of more problems down the road), and may in fact require additional requirements for the non-compliant plant that compliant plants don’t face (for example, via a negotiated settlement). Th ese additional costs can add enormous extra cost. Many potential customers are now “buying green”, and the prospect of doing business with a known environmental violator may be less than entic-ing for them, possibly costing the chance to do future business on cer-tain projects. Th e costs there could also be enormous.
In reality, for most ready mixed concrete producers, non-compli-ance is a result of simply not knowing or unaware of permit rules and regulations. Unfortunately that’s no excuse in the eyes of regulators. It’s up to all producers to ensure they meet or exceed the minimum requirements to meet our industry’s environmental responsibility.
So what does this tell us? Compliance does indeed pay. If you are merely looking to save money, get into compliance and stay there. It’s a whole lot cheaper in the long run. ■
For further information on any of the issues in this article, Doug Ruhlin
can be contacted at Resource Management Associates, PO Box 512, Forked
River NJ 08731; (609) 693-8301; www.resourcemanagementassoc.com; or
via email at [email protected].

22 ı SEPTEMBER/OCTOBER 2011
American Society of Training and Development 2010 State of Industry Report Reflects Less Recession Impact than Anticipated
education matters
For the 14th year, ASTD released its in-depth report for companies and indus-tries to use as a benchmark. Based on
2009 figures, the average annual learning expenditure per employee increased from $1,068 in 2008 to $1,081—an increase of 1.2 percent. Learning functions were serving a smaller workforce; therefore the annual learning expenditure per employee increased slightly. The amount of learning expenditure as a percentage of payroll decreased slightly from 2.24 percent in 2008 to 2.14 percent in 2009. On average, direct learning expen-ditures increased from 0.59 to 0.71 percent of revenue and from 8.75 to 10.88 percent of profit in 2009. These percentages increased in 2009 because organizations’ financial commitment to learning and development held steady even while their revenue and profit decreased because of the recession.
Th ere were changes in the way the money was spent. For the fi rst time since 2004, orga-nizations increased their spending on out-sourcing as they increased reliance on external providers. Th e consolidated average spent on external services was 26.9 percent of the total learning expenditure, up from 22.0 percent in 2008. Outsourcing includes spending on con-sultants and outside providers of workshops and training sessions. Despite increased spend-ing on outsourcing, the majority of learning investment was internal. Internal costs for the learning function, including learning staff salaries, administrative costs and development costs, accounted for an average of 62.5 percent of learning expenditures in 2009.
Employees in the surveyed organizations accessed an average of 31.9 hours of formal learn-ing content in 2009, down from 36.3 hours in 2008. Although the number of hours of learn-ing decreased, the amount still demonstrates
By Eileen Dickson, Vice President, Education, NRMCA
that organizations expect employees to allocate a meaningful amount of time to formal learn-ing and development activities.
Th e breakdown of learning content by topic area changed only slightly. Th e content area with the largest percentage—profession- or industry-specifi c content—accounted for 17.2 percent of formal learning hours. Managerial and supervisory training was the second-largest content area in 2009 at 10.4 percent. Delivery of content in the informa-tion technology (IT) and systems category (9.3 percent) saw a slight decline in 2009. Despite declines in 2009, processes, proce-dures and business practices (9.2 percent), and mandatory and compliance training (7.8 percent) were content areas that organizations continued to emphasize.
In 2009, each learning staff was respon-sible for an average of 240 employees, down from 253 in 2008. Th is is consistent with the fact that many organizations continued to downsize their workforces in 2009 which reduced the average number of employees each learning staff served.
Th e amount of learning content produced and consumed per learning staff also decreased in 2009, as did the average cost per learning hour made available, although the average cost per hour used went up. Th e average num-ber of learning hours produced per learning staff decreased from 353 to 264 and the aver-age number of hours used per learning staff decreased from 5,507 to 5,350. Th e average cost per learning hour made available decreased 8.5 percent, from $1,528 to $1,398, while the average cost per hour used rose from $52 to $63. Th e cost per hour used increased because the average workforce size and the number of learning hours used decreased in 2009, while the investment in learning remained the same.
Employees in the surveyed organizations accessed an average of 31.9 hours of formal learning content in 2009, down from 36.3 hours in 2008. Although the number of hours of learning decreased, the amount still dem-onstrates that organizations expect employees to allocate a meaningful amount of time to formal learning and development activities.
After increasing steadily for fi ve years, the average percentage of learning hours available through e-learning was 36.5 percent, its high-est level since ASTD began collecting data on the use of technology 14 years ago. An increas-ingly large proportion of e-learning comprises online learning (self-paced and instructor-led online learning). In 2009, 27.7 percent of all formal learning hours made available were online, an increase from 23.1 percent in 2008. Other e-learning delivery methods did not dis-play much variation from 2008. Th e growth of online learning supported the increase in technology-based delivery methods and now represents more than three-quarters of the technology-based learning available.
ASTD (American Society for Training &
Development) is the world’s largest association
dedicated to workplace learning and perfor-
mance professionals. ASTD’s members come
from more than 100 countries and connect
locally in more than 128 U.S. chapters and
with more than 20 international partners.
Members work in thousands of organizations
of all sizes, in government, as independent con-
sultants, and suppliers.
Started in 1943, in recent years ASTD has
widened the profession’s focus to link learning
and performance to individual and organiza-
tional results, and is a sought-after voice on
critical public policy issues. ■
Bibliography: © 2010 ASTD

CONCRETE in focus ı 23
corporate suite
The Sinking of the TitanicAn Analogy of Failed LeadershipBy Greg Smith
We have struck iceberg. . .sinking fast. . .come to our assistance.” Those words pierced the airwaves on a cold evening in 1912. Before they tapped the last bit of Morse Code, they became the epitaph for the lives of the 1200 people
lost that night on the Titanic. The ship was doomed and slowly sliding into its watery grave. Why did the largest, most advanced ship of the century sink?
24 ı SEPTEMBER/OCTOBER 2011244 ıı SEPTSEPTEMBEEMB R/OCO TOBET R 2011
Start looking toward those
on the front-line for ideas and
solutions. Do it before you hit
the icebergs.
Th ose of us who have studied the Titanic or at least saw the movie may know. It wasn’t the iceberg that caused the disaster, but something else. Clear in my mind is the real reason that mighty ship went down -- lead-ership had failed.
The Titanic rests on the bottom of the ocean, but we can resurrect the truth. The lessons we learn can have a positive impact on our ability to lead others.
Leadership is Always Responsible
— Leadership is more than a fi gurehead. Leadership is not simply a position, a job title or in this case, being the captain of the ship. Leadership is not just about power, ego and pride; it is both science and art. Leadership needs to be engaged, involved, motivating, talking, checking, removing obstacles, training and looking over the horizon for new opportunities.
Th is was Captain E.J. Smith’s retire-ment trip. He was headed for the easy life. All he had to do was get to New York. No one is sure why he ignored seven ice-berg warnings from his crew and other ships. Responsibility can’t be delegated. Leadership is responsible for everything the organization does or fails to do.
Biggest Is Not Always the Best —
Th e larger an organization becomes, the greater its infl exibility. It can become more diffi cult and cumbersome to steer, to adapt and to change courses. It becomes a bureaucracy where rules, regulations, policies, procedures and “I need permis-sion to make a decision” becomes the norm. Today’s business world must change course quickly. Once they saw the iceberg, it took too long for the ship to react and steer away.
Rank Has Its Privileges? — A good organization builds trust and a sense of equality among all the people who work there. Sometimes intentionally, some-times not, organizations create a culture making people feel less valued because of their rank, status, education level or other forms of classifi cation. Th is can be detri-mental if you are in a business that must react to change and innovation. Ranking people limits potential. Whether it is sim-ply reserved parking spaces, blue collar, white collar, temporary, part-time, those with cubicles, those with offi ces etc., the results are the same. Clear the lines of communication and make everyone feel
they are rowing in the same direction for the same purpose. In a disaster everyone is equal.
The Truth Changes — Th e Titanic was unsinkable. . .so they thought. So confi dent were they, life boats were avail-able for only half the passengers. Dee Hock said, “Th e problem is never how to get new, innovative thoughts into your mind, but how to get the old ones out.”
Technology Is Not a Substitute for
True Leadership — Someone said, “Th e danger is not that computers will replace us. Th e real danger is when we start act-ing like computers.” When technology fails, leadership must prevail. Captain E.J. Smith said years before the Titanic’s voyage, “I cannot imagine any condition which would cause a ship to fl ounder. Modern shipbuilding has gone beyond that.” Many businesses invest and put more reliance in technology than their people. If you don’t have good leadership, the best technology will not save you from a disaster.
Leadership Focuses on Training —
As the stern of the Titanic lifted out of the water, the crew and passengers struggled with the lifeboats. Th ere were no drills, no rehearsals and the crew stood unfamiliar with their responsibilities. Th e boats were improperly loaded and only one tried to go back and recover survivors. Everyone must continuously learn new skills and upgrade their knowledge to stay competitive in the global marketplace.
Leadership Looks Below the Surface
— Th e greatest dangers as well as the great-est opportunities lie below the surface or just beyond the horizon. Th e ocean was as smooth as glass, deceptively dangerous. Th e biggest part of the iceberg lay below. . .unseen. Like steel fangs, it ripped 300 feet of the Titanic’s hull. Th ose below, the “crew and steerage,” felt and saw the dam-age fi rst. Like a gasping breath, the steam billowed above as chaos reigned below. Th ose who know what’s wrong with your
“ship” are those who are below, those who work on the front-line. Furthermore, they usually have the best ideas and remedies to your problems. Start looking toward those on the front-line for ideas and solutions. Do it before you hit the icebergs.
Leadership Looks Beyond the
Horizon — Th e lifespan of a business is getting shorter. Only the most innovative will survive. Success often gets an organi-zation in trouble. A good “Captain” is on the lookout for changing trends, changing needs, storms and icebergs. Sam Walton identifi ed the need and other retailers did not. Apple has overtaken Sony in its abil-ity to create consumer demand and new devices. Mary Kay Ash saw it and oth-ers didn’t. Get the picture? Be out there and keep a steadfast lookout for the next change coming your way.
Th e Moral of the Story — None of us were alive when the Titanic sank, but all of us lost something that night. Hopefully, we recognize the lessons learned and will chart
your course toward the right direction. ■
Greg Smith’s cutting-edge keynotes, consult-
ing and training programs have helped busi-
nesses accelerate organizational performance,
reduce turnover, increase sales, hire better
people and deliver better customer service. As
President and Lead Navigator of Chart Your
Course International he has implemented
professional development programs for orga-
nizations globally. He has authored nine
informative books including his latest book
Fired Up! Leading Your Organization
to Achieve Exceptional Results. He lives
in Conyers, Georgia. For more information
please call (770) 860-9464.