Embed Size (px)
Citation preview
1 Physikalisch-Technische Bundesanstalt, Germany (PTB) 2 Istituto di Metrologia “G. Colonnetti“, Consiglio Nazionale delle Ricerche, Italy (IMGC-CNR) 3 Bureau National de Métrologie, Laboratoire National d’Essais, France (BNM-LNE) 4 National Physical Laboratory, UK (NPL) 5 Centro Nacional de Metrología, Mexico (CENAM) 6 National Institute of Standards and Technology, USA (NIST) 7 Institute for National Measurement Standards, National Research Council, Canada (INMS/NRC) 8 National Metrology Institute of Japan, AIST (NMIJ/AIST) 9 National Physical Laboratory, India, (NPLI)
Version 4 of 01.08.2005
Final Report on Key Comparison CCM.P-K7 in the Range 10 MPa to 100 MPa of Hydraulic Gauge Pressure
W. Sabuga 1, M. Bergoglio 2, T. Rabault 3, B. Waller 4, J.C. Torres 5, D.A. Olson 6, A. Agarwal 7, T. Kobata 8, A.K. Bandyopadhyay 9
January, 2005
Abstract This report describes a CCM key comparison of hydraulic pressure standards of nine National Metrology Institutes that was carried out in the period from November 2002 to June 2004 in order to determine their degrees of equivalence in the range 10 MPa to 100 MPa of the gauge pressure. The pilot laboratory was PTB. The primary pressure standards were pressure balances of different design equipped with piston-cylinder assemblies operated in free-deformation, controlled-clearance or re-entrant operation mode. The transfer standard was a pressure balance equipped with a piston-cylinder assembly and a mass set. The pressure-dependent effective areas of the transfer standard at specified pressures were reported by the participants and led to the reference values calculated as medians. All participants’ results agree with the reference values and with each other within the expanded uncertainties calculated with a coverage factor 2, most of them even within their standard uncertainties. In addition, the results were analysed in terms of the zero pressure effective area and the pressure distortion coefficient. Also for them agreement within expanded uncertainties (k=2) is observed. The results of the comparison demonstrate equivalence of the laboratory standards and support their measurement capability statements.
Final Report on CCM.P-K7, Version 4 of 01.08.2005
- 1 -
Contents
1. Introduction .................................................................................................................... 2
2. Laboratory standards and measurement methods of the participants............................. 2
2.1 PTB pressure balance ................................................................................................. 2
2.2 IMGC-CNR pressure balance .................................................................................... 3
2.3 BNM-LNE pressure balance ...................................................................................... 3
2.4 NPL pressure balance................................................................................................. 4
2.5 CENAM pressure balance.......................................................................................... 4
2.6 NIST pressure balance ............................................................................................... 5
2.7 INMS/NRC pressure balance ..................................................................................... 5
2.8 NMIJ/AIST pressure balance ..................................................................................... 6
2.9 NPLI pressure balance ............................................................................................... 6
3. Transfer standard ............................................................................................................ 7
4. Organization, chronology and problems during the comparison ................................... 8
5. Measurement procedures................................................................................................ 8
6. Results ............................................................................................................................ 9
6.1 Stability of the Transfer standard ............................................................................... 9
6.2 Results of the participants ........................................................................................ 10
6.3 Reference value calculation ..................................................................................... 14
6.4 Degree of equivalence.............................................................................................. 16
7. Discussion .................................................................................................................... 29
8. Conclusions .................................................................................................................. 30
Acknowledgements .................................................................................................................. 30
References ................................................................................................................................ 31
Final Report on CCM.P-K7, Version 4 of 01.08.2005
- 2 -
1. Introduction In May 1996 the Comité Consultatif pour la Masse et les grandeurs apparentéès (CCM) approved proposals by the Pressure Working Groups that identified six pressure ranges for Key Comparisons (KC) and the type of transfer standards to be used. The objective of these comparisons is to state the degree of equivalence of primary pressure standards maintained by National Metrology Institutes (NMIs) – the signatories of the Mutual Recognition Arrangement (MRA). One of the six key comparisons was in the range 10 MPa to 100 MPa of hydraulic pressure. A former comparison in the pressure range 20 MPa to 100 MPa was carried out between 1981 and 1989, and its results were approved for provisional equivalence and included in the KC data base of the Bureau International des Poids et Mesures (BIPM), where the comparison is identified as CCM.P-K11. At the CCM High Pressure Working Group meeting held at BIPM on 22 May 2002, it was decided to carry out a new key comparison in the range 10 MPa to 100 MPa. This comparison, which is identified as CCM.P-K7, is aimed to renew the equivalence statements derived from comparison CCM.P-K11. In the discussion at the meeting of 22 May 2002 it was stressed that, besides the task of linking the results of the regional comparisons performed in the same pressure range, the actual comparison should demonstrate the state of the art in the 100 MPa range and, additionally, to give opportunity to the laboratories of highest level to support their uncertainty statements made in their Calibration Measurement Capability (CMC) Tables. For this reason, the originally assumed number of participants of six – two institutes-members of the European (EUROMET), Asia-Pacific (APMP) and American (SIM) Regional Metrology Organizations – was finally extended to nine as listed above. The PTB agreed to be the pilot laboratory in this comparison. The comparison was conducted in accordance with the Technical Protocol prepared by the PTB and approved by the participants. 2. Laboratory standards and measurement methods of the participants All the laboratory standards (LS) used were pressure balances equipped with piston-cylinder assemblies. Different methods were applied by the participants to compare their standards with the transfer standard (TS). 2.1 PTB pressure balance The PTB used a home-made pressure balance with a piston-cylinder assembly identified as Ruska 703/1 whose properties are given below together with measurement conditions. Manufacturer Measurement range in the pressure balance used, in MPa Material of piston and cylinder Operation mode Pressure-transmitting medium Zero-pressure effective area at 20 °C, in mm2 Pressure distortion coefficient, in MPa-1
Ruska, special design 10 to 200
tungsten carbide alloy free-deformation
DHS 1) 8.395432·(1 ± 1·10-5)
(0.725 ± 0.1)·10-6
Final Report on CCM.P-K7, Version 4 of 01.08.2005
- 3 -
Relative uncertainty of mass pieces, in 10-6 Linear thermal expansion coefficient of assembly, in °C-1 Reference temperature, in °C Local gravity, in m/s2 Height difference between LS and TS, in mm
1 (8.64 ± 0.2)·10-6
20 9.812533·(1 ± 5.4·10-7)
0.1 ± 0.37 1) DHS = di(2)-ethyl-hexyl-sebacate. The zero-pressure effective area of LS (A0,LS) is traceable through a series of calibrations to 5 cm2 oil-operated piston-cylinder assemblies whose effective area was determined by dimensional measurements [1]. The pressure distortion coefficient of LS (λLS) was determined by the Finite Element Analysis from the assembly’s dimensional properties and elastic constants [2]. The pressure equilibrium between LS and TS was established by controlling the piston fall rates of LS and TS. 2.2 IMGC-CNR pressure balance The IMGC-CNR used a home-made pressure balance with a piston-cylinder assembly identified as IMGC-100NNc.t. whose properties are given below together with measurement conditions. Manufacturer Measurement range in the pressure balance used, in MPa Material of piston and cylinder Operation mode Pressure-transmitting medium Zero-pressure effective area at 20 °C, in mm2 Pressure distortion coefficient, in MPa-1 Relative uncertainty of mass pieces, in 10-6 Linear thermal expansion coefficient of assembly, in °C-1 Reference temperature, in °C Local gravity, in m/s2 Height difference between LS and TS, in mm
IMGC-CNR 2.5 to 100
tungsten carbide alloy free-deformation
DHS 20.00057·(1 ± 1·10-5) (0.72 ± 0.043)·10-6
0.75 9.1·10-6
20 9.805341·(1 ± 2·10-7)
<0.08 ± 0.1 The zero-pressure effective area was determined by dimensional measurements made at IMGC-CNR and repeated during the comparison period. The pressure distortion coefficient was determined by FEM elastic distortion calculation and compared with elastic distortion measurements by strain gauges on the outer surface of the cylinder [3]. The pressure equilibrium between LS and TS was established by controlling the piston fall rates of LS and TS. 2.3 BNM-LNE pressure balance The BNM-LNE standard used in the comparison was the national standard for (6 to 200) MPa range equipped with piston-cylinder assembly N° 5 developed in cooperation with Desgranges et Huot (DH). The assembly was used in controlled clearance mode, with a counter-pressure equal to 1/4 of the measurement pressure. The standard was described in [4]. The effective area at null pressure has been determined by comparison with the 10 MPa standard used for the CCM.P-K1c, itself traceable to the primary standard in the range 10 kPa to 1 MPa [5]. The pressure distortion coefficient has been determined using the experimental method developed at the BNM-LNE. This method is based on fall rate measurements and cross-floating experiment under variable conditions of counter -pressure. It has been applied to 5 assemblies of the same geometry in order to demonstrate its consistency. The piston-

Final Report on CCM.P-K7, Version 4 of 01.08.2005
- 4 -
cylinder assembly N° 5 participated in the EUROMET Project N° 256 - work on the pressure distortion coefficient calculation. The main characteristics and the uncertainties of the standard are given in the table below. Manufacturer Measurement range in the pressure balance used, in MPa Material of piston and cylinder Operation mode Pressure-transmitting medium Zero-pressure effective area at 20 °C, in mm2 Pressure distortion coefficient, in MPa-1 Relative uncertainty of mass pieces, in 10-6 Linear thermal expansion coefficient of assembly, in °C-1 Reference temperature, in °C Local gravity, in m/s2 Height difference between LS and TS, in mm
DH / BNM-LNE 6 to 200
tungsten carbide alloy controlled-clearance
DHS 50.27121·(1 ± 4.5·10-6)
(-0.02 ± 0.035)·10-6 0.8 to 0.4
9·10-6 20
9.809273·(1 ± 1·10-7) 37 ± 1.1
2.4 NPL pressure balance The NPL used the national pressure standard in the range 1 to 100 MPa whose properties are given below together with measurement conditions. Manufacturer Measurement range in the pressure balance used, in MPa Material of piston and cylinder Operation mode Pressure-transmitting medium Zero-pressure effective area at 20 °C, in mm2 Pressure distortion coefficient, in MPa-1 Relative uncertainty of mass pieces, in 10-6 Linear thermal expansion coefficient of assembly, in °C-1 Reference temperature, in °C Local gravity, in m/s2 Height difference between LS and TS, in mm
DH 1 to 100
tungsten carbide alloy free-deformation
DHS 9.80583·(1 ± 11.6·10-6)
(1.04 ± 0.085)·10-6 0.5
9·10-6 20
9.811813·(1 ± 3·10-7) 0.3 ± 0.1
The effective area and distortion coefficient of this standard are traceable via a series of cross-float comparisons to a 25 mm diameter piston-cylinder assembly which has been calibrated by dimensional metrology at the NPL. The distortion coefficient of the 25 mm piston-cylinder has been estimated by FEM. The pressure equilibrium between LS and TS was established by monitoring and adjusting the piston fall rates of LS and TS. 2.5 CENAM pressure balance The CENAM used the national pressure standard with a piston-cylinder unit serial no. 5716 whose properties are given below together with measurement conditions. Manufacturer Measurement range in the pressure balance used, in MPa Material of piston and cylinder Operation mode Pressure-transmitting medium Zero-pressure effective area at 20 °C, in mm2 Pressure distortion coefficient, in MPa-1 Relative uncertainty of mass pieces, in 10-6
DH 1 to 100
tungsten carbide alloy free-deformation
DHS 9.80518·(1 ± 15.3·10-6)
(0.802 ± 0.108)·10-6 1
Final Report on CCM.P-K7, Version 4 of 01.08.2005
- 5 -
Linear thermal expansion coefficient of assembly, in °C-1 Reference temperature, in °C Local gravity, in m/s2 Height difference between LS and TS, in mm
9·10-6 20
9.780845·(1 ± 5·10-7) -0.12 ± 1
The zero-pressure effective area of LS is traceable through a series of calibrations to a 10 cm2 gas-operated piston-cylinder assembly whose effective area was determined by dimensional measurements. The pressure distortion coefficient was determined by the “simple” formula from assembly’s dimensional properties and elastic constants supplied by the manufacturer. 2.6 NIST pressure balance The NIST used the national pressure standard with a piston-cylinder unit known as PG41. Its properties and measurement conditions are given below. Manufacturer Measurement range in the pressure balance used, in MPa Material of piston and cylinder Operation mode Pressure-transmitting medium Zero-pressure effective area at 23 °C, in mm2 Pressure distortion coefficient, in MPa-1 Relative uncertainty of mass pieces, in 10-6 Linear thermal expansion coefficient of assembly, in °C-1 Reference temperature, in °C Local gravity, in m/s2 Height difference between LS and TS, in mm
Ruska 7 to 140
tungsten carbide alloy re-entrant
Spinesstic hydraulic fluid 16.80257·(1 ± 18.5·10-6)
-2.516·10-6 0.86
8.22·10-6 23
9.801010·(1 ± 1·10-6) 7.3 ± 2
The zero-pressure area and distortion coefficient of PG41 were determined by cross-float calibration against two NIST piston gauge primary standards, both of the controlled clearance type. The two sets of data were combined and fit together to provide values for A0,LS, λLS and their uncertainties. The values were most recently established in 1995. A cross-float of PG41 against another Laboratory Standard in 2003 confirmed the characteristics of the gauge. As the LS and TS use different fluids, they were separated with a metal diaphragm interface, which was a Ruska Differential Pressure (DP) Cell (Ruska model 2413, 140 MPa full scale). The diaphragm of the DP Cell was oriented in the horizontal plane within 1 mm of the reference level of the LS. The DP Cell was calibrated at ambient pressure to determine the sensitivity of the voltage output to a differential pressure. The differential pressure was set with oil manometers. The sensitivity for –0.5 V < output < 0.5 V is about 100 Pa/V. During a cross-float, equilibrium within 5 Pa was established. The DP Cell was also calibrated for the shift in the voltage output (for zero differential pressure) as the mean operating pressure changed. This was accomplished by subjecting both sides of the cell to the same pressure, produced by PG41 with Spinesstic, and noting the position of the zero-potentiometer required to null the output. The DP Cell and the method used to determine pressure equilibrium during a cross-float is believed to introduce a standard uncertainty in pressure of 41 Pa. After the calibration of the DP Cell and prior to performing the measurement cycles of the comparison, both sides of the Cell were flushed with the respective fluids from the pressure balances. 2.7 INMS/NRC pressure balance The INMS/NRC used the national pressure standard with a piston-cylinder unit whose properties are given below together with measurement conditions.

Final Report on CCM.P-K7, Version 4 of 01.08.2005
- 6 -
Manufacturer Measurement range in the pressure balance used, in MPa Material of piston and cylinder Operation mode Pressure-transmitting medium Zero-pressure effective area at 20 °C, in mm2 Pressure distortion coefficient, in MPa-1 Relative uncertainty of mass pieces, in 10-6 Linear thermal expansion coefficient of assembly, in °C-1 Reference temperature, in °C Local gravity, in m/s2 Height difference between LS and TS, in mm
DH Instruments (DHI)2 to 110
tungsten carbide alloy re-entrant
DHS 4.902954·(1 ± 12·10-6)
(-2.51 ± 0.126)·10-6 1
9·10-6 20
9.806159·(1 ± 5·10-7) -75.00 ± 1.0
The zero-pressure effective area of LS is traceable to the NRC primary mercury manometer through a series of cross-float measurements between the LS, a 10 cm2 gas –operated piston-cylinder assembly and the mercury manometer. The pressure distortion coefficient was determined theoretically using dimensional properties and elastic constants supplied by the manufacturer. 2.8 NMIJ/AIST pressure balance The NMIJ/AIST used the national pressure standard with a piston-cylinder unit whose properties are given below together with measurement conditions. Manufacturer Measurement range in the pressure balance used, in MPa Material of piston and cylinder Operation mode Pressure-transmitting medium Zero-pressure effective area at 23 °C, in mm2 Pressure distortion coefficient, in MPa-1 Relative uncertainty of mass pieces, in 10-6 Linear thermal expansion coefficient of assembly, in °C-1 Reference temperature, in °C Local gravity, in m/s2 Height difference between LS and TS, in mm
DH 1 to 100
tungsten carbide alloy free-deformation
DHS 9.805620·(1 ± 12.6·10-6)
(0.838 ± 0.101)·10-6 0.5
9·10-6 23
9.7994804·(1 ± 2·10-7) -0.27 ± 0.5
The zero-pressure effective area of the LS is traceable through a series of calibrations to larger diameter piston-cylinder assemblies whose effective areas have been evaluated by the NMIJ/AIST mercury manometer and/or dimensional measurements. The pressure distortion coefficient of the LS was determined from cross-float measurements against the NMIJ/AIST controlled-clearance type pressure balance which was characterized experimentally at NMIJ/AIST. The difference of the pressures generated by LS and TS was determined using a high-resolution pressure transducer which was alternatively connected to the first and to the second pressure balance [6]. 2.9 NPLI pressure balance The NPLI used the national pressure standard with a piston-cylinder unit whose properties are given below together with measurement conditions. Manufacturer DH
Final Report on CCM.P-K7, Version 4 of 01.08.2005
- 7 -
Measurement range in the pressure balance used, in MPa Material of piston and cylinder Operation mode Pressure-transmitting medium Zero-pressure effective area at 20 °C, in mm2 Pressure distortion coefficient, in MPa-1 Relative uncertainty of mass pieces, in 10-6 Linear thermal expansion coefficient of assembly, in °C-1 Reference temperature, in °C Local gravity, in m/s2 Height difference between LS and TS, in mm
0.2 to 100 tungsten carbide alloy
free-deformation DHS
9.805669·(1 ± 18.4·10-6)(0.822 ± 0.15)·10-6
0.11 9.1·10-6
20 9.7912393·(1 ± 9·10-8)
2 ± 0.5 The zero-pressure effective area and the pressure distortion coefficient of the LS were determined from cross-float measurements against a primary controlled-clearance piston gauge [7]. 3. Transfer standard The transfer standard is described in detail in the Technical Protocol of the comparison. It was a DH piston-cylinder assembly of 0.1 cm2 nominal effective area with serial number 1017 and was mounted in a DH pressure balance model 5306, equipped with a carrying bell, a set of 20 masses totalling 99 kg, a temperature probe, and all other parts required for the operation of the pressure balance and connecting it to the LS. The pressure-transmitting medium in the TS is DHS. Its density as a function of pressure and surface tension were provided by PTB. The piston-cylinder assembly is made of tungsten carbide. The cylinder cap is made of stainless steel. According to the manufacturer information, the tungsten carbide of the assembly has the following properties: Young’s modulus E = 620 GPa Poisson’s coefficient µ = 0.218 Linear thermal expansion coefficient α = 4.5⋅10-6 1/°C. This value was confirmed by the hydrostatic weighing method applied to the cylinder of the TS at PTB at the end of the comparison. The conventional masses and associated uncertainties were determined at PTB for the piston, the carrying bell and the mass pieces. These data were provided to the participants together with the corresponding densities. The temperature probe - a platinum resistance thermometer - was calibrated at PTB, and the formula for the temperature-resistance dependence in the temperature range (18.5 to 24.5) °C was given. Each participant used their own electronics to measure the thermometer resistance. The piston working position and the pressure reference level were specified. The independency of the effective area of the TS when the piston deviates by ±1 mm from its working position was checked at PTB. Also the typical cross-float sensitivity and reproducibility, piston-cylinder temperature drift, and piston fall rates at different pressures as measured at PTB were reported. The piston-cylinder assembly was manufactured 1980 and therefore was expected to be sufficiently old to have a stable value of its effective area in the period of the comparison. The results of calibrations performed in the PTB 1991, 1992, 1998 and 2002 demonstrated the relative stability of A0 within 2.4·10-6 with no systematic change. The TS stability was measured by the pilot laboratory at the beginning, in the middle, and at the end of the comparison.
Final Report on CCM.P-K7, Version 4 of 01.08.2005
- 8 -
4. Organization, chronology and problems during the comparison The measurements were performed in the following order and times:
Institute Measurement start date
Measurement end date
PTB, initial investigation 12 Nov 2002 15 Nov 2002 IMGC-CNR 3 Feb 2003 13 Feb 2003 BNM-LNE 13 March 2003 19 March 2003 NPL 20 May 2003 28 May 2003 PTB, intermediary check 11 June 2003 19 June 2003 CENAM 12 Aug 2003 22 Aug 2003 NIST 25 Sep 2003 3 Oct 2003 INMS/NRC 20 Oct 2003 19 Dec 2003 NMIJ/AIST 15 Jan 2004 22 Jan 2004 NPLI 19 March 2004 24 March 2004 PTB, final investigation – PTB result 8 June 2004 15 June 2004 There were different problems during the comparison. Its finish was delayed by one month because of technical problems in INMS/NRC and, additionally, by one month due to customs problems. When sending the TS from PTB to CENAM an ATA carnet could not be issued because Mexico is not a carnet member. For this reason some participants had difficulties with the temporary import of TS, and, after the measurements at NMIJ/AIST, the TS had to come to PTB for a carnet preparation before it could be sent to NPLI. Although the completeness and state of TS were controlled and documented with the departure and arrival protocols, it arrived in NPLI with a damaged pressure multiplier. An unqualified person had evidently tried to disassemble this on the circuit NMIJ/AIST-PTB-NPLI. This created technical problems for measurements at NPLI. The multiplier was repaired before the final investigation at PTB. 5. Measurement procedures The measurements included five cycles each with nominal pressures created in the following order (10, 20, 30, 40, 50, 60 70, 80, 90, 100, 100, 90, 80, 70, 60, 50, 40, 30, 20, 10) MPa. At each pressure the participants had to determine the effective area (Ap) of the TS by cross-floating it against their pressure standards. Ap was calculated at the reference temperature of 20 °C using the equation:
( )( )[ ]0cp
nom,0aa0
0
a0
1
21
ttααp
πAσρρρ
ρρgm
Ai
ii
p −++
+
−+−
=∑
, where (1)
mi are conventional masses of the piston, the weight carrier and the mass pieces placed on the weight carrier of TS; ρi are densities of the parts with masses mi; ρa is air density; ρ0a is conventional value of the air density, ρ0a = 1.2 kg/m3; ρ0 is conventional value of the mass density, ρ0 = 8000 kg/m3; g is local gravity acceleration; σ is surface tension of the TS oil;

Final Report on CCM.P-K7, Version 4 of 01.08.2005
- 9 -
A0,nom is nominal effective area of TS; p is pressure generated by the laboratory standard at the TS reference level; αp and αc are thermal expansion coefficients of the piston and cylinder materials, respectively; t is temperature of TS; t0 is reference temperature, t0 = 20 °C. The participants calculated values of p and ρa, measured t, and applied the local value of g. All other parameters were provided by the pilot laboratory. For each measurement point the participants reported the ambient conditions (air temperature and pressure), temperatures of LS and TS, generated pressure and Ap. For each nominal pressure they reported summary results including the sensitivity of the cross float, uncertainties of t and p, average Ap, its standard deviation and combined standard uncertainty. For pressures 10 MPa and 100 MPa, a list of the main uncertainty sources and their contributions to Ap were presented. Additionally, each participant included the zero-pressure effective area of the TS (A0) and its pressure distortion coefficient (λ) which satisfy equation
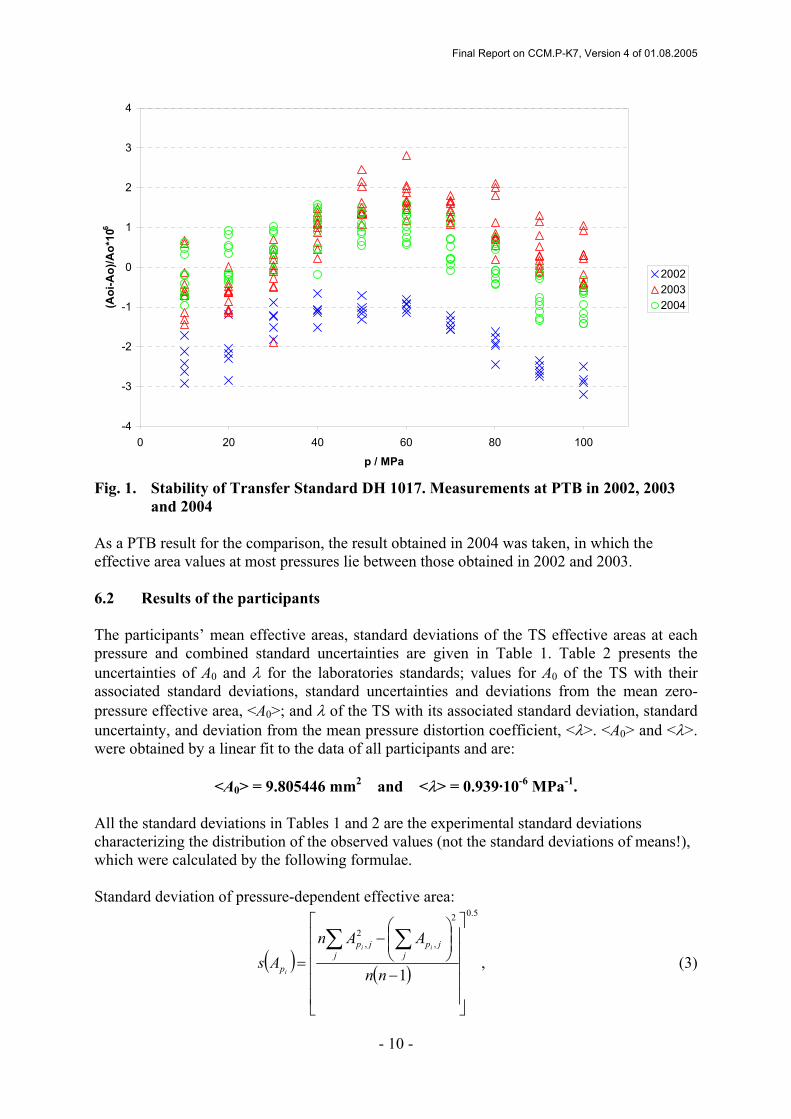
Ap = A0(1+λp) (2) and are based on the results of all 100 measurements. The combined standard uncertainties of A0 and λ as well as a description of how they were calculated were included. 6. Results 6.1 Stability of the Transfer standard The results of the controlled measurements performed at PTB at the beginning (2002), in the middle (2003), and at end of the comparison (2004) are shown in Fig. 1 and demonstrate the stability of TS at any pressure within 3·10-6. The changes in the effective area observed appear rather non-systematic.
Final Report on CCM.P-K7, Version 4 of 01.08.2005
- 10 -
-4
-3
-2
-1
0
1
2
3
4
0 20 40 60 80 100
p / MPa
(Aoi
-Ao)
/Ao*
106
200220032004
Fig. 1. Stability of Transfer Standard DH 1017. Measurements at PTB in 2002, 2003
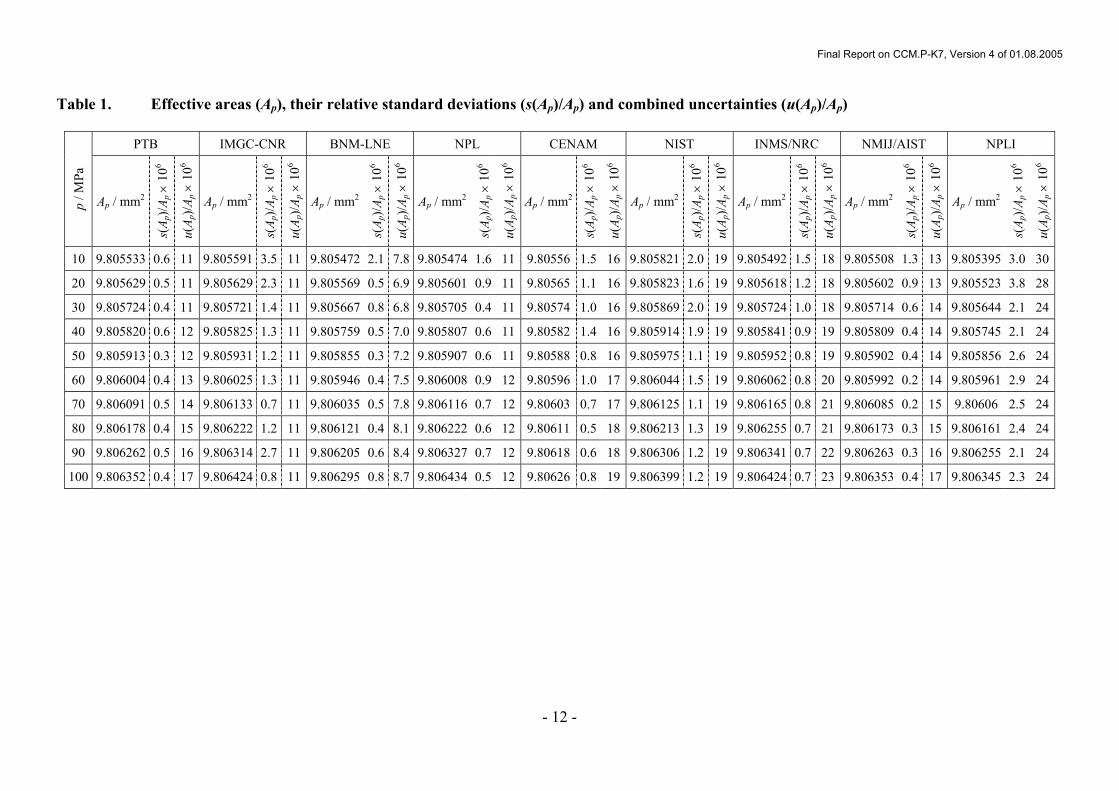
and 2004 As a PTB result for the comparison, the result obtained in 2004 was taken, in which the effective area values at most pressures lie between those obtained in 2002 and 2003. 6.2 Results of the participants The participants’ mean effective areas, standard deviations of the TS effective areas at each pressure and combined standard uncertainties are given in Table 1. Table 2 presents the uncertainties of A0 and λ for the laboratories standards; values for A0 of the TS with their associated standard deviations, standard uncertainties and deviations from the mean zero-pressure effective area, <A0>; and λ of the TS with its associated standard deviation, standard uncertainty, and deviation from the mean pressure distortion coefficient, <λ>. <A0> and <λ>. were obtained by a linear fit to the data of all participants and are:
<A0> = 9.805446 mm2 and <λ> = 0.939·10-6 MPa-1. All the standard deviations in Tables 1 and 2 are the experimental standard deviations characterizing the distribution of the observed values (not the standard deviations of means!), which were calculated by the following formulae. Standard deviation of pressure-dependent effective area:
( ) ( )
5.02
,2
,
1
−
−
=∑∑
nn
AAnAs j
jpj
jp
p
ii
i, (3)
Final Report on CCM.P-K7, Version 4 of 01.08.2005
- 11 -
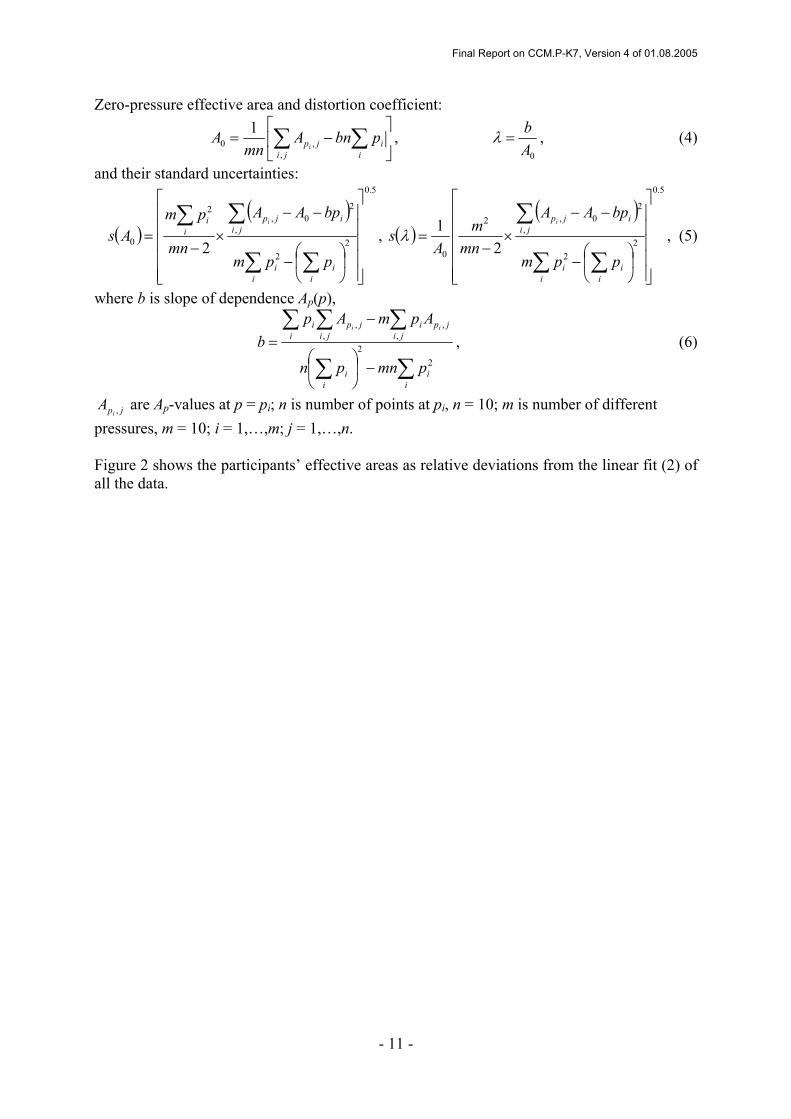
Zero-pressure effective area and distortion coefficient:
−= ∑∑
ii
jijp pbnA
mnA
i,
,01 ,
0Ab
=λ , (4)
and their standard uncertainties:
( )( )
5.0
22
,
20,
2
0 2
−
−−×
−=
∑ ∑
∑∑
i iii
jiijp
ii
ppm
bpAA
mn
pmAs
i
, ( )( )
5.0
22
,
20,2
0 21
−
−−×
−=
∑ ∑
∑
i iii
jiijp
ppm
bpAA
mnm
As
i
λ , (5)
where b is slope of dependence Ap(p),
∑∑
∑∑∑
−
−=
ii
ii
jijpi
jijp
ii
pmnpn
ApmApb
ii
22
,,
,,
, (6)
jpiA , are Ap-values at p = pi; n is number of points at pi, n = 10; m is number of different pressures, m = 10; i = 1,…,m; j = 1,…,n. Figure 2 shows the participants’ effective areas as relative deviations from the linear fit (2) of all the data.
Final Report on CCM.P-K7, Version 4 of 01.08.2005
- 12 -
Table 1. Effective areas (Ap), their relative standard deviations (s(Ap)/Ap) and combined uncertainties (u(Ap)/Ap)
PTB IMGC-CNR BNM-LNE NPL CENAM NIST INMS/NRC NMIJ/AIST NPLI
p / M
Pa
Ap / mm2
s(A p
)/Ap ×
106
u(A p
)/Ap ×
106
Ap / mm2
s(A p
)/Ap ×
106
u(A p
)/Ap ×
106
Ap / mm2
s(A p
)/Ap ×
106
u(A p
)/Ap ×
106
Ap / mm2
s(A p
)/Ap ×
106
u(A p
)/Ap ×
106
Ap / mm2
s(A p
)/Ap ×
106
u(A p
)/Ap ×
106
Ap / mm2
s(A p
)/Ap ×
106
u(A p
)/Ap ×
106
Ap / mm2
s(A p
)/Ap ×
106
u(A p
)/Ap ×
106
Ap / mm2
s(A p
)/Ap ×
106
u(A p
)/Ap ×
106
Ap / mm2
s(A p
)/Ap ×
106
u(A p
)/Ap ×
106
10 9.805533 0.6 11 9.805591 3.5 11 9.805472 2.1 7.8 9.805474 1.6 11 9.80556 1.5 16 9.805821 2.0 19 9.805492 1.5 18 9.805508 1.3 13 9.805395 3.0 30
20 9.805629 0.5 11 9.805629 2.3 11 9.805569 0.5 6.9 9.805601 0.9 11 9.80565 1.1 16 9.805823 1.6 19 9.805618 1.2 18 9.805602 0.9 13 9.805523 3.8 28
30 9.805724 0.4 11 9.805721 1.4 11 9.805667 0.8 6.8 9.805705 0.4 11 9.80574 1.0 16 9.805869 2.0 19 9.805724 1.0 18 9.805714 0.6 14 9.805644 2.1 24
40 9.805820 0.6 12 9.805825 1.3 11 9.805759 0.5 7.0 9.805807 0.6 11 9.80582 1.4 16 9.805914 1.9 19 9.805841 0.9 19 9.805809 0.4 14 9.805745 2.1 24
50 9.805913 0.3 12 9.805931 1.2 11 9.805855 0.3 7.2 9.805907 0.6 11 9.80588 0.8 16 9.805975 1.1 19 9.805952 0.8 19 9.805902 0.4 14 9.805856 2.6 24
60 9.806004 0.4 13 9.806025 1.3 11 9.805946 0.4 7.5 9.806008 0.9 12 9.80596 1.0 17 9.806044 1.5 19 9.806062 0.8 20 9.805992 0.2 14 9.805961 2.9 24
70 9.806091 0.5 14 9.806133 0.7 11 9.806035 0.5 7.8 9.806116 0.7 12 9.80603 0.7 17 9.806125 1.1 19 9.806165 0.8 21 9.806085 0.2 15 9.80606 2.5 24
80 9.806178 0.4 15 9.806222 1.2 11 9.806121 0.4 8.1 9.806222 0.6 12 9.80611 0.5 18 9.806213 1.3 19 9.806255 0.7 21 9.806173 0.3 15 9.806161 2.4 24
90 9.806262 0.5 16 9.806314 2.7 11 9.806205 0.6 8.4 9.806327 0.7 12 9.80618 0.6 18 9.806306 1.2 19 9.806341 0.7 22 9.806263 0.3 16 9.806255 2.1 24
100 9.806352 0.4 17 9.806424 0.8 11 9.806295 0.8 8.7 9.806434 0.5 12 9.80626 0.8 19 9.806399 1.2 19 9.806424 0.7 23 9.806353 0.4 17 9.806345 2.3 24

Final Report on CCM.P-K7, Version 4 of 01.08.2005
- 13 -
Table 2. Relative standard uncertainties of zero-pressure effective areas (u(A0,LS)/A0,LS) and standard uncertainties of distortion coefficients (u(λLS)) of the laboratory standards; zero-pressure effective areas of TS (A0), their relative standard deviations (s(A0)/A0), standard uncertainties (u(A0)/A0) and relative deviations from the average zero-pressure effective area ((A0-<A0>)/<A0>); pressure distortion coefficient of TS (λ), its standard deviation (s(λ)), standard uncertainty (u(λ)) and deviation from the average pressure distortion coefficient (λ-<λ>)
Property PTB IMGC-CNR BNM-LNE NPL CENAM NIST INMS/NRC NMIJ/AIST NPLI
u(A0,LS) / A0,LS × 106 10 10 4.5 12 15 19 12 13 18 u(λLS) × (106 MPa) 0.1 0.043 0.035 0.085 0.108 - 0.13 0.1 0.15
A0 / mm2 9.805451 9.805457 9.805385 9.80538 9.8055 9.805683 9.805415 9.805425 9.805317 s(A0)/A0·106 1.6 5.3 2.4 2.2 2.5 8.4 4.5 2.1 6.2 u(A0)/A0·106 11 11 7.6 12 19 19 18 13 -
(A0-<A0>)/<A0>·106 0.5 1.1 -6.2 -6.8 5.5 24.1 -3.2 -2.2 -13.2 λ × (106 MPa) 0.926 0.978 0.94 1.05 0.78 0.681 1.062 0.955 1.070
s(λ) × (106 MPa) 0.026 0.086 0.038 0.035 0.040 0.136 0.072 0.034 0.100 u(λ) × (106 MPa) 0.1 - 0.04 0.085 - - 0.11 0.1 -
(λ-<λ>) × (106 MPa) -0.013 0.039 0.001 0.111 -0.159 -0.258 0.123 0.016 0.131

Final Report on CCM.P-K7, Version 4 of 01.08.2005
- 14 -
-15
-10
-5
0
5
10
15
20
25
30
0 20 40 60 80 100
p/MPa
(Api
-Ap,
lin)/A
p,lin
/ 10
-6
PTBIMGC-CNRBNM-LNENPLCENAMNISTINMS/NRCNMIJ/AISTNPLI
Fig. 2. Relative deviations of the participants’ results from the linear fit 6.3 Reference value calculation Different ways are considered to calculate the reference value of TS. First, the reference effective area (Ap,ref) can be defined by the linear fit (2) of the participants’ results. With this approach Ap,ref is a linear function of pressure as expected for pressure balances and does not suffer from random physically irrelevant changes which are usually observed when Ap,ref is calculated as a mean or median value. The disadvantage of this approach lies in the expression of the uncertainty of Ap,ref, because this expression in terms of parameter errors for A0 and λ does not reflect the uncertainty of Ap,ref as observed in the participants’ results. Second, as Ap,ref the non-weighted or weighted mean can be taken. In [8] the weighted mean method is recommended, and the conditions are formulated at which this method is applicable. The chi-squared test is suggested for an overall consistency check of the results obtained. With the reference value calculated at each pressure as
( ) ( )∑∑==
=9
1 ,2
9
1 ,2
,ref,
1i ipi ip
ipp AuAu
AA (7)
the chi-squared value is formed as ( )
( )∑=
−=
9
1 ,2
2ref,,2
obsχi ip
pip
AuAA
, (8)
and the consistency condition { } 05.0χ)(χPr 2
obs2 <>ν (9)
is checked, where ν is the degrees of freedom, ν = 8. For this ν the condition (9) is fulfilled if χ2
obs is smaller than 2.73. The results of the comparison obtained at p = 10 MPa lead to value χ2
obs = 3.84 and indicate the results to be not consistent enough for the application of the weighted mean method.

Final Report on CCM.P-K7, Version 4 of 01.08.2005
- 15 -
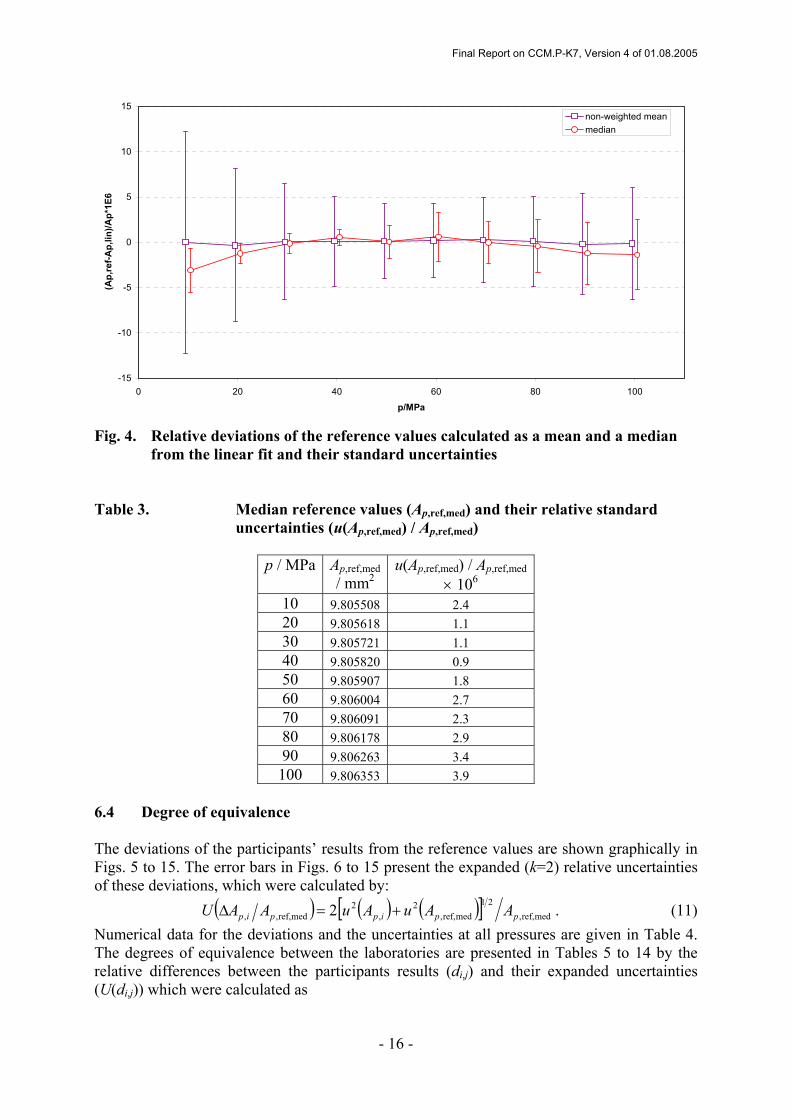
Alternatively, Ap,ref can be calculated as a median which is more robust and is preferable in the case of outlining results [8, 9]. Figure 3 presents the relative deviations of the non-weighted mean and median reference values from those calculated as a linear fit. The results of the three approaches agree within 3·10-6 relative. However, as can be seen in Fig. 4, the uncertainties of the median reference values are significantly lower than those of the mean reference values. For the mean values, the uncertainties were calculated as standard deviations. For the median values, the uncertainties were calculated according to [9]
( ) medref,medref,, med1
858.1p,p,ip AA
nAu −
−= , (10)
where n=9 is the number of participants, Ap,i – their results and Ap,ref,med – the median reference values. For the reason of lower uncertainty of the reference values in the third approach and due to the relatively large deviations of some results at low pressures it seems to be reasonable to use the median as a comparison reference value. The median reference values and their uncertainties are given in Table 3.
-3
-2.5
-2
-1.5
-1
-0.5
0
0.5
1
1.5
0 20 40 60 80 100
p/MPa
(Ap,
ref-A
p,lin
)/Ap*
1E6
non-weighted meanmedian
Fig. 3. Relative deviations of the reference values calculated as a mean and a median
from the linear fit
Final Report on CCM.P-K7, Version 4 of 01.08.2005
- 16 -
-15
-10
-5
0
5
10
15
0 20 40 60 80 100
p/MPa
(Ap,
ref-A
p,lin
)/Ap*
1E6
non-weighted meanmedian
Fig. 4. Relative deviations of the reference values calculated as a mean and a median
from the linear fit and their standard uncertainties Table 3. Median reference values (Ap,ref,med) and their relative standard
uncertainties (u(Ap,ref,med) / Ap,ref,med)
p / MPa Ap,ref,med / mm2
u(Ap,ref,med) / Ap,ref,med × 106
10 9.805508 2.4 20 9.805618 1.1 30 9.805721 1.1 40 9.805820 0.9 50 9.805907 1.8 60 9.806004 2.7 70 9.806091 2.3 80 9.806178 2.9 90 9.806263 3.4 100 9.806353 3.9
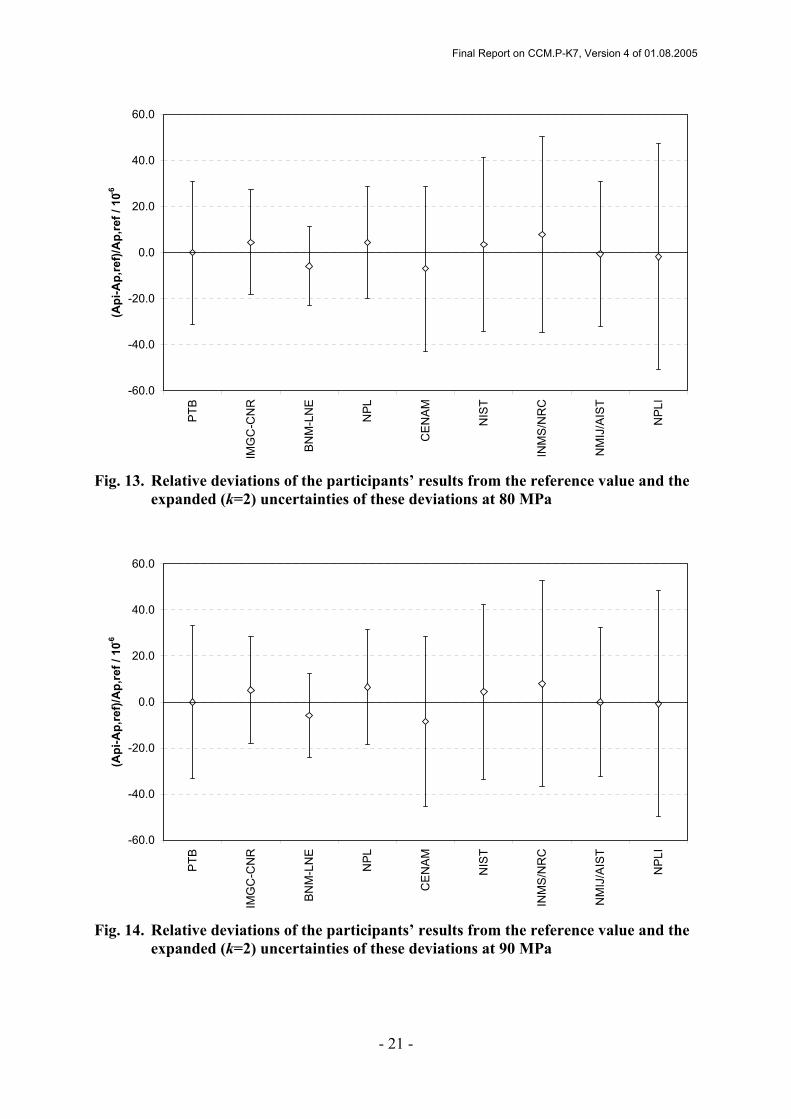
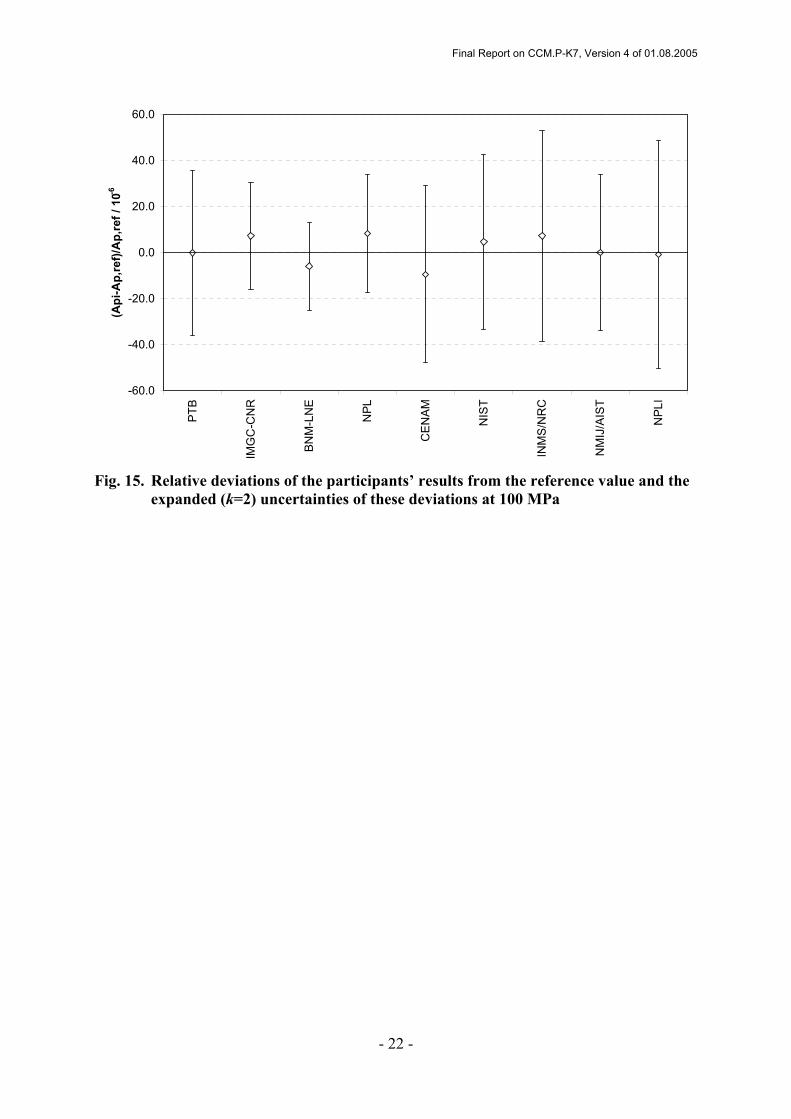
6.4 Degree of equivalence The deviations of the participants’ results from the reference values are shown graphically in Figs. 5 to 15. The error bars in Figs. 6 to 15 present the expanded (k=2) relative uncertainties of these deviations, which were calculated by:
( ) ( ) ( )[ ] medref,,21
medref,,2
,2
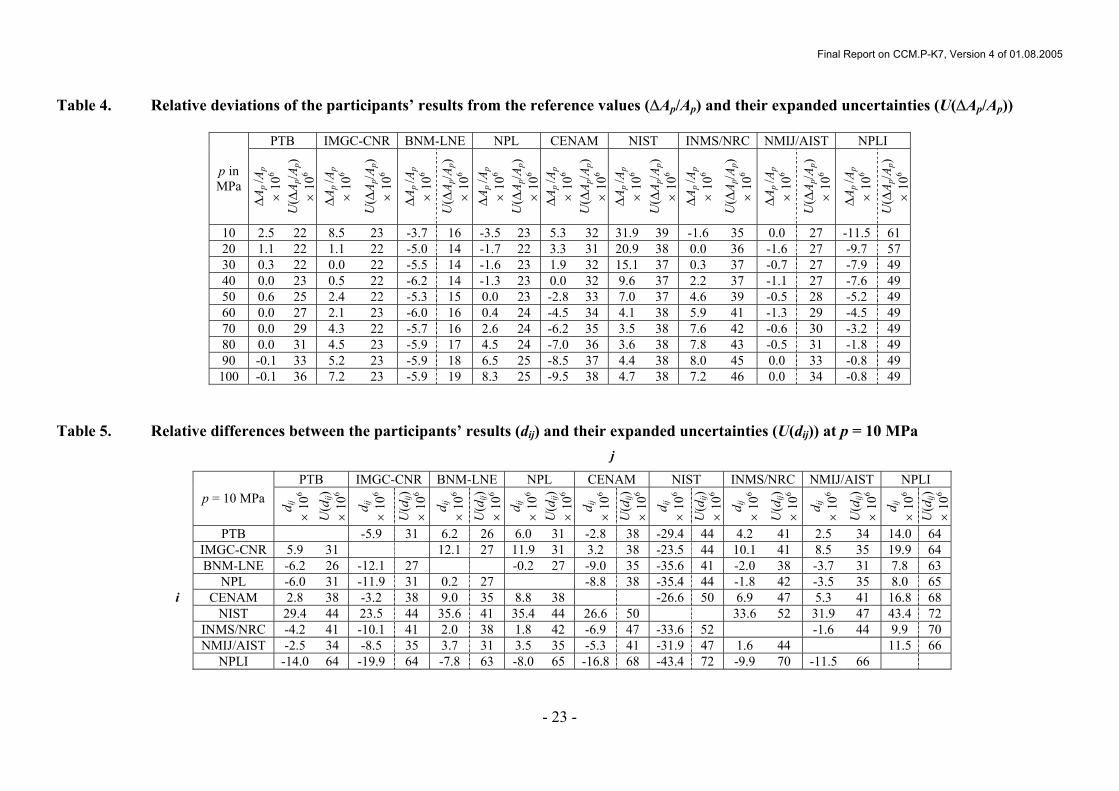
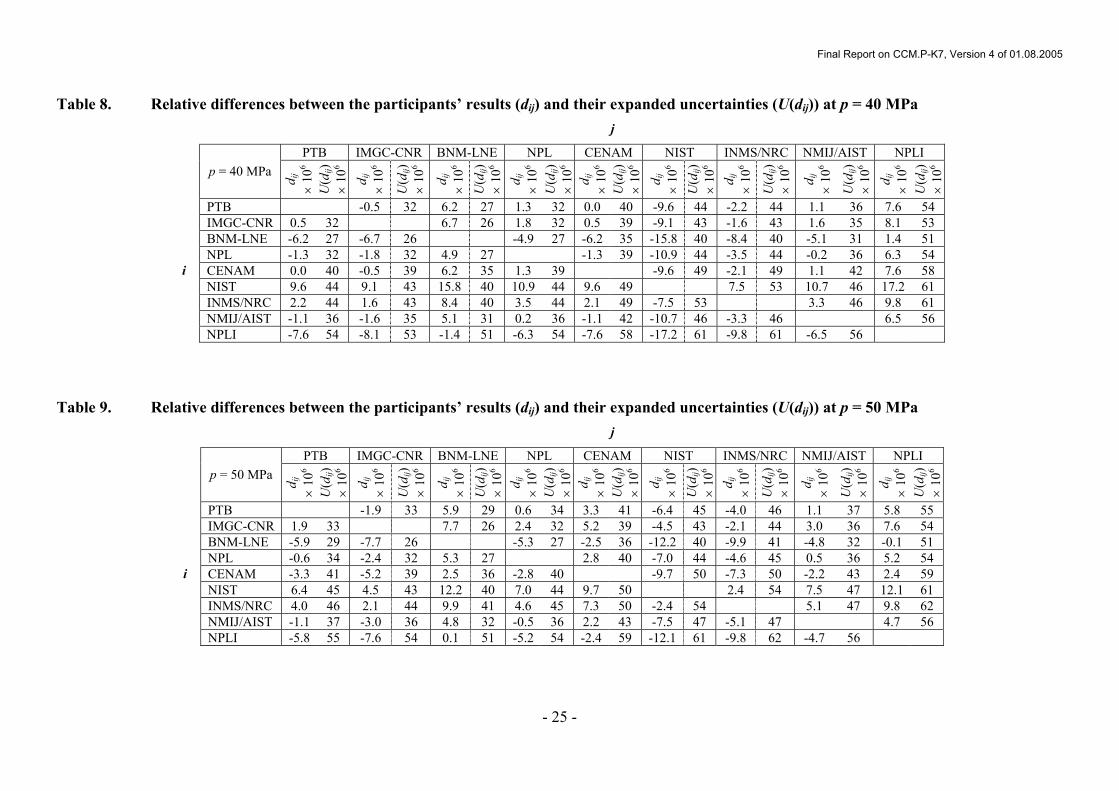
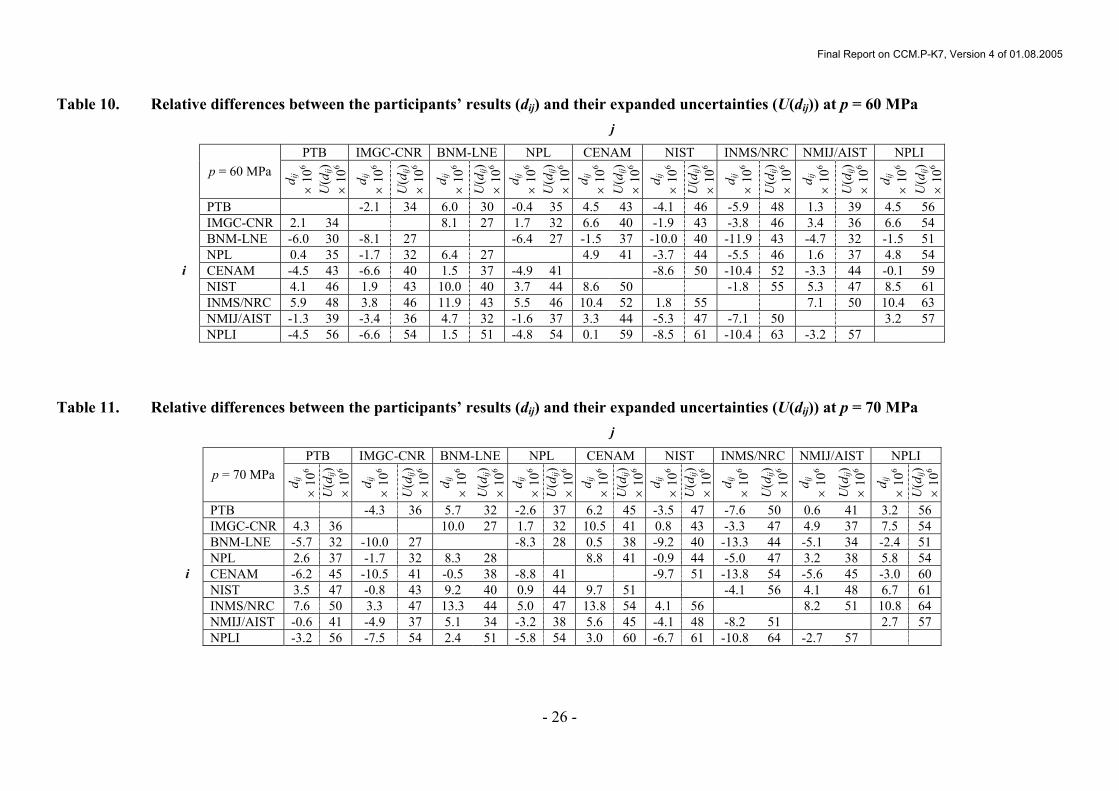
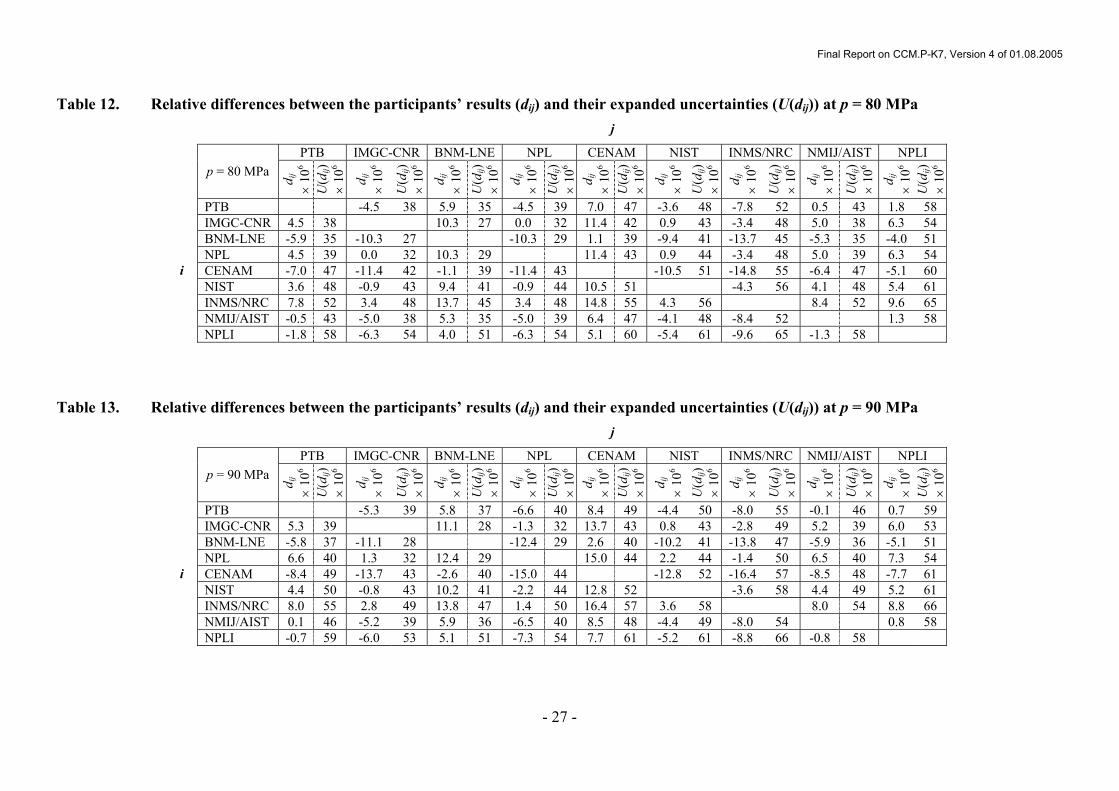
medref,,, 2 ppippip AAuAuAAU +=∆ . (11) Numerical data for the deviations and the uncertainties at all pressures are given in Table 4. The degrees of equivalence between the laboratories are presented in Tables 5 to 14 by the relative differences between the participants results (di,j) and their expanded uncertainties (U(di,j)) which were calculated as

Final Report on CCM.P-K7, Version 4 of 01.08.2005
- 17 -
( ) medref,,,, pjpipij AAAd −= . (12) and
( ) ( ) ( )[ ] medref,,21
,2
,22 pjpipij AAuAudU += . (13)
-15
-10
-5
0
5
10
15
20
25
30
35
0 20 40 60 80 100
p/MPa
(Api
-Ap,
ref)/
Ap,
ref /
10-6
PTBIMGC-CNRBNM-LNENPLCENAMNISTINMS/NRCNMIJ/AISTNPLI
Fig. 5. Relative deviations of the participants results’ from the reference value
-60.0
-40.0
-20.0
0.0
20.0
40.0
60.0
PTB
IMG
C-C
NR
BNM
-LN
E
NPL
CE
NA
M
NIS
T
INM
S/N
RC
NM
IJ/A
IST
NPL
I
(Api
-Ap,
ref)/
Ap,
ref /
10-6
Fig. 6. Relative deviations of the participants results’ from the reference value and the
expanded (k=2) uncertainties of these deviations at 10 MPa

Final Report on CCM.P-K7, Version 4 of 01.08.2005
- 18 -
-60.0
-40.0
-20.0
0.0
20.0
40.0
60.0
PTB
IMG
C-C
NR
BNM
-LN
E
NPL
CE
NA
M
NIS
T
INM
S/N
RC
NM
IJ/A
IST
NPL
I
(Api
-Ap,
ref)/
Ap,
ref /
10-6
Fig. 7. Relative deviations of the participants’ results from the reference value and the
expanded (k=2) uncertainties of these deviations at 20 MPa
-60.0
-40.0
-20.0
0.0
20.0
40.0
60.0
PTB
IMG
C-C
NR
BNM
-LN
E
NPL
CE
NA
M
NIS
T
INM
S/N
RC
NM
IJ/A
IST
NPL
I
(Api
-Ap,
ref)/
Ap,
ref /
10-6
Fig. 8. Relative deviations of the participants’ results from the reference value and the
expanded (k=2) uncertainties of these deviations at 30 MPa
Final Report on CCM.P-K7, Version 4 of 01.08.2005
- 19 -
-60.0
-40.0
-20.0
0.0
20.0
40.0
60.0
PTB
IMG
C-C
NR
BNM
-LN
E
NPL
CE
NA
M
NIS
T
INM
S/N
RC
NM
IJ/A
IST
NPL
I
(Api
-Ap,
ref)/
Ap,
ref /
10-6
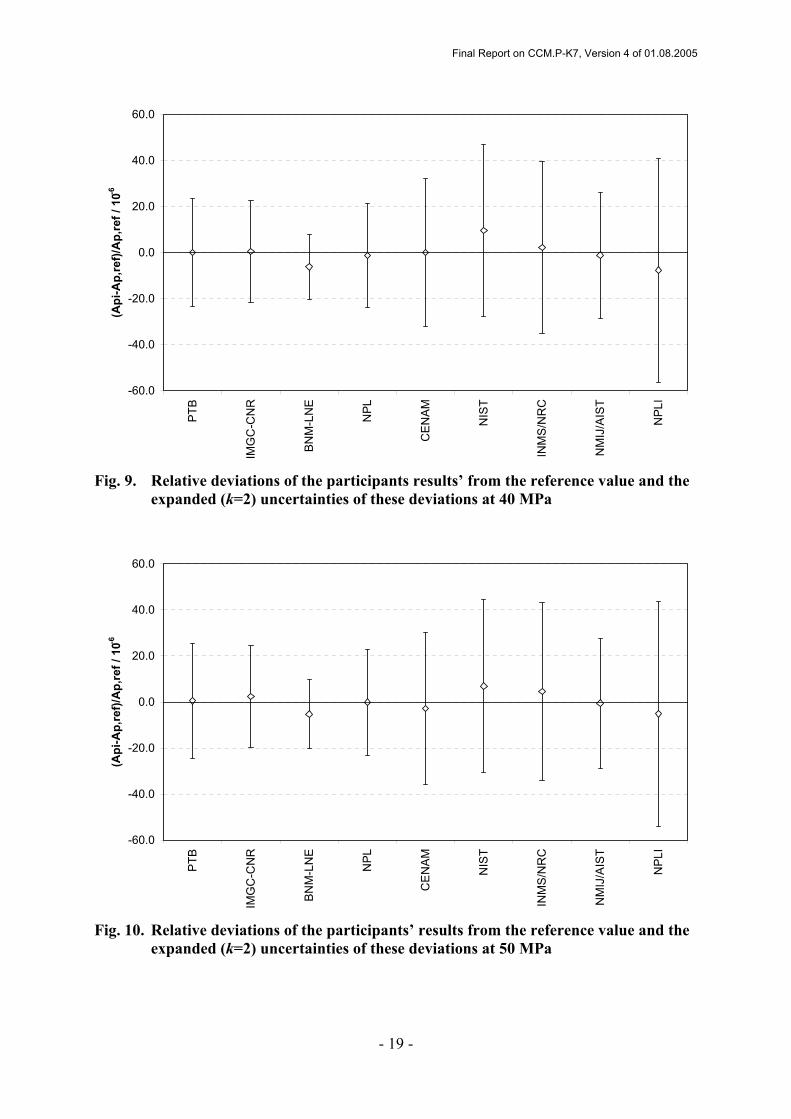
Fig. 9. Relative deviations of the participants results’ from the reference value and the
expanded (k=2) uncertainties of these deviations at 40 MPa
-60.0
-40.0
-20.0
0.0
20.0
40.0
60.0
PTB
IMG
C-C
NR
BNM
-LN
E
NPL
CE
NA
M
NIS
T
INM
S/N
RC
NM
IJ/A
IST
NPL
I
(Api
-Ap,
ref)/
Ap,
ref /
10-6
Fig. 10. Relative deviations of the participants’ results from the reference value and the
expanded (k=2) uncertainties of these deviations at 50 MPa
Final Report on CCM.P-K7, Version 4 of 01.08.2005
- 20 -
-60.0
-40.0
-20.0
0.0
20.0
40.0
60.0
PTB
IMG
C-C
NR
BNM
-LN
E
NPL
CE
NA
M
NIS
T
INM
S/N
RC
NM
IJ/A
IST
NPL
I
(Api
-Ap,
ref)/
Ap,
ref /
10-6
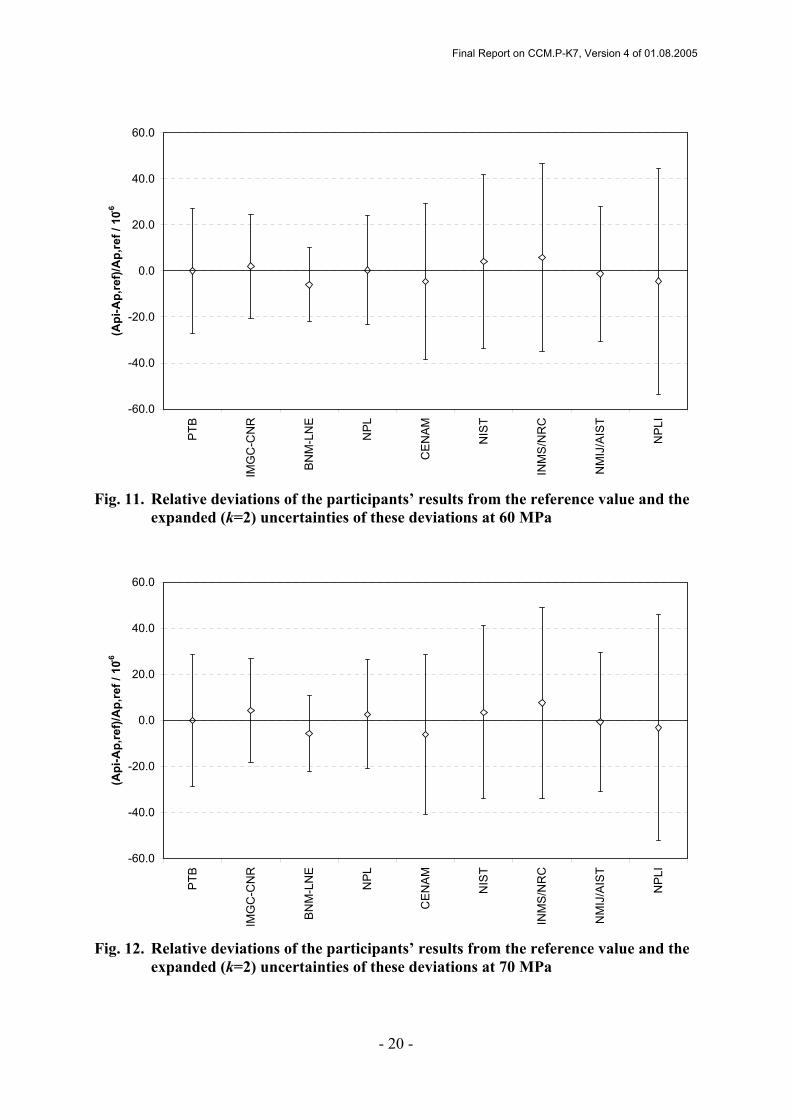
Fig. 11. Relative deviations of the participants’ results from the reference value and the
expanded (k=2) uncertainties of these deviations at 60 MPa
-60.0
-40.0
-20.0
0.0
20.0
40.0
60.0
PTB
IMG
C-C
NR
BNM
-LN
E
NPL
CE
NA
M
NIS
T
INM
S/N
RC
NM
IJ/A
IST
NPL
I
(Api
-Ap,
ref)/
Ap,
ref /
10-6
Fig. 12. Relative deviations of the participants’ results from the reference value and the
expanded (k=2) uncertainties of these deviations at 70 MPa
Final Report on CCM.P-K7, Version 4 of 01.08.2005
- 21 -
-60.0
-40.0
-20.0
0.0
20.0
40.0
60.0
PTB
IMG
C-C
NR
BNM
-LN
E
NPL
CE
NA
M
NIS
T
INM
S/N
RC
NM
IJ/A
IST
NPL
I
(Api
-Ap,
ref)/
Ap,
ref /
10-6
Fig. 13. Relative deviations of the participants’ results from the reference value and the
expanded (k=2) uncertainties of these deviations at 80 MPa
-60.0
-40.0
-20.0
0.0
20.0
40.0
60.0
PTB
IMG
C-C
NR
BNM
-LN
E
NPL
CE
NA
M
NIS
T
INM
S/N
RC
NM
IJ/A
IST
NPL
I
(Api
-Ap,
ref)/
Ap,
ref /
10-6
Fig. 14. Relative deviations of the participants’ results from the reference value and the
expanded (k=2) uncertainties of these deviations at 90 MPa
Final Report on CCM.P-K7, Version 4 of 01.08.2005
- 22 -
-60.0
-40.0
-20.0
0.0
20.0
40.0
60.0
PTB
IMG
C-C
NR
BNM
-LN
E
NPL
CE
NA
M
NIS
T
INM
S/N
RC
NM
IJ/A
IST
NPL
I
(Api
-Ap,
ref)/
Ap,
ref /
10-6
Fig. 15. Relative deviations of the participants’ results from the reference value and the
expanded (k=2) uncertainties of these deviations at 100 MPa
Final Report on CCM.P-K7, Version 4 of 01.08.2005
- 23 -
Table 4. Relative deviations of the participants’ results from the reference values (∆Ap/Ap) and their expanded uncertainties (U(∆Ap/Ap))
PTB IMGC-CNR BNM-LNE NPL CENAM NIST INMS/NRC NMIJ/AIST NPLI
p in MPa
∆Ap /A
p ×
106
U(∆
A p/A
p) ×
106
∆Ap /A
p ×
106
U(∆
A p/A
p) ×
106
∆Ap /A
p ×
106
U(∆
A p/A
p) ×
106
∆Ap /A
p ×
106
U(∆
A p/A
p) ×
106
∆Ap /A
p ×
106
U(∆
A p/A
p) ×
106
∆Ap /A
p ×
106
U(∆
A p/A
p) ×
106
∆Ap /A
p ×
106
U(∆
A p/A
p) ×
106
∆Ap /A
p ×
106
U(∆
A p/A
p) ×
106
∆Ap /A
p ×
106
U(∆
A p/A
p) ×
106
10 2.5 22 8.5 23 -3.7 16 -3.5 23 5.3 32 31.9 39 -1.6 35 0.0 27 -11.5 61 20 1.1 22 1.1 22 -5.0 14 -1.7 22 3.3 31 20.9 38 0.0 36 -1.6 27 -9.7 57 30 0.3 22 0.0 22 -5.5 14 -1.6 23 1.9 32 15.1 37 0.3 37 -0.7 27 -7.9 49 40 0.0 23 0.5 22 -6.2 14 -1.3 23 0.0 32 9.6 37 2.2 37 -1.1 27 -7.6 49 50 0.6 25 2.4 22 -5.3 15 0.0 23 -2.8 33 7.0 37 4.6 39 -0.5 28 -5.2 49 60 0.0 27 2.1 23 -6.0 16 0.4 24 -4.5 34 4.1 38 5.9 41 -1.3 29 -4.5 49 70 0.0 29 4.3 22 -5.7 16 2.6 24 -6.2 35 3.5 38 7.6 42 -0.6 30 -3.2 49 80 0.0 31 4.5 23 -5.9 17 4.5 24 -7.0 36 3.6 38 7.8 43 -0.5 31 -1.8 49 90 -0.1 33 5.2 23 -5.9 18 6.5 25 -8.5 37 4.4 38 8.0 45 0.0 33 -0.8 49 100 -0.1 36 7.2 23 -5.9 19 8.3 25 -9.5 38 4.7 38 7.2 46 0.0 34 -0.8 49
Table 5. Relative differences between the participants’ results (dij) and their expanded uncertainties (U(dij)) at p = 10 MPa
j
PTB IMGC-CNR BNM-LNE NPL CENAM NIST INMS/NRC NMIJ/AIST NPLI p = 10 MPa
d ij
× 10
6 U
(dij)
× 10
6
d ij
× 10
6
U(d
ij)
× 10
6 d i
j ×
106
U(d
ij)
× 10
6 d i
j ×
106
U(d
ij)
× 10
6 d i
j ×
106
U(d
ij)
× 10
6 d i
j ×
106
U(d
ij)
× 10
6 d i
j ×
106
U(d
ij)
× 10
6
d ij
× 10
6
U(d
ij)
× 10
6 d i
j ×
106
U(d
ij)
× 10
6
PTB -5.9 31 6.2 26 6.0 31 -2.8 38 -29.4 44 4.2 41 2.5 34 14.0 64 IMGC-CNR 5.9 31 12.1 27 11.9 31 3.2 38 -23.5 44 10.1 41 8.5 35 19.9 64 BNM-LNE -6.2 26 -12.1 27 -0.2 27 -9.0 35 -35.6 41 -2.0 38 -3.7 31 7.8 63
NPL -6.0 31 -11.9 31 0.2 27 -8.8 38 -35.4 44 -1.8 42 -3.5 35 8.0 65 CENAM 2.8 38 -3.2 38 9.0 35 8.8 38 -26.6 50 6.9 47 5.3 41 16.8 68
NIST 29.4 44 23.5 44 35.6 41 35.4 44 26.6 50 33.6 52 31.9 47 43.4 72 INMS/NRC -4.2 41 -10.1 41 2.0 38 1.8 42 -6.9 47 -33.6 52 -1.6 44 9.9 70 NMIJ/AIST -2.5 34 -8.5 35 3.7 31 3.5 35 -5.3 41 -31.9 47 1.6 44 11.5 66
i
NPLI -14.0 64 -19.9 64 -7.8 63 -8.0 65 -16.8 68 -43.4 72 -9.9 70 -11.5 66

Final Report on CCM.P-K7, Version 4 of 01.08.2005
- 24 -
Table 6. Relative differences between the participants’ results (dij) and their expanded uncertainties (U(dij)) at p = 20 MPa
j
PTB IMGC-CNR BNM-LNE NPL CENAM NIST INMS/NRC NMIJ/AIST NPLI p = 20 MPa
d ij
× 10
6 U
(dij)
× 10
6
d ij
× 10
6
U(d
ij)
× 10
6 d i
j ×
106
U(d
ij)
× 10
6 d i
j ×
106
U(d
ij)
× 10
6 d i
j ×
106
U(d
ij)
× 10
6 d i
j ×
106
U(d
ij)
× 10
6 d i
j ×
106
U(d
ij)
× 10
6
d ij
× 10
6
U(d
ij)
× 10
6 d i
j ×
106
U(d
ij)
× 10
6
PTB 0.0 31 6.1 26 2.8 31 -2.2 38 -19.8 43 1.1 42 2.7 34 10.8 61 IMGC-CNR 0.0 31 6.1 26 2.9 31 -2.1 38 -19.8 44 1.1 42 2.8 35 10.9 61 BNM-LNE -6.1 26 -6.1 26 -3.3 26 -8.3 34 -25.9 40 -5.0 38 -3.4 30 4.7 58 NPL -2.8 31 -2.9 31 3.3 26 -5.0 38 -22.6 44 -1.7 42 -0.1 35 8.0 61 CENAM 2.2 38 2.1 38 8.3 34 5.0 38 -17.6 49 3.3 48 4.9 41 13.0 65 NIST 19.8 43 19.8 44 25.9 40 22.6 44 17.6 49 20.9 52 22.5 46 30.6 68 INMS/NRC -1.1 42 -1.1 42 5.0 38 1.7 42 -3.3 48 -20.9 52 1.6 45 9.7 67 NMIJ/AIST -2.7 34 -2.8 35 3.4 30 0.1 35 -4.9 41 -22.5 46 -1.6 45 8.1 63
i
NPLI -10.8 61 -10.9 61 -4.7 58 -8.0 61 -13.0 65 -30.6 68 -9.7 67 -8.1 63 Table 7. Relative differences between the participants’ results (dij) and their expanded uncertainties (U(dij)) at p = 30 MPa
j
PTB IMGC-CNR BNM-LNE NPL CENAM NIST INMS/NRC NMIJ/AIST NPLI p = 30 MPa
d ij
× 10
6 U
(dij)
× 10
6 d i
j ×
106
U(d
ij)
× 10
6
d ij
× 10
6 U
(dij)
× 10
6 d i
j ×
106
U(d
ij)
× 10
6 d i
j ×
106
U(d
ij)
× 10
6 d i
j ×
106
U(d
ij)
× 10
6 d i
j ×
106
U(d
ij)
× 10
6
d ij
× 10
6
U(d
ij)
× 10
6 d i
j ×
106
U(d
ij)
× 10
6
PTB 0.3 31 5.8 26 1.9 32 -1.7 39 -14.8 43 0.0 43 1.0 35 8.2 53 IMGC-CNR -0.3 31 5.5 26 1.6 31 -1.9 38 -15.1 43 -0.3 43 0.7 35 7.9 53 BNM-LNE -5.8 26 -5.5 26 -3.9 26 -7.5 34 -20.6 40 -5.8 39 -4.8 30 2.4 50 NPL -1.9 32 -1.6 31 3.9 26 -3.6 39 -16.7 44 -1.9 43 -0.9 35 6.3 54 CENAM 1.7 39 1.9 38 7.5 34 3.6 39 -13.1 49 1.6 48 2.7 42 9.8 58 NIST 14.8 43 15.1 43 20.6 40 16.7 44 13.1 49 14.8 52 15.8 46 23.0 61 INMS/NRC 0.0 43 0.3 43 5.8 39 1.9 43 -1.6 48 -14.8 52 1.0 45 8.2 61 NMIJ/AIST -1.0 35 -0.7 35 4.8 30 0.9 35 -2.7 42 -15.8 46 -1.0 45 7.2 56
i
NPLI -8.2 53 -7.9 53 -2.4 50 -6.3 54 -9.8 58 -23.0 61 -8.2 61 -7.2 56
Final Report on CCM.P-K7, Version 4 of 01.08.2005
- 25 -
Table 8. Relative differences between the participants’ results (dij) and their expanded uncertainties (U(dij)) at p = 40 MPa j
PTB IMGC-CNR BNM-LNE NPL CENAM NIST INMS/NRC NMIJ/AIST NPLI p = 40 MPa
d ij
× 10
6 U
(dij)
× 10
6 d i
j ×
106
U(d
ij)
× 10
6
d ij
× 10
6 U
(dij)
× 10
6 d i
j ×
106
U(d
ij)
× 10
6 d i
j ×
106
U(d
ij)
× 10
6 d i
j ×
106
U(d
ij)
× 10
6 d i
j ×
106
U(d
ij)
× 10
6
d ij
× 10
6
U(d
ij)
× 10
6 d i
j ×
106
U(d
ij)
× 10
6
PTB -0.5 32 6.2 27 1.3 32 0.0 40 -9.6 44 -2.2 44 1.1 36 7.6 54 IMGC-CNR 0.5 32 6.7 26 1.8 32 0.5 39 -9.1 43 -1.6 43 1.6 35 8.1 53 BNM-LNE -6.2 27 -6.7 26 -4.9 27 -6.2 35 -15.8 40 -8.4 40 -5.1 31 1.4 51 NPL -1.3 32 -1.8 32 4.9 27 -1.3 39 -10.9 44 -3.5 44 -0.2 36 6.3 54 CENAM 0.0 40 -0.5 39 6.2 35 1.3 39 -9.6 49 -2.1 49 1.1 42 7.6 58 NIST 9.6 44 9.1 43 15.8 40 10.9 44 9.6 49 7.5 53 10.7 46 17.2 61 INMS/NRC 2.2 44 1.6 43 8.4 40 3.5 44 2.1 49 -7.5 53 3.3 46 9.8 61 NMIJ/AIST -1.1 36 -1.6 35 5.1 31 0.2 36 -1.1 42 -10.7 46 -3.3 46 6.5 56
i
NPLI -7.6 54 -8.1 53 -1.4 51 -6.3 54 -7.6 58 -17.2 61 -9.8 61 -6.5 56 Table 9. Relative differences between the participants’ results (dij) and their expanded uncertainties (U(dij)) at p = 50 MPa
j
PTB IMGC-CNR BNM-LNE NPL CENAM NIST INMS/NRC NMIJ/AIST NPLI p = 50 MPa
d ij
× 10
6 U
(dij)
× 10
6 d i
j ×
106
U(d
ij)
× 10
6
d ij
× 10
6 U
(dij)
× 10
6 d i
j ×
106
U(d
ij)
× 10
6 d i
j ×
106
U(d
ij)
× 10
6 d i
j ×
106
U(d
ij)
× 10
6 d i
j ×
106
U(d
ij)
× 10
6
d ij
× 10
6
U(d
ij)
× 10
6 d i
j ×
106
U(d
ij)
× 10
6
PTB -1.9 33 5.9 29 0.6 34 3.3 41 -6.4 45 -4.0 46 1.1 37 5.8 55 IMGC-CNR 1.9 33 7.7 26 2.4 32 5.2 39 -4.5 43 -2.1 44 3.0 36 7.6 54 BNM-LNE -5.9 29 -7.7 26 -5.3 27 -2.5 36 -12.2 40 -9.9 41 -4.8 32 -0.1 51 NPL -0.6 34 -2.4 32 5.3 27 2.8 40 -7.0 44 -4.6 45 0.5 36 5.2 54 CENAM -3.3 41 -5.2 39 2.5 36 -2.8 40 -9.7 50 -7.3 50 -2.2 43 2.4 59 NIST 6.4 45 4.5 43 12.2 40 7.0 44 9.7 50 2.4 54 7.5 47 12.1 61 INMS/NRC 4.0 46 2.1 44 9.9 41 4.6 45 7.3 50 -2.4 54 5.1 47 9.8 62 NMIJ/AIST -1.1 37 -3.0 36 4.8 32 -0.5 36 2.2 43 -7.5 47 -5.1 47 4.7 56
i
NPLI -5.8 55 -7.6 54 0.1 51 -5.2 54 -2.4 59 -12.1 61 -9.8 62 -4.7 56
Final Report on CCM.P-K7, Version 4 of 01.08.2005
- 26 -
Table 10. Relative differences between the participants’ results (dij) and their expanded uncertainties (U(dij)) at p = 60 MPa j
PTB IMGC-CNR BNM-LNE NPL CENAM NIST INMS/NRC NMIJ/AIST NPLI p = 60 MPa
d ij
× 10
6 U
(dij)
× 10
6 d i
j ×
106
U(d
ij)
× 10
6
d ij
× 10
6 U
(dij)
× 10
6 d i
j ×
106
U(d
ij)
× 10
6 d i
j ×
106
U(d
ij)
× 10
6 d i
j ×
106
U(d
ij)
× 10
6 d i
j ×
106
U(d
ij)
× 10
6 d i
j ×
106
U(d
ij)
× 10
6 d i
j ×
106
U(d
ij)
× 10
6
PTB -2.1 34 6.0 30 -0.4 35 4.5 43 -4.1 46 -5.9 48 1.3 39 4.5 56 IMGC-CNR 2.1 34 8.1 27 1.7 32 6.6 40 -1.9 43 -3.8 46 3.4 36 6.6 54 BNM-LNE -6.0 30 -8.1 27 -6.4 27 -1.5 37 -10.0 40 -11.9 43 -4.7 32 -1.5 51 NPL 0.4 35 -1.7 32 6.4 27 4.9 41 -3.7 44 -5.5 46 1.6 37 4.8 54 CENAM -4.5 43 -6.6 40 1.5 37 -4.9 41 -8.6 50 -10.4 52 -3.3 44 -0.1 59 NIST 4.1 46 1.9 43 10.0 40 3.7 44 8.6 50 -1.8 55 5.3 47 8.5 61 INMS/NRC 5.9 48 3.8 46 11.9 43 5.5 46 10.4 52 1.8 55 7.1 50 10.4 63 NMIJ/AIST -1.3 39 -3.4 36 4.7 32 -1.6 37 3.3 44 -5.3 47 -7.1 50 3.2 57
i
NPLI -4.5 56 -6.6 54 1.5 51 -4.8 54 0.1 59 -8.5 61 -10.4 63 -3.2 57 Table 11. Relative differences between the participants’ results (dij) and their expanded uncertainties (U(dij)) at p = 70 MPa
j
PTB IMGC-CNR BNM-LNE NPL CENAM NIST INMS/NRC NMIJ/AIST NPLI p = 70 MPa
d ij
× 10
6 U
(dij)
× 10
6
d ij
× 10
6
U(d
ij)
× 10
6 d i
j ×
106
U(d
ij)
× 10
6 d i
j ×
106
U(d
ij)
× 10
6 d i
j ×
106
U(d
ij)
× 10
6 d i
j ×
106
U(d
ij)
× 10
6 d i
j ×
106
U(d
ij)
× 10
6 d i
j ×
106
U(d
ij)
× 10
6 d i
j ×
106
U(d
ij)
× 10
6
PTB -4.3 36 5.7 32 -2.6 37 6.2 45 -3.5 47 -7.6 50 0.6 41 3.2 56 IMGC-CNR 4.3 36 10.0 27 1.7 32 10.5 41 0.8 43 -3.3 47 4.9 37 7.5 54 BNM-LNE -5.7 32 -10.0 27 -8.3 28 0.5 38 -9.2 40 -13.3 44 -5.1 34 -2.4 51 NPL 2.6 37 -1.7 32 8.3 28 8.8 41 -0.9 44 -5.0 47 3.2 38 5.8 54 CENAM -6.2 45 -10.5 41 -0.5 38 -8.8 41 -9.7 51 -13.8 54 -5.6 45 -3.0 60 NIST 3.5 47 -0.8 43 9.2 40 0.9 44 9.7 51 -4.1 56 4.1 48 6.7 61 INMS/NRC 7.6 50 3.3 47 13.3 44 5.0 47 13.8 54 4.1 56 8.2 51 10.8 64 NMIJ/AIST -0.6 41 -4.9 37 5.1 34 -3.2 38 5.6 45 -4.1 48 -8.2 51 2.7 57
i
NPLI -3.2 56 -7.5 54 2.4 51 -5.8 54 3.0 60 -6.7 61 -10.8 64 -2.7 57
Final Report on CCM.P-K7, Version 4 of 01.08.2005
- 27 -
Table 12. Relative differences between the participants’ results (dij) and their expanded uncertainties (U(dij)) at p = 80 MPa j
PTB IMGC-CNR BNM-LNE NPL CENAM NIST INMS/NRC NMIJ/AIST NPLI p = 80 MPa
d ij
× 10
6 U
(dij)
× 10
6
d ij
× 10
6
U(d
ij)
× 10
6 d i
j ×
106
U(d
ij)
× 10
6 d i
j ×
106
U(d
ij)
× 10
6 d i
j ×
106
U(d
ij)
× 10
6 d i
j ×
106
U(d
ij)
× 10
6 d i
j ×
106
U(d
ij)
× 10
6 d i
j ×
106
U(d
ij)
× 10
6 d i
j ×
106
U(d
ij)
× 10
6
PTB -4.5 38 5.9 35 -4.5 39 7.0 47 -3.6 48 -7.8 52 0.5 43 1.8 58 IMGC-CNR 4.5 38 10.3 27 0.0 32 11.4 42 0.9 43 -3.4 48 5.0 38 6.3 54 BNM-LNE -5.9 35 -10.3 27 -10.3 29 1.1 39 -9.4 41 -13.7 45 -5.3 35 -4.0 51 NPL 4.5 39 0.0 32 10.3 29 11.4 43 0.9 44 -3.4 48 5.0 39 6.3 54 CENAM -7.0 47 -11.4 42 -1.1 39 -11.4 43 -10.5 51 -14.8 55 -6.4 47 -5.1 60 NIST 3.6 48 -0.9 43 9.4 41 -0.9 44 10.5 51 -4.3 56 4.1 48 5.4 61 INMS/NRC 7.8 52 3.4 48 13.7 45 3.4 48 14.8 55 4.3 56 8.4 52 9.6 65 NMIJ/AIST -0.5 43 -5.0 38 5.3 35 -5.0 39 6.4 47 -4.1 48 -8.4 52 1.3 58
i
NPLI -1.8 58 -6.3 54 4.0 51 -6.3 54 5.1 60 -5.4 61 -9.6 65 -1.3 58 Table 13. Relative differences between the participants’ results (dij) and their expanded uncertainties (U(dij)) at p = 90 MPa
j
PTB IMGC-CNR BNM-LNE NPL CENAM NIST INMS/NRC NMIJ/AIST NPLI p = 90 MPa
d ij
× 10
6 U
(dij)
× 10
6
d ij
× 10
6
U(d
ij)
× 10
6 d i
j ×
106
U(d
ij)
× 10
6 d i
j ×
106
U(d
ij)
× 10
6 d i
j ×
106
U(d
ij)
× 10
6 d i
j ×
106
U(d
ij)
× 10
6 d i
j ×
106
U(d
ij)
× 10
6 d i
j ×
106
U(d
ij)
× 10
6 d i
j ×
106
U(d
ij)
× 10
6
PTB -5.3 39 5.8 37 -6.6 40 8.4 49 -4.4 50 -8.0 55 -0.1 46 0.7 59 IMGC-CNR 5.3 39 11.1 28 -1.3 32 13.7 43 0.8 43 -2.8 49 5.2 39 6.0 53 BNM-LNE -5.8 37 -11.1 28 -12.4 29 2.6 40 -10.2 41 -13.8 47 -5.9 36 -5.1 51 NPL 6.6 40 1.3 32 12.4 29 15.0 44 2.2 44 -1.4 50 6.5 40 7.3 54 CENAM -8.4 49 -13.7 43 -2.6 40 -15.0 44 -12.8 52 -16.4 57 -8.5 48 -7.7 61 NIST 4.4 50 -0.8 43 10.2 41 -2.2 44 12.8 52 -3.6 58 4.4 49 5.2 61 INMS/NRC 8.0 55 2.8 49 13.8 47 1.4 50 16.4 57 3.6 58 8.0 54 8.8 66 NMIJ/AIST 0.1 46 -5.2 39 5.9 36 -6.5 40 8.5 48 -4.4 49 -8.0 54 0.8 58
i
NPLI -0.7 59 -6.0 53 5.1 51 -7.3 54 7.7 61 -5.2 61 -8.8 66 -0.8 58

Final Report on CCM.P-K7, Version 4 of 01.08.2005
- 28 -
Table 14. Relative differences between the participants’ results (dij) and their expanded uncertainties (U(dij)) at p = 100 MPa j
PTB IMGC-CNR BNM-LNE NPL CENAM NIST INMS/NRC NMIJ/AIST NPLI p = 100 MPa
d ij
× 10
6 U
(dij)
× 10
6
d ij
× 10
6
U(d
ij)
× 10
6 d i
j ×
106
U(d
ij)
× 10
6 d i
j ×
106
U(d
ij)
× 10
6 d i
j ×
106
U(d
ij)
× 10
6 d i
j ×
106
U(d
ij)
× 10
6 d i
j ×
106
U(d
ij)
× 10
6 d i
j ×
106
U(d
ij)
× 10
6 d i
j ×
106
U(d
ij)
× 10
6
PTB -7.3 41 5.8 39 -8.3 43 9.4 51 -4.8 51 -7.3 57 -0.1 48 0.7 60 IMGC-CNR 7.3 41 13.1 28 -1.0 33 16.7 44 2.5 43 0.0 50 7.2 40 8.0 54 BNM-LNE -5.8 39 -13.1 28 -14.1 30 3.6 42 -10.6 41 -13.1 48 -5.9 37 -5.1 52 NPL 8.3 43 1.0 33 14.1 30 17.7 45 3.5 44 1.0 51 8.3 41 9.1 55 CENAM -9.4 51 -16.7 44 -3.6 42 -17.7 45 -14.2 53 -16.7 59 -9.5 50 -8.7 62 NIST 4.8 51 -2.5 43 10.6 41 -3.5 44 14.2 53 -2.5 59 4.7 50 5.5 61 INMS/NRC 7.3 57 0.0 50 13.1 48 -1.0 51 16.7 59 2.5 59 7.2 56 8.0 67 NMIJ/AIST 0.1 48 -7.2 40 5.9 37 -8.3 41 9.5 50 -4.7 50 -7.2 56 0.8 59
i
NPLI -0.7 60 -8.0 54 5.1 52 -9.1 55 8.7 62 -5.5 61 -8.0 67 -0.8 59

Final Report on CCM.P-K7, Version 4 of 01.08.2005
- 29 -
7. Discussion From Table 1, good performance of the TS can be concluded. The typical relative standard deviations of Ap range from 0.2·10-6 to 3.8·10-6 with the most values being around 1·10-6. The changes of typical s(Ap)/Ap values from laboratory to laboratory demonstrate different performance of pressure measurements. A comparison of s(Ap) with u(Ap) clearly shows that almost the entire uncertainty of Ap is contributed by the uncertainty of the laboratory standards. As is seen in Table 2, the participants claim quite different uncertainties for their standards. For A0 the relative standard uncertainty lies between 4.5·10-6 and 19·10-6, and the standard uncertainty of λ ranges from 0.035·10-6 MPa-1 to 0.15·10-6 MPa-1. In dependence on u(A0,LS) and u(λLS) claimed, the resulting relative standard uncertainty of Ap of TS is more or less pressure dependent and ranges from 6.8·10-6 to 30·10-6. The highest and the lowest uncertainties reported for the same pressure differ by a factor of four. An analysis of the comparison results in terms of the zero-pressure effective area and pressure distortion coefficient is of interest because these quantities are frequently reported in calibration certificates (Table 2). For all participants, the standard deviation of A0 obtained by the linear regression is noticeably higher than s(Ap), which expresses the fact that Ap did not change entirely linearly with pressure. Nevertheless, as a comparison of s(A0) with u(A0) and of s(λ) with u(λ) shows, using the A0-λ model the laboratory standards are the main uncertainty source. The relative difference between the maximum and minimum zero-pressure effective areas is equal to 38·10-6 and between the maximum and minimum pressure distortion coefficients to 0.39·10-6 MPa-1. These differences are larger and for some laboratories significantly larger than the expanded uncertainties which are ascribed to the laboratory standards. The value of 0.39·10-6 MPa-1 is also higher than 0.1·10-6 MPa-1, the value assumed to be a reasonable minimum uncertainty of the pressure distortion coefficient of pressure balances implied as reference pressure standards in the CIPM Calibration Measurement Capabilities (CMC) tables of NMIs. However, the source for the discrepancies should be searched not in the A0,LS- and λLS- uncertainties of the laboratory standards but rather in constant force errors such as errors in the constant mass part, oil surface tension, head correction, pressure difference measurement etc., which cause typical non-linear dependence of Ap(p) observed in some of the participants’ results. Indeed, when comparing the results of selected laboratories which observed particularly good linearity of Ap(p), the agreement in A0 and λ is much better. Thus for PTB, IMGC-CNR, BNM-LNE, NPL, CENAM, INMS/NRC and NMIJ/AIST the maximum relative difference of A0 is 12.3·10-6 and the maximum difference of λ is 0.28·10-6 MPa-1. Among the laboratories reported uncertainties of A0 and λ of the TS, all A0 values agree within their standard uncertainties and λ values within their expanded uncertainties (k=2). With the exception of pair BNM-LNE and NPL all λ values agree even at the standard uncertainty level. For the median pressure dependent effective areas of the TS which have been chosen as reference values of this comparison (KCRV), a full agreement between them and the participants’ results is observed at all pressures within the expanded uncertainties (k=2). Except for the NIST results at 10 MPa and 20 MPa, all participants’ results agree with KCRV even within their standard uncertainties. A comparison of pairs demonstrates that all Ap values of the participants agree with each other within their expanded uncertainties (k=2). At the level of standard uncertainties there is a full agreement between 40 MPa and 100 MPa. At the lowest pressure of 10 MPa the NIST result deviates from the results of other participants by more than the standard uncertainty.
Final Report on CCM.P-K7, Version 4 of 01.08.2005
- 30 -
At a pressure of 20 MPa the NIST result is higher than the results of BNM-LNE and NPL by more than the standard uncertainty. At a pressure of 30 MPa the difference of the NIST and BNM-LNE effective areas is higher than the standard uncertainty. Although the NIST result for the effective area of the transfer standard agrees within the expanded uncertainty with the key comparison reference value, the larger areas at the low pressures indicate a possible constant force error. NIST was the only participant whose LS and TS operated with different pressure transmitting media, and because of this was the only participant to determine pressure equilibrium between their LS and the TS with a DP cell. If the DP cell produced a constant pressure error of the order of 200 Pa, this would be enough to explain the larger TS areas at low pressure. It is worth noting that the use of the DP cell has not led to any deterioration of the measurement performance at individual pressures; the standard deviation of the NIST Ap is within the range of other participants who directly connected the TS to their LS. In a bilateral comparison between NIST and NPLI, which was carried out in the range 40 MPa to 200 MPa immediately before the current CCM comparison, the pressure standards of both laboratories were connected directly without a DP cell and demonstrated equivalence within 2·10-6 in relative units [10]. Additional investigations are required to definitively conclude on the possible effect of the DP cell or other force errors on the NIST results in the CCM comparison. 8. Conclusions The uncertainties of the participants claimed in their CMC tables for the pressure range 10 MPa to 100 MPa are fully supported by this comparison. All the effective areas of the transfer standard reported by the participants agree within their expanded uncertainties (k=2) with the key comparison reference values and with each other. In 342 of 360 pairs of results, agreement within the standard uncertainties is observed. For laboratories presenting the zero-pressure effective area and pressure distortion coefficient of the transfer standard with their combined standard uncertainties, all the results are equivalent within the expanded uncertainties (k=2). The scatter of the reported distortion coefficients, which is four times higher than the uncertainties of the pressure distortion coefficient typically assumed in the CMC tables of NMIs, should be explained by errors in determining the forces acting on the piston rather than by errors in the distortion coefficients of the laboratories’ standards. The results of the comparison show that cross-float measurements with pressure balances working with different liquids still remain problematic and can lead to increased uncertainties. The transfer standard was stable within only a few 10-6 in the period of the comparison. This fact and also the performance on the 10-6 level of the laboratories which took part in the regional comparisons in the 10 MPa to 100 MPa range provide a good basis for a link of that regional comparisons to the actual CCM comparison and to each other. Acknowledgements The authors thank G.F. Molinar (IMGC-CNR), J.C. Legras (BNM-LNE), I. Severn and D. Sumner (NPL), S. Yadav (NPLI), D. Waßmann and T. Konczak (PTB), who have essentially contributed to this comparison either by its organisation, analysing and discussing the results as well as a critical reading of the manuscript or by characterising the transfer standard, carrying out pressure measurements and taking other responsibilities at different stages of this project.
Final Report on CCM.P-K7, Version 4 of 01.08.2005
- 31 -
References 1. Jäger J., Sabuga W., Wassmann D., Piston-cylinder assemblies of 5 cm2 cross-
sectional area used in an oil-operated primary pressure balance standard for the 10 MPa range, Metrologia, 1999, 36, 541-544.
2. Molinar G., Sabuga W., Robinson G., Legras J.C., Comparison of methods for calculating distortion in pressure balances up to 400 MPa - EUROMET Project #256. In: Metrologia, 1998, 35, 739-759.
3. Molinar G.F., Maghenzani R., Cresto P.C. and Bianchi L., Elastic distortions in piston-cylinder units at pressures up to 0.5 GPa, Metrologia, 1992, 29, 425-440.
4. Legras J.C., Huot A., Delajoud P., La référence nationale de pression du BNM dans le domaine de 5 à 200 MPa, Bull. d'Information du BNM, Avril 1982, N° 48, 9-33.
5. Legras J.C., Piston gage used as high accuracy standards in the range 0.01 - 1000 MPa. BIPM Monographie 89/1, 1989, 41 -52.
6. Kobata T., Olson D.A., Accurate Determination of Differential Pressure between Two Pressure Balances using a Pressure Transducer, Proc. of SICE Ann. Conf. – 2003, Fukui, 4 - 6, August, 2003
7. Bandyopadhyay A.K., Gupta A.C., Realization of a national practical pressure scale for pressures up to 500 MPa, Metrologia, 1999, 36, 681-688
8. Cox M.G., The evaluation of key comparison data, Metrologia, 2002, 39, 589-595 9. Müller J.W., Possible advantages of a robust evaluation of comparisons, J. Res. Natl.
Inst. Stand. Technol. 105, 551-555, 2000. 10. Driver R.G., Olson D.A., Sanjay Y and Bandyopadhyay A.K., Bilateral comparison
between NIST (USA) and NPL (India) in the hydraulic pressure region 40 to 200 MPa, Proc. of the 4th CCM Int. Conf. on pressure metrology, 2005.