Embed Size (px)
Citation preview

CCKK DRUG DELIVERY TECHNOLOGIES: MONOCLONAL ANTIBODIES FOR DELIVERY OF
CHEMOTHERAPY DRUGS FOR CANCER THERAPY
Technical Report and Business Plan
April 29, 2005 Submitted to Dr. Miguel Bagajewicz Submitted by: Sarah Clawson Paul Cole Sarah Katen Nell Keith

Table of Contents
1. Abstract........................................................................................................................... 5
2. Introduction.................................................................................................................... 6 2.1 Malignant Tumors: Gliomas.............................................................................................. 7 2.2 Blood Brain Barrier ............................................................................................................ 8 2.3 MAb 81C6............................................................................................................................ 9
3. Existing Treatment Options......................................................................................... 10 3.1 Antibody alone................................................................................................................... 10 3.2 Antibody with Toxin ......................................................................................................... 11 3.3 MAb conjugated to radionuclide ..................................................................................... 12
4. Proposed Alternative Treatment Methods................................................................... 13 4.1 Immunomicelles ................................................................................................................ 13 4.2 Vector Mediated Transcytosis ......................................................................................... 14 4.3 Immunoliposome............................................................................................................... 16 4.4 Immunoliposomes vs. Immunomicelles........................................................................... 16 4.5 Nanoparticles..................................................................................................................... 17 4.6 Chemotherapy Toxin Choices.......................................................................................... 18 4.7 Temodar Product Information ....................................................................................... 19
5. Production of Monoclonal Antibodies ........................................................................ 20 5.1 Laboratory Scale Production/Isolation of Monoclonal Antibodies .............................. 20 5.2 Large Scale Production of MAbs..................................................................................... 22
6. Immunomicelle Production and Drug Encapsulation ............................................... 26 6.1 Production of Immunomicelle.......................................................................................... 26 6.2 Immunomicelle with Temodar®....................................................................................... 27
7. Treatment ..................................................................................................................... 28 7.1 Blood Supply to the Brain ................................................................................................ 28 7.2 Blood Temodar® Concentration Model........................................................................... 29 7.3 Drug Delivery by Injection as a Function of Tumor Volume ....................................... 32 7.4 Brain Immunomicelle Concentration Model.................................................................. 36
8. Animal Testing ............................................................................................................. 41
9. Business Plan ............................................................................................................... 41 9.1 Business Goals and Market Strategy............................................................................... 41 9.2 Business Organization ...................................................................................................... 43 9.3 Glioma Incidence in the US.............................................................................................. 45
2
9.4 Plant Location ................................................................................................................... 46 9.5 Funding .............................................................................................................................. 49 9.6 Cost..................................................................................................................................... 50 9.7 Pre-FDA Testing ............................................................................................................... 51 9.8 FDA Testing and Approval .............................................................................................. 56 9.9 Marketing .......................................................................................................................... 58 9.10 Economic Demand Model............................................................................................... 59 9.11 Risk Analysis ................................................................................................................... 63
10. Conclusions ................................................................................................................ 77
11. References .................................................................................................................. 78
A1. Appendix 1 ................................................................................................................. 81 A1.1 Nanoparticles .................................................................................................................. 81 A1.2 Production of Nanoparticles.......................................................................................... 82 A1.3 Problems with Nanoparticle Treatment...................................................................... 82 A1.4 Pre-FDA Testing of Nanoshell Delivery Mechanism .................................................. 85
A2. Appendix 2 ................................................................................................................. 87 A2.1 Pharmacokinetic Parameter Derivation ...................................................................... 87
A3. Appendix 3 ................................................................................................................. 91 A3.1 NPV Distributions of Each Successful Scenario.......................................................... 91
3
Table of Figures Figure 1: Monoclonal Antibodies Binding to Epitopes_________________________________________ 6 Figure 2: Malignant Glioma _____________________________________________________________ 7 Figure 3: Blood Brain Barrier Illustration __________________________________________________ 9 Figure 4: Antibody Treatment Mechanisms ________________________________________________ 11 Figure 5: Cross-sectional View of a Micelle________________________________________________ 13 Figure 6: Vector Mediated Transcytosis ___________________________________________________ 15 Figure 7: Cross-sectional View of a Liposome ______________________________________________ 16 Figure 8: Electron Micrograph of Nanoparticles ____________________________________________ 18 Figure 9: Temodar® Molecular Structure __________________________________________________ 20 Figure 10: MAb Isolation Technique _____________________________________________________ 21 Figure 11: Process Flow Diagram for Monoclonal Antibody Production Plant ____________________ 25 Figure 12: MAb-Micelle Attachment Reaction ______________________________________________ 27 Figure 13: Vascular Nework of the Brain __________________________________________________ 29 Figure 14: Micelle and Temodar® Oral Dosage Elimination Model _____________________________ 32 Figure 15: Common Carotid Artery Branching _____________________________________________ 33 Figure 16: Drug Delivery Standard Curve _________________________________________________ 35 Figure 17: Two Compartment Model _____________________________________________________ 36 Figure 18: Equilibrium Elimination Model_________________________________________________ 37 Figure 19: Redistribution Phase Equilibration Model ________________________________________ 38 Figure 20: Micelle Two Phase Elimination Model ___________________________________________ 40 Figure 21: Sales of Monoclonal Antibodies for Cancer _______________________________________ 43 Figure 22: Population Growth of the United States __________________________________________ 46 Figure 23: Location of Top 50 Cancer Treatment Centers in the US _____________________________ 48 Figure 24: Pre-FDA Possibilities ________________________________________________________ 51 Figure 25: Pre-FDA Micelle Testing Flow Chart____________________________________________ 54 Figure 26: Pre-FDA Micelle Testing Pathways _____________________________________________ 55 Figure 27: FDA Approval Pathways______________________________________________________ 57 Figure 28: α Function Model ___________________________________________________________ 62 Figure 29: NPV Risk Curve for Minimal R&D Spending ______________________________________ 71 Figure 30: Risk Curves for Variying First-Stage Decisions ____________________________________ 72 Figure 31: NPV Distribution at 5 Years of Most Probable Success ______________________________ 73 Figure 32: NPV Distributions for Sucessful Pathways ________________________________________ 74 Figure 33: Module 1 NPV Distribution____________________________________________________ 75 Figure 34: Module 2 NPV Distribution____________________________________________________ 76 Figure 35: Module 3 NPV Distribution____________________________________________________ 76 Figure 36: Module 4 NPV Distribution____________________________________________________ 77 Figure 37: Structure of Polybutylcyanoacrylate _____________________________________________ 84 Figure 38: Pre-FDA Testing of Nanoshell Flowchart_________________________________________ 86 Figure 39: Two Compartment Model Diagram______________________________________________ 87 Table of Tables Table 1: Pharmacokinetic Parameters ____________________________________________________ 39 Table 2: Available Funding from NIH_____________________________________________________ 49 Table 3: Pre-FDA Pathway Probabilities __________________________________________________ 65 Table 4: FDA Approval Process Probabilities ______________________________________________ 66 Table 5: FDA Approval Process Probabilities ______________________________________________ 67 Table 6: FDA Approval Process Probabilities ______________________________________________ 68 Table 7: FDA Approval Process Probabilities ______________________________________________ 69
4
1. Abstract Malignant Gliomas affect six to nine thousand Americans every year: the average sur-vival time for a patient with this disease is 40 to 60 weeks. CCKK Drug Delivery Tech-nologies has developed a treatment utilizing monoclonal antibodies (MAbs) to selectively deliver a chemotherapy drug directly to the tumor cells. The MAb used, 81C6, targets tenascin, which is in the extracellular matrix of the tumor. The antibody will be attached to a micelle and the toxin will be encapsulated within the micelle. This method will in-crease the damage to the tumor cells while decreasing the damage to the rest of the body. CCKK Drug Delivery Technologies will be a drug delivery technology company that will solicit other, larger drug companies to partner in the use of their drug with our immu-nomicelle technology. Company expenditures will be focused primarily on developing the delivery of the toxin to the cancer cell. Doing this will decrease our FDA costs be-cause the drug manufacturer will absorb the majority of the costs. The production facilities will be located in the Boswash, a megalopolis which runs from Boston south west to Washington DC, including Philadelphia, New York City, and Hart-ford, as well as all surrounding suburbs, in order to utilize the expertise and resources af-forded by three of the top five cancer facilities in the U.S. as well as those of top research universities. Pre-FDA testing will be done at Johns Hopkins, Yale, or Harvard in order to employ their expertise and take advantage of available NIH funding for university re-search; the NIH is the major funding source for research in cancer therapy, especially at the university level. The average amount of NIH grants that can be obtained by building in this area is approximately $3,789,000. It is estimated that the pre-FDA testing will cost between $2.5 million and $4.5 million and last thirteen years if the project is to ad-vance to FDA testing. Therefore, obtaining these grants is critical to the financial feasi-bility of the project. The facilities costs were estimated at $31.5 million, including facilities for antibody, vec-tor, and micelle production, as well as a pre-FDA research facility. The facilities for commercial production will be built during stage II of FDA testing, assuming the treat-ment passes all of the previous stages. FDA trials will be conducted to determine the safety, short term side effects, and long term side effects of the treatment. FDA testing will require approximately $20 million to fund the participating doctors’ salary and patients’ treatment for a duration of approxi-mately 21.5 years. The treatment cost per patient is set as $15,000 per year. This price allows for recovery of the capital investment in three years with a significant profit margin. The three years begins once FDA approval is granted and production has begun. A final NPV of the most likely scenario is around $100 million.
5
2. Introduction
Antibodies are proteins produced by the plasma cells in the immune system in response
to antigens, or foreign substances to the body that could possibly be detrimental to the
cell. Antibody-antigen complexes initiate a cascade of protective reactions in cells of the
immune system. Monoclonal antibodies are Y-shaped proteins with an antigen binding
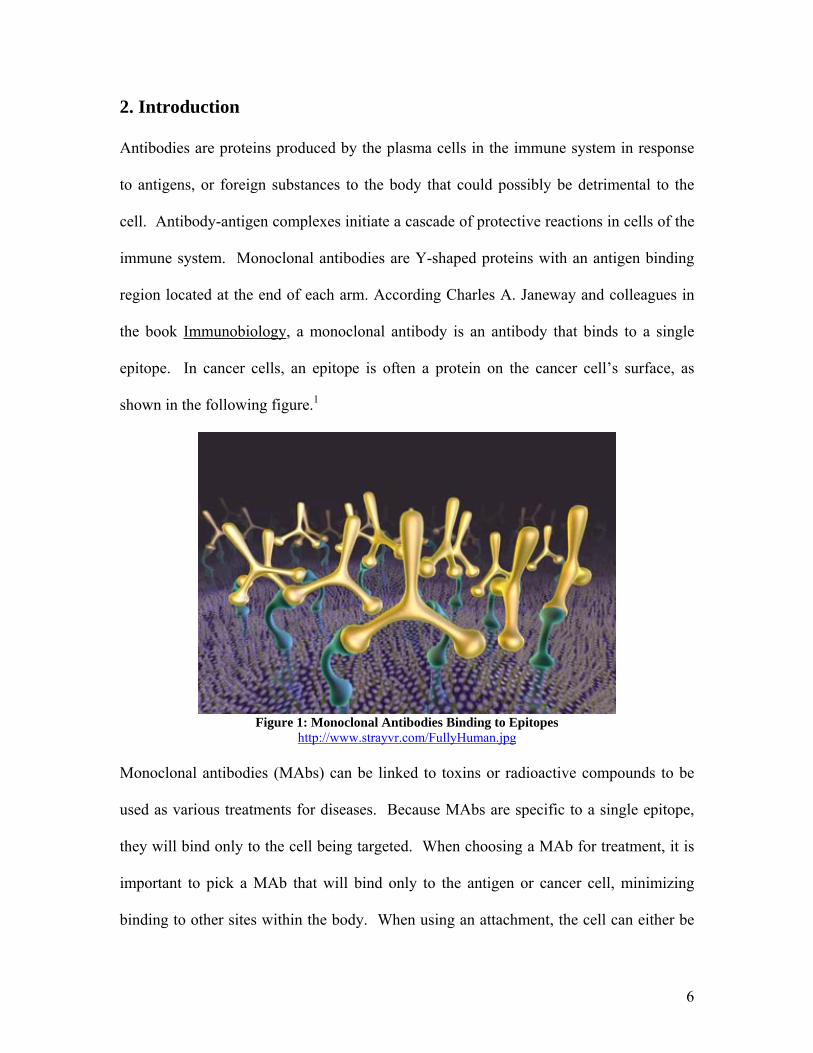
region located at the end of each arm. According Charles A. Janeway and colleagues in
the book Immunobiology, a monoclonal antibody is an antibody that binds to a single
epitope. In cancer cells, an epitope is often a protein on the cancer cell’s surface, as
shown in the following figure.1
Figure 1: Monoclonal Antibodies Binding to Epitopes
http://www.strayvr.com/FullyHuman.jpg
Monoclonal antibodies (MAbs) can be linked to toxins or radioactive compounds to be
used as various treatments for diseases. Because MAbs are specific to a single epitope,
they will bind only to the cell being targeted. When choosing a MAb for treatment, it is
important to pick a MAb that will bind only to the antigen or cancer cell, minimizing
binding to other sites within the body. When using an attachment, the cell can either be
6
killed by radiation from the molecule attached to the MAb or by the release of the toxin
in the cell after it engulfs the antibody.1
2.1 Malignant Tumors: Gliomas
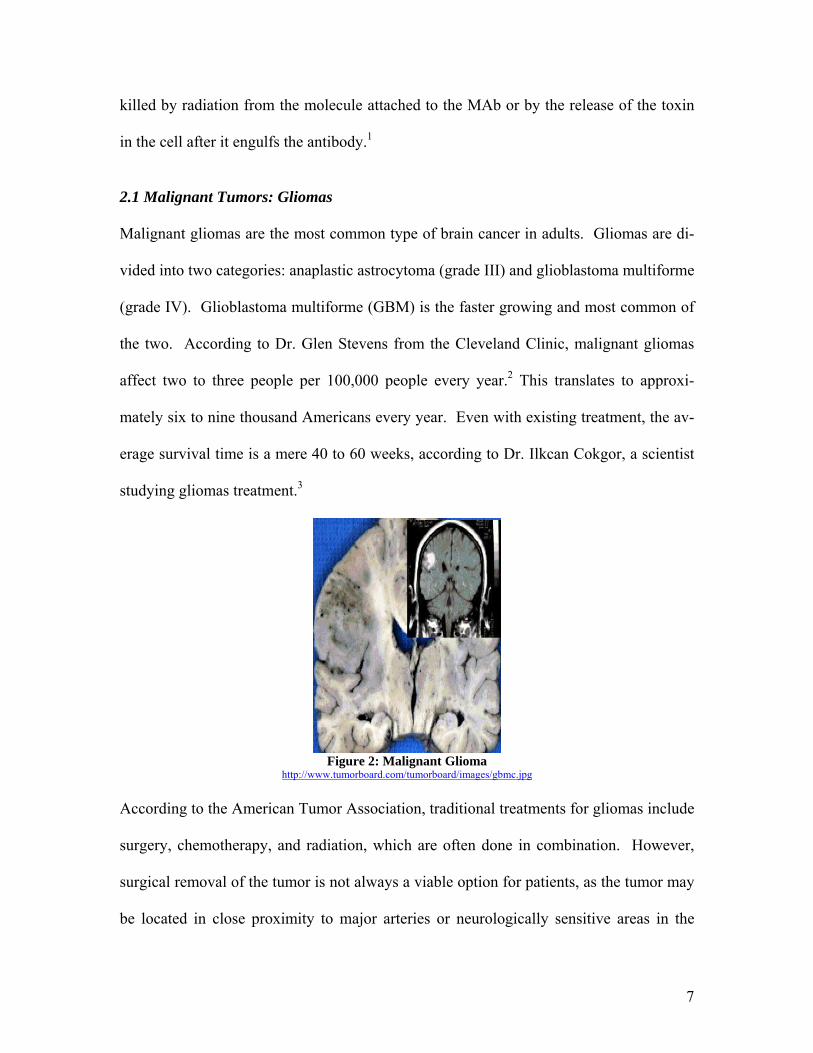
Malignant gliomas are the most common type of brain cancer in adults. Gliomas are di-
vided into two categories: anaplastic astrocytoma (grade III) and glioblastoma multiforme
(grade IV). Glioblastoma multiforme (GBM) is the faster growing and most common of
the two. According to Dr. Glen Stevens from the Cleveland Clinic, malignant gliomas
affect two to three people per 100,000 people every year.2 This translates to approxi-
mately six to nine thousand Americans every year. Even with existing treatment, the av-
erage survival time is a mere 40 to 60 weeks, according to Dr. Ilkcan Cokgor, a scientist
studying gliomas treatment.3
Figure 2: Malignant Glioma
http://www.tumorboard.com/tumorboard/images/gbmc.jpg
According to the American Tumor Association, traditional treatments for gliomas include
surgery, chemotherapy, and radiation, which are often done in combination. However,
surgical removal of the tumor is not always a viable option for patients, as the tumor may
be located in close proximity to major arteries or neurologically sensitive areas in the
7
brain. The goal in tumor removal is to eliminate the tumor without causing severe neuro-
logical damage. Partial removal of the tumor will also help alleviate symptoms by reduc-
ing the relative size of the tumor, which will result in a decrease the intracranial pressure,
thereby relieving the symptoms associated with this disease. Traditional radiation utilizes
either X-rays or gamma rays aimed at the tumor to disrupt the tumor growth. Chemo-
therapy agents target and kill rapidly growing cells; they can be used before or after sur-
gery and during radiation therapy.4
2.2 Blood Brain Barrier The blood-brain barrier (BBB) is present to protect brain cells from harmful, foreign
molecules. It manifests itself in the form of tight junctions in brain capillary endothelial
cells that prevent molecules from entering glial cells (brain tissue). As seen in Figure 2,
the gaps present in capillaries in the rest of the body do not occur in the capillaries in the
brain. According to Dale Purves and colleagues in the book Neuroscience, entry can be
achieved only by a molecule’s high solubility in lipids or by a transporter mechanism.5 If
a molecule is lipid insoluble and not normally transported across the blood brain barrier,
the molecule can be transported by attaching it to a vector according to Dr. WM
Pardridge from the UCLA School of Medicine. The vector can be a modified protein or
an antibody, but the vector must normally predisposed to crossing the BBB.6
8
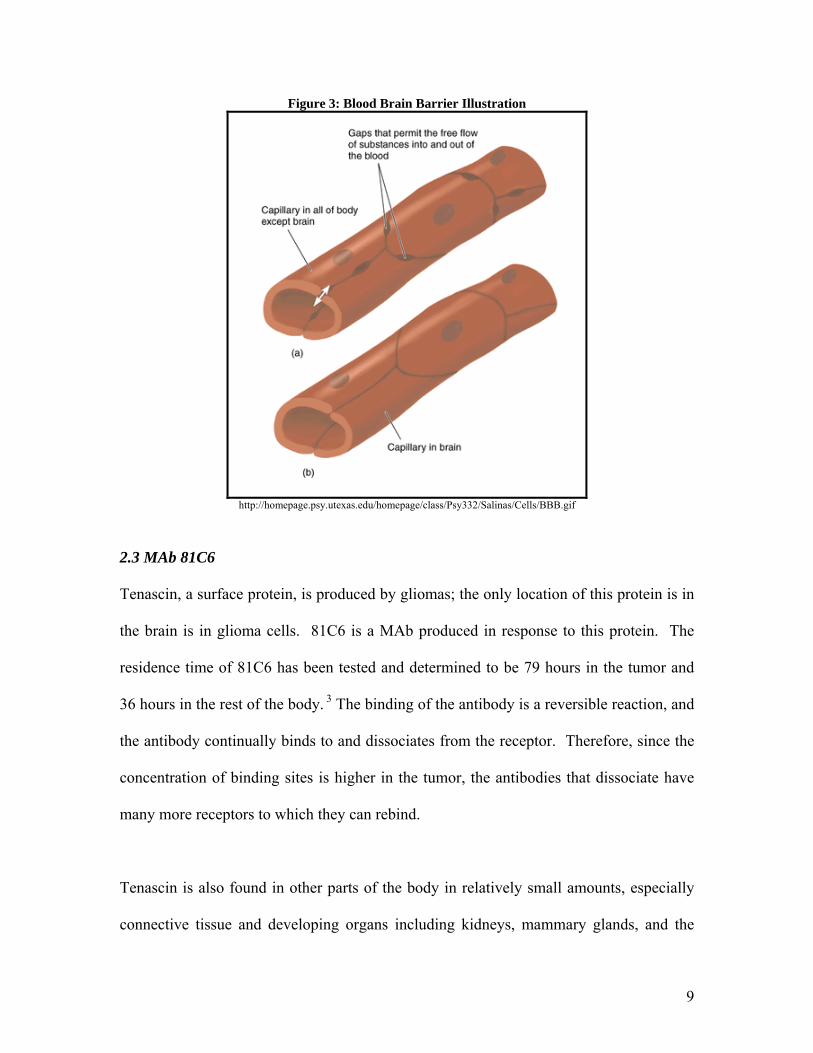
Figure 3: Blood Brain Barrier Illustration
http://homepage.psy.utexas.edu/homepage/class/Psy332/Salinas/Cells/BBB.gif
2.3 MAb 81C6
Tenascin, a surface protein, is produced by gliomas; the only location of this protein is in
the brain is in glioma cells. 81C6 is a MAb produced in response to this protein. The
residence time of 81C6 has been tested and determined to be 79 hours in the tumor and
36 hours in the rest of the body. 3 The binding of the antibody is a reversible reaction, and
the antibody continually binds to and dissociates from the receptor. Therefore, since the
concentration of binding sites is higher in the tumor, the antibodies that dissociate have
many more receptors to which they can rebind.
Tenascin is also found in other parts of the body in relatively small amounts, especially
connective tissue and developing organs including kidneys, mammary glands, and the
9
teeth. Unwanted binding of the MAb to tenascin in these locations could cause harmful
side effects. However, according to Chiquet-Ehrismann, the most abundant source of
tenascin found in the body is in glioma cells.7 Therefore, if MAb 81C6 is used to deliver
treatment, the effects on the other parts of the body containing tenascin are relatively
small compared to the tumor cells.
3. Existing Treatment Options
3.1 Antibody alone
One treatment option utilizing monoclonal antibodies (MAbs) involves using only the
antibody, which can initiate the immune response of natural killer cells (NK). The treat-
ment would include the intake of tumor-specific antibodies targeting tumor-specific anti-
gens found on the tumor cell surface followed by a natural immune response. There are
currently treatments for breast cancer and non-Hodgkin’s B-cell lymphoma utilizing this
technology that are already FDA approved. These treatments are done in conjunction
with chemotherapy surgery, and/or radiation. The humanized form of MAb used to treat
breast cancer is known as Herceptin, which targets a growth hormone that is over-
expressed in approximately ¼ of breast cancer patients.
One problem with this MAb treatment in cancer is the genetic instability of some cancer
cells; the phenotypes of the cancer cells are constantly changing, and thus it is difficult to
maintain a treatment regime based on cell specificity. The first successful treatment us-
ing MAb without a ligand was in B-cell lymphomas. After treatment the tumor usually
10
went into remission, but later reappeared. When the tumor manifested a second time and
was re-treated, the MAb was no longer able to bind to the tumor cell surface. Also, inef-
ficient killing of the tumor cells by the immune system presents another problem with the
use of MAb treatment without the use of a ligand; if the tumor is not entirely killed, re-
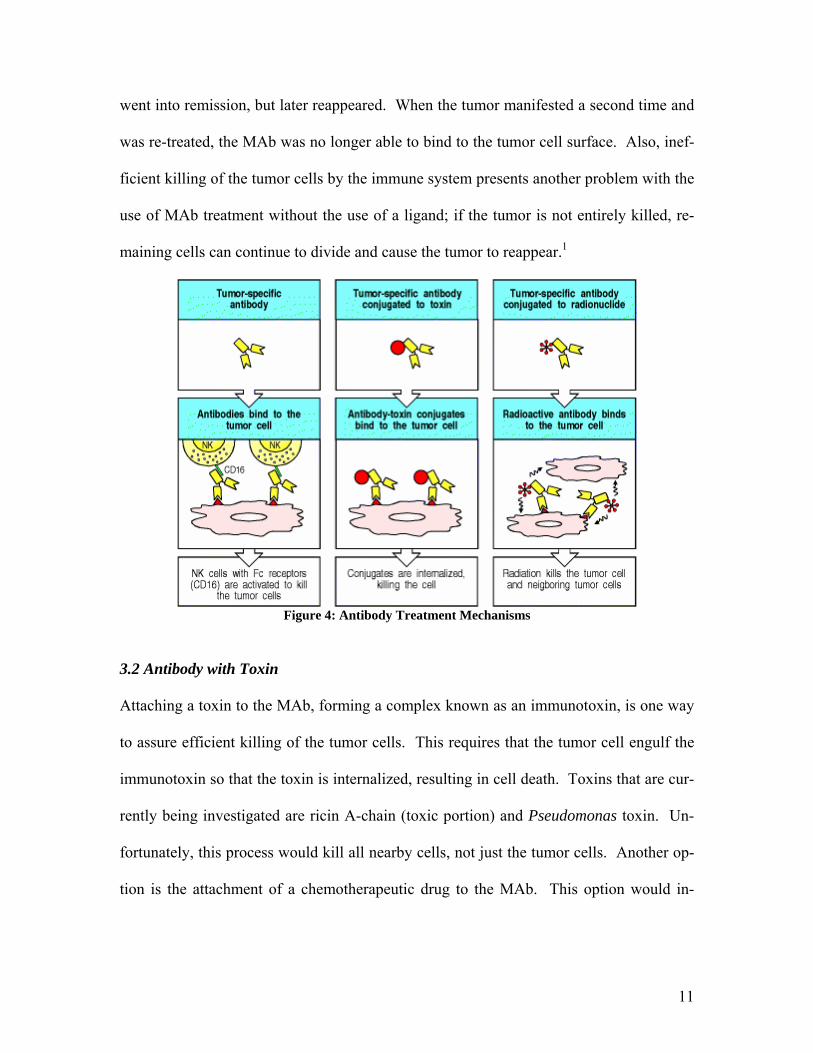
maining cells can continue to divide and cause the tumor to reappear.1
Figure 4: Antibody Treatment Mechanisms
3.2 Antibody with Toxin
Attaching a toxin to the MAb, forming a complex known as an immunotoxin, is one way
to assure efficient killing of the tumor cells. This requires that the tumor cell engulf the
immunotoxin so that the toxin is internalized, resulting in cell death. Toxins that are cur-
rently being investigated are ricin A-chain (toxic portion) and Pseudomonas toxin. Un-
fortunately, this process would kill all nearby cells, not just the tumor cells. Another op-
tion is the attachment of a chemotherapeutic drug to the MAb. This option would in-
11
crease the concentration of the drug at the tumor, making it a more effective method of
chemotherapy drug delivery.1 (See Figure 3)
3.3 MAb conjugated to radionuclide
Monoclonal antibodies can also be attached to radioactive molecules/elements to deliver
radiation treatment to tumor cells. The high dosage of radioactivity increases the likeli-
hood that all of the cancer cells would be destroyed, but will kill the surrounding cells
along with the tumor cells. 81C6 has previously been bound to Iodine-131, which has a
half life of 8 hours. This treatment was delivered by Cokgor, et al. by directly inserting it
into the tumor cavity following surgical removal of the tumor.3 This treatment limits the
patients that could possibly be treated because a number of patients are not candidates for
tumor removal, which makes them ineligible for this treatment. Because the residence
time of 81C6 in the non-cancerous areas of the body is 36 hours, if it were administered
to all patients via injection, the patient runs the risk of having other tissues destroyed by
radioactivity. Also, with the radioactive iodine treatment, the patient must be quarantined
during treatment because of the radioactivity of the iodine. This makes the treatment un-
attractive to terminally ill patients who want to spend their remaining time with family
and friends.
12
4. Proposed Alternative Treatment Methods 4.1 Immunomicelles
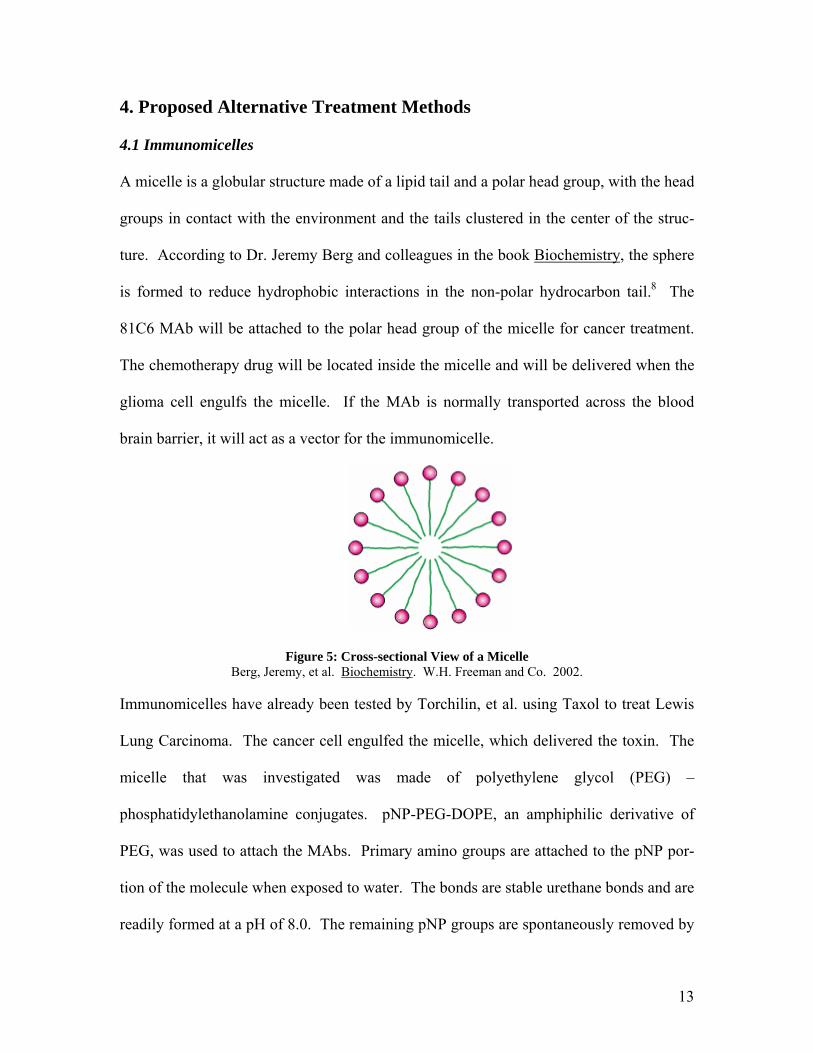
A micelle is a globular structure made of a lipid tail and a polar head group, with the head
groups in contact with the environment and the tails clustered in the center of the struc-
ture. According to Dr. Jeremy Berg and colleagues in the book Biochemistry, the sphere
is formed to reduce hydrophobic interactions in the non-polar hydrocarbon tail.8 The
81C6 MAb will be attached to the polar head group of the micelle for cancer treatment.
The chemotherapy drug will be located inside the micelle and will be delivered when the
glioma cell engulfs the micelle. If the MAb is normally transported across the blood
brain barrier, it will act as a vector for the immunomicelle.
Figure 5: Cross-sectional View of a Micelle Berg, Jeremy, et al. Biochemistry. W.H. Freeman and Co. 2002.
Immunomicelles have already been tested by Torchilin, et al. using Taxol to treat Lewis
Lung Carcinoma. The cancer cell engulfed the micelle, which delivered the toxin. The
micelle that was investigated was made of polyethylene glycol (PEG) –
phosphatidylethanolamine conjugates. pNP-PEG-DOPE, an amphiphilic derivative of
PEG, was used to attach the MAbs. Primary amino groups are attached to the pNP por-
tion of the molecule when exposed to water. The bonds are stable urethane bonds and are
readily formed at a pH of 8.0. The remaining pNP groups are spontaneously removed by
13
hydrolysis. The PEG derivative readily incorporates into the micelle because of the hy-
drophobic PEG tail. This method also allows for several MAbs to be attached to the mi-
celle.9
4.2 Vector Mediated Transcytosis
The major concern with the immunomicelle treatment for gliomas is that it is not known
if the 81C6 immunomicelle will cross the blood brain barrier. As previously stated, a
vector is a protein or antibody that has a normal predisposition to cross the BBB. OX26
is a MAb that has already been shown by Dr. U. Bickel and colleagues at UCLA to be an
effective vector in aiding transport molecules across the blood brain barrier. Vectors aid
in transportation across the blood brain barrier by transcytosis, which is the process of
transportation across an endothelium cell by uptake and release of the cell by coated vesi-
cles (Figure 6). OX26 undergoes receptor-mediated transcytosis by targeting transferrin.
The transferrin receptor is highly expressed on brain capillary endothelial cells.29 If 81C6
alone proves to not cross the blood brain barrier, a vector will then be added and tested
during pre-FDA testing. The vector will be added using the same method used to attach
the 81C6 MAb to the micelle.
14
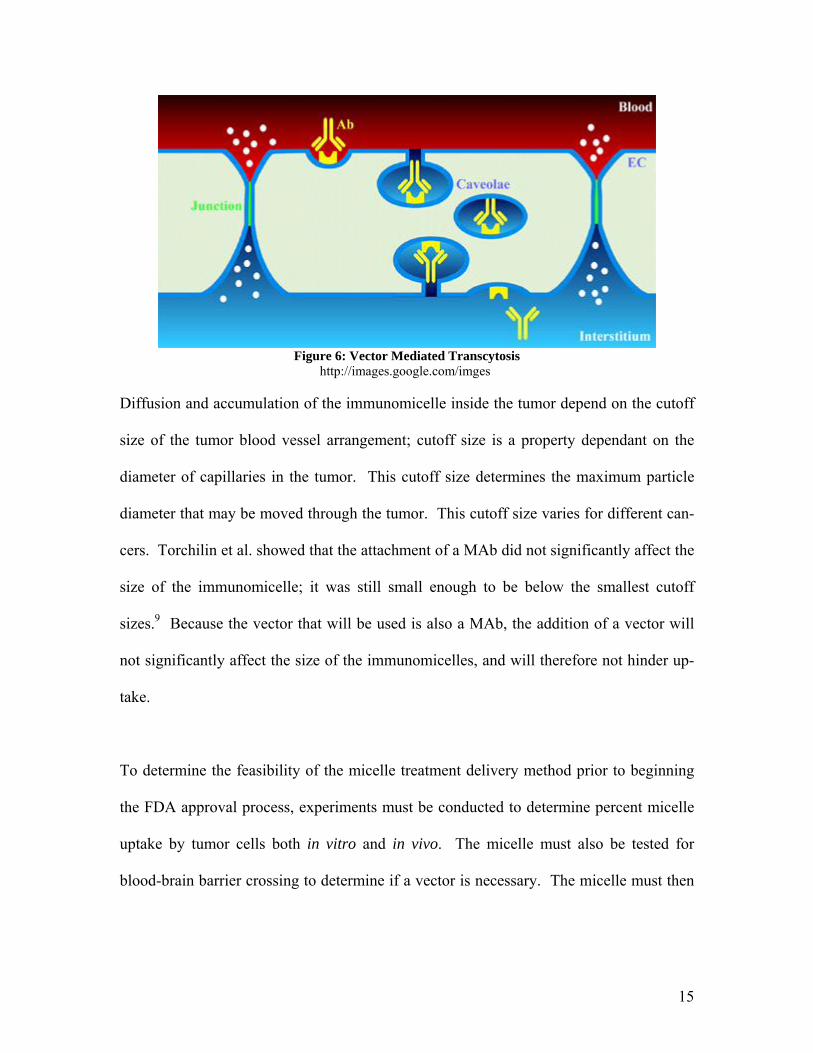
Figure 6: Vector Mediated Transcytosis
http://images.google.com/imges
Diffusion and accumulation of the immunomicelle inside the tumor depend on the cutoff
size of the tumor blood vessel arrangement; cutoff size is a property dependant on the
diameter of capillaries in the tumor. This cutoff size determines the maximum particle
diameter that may be moved through the tumor. This cutoff size varies for different can-
cers. Torchilin et al. showed that the attachment of a MAb did not significantly affect the
size of the immunomicelle; it was still small enough to be below the smallest cutoff
sizes.9 Because the vector that will be used is also a MAb, the addition of a vector will
not significantly affect the size of the immunomicelles, and will therefore not hinder up-
take.
To determine the feasibility of the micelle treatment delivery method prior to beginning
the FDA approval process, experiments must be conducted to determine percent micelle
uptake by tumor cells both in vitro and in vivo. The micelle must also be tested for
blood-brain barrier crossing to determine if a vector is necessary. The micelle must then
15
be tested in animals to evaluate potential side effects on the rest of body and effective
tumor reduction.
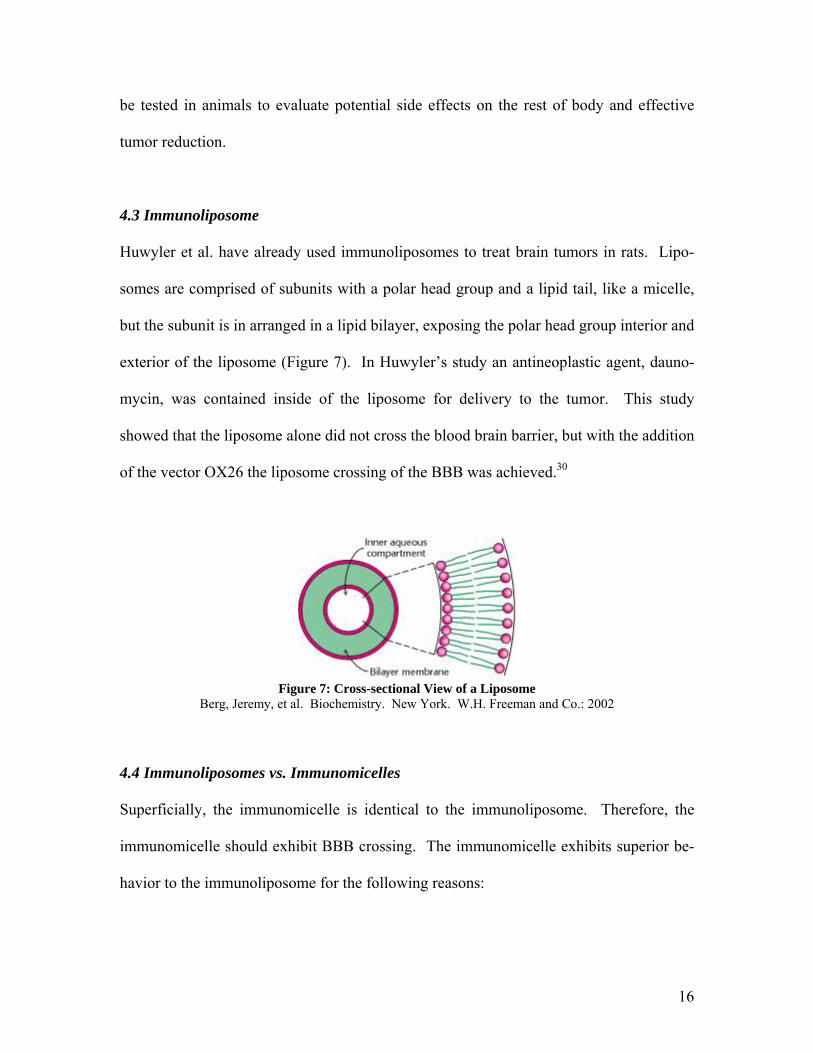
4.3 Immunoliposome
Huwyler et al. have already used immunoliposomes to treat brain tumors in rats. Lipo-
somes are comprised of subunits with a polar head group and a lipid tail, like a micelle,
but the subunit is in arranged in a lipid bilayer, exposing the polar head group interior and
exterior of the liposome (Figure 7). In Huwyler’s study an antineoplastic agent, dauno-
mycin, was contained inside of the liposome for delivery to the tumor. This study
showed that the liposome alone did not cross the blood brain barrier, but with the addition
of the vector OX26 the liposome crossing of the BBB was achieved.30
Figure 7: Cross-sectional View of a Liposome
Berg, Jeremy, et al. Biochemistry. New York. W.H. Freeman and Co.: 2002
4.4 Immunoliposomes vs. Immunomicelles
Superficially, the immunomicelle is identical to the immunoliposome. Therefore, the
immunomicelle should exhibit BBB crossing. The immunomicelle exhibits superior be-
havior to the immunoliposome for the following reasons:
16
• Immunomicelles can contain more toxin than an immunoliposome of the same di-
ameter because the immunoliposome has a thicker outer wall. This may be an
advantage if the volume of the drug delivered to the patient needs to be minimized
so that the treatment can be delivered via single injection instead of an I.V.
• A particle with a smaller diameter will cross the BBB more easily because less
energy is required to encapsulate the particle during transcytosis.
• A very large particle may block or occupy multiple transferrin binding sites. This
stearic interaction may result in fewer particles to crossing the BBB.
4.5 Nanoparticles
A nanoparticle is a synthetic microscopic particle with a diameter that is measured in na-
nometers. Nanoparticles are used for numerous applications, including counteracting the
toxicity of chemical and biological weapons, water filtration, and air purification.11 How-
ever, one of the most promising applications involves a novel system of drug delivery.
Laboratory investigations in vivo in mice by R. Reszka et. al. have shown that nanoparti-
cles can effectively deliver cancer treatment toxins to various areas of the body, including
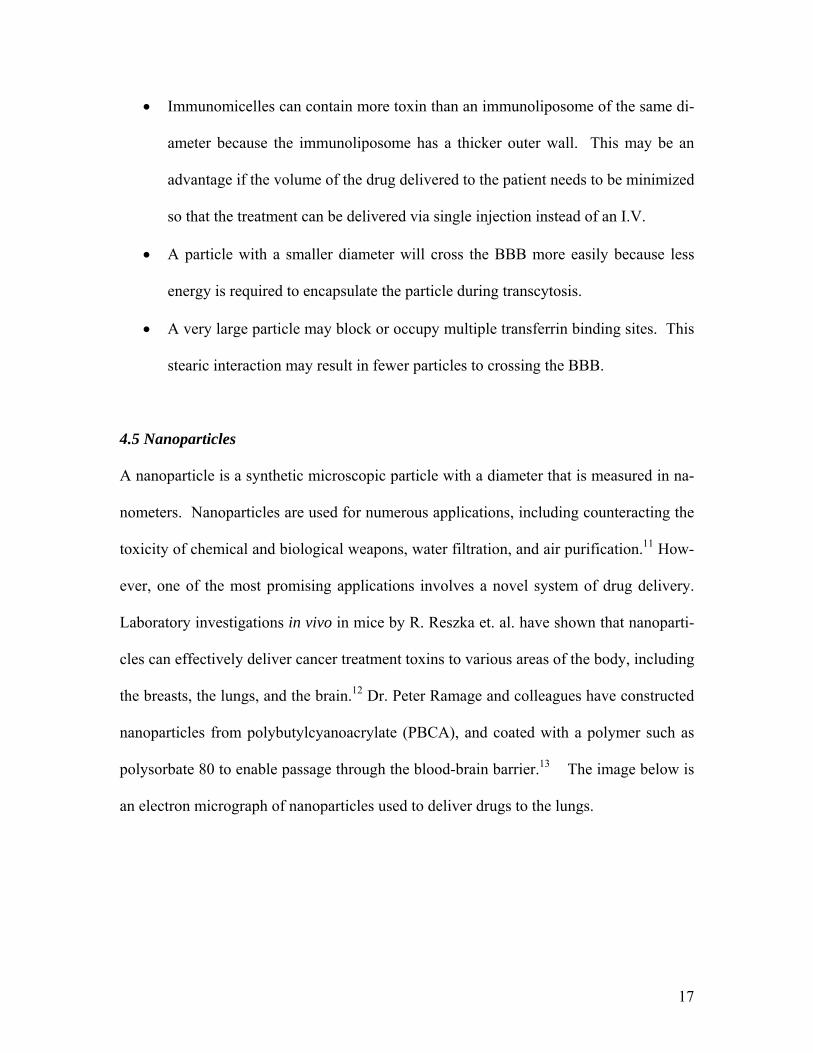
the breasts, the lungs, and the brain.12 Dr. Peter Ramage and colleagues have constructed
nanoparticles from polybutylcyanoacrylate (PBCA), and coated with a polymer such as
polysorbate 80 to enable passage through the blood-brain barrier.13 The image below is
an electron micrograph of nanoparticles used to deliver drugs to the lungs.
17
Figure 8: Electron Micrograph of Nanoparticles
Image courtesy of http://www.betterhumans.com/News/news.aspx?articleID=2003-09-30-5 There have been limited studies by Dr. ZR Zhang and colleagues of the use of nanoparti-
cle-antibody conjugate systems to ensure more selective toxin delivery to breast cancer
cells with fairly promising results.14 This project investigated the possibility of a nanopar-
ticle-81C6 antibody conjugate system to selectively deliver gliomas chemotherapy drugs
to gliomas brain tumor cells. Investigations revealed that this could be an effective
treatment. However, there are a number of problems that must be addressed during drug
delivery research which could make this option infeasible to develop at a reasonable cost.
Among these problems are determining the amount of time required to release the toxin
from the nanoparticle and attaching the antibody to the nanoparticle. Due to these con-
traints, the micelle was selected over the nanoparticle as the superior treatment delivery
option. Details of the nanoparticle treatment option analysis and problems with this op-
tion are discussed in Appendix 1.
4.6 Chemotherapy Toxin Choices
Taxol®, Temodar®, Cisplatin, and Lomustine are a few chemotherapy agents that are cur-
rently being used to treat malignant gliomas.15 Temodar® was the toxin of choice for en-
capsulation in the immunomicelle based on its relative size. It is the smallest chemother-
apy agent in terms of molecular diameter; therefore, more could be encapsulated in the
18
immunomicelle. Therefore fewer immunomicelles will be needed and the total volume
of the treatment will be lower. This will decrease the dosage volume required, thereby
reducing the likelihood that an IV will be needed in order to administer treatment. The
mechanisms of the drugs are different, but they all kill rapidly dividing cells, so the side
effects are similar. The dosage limiting factor for all of the drugs researched is the ef-
fects on the bone marrow and blood. Therefore, side effects are not considered in the se-
lection of a chemotherapy toxin because each of the drugs exhibited the similar side ef-
fects.
4.7 Temodar Product Information Dosage of Temodar® is determined based on the patient’s body surface area (BSA) and is
done in 28 day cycles. The patient receives Temodar® for the first 5 days then receives
no drugs for 23 days. A complete blood count is done on day 22 and day 29 (day 1 of the
next cycle) to determine if/when the chemotherapy should be continued. The first cycle
is done at 150 mg/m2 and the following cycles are done at 200 mg/m2. If the absolute
neutrophil count (ANC) is below 1000/µL or the platelet count is below 50,000/µL any-
time during the treatment cycle then the next cycle should be reduced by 50 mg/m2. The
optimum duration of treatment time for Temodar® is not known, but the maximum treat-
ment time during clinical trial was 2 years; this is mostly due to the truncated life span of
the patient with gliomas. The short life span also results in an inability to monitor long
term side effects of the drug. Temodar® can be continued throughout the disease pro-
gression. Dosage and treatment limiting factors were hematologic, meaning depending
19
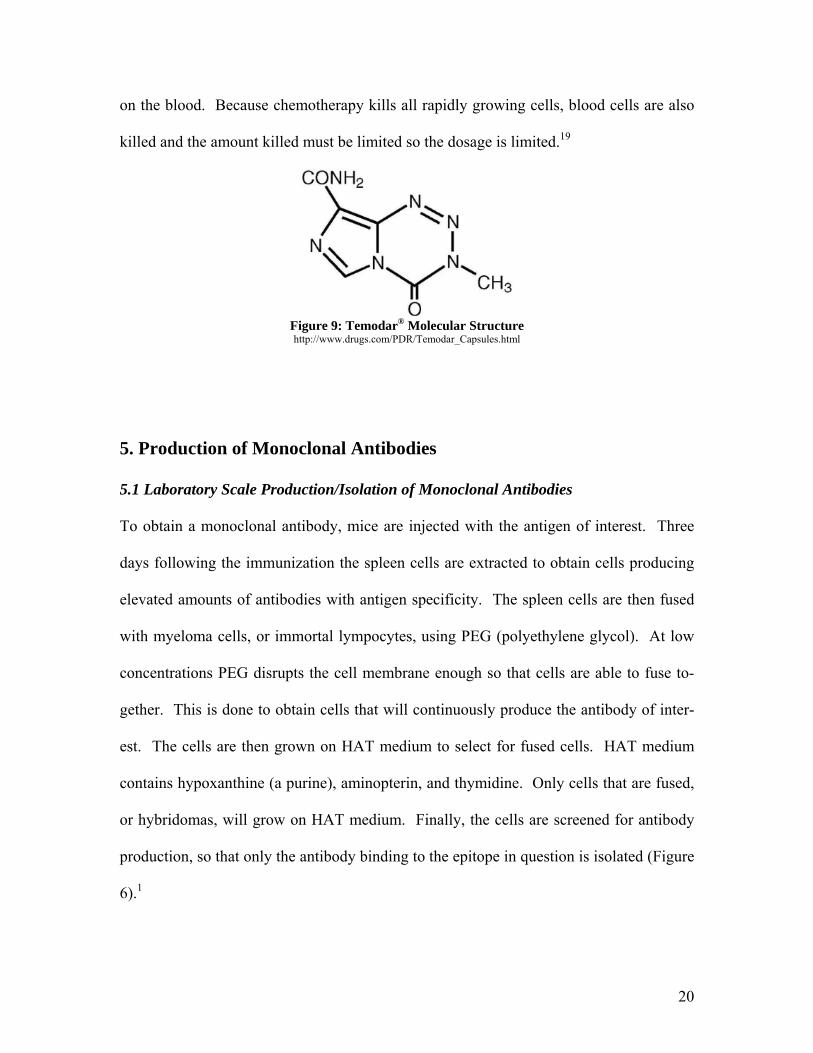
on the blood. Because chemotherapy kills all rapidly growing cells, blood cells are also
killed and the amount killed must be limited so the dosage is limited.19
Figure 9: Temodar® Molecular Structure http://www.drugs.com/PDR/Temodar_Capsules.html
5. Production of Monoclonal Antibodies
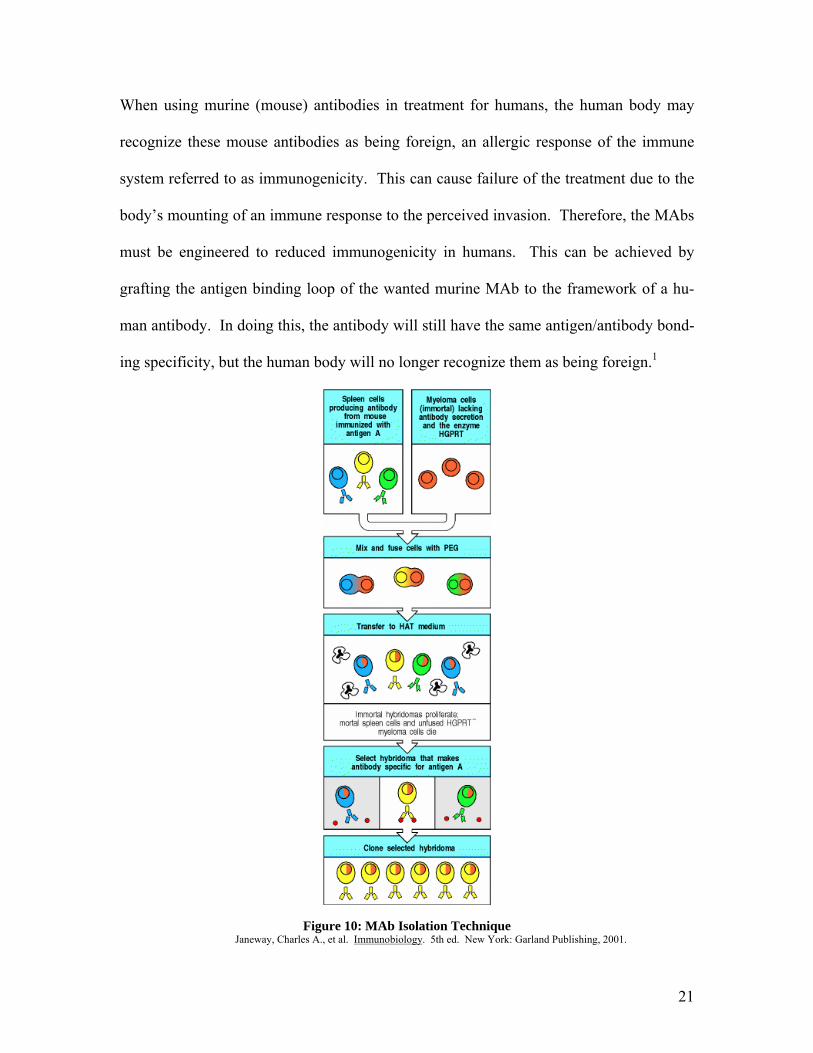
5.1 Laboratory Scale Production/Isolation of Monoclonal Antibodies
To obtain a monoclonal antibody, mice are injected with the antigen of interest. Three
days following the immunization the spleen cells are extracted to obtain cells producing
elevated amounts of antibodies with antigen specificity. The spleen cells are then fused
with myeloma cells, or immortal lympocytes, using PEG (polyethylene glycol). At low
concentrations PEG disrupts the cell membrane enough so that cells are able to fuse to-
gether. This is done to obtain cells that will continuously produce the antibody of inter-
est. The cells are then grown on HAT medium to select for fused cells. HAT medium
contains hypoxanthine (a purine), aminopterin, and thymidine. Only cells that are fused,
or hybridomas, will grow on HAT medium. Finally, the cells are screened for antibody
production, so that only the antibody binding to the epitope in question is isolated (Figure
6).1
20
When using murine (mouse) antibodies in treatment for humans, the human body may
recognize these mouse antibodies as being foreign, an allergic response of the immune
system referred to as immunogenicity. This can cause failure of the treatment due to the
body’s mounting of an immune response to the perceived invasion. Therefore, the MAbs
must be engineered to reduced immunogenicity in humans. This can be achieved by
grafting the antigen binding loop of the wanted murine MAb to the framework of a hu-
man antibody. In doing this, the antibody will still have the same antigen/antibody bond-
ing specificity, but the human body will no longer recognize them as being foreign.1
Figure 10: MAb Isolation Technique Janeway, Charles A., et al. Immunobiology. 5th ed. New York: Garland Publishing, 2001.
21
5.2 Large Scale Production of MAbs
There are currently several approved monoclonal antibody therapeutics on the market.
According to Dr. Roger G. Harrison et. al., the production of these antibodies involves
three distinct production phases: a bioreaction section, a recovery section, and a purifica-
tion section. The bioreaction section involves dissolving the serum-free, low protein con-
tent media powder in a water-for-injection (WFI) stainless steel tank. This involves the
use of very pure water as a solvent to ensure that the media is not contaminated before
exposure to the antibody. The solution is then sterilized using a dead-end polishing filter.
This purified media is then transferred to a stirred tank bioreactor to grow the cells ex-
pressing the 81C6 antibody. The cells are grown in the reactor for around one week. The
cells are then moved to the recovery section of the process, which involves the use of
column chromatography to isolate the antibody. A membrane diafilter is first used to re-
move generated biomass and other suspended compounds in the mixture, and then a mo-
lecular weight cutoff ultrafilter is used to increase the solution concentration.16
Next, three types of column chromatography are used to further purify the protein solu-
tion. First, affinity chromatography is used to remove contaminant proteins. This type of
chromatography involves the use of an affinity ligand that is specific to the antibody
binding site. This ligand is attached to an inert chromatography matrix. This matrix will
then bind to molecules according to their specificity to the binding site, while other com-
ponents of the antibody mixture will pass through the medium unabsorbed. During the
chromatography process the column is first equilibrated by passing a binding buffer
through the column. The antibody mixture is then passed through the column and the
22
antibody binds to the ligand, while the rest of the mixture passes through the column. An
elution buffer with a different pH or salt concentration is then passed through the column
to disrupt antibody-ligand interactions and remove the antibody from the column in a
separate fraction from contaminants. This process will take around one day and have a
95% recovery.16
The elution buffer is then exchanged with a salt buffer using a diafilter. This antibody
solution is then further purified by the use of ion exchange chromatography. This in-
volves the separation of molecules according to their charge. It increases the concentra-
tion of the antibody solution and removes charged contaminants. The column is packed
with a charged particulate media called a resin and equilibrated with a salt buffer of op-
posite charge. This neutralizes the resin prior to loading the antibody solution on to the
column. The antibody, which has a net charge opposite to the of the column resin, will
then displace the charged salt ions and bind to the resin while the components with a
lesser charge will elute through the column immediately. A salt buffer is then added to
the column to displace the antibody and cause the antibody to come out of the column.
This process will take around one day and have a 90% recovery.16
The antibody solution is then transferred to a stirred storage tank and ammonium sulfate
is added to increase the ionic strength of the solution and prepare it for the final step in
the recovery purification process: hydrophobic interaction chromatography (HIC). This
is necessary to remove any final aqueous contaminants in the antibody solution. Accord-
ing to Dr. Helen Zgurskaya, the ammonium sulfate will cause the antibody to be less
23
soluble in water by neutralizing the protein surface charge and interfering with hydrogen
bonding between the protein and the aqueous solution.17 The antibody solution is then
eluted through the column and the insoluble proteins will aggregate on the resin beads.
After the antibody has bound to the column resin the salt concentration of the elutant so-
lution running down the column is reduced to remove the antibody from the column.
This process will take around one day and a 95% recovery is expected.16
The final antibody solution is then concentrated in a molecular weight cutoff ultrafilter
and the HIC buffer is exchanged with a salt buffer using diafiltration. Finally, glycerol is
added to increase the antibody solution stability for relatively long term storage and the
solution is sterilized using dead-end filtration.16
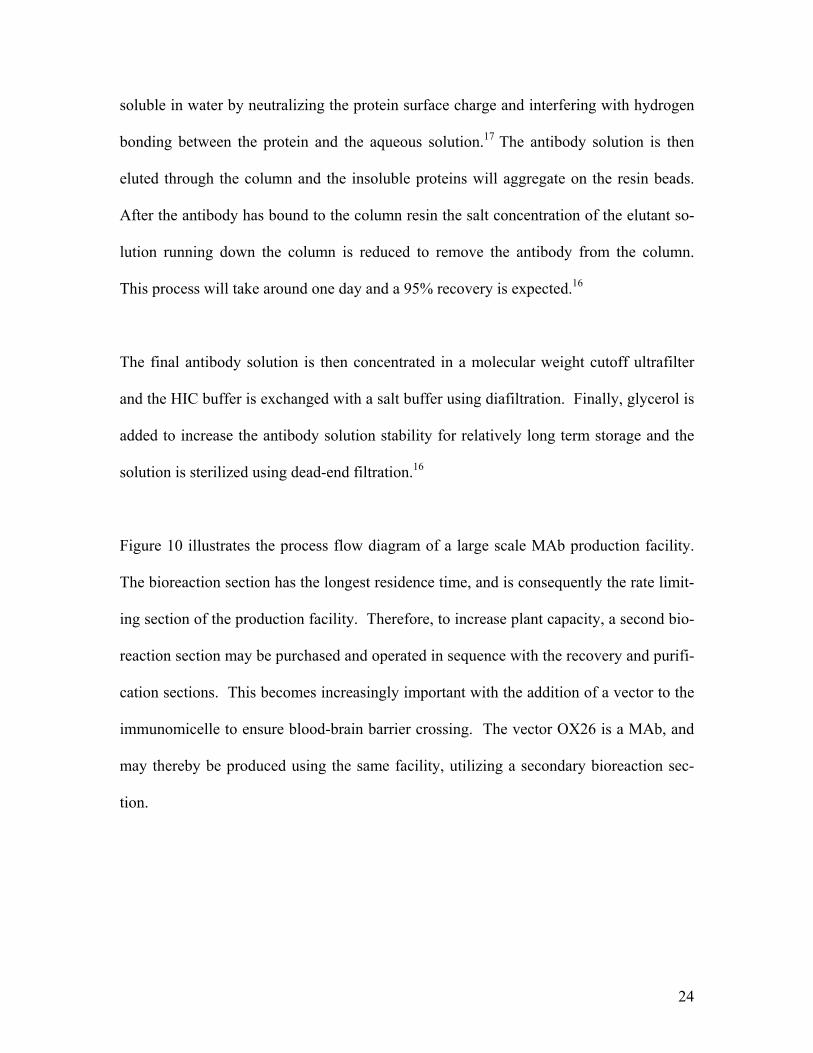
Figure 10 illustrates the process flow diagram of a large scale MAb production facility.
The bioreaction section has the longest residence time, and is consequently the rate limit-
ing section of the production facility. Therefore, to increase plant capacity, a second bio-
reaction section may be purchased and operated in sequence with the recovery and purifi-
cation sections. This becomes increasingly important with the addition of a vector to the
immunomicelle to ensure blood-brain barrier crossing. The vector OX26 is a MAb, and
may thereby be produced using the same facility, utilizing a secondary bioreaction sec-
tion.
24
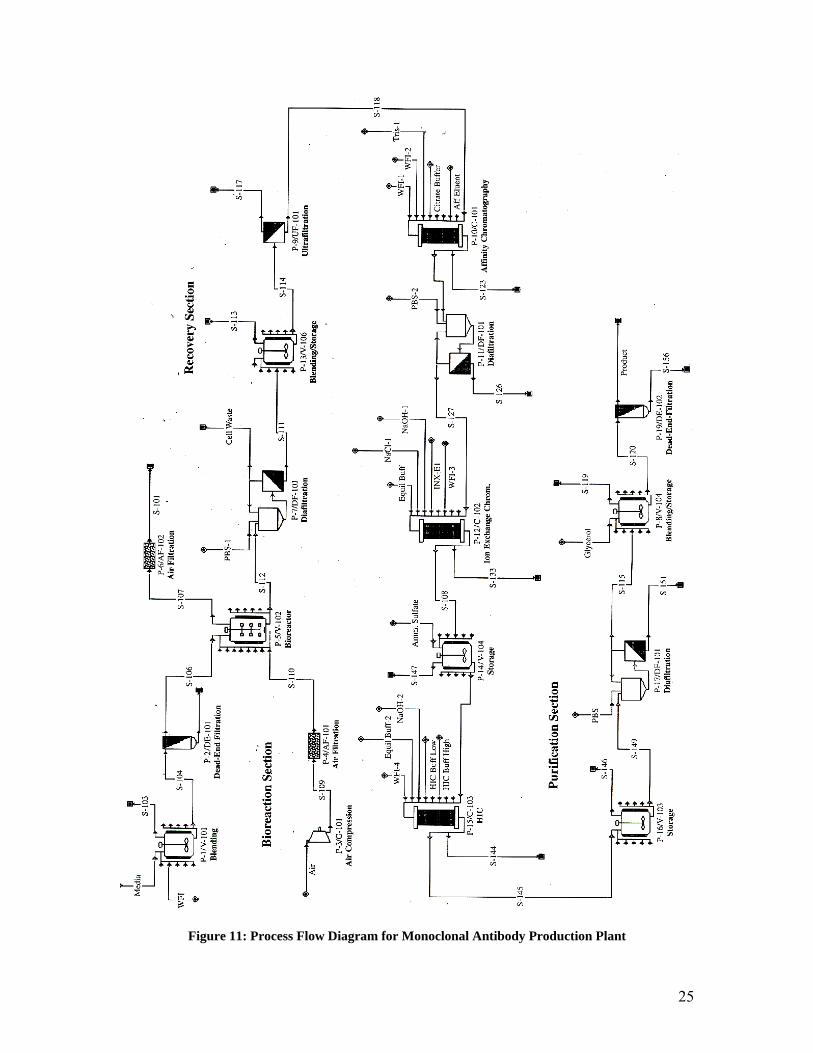
Figure 11: Process Flow Diagram for Monoclonal Antibody Production Plant
25
6. Immunomicelle Production and Drug Encapsulation 6.1 Production of Immunomicelle
There are a series of steps involved in immunomicelle production. First, pNP-PEG-PE
must be produced. This was done by Torchilin et. al. by placing polyethylene (PE) in a
10x molar excess of PEG-(pNP)2 in chloroform in the presence of triethylamine. Then
the organic solvents are removed. Micelles can then be formed in 0.01M HCl/ 0.15M
NaCl by bath sonication. PEG and pNP can be removed from the pNP-PEG-PE by
chromatography using a CL-4B column. The micelles are then freeze dried, followed by
an extraction using chloroform.18
Next, the toxin is added to the micelle. First, a lipid film is formed by putting the pNP-
PEG-PE/ PEG-PE mixture under vacuum. Then the toxin dissolved in methanol is added
to a chloroform solution of the pNP-PEG-PE/ PEG-PE. To reform the micelles, rehy-
drate the solution at 50ºC with 5mM sodium citrate saline and vortex for 5 minutes.9
In the last step, the MAb is added to the micelle (for reaction information see Figure 7).
The antibody attaches to the ester group on the micelle surface because the oxygen is sta-
bilized by the benzene-NO2 and can detach from the micelle. One milligram of protein is
added for every 10mg of pNP-PEG-PE containing liposome stored in the sodium citrate
solution at pH 5.1. The pH of the solution is increased to 8.5, and then incubated for two
hours to attach the antibody (protein) and hydrolyze any remaining pNP groups. Purifi-
cation can be achieved by gel filtration chromatography. At the laboratory scale the
maximum yield obtained by Torchilin, et al, was 60%.9
26
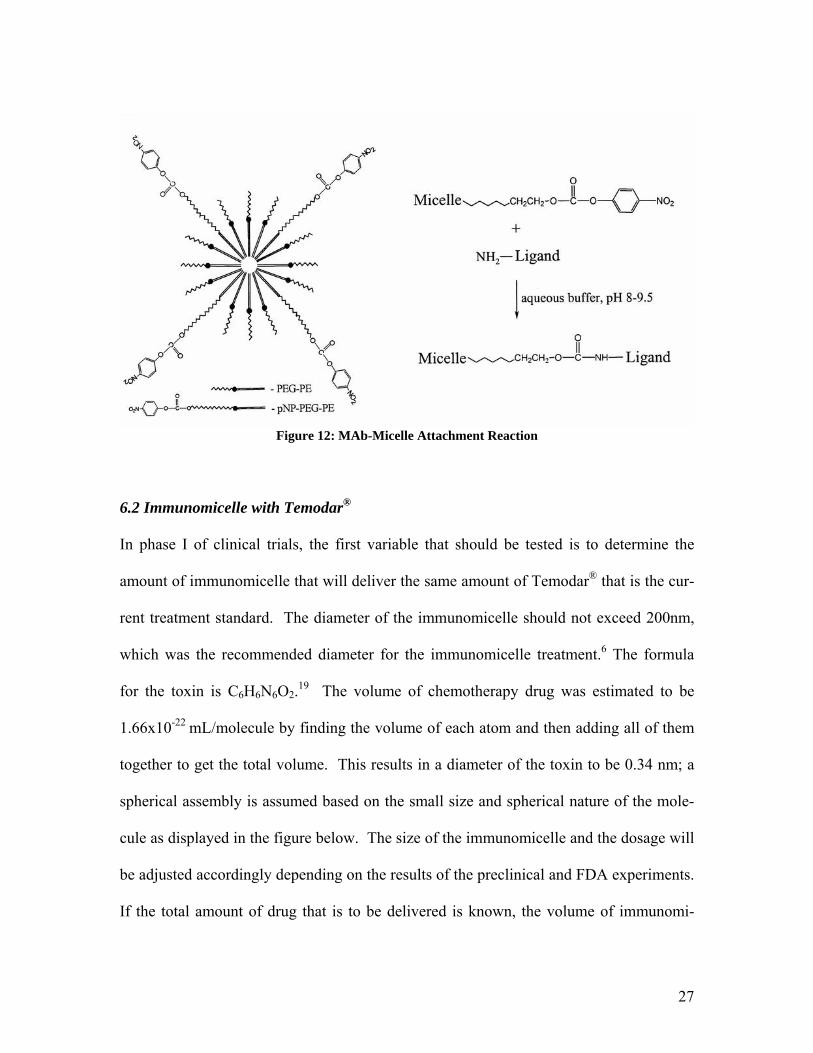
Figure 12: MAb-Micelle Attachment Reaction
6.2 Immunomicelle with Temodar®
In phase I of clinical trials, the first variable that should be tested is to determine the
amount of immunomicelle that will deliver the same amount of Temodar® that is the cur-
rent treatment standard. The diameter of the immunomicelle should not exceed 200nm,
which was the recommended diameter for the immunomicelle treatment.6 The formula
for the toxin is C6H6N6O2.19 The volume of chemotherapy drug was estimated to be
1.66x10⁻²² mL/molecule by finding the volume of each atom and then adding all of them
together to get the total volume. This results in a diameter of the toxin to be 0.34 nm; a
spherical assembly is assumed based on the small size and spherical nature of the mole-
cule as displayed in the figure below. The size of the immunomicelle and the dosage will
be adjusted accordingly depending on the results of the preclinical and FDA experiments.
If the total amount of drug that is to be delivered is known, the volume of immunomi-
27
celles to be delivered can be calculated. If the volume of immunomicelles to be delivered
is large then the treatment may have to be delivered by IV instead of a single injection.
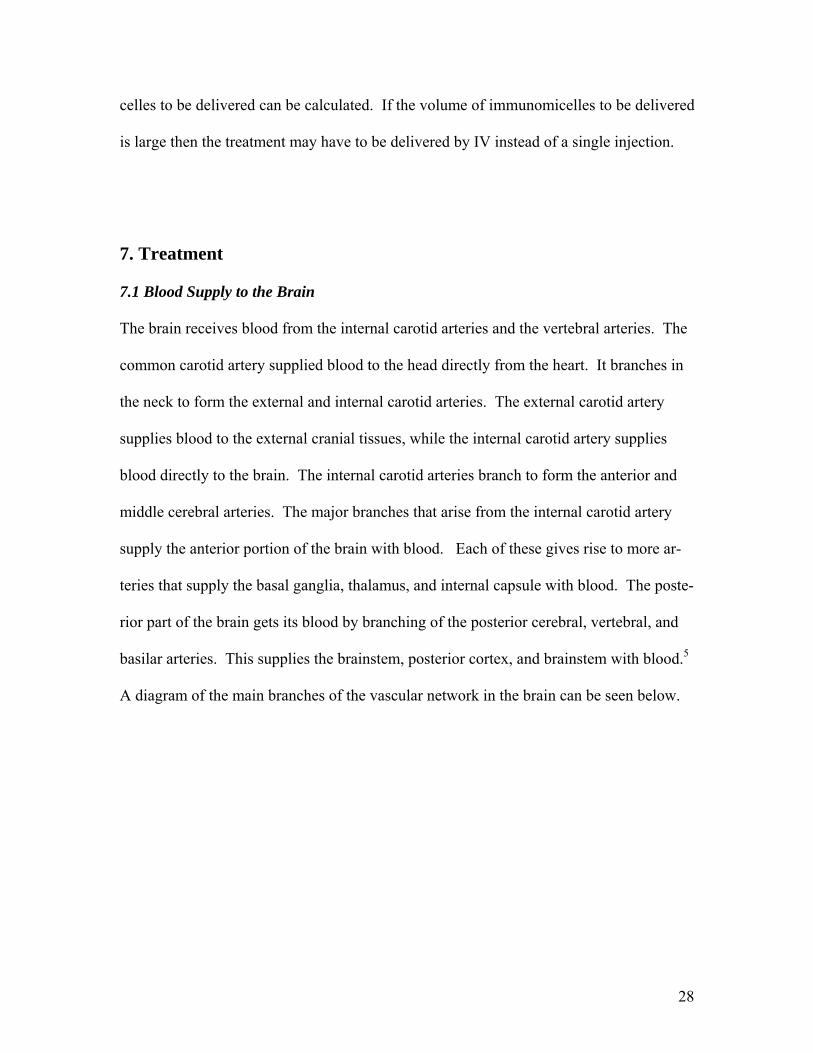
7. Treatment 7.1 Blood Supply to the Brain
The brain receives blood from the internal carotid arteries and the vertebral arteries. The
common carotid artery supplied blood to the head directly from the heart. It branches in
the neck to form the external and internal carotid arteries. The external carotid artery
supplies blood to the external cranial tissues, while the internal carotid artery supplies
blood directly to the brain. The internal carotid arteries branch to form the anterior and
middle cerebral arteries. The major branches that arise from the internal carotid artery
supply the anterior portion of the brain with blood. Each of these gives rise to more ar-
teries that supply the basal ganglia, thalamus, and internal capsule with blood. The poste-
rior part of the brain gets its blood by branching of the posterior cerebral, vertebral, and
basilar arteries. This supplies the brainstem, posterior cortex, and brainstem with blood.5
A diagram of the main branches of the vascular network in the brain can be seen below.
28
Figure 13: Vascular Network of the Brain
http://www.ncbi.nlm.nih.gov
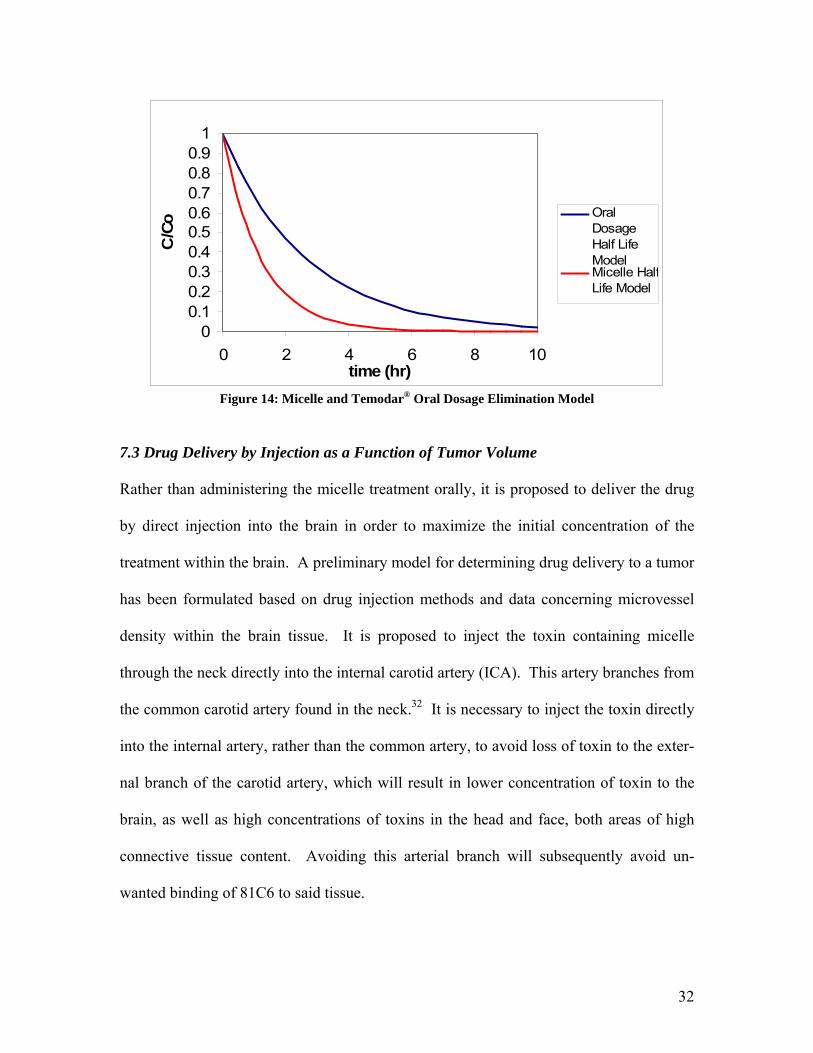
7.2 Blood Temodar® Concentration Model
The concentration of Temodar® or micelles in the blood can be modeled as a function of
time after treatment administration as a half-life decay process. The half life of Temo-
dar® is likely greater than the half life of the micelle in the body due to Temodar® inter-
29
acting with plasma proteins in the blood. Therefore, this model will allow for compari-
son between the amount of time that an oral dosage of Temodar® remains in the body and
the amount of time a micelle-contained dosage of Temodar® will remain in the body.
The half life decay process is modeled by the differential equation
bloodblood kC
dtdC
−=
Separating variables and integrating with the limits Cblood = C0 at t = 0 gives:
ktC
Cblood −=)ln(0
where Cblood is the concentration of Temodar® in the blood at time t, C0 is the original
blood concentration, and k is the half life proportionality constant. According to the Te-
modar® product information sheet, the half life of Temodar® in the human body is 1.8
hours; the k value can be calculated from this as 0.38 hr-1 using the half life decay equa-
tion.31 Substituting this value for k in the half life decay equation and rearranging yields:
tblood eC
C 38.0
0
−=
This equation models the amount of Temodar® in the body as a function of time with the
current oral dosage treatment.
The application of this model to find the concentration of micelles in the blood as
a function of time is more involved, since the half life of the micelle in the body is not
known. Therefore, it must be derived by determining the rate at which micelles are re-
moved from the body by the renal system. The typical human has around 5 liters of
blood in his or her body, and the blood is pumped at 5 liters/min by the heart. Therefore,
the blood is circulated through the body by the heart approximately every minute. The
30
kidneys receive 20-25% of the cardiac output, which is around 1 liter/min. However,
they are only able to process about 13% of the blood they receive, or 120-140 mL/min.
The percent of blood they would process is found as the product of the percent of cardiac
output delivered to the kidneys and the percent of blood in the kidneys that is processed
per minute as follows:
25/1%4%10013.0225.0%%% ≈=××=×= processedreceivedcleaned
It is assumed that around half of the micelles in the blood cleaned are removed each time
a volume of blood is processed by the kidneys. Therefore, the net percent of total blood
volume for which the micelles are removed is around 2% or 1/50. Therefore, in 50 min-
utes the concentration of micelles in the blood is halved. From this half life a k value of
0.83hr-1 is calculated, which can be substituted into the half life function to create the fol-
lowing equation
tblood eC
C 83.0
0
−=
The elimination of drug from the body for an oral dosage of Temodar® and the elimina-
tion of drug for a micelle dosage of Temodar® are compared by graphing the half life
function for each treatment option. The plot with these functions is displayed in Figure
12.
As clearly shown in this figure, the micelle is eliminated from the body much more rap-
idly than Temodar® alone. This phenomenon should result in a significant reduction in
associated toxin side effects.
31
00.10.20.30.40.50.60.70.80.9
1
0 2 4 6 8 10time (hr)
C/C
o OralDosageHalf LifeModelMicelle HalfLife Model
Figure 14: Micelle and Temodar® Oral Dosage Elimination Model
7.3 Drug Delivery by Injection as a Function of Tumor Volume
Rather than administering the micelle treatment orally, it is proposed to deliver the drug
by direct injection into the brain in order to maximize the initial concentration of the
treatment within the brain. A preliminary model for determining drug delivery to a tumor
has been formulated based on drug injection methods and data concerning microvessel
density within the brain tissue. It is proposed to inject the toxin containing micelle
through the neck directly into the internal carotid artery (ICA). This artery branches from
the common carotid artery found in the neck.32 It is necessary to inject the toxin directly
into the internal artery, rather than the common artery, to avoid loss of toxin to the exter-
nal branch of the carotid artery, which will result in lower concentration of toxin to the
brain, as well as high concentrations of toxins in the head and face, both areas of high
connective tissue content. Avoiding this arterial branch will subsequently avoid un-
wanted binding of 81C6 to said tissue.
32
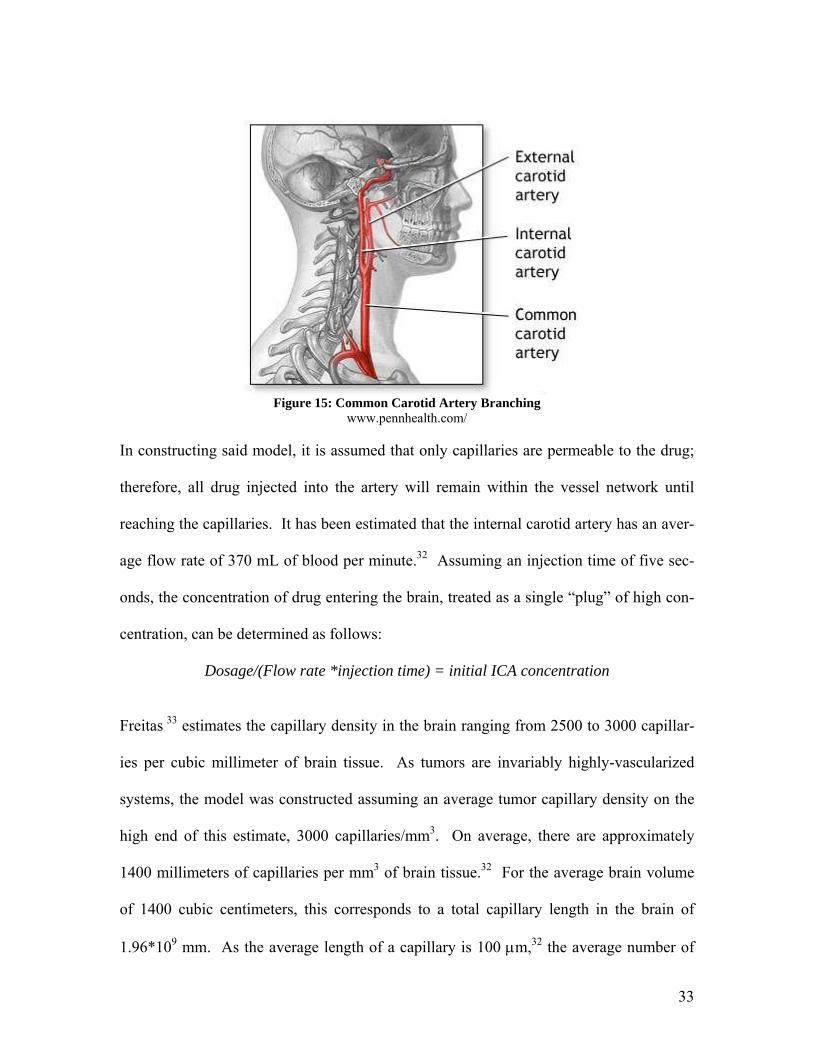
Figure 15: Common Carotid Artery Branching
www.pennhealth.com/
In constructing said model, it is assumed that only capillaries are permeable to the drug;
therefore, all drug injected into the artery will remain within the vessel network until
reaching the capillaries. It has been estimated that the internal carotid artery has an aver-
age flow rate of 370 mL of blood per minute.32 Assuming an injection time of five sec-
onds, the concentration of drug entering the brain, treated as a single “plug” of high con-
centration, can be determined as follows:
Dosage/(Flow rate *injection time) = initial ICA concentration
Freitas 33 estimates the capillary density in the brain ranging from 2500 to 3000 capillar-
ies per cubic millimeter of brain tissue. As tumors are invariably highly-vascularized
systems, the model was constructed assuming an average tumor capillary density on the
high end of this estimate, 3000 capillaries/mm3. On average, there are approximately
1400 millimeters of capillaries per mm3 of brain tissue.32 For the average brain volume
of 1400 cubic centimeters, this corresponds to a total capillary length in the brain of
1.96*109 mm. As the average length of a capillary is 100 µm,32 the average number of
33
capillaries in the brain can be estimated to be 1.96*1010 mm. Given that each half of the
brain is supplied with blood by two internal carotid arteries, for calculational purposes,
this number must be halved, to represent the number of capillaries in the half of the brain
supplied by the carotid artery of interest.
Using the above estimates of the microvessel network within the brain, one is able to de-
termine the amount of drug delivered per capillary. If the branches in the blood vessels
in the brain are treated as a series of splitters, with each branch resulting in the subse-
quent vessels containing equal drug concentration in a lower volume, one can determine
the average drug contained in each capillary in the half of the brain of interest. The vol-
ume contained in each capillary is determined as follows:
ICA plug volume/number of capillaries = capillary plug volume
The amount of drug delivered by each capillary can then be determined by the following
equation:
Capillary plug concentration*capillary plug volume = Initial ICA plug concentration*capillary plug volume = drug delivered per capillary
Now, the amount of drug delivered to a tumor as a function of tumor volume is simply
given as follows:
Drug delivered per capillary*number of capillaries per volume of tumor = drug delivered per unit tumor volume
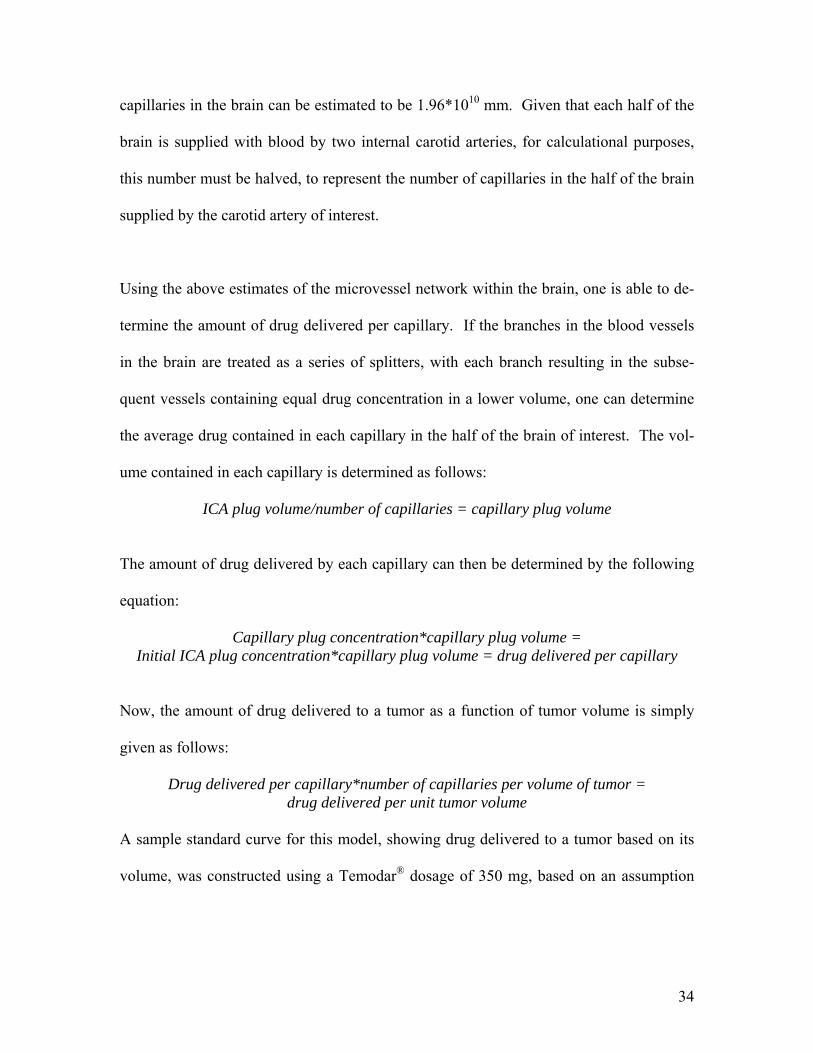
A sample standard curve for this model, showing drug delivered to a tumor based on its
volume, was constructed using a Temodar® dosage of 350 mg, based on an assumption
34
that 50% of the drug containing micelle will cross the BBB, and that 50% of the drug that
crosses will actually bind to the tumor. This standard curve can be seen in Figure 14.
Drug Delivered upon Initial Injection (350 mg dosage)
00.20.40.60.8
11.21.41.61.8
2
0 20 40 60 80
Tumor Volume (cc)
Dru
g D
eliv
ered
(mg)
Figure 16: Drug Delivery Standard Curve
This model returns a value of 0.0268 µg drug per mm3 tumor tissue. Applying this model
to the existing method of oral dosage, assuming the 350 sample dosage is diluted in the
entire 5 L of blood in the body, shows that the method of oral dosage delivers a mere
0.000107 µg/mm3 tumor, illustrating the superiority of the injection method. Injection
renders a 250 fold increase in the amount of drug delivered to the tumor for an amount
equal to the amount taken orally.
This preliminary model contains key assumptions. The arbitrary estimations that 50% of
the drug-containing-micelle crosses the BBB and that 50% of this drug bind to the tumor
have no basis in data or observation; in order to refine this model, experiments will have
to be conducted during pre-FDA testing in order to determine the amount of micelle that
35
actually crosses the BBB and the amount of micelle that actually binds to the tumor, in
order to determine the actual efficacy of the drug delivery.
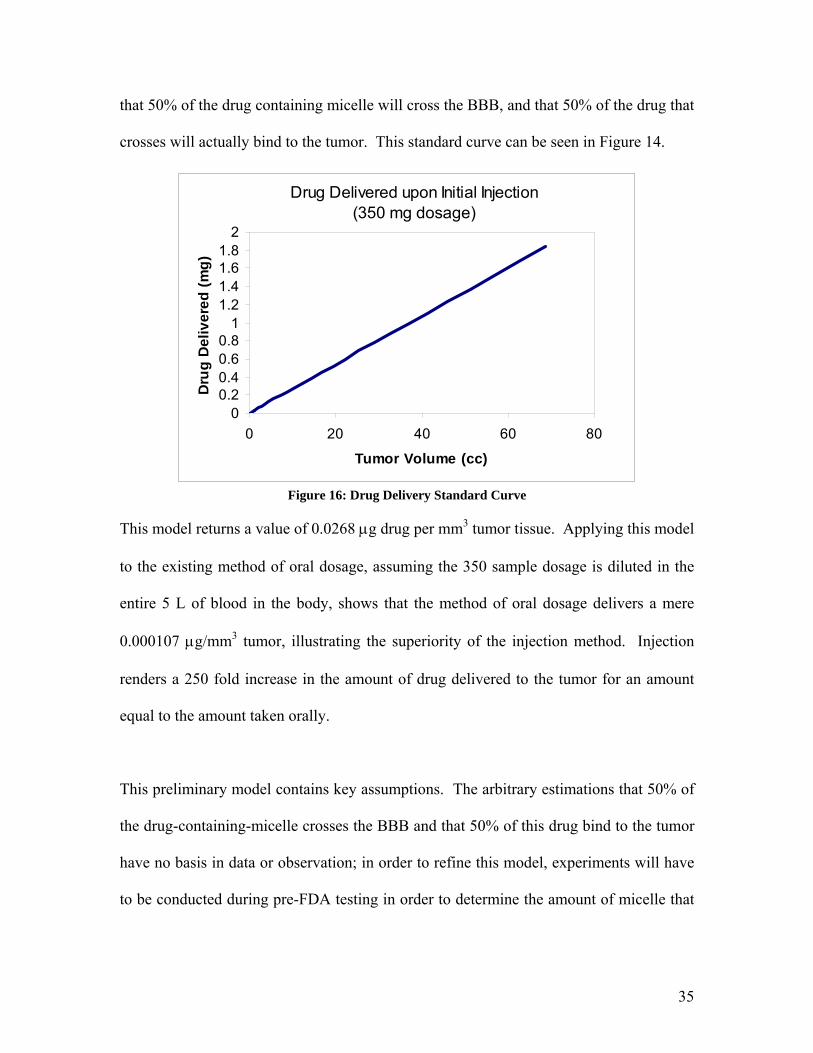
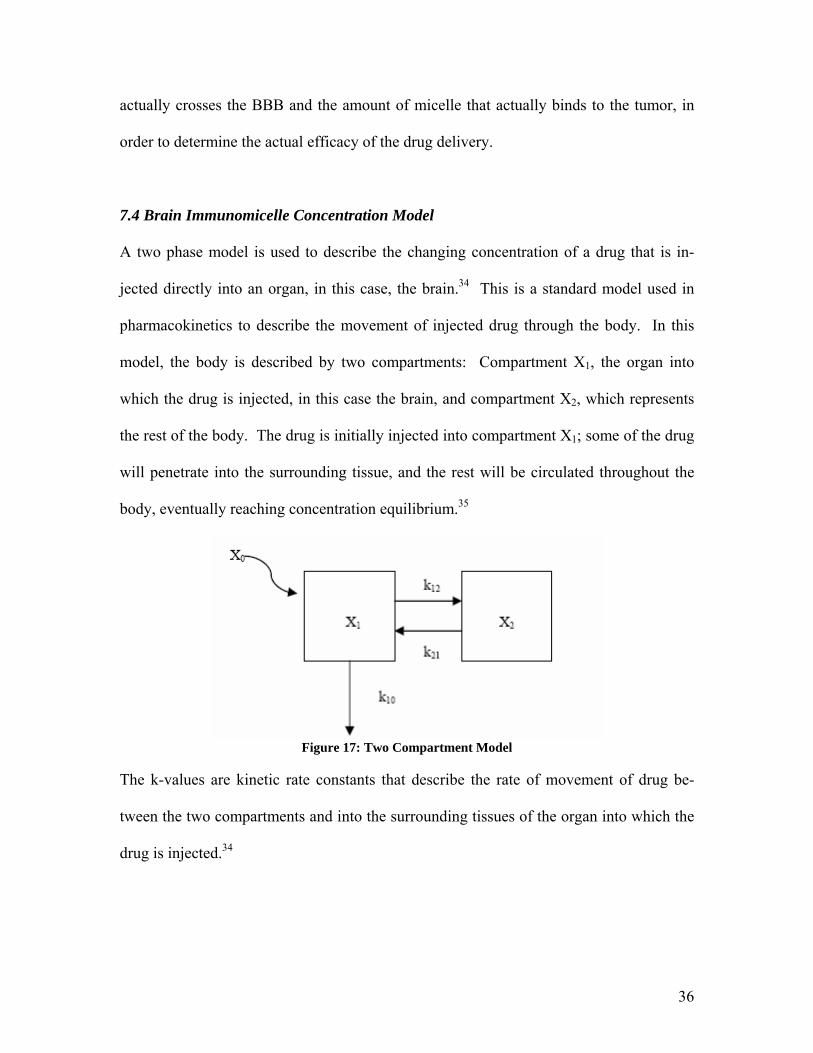
7.4 Brain Immunomicelle Concentration Model
A two phase model is used to describe the changing concentration of a drug that is in-
jected directly into an organ, in this case, the brain.34 This is a standard model used in
pharmacokinetics to describe the movement of injected drug through the body. In this
model, the body is described by two compartments: Compartment X1, the organ into
which the drug is injected, in this case the brain, and compartment X2, which represents
the rest of the body. The drug is initially injected into compartment X1; some of the drug
will penetrate into the surrounding tissue, and the rest will be circulated throughout the
body, eventually reaching concentration equilibrium.35
Figure 17: Two Compartment Model
The k-values are kinetic rate constants that describe the rate of movement of drug be-
tween the two compartments and into the surrounding tissues of the organ into which the
drug is injected.34
36
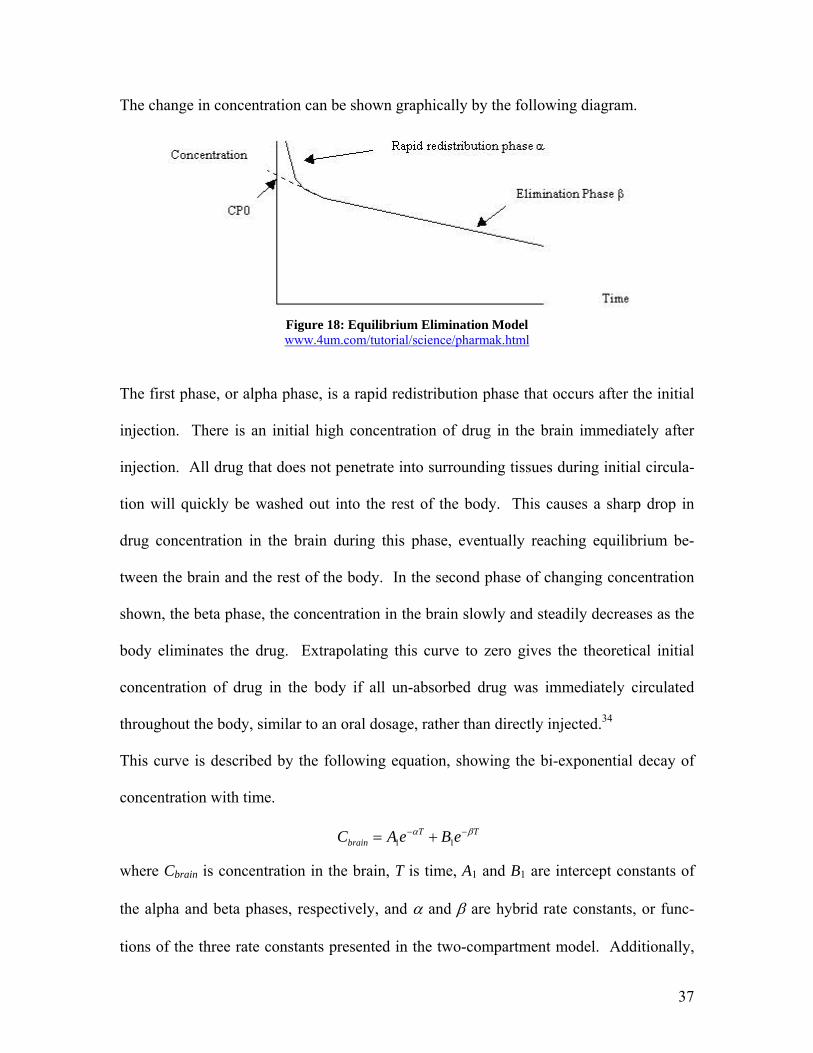
The change in concentration can be shown graphically by the following diagram.
Figure 18: Equilibrium Elimination Model www.4um.com/tutorial/science/pharmak.html
The first phase, or alpha phase, is a rapid redistribution phase that occurs after the initial
injection. There is an initial high concentration of drug in the brain immediately after
injection. All drug that does not penetrate into surrounding tissues during initial circula-
tion will quickly be washed out into the rest of the body. This causes a sharp drop in
drug concentration in the brain during this phase, eventually reaching equilibrium be-
tween the brain and the rest of the body. In the second phase of changing concentration
shown, the beta phase, the concentration in the brain slowly and steadily decreases as the
body eliminates the drug. Extrapolating this curve to zero gives the theoretical initial
concentration of drug in the body if all un-absorbed drug was immediately circulated
throughout the body, similar to an oral dosage, rather than directly injected.34
This curve is described by the following equation, showing the bi-exponential decay of
concentration with time.
− TTbrain eBeAC βα −+= 11
where Cbrain is concentration in the brain, T is time, A1 and B1 are intercept constants of
the alpha and beta phases, respectively, and α and β are hybrid rate constants, or func-
tions of the three rate constants presented in the two-compartment model. Additionally,
37
the α and β constants are also functions of the phase half-life. The β parameter was de-
termined by assuming the half-life of the elimination phase is that calculated by the oral
dosage model.
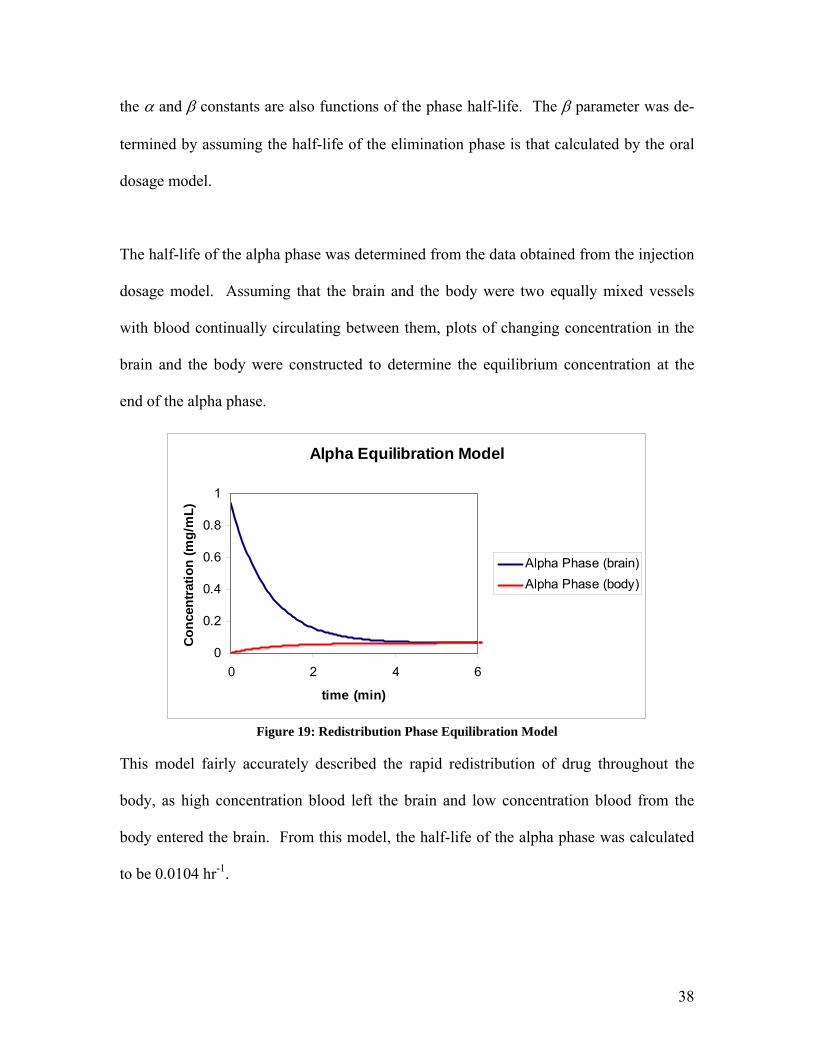
The half-life of the alpha phase was determined from the data obtained from the injection
dosage model. Assuming that the brain and the body were two equally mixed vessels
with blood continually circulating between them, plots of changing concentration in the
brain and the body were constructed to determine the equilibrium concentration at the
end of the alpha phase.
Alpha Equilibration Model
0
0.2
0.4
0.6
0.8
1
0 2 4 6
time (min)
Con
cent
ratio
n (m
g/m
L)
Alpha Phase (brain)Alpha Phase (body)
Figure 19: Redistribution Phase Equilibration Model
This model fairly accurately described the rapid redistribution of drug throughout the
body, as high concentration blood left the brain and low concentration blood from the
body entered the brain. From this model, the half-life of the alpha phase was calculated
to be 0.0104 hr-1.
38
The A1 and B1 parameters were determined from the injection model, which returned an
estimate of the amount of drug exiting the brain after initial injection, or the amount of
drug not absorbed by the tumor. Dividing this initial amount of drug by the amount of
blood in the brain gave an estimate for A1, and dividing this amount of drug by the total
amount of blood contained in the body gave an estimate for B1.
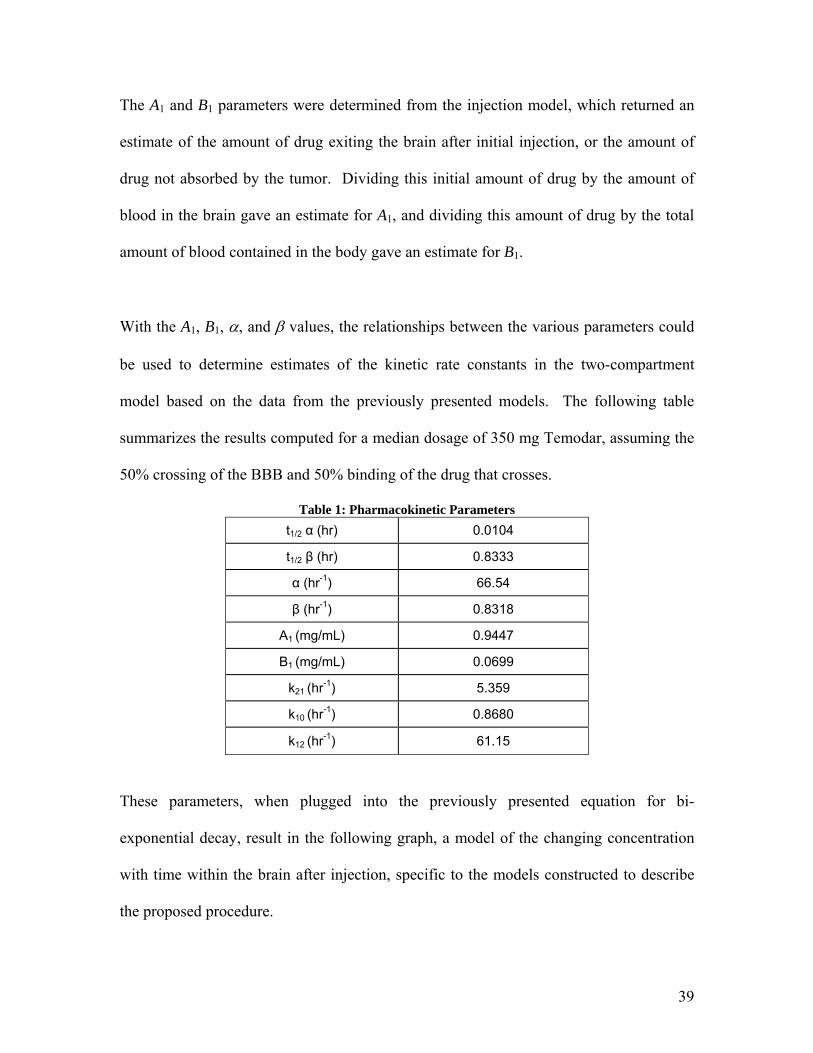
With the A1, B1, α, and β values, the relationships between the various parameters could
be used to determine estimates of the kinetic rate constants in the two-compartment
model based on the data from the previously presented models. The following table
summarizes the results computed for a median dosage of 350 mg Temodar, assuming the
50% crossing of the BBB and 50% binding of the drug that crosses.
Table 1: Pharmacokinetic Parameters t1/2 α (hr) 0.0104
t1/2 β (hr) 0.8333
α (hr-1) 66.54
β (hr-1) 0.8318
A1 (mg/mL) 0.9447
B1 (mg/mL) 0.0699
k21 (hr-1) 5.359
k10 (hr-1) 0.8680
k12 (hr-1) 61.15
These parameters, when plugged into the previously presented equation for bi-
exponential decay, result in the following graph, a model of the changing concentration
with time within the brain after injection, specific to the models constructed to describe
the proposed procedure.
39
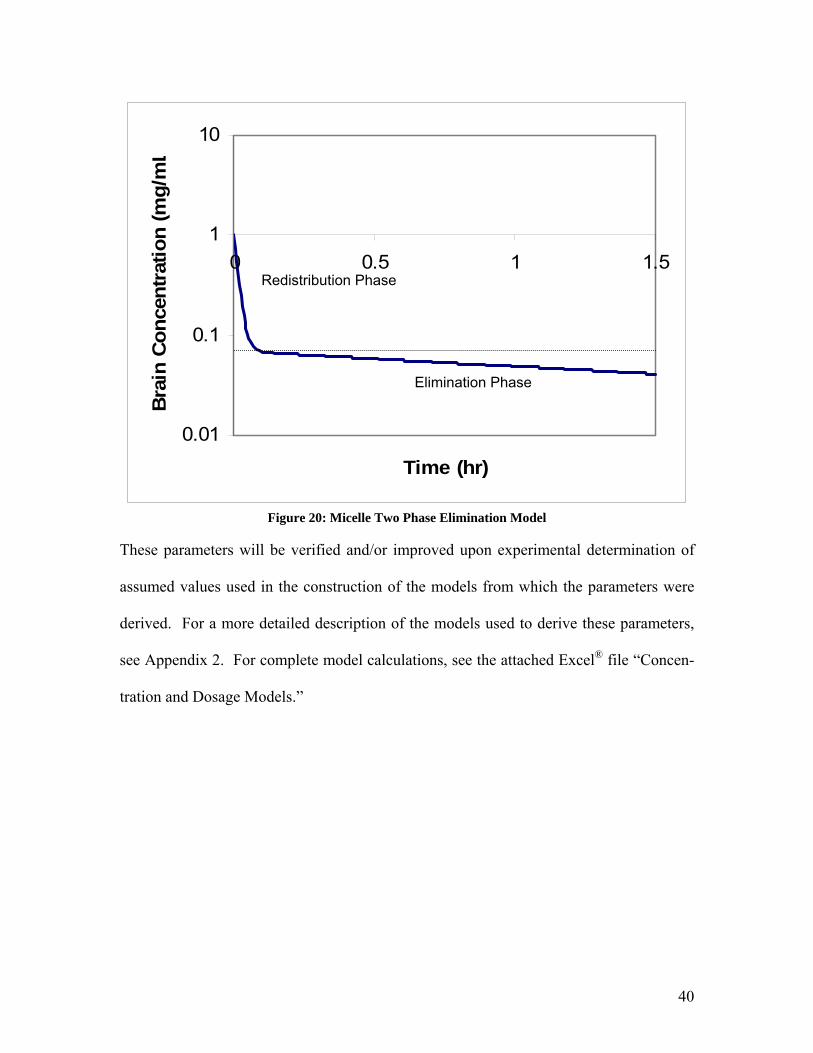
0.01
0.1
1
10
0 0.5 1 1
Time (hr)
Bra
in C
once
ntra
tion
(mg/
m
.5
L
Redistribution Phase
Elimination Phase
Figure 20: Micelle Two Phase Elimination Model
These parameters will be verified and/or improved upon experimental determination of
assumed values used in the construction of the models from which the parameters were
derived. For a more detailed description of the models used to derive these parameters,
see Appendix 2. For complete model calculations, see the attached Excel® file “Concen-
tration and Dosage Models.”
40
8. Animal Testing
There is no animal disease model for gliomas, so a mouse model must be generated in the
laboratory. According to Karl Schmidt et. al., this is accomplished by obtaining nude
mice and infecting them with human glioma cells, which will cause brain cancer in the
mouse.20 Nude mice are born without a thymus; therefore, they are unable to mount most
immune responses including the killing of malignant cells, allowing for tumor formation.
The nude mice can be obtained from the Jackson Laboratory for approximately $70 per
mouse.21 The tumor cell lines can be purchased from the American Type Culture Collec-
tion in Rockville, Missouri. Because gliomas can be either grade III or grade IV, two dif-
ferent cell lines must be purchased. The cell lines that are used must be tumorigenic in
mice and are U87 for grade III and LN-18 for grade IV; at the American Type Culture
Collection these cell lines cost $185 and $235, respectively.22 When determining the
costs of animal testing the price for maintaining the tumor cell lines must also be consid-
ered.
9. Business Plan
9.1 Business Goals and Market Strategy
This company is dedicated to the use of monoclonal antibodies to treat the most pressing
diseases affecting society. The company believes that in using cutting edge technology,
such as toxin encapsulation in micelles, current treatments may be used to a more effec-
tive and less invasive measure. The goal of the company is to become a proprietary drug
delivery company, using current pharmaceutical means to provide therapy for the most
41
demanding diseases facing society today. In this case, gliomas, or malignant brain tu-
mors, will serve as an example of the diseases that the company hopes to treat and re-
duce.
In 1997, the first Monoclonal Antibody (MAb) treatment was approved for pharmaceuti-
cal use in the US by the FDA (Rituxan).23 Today, twenty-eight antibody preparations
have been approved for use in the US and Europe. Two of the approvals have since been
rescinded, but 500 more are in the development stages. This represents the largest bio-
technology category in development. Thus, it is important to look at the future of the
MAb market, to ensure that there is not an over-saturation of the marketplace, leading to
excess production and corporate losses. During 2002 and 2003, the MAb market in can-
cer therapy has grown at an average annual growth rate of nearly 60%.24 This growth is
exceptional, and represents the large interest and high effectiveness of MAb treatment of
cancer. There has been nearly a $2 billion increase in revenues for MAb treatments for
cancer since 2001. More than $3 billion in revenue was recorded for MAb for cancer
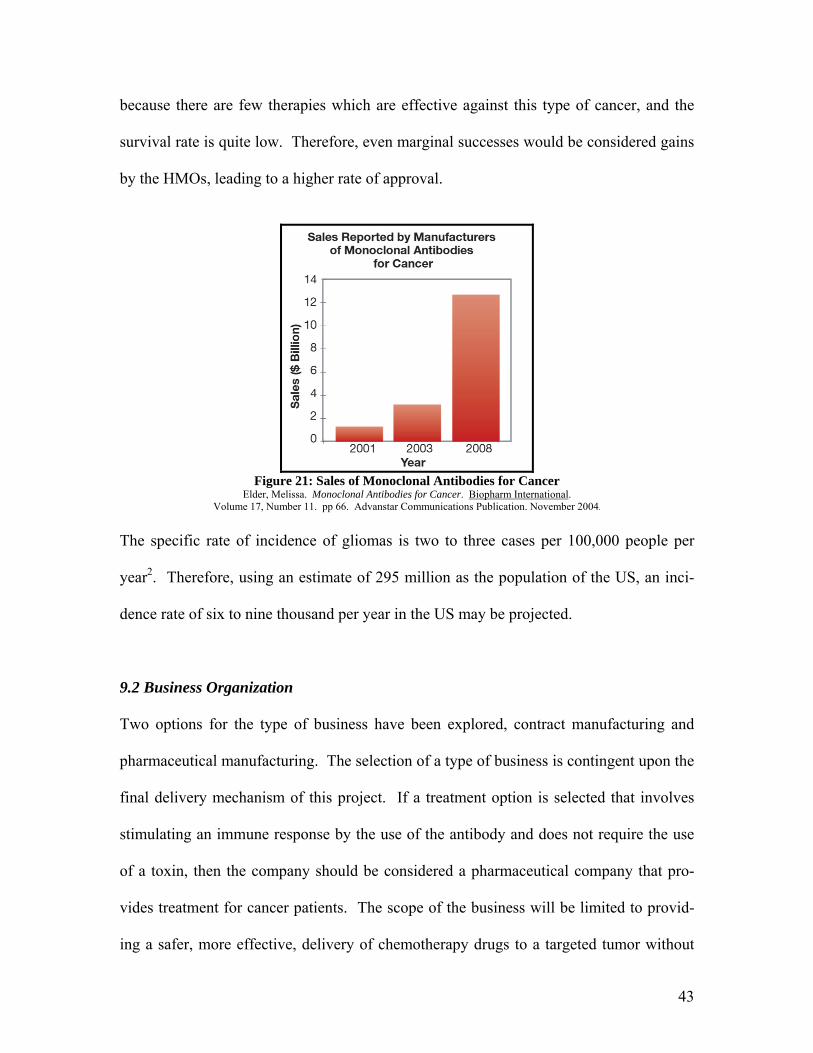
treatment in 2003, with expected revenues of more than $12 billion in 2008. The sales
growth of MAb Cancer Therapies is displayed in Figure 10.24 However, this explosive
growth may be slowed by factors such as difficulty in obtaining HMO approvals. If the
MAb treatments are not approved for use by the HMOs then the cost of the treatment will
be too high for most patients. Thus, any treatment must demonstrate an increased effec-
tiveness over current methods to be considered for approval by the HMOs. A decreased
incidence of severe side effects may also be a point of consideration by the HMOs.
Therefore, the selection of gliomas as a disease for treatment allows for greater success
42
because there are few therapies which are effective against this type of cancer, and the
survival rate is quite low. Therefore, even marginal successes would be considered gains
by the HMOs, leading to a higher rate of approval.
Figure 21: Sales of Monoclonal Antibodies for Cancer
Elder, Melissa. Monoclonal Antibodies for Cancer. Biopharm International. Volume 17, Number 11. pp 66. Advanstar Communications Publication. November 2004.
The specific rate of incidence of gliomas is two to three cases per 100,000 people per
year2. Therefore, using an estimate of 295 million as the population of the US, an inci-
dence rate of six to nine thousand per year in the US may be projected.
9.2 Business Organization Two options for the type of business have been explored, contract manufacturing and
pharmaceutical manufacturing. The selection of a type of business is contingent upon the
final delivery mechanism of this project. If a treatment option is selected that involves
stimulating an immune response by the use of the antibody and does not require the use
of a toxin, then the company should be considered a pharmaceutical company that pro-
vides treatment for cancer patients. The scope of the business will be limited to provid-
ing a safer, more effective, delivery of chemotherapy drugs to a targeted tumor without
43
the extensive side effects of the current chemotherapy drugs. In the business model for a
drug delivery company there would be extensive resources used to promote the technol-
ogy of the company to the current manufacturers of chemotherapy drugs. The ability to
modify existing toxins for more controlled release would be a major selling point for the
company. Expenditures would be required to develop the delivery of the specific toxin to
the targeted cancer cells. This formulation and development cycle using another com-
pany’s drug would be extensive and result in major costs for the company; however, in
contracting with a company to provide a delivery mechanism for an existing drug, some
of this cost would be deferred by the initial investment of the contracted company. This
deferred cost of development and research would provide initial capital for the intensive
process of adapting an existing drug to a modified delivery technique.
Another benefit of the drug delivery technology company is the ability to defer the cost
of FDA approval and testing. The major steps for FDA approval for which the company
is responsible are in most cases limited to the approval of the delivery technique, the fa-
cilities used for manufacturing the modified delivery system, and the materials used in
said system. Another part of FDA approval, which involves the approval of the drug in
connection with the delivery mechanism, would be mostly a concern of the contracted
company. The FDA modeling contained in this report should serve as an estimate and a
basis for a contracted company to make a decision to go forward with the incorporation
of their drug into the technology provided by the company. The final payment of the full
contract for development of the drug into the delivery system would be contingent upon
final FDA approval, but the major capital investment needed for the FDA approval proc-
44
ess would not be a responsibility of the company. This business model does not require
the enormous amount of capital investment required by the FDA approval of most new
drugs.
In most cases the capital expended to ensure approval of a treatment can exceed several
hundred million dollars. This is an enormous burden on a small and growing company.
Avoiding this investment aids in the ability of the company to grow and find a stable
niche in which to enter into the biotechnology and pharmaceutical industry. The long-
term goal of the company would be to increase its share in the biotechnology field by be-
coming a company able to meld current technology with ideas of tomorrow, increasing
the effectiveness of treatment while decreasing the side effects of those treatments. The
ability to provide a better, safer, and more reliable treatment path will increase the viabil-
ity of the company in the cancer treatment community of pharmaceuticals and biotech-
nology.
9.3 Glioma Incidence in the US
Two to three incidences of gliomas occur per 100,000 people in a given population per
year.3 According to the US Census Bureau on January 1, 2005 the population of the
United States was 295 million people.36 This translates to roughly six to nine thousand
cases of gliomas in the US each year. Therefore the mean number of patients suffering
from gliomas per year was estimated at 7375.
45
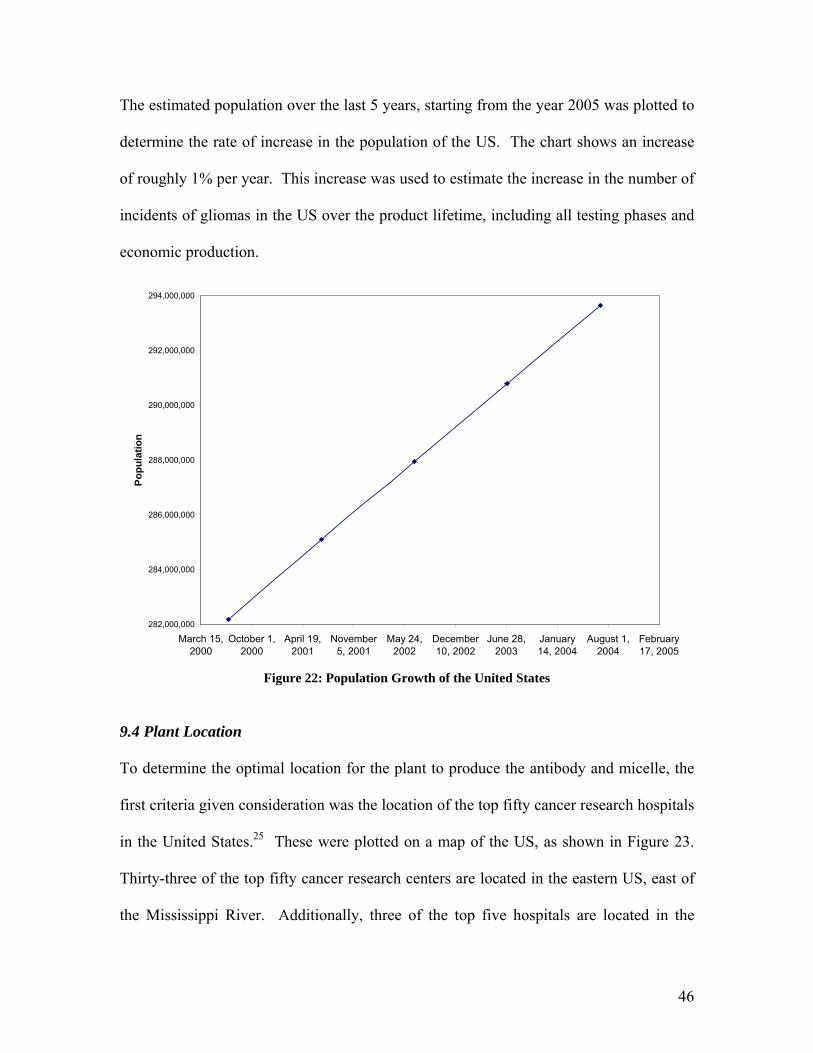
The estimated population over the last 5 years, starting from the year 2005 was plotted to
determine the rate of increase in the population of the US. The chart shows an increase
of roughly 1% per year. This increase was used to estimate the increase in the number of
incidents of gliomas in the US over the product lifetime, including all testing phases and
economic production.
282,000,000
284,000,000
286,000,000
288,000,000
290,000,000
292,000,000
294,000,000
March 15,2000
October 1,2000
April 19,2001
November5, 2001
May 24,2002
December10, 2002
June 28,2003
January14, 2004
August 1,2004
February17, 2005
Popu
latio
n
Figure 22: Population Growth of the United States
9.4 Plant Location
To determine the optimal location for the plant to produce the antibody and micelle, the
first criteria given consideration was the location of the top fifty cancer research hospitals
in the United States.25 These were plotted on a map of the US, as shown in Figure 23.
Thirty-three of the top fifty cancer research centers are located in the eastern US, east of
the Mississippi River. Additionally, three of the top five hospitals are located in the
46
megalopolis known as the Boswash, which runs southwest from Boston to Washington
DC, including Philadelphia, New York City, and Hartford, as well as all surrounding
suburbs.
This 400 mile strip of land contains one of the most fertile academic environments in the
world. The university medical facilities that are located in this area include Johns Hop-
kins Hospital, Yale Medical Facility, and Harvard Medical School. These universities
offer not only a wealth of cancer research and expertise, but also vital federal funding.
Many of these schools currently receive grants from institutes such as the National Insti-
tute of Health (NIH). These institutes not only rank among the top cancer treatment fa-
cilities in the nation, but also among the most well funded institutions in the US.26 The
average NIH grant amount at Johns Hopkins, Yale, and Harvard Universities, combined
for the 2003 fiscal year, was $450,000 dollars per grant. Combined with the universities,
where much of the research and development of this new technology will be carried out,
the financial gains of working with these universities is obvious. Using this criteria, it
was determined that the optimal placement for a production plant and main campus for
the company would be in or around New York City. This is a central location of the
Boswash and gives several options for plant location. A plant could be built outside New
York City in New York State, Connecticut, or New Jersey.
47
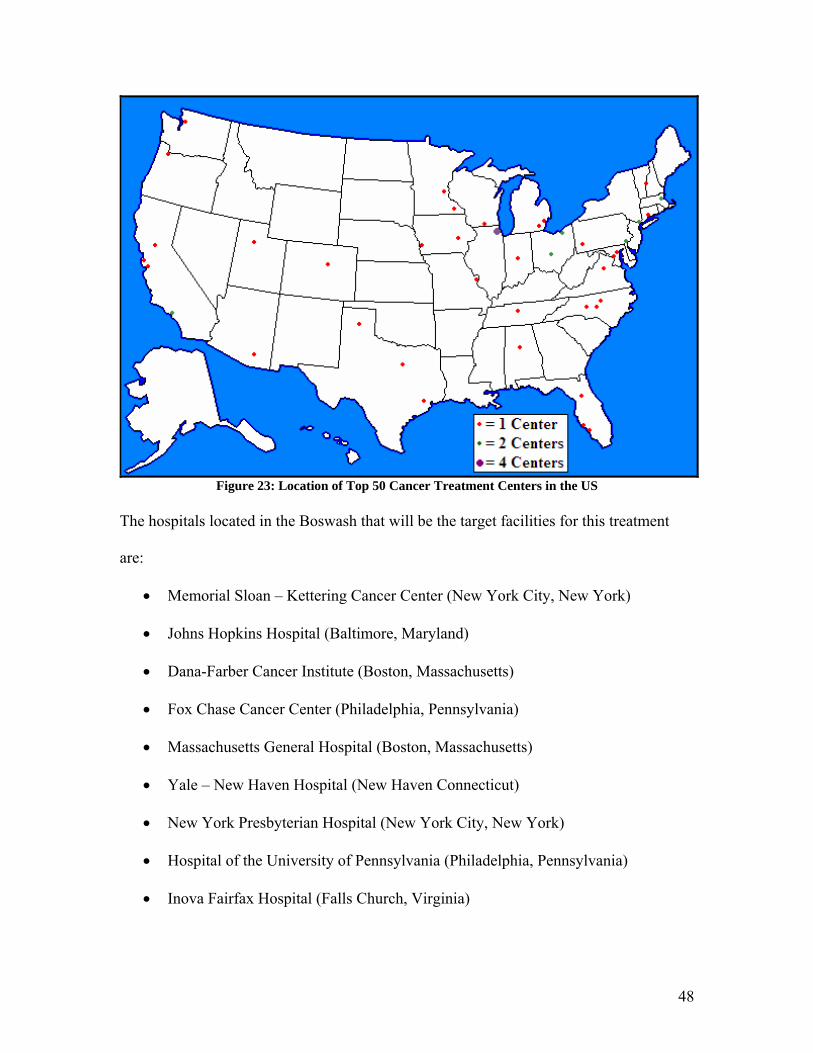
Figure 23: Location of Top 50 Cancer Treatment Centers in the US
The hospitals located in the Boswash that will be the target facilities for this treatment
are:
• Memorial Sloan – Kettering Cancer Center (New York City, New York)
• Johns Hopkins Hospital (Baltimore, Maryland)
• Dana-Farber Cancer Institute (Boston, Massachusetts)
• Fox Chase Cancer Center (Philadelphia, Pennsylvania)
• Massachusetts General Hospital (Boston, Massachusetts)
• Yale – New Haven Hospital (New Haven Connecticut)
• New York Presbyterian Hospital (New York City, New York)
• Hospital of the University of Pennsylvania (Philadelphia, Pennsylvania)
• Inova Fairfax Hospital (Falls Church, Virginia)
48
As glioma patients frequently travel to these hospitals for treatment, a marketing strategy
will initially be targeted at the oncologists at these hospitals.
9.5 Funding
On the front end of this project, the major burden for funding will be the cost of research
and development for the micelle delivery mechanism. This will be funded by both pri-
vate investments and government research grants. A large source of funding will be from
the NIH. The major grants that will be sought from the NIH are: Small Business Tech-
nology Transfer Grants, Small Business Innovation Research Grants, Animal (Mammal-
ian and Non-mammalian) Model and Animal and Biological Material Resource Grants,
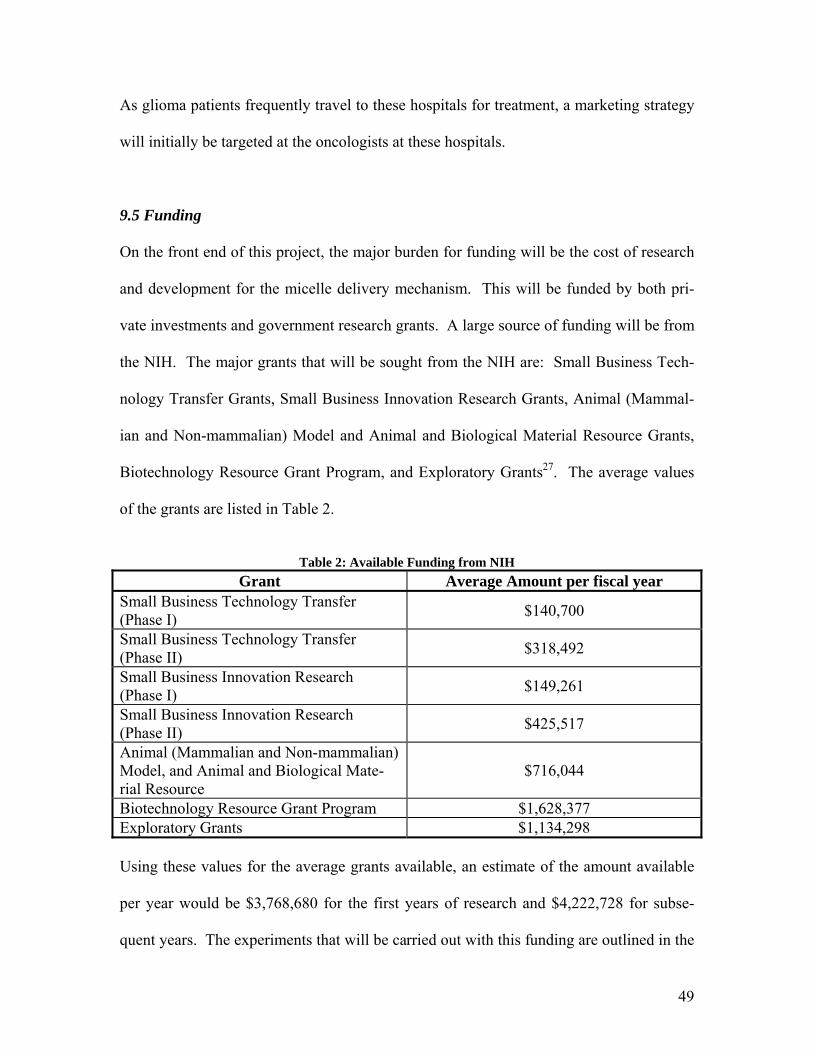
Biotechnology Resource Grant Program, and Exploratory Grants27. The average values
of the grants are listed in Table 2.
Table 2: Available Funding from NIH
Grant Average Amount per fiscal year Small Business Technology Transfer (Phase I) $140,700
Small Business Technology Transfer (Phase II) $318,492
Small Business Innovation Research (Phase I) $149,261
Small Business Innovation Research (Phase II) $425,517
Animal (Mammalian and Non-mammalian) Model, and Animal and Biological Mate-rial Resource
$716,044
Biotechnology Resource Grant Program $1,628,377 Exploratory Grants $1,134,298 Using these values for the average grants available, an estimate of the amount available
per year would be $3,768,680 for the first years of research and $4,222,728 for subse-
quent years. The experiments that will be carried out with this funding are outlined in the
49
pre-FDA testing section of the report. These grants are all from the NIH, the major
source of funding for this company.
Another source of funding for this project would be the American Cancer Society (ACS).
The ACS grants money to fund research at universities; therefore, the company partnered
with universities would be able to provide the salaries of several researchers and the
funding for several laboratories. The maximum yearly grant from the ACS is approxi-
mately $250,000.
These estimates do not reflect every available grant, but the ones that are easily obtained
and fairly standard. The actual total funding that the company would receive would be
much greater than the amount found here.
9.6 Cost
During Pre-FDA testing of the micelle, a facility will be constructed to house the research
labs and testing facilities. This facility is estimated to cost $5 million, and will house the
corporate headquarters and all auxiliary systems for support of the company. This facil-
ity will remain useful even after the pre-FDA testing has been completed, serving as the
headquarters for the company’s research and development division.
The estimated total capital investment (TCI) for a MAb production facility is $16.3 mil-
lion. This includes all necessary construction and equipment, including bioreactors,
chromatography columns, and necessary sterilization equipment. The estimated TCI for
50
the micelle production and attachment facility is $45 million. This includes all necessary
equipment for micelle construction, encapsulation of the toxin, and attachment of the
MAb to the globular structure. If a vector is needed to assist in blood-brain barrier cross-
ing the TCI for a facility to produce the vector is estimated at $250,000. This is less than
the facility for the MAb production, because the vector will likely be another MAb and
will be operated in conjunction with existing MAb facilities.
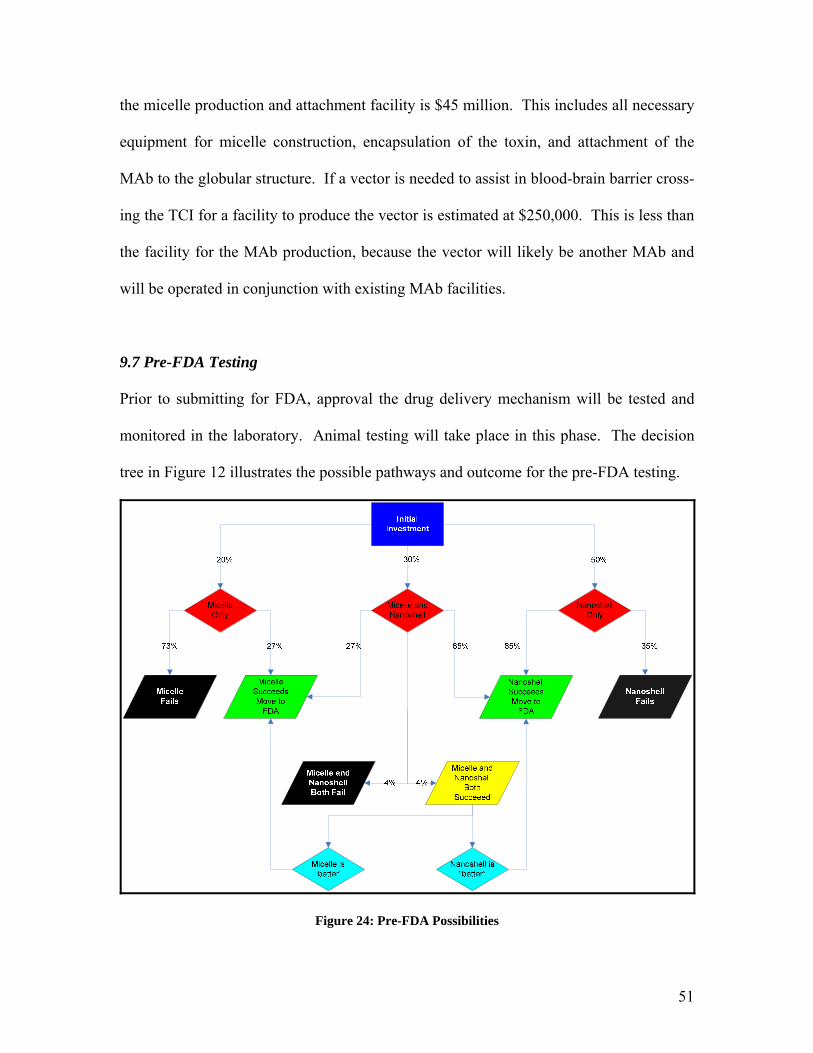
9.7 Pre-FDA Testing
Prior to submitting for FDA, approval the drug delivery mechanism will be tested and
monitored in the laboratory. Animal testing will take place in this phase. The decision
tree in Figure 12 illustrates the possible pathways and outcome for the pre-FDA testing.
Figure 24: Pre-FDA Possibilities
51
Figure 25 illustrates the research and development phase of the micelle encapsulation.
There are three major behaviors of the micelle and antibody that are being investigated in
this section. The first aspect being investigated is cell uptake of the micelle and accom-
panying toxin. If the micelle delivery mechanism passes this stage and is taken up by the
cell with the appropriate binding sites, then the project will progress on to BBB crossing
testing. In this phase of the testing, if the MAb does not act as a vector to allow the mi-
celle to cross the BBB, then the use of a vector attached to the micelle will be investi-
gated. If the BBB can be crossed by the micelle then the testing will proceed to the next
stage of testing. If the BBB cannot be crossed by the micelle then the project will fail.
The third stage of testing is to investigate the effects the micelle and accompanying test-
ing will have on the rest of the body which is not cancerous. This includes all areas
which have the binding site specific to the antibody as well as any areas of the body
which are affected by the chemotherapy toxin. This is a comparison of the side effects of
the chemotherapy alone to the micelle delivery system. If the effects on non-cancerous
areas of the body are roughly equivalent to or less than the chemotherapy alone, then the
final stage of Pre-FDA testing will be entered. If the effects on non-cancerous areas of
the body are greater than the current chemotherapy then the project will fail.
The final stage of testing is to observe the effectiveness in reduction of the tumor. In this
case it is necessary to obtain a reduction of the tumor that is at least as much as the che-
motherapy alone. If there is a negligible difference in the reduction of the tumor when
using the micelle as compared to the chemotherapy alone, then it becomes necessary to
52
53
evaluate the extent of the side effects. If the side effects are less than the current chemo-
therapy by using the micelle, then the project still has merit and should proceed. How-
ever, if the side effects are negligibly reduced then the project will fail.
Figure 26 represents a possible flow chart of the pre-FDA testing of the micelle drug en-
capsulation. The assigned probabilities are based on the research that has been done at
each section. For some stages of testing there is no literature that specifies that the test-
ing has been successful on some level. Therefore, the listed probabilities are simply
guidelines of what might happen and are educated guesses about the process of testing.
The cost listed next to each phase of testing represents the cost of materials and supplies
for that phase of testing. The accompanying time that is listed with each testing phase is
the time that is projected to be spent for completion of that specific phase. During pre-
FDA testing the company plans to employ two PhD’s and four technicians to carry out
the testing procedures. The yearly salary for the PhD’s is $85,000 per year, and for the
technicians the salary is at $45,000 per year. Thus, to calculate the total cost of a specific
phase of testing, it is necessary to multiply the number of employees by the annual salary
of the employee giving a total labor cost per year, then multiply by the total number of
years for the testing, giving the total labor cost for the specific phase of testing. The total
materials cost may then be added to the labor cost for the net cost of each phase.
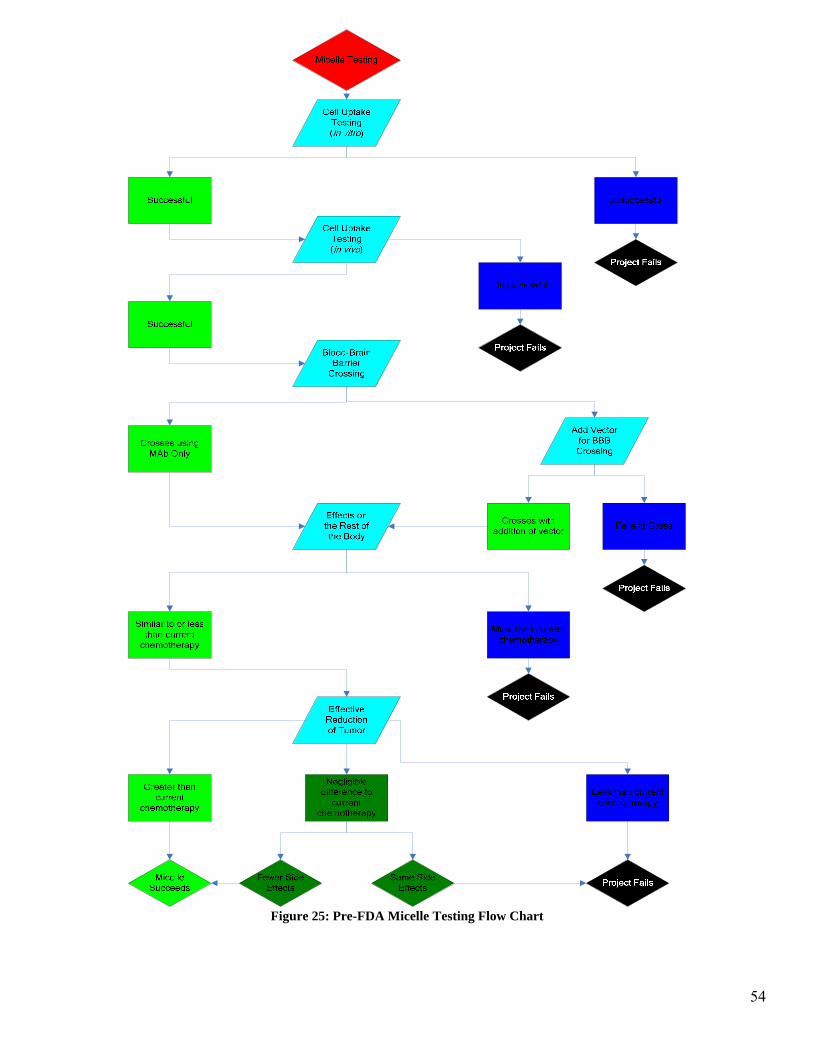
Figure 25: Pre-FDA Micelle Testing Flow Chart
54
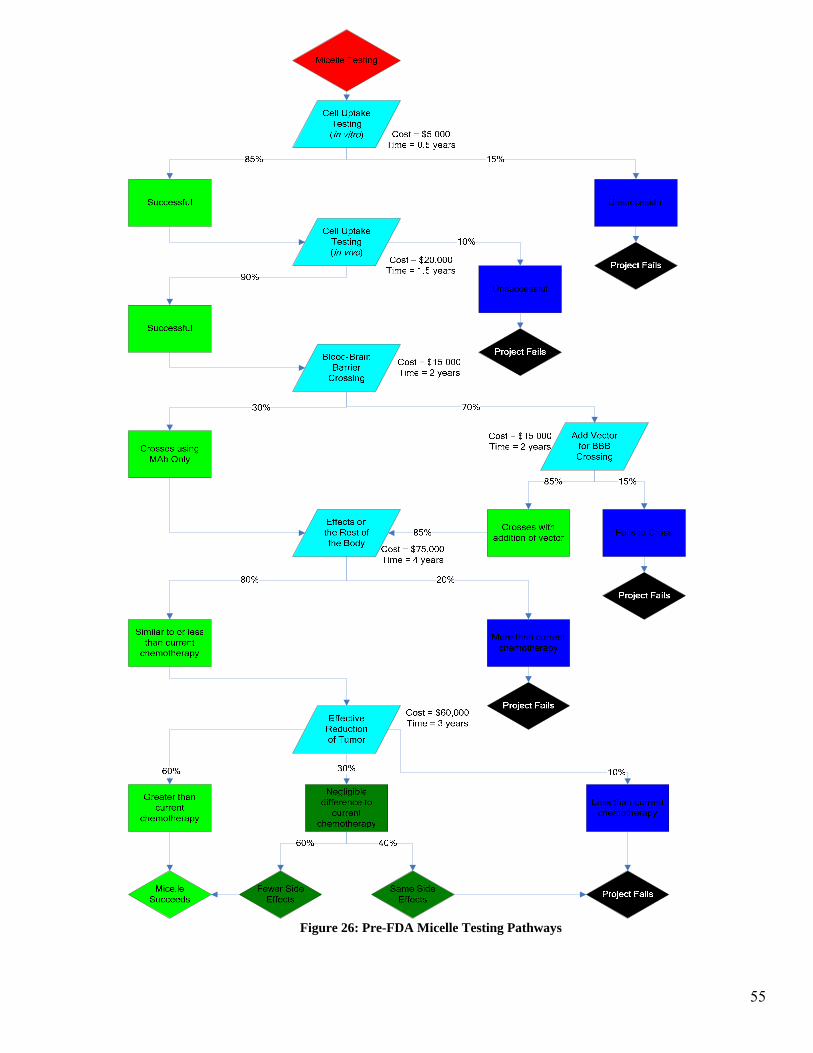
Figure 26: Pre-FDA Micelle Testing Pathways
55
56
9.8 FDA Testing and Approval
FDA testing is a long and drawn out process designed to test the effectiveness and safety
of a new drug. In the case of this venture it is necessary to model the approval process of
the new drug delivery technology. There are three main phases to the FDA approval
process. The first phase is used to determine the dosage and immediate safety of a par-
ticular drug. The second phase is used to determine the effectiveness of the treatment and
to look for immediate side effects in patient volunteers. The third phase is used to moni-
tor effects of long term use and verify the long term effectiveness of the drugs.
For the FDA testing process, the number of doctors participating in each phase of the ap-
proval process was estimated, and the ratio of doctors to patients was kept at approxi-
mately 1:15. The amount of patients participating in each phase of the experiment was
estimated conservatively based on the rate of incidence of gliomas. Therefore, the length
of the phases was increased to compensate for a low participation based on the incidence
of gliomas. As the testing proceeded, an increased cost in patient care was factored in for
economic analysis purposes. This is due to the nature of the tests. The phase I trials
monitor safety in dosage, and is therefore a very short testing period. The phase III trials
monitor long term effects from long term use of the drug, therefore constituting a higher
cost for patient care over the course of the treatment.
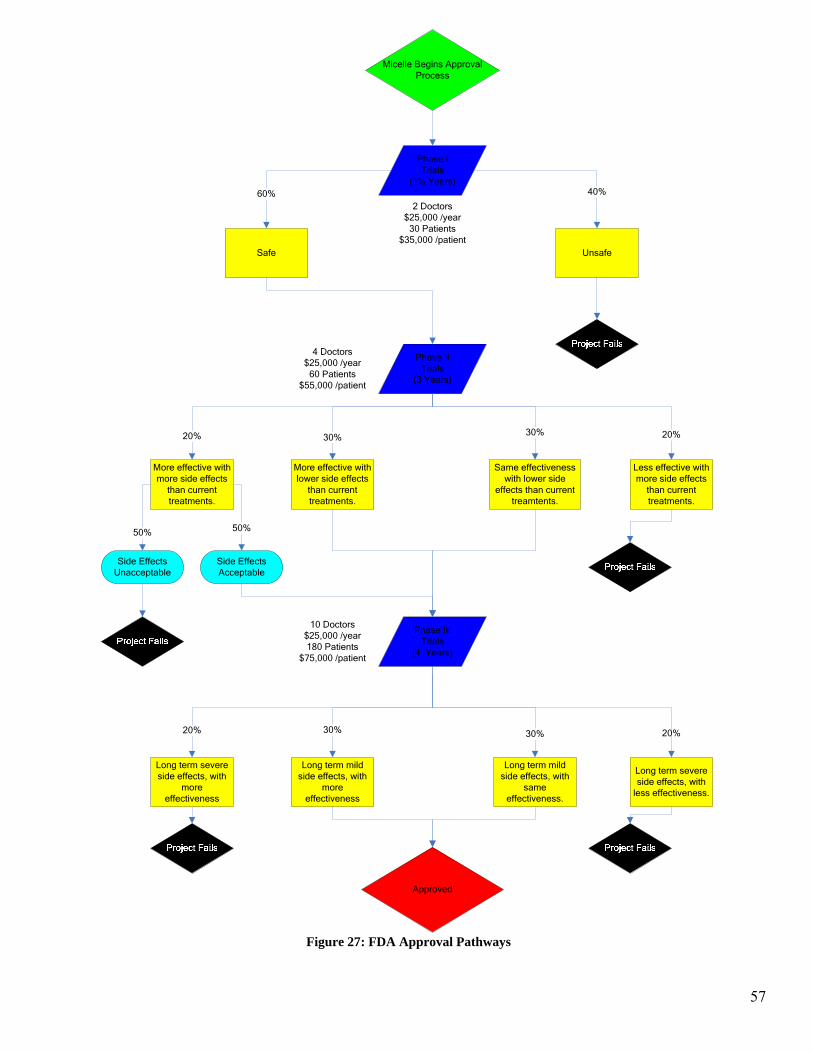
Micelle Begins Approval Process
Phase I Trials
(1½ Years)
Safe Unsafe
60% 40%
Phase II Trials
(3 Years)
More effective with lower side effects
than current treatments.
Same effectiveness with lower side
effects than current treamtents.
More effective with more side effects
than current treatments.
Less effective with more side effects
than current treatments.
20% 30% 30% 20%
Side Effects Unacceptable
Side Effects Acceptable
50% 50%
Phase III Trials
(4 Years)
Long term severe side effects, with
more effectiveness
Long term mild side effects, with
more effectiveness
Long term mild side effects, with
same effectiveness.
Long term severe side effects, with
less effectiveness.
20% 30% 30%
Approved
20%
2 Doctors$25,000 /year
30 Patients $35,000 /patient
4 Doctors$25,000 /year
60 Patients $55,000 /patient
10 Doctors$25,000 /year180 Patients
$75,000 /patient
Figure 27: FDA Approval Pathways
57
9.9 Marketing
Once the final stages of Pre-FDA testing have begun and have shown promising results,
the company will move into a phase of developing a brand name and marketing strategy.
As the testing for FDA approval commences, the company will then need to retain adver-
tising and marketing specialists. The first goal for the marketing strategy will be to target
oncologists at hospitals in the New England area. This is necessary for both corporate
growth and to recruit a number of oncologists for the phase two FDA trials. Marketing
should not be targeted at the general public because the amount of money required to ad-
vertise to the entire nation would be quite large and this type of advertising is too indis-
criminate based on the small number of glioma patients in the US.
Another facet of the marketing department’s job is to bring in new business for our drug
delivery technology. At the inception of the company this department will be formed.
Initially, the size of the marketing department will be two people. These people will be
responsible for contacting current drug manufacturers and selling the idea of monoclonal
antibody targeted systems. This will generate business for the company and will provide
for corporate growth.
The amount to be spent on marketing will vary depending on how rapidly the company
grows and the amount of success that is observed in the pre-FDA and FDA trials. Ini-
tially, a goal of approximately $150,000 per year will be instituted. This will provide the
salary for the marketing department (2 people with salary of $45,000 per year), travel ex-
penses, and marketing to doctors of oncology for participation in the trails. As the trials
58
of our delivery technology are completed, the marketing department will need to rapidly
expand. As the FDA trials progress into the phase two clinical trials the company will be
looking to expand the marketing department, most likely adding two more people and
additional funding for travel and marketing expenses28. The budget of the marketing de-
partment will move to approximately $450,000 per year once the FDA approval process
has moved into phase III trials.
9.10 Economic Demand Model
An economic demand model was derived to account for the effects of marketing expendi-
tures, improved treatment efficacy, and lowered treatment side effects on product de-
mand. For a given market, two products of equal quality and prominence are described
by the following the equation:
p1d1 = p2d2
In this model two treatments with an equal price would have an equal demand. However,
if one product is new on the market and therefore not as well known, a knowledge multi-
plier α must be inserted on the other side of the equation to account for this decrease in
product demand. This modified model is described by the following equation:
p1d1 = αp2d2
In this derivation the α value is a fraction that is assumed to be a function of the amount
of money spend on marketing during the FDA approval process and large scale produc-
tion.
59
Since the targeted population for treatment is relatively small and concentrated in the top
cancer treatment hospitals, it was assumed that once large scale production begins the
demand for the treatment will grow as the oncologists become aware of the treatment and
recommend it for their patients. Therefore, the rate at which the demand grows will de-
pend upon the rate at which oncologists tell their colleagues about the new treatment and
these colleagues begin recommending it to their patients. In comparison, the amount of
money spent on marketing will have a negligible effect on the rate of demand growth,
since oncologists are more likely to be influenced by their colleagues in the cancer treat-
ment hospital than a visiting sales representative or magazine advertisement. Thus, the α
value is assumed to be independent of the amount of money spent on marketing during
phase III of the FDA approval process and large scale production.
Conversely, marketing will play an important role in the demand during the first two
phases of the FDA approval process. During this period, hiring marketing consultants to
promote the treatment with oncologists is critical for finding patients to participate in the
clinical trials. Spending more money on marketing the product during this period of
treatment development will increase the initial demand for the treatment after large scale
production begins. However, these marketing expenditures will not significantly affect
the long term product demand since the product demand will rapidly increase after large
scale production begins as oncologists recommend the treatment for their patients.
Using these assumptions, the demand model is derived by the assuming a linear increase
in demand after production begins. This assumption is valid since the treatment popula-
60
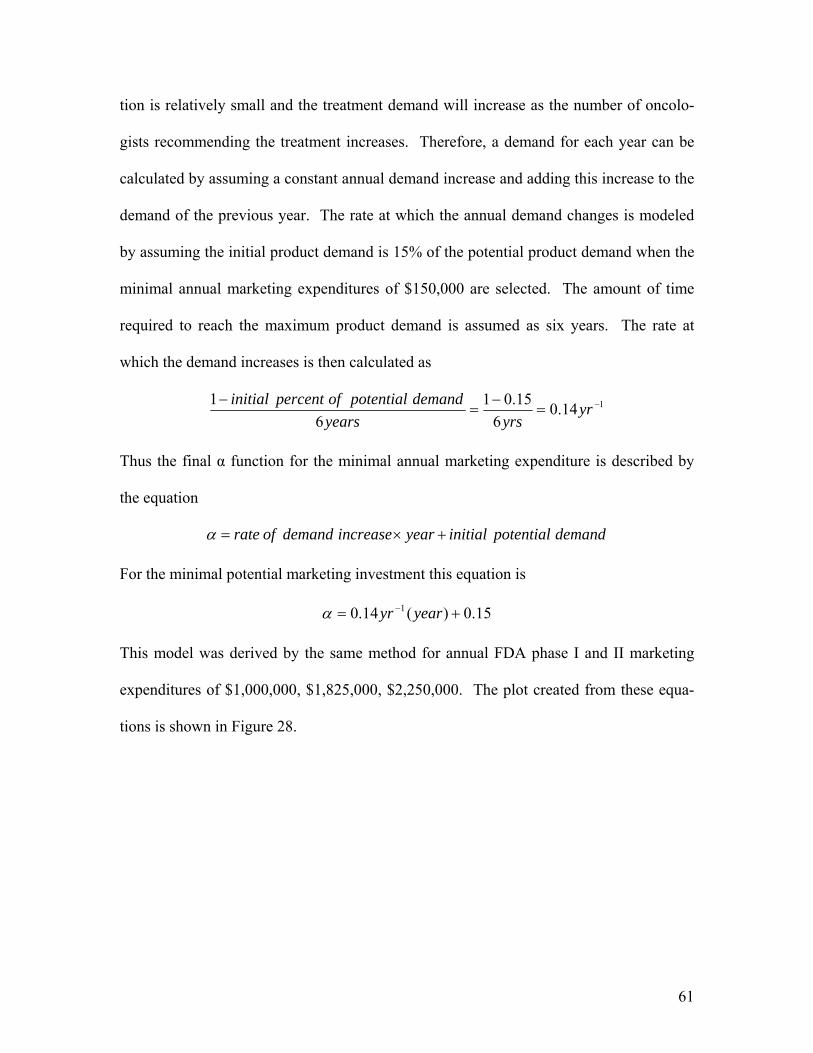
tion is relatively small and the treatment demand will increase as the number of oncolo-
gists recommending the treatment increases. Therefore, a demand for each year can be
calculated by assuming a constant annual demand increase and adding this increase to the
demand of the previous year. The rate at which the annual demand changes is modeled
by assuming the initial product demand is 15% of the potential product demand when the
minimal annual marketing expenditures of $150,000 are selected. The amount of time
required to reach the maximum product demand is assumed as six years. The rate at
which the demand increases is then calculated as
114.06
15.016
1 −=−
=− yr
yrsyearsdemandpotentialofpercentinitial
Thus the final α function for the minimal annual marketing expenditure is described by
the equation
demandpotentialinitialyearincreasedemandofrate +×=α
For the minimal potential marketing investment this equation is
15.0)(14.0 1 += − yearyrα
This model was derived by the same method for annual FDA phase I and II marketing
expenditures of $1,000,000, $1,825,000, $2,250,000. The plot created from these equa-
tions is shown in Figure 28.
61
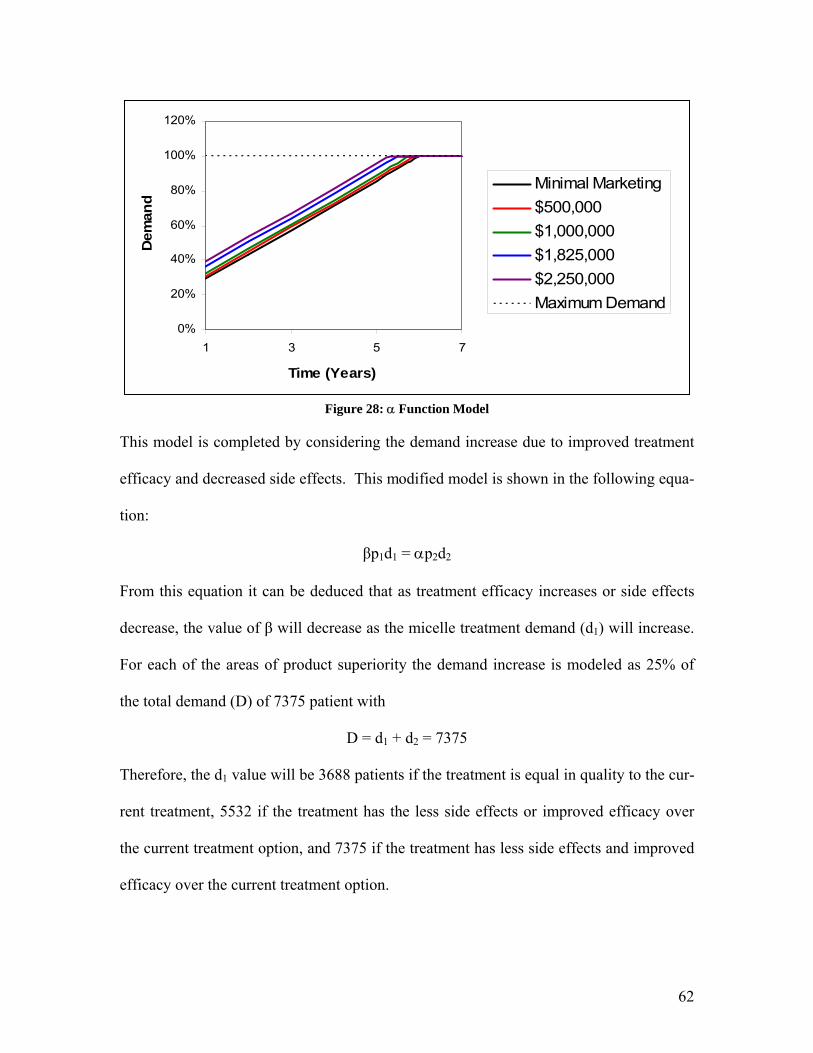
0%
20%
40%
60%
80%
100%
120%
1 3 5 7
Time (Years)
Dem
and
Minimal Marketing$500,000$1,000,000$1,825,000$2,250,000Maximum Demand
Figure 28: α Function Model
This model is completed by considering the demand increase due to improved treatment
efficacy and decreased side effects. This modified model is shown in the following equa-
tion:
βp1d1 = αp2d2
From this equation it can be deduced that as treatment efficacy increases or side effects
decrease, the value of β will decrease as the micelle treatment demand (d1) will increase.
For each of the areas of product superiority the demand increase is modeled as 25% of
the total demand (D) of 7375 patient with
D = d1 + d2 = 7375
Therefore, the d1 value will be 3688 patients if the treatment is equal in quality to the cur-
rent treatment, 5532 if the treatment has the less side effects or improved efficacy over
the current treatment option, and 7375 if the treatment has less side effects and improved
efficacy over the current treatment option.
62
This economic demand model is incorporated into the final profitability calculations and
risk analysis. Results indicate that changing the marketing expenditures during phases I
and II has minimal effects on the net present value after 15 years. However, the changes
in demand based on the micelle treatment superiority over the current treatment were sig-
nificant. As expected, the net present value of the project doubled when the when the
treatment had both improved efficacy and less side effects. This indicates that treatment
superiority over the current treatment has a much greater impact on product demand than
marketing expenditures.
9.11 Risk Analysis
Risk analysis was performed on profitability of the micelle development and production
process. The probability of each scenario of success and failure during pre-FDA and
FDA testing is evaluated by multiplying the assigned probabilities of each stage of testing
to determine the final probability of each success or failure scenario. For example, the
probability that the micelle will not be able to be modified to cross the blood-brain barrier
was found as follows:
th vectorbarrier wibrain blood crossnot does micellebarrierbrain -blood thecross toaddedvector
in vivo uptake micelle successfulin vitro uptake micelle succesfulbarrierbrain blood crossnot does micelle
pp
ppp
××
×=
substituting values from the pre-FDA micelle testing flowchart:
08.015.0*70.0*90.0*85.0barrierbrain blood crossnot does micelle ==p
Charts displaying the probabilities of all possible scenarios are displayed below with re-
spect to varying investment as first-stage decisions. The accuracy of the probabilities
was verified by adding all the probabilities to ensure that the sum of the pre-FDA prob-
abilities is equal to one and that the sum of the probabilities of each set of FDA scenarios
63
based on each success scenario from pre-FDA testing is equal to the probability of this
successful scenario occurring in pre-FDA testing.
The first stage decisions, involving amount of money spent on research and development
through pre-FDA and FDA testing, were varied. Subsequent changes were made to the
probabilities of successful pathways corresponding to an increased spending resulting in
more likelihood of success.
64
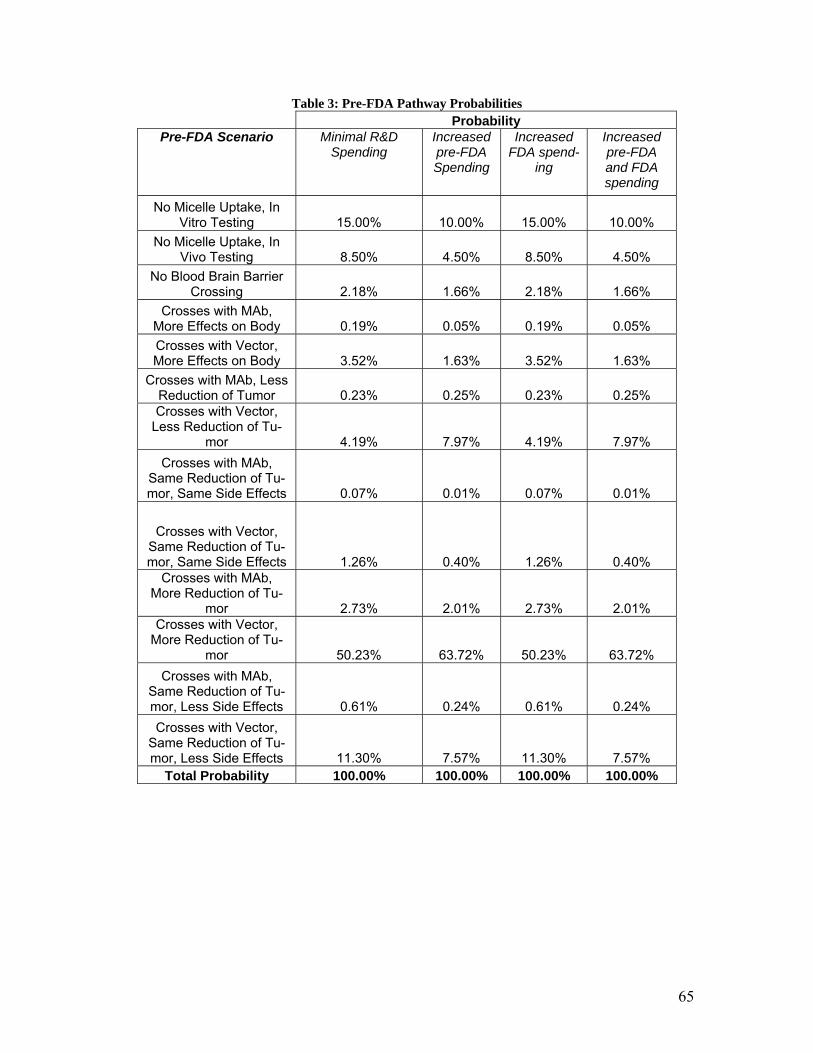
Table 3: Pre-FDA Pathway Probabilities Probability
Pre-FDA Scenario Minimal R&D Spending
Increased pre-FDA Spending
Increased FDA spend-
ing
Increased pre-FDA and FDA spending
No Micelle Uptake, In Vitro Testing 15.00% 10.00% 15.00% 10.00%
No Micelle Uptake, In Vivo Testing 8.50% 4.50% 8.50% 4.50%
No Blood Brain Barrier Crossing 2.18% 1.66% 2.18% 1.66%
Crosses with MAb, More Effects on Body 0.19% 0.05% 0.19% 0.05% Crosses with Vector, More Effects on Body 3.52% 1.63% 3.52% 1.63%
Crosses with MAb, Less Reduction of Tumor 0.23% 0.25% 0.23% 0.25% Crosses with Vector,
Less Reduction of Tu-mor 4.19% 7.97% 4.19% 7.97%
Crosses with MAb, Same Reduction of Tu-mor, Same Side Effects 0.07% 0.01% 0.07% 0.01%
Crosses with Vector, Same Reduction of Tu-mor, Same Side Effects 1.26% 0.40% 1.26% 0.40%
Crosses with MAb, More Reduction of Tu-
mor 2.73% 2.01% 2.73% 2.01% Crosses with Vector,
More Reduction of Tu-mor 50.23% 63.72% 50.23% 63.72%
Crosses with MAb, Same Reduction of Tu-mor, Less Side Effects 0.61% 0.24% 0.61% 0.24% Crosses with Vector,
Same Reduction of Tu-mor, Less Side Effects 11.30% 7.57% 11.30% 7.57%
Total Probability 100.00% 100.00% 100.00% 100.00%
65
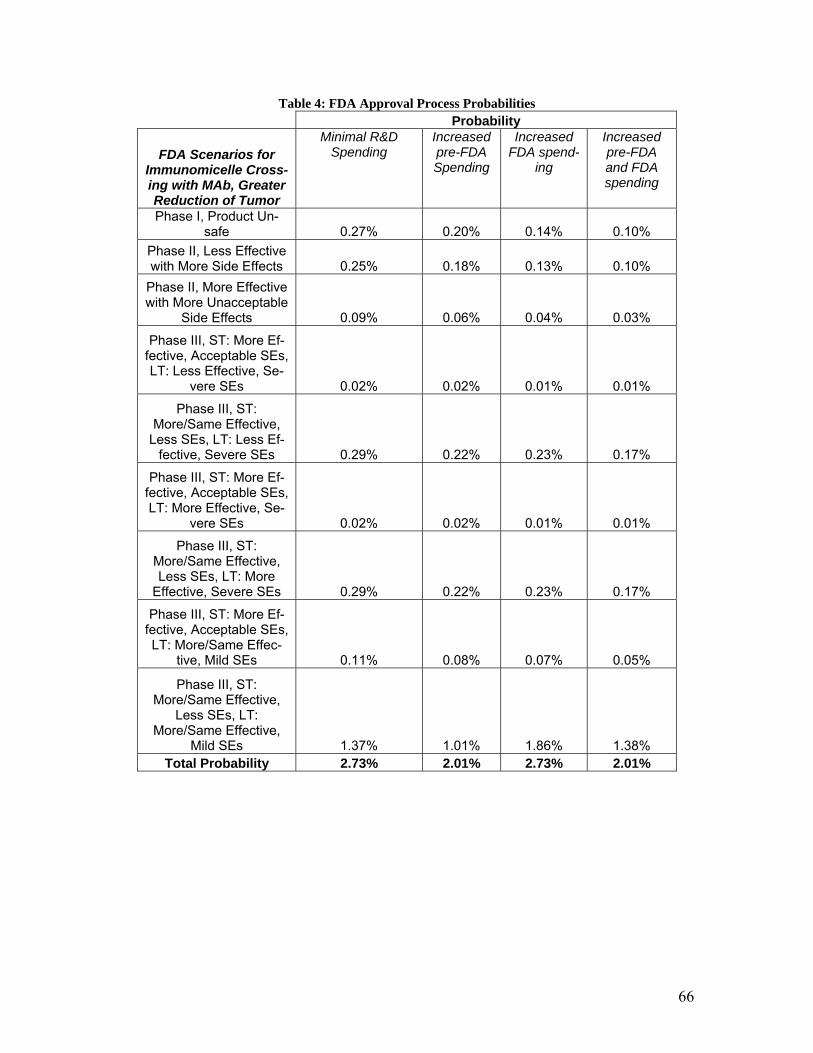
Table 4: FDA Approval Process Probabilities Probability
FDA Scenarios for Immunomicelle Cross-ing with MAb, Greater Reduction of Tumor
Minimal R&D Spending
Increased pre-FDA Spending
Increased FDA spend-
ing
Increased pre-FDA and FDA spending
Phase I, Product Un-safe 0.27% 0.20% 0.14% 0.10%
Phase II, Less Effective with More Side Effects 0.25% 0.18% 0.13% 0.10%
Phase II, More Effective with More Unacceptable
Side Effects 0.09% 0.06% 0.04% 0.03%
Phase III, ST: More Ef-fective, Acceptable SEs, LT: Less Effective, Se-
vere SEs 0.02% 0.02% 0.01% 0.01%
Phase III, ST: More/Same Effective,
Less SEs, LT: Less Ef-fective, Severe SEs 0.29% 0.22% 0.23% 0.17%
Phase III, ST: More Ef-fective, Acceptable SEs, LT: More Effective, Se-
vere SEs 0.02% 0.02% 0.01% 0.01%
Phase III, ST: More/Same Effective, Less SEs, LT: More
Effective, Severe SEs 0.29% 0.22% 0.23% 0.17%
Phase III, ST: More Ef-fective, Acceptable SEs, LT: More/Same Effec-
tive, Mild SEs 0.11% 0.08% 0.07% 0.05%
Phase III, ST: More/Same Effective,
Less SEs, LT: More/Same Effective,
Mild SEs 1.37% 1.01% 1.86% 1.38% Total Probability 2.73% 2.01% 2.73% 2.01%
66
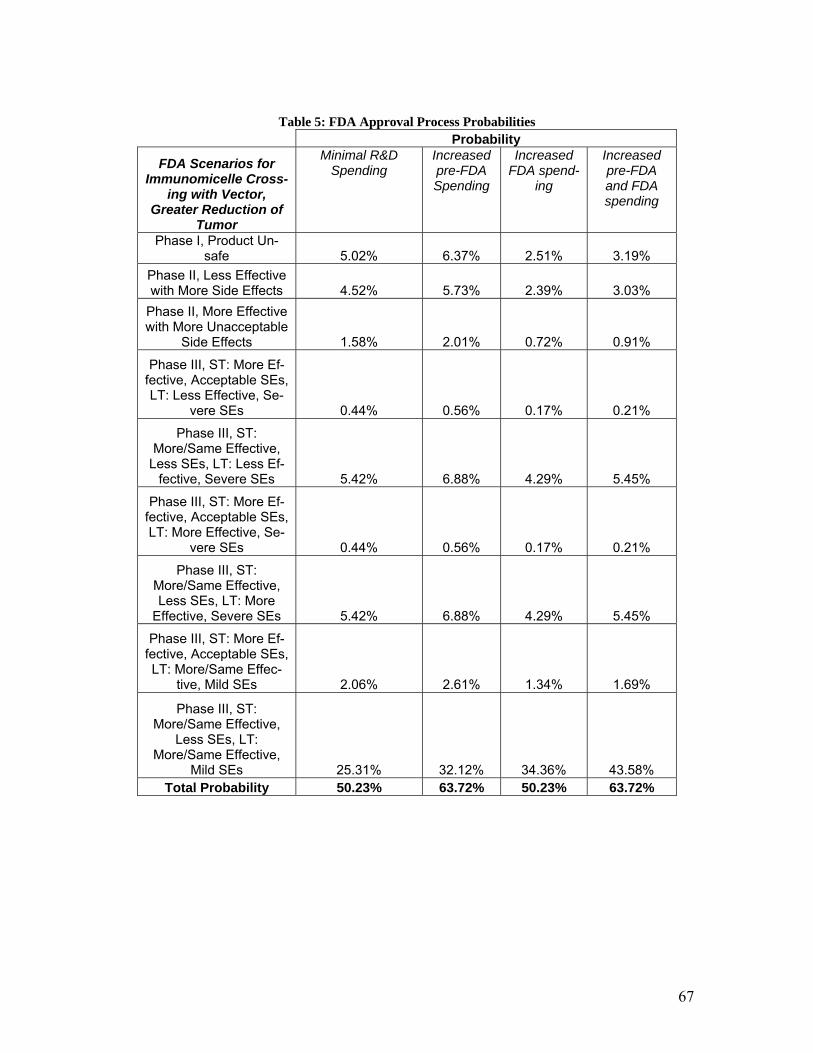
Table 5: FDA Approval Process Probabilities
Probability
FDA Scenarios for Immunomicelle Cross-
ing with Vector, Greater Reduction of
Tumor
Minimal R&D Spending
Increased pre-FDA Spending
Increased FDA spend-
ing
Increased pre-FDA and FDA spending
Phase I, Product Un-safe 5.02% 6.37% 2.51% 3.19%
Phase II, Less Effective with More Side Effects 4.52% 5.73% 2.39% 3.03%
Phase II, More Effective with More Unacceptable
Side Effects 1.58% 2.01% 0.72% 0.91%
Phase III, ST: More Ef-fective, Acceptable SEs, LT: Less Effective, Se-
vere SEs 0.44% 0.56% 0.17% 0.21%
Phase III, ST: More/Same Effective,
Less SEs, LT: Less Ef-fective, Severe SEs 5.42% 6.88% 4.29% 5.45%
Phase III, ST: More Ef-fective, Acceptable SEs, LT: More Effective, Se-
vere SEs 0.44% 0.56% 0.17% 0.21%
Phase III, ST: More/Same Effective, Less SEs, LT: More
Effective, Severe SEs 5.42% 6.88% 4.29% 5.45%
Phase III, ST: More Ef-fective, Acceptable SEs, LT: More/Same Effec-
tive, Mild SEs 2.06% 2.61% 1.34% 1.69%
Phase III, ST: More/Same Effective,
Less SEs, LT: More/Same Effective,
Mild SEs 25.31% 32.12% 34.36% 43.58% Total Probability 50.23% 63.72% 50.23% 63.72%
67
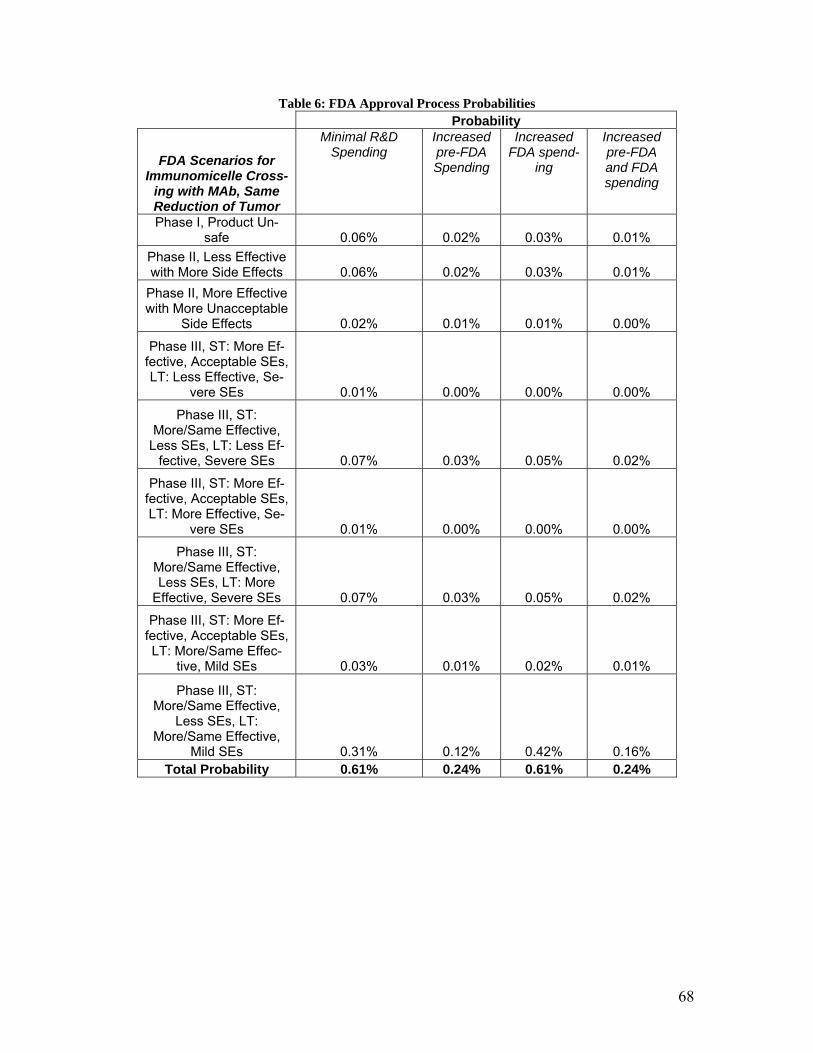
Table 6: FDA Approval Process Probabilities Probability
FDA Scenarios for Immunomicelle Cross-
ing with MAb, Same Reduction of Tumor
Minimal R&D Spending
Increased pre-FDA Spending
Increased FDA spend-
ing
Increased pre-FDA and FDA spending
Phase I, Product Un-safe 0.06% 0.02% 0.03% 0.01%
Phase II, Less Effective with More Side Effects 0.06% 0.02% 0.03% 0.01%
Phase II, More Effective with More Unacceptable
Side Effects 0.02% 0.01% 0.01% 0.00%
Phase III, ST: More Ef-fective, Acceptable SEs, LT: Less Effective, Se-
vere SEs 0.01% 0.00% 0.00% 0.00%
Phase III, ST: More/Same Effective,
Less SEs, LT: Less Ef-fective, Severe SEs 0.07% 0.03% 0.05% 0.02%
Phase III, ST: More Ef-fective, Acceptable SEs, LT: More Effective, Se-
vere SEs 0.01% 0.00% 0.00% 0.00%
Phase III, ST: More/Same Effective, Less SEs, LT: More
Effective, Severe SEs 0.07% 0.03% 0.05% 0.02%
Phase III, ST: More Ef-fective, Acceptable SEs, LT: More/Same Effec-
tive, Mild SEs 0.03% 0.01% 0.02% 0.01%
Phase III, ST: More/Same Effective,
Less SEs, LT: More/Same Effective,
Mild SEs 0.31% 0.12% 0.42% 0.16% Total Probability 0.61% 0.24% 0.61% 0.24%
68
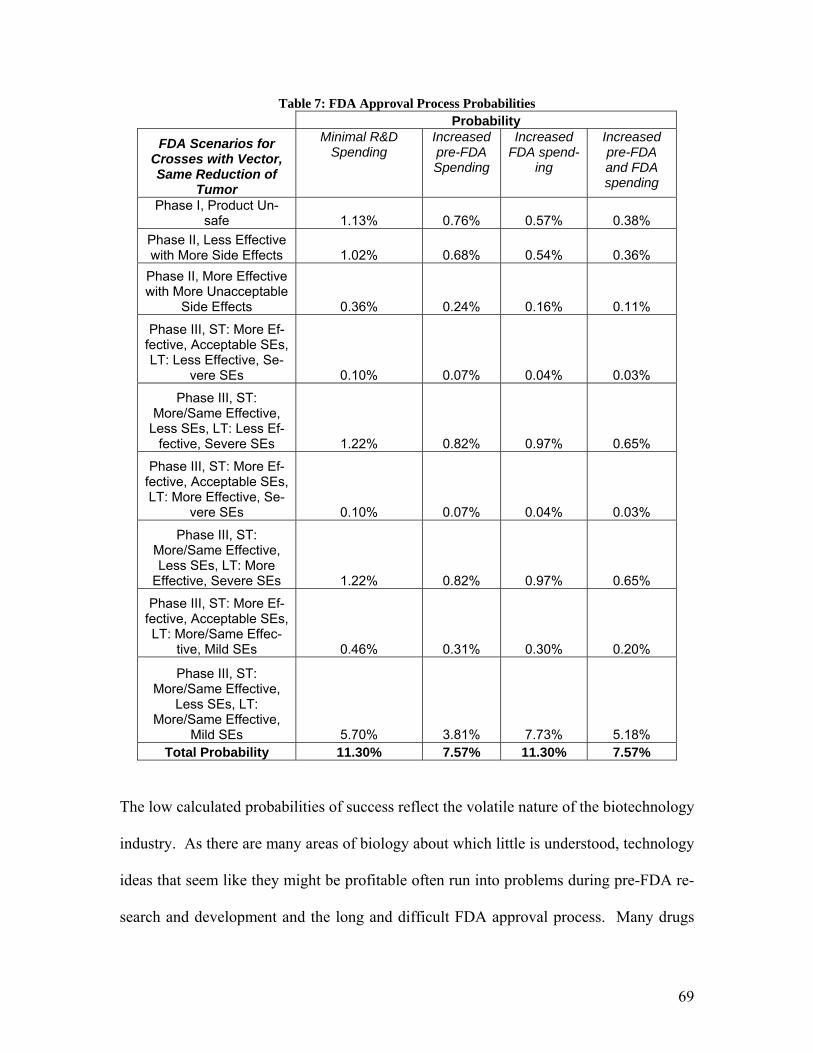
Table 7: FDA Approval Process Probabilities Probability
FDA Scenarios for Crosses with Vector, Same Reduction of
Tumor
Minimal R&D Spending
Increased pre-FDA Spending
Increased FDA spend-
ing
Increased pre-FDA and FDA spending
Phase I, Product Un-safe 1.13% 0.76% 0.57% 0.38%
Phase II, Less Effective with More Side Effects 1.02% 0.68% 0.54% 0.36%
Phase II, More Effective with More Unacceptable
Side Effects 0.36% 0.24% 0.16% 0.11%
Phase III, ST: More Ef-fective, Acceptable SEs, LT: Less Effective, Se-
vere SEs 0.10% 0.07% 0.04% 0.03%
Phase III, ST: More/Same Effective,
Less SEs, LT: Less Ef-fective, Severe SEs 1.22% 0.82% 0.97% 0.65%
Phase III, ST: More Ef-fective, Acceptable SEs, LT: More Effective, Se-
vere SEs 0.10% 0.07% 0.04% 0.03%
Phase III, ST: More/Same Effective, Less SEs, LT: More
Effective, Severe SEs 1.22% 0.82% 0.97% 0.65%
Phase III, ST: More Ef-fective, Acceptable SEs, LT: More/Same Effec-
tive, Mild SEs 0.46% 0.31% 0.30% 0.20%
Phase III, ST: More/Same Effective,
Less SEs, LT: More/Same Effective,
Mild SEs 5.70% 3.81% 7.73% 5.18% Total Probability 11.30% 7.57% 11.30% 7.57%
The low calculated probabilities of success reflect the volatile nature of the biotechnology
industry. As there are many areas of biology about which little is understood, technology
ideas that seem like they might be profitable often run into problems during pre-FDA re-
search and development and the long and difficult FDA approval process. Many drugs
69
enter the FDA approval process and relatively few are approved for sales. Therefore,
there are many more failure scenarios than success scenarios in the pre-FDA and FDA
flowcharts and this business venture has very high risk.
The complete product cost for treatment was determined by calculating the treatment cost
necessary to recover all investments in pre-FDA and FDA research and development test-
ing, facilities, labor, and marketing in three years. The net present value was calculated
with the following formula:
∑= +
−×=
15
1)()1(i
pathtiRTCIsalespriceNPV
The solver function in Excel® was used to find the treatment price necessary to have a net
present value of zero after 3 years of sales for the success scenario with the highest prob-
ability, which is the scenario that the micelle crossing the blood-brain barrier with a vec-
tor and results in a greater reduction of the tumor than the current treatment. The recov-
ery period was set at three years in order to generate enough revenues to recover the ini-
tial investment quickly. The calculated price was equal to around $9,000 with the three
year recovery period, based on annual sales to 7375 patients modified by the appropriate
demand multiplier. The patient cost of the treatment was then set to $15,000 to ensure a
profit margin to compensate for the expensive nature of this project. The expected NPV
for the venture was described by the following chart, wherein the expected net present
values of all possible pathways were arranged from least to greatest, and the associated
probabilities of each pathway were added, forming a cumulative graph of probability vs.
expected NPV shown in Figure 29.
70
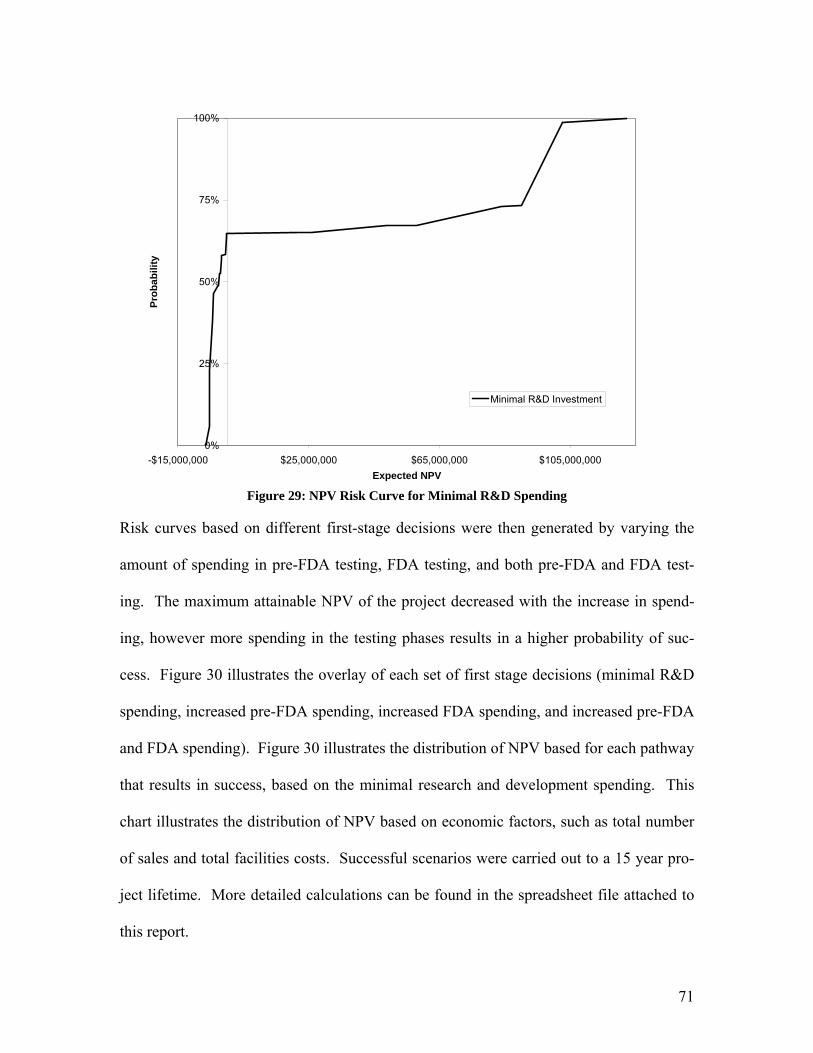
0%
25%
50%
75%
100%
-$15,000,000 $25,000,000 $65,000,000 $105,000,000Expected NPV
Prob
abili
ty
Minimal R&D Investment
Figure 29: NPV Risk Curve for Minimal R&D Spending
Risk curves based on different first-stage decisions were then generated by varying the
amount of spending in pre-FDA testing, FDA testing, and both pre-FDA and FDA test-
ing. The maximum attainable NPV of the project decreased with the increase in spend-
ing, however more spending in the testing phases results in a higher probability of suc-
cess. Figure 30 illustrates the overlay of each set of first stage decisions (minimal R&D
spending, increased pre-FDA spending, increased FDA spending, and increased pre-FDA
and FDA spending). Figure 30 illustrates the distribution of NPV based for each pathway
that results in success, based on the minimal research and development spending. This
chart illustrates the distribution of NPV based on economic factors, such as total number
of sales and total facilities costs. Successful scenarios were carried out to a 15 year pro-
ject lifetime. More detailed calculations can be found in the spreadsheet file attached to
this report.
71
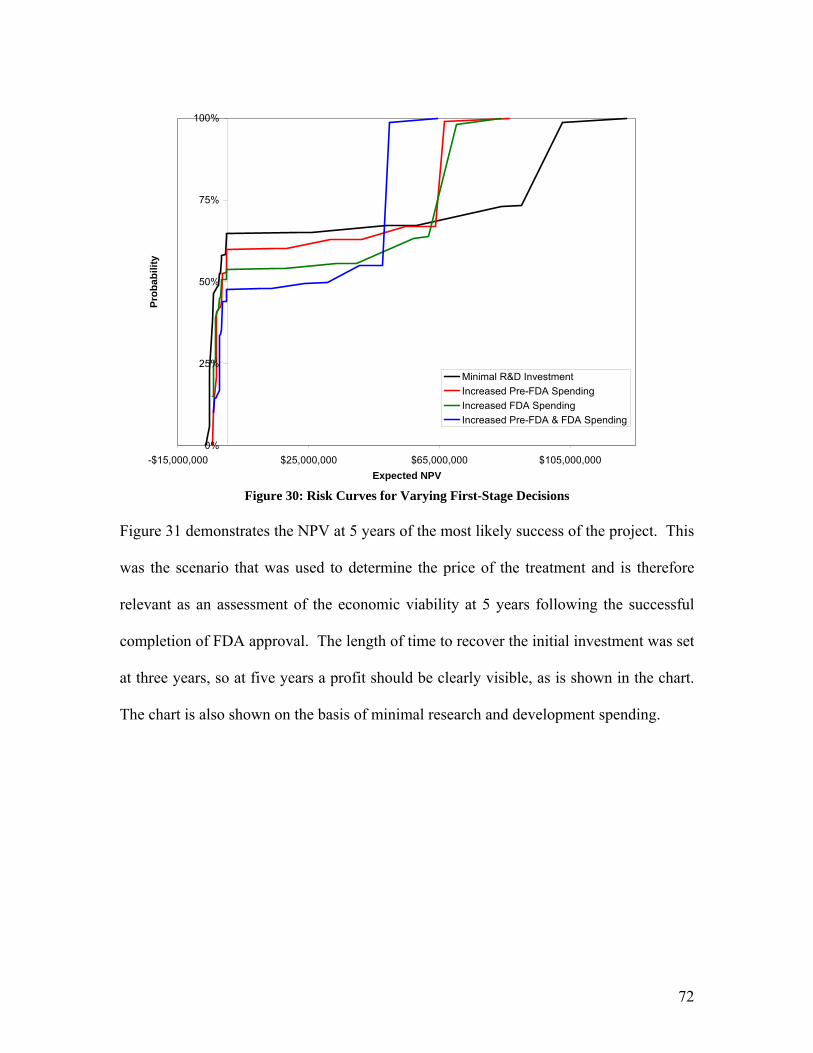
0%
25%
50%
75%
100%
-$15,000,000 $25,000,000 $65,000,000 $105,000,000Expected NPV
Prob
abili
ty
Minimal R&D InvestmentIncreased Pre-FDA SpendingIncreased FDA SpendingIncreased Pre-FDA & FDA Spending
Figure 30: Risk Curves for Varying First-Stage Decisions
Figure 31 demonstrates the NPV at 5 years of the most likely success of the project. This
was the scenario that was used to determine the price of the treatment and is therefore
relevant as an assessment of the economic viability at 5 years following the successful
completion of FDA approval. The length of time to recover the initial investment was set
at three years, so at five years a profit should be clearly visible, as is shown in the chart.
The chart is also shown on the basis of minimal research and development spending.
72
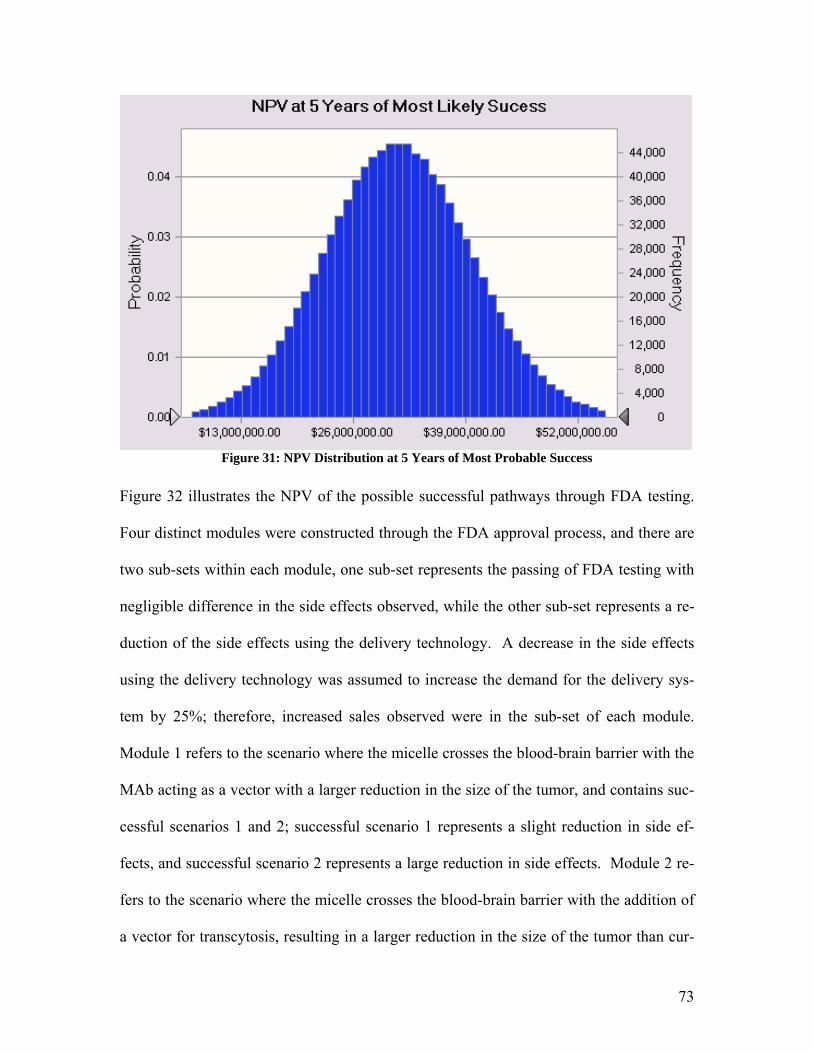
Figure 31: NPV Distribution at 5 Years of Most Probable Success
Figure 32 illustrates the NPV of the possible successful pathways through FDA testing.
Four distinct modules were constructed through the FDA approval process, and there are
two sub-sets within each module, one sub-set represents the passing of FDA testing with
negligible difference in the side effects observed, while the other sub-set represents a re-
duction of the side effects using the delivery technology. A decrease in the side effects
using the delivery technology was assumed to increase the demand for the delivery sys-
tem by 25%; therefore, increased sales observed were in the sub-set of each module.
Module 1 refers to the scenario where the micelle crosses the blood-brain barrier with the
MAb acting as a vector with a larger reduction in the size of the tumor, and contains suc-
cessful scenarios 1 and 2; successful scenario 1 represents a slight reduction in side ef-
fects, and successful scenario 2 represents a large reduction in side effects. Module 2 re-
fers to the scenario where the micelle crosses the blood-brain barrier with the addition of
a vector for transcytosis, resulting in a larger reduction in the size of the tumor than cur-
73
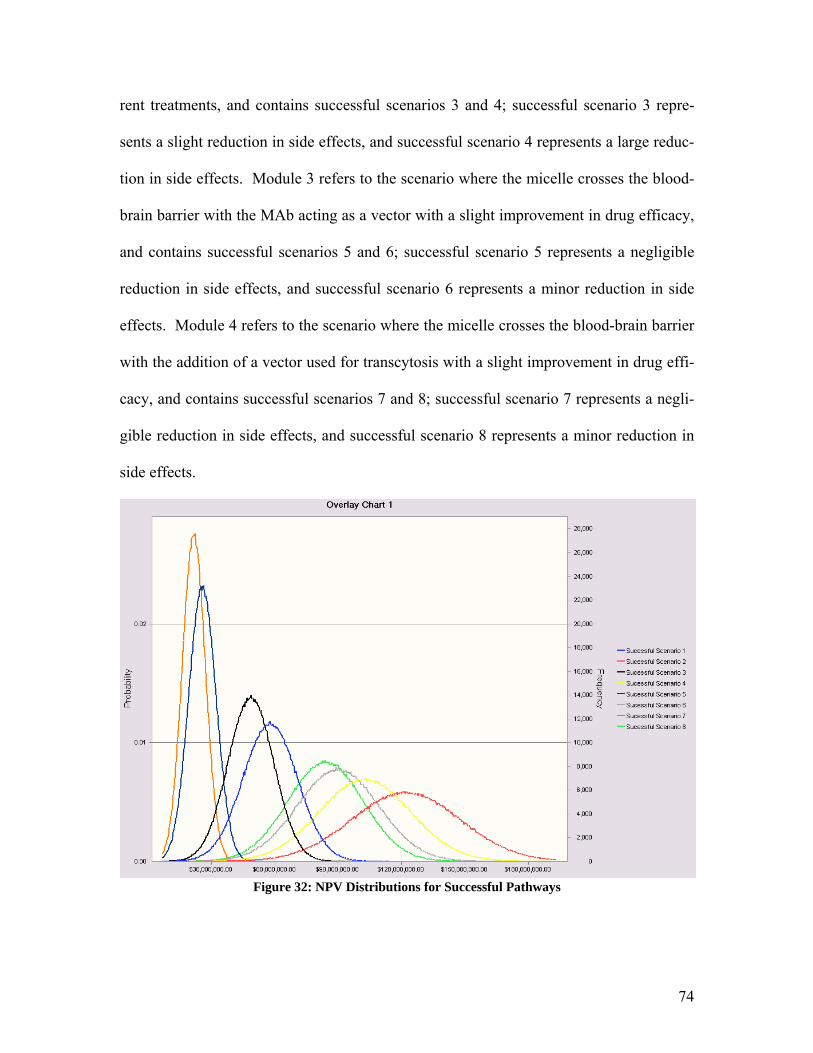
rent treatments, and contains successful scenarios 3 and 4; successful scenario 3 repre-
sents a slight reduction in side effects, and successful scenario 4 represents a large reduc-
tion in side effects. Module 3 refers to the scenario where the micelle crosses the blood-
brain barrier with the MAb acting as a vector with a slight improvement in drug efficacy,
and contains successful scenarios 5 and 6; successful scenario 5 represents a negligible
reduction in side effects, and successful scenario 6 represents a minor reduction in side
effects. Module 4 refers to the scenario where the micelle crosses the blood-brain barrier
with the addition of a vector used for transcytosis with a slight improvement in drug effi-
cacy, and contains successful scenarios 7 and 8; successful scenario 7 represents a negli-
gible reduction in side effects, and successful scenario 8 represents a minor reduction in
side effects.
Figure 32: NPV Distributions for Successful Pathways
74
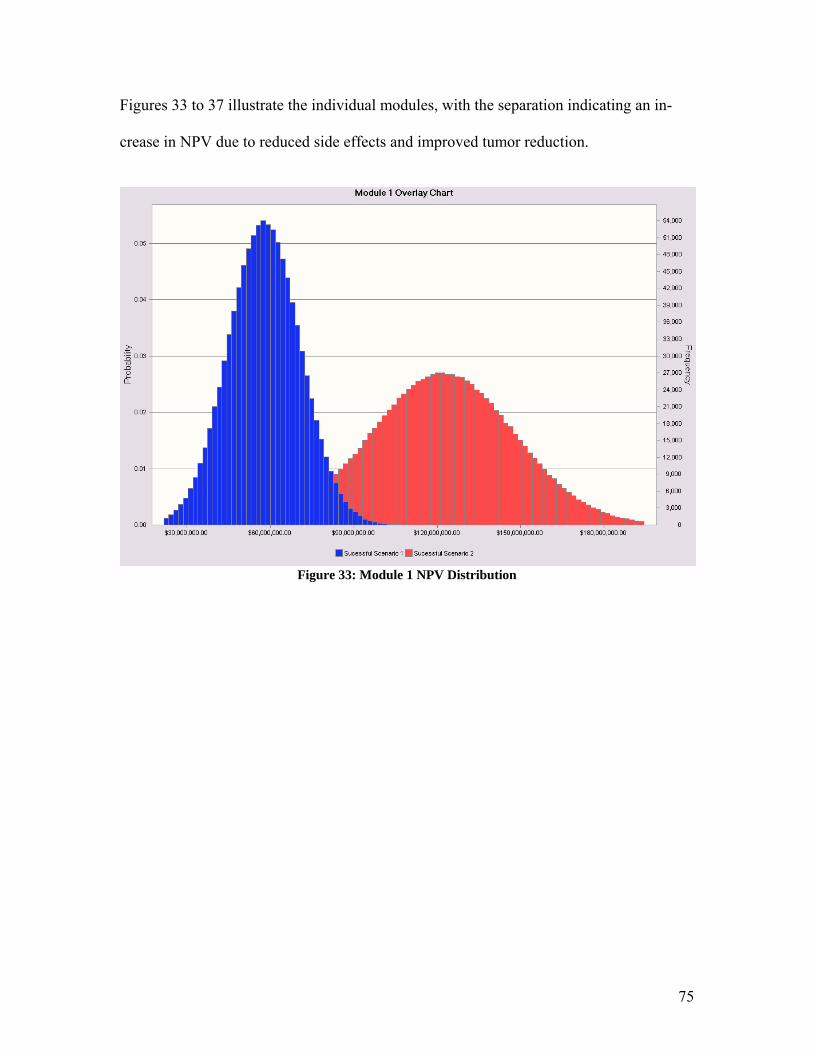
Figures 33 to 37 illustrate the individual modules, with the separation indicating an in-
crease in NPV due to reduced side effects and improved tumor reduction.
Figure 33: Module 1 NPV Distribution
75
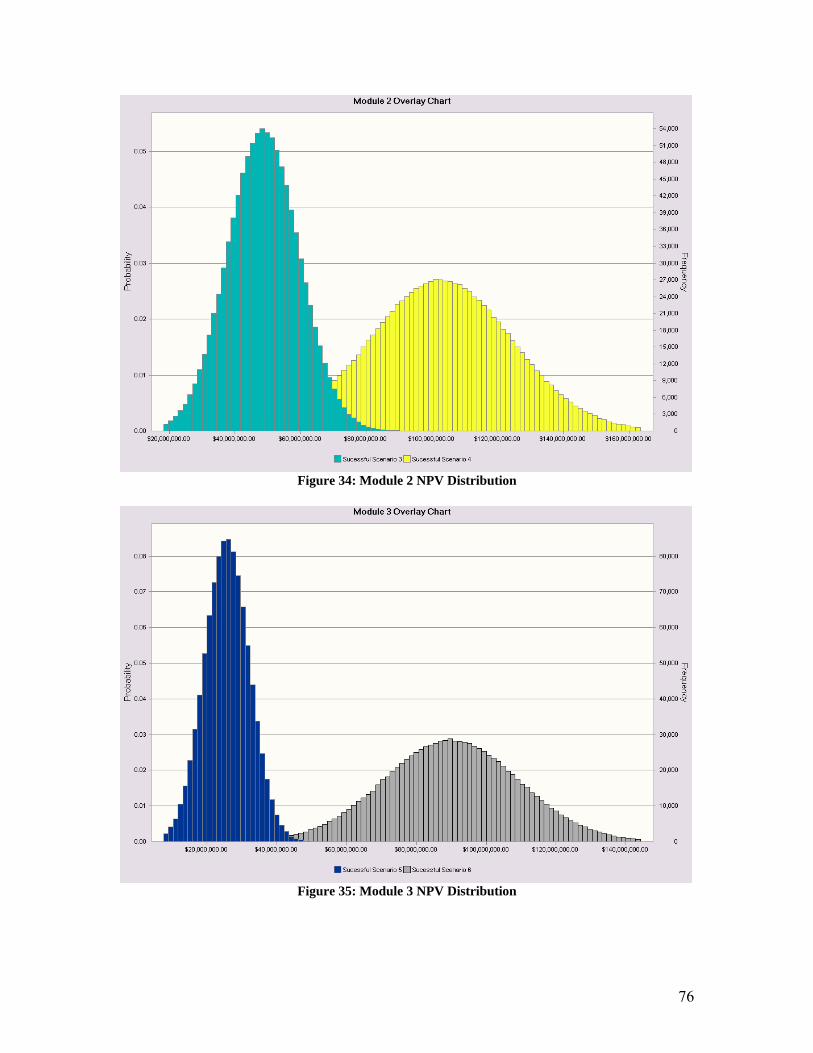
Figure 34: Module 2 NPV Distribution
Figure 35: Module 3 NPV Distribution
76
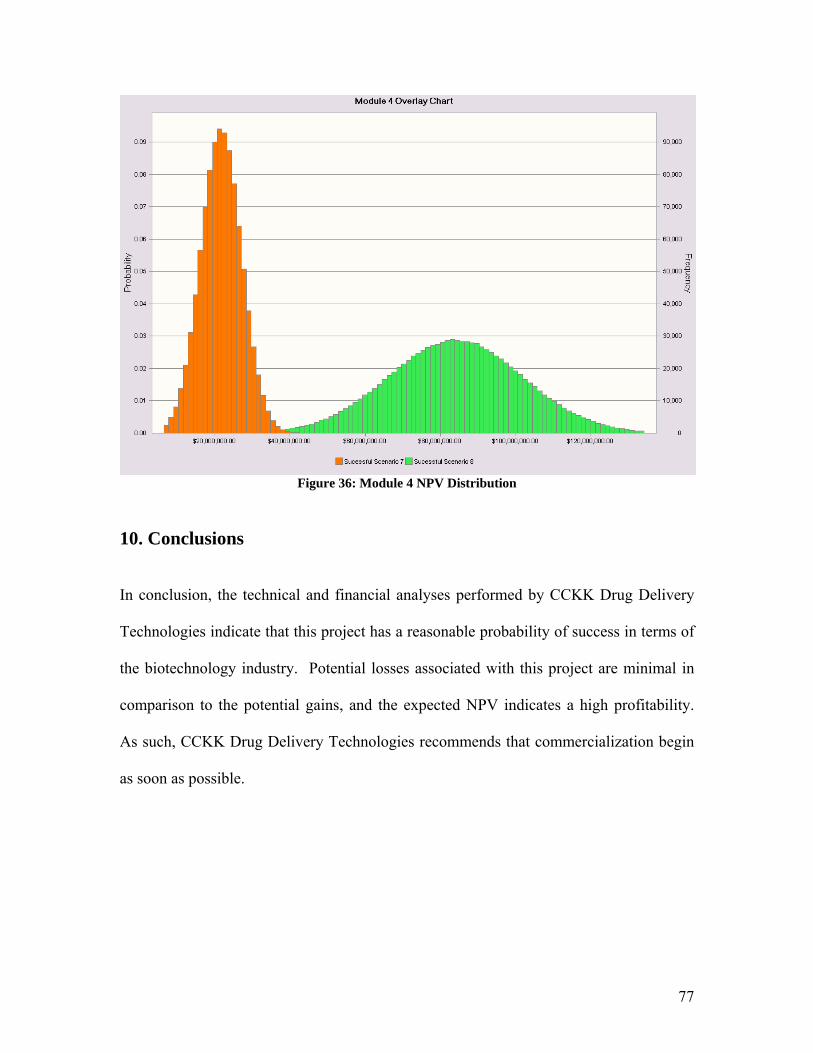
Figure 36: Module 4 NPV Distribution
10. Conclusions
In conclusion, the technical and financial analyses performed by CCKK Drug Delivery
Technologies indicate that this project has a reasonable probability of success in terms of
the biotechnology industry. Potential losses associated with this project are minimal in
comparison to the potential gains, and the expected NPV indicates a high profitability.
As such, CCKK Drug Delivery Technologies recommends that commercialization begin
as soon as possible.
77
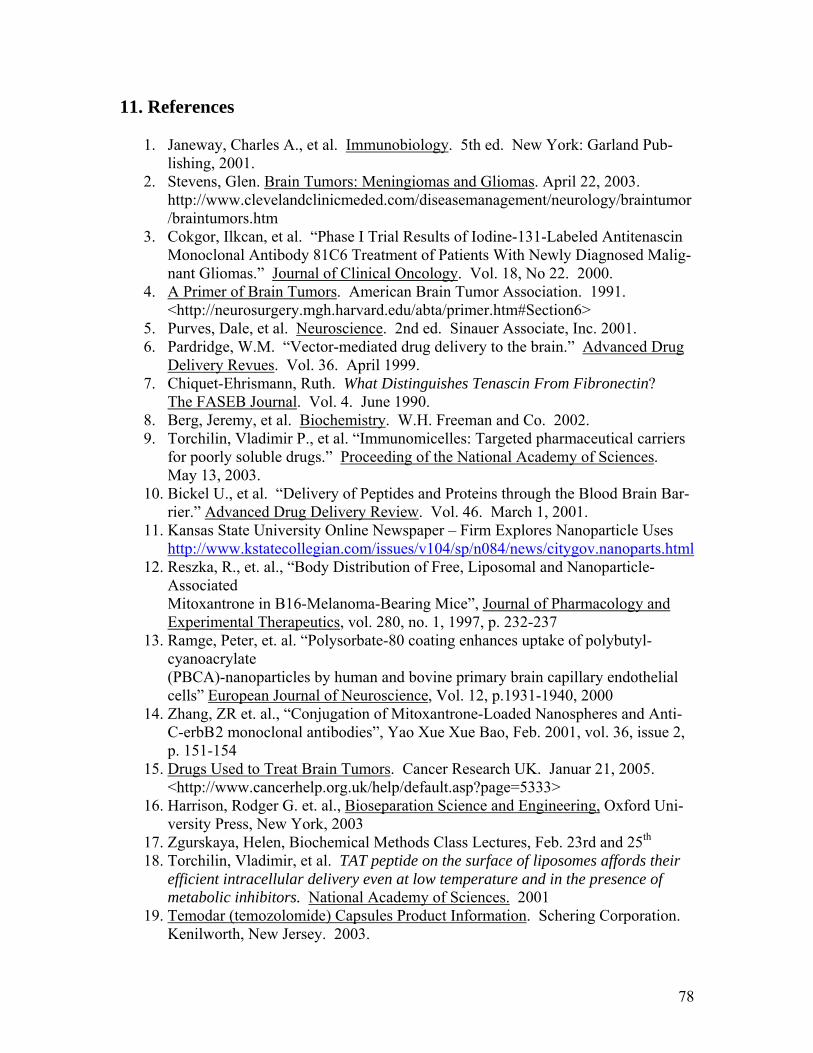
11. References
1. Janeway, Charles A., et al. Immunobiology. 5th ed. New York: Garland Pub-lishing, 2001.
2. Stevens, Glen. Brain Tumors: Meningiomas and Gliomas. April 22, 2003. http://www.clevelandclinicmeded.com/diseasemanagement/neurology/braintumor/braintumors.htm
3. Cokgor, Ilkcan, et al. “Phase I Trial Results of Iodine-131-Labeled Antitenascin Monoclonal Antibody 81C6 Treatment of Patients With Newly Diagnosed Malig-nant Gliomas.” Journal of Clinical Oncology. Vol. 18, No 22. 2000.
4. A Primer of Brain Tumors. American Brain Tumor Association. 1991. <http://neurosurgery.mgh.harvard.edu/abta/primer.htm#Section6>
5. Purves, Dale, et al. Neuroscience. 2nd ed. Sinauer Associate, Inc. 2001. 6. Pardridge, W.M. “Vector-mediated drug delivery to the brain.” Advanced Drug
Delivery Revues. Vol. 36. April 1999. 7. Chiquet-Ehrismann, Ruth. What Distinguishes Tenascin From Fibronectin?
The FASEB Journal. Vol. 4. June 1990. 8. Berg, Jeremy, et al. Biochemistry. W.H. Freeman and Co. 2002. 9. Torchilin, Vladimir P., et al. “Immunomicelles: Targeted pharmaceutical carriers
for poorly soluble drugs.” Proceeding of the National Academy of Sciences. May 13, 2003.
10. Bickel U., et al. “Delivery of Peptides and Proteins through the Blood Brain Bar-rier.” Advanced Drug Delivery Review. Vol. 46. March 1, 2001.
11. Kansas State University Online Newspaper – Firm Explores Nanoparticle Uses http://www.kstatecollegian.com/issues/v104/sp/n084/news/citygov.nanoparts.html
12. Reszka, R., et. al., “Body Distribution of Free, Liposomal and Nanoparticle-Associated Mitoxantrone in B16-Melanoma-Bearing Mice”, Journal of Pharmacology and Experimental Therapeutics, vol. 280, no. 1, 1997, p. 232-237
13. Ramge, Peter, et. al. “Polysorbate-80 coating enhances uptake of polybutyl-cyanoacrylate (PBCA)-nanoparticles by human and bovine primary brain capillary endothelial cells” European Journal of Neuroscience, Vol. 12, p.1931-1940, 2000
14. Zhang, ZR et. al., “Conjugation of Mitoxantrone-Loaded Nanospheres and Anti-C-erbB 2 monoclonal antibodies”, Yao Xue Xue Bao, Feb. 2001, vol. 36, issue 2, p. 151-154
15. Drugs Used to Treat Brain Tumors. Cancer Research UK. Januar 21, 2005. <http://www.cancerhelp.org.uk/help/default.asp?page=5333>
16. Harrison, Rodger G. et. al., Bioseparation Science and Engineering, Oxford Uni-versity Press, New York, 2003
17. Zgurskaya, Helen, Biochemical Methods Class Lectures, Feb. 23rd and 25th 18. Torchilin, Vladimir, et al. TAT peptide on the surface of liposomes affords their
efficient intracellular delivery even at low temperature and in the presence of metabolic inhibitors. National Academy of Sciences. 2001
19. Temodar (temozolomide) Capsules Product Information. Schering Corporation. Kenilworth, New Jersey. 2003.
78
20. Schmidt, Karl, et al. Volume Reconstruction Techniques Improve the Correlation Between Histological and in vivo Tumor Volume Measurements in Mouse Mod-els of Human Gliomas. Journal of Neuro-Oncology. Kluwer Academic Publish-ers. 2004.
21. Strain: NU/J. The Jackson Laboratory. <http://jaxmice.jax.org/jaxmice-cgi/jaxmicedb.cgi?objtype=pricedetail&stock=002019&dest=U>
22. American Type Culture Collection. <http://www.atcc.org/SearchCatalogs/Search.cfm> 2005.
23. Walsh, Gary Ph.D. Modern Antibody-Based Therapeutics. Biopharm Interna-tional. Volume 17, Number 12. pp. 18-25. Advanstar Communications Publica-tion. December 2004.
24. Elder, Melissa. Monoclonal Antibodies for Cancer. Biopharm International. Volume 17, Number 11. pp 66. Advanstar Communications Publication. No-vember 2004.
25. Best Hospitals 2004 – Cancer. US News. Online Source. http://www.usnews.com/usnews/health/hosptl/rankings/specihqcanc.htm 3/7/2005
26. NIH Awards to all Intitutions by Rank 1-100, Fiscal Year 2003. Online Source. http://grants1.nih.gov/grants/award/trends/rnk03all1to100.html 3/7/2005.
27. NIH Research Grants Average Cost for Competing and Non-competing Awards Fiscal Years 1998-2003. Online Source http://grants1.nih.gov/grants/award/research/RGAVG9803.htm 3/7/2005
28. Keating, Rick. Conceptualizing, Making, and Selling the Brand. Biopharm In-ternational. Volume 18, Number 1. pp 48-49. Advanstar Communications Pub-lication. January 2005.
29. Bickel, Ulrich, et al. Pharmacologic effects in vivo in brain by vector-mediated peptide drug delivery. Proceedings of the National Academy of Science. 1992.
30. Huwyler, Jorg, et al. Brain Drug Delivery of Small Molecules Using Immunoli-posomes. Proceedings of the National Academy of Sciences. Neurobiology. 1996.
31. Temodar Product Information, Schering Corporation, 2003 32. Blinkov, Samuil M., and Il-ya I. Glezer, eds. The Human Brain in Figures and
Tables: A Quantitative Handbook. Moscow: Basic Books, Inc, 1968 33. Freitas, Robert A., Jr. Nanomedicine: Volume I: Basic Capabilities. George-
town, TX: Landes Bioscience, 1999 34. Welling, Peter G. Pharmacokinetics Processes and Mathematics. Washington,
DC: ASC Monograph, 1986. 35. Makoid, Michael, et. al., Basic Pharmacokinetics, Creighten University
http://pharmacy.creighton.edu/pha443/pdf/mammillary%20models.pdf 36. “Census Bureau Projects Nation's Population to Total 295 Million on New Year's
Day” Online Source. 2005. http://www.census.gov/Press-Release/www/releases/archives/population/003161.html
37. Zhang, ZR et. al., “Conjugation of Mitoxantrone-Loaded Nanospheres and Anti-C-erbB 2 monoclonal antibodies”, Yao Xue Xue Bao, Feb. 2001, vol. 36, issue 2, p. 151-154
79
38. Alyautdin, Renad N., et. al., “Delivery of Loperamide Across the Blood-Brain Barrier with Polysorbate 80 Coated Polybutylcyanoacrylate Nanoparticles”, Pharmaceutical Research, 1997, vol. 14, no. 3, p.325-328
39. Garcia, M. L., et. al., “Stability and ocular tolerance of cyclophophamide-loaded nanospheres”, Journal of Microencapsulation, March 2004, vol. 21, no. 2, p. 213-223
40. Ramge, Peter, et. al. “Polysorbate-80 coating enhances uptake of polybutyl-cyanoacrylate (PBCA)-nanoparticles by human and bovine primary brain capil-lary endothelial cells” European Journal of Neuroscience, Vol. 12, p.1931-1940, 2000
80
A1. Appendix 1 A1.1 Nanoparticles
Nanosphere/monoclonal antibody conjugates have been created by Dr. ZR Zhang and
colleagues in China on the laboratory scale to deliver the toxin mitoxantrone to mammary
cancer cells.37 However, these have only been created and tested for antibody specificity,
and no studies have been done using these conjugates to improve drug delivery in vitro or
in vivo. They have also not yet been used to cross the blood-brain barrier and deliver
cancer treatment toxins to brain tumors. However, polysorbate 80 coated nanoparticles
have been shown to effectively cross the blood brain barrier in in vitro and in vivo stud-
ies.38 There is no current work to bind a monoclonal antibody to polysorbate 80 coated
nanoparticles. The attachment of a monoclonal antibody could make this a more effec-
tive cancer treatment drug delivery system by improving targeting of treatment to the tu-
mor cells in the brain. Since monoclonal antibody 81C6 selectively binds to tenascin,
which is present on an extracellular matrix protein common in gliomas cancer tissue, it
would increase the amount of toxin delivered to the tumor and decrease the relative
amount of toxin found throughout the body. If the nanoparticle is designed to break
down and release the toxin between 36 and 72 hours after entering the body, it would al-
low for toxin delivery only to cancerous brain cells to which the antibody 81C6 binds,
while the toxin containing nanoparticles would be mostly cleared out of the rest of the
body before toxin release. However, designing a nanoparticle that would accomplish this
goal proved very difficult based on the limited amount of information available about the
diffusion of nanoparticles in vivo and on the problems with attaching the antibody to the
nanoparticle. These problems are explained in detail in section three of this appendix.
81
A1.2 Production of Nanoparticles
Polybutylcyanoacrylate nanoparticles are prepared by emulsion polymerization. This in-
volves the suspension of small globules of one liquid in a second liquid in which the first
liquid is insoluble. The polymerization takes place in a mixture of water and ethanol, as
the monomer butylcyanoacrylate is not soluble in this aqueous mixture. Poloxamer 188
and sodium sulfate were added as stabilizers. The toxin is added to this mixture at a con-
centration of 0.1% (m/v). Polybutylcyanoacrylate is then added dropwise to the solution.
The mixture is then stirred for four hours at room temperature with a magnetic stirrer at
400 rpm. The solution pH is then adjusted to 6.0 +/- 0.5 with sodium hydroxide and
stirred for another hour. The suspension is then filtered and the ethanol is removed under
a vacuum until an aqueous suspension of nanoparticles remains. Mannitol is then added
and the nanoparticles are freeze-dried for twenty four hours under vacuum. The product
is then homogeneously dispersed in phosphate buffered saline (PBS) solution by ultra-
sonification, or the dispersion of product in the solution by sound wave energy. Accord-
ing to Renad N. Alyautdin and colleagues, polysorbate 80 is then added and the mixture
is incubated for 30 minutes.38
A1.3 Problems with Nanoparticle Treatment
1. Drug Release Time – Polysorbate 80 coated nanoparticles are a very new idea,
and little research has been done into the drug release time in vivo. According to
Dr. M. L. Garcia and colleagues, an in vitro study of polymer nanoparticle degra-
dation indicates that it could take weeks.39 This would be too long for this treat-
ment because the antibody would degrade and the nanoparticle would be washed
out of the brain before drug release. However, this study is not indicative of the
82
drug release time in vivo. Enzymes and other biomolecules in the brain will inter-
act with the nanoparticle and will likely cause it to degrade in chunks in the brain,
which is a difficult process to effectively model. Therefore, extensive research
will be necessary to determine the appropriate nanoparticle thickness, and the
thickness may or may not have a significant impact on release time if there are
significant interactions between the polysorbate 80 coating and the polybutyl-
cyanoacrylate coating and enzymes in the brain. Thus it is not possible to predict
with any certainty the likelihood of toxin release between 36 and 79 hours. This
is the timeframe between the exit of the antibody from the body and from the exit
of the antibody from the brain.
2. Particle Size – The nanoparticle must be small enough to cross the blood-brain
barrier. Research results from Dr. Peter Ramge and colleagues in Germany indi-
cate that 450 nm is an appropriate maximum particle diameter for crossing the
blood-brain barrier.40 This would correspond to a particle radius of 225 nm. The
total radius of the particle is modeled with the following equation:
PSPBCAT rrr +=
where rt is the total nanoparticle radius, rPBCA is the radius of the polybutyl-
cyanoacrylate nanoparticles before the addition of polysorbate 80, and rPS is the
thickness of the polysorbate coating. Research results indicate that rPBCA is gener-
ally around 150 nm.40 Therefore, the maximum polysorbate thickness possible is
around 75 nm.
83
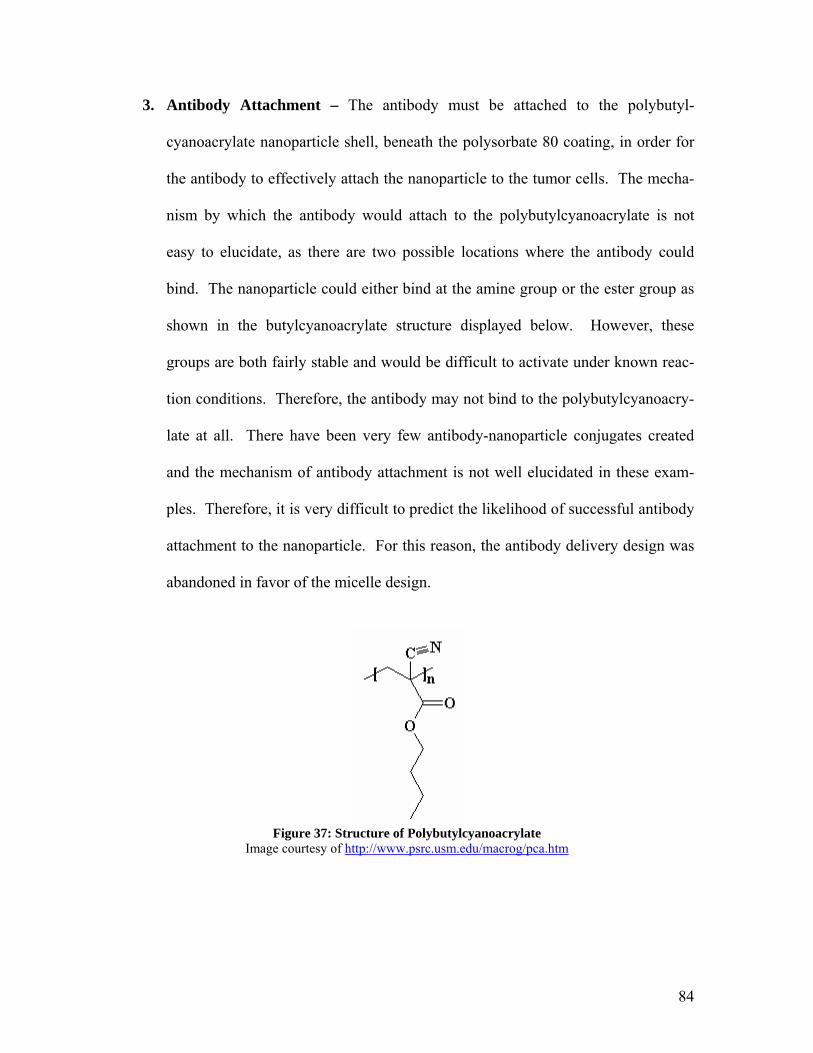
3. Antibody Attachment – The antibody must be attached to the polybutyl-
cyanoacrylate nanoparticle shell, beneath the polysorbate 80 coating, in order for
the antibody to effectively attach the nanoparticle to the tumor cells. The mecha-
nism by which the antibody would attach to the polybutylcyanoacrylate is not
easy to elucidate, as there are two possible locations where the antibody could
bind. The nanoparticle could either bind at the amine group or the ester group as
shown in the butylcyanoacrylate structure displayed below. However, these
groups are both fairly stable and would be difficult to activate under known reac-
tion conditions. Therefore, the antibody may not bind to the polybutylcyanoacry-
late at all. There have been very few antibody-nanoparticle conjugates created
and the mechanism of antibody attachment is not well elucidated in these exam-
ples. Therefore, it is very difficult to predict the likelihood of successful antibody
attachment to the nanoparticle. For this reason, the antibody delivery design was
abandoned in favor of the micelle design.
Figure 37: Structure of Polybutylcyanoacrylate
Image courtesy of http://www.psrc.usm.edu/macrog/pca.htm
84
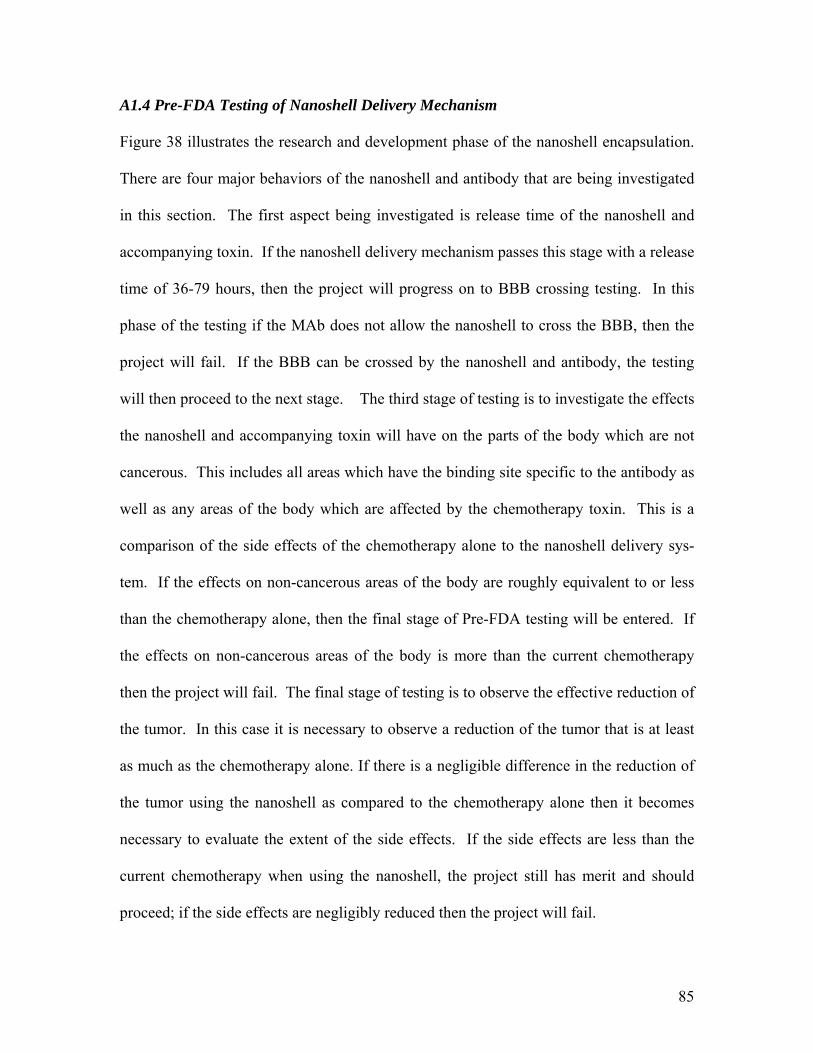
85
A1.4 Pre-FDA Testing of Nanoshell Delivery Mechanism
Figure 38 illustrates the research and development phase of the nanoshell encapsulation.
There are four major behaviors of the nanoshell and antibody that are being investigated
in this section. The first aspect being investigated is release time of the nanoshell and
accompanying toxin. If the nanoshell delivery mechanism passes this stage with a release
time of 36-79 hours, then the project will progress on to BBB crossing testing. In this
phase of the testing if the MAb does not allow the nanoshell to cross the BBB, then the
project will fail. If the BBB can be crossed by the nanoshell and antibody, the testing
will then proceed to the next stage. The third stage of testing is to investigate the effects
the nanoshell and accompanying toxin will have on the parts of the body which are not
cancerous. This includes all areas which have the binding site specific to the antibody as
well as any areas of the body which are affected by the chemotherapy toxin. This is a
comparison of the side effects of the chemotherapy alone to the nanoshell delivery sys-
tem. If the effects on non-cancerous areas of the body are roughly equivalent to or less
than the chemotherapy alone, then the final stage of Pre-FDA testing will be entered. If
the effects on non-cancerous areas of the body is more than the current chemotherapy
then the project will fail. The final stage of testing is to observe the effective reduction of
the tumor. In this case it is necessary to observe a reduction of the tumor that is at least
as much as the chemotherapy alone. If there is a negligible difference in the reduction of
the tumor using the nanoshell as compared to the chemotherapy alone then it becomes
necessary to evaluate the extent of the side effects. If the side effects are less than the
current chemotherapy when using the nanoshell, the project still has merit and should
proceed; if the side effects are negligibly reduced then the project will fail.
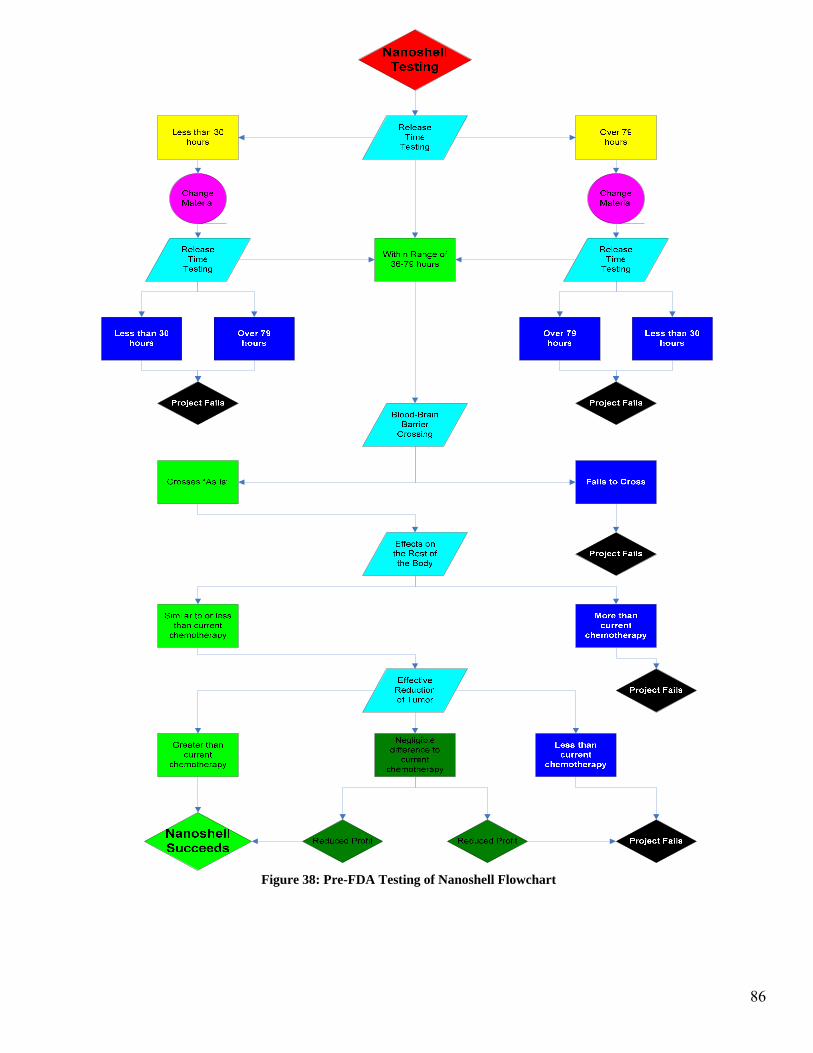
Figure 38: Pre-FDA Testing of Nanoshell Flowchart
86
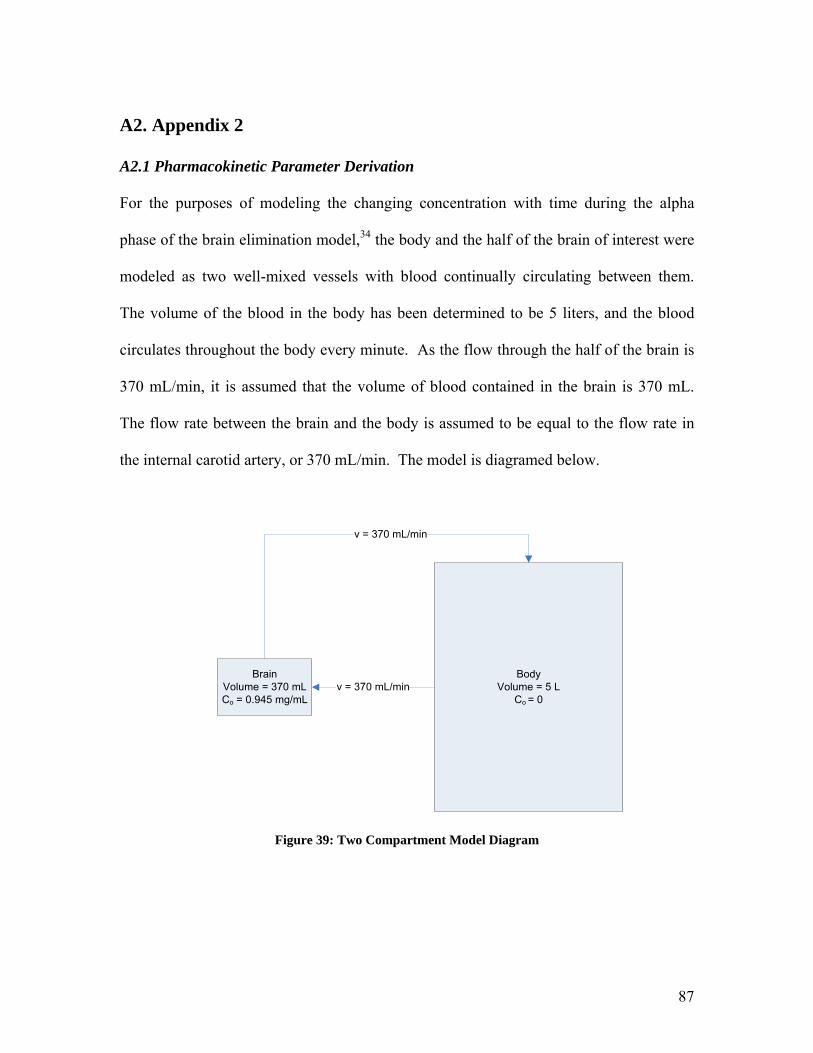
A2. Appendix 2
A2.1 Pharmacokinetic Parameter Derivation
For the purposes of modeling the changing concentration with time during the alpha
phase of the brain elimination model,34 the body and the half of the brain of interest were
modeled as two well-mixed vessels with blood continually circulating between them.
The volume of the blood in the body has been determined to be 5 liters, and the blood
circulates throughout the body every minute. As the flow through the half of the brain is
370 mL/min, it is assumed that the volume of blood contained in the brain is 370 mL.
The flow rate between the brain and the body is assumed to be equal to the flow rate in
the internal carotid artery, or 370 mL/min. The model is diagramed below.
BrainVolume = 370 mLCo = 0.945 mg/mL
BodyVolume = 5 L
Co = 0v = 370 mL/min
v = 370 mL/min
Figure 39: Two Compartment Model Diagram
87
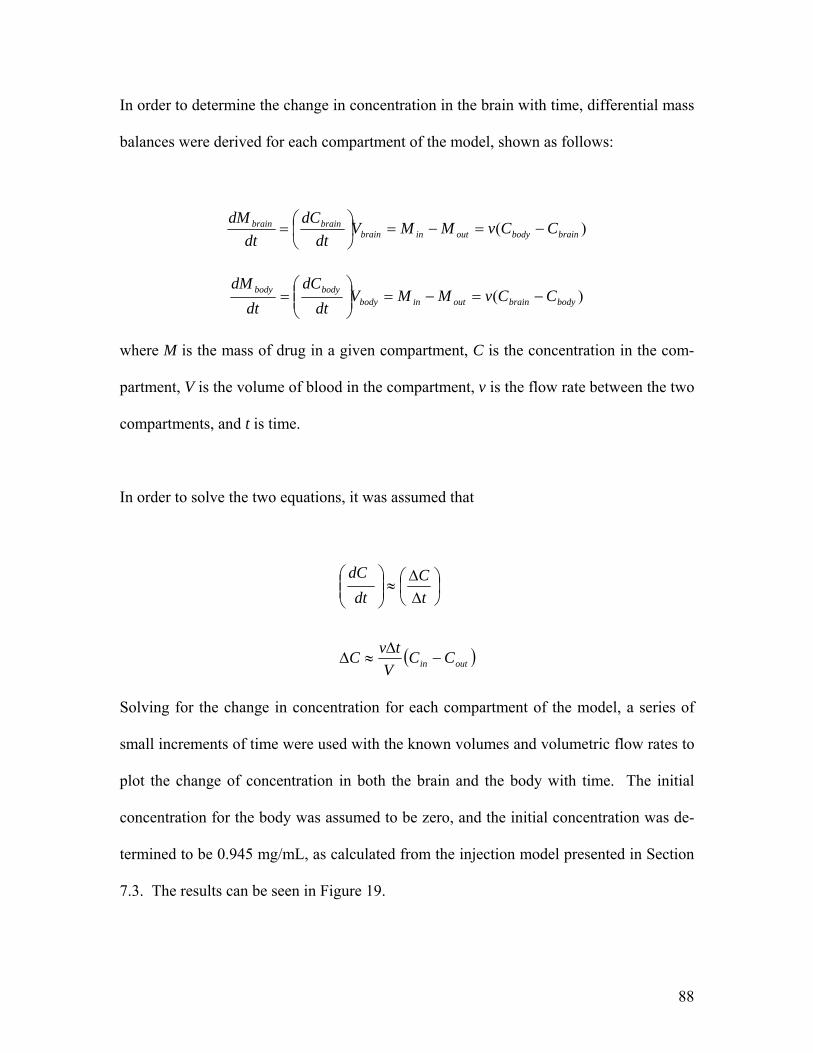
In order to determine the change in concentration in the brain with time, differential mass
balances were derived for each compartment of the model, shown as follows:
)( brainbodyoutinbrainbrainbrain CCvMMV
dtdC
dtdM
−=−=⎟⎠⎞
⎜⎝⎛=
)( bodybrainoutinbodybodybody CCvMMV
dtdC
dtdM
−=−=⎟⎟⎠
⎞⎜⎜⎝
⎛=
where M is the mass of drug in a given compartment, C is the concentration in the com-
partment, V is the volume of blood in the compartment, v is the flow rate between the two
compartments, and t is time.
In order to solve the two equations, it was assumed that
( )outin CCV
tvC
tC
dtdC
−∆
≈∆
⎟⎠⎞
⎜⎝⎛∆∆
≈⎟⎟⎠
⎞⎜⎜⎝
⎛
Solving for the change in concentration for each compartment of the model, a series of
small increments of time were used with the known volumes and volumetric flow rates to
plot the change of concentration in both the brain and the body with time. The initial
concentration for the body was assumed to be zero, and the initial concentration was de-
termined to be 0.945 mg/mL, as calculated from the injection model presented in Section
7.3. The results can be seen in Figure 19.
88
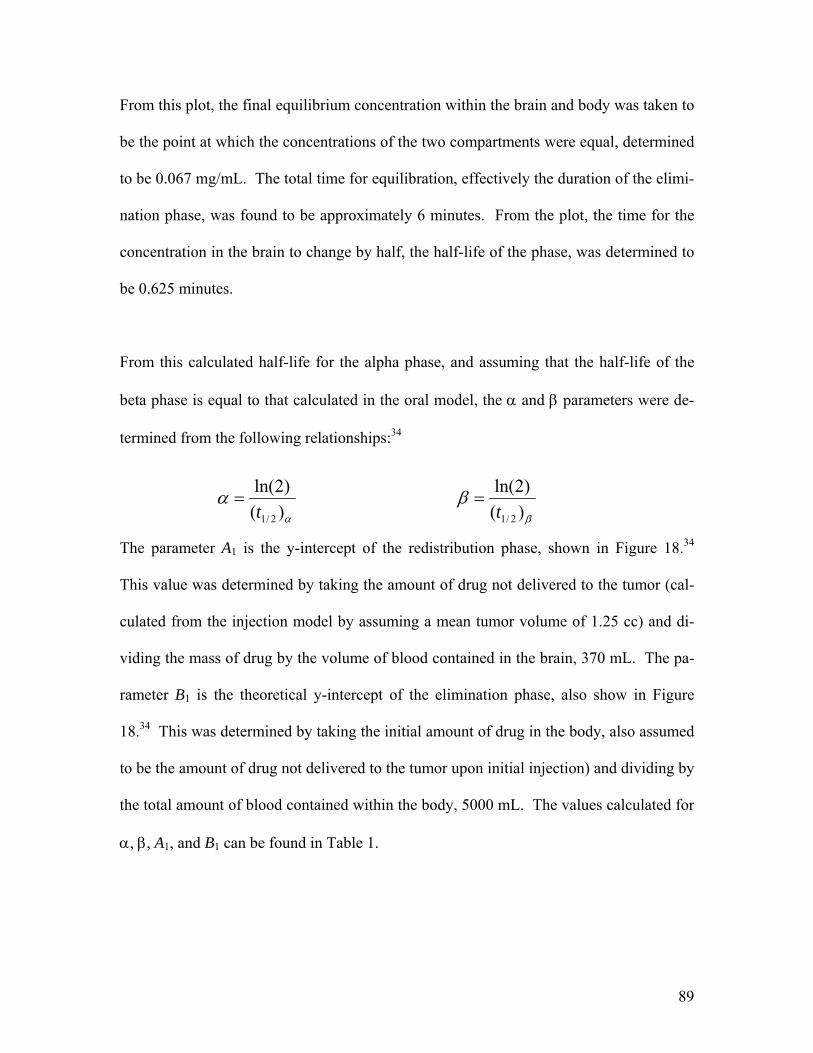
From this plot, the final equilibrium concentration within the brain and body was taken to
be the point at which the concentrations of the two compartments were equal, determined
to be 0.067 mg/mL. The total time for equilibration, effectively the duration of the elimi-
nation phase, was found to be approximately 6 minutes. From the plot, the time for the
concentration in the brain to change by half, the half-life of the phase, was determined to
be 0.625 minutes.
From this calculated half-life for the alpha phase, and assuming that the half-life of the
beta phase is equal to that calculated in the oral model, the α and β parameters were de-
termined from the following relationships:34
α
α)()2ln(
2/1t=
β
β)()2ln(
2/1t=
The parameter A1 is the y-intercept of the redistribution phase, shown in Figure 18.34
This value was determined by taking the amount of drug not delivered to the tumor (cal-
culated from the injection model by assuming a mean tumor volume of 1.25 cc) and di-
viding the mass of drug by the volume of blood contained in the brain, 370 mL. The pa-
rameter B1 is the theoretical y-intercept of the elimination phase, also show in Figure
18.34 This was determined by taking the initial amount of drug in the body, also assumed
to be the amount of drug not delivered to the tumor upon initial injection) and dividing by
the total amount of blood contained within the body, 5000 mL. The values calculated for
α, β, A1, and B1 can be found in Table 1.
89
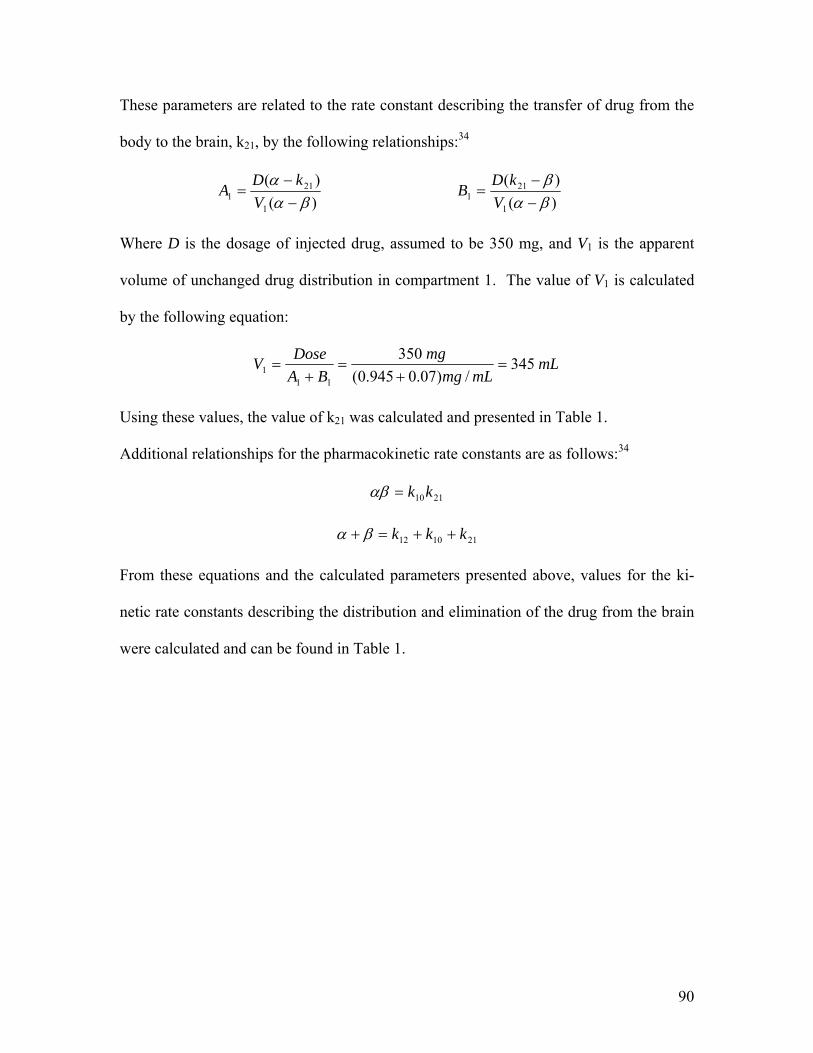
These parameters are related to the rate constant describing the transfer of drug from the
body to the brain, k21, by the following relationships:34
)()(
1
211 βα
α−−
=V
kDA )()(
1
211 βα
β−−
=V
kDB
Where D is the dosage of injected drug, assumed to be 350 mg, and V1 is the apparent
volume of unchanged drug distribution in compartment 1. The value of V1 is calculated
by the following equation:
mLmLmg
mgBA
DoseV 345/)07.0945.0(
350
111 =
+=
+=
Using these values, the value of k21 was calculated and presented in Table 1.
Additional relationships for the pharmacokinetic rate constants are as follows:34
2110kk=αβ
211012 kkk ++=+ βα
From these equations and the calculated parameters presented above, values for the ki-
netic rate constants describing the distribution and elimination of the drug from the brain
were calculated and can be found in Table 1.
90
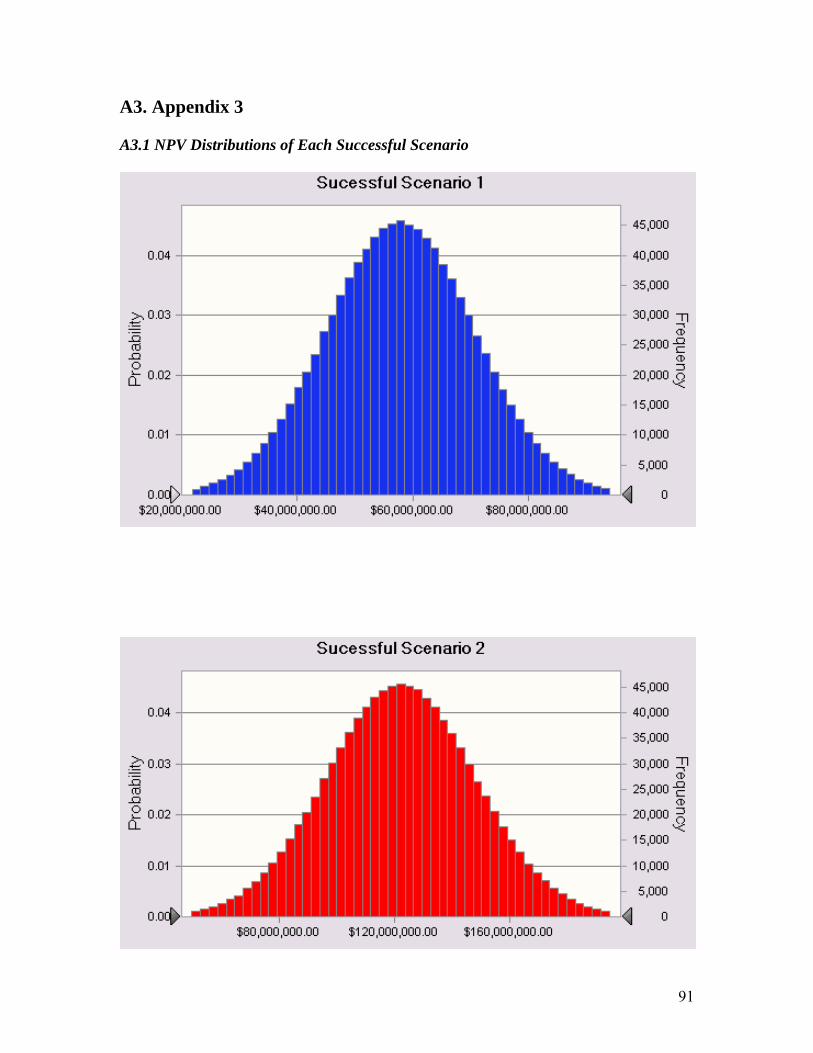
A3. Appendix 3 A3.1 NPV Distributions of Each Successful Scenario
91
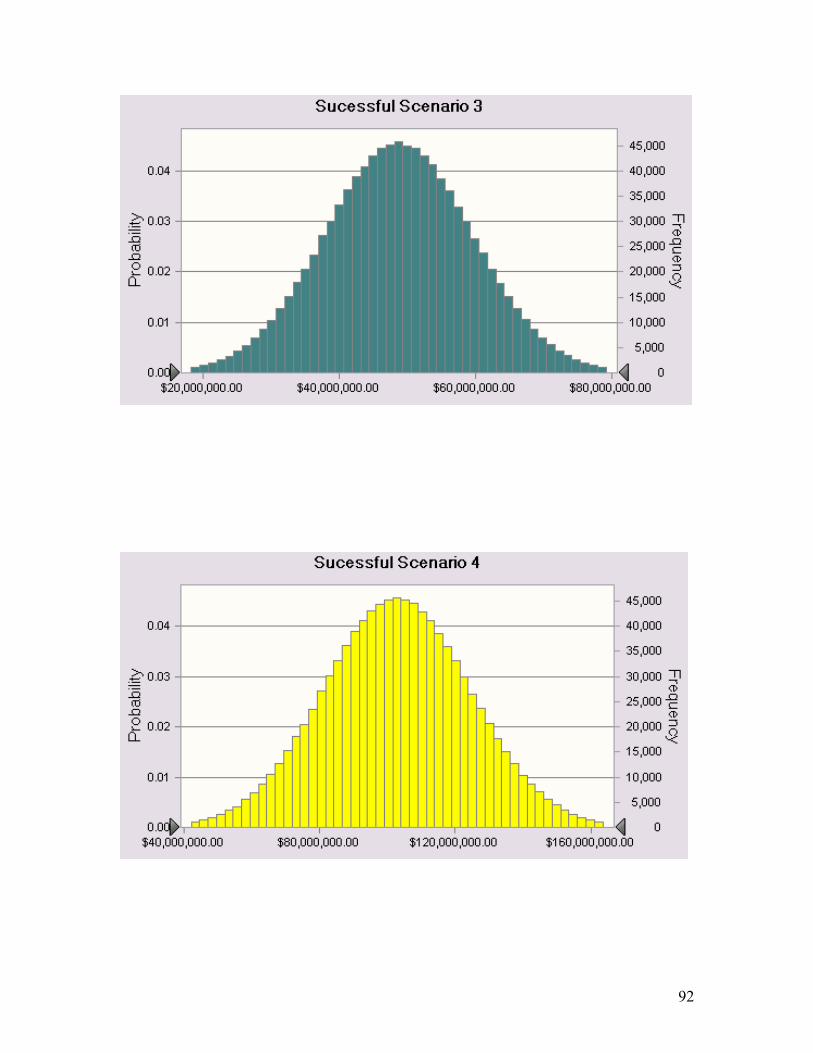
92
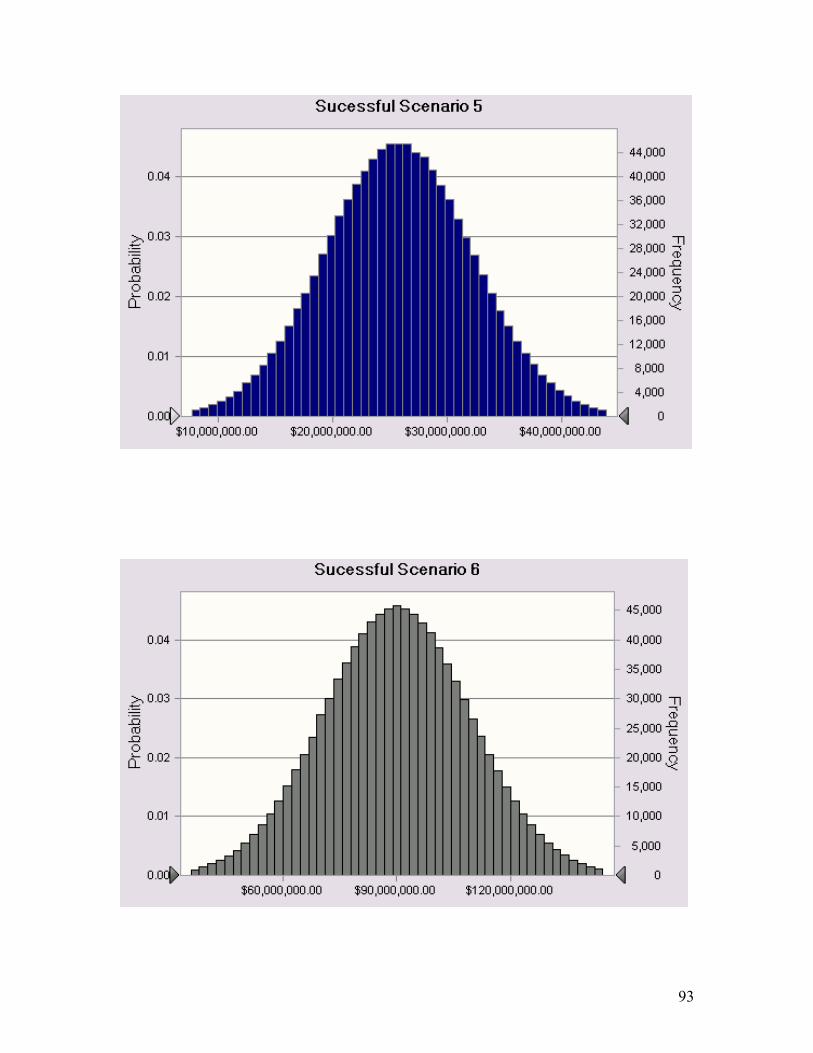
93
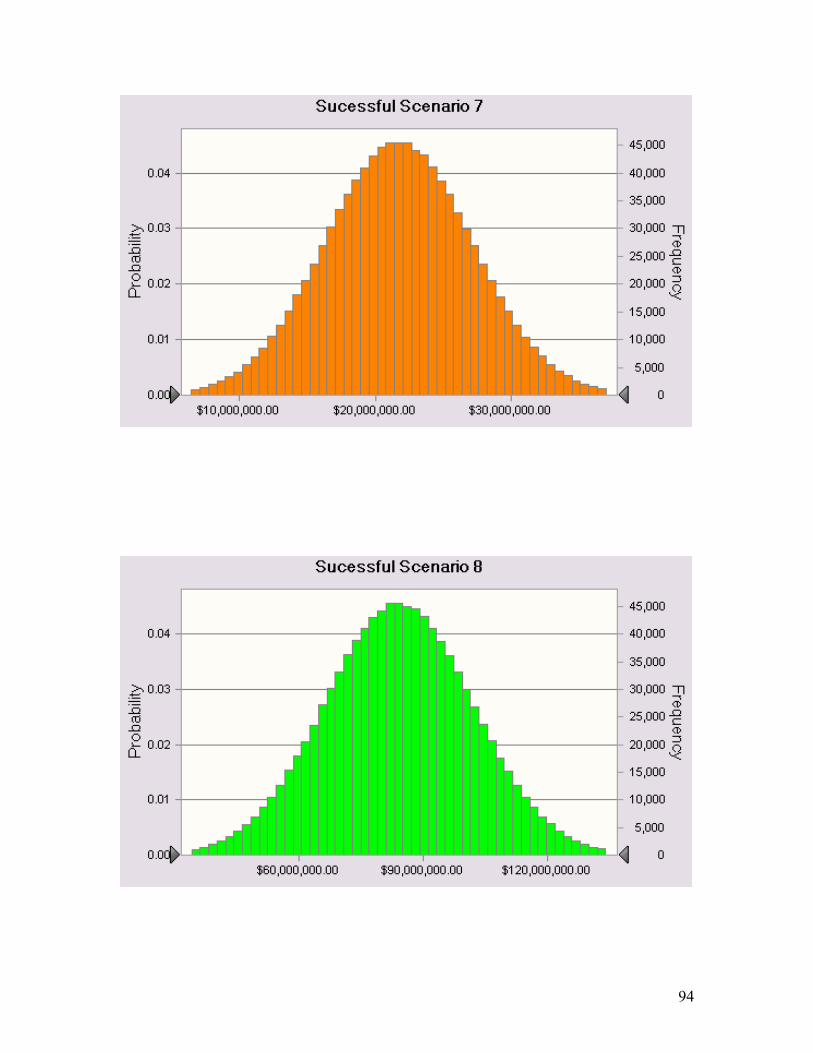
94


![Free vibration analysis of piezoelectric cylindrical nanoshell ......vibration analysis of shallow shells [25]. Loy et al. presented the free vibration analysis of cylindrical shells](https://img.pdfslide.us/doc/110x75/5f736ba706f884064751d11e/free-vibration-analysis-of-piezoelectric-cylindrical-nanoshell-vibration.jpg)