Embed Size (px)
Citation preview

CCH Finance Committee Meeting February 2020
Ekerete Akpan, Chief Financial OfficerFebruary 20, 2020

Agenda1. Jan-2020 Leading indicators
a. Revenue Cycle metrics and observations as of Jan-2020
b. FY 2020 Gross Charges as of Jan-2020
c. Charity care and Self pay costs vs. DSH/BIPA as of Jan-2020
d. Preliminary Cash Flow projections as of January 2020
2. System wide Dec-2019 Accrual Basis Income Statement and Observations
a. CCH Provider Service Financials , Operational Statistics and Observations
b. County Care Financials & Stats
c. Correctional Health services Financials & Stats
d. Cook County Department of Public Health Financials & Stats
e. Administration Financials
3. Appendix - FY 2020 System-wide volumes/stats
2

January 2020 Leading IndicatorsRevenue Cycle Metrics, Gross Charges and Uncompensated Care vs. DSH/BIPAPreliminary Cash Flow Projections

FYTD 2020 - Revenue Cycle Metrics as of end Jan-2020
4
: Total accounts receivable over average daily revenue: Total charges of discharge not finally billed over average daily revenue
: Percentage of claims denied initially compared to total claims submitted.*Source HFMA Key Hospital Statistics and Ratio Margins from Cerner
Metric Average FYTD2019
Average FYTD2020
Dec-19 Jan-20
CCH
Benchmark
/Targets
Some
Industry
Targets
Average Days in Accounts Receivable (lower is better)
97 88 88 88 60-65 40*
Discharged Not Finally Billed Days (lower is better)
11 8 8.3 8 5 7*
Claims Initial Denials Percentage (lower is better)
20% 20% 20% 19% 10% 3%*

Observations on Revenue Cycle Metrics
Sustained year over year improvements
Cash collections for FYTD 2020 up 23% to $72.8M from $59.4M for same period in FY2019
Case mix index continues to improve by 6% year over year, indicating greater focus on clinical documentation
and coding
Average days in Accounts Receivables at 88 days, improving with focus on getting to target days in AR
Discharged Not Finally Billed (DNFB) at 8 days improving with focus on “coding-ready” encounters especially
for high dollar inpatient discharges and concurrent coding for long stay patients prior to discharges
Initial Claims Denials – improving to 19% with focus on upstream processes and activities including pre-
authorization, pre-certification and accurate registration. Specific activities aligned with patient accounting
implementation there is room for continued improvement.
5Source: Finance Department, Business Intelligence & CountyCare

FYTD 2020 – Gross Charges as of end Jan-2020 (in $ millions)
6Source: Unaudited Financials Charge Reports , FY2020 Cook County /CCH Budget Book
2019 2020 2019 vs.2020
2019 vs.2020
%tage
2020 BudgetTarget
Charges with Reimbursement Potential 160.11 164.96 4.84 3.0%
Charges with NO Reimbursement Potential 106.06 131.06 25.00 23.6% 8.5%
Total 266.17 296.01 29.84 11.2%
2019v2020
%tage2019 2020 2019vs. 2020
COMMERCIAL $ 16.46 $ 15.00 $ (1.46) -8.9%
COUNTYCARE $ 38.82 $ 42.42 $ 3.60 9.3%
MEDICAID $ 31.89 $ 23.07 $ (8.82) -27.7%
MEDICAID MGD CARE $ 30.72 $ 38.29 $ 7.57 24.7%
MEDICARE $ 30.63 $ 31.53 $ 0.90 2.9%
MEDICARE MGD CARE $ 11.59 $ 14.65 $ 3.06 26.4%
CHARITY CARE $ 64.52 $ 68.82 $ 4.29 6.7%
SELF PAY $ 37.41 $ 58.69 $ 21.28 56.9%
Others $ 4.12 $ 3.54 $ (0.58) -14.0%
Grand Total $266.17 $296.01 $ 29.84 11.2%

$40M$43M
$23M
$37M
FY2019 FY2020
Charity Care Cost Self Pay
FYTD 2020 - Charity Care & Self Pay Cost vs. DSH/BIPA funding as of end Jan-2020
7
Source: Unaudited Financials Charge Reports , FY2020 Cook County /CCH Budget BookDSH: Disproportionate Share Hospital Payments-$156.7M/YearBIPA: Benefits Improvement and Protection Act Payments-$132.3M/Year
Gap $15M
Gap – $32M
DSH/BIPA $48M

FY2020 – CCH Hospitals & Clinics - Preliminary Cash Flow Projections as of end Jan-2020 (in millions)
8Source: Finance Department
MonthProjected Cash
ReceiptsProjected Expenses
Projected Earnings from Health Plans
Net Cash Flow
Dec-19 $ 57.10 $ (124.46) $ - $ (67.36)Jan-20 57.10 (124.46) - (67.36)Feb-20 57.10 (94.46) 38.00 0.64 Mar-20 54.25 (84.46) 15.00 (15.21)Apr-20 54.25 (84.46) 15.00 (15.21)May-20 54.25 (84.46) 15.00 (15.21)Jun-20 54.25 (84.46) 15.00 (15.21)Jul-20 54.25 (84.46) 15.00 (15.21)
Aug-20 150.80 (84.46) 15.00 81.34 Sep-20 54.25 (84.46) 15.00 (15.21)Oct-20 54.25 (84.46) 15.00 (15.21)Nov-20 90.92 (84.46) 15.00 21.46
Total $ 792.73 $ (1,103.50) $ 173.00 $(137.77)
CCH Hospitals & Clinics as a
provider of care, cash flows are
positive in August and November
due to payments of BIPA.
Due to increasing and
unsustainable growth in charity
care, and predominantly
government payors, CCH
projected expenses exceed its
cash flows and will impact CCH
ability to meet budget.
CCH must earn Health plan
business of $173M for FY2020
by serving Countycare/MoreCare
members

FY2020 – Correctional Health / CCDPH Preliminary Cash Flow projections as of end Jan-2020 (in millions)
9
Source: Finance Department
Correctional Health /CCDPH
cashflow dependent on property
tax receipts, cashflow based on
FY2019 experience .
Correctional Health/CCDPH
projected expenses exceed its cash
flows for Cook County mandated
services
Month
Projected Property Tax
ReceiptsProjected Expenses Net Cash Flow
Dec-19 $ 0.17 $ (8.46) $ (8.29)Jan-20 4.83 (8.46) (3.63)Feb-20 7.19 (8.46) (1.27)Mar-20 36.22 (8.46) 27.77 Apr-20 1.29 (8.46) (7.17)
May-20 0.59 (8.46) (7.87)Jun-20 4.45 (8.46) (4.00)Jul-20 4.34 (8.46) (4.12)
Aug-20 22.04 (8.46) 13.58 Sep-20 0.70 (8.46) (7.75)Oct-20 0.82 (8.46) (7.64)Nov-20 0.35 (8.46) (8.11)
Total $ 83.00 $ (101.50) $ (18.50)

FY2020 – Health Plans Preliminary Cash Flow projections as of end Jan-2020 (in millions)
10
Source: Finance Department
Health plans cashflows particularly
exposed to State payments cycles
HealthPlan does not make direct to
CCH, however, residual PMPM not
paid to external providers is
retained by CCH hospitals & Clinics.
CCH Hospitals and Clinics must earn
Health plan business by serving
Countycare/MoreCare members
MonthProjected PMPM
ReceiptsProjected Claims
Expenses
Net Cash Flow to CCH Hospital &
Clinics
Dec-19 $ 48.00 $ (48.00) $ -
Jan-20 66.00 (66.00) -
Feb-20 450.00 (412.00) 38.00
Mar-20 150.00 (135.00) 15.00
Apr-20 150.00 (135.00) 15.00
May-20 150.00 (135.00) 15.00
Jun-20 150.00 (135.00) 15.00
Jul-20 150.00 (135.00) 15.00
Aug-20 150.00 (135.00) 15.00
Sep-20 150.00 (135.00) 15.00
Oct-20 150.00 (135.00) 15.00
Nov-20 150.00 (135.00) 15.00
Total $ 1,914.00 $ (1,741.00) $ 173.00

FY2020 - Systems-wide Accrual Basis Financials, Observationsas of end December 2019

Accrual Basis Income Statement for the One Month ending December 2019 (in thousands)
12
*Year to Date (1 month) Pension Liability per GASB Pension includes Other Post Employment Benefits (OPEB) Expense
Internal Claims based on paid claims and estimated IBNR provided by third-party actuaries priced at 100% of Medicaid rates Unaudited Financial Statement

Observations on Accrual Basis Financials
CCH Hospitals & Clinics as a provider of care, Net Patient Service Revenues - $63M, 11% unfavorable to target due to
increasing and unsustainable growth in charity care, this is above the 8.5% budgeted and will impact CCH ability to
meet budget.
• System-wide uninsured numbers
• Captured by Visits, increased to 46%
• Captured by Charges, increases to 45%
CountyCare Capitation Revenues - $146.8M, 1% unfavorable to target due to lower than budgeted enrollment
(currently approximately 319,000 members vs. 326,000) as a result of lower State/County MCO enrollment.
CountyCare retains market share of approximately 31.5%.
State owed CountyCare $170M of past due capitation payments as of end December -2019 with $246M in
adjudicated but not paid claims pending action.
13Source: Finance Department, Business Intelligence & CountyCare

Observations on Accrual Basis Financials
Personnel Costs - Salary & Benefits expenses - exceeding budget by $3.2M or 6% and Overtime expenses -
exceeding budget by $1.5M of 58%
CCH is embarking on an immediate review of vacancies and programs with operational and clinical leaders to
prioritize hiring, ensure we come within budgeted vacancy factor of 900 FTEs vs current vacancies of
approximately 600 FTEs including as significant number of clinical positions needed to continue services at
current levels.
Other than Personnel Costs - Supplies & Materials and Pharmaceutical Supplies exceeding budget, Purchase
Services Rental others including Agency Expenses exceeding budget
CCH is embarking on an immediate review of all other than personnel costs with operational and clinical
leaders to ensure we come within budget, including a review of programs with contracted agency costs
14Source: Finance Department

Provider of Care ServicesFinancial and Operational Statistics
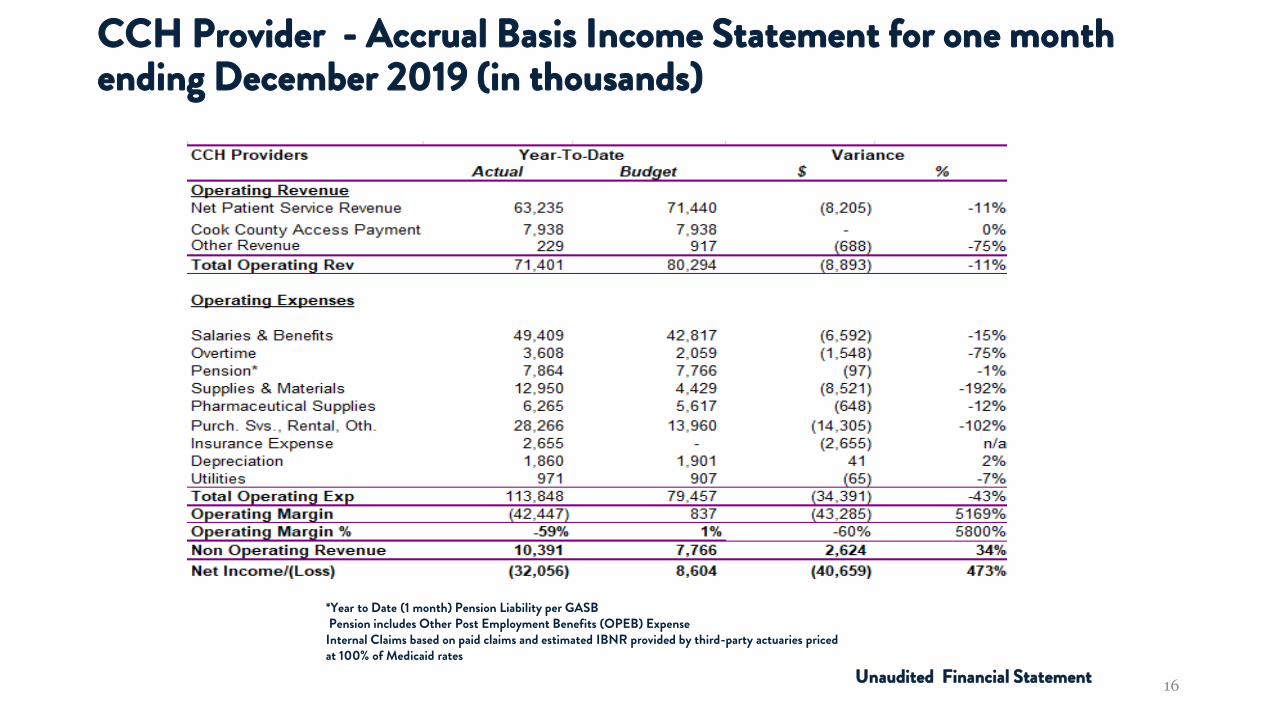
CCH Provider - Accrual Basis Income Statement for one month ending December 2019 (in thousands)
16Unaudited Financial Statement
*Year to Date (1 month) Pension Liability per GASB Pension includes Other Post Employment Benefits (OPEB) Expense
Internal Claims based on paid claims and estimated IBNR provided by third-party actuaries priced at 100% of Medicaid rates

Clinical Activity Observations
Primary Care visits are up by 10% versus FY18, and up 6% versus FY19 target
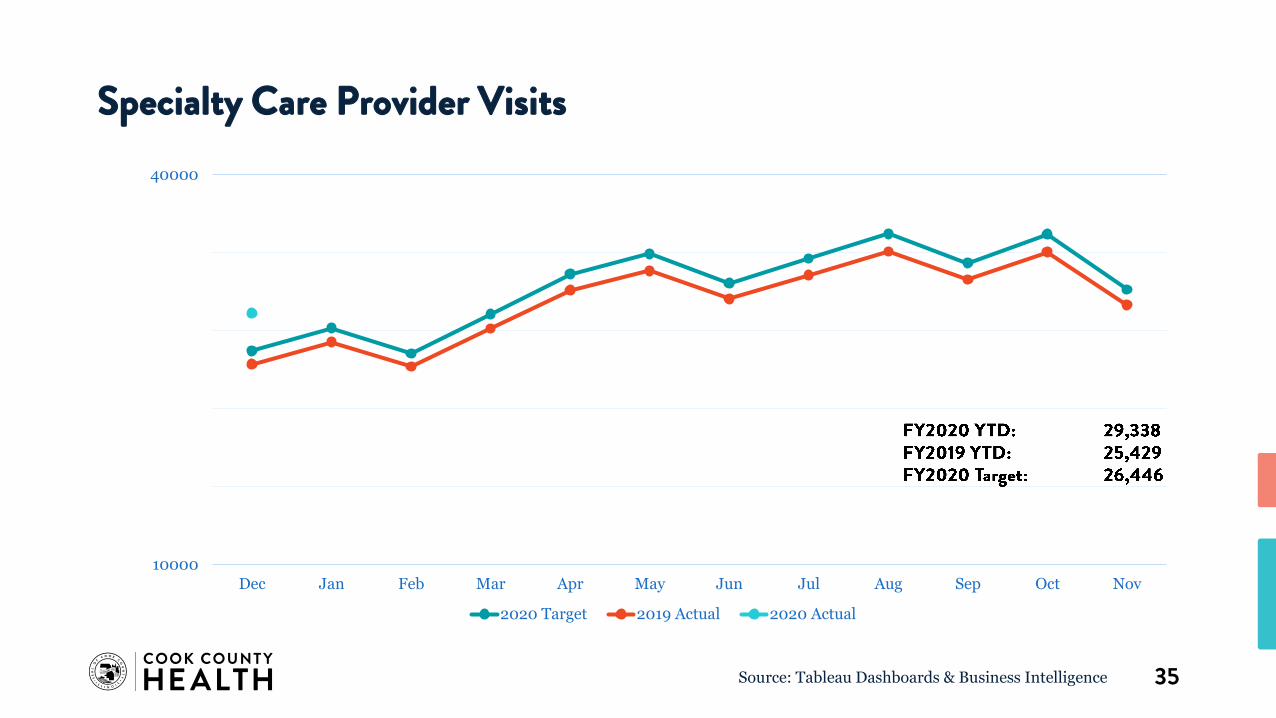
Specialty Care visits are up by 15% versus FY18 up 11% versus FY19 target
Surgical Cases are up by 7% versus FY19, and down 2% versus FY20 target
Inpatient Discharges are up by 10% versus FY19
Length of Stay is down by 2% versus FY19, and down 2% versus FY20target
Emergency Department visits are up by 3% versus FY19
Deliveries are up by 1% versus FY19 and up by 7% versus FY20 target
17Source: CCH Tableau Dashboards

Stroger Operations Overview for one month ending December 2019
Comments:
• Growth primary and specialty care provider visits continue in FY2020
targets
• Payor mix challenges continue vs FY 2020 budget assumptions
18
CHARITY CARE$30M
COMMERCIAL$6M
MEDICAID$10M
MEDICAID MANAGED CARE $17M
COUNTYCARE$18M
MEDICARE$15M
MEDICARE MANAGED CARE
$6M
SELF PAY$28M
GROSS CHARGES
Source: Charge Report & Business Intelligence

Provident Operations Overview for one month ending December 2019
Comments:
• Growth in primary care and specialty care provider visits continues in FY2020
Leadership reviewing left without being seen in Emergency Dept.
• Challenging payor mix though better than rest of system on average
19
CHARITY CARE$1M
COMMERCIAL413K
MEDICAID$456K
MEDICAID MANAGED CARE
$1M
COUNTYCARE $2M
MEDICARE$852K
MEDICARE MANAGED CARE
$380K
SELF PAY $2M
GROSS CHARGES
Source: Charge Report & Business Intelligence

ACHN Operations Overview for one month ending December 2019
Comments :
• Growth trends in Primary care and Specialty care provider visits
continues in FY2020
• Challenging payor mix trends with non-reimbursable payors generally
higher than rest of system
20
*includes All OBGYN clinics , Ped Primary on Stroger campus *excludes Stroger Specialty Care, CORE, Stroger-Hospital Based Clinics, Sengstacke GMC & Psych, Austin Behavioral Health, and assuming all registrations are provider visits
CHARITY CARE$3M
COMMERCIAL$504K
MEDICAID$415K
MEDICAID MANAGED CARE $1M
COUNTYCARE $2M
MEDICARE$728K
MEDICARE MANAGED CARE
$307K
SELF PAY$2M
GROSS CHARGES
Source: Charge Report & Business Intelligence

CountyCare Health PlanFinancial and Operational Statistics

Health Plans – Accrual Basis Income Statement for one month ending December 2019 (in thousands)
22Unaudited Financial Statement
*Internal Claims based on paid claims and estimated IBNR provided by third-party actuaries priced at 100% of Medicaid rates**Cook County Health reflects a refundable deposit asset of $50 million. The actual balance of this deposit may vary due to claims payment timing, however, replenishment of the deposit is reflected in Claims Payable on the balance sheet.

Correctional Health ServicesFinancial & Operational Statistics

Accrual Basis Income Statement for one month ending December 2019 (in thousands)
24Unaudited Financial Statement
*Year to Date (1 months) Pension Liability per GASB Pension includes Other Post Employment Benefits (OPEB) Expense

0
500
1000
1500
2000
2500
3000
3500
4000
Dec Jan Feb Mar Apr May Jun Jul Aug Sep Oct Nov
Total Intakes
2019 Actual 2020 Actual
for one month ending
Comments:• 91% of intakes are screened by financial counselling to ensure continuity of coverage
25Source: Cermak Health Services – Financial Counseling

Cook County Dept. of Public HealthFinancial & Operational Statistics

Accrual Basis Income Statement for one month ending December 2019 (in thousands)
27Unaudited Financial Statement
*Year to Date (1 months) Pension Liability per GASB Pension includes Other Post Employment Benefits (OPEB) Expense
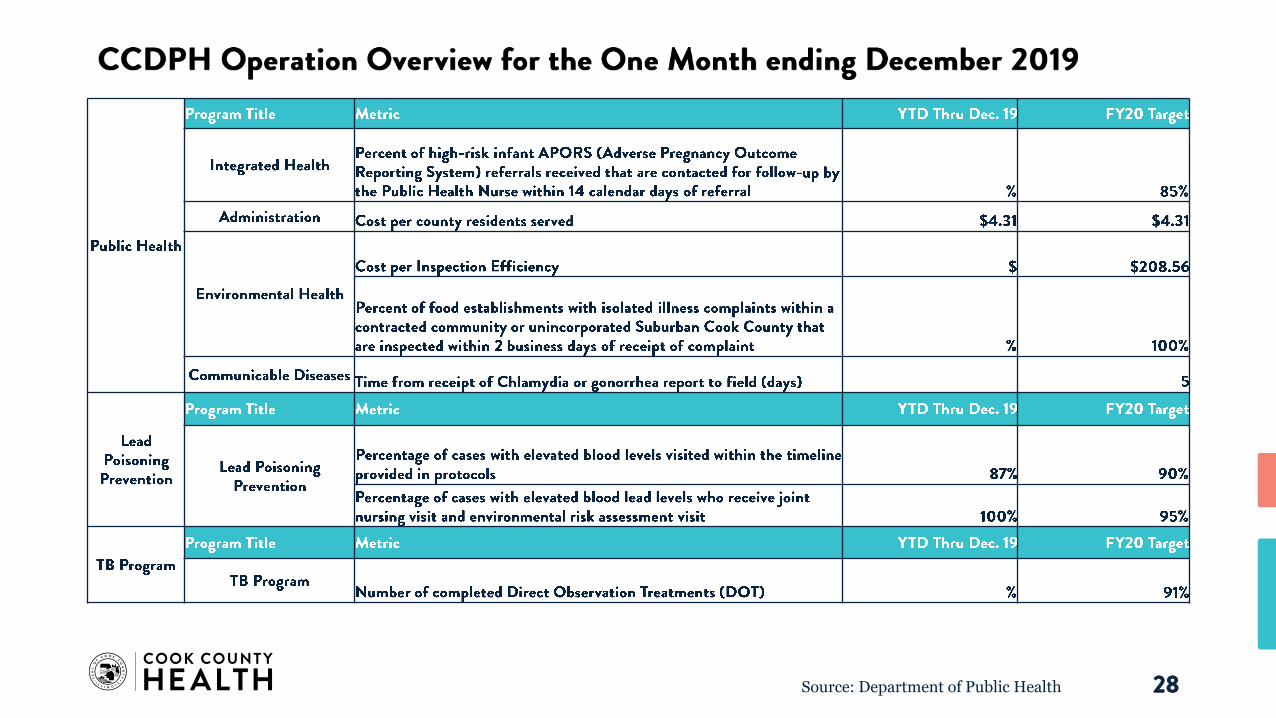
28Source: Department of Public Health
CCH AdministrationFinancial Statements
29

Accrual Basis Income Statement for one month ending December 2019(in thousands)
30
Unaudited Financial Statement
*Year to Date (1 month) Pension Liability per GASB Pension includes Other Post Employment Benefits (OPEB) Expense

AppendixFY 2020 - System-wide Volumes / Stats

0%
25%
21%
5%4%
12%
16%
15%
1%
County Care
UncompensatedCare= 46%
Self PayAll Medicaid = 32%
All Medicare
System Payor Mix By Visit as of December 2019
32Source: Tableau Dashboards & Business Intelligence

23%32M
22%31M
5%7M
7%10M
13%19M
14%21M
16%23M
Charity Care
Other (SelfPay)
CommerciallyInsured
Medicaid
MedicaidManaged Care
County Care
Medicare
Charity CareCounty Care
Self Pay
UncompensatedCare = 45% 63M
All Medicaid = 34%50M
All Medicare
System Payor Mix By Charges as of December 2019
33Source: Finance Department

10000
30000
Dec Jan Feb Mar Apr May Jun Jul Aug Sep Oct Nov2020 Target 2019 Actual 2020 Actual
Primary Care Provider Visits
34Source: Tableau Dashboards & Business Intelligence
10000
40000
Dec Jan Feb Mar Apr May Jun Jul Aug Sep Oct Nov
2020 Target 2019 Actual 2020 Actual
Specialty Care Provider Visits
35Source: Tableau Dashboards & Business Intelligence

1,000
2,000
Dec Jan Feb Mar Apr May Jun Jul Aug Sep Oct Nov
2020 Target 2019 Actual 2020 Actual
Total Inpatient Discharges
36Source: Tableau Dashboards & Business Intelligence

0.00
10.00
Dec Jan Feb Mar Apr May Jun Jul Aug Sep Oct Nov
2020 Target 2019 Actual 2020 Actual
Average Length of Stay
37Source: Business Intelligence

10,000
15,000
Dec Jan Feb Mar Apr May Jun Jul Aug Sep Oct Nov
2020Target 2019 Actual 2020 Actual
Total Emergency Room Visits
38Source: Tableau Dashboard

50
150
Dec Jan Feb Mar Apr May Jun Jul Aug Sep Oct Nov
2020 Target 2019 Actual 2020 Actual
Total Deliveries
39Source: Business Intelligence

1,000
1,500
Dec Jan Feb Mar Apr May Jun Jul Aug Sep Oct Nov
2020 Target 2019 Actual 2020 Actual
Total Surgical Cases
40Source: Business Intelligence

1.66
1.55
1.49
1.611.60
1.59
1.73
1.62
1.59
1.64
1.62
1.60
Dec Jan Feb Mar Apr May Jun Jul Aug Sep Oct Nov
FY19 FY20
Case Mix Index
41Source: Tableau Dashboard

Questions?