Embed Size (px)
Citation preview
CCGPS
Frameworks Student Edition
7th Grade
Unit 6: Probability
Mathematics
Georgia Department of Education Common Core Georgia Performance Standards Framework Student Edition
Seventh Grade Mathematics Unit 6
MATHEMATICS GRADE 7 UNIT 6: Probability
Georgia Department of Education
Dr. John D. Barge, State School Superintendent
April 2012 Page 2 of 28
All Rights Reserved
PROBABILITY
TABLE OF CONTENTS
Overview ..........................................................................................................................................3
Standards Addressed in this Unit .....................................................................................................4
Key Standards & Related Standards ...............................................................................4
Standards for Mathematical Practice ...............................................................................5
Enduring Understandings.................................................................................................................7
Concepts & Skills to Maintain .........................................................................................................8
Selected Terms and Symbols ...........................................................................................................9
Tasks ..............................................................................................................................................11
Probability??? ....................................................................................................................11
Heads Wins! .......................................................................................................................12
What are Your Chances? ...................................................................................................13
Probably Graphing .............................................................................................................18
Rolling Dice .......................................................................................................................20
Number Cube Sums ...........................................................................................................21
Dice Game Task .................................................................................................................22
Is It Fair? ............................................................................................................................23
Charity Fair ........................................................................................................................26
Designing Simulations .......................................................................................................27
Georgia Department of Education Common Core Georgia Performance Standards Framework Student Edition
Seventh Grade Mathematics Unit 6
MATHEMATICS GRADE 7 UNIT 6: Probability
Georgia Department of Education
Dr. John D. Barge, State School Superintendent
April 2012 Page 3 of 28
All Rights Reserved
OVERVIEW
In this unit students will:
be formally introduced to the study of probability.
begin to understand the probability of chance (simple and compound).
develop and use sample spaces.
compare experimental and theoretical probabilities.
develop and use graphical organizers.
use information from simulations for predictions.
understand the probability of chance by using the benchmarks of probability: 0, ⁄ and 1.
experience situations that have clearly defined probability of never happening as zero,
equally likely to happen as to not happen as ⁄ or always happening as 1.
experience situations in which the probability is somewhere between 0 and 1 and express
the probability as number between those benchmark values.
make predictions about the relative frequency of an event by using simulations to collect,
record, organize and analyze data.
develop the understanding that the more the simulation for an event is repeated, the closer
the experimental probability approaches the theoretical probability.
develop probability models to be used to find the probability of events.
develop models of equal outcomes and models of not equal outcomes and use them to
determine the probabilities of events.
begin to expand the knowledge and understanding of the probability of simple events.
find the probabilities of compound events by creating organized lists, tables and tree
diagrams.
determine, from each sample space, the probability or fraction of each possible outcome.
continue to build on the use of simulations for simple probabilities and now expand the
simulation of compound probability.
Although the units in this instructional framework emphasize key standards and big ideas
at specific times of the year, routine topics such as estimation, mental computation, and basic
computation facts should be addressed on an ongoing basis. Ideas related to the eight process
standards should be addressed constantly as well. To assure that this unit is taught with the
appropriate emphasis, depth, and rigor, it is important that the tasks listed under “Evidence of
Learning” be reviewed early in the planning process. A variety of resources should be utilized to
supplement this unit. This unit provides much needed content information, but excellent learning
activities as well. The tasks in this unit illustrate the types of learning activities that should be
utilized from a variety of sources.
Georgia Department of Education Common Core Georgia Performance Standards Framework Student Edition
Seventh Grade Mathematics Unit 6
MATHEMATICS GRADE 7 UNIT 6: Probability
Georgia Department of Education
Dr. John D. Barge, State School Superintendent
April 2012 Page 4 of 28
All Rights Reserved
STANDARDS ADDRESSED IN THIS UNIT
Mathematical standards are interwoven and should be addressed throughout the year in as
many different units and activities as possible in order to emphasize the natural connections that
exist among mathematical topics.
KEY STANDARDS
Investigate chance processes and develop, use, and evaluate probability models.
MCC7.SP.5 Understand that the probability of a chance event is a number between 0 and 1 that
expresses the likelihood of the event occurring. Larger numbers indicate greater likelihood. A
probability near 0 indicates an unlikely event, a probability around 1/2 indicates an event that is
neither unlikely nor likely, and a probability near 1 indicates a likely event.
MCC7.SP.6 Approximate the probability of a chance event by collecting data on the chance
process that produces it and observing its long‐run relative frequency, and predict the
approximate relative frequency given the probability. For example, when rolling a number cube
600 times, predict that a 3 or 6 would be rolled roughly 200 times, but probably not exactly 200
times.
MCC7.SP.7 Develop a probability model and use it to find probabilities of events. Compare
probabilities from a model to observed frequencies; if the agreement is not good, explain
possible sources of the discrepancy.
MCC7.SP.7a Develop a uniform probability model by assigning equal probability to all
outcomes, and use the model to determine probabilities of events. For example, if a student is
selected at random from a class, find the probability that Jane will be selected and the
probability that a girl will be selected.
MCC7.SP.7b Develop a probability model (which may not be uniform) by observing
frequencies in data generated from a chance process. For example, find the approximate
probability that a spinning penny will land heads up or that a tossed paper cup will land
open‐end down. Do the outcomes for the spinning penny appear to be equally likely based on
the observed frequencies?
MCC7.SP.8 Find probabilities of compound events using organized lists, tables, tree diagrams,
and simulation.
MCC7.SP.8a Understand that, just as with simple events, the probability of a compound
event is the fraction of outcomes in the sample space for which the compound event occurs.
MCC7.SP.8b Represent sample spaces for compound events using methods such as
organized lists, tables and tree diagrams. For an event described in everyday language (e.g.,
“rolling double sixes”), identify the outcomes in the sample space which compose the event.
Georgia Department of Education Common Core Georgia Performance Standards Framework Student Edition
Seventh Grade Mathematics Unit 6
MATHEMATICS GRADE 7 UNIT 6: Probability
Georgia Department of Education
Dr. John D. Barge, State School Superintendent
April 2012 Page 5 of 28
All Rights Reserved
MCC7.SP.8c Design and use a simulation to generate frequencies for compound events. For
example, use random digits as a simulation tool to approximate the answer to the question: If
40% of donors have type A blood, what is the probability that it will take at least 4 donors to
find one with type A blood?
RELATED STANDARDS
MCC7.RP.3 Use proportional relationships to solve multistep ratio and percent problems.
MCC7.NS.2 Apply and extend previous understandings of multiplication and division and of
fractions to multiply and divide rational numbers.
MCC7.NS.3 Solve real‐world and mathematical problems involving the four operations with
rational numbers.
MCC7.EE.3 Solve multi‐step real‐life and mathematical problems posed with positive and
negative rational numbers in any form (whole numbers, fractions, and decimals), using tools
strategically. Apply properties of operations as strategies to calculate with numbers in any form;
convert between forms as appropriate; and assess the reasonableness of answers using mental
computation and estimation strategies.
MCC7.SP.1 Understand that statistics can be used to gain information about a population by
examining a sample of the population; generalizations about a population from a sample are
valid only if the sample is representative of that population. Understand that random sampling
tends to produce representative samples and support valid inferences.
MCC7.SP.2 Use data from a random sample to draw inferences about a population with an
unknown characteristic of interest. Generate multiple samples (or simulated samples) of the same
size to gauge the variation in estimates or predictions.
STANDARDS FOR MATHEMATICAL PRACTICE
The Standards for Mathematical Practice describe varieties of expertise that mathematics
educators at all levels should seek to develop in their students. These practices rest on important
“processes and proficiencies” with longstanding importance in mathematics education. The first
of these are the NCTM process standards of problem solving, reasoning and proof,
communication, representation, and connections. The second are the strands of mathematical
proficiency specified in the National Research Council’s report Adding It Up: adaptive
reasoning , strategic competence, conceptual understanding (comprehension of mathematical
concepts, operations and relations), procedural fluency (skill in carrying out procedures flexibly,
accurately, efficiently and appropriately) and productive disposition (habitual inclination to see
mathematics as sensible, useful, and worthwhile, coupled with a belief in diligence and one’s
own efficacy).
Georgia Department of Education Common Core Georgia Performance Standards Framework Student Edition
Seventh Grade Mathematics Unit 6
MATHEMATICS GRADE 7 UNIT 6: Probability
Georgia Department of Education
Dr. John D. Barge, State School Superintendent
April 2012 Page 6 of 28
All Rights Reserved
1. Make sense of problems and persevere in solving them.
In grade 7, students solve problems involving ratios and rates and discuss how they solved them.
Students solve real world problems through the application of algebraic and geometric concepts.
Students seek the meaning of a problem and look for efficient ways to represent and solve it.
They may check their thinking by asking themselves, “What is the most efficient way to solve
the problem?”, “Does this make sense?”, and “Can I solve the problem in a different way?”
2. Reason abstractly and quantitatively.
In grade 7, students represent a wide variety of real world contexts through the use of real
numbers and variables in mathematical expressions, equations, and inequalities. Students
contextualize to understand the meaning of the number or variable as related to the problem and
decontextualize to manipulate symbolic representations by applying properties of operations.
3. Construct viable arguments and critique the reasoning of others.
In grade 7, students construct arguments using verbal or written explanations accompanied by
expressions, equations, inequalities, models, and graphs, tables, and other data displays (i.e. box
plots, dot plots, histograms, etc.). They further refine their mathematical communication skills
through mathematical discussions in which they critically evaluate their own thinking and the
thinking of other students. They pose questions like “How did you get that?”, “Why is that true?”
“Does that always work?”. They explain their thinking to others and respond to others’ thinking.
4. Model with mathematics.
In grade 7, students model problem situations symbolically, graphically, tabularly, and
contextually. Students form expressions, equations, or inequalities from real world contexts and
connect symbolic and graphical representations. Students explore covariance and represent two
quantities simultaneously. They use measures of center and variability and data displays (i.e. box
plots and histograms) to draw inferences, make comparisons and formulate predictions. Students
use experiments or simulations to generate data sets and create probability models. Students
need many opportunities to connect and explain the connections between the different
representations. They should be able to use all of these representations as appropriate to a
problem context.
5. Use appropriate tools strategically.
Students consider available tools (including estimation and technology) when solving a
mathematical problem and decide when certain tools might be helpful. For instance, students in
grade 7 may decide to represent similar data sets using dot plots with the same scale to visually
compare the center and variability of the data. Students might use physical objects or applets to
generate probability data and use graphing calculators or spreadsheets to manage and represent
data in different forms.
6. Attend to precision.
In grade 7, students continue to refine their mathematical communication skills by using clear
and precise language in their discussions with others and in their own reasoning. Students define
variables, specify units of measure, and label axes accurately. Students use appropriate
Georgia Department of Education Common Core Georgia Performance Standards Framework Student Edition
Seventh Grade Mathematics Unit 6
MATHEMATICS GRADE 7 UNIT 6: Probability
Georgia Department of Education
Dr. John D. Barge, State School Superintendent
April 2012 Page 7 of 28
All Rights Reserved
terminology when referring to rates, ratios, probability models, geometric figures, data displays,
and components of expressions, equations or inequalities.
7. Look for and make use of structure.
Students routinely seek patterns or structures to model and solve problems. For instance, students
recognize patterns that exist in ratio tables making connections between the constant of
proportionality in a table with the slope of a graph. Students apply properties to generate
equivalent expressions (i.e. 6 + 2x = 3 (2 + x) by distributive property) and solve equations (i.e.
2c + 3 = 15, 2c = 12 by subtraction property of equality), c=6 by division property of equality).
Students compose and decompose two‐ and three‐dimensional figures to solve real world
problems involving scale drawings, surface area, and volume. Students examine tree diagrams or
systematic lists to determine the sample space for compound events and verify that they have
listed all possibilities.
8. Look for and express regularity in repeated reasoning.
In grade 7, students use repeated reasoning to understand algorithms and make generalizations
about patterns. During multiple opportunities to solve and model problems, they may notice that
a/b ÷ c/d = ad/bc and construct other examples and models that confirm their generalization.
They extend their thinking to include complex fractions and rational numbers. Students formally
begin to make connections between covariance, rates, and representations showing the
relationships between quantities. They create, explain, evaluate, and modify probability models
to describe simple and compound events.
ENDURING UNDERSTANDINGS
Probabilities are fractions derived from modeling real world experiments and simulations
of chance.
Modeling real world experiments through trials and simulations are used to predict the
probability of a given event.
Chance has no memory. For repeated trials of a simple experiment, the outcome of prior
trials has no impact on the next.
The probability of a given event can be represented as a fraction between 0 and 1.
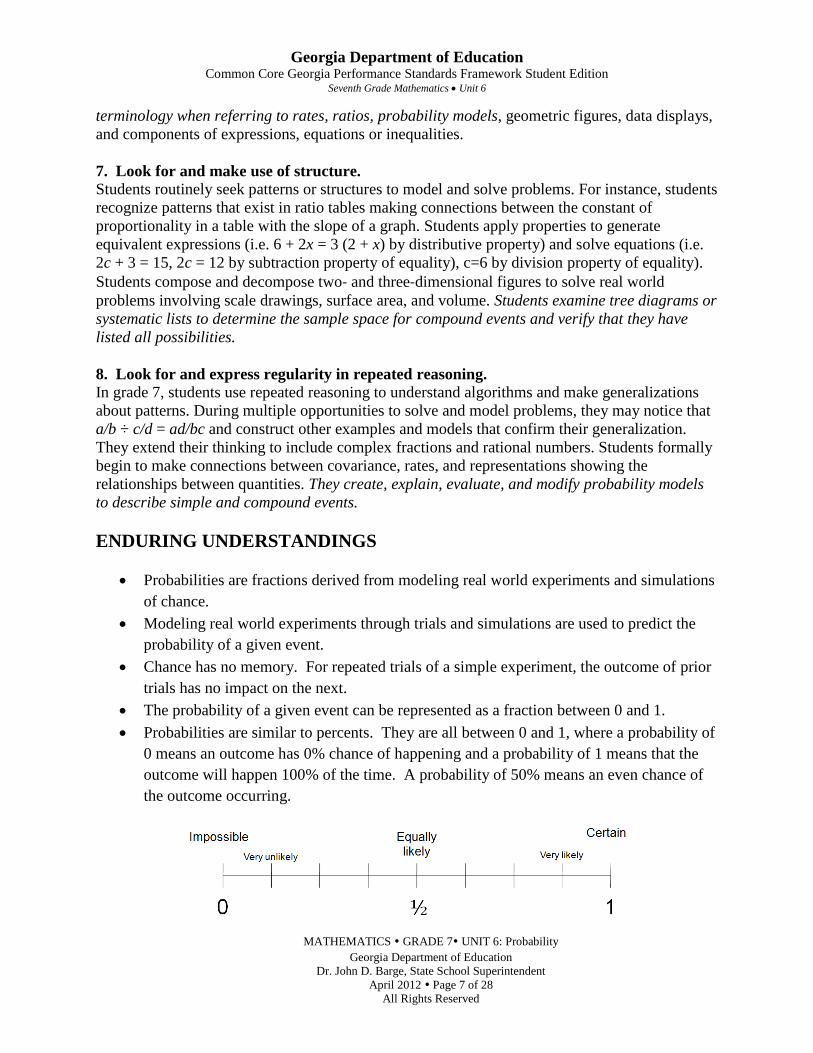
Probabilities are similar to percents. They are all between 0 and 1, where a probability of
0 means an outcome has 0% chance of happening and a probability of 1 means that the
outcome will happen 100% of the time. A probability of 50% means an even chance of
the outcome occurring.
Georgia Department of Education Common Core Georgia Performance Standards Framework Student Edition
Seventh Grade Mathematics Unit 6
MATHEMATICS GRADE 7 UNIT 6: Probability
Georgia Department of Education
Dr. John D. Barge, State School Superintendent
April 2012 Page 8 of 28
All Rights Reserved
If we add the probabilities of every outcome in a sample space, the sum should always
equal 1.
The experimental probability or relative frequency of outcomes of an event can be used
to estimate the exact probability of an event.
Experimental probability approaches theoretical probability when the number of trials is
large.
Sometimes the outcome of one event does not affect the outcome of another event. (This
is when the outcomes are called independent.)
Tree diagrams are useful for describing relatively small sample spaces and computing
probabilities, as well as for visualizing why the number of outcomes can be extremely
large.
Simulations can be used to collect data and estimate probabilities for real situations that
are sufficiently complex that the theoretical probabilities are not obvious.
CONCEPTS AND SKILLS TO MAINTAIN
It is expected that students will have prior knowledge/experience related to the concepts
and skills identified below. It may be necessary to pre-assess in order to determine if time needs
to be spent on conceptual activities that help students develop a deeper understanding of these
ideas.
number sense
computation with whole numbers and decimals, including application of order of
operations
addition and subtraction of common fractions with like denominators
measuring length and finding perimeter and area of rectangles and squares
characteristics of 2-D and 3-D shapes
data usage and representations
Georgia Department of Education Common Core Georgia Performance Standards Framework Student Edition
Seventh Grade Mathematics Unit 6
MATHEMATICS GRADE 7 UNIT 6: Probability
Georgia Department of Education
Dr. John D. Barge, State School Superintendent
April 2012 Page 9 of 28
All Rights Reserved
SELECTED TERMS AND SYMBOLS
The following terms and symbols are often misunderstood. These concepts are not an
inclusive list and should not be taught in isolation. However, due to evidence of frequent
difficulty and misunderstanding associated with these concepts, instructors should pay particular
attention to them and how their students are able to explain and apply them.
The definitions below are for teacher reference only and are not to be memorized by the
students. Students should explore these concepts using models and real life examples. Students
should understand the concepts involved and be able to recognize and/or demonstrate them with
words, models, pictures, or numbers.
Definitions and activities for these and other terms can be found on the Intermath website,
http://intermath.coe.uga.edu/dictnary/homepg.asp, and the Learning Progression for 6-8 Statistics
and Probability at http://commoncoretools.me/category/progressions/.
Chance Process: The repeated observations of random outcomes of a given event.
Compound Event: Any event which consists of more than one outcome.
Empirical: A probability model based upon observed data generated by the process.
Also, referred to as the experimental probability.
Event: Any possible outcome of an experiment in probability. Any collection of
outcomes of an experiment. Formally, an event is any subset of the sample space.
Experimental Probability: The ratio of the number of times an outcome occurs to the
total amount of trials performed.
Independent events: Two events are independent if the occurrence of one of the
events gives us no information about whether or not the other event will occur; that
is, the events have no influence on each other.
Probability: A measure of the likelihood of an event. It is the ratio of the number of
ways a certain event can occur to the number of possible outcomes.
Probability Model: It provides a probability for each possible non-overlapping outcome
for a change process so that the total probability over all such outcomes is unity. This
can be either theoretical or experimental.
Relative Frequency of Outcomes: Also, Experimental Probability
Georgia Department of Education Common Core Georgia Performance Standards Framework Student Edition
Seventh Grade Mathematics Unit 6
MATHEMATICS GRADE 7 UNIT 6: Probability
Georgia Department of Education
Dr. John D. Barge, State School Superintendent
April 2012 Page 10 of 28
All Rights Reserved
Sample space: All possible outcomes of a given experiment.
Simple Event: Any event which consists of a single outcome in the sample space. A
simple event can be represented by a single branch of a tree diagram.
Simulation: A technique used for answering real-world questions or making decisions in
complex situations where an element of chance is involved.
Theoretical Probability: The mathematical calculation that an event will happen in
theory. It is based on the structure of the processes and its outcomes.
Tree diagram: A tree-shaped diagram that illustrates sequentially the possible
outcomes of a given event.
Georgia Department of Education Common Core Georgia Performance Standards Framework Student Edition
Seventh Grade Mathematics Unit 6
MATHEMATICS GRADE 7 UNIT 6: Probability
Georgia Department of Education
Dr. John D. Barge, State School Superintendent
April 2012 Page 11 of 28
All Rights Reserved
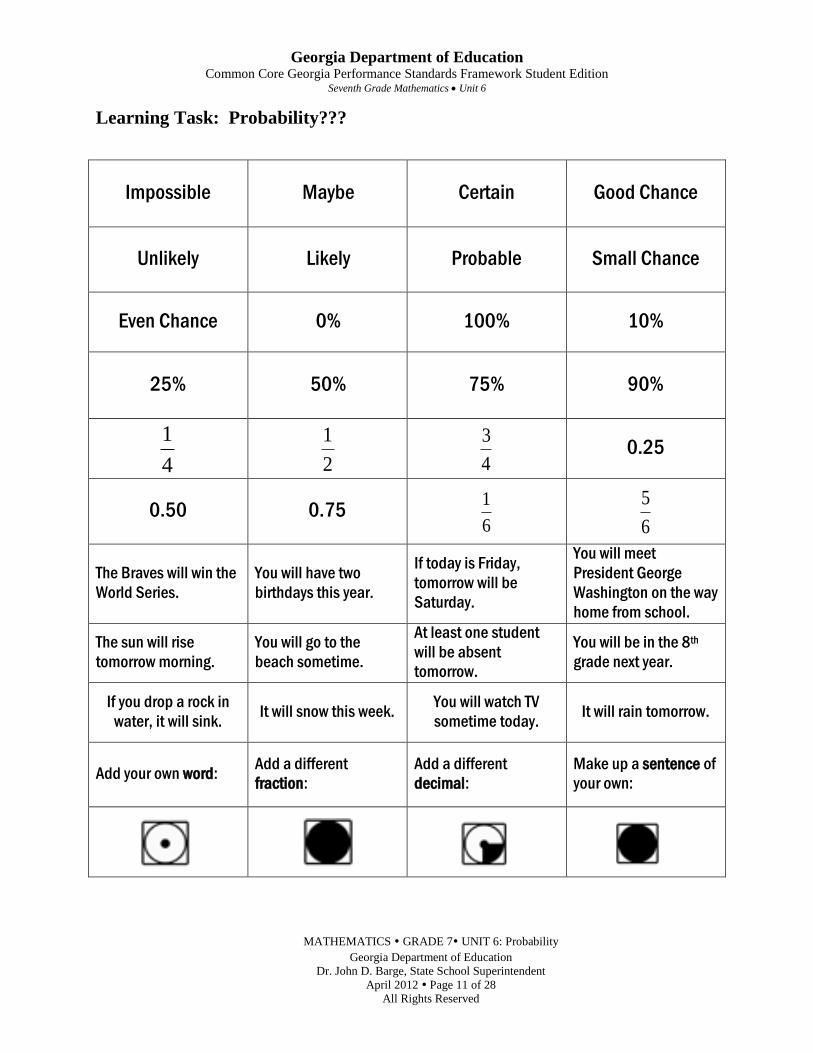
Learning Task: Probability???
Impossible Maybe Certain Good Chance
Unlikely Likely Probable Small Chance
Even Chance 0% 100% 10%
25% 50% 75% 90%
4
1
2
1
4
3 0.25
0.50 0.75 6
1
6
5
The Braves will win the
World Series.
You will have two
birthdays this year.
If today is Friday,
tomorrow will be
Saturday.
You will meet
President George
Washington on the way
home from school.
The sun will rise
tomorrow morning.
You will go to the
beach sometime.
At least one student
will be absent
tomorrow.
You will be in the 8th
grade next year.
If you drop a rock in
water, it will sink. It will snow this week.
You will watch TV
sometime today.
It will rain tomorrow.
Add your own word: Add a different
fraction:
Add a different
decimal:
Make up a sentence of
your own:
Georgia Department of Education Common Core Georgia Performance Standards Framework Student Edition
Seventh Grade Mathematics Unit 6
MATHEMATICS GRADE 7 UNIT 6: Probability
Georgia Department of Education
Dr. John D. Barge, State School Superintendent
April 2012 Page 12 of 28
All Rights Reserved
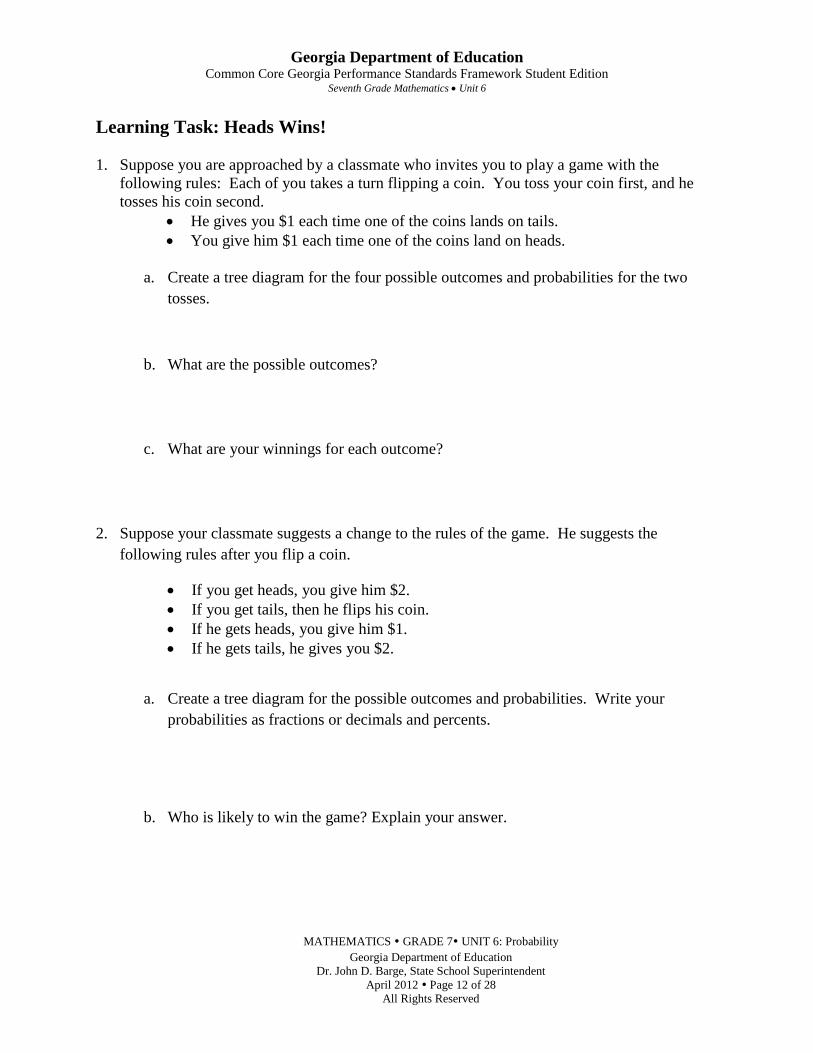
Learning Task: Heads Wins!
1. Suppose you are approached by a classmate who invites you to play a game with the
following rules: Each of you takes a turn flipping a coin. You toss your coin first, and he
tosses his coin second.
He gives you $1 each time one of the coins lands on tails.
You give him $1 each time one of the coins land on heads.
a. Create a tree diagram for the four possible outcomes and probabilities for the two
tosses.
b. What are the possible outcomes?
c. What are your winnings for each outcome?
2. Suppose your classmate suggests a change to the rules of the game. He suggests the
following rules after you flip a coin.
If you get heads, you give him $2.
If you get tails, then he flips his coin.
If he gets heads, you give him $1.
If he gets tails, he gives you $2.
a. Create a tree diagram for the possible outcomes and probabilities. Write your
probabilities as fractions or decimals and percents.
b. Who is likely to win the game? Explain your answer.
=
=
=
Georgia Department of Education Common Core Georgia Performance Standards Framework Student Edition
Seventh Grade Mathematics Unit 6
MATHEMATICS GRADE 7 UNIT 6: Probability
Georgia Department of Education
Dr. John D. Barge, State School Superintendent
April 2012 Page 13 of 28
All Rights Reserved
Learning Task: What Are Your Chances?
Instructions:
a) Create two spinners. Each spinner needs
to have four equal sections.
b) Make each spinner using colors,
numbers, letters, or pictures.
c) Using a paper clip & your pencil, you
can “spin” the spinner by holding the
paper clip in the center of the circle
with your pencil point and thumping the
spinner.
Georgia Department of Education Common Core Georgia Performance Standards Framework Student Edition
Seventh Grade Mathematics Unit 6
MATHEMATICS GRADE 7 UNIT 6: Probability
Georgia Department of Education
Dr. John D. Barge, State School Superintendent
April 2012 Page 14 of 28
All Rights Reserved
Instructions:
a) Create number cubes.
b) Use numbers 1-6 to create each number
cube.
c) Cut out each number cube, fold on the
lines, and tape together.
Georgia Department of Education Common Core Georgia Performance Standards Framework Student Edition
Seventh Grade Mathematics Unit 6
MATHEMATICS GRADE 7 UNIT 6: Probability
Georgia Department of Education
Dr. John D. Barge, State School Superintendent
April 2012 Page 15 of 28
All Rights Reserved
Learning Task: What Are Your Chances?
Part 1:
a) List the possible outcomes or sample space for the spinner you created.
b) List the possible outcomes or sample space for the number cube you created.
Part 2:
Select one spinner and one number cube. Find the sample space (possible outcomes) for spinning
a spinner and tossing a number cube. Make table or a tree diagram.
a) Does spinning a four section spinner affect the number a six-sided number cube will land
upon when tossed? Explain.
b) What are the two independent events? Explain.
c) How are the independent events represented in your two-way table or tree diagram?
Select both spinners and answer the following questions:
d) Does spinning a four section spinner affect the outcome of spinning a different four
section spinner? Explain.
e) What are the two independent events? Explain.
f) What is the sample space (possible outcomes) for spinning both spinners?
Georgia Department of Education Common Core Georgia Performance Standards Framework Student Edition
Seventh Grade Mathematics Unit 6
MATHEMATICS GRADE 7 UNIT 6: Probability
Georgia Department of Education
Dr. John D. Barge, State School Superintendent
April 2012 Page 16 of 28
All Rights Reserved
g) How are the independent events represented in the two-way table and the tree diagram?
Select both number cubes and answer the following questions:
h) Does tossing a number cube affect the number that is tossed on a different number cube?
i) What are the two independent events? Explain.
j) What is the sample space (possible outcomes) for tossing both number cubes?
k) How are the independent events represented in the two-way table and the tree diagram?
Part 3.
Select one spinner.
a) Compute the probability of one-event occurring. How did you determine the probability
and what does the probability tell us about the event occurring?
Select one number cube.
b) Compute the probability of one-event occurring. How did you determine the probability
and what does the probability tell us about the event occurring?
Georgia Department of Education Common Core Georgia Performance Standards Framework Student Edition
Seventh Grade Mathematics Unit 6
MATHEMATICS GRADE 7 UNIT 6: Probability
Georgia Department of Education
Dr. John D. Barge, State School Superintendent
April 2012 Page 17 of 28
All Rights Reserved
Select both spinners. Use both spinners to predict the probability of a two-event experiment.
Answer the questions about the following experiment.
c) Predict the probability of landing on blue after spinning the first spinner and landing on
yellow. Calculate the probability. Explain how you determined the probability.
d) Compare the probability of spinning one spinner to the probability of spinning two
spinners. Explain.
Georgia Department of Education Common Core Georgia Performance Standards Framework Student Edition
Seventh Grade Mathematics Unit 6
MATHEMATICS GRADE 7 UNIT 6: Probability
Georgia Department of Education
Dr. John D. Barge, State School Superintendent
April 2012 Page 18 of 28
All Rights Reserved
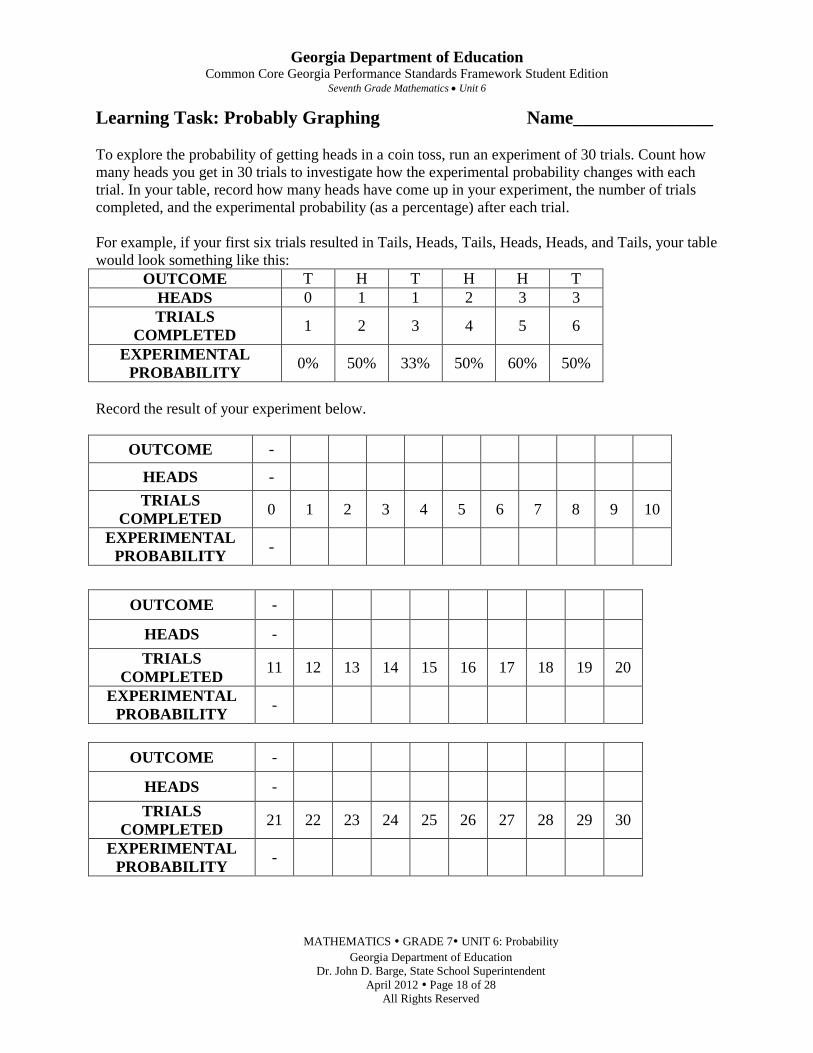
Learning Task: Probably Graphing Name_______________
To explore the probability of getting heads in a coin toss, run an experiment of 30 trials. Count how
many heads you get in 30 trials to investigate how the experimental probability changes with each
trial. In your table, record how many heads have come up in your experiment, the number of trials
completed, and the experimental probability (as a percentage) after each trial.
For example, if your first six trials resulted in Tails, Heads, Tails, Heads, Heads, and Tails, your table
would look something like this:
OUTCOME T H T H H T
HEADS 0 1 1 2 3 3
TRIALS
COMPLETED 1 2 3 4 5 6
EXPERIMENTAL
PROBABILITY 0% 50% 33% 50% 60% 50%
Record the result of your experiment below.
OUTCOME -
HEADS -
TRIALS
COMPLETED 0 1 2 3 4 5 6 7 8 9 10
EXPERIMENTAL
PROBABILITY -
OUTCOME -
HEADS -
TRIALS
COMPLETED 11 12 13 14 15 16 17 18 19 20
EXPERIMENTAL
PROBABILITY -
OUTCOME -
HEADS -
TRIALS
COMPLETED 21 22 23 24 25 26 27 28 29 30
EXPERIMENTAL
PROBABILITY -
Georgia Department of Education Common Core Georgia Performance Standards Framework Student Edition
Seventh Grade Mathematics Unit 6
MATHEMATICS GRADE 7 UNIT 6: Probability
Georgia Department of Education
Dr. John D. Barge, State School Superintendent
April 2012 Page 19 of 28
All Rights Reserved
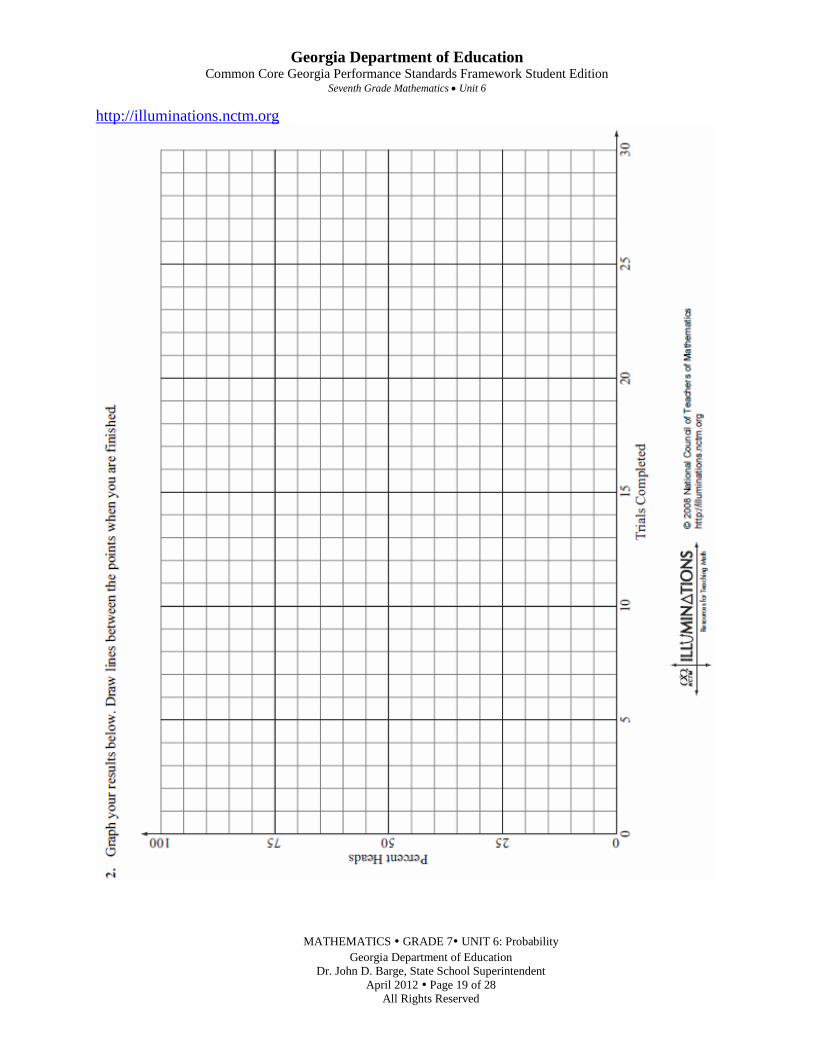
http://illuminations.nctm.org
Georgia Department of Education Common Core Georgia Performance Standards Framework Student Edition
Seventh Grade Mathematics Unit 6
MATHEMATICS GRADE 7 UNIT 6: Probability
Georgia Department of Education
Dr. John D. Barge, State School Superintendent
April 2012 Page 20 of 28
All Rights Reserved
Learning Task: Rolling Dice
This task is from Mathematics Achievement Partnership: Achieve, Inc.
You roll a pair of fair six-sided dice.
a) What is the probability that the sum of the numbers on the uppermost faces
of the dice will be 6?
b) What is the probability that you will roll doubles?
c) Are “rolling a sum of 6” and “rolling doubles” equally likely events?
Georgia Department of Education Common Core Georgia Performance Standards Framework Student Edition
Seventh Grade Mathematics Unit 6
MATHEMATICS GRADE 7 UNIT 6: Probability
Georgia Department of Education
Dr. John D. Barge, State School Superintendent
April 2012 Page 21 of 28
All Rights Reserved
Learning Task: Number Cube Sums
Suppose that a friend wants to play a game with you. She says, “Let’s roll two number cubes 10
times and find the sum of each roll. If the sum is 1, 2, 3, 4, 10, 11, or 12, you win. If the sum is
5, 6, 7, 8, or 9, I win.”
A. Would you want to play this game? Why or why not?
B. Roll the number cubes 10 times and record the sums. What did you find?
C. Repeat the game 5 more times. Were the results the same each time?
D. If you were to create a bar chart of the number of times each sum occurred, what would
that bar chart look like?
E. What do you think it would look like if you repeated the game 100 times?
F. Who would win most often? Explain why.
G. Show all possible sums. How many are there?
H. Would you change the rules of the game in some way that makes it equally likely for
Player A or Player B to win?
Georgia Department of Education Common Core Georgia Performance Standards Framework Student Edition
Seventh Grade Mathematics Unit 6
MATHEMATICS GRADE 7 UNIT 6: Probability
Georgia Department of Education
Dr. John D. Barge, State School Superintendent
April 2012 Page 22 of 28
All Rights Reserved
Performance Task: Dice Game
Michael, Janet, Kareta, and Chan are playing a game. Each person has chosen two special
numbers between 2 and 12. Here are the numbers they chose:
Michael: 7 and 8
Janet: 5 and 10
Kareta: 11 and 12
Chan: 4 and 9
They each take turns rolling a pair of dice. Each person receives 8 points whenever the total
number of dots on the two dice is equal to one of their special numbers. The winner is the first
person to get more than 100 points.
1. Play the game. Roll a pair of dice over and over again. Every time you roll, record the total of
the dice and the number of points scored for each of the 4 people. Stop rolling when someone
wins (makes more than 100 points). Who wins? Who would you expect to win if you played the
game again? Why?
2. Make a graph or some display showing the experimental probabilities of rolling each total
from 2 to 12. Using this information, for each person, Michael, Janet, Kareta, and Chan,
calculate the experimental probability of rolling one of their special numbers.
3. Make another display, like the one you did in part 3, showing the theoretical probabilities of
rolling each total from 2 to 12. Using this information, for each person, Michael, Janet, Kareta,
and Chan, calculate the theoretical probability of rolling one of their special numbers.
4. Using the displays you made in part 3 and 4, compare theoretical probabilities with
experimental probabilities. Are they different? How? Can you explain the reason for these
differences?
5. What would you expect if you played the game again? Why?
Georgia Department of Education Common Core Georgia Performance Standards Framework Student Edition
Seventh Grade Mathematics Unit 6
MATHEMATICS GRADE 7 UNIT 6: Probability
Georgia Department of Education
Dr. John D. Barge, State School Superintendent
April 2012 Page 23 of 28
All Rights Reserved
Performance Task : Is It Fair?
[This task was created from the activity sheet found at http://illuminations.nctm.org/lessons/9-
12/explorations/ExplorationsWithChance-AS-IsItFair.pdf.]
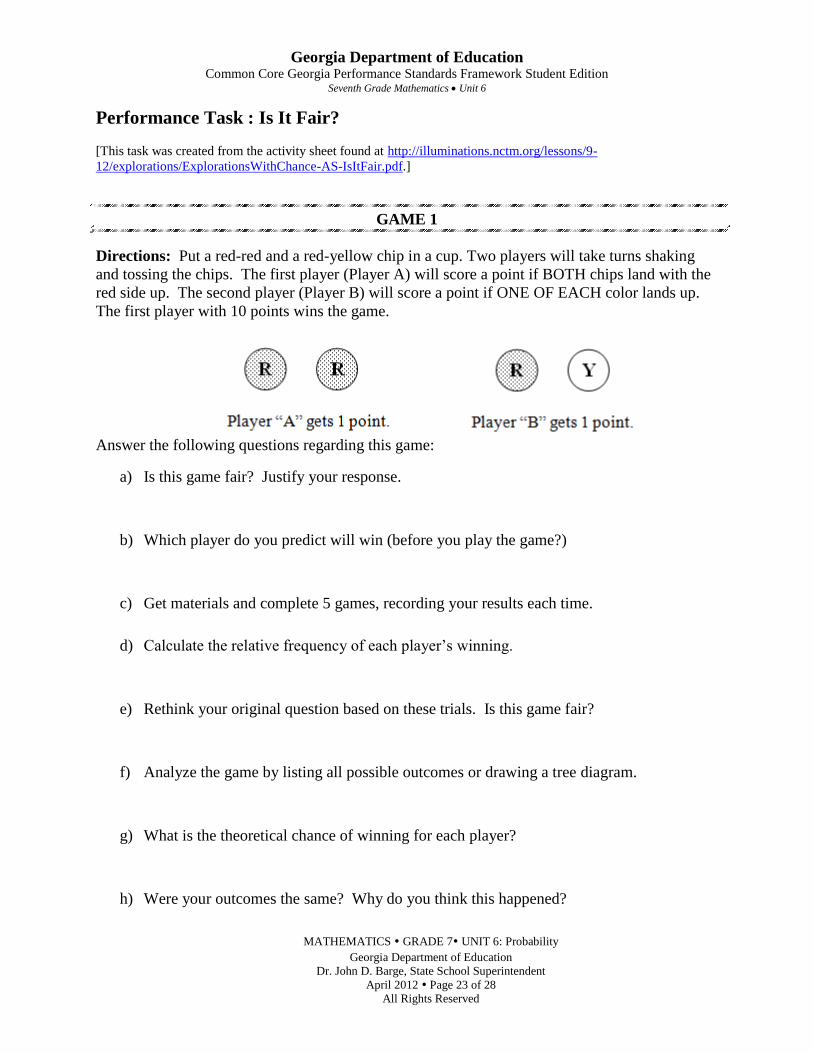
GAME 1
Directions: Put a red-red and a red-yellow chip in a cup. Two players will take turns shaking
and tossing the chips. The first player (Player A) will score a point if BOTH chips land with the
red side up. The second player (Player B) will score a point if ONE OF EACH color lands up.
The first player with 10 points wins the game.
Answer the following questions regarding this game:
a) Is this game fair? Justify your response.
b) Which player do you predict will win (before you play the game?)
c) Get materials and complete 5 games, recording your results each time.
d) Calculate the relative frequency of each player’s winning.
e) Rethink your original question based on these trials. Is this game fair?
f) Analyze the game by listing all possible outcomes or drawing a tree diagram.
g) What is the theoretical chance of winning for each player?
h) Were your outcomes the same? Why do you think this happened?
Georgia Department of Education Common Core Georgia Performance Standards Framework Student Edition
Seventh Grade Mathematics Unit 6
MATHEMATICS GRADE 7 UNIT 6: Probability
Georgia Department of Education
Dr. John D. Barge, State School Superintendent
April 2012 Page 24 of 28
All Rights Reserved
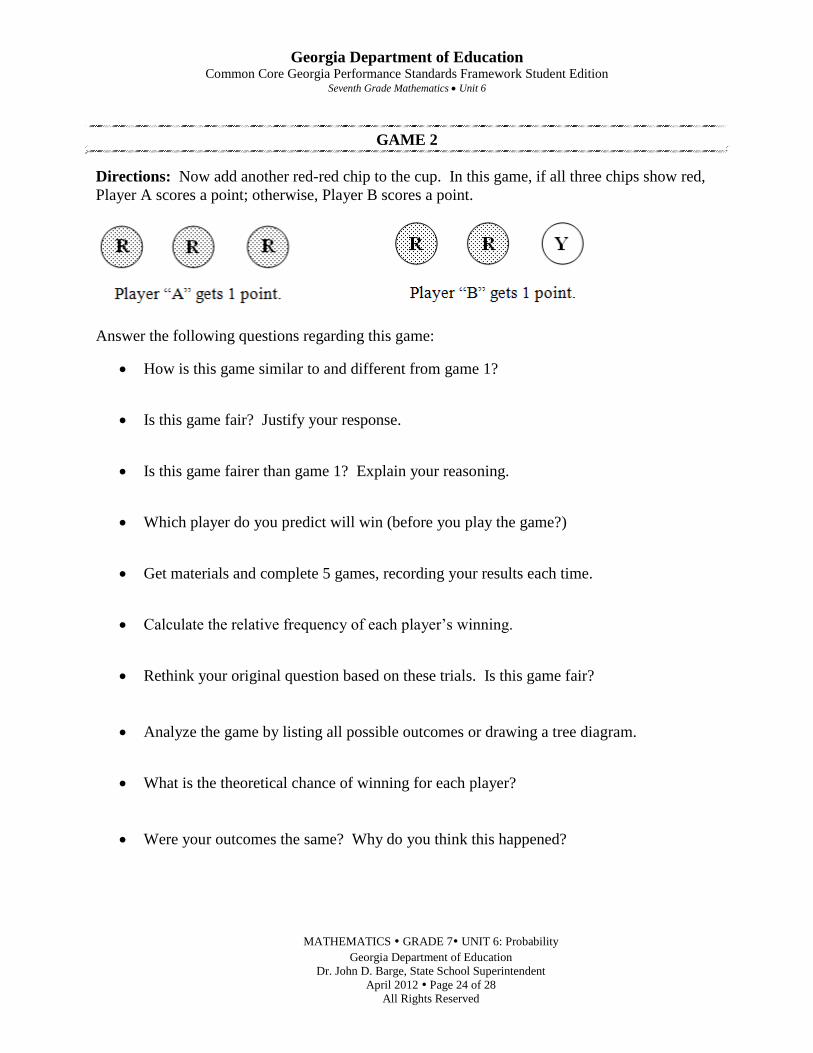
GAME 2
Directions: Now add another red-red chip to the cup. In this game, if all three chips show red,
Player A scores a point; otherwise, Player B scores a point.
Answer the following questions regarding this game:
How is this game similar to and different from game 1?
Is this game fair? Justify your response.
Is this game fairer than game 1? Explain your reasoning.
Which player do you predict will win (before you play the game?)
Get materials and complete 5 games, recording your results each time.
Calculate the relative frequency of each player’s winning.
Rethink your original question based on these trials. Is this game fair?
Analyze the game by listing all possible outcomes or drawing a tree diagram.
What is the theoretical chance of winning for each player?
Were your outcomes the same? Why do you think this happened?
Georgia Department of Education Common Core Georgia Performance Standards Framework Student Edition
Seventh Grade Mathematics Unit 6
MATHEMATICS GRADE 7 UNIT 6: Probability
Georgia Department of Education
Dr. John D. Barge, State School Superintendent
April 2012 Page 25 of 28
All Rights Reserved
GAME 3
Directions: Suppose that a red-red chip is replaced by a second red-yellow chip. Again, if all
three chips show red, Player A scores a point; otherwise, Player B scores a point.
Answer the following questions regarding this game:
How does replacing one of the red-red chips with a second red-yellow chip change the
outcomes?
Is Game 3 fair? Justify your response.
GAME 4
Directions: Try this game with three chips—red-blue, red-yellow, and blue-yellow. Player A
scores if all three chips are different colors; Player B scores a point if two chips match.
Predict the fairness of this game. Discuss your reasons before playing.
Play and record at least five games.
Find the relative frequency of each player’s winning to decide if the game appears to be
fair. How many outcomes are possible for this game? Make a tree diagram to help find
the theoretical probability for each player.
If this game is not fair, how would you change the scoring to make it fair?
Georgia Department of Education Common Core Georgia Performance Standards Framework Student Edition
Seventh Grade Mathematics Unit 6
MATHEMATICS GRADE 7 UNIT 6: Probability
Georgia Department of Education
Dr. John D. Barge, State School Superintendent
April 2012 Page 26 of 28
All Rights Reserved
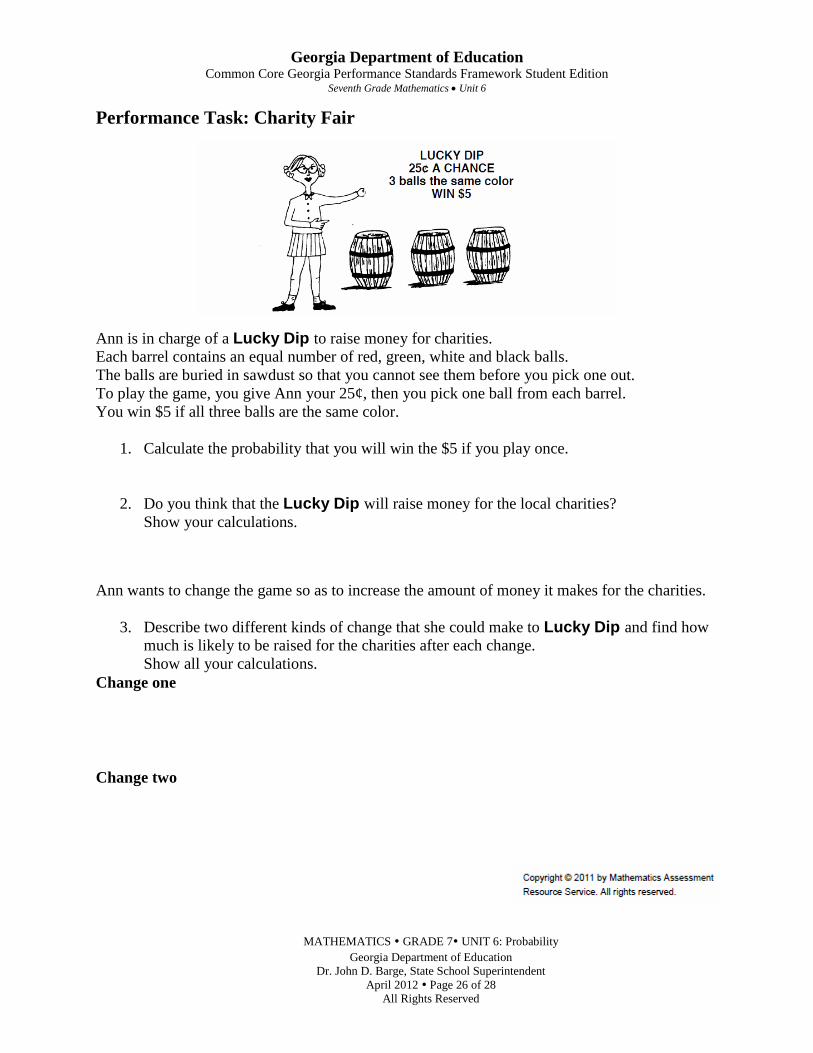
Performance Task: Charity Fair
Ann is in charge of a Lucky Dip to raise money for charities.
Each barrel contains an equal number of red, green, white and black balls.
The balls are buried in sawdust so that you cannot see them before you pick one out.
To play the game, you give Ann your 25¢, then you pick one ball from each barrel.
You win $5 if all three balls are the same color.
1. Calculate the probability that you will win the $5 if you play once.
2. Do you think that the Lucky Dip will raise money for the local charities?
Show your calculations.
Ann wants to change the game so as to increase the amount of money it makes for the charities.
3. Describe two different kinds of change that she could make to Lucky Dip and find how
much is likely to be raised for the charities after each change.
Show all your calculations.
Change one
Change two
Georgia Department of Education Common Core Georgia Performance Standards Framework Student Edition
Seventh Grade Mathematics Unit 6
MATHEMATICS GRADE 7 UNIT 6: Probability
Georgia Department of Education
Dr. John D. Barge, State School Superintendent
April 2012 Page 27 of 28
All Rights Reserved
Georgia Department of Education Common Core Georgia Performance Standards Framework Student Edition
Seventh Grade Mathematics Unit 6
MATHEMATICS GRADE 7 UNIT 6: Probability
Georgia Department of Education
Dr. John D. Barge, State School Superintendent
April 2012 Page 28 of 28
All Rights Reserved
Task: Designing Simulations
Source: Maryland Department of Education http://mdk12.org/instruction/clg/algebra_data_analysis/goal3.html
Describe how you would conduct one trial of a simulation model for each of the following
situations.
1. Based on his history, Stetson has an 80% chance of making a foul shot in a basketball
game. Suppose Stetson attempts 18 foul shots in a game. Describe one trial of a
simulation model for Stetson’s foul shot results in a game.
2. Based on her history, Mindy scores on 3/5 of her shots on goal in a field hockey game.
Suppose she attempts 8 shots on goal in a game. Describe one trial of a simulation model
for Mindy’s shots on goal results in a game.
3. The Bumble Bees’ chance of winning a football game is 20%. Suppose they play 15
football games in a season. Describe one trial of a simulation model for their 15 game
season.
4. Carlos has two chances to get the correct answer on a multiple-choice question with three
choices. Suppose he guesses. He will answer correctly on the first try 2/3 of the time. If
he has to try again, he has a 50% chance of getting the correct answer. Describe one trial
of a simulation model for Carlos getting the correct answer on a multiple-choice question.
5. Based on his history, Anthony has a 77% chance of making a foul shot in a basketball
game. Suppose he makes 16 shots in a game. Describe one trial of a simulation model for
Anthony’s foul shot results in a game.