Embed Size (px)
Citation preview

CBRE GROUP, INC.INVESTOR OVERVIEW
November 2018

INVESTOR DECK | 2
This presentation contains statements that are forward looking within the meaning of the Private Securities Litigation Reform Act of 1995. These include statements regarding CBRE’s future growth momentum, operations, market share, business outlook, and financial performance expectations. These statements are estimates only and actual results may ultimately differ from them. Except to the extent required by applicable securities laws, we undertake no obligation to update or publicly revise any of the forward-looking statements that you may hear today. Please refer to our third quarter earnings release, furnished on Form 8-K, our most recent annual report filed on Form 10-K and our most recent quarterly report filed on Form 10-Q, and in particular any discussion of risk factors or forward-looking statements therein, which are available on the SEC’s website (www.sec.gov), for a full discussion of the risks and other factors that may impact any forward-looking statements that you may hear today. We may make certain statements during the course of this presentation, which include references to “non-GAAP financial measures,” as defined by SEC regulations. Where required by these regulations, we have provided reconciliations of these measures to what we believe are the most directly comparable GAAP measures, which are attached hereto within the appendix.
Forward-Looking Statements

INVESTOR DECK | 3
Market Leadership• #1 Leasing
• #1 Property Sales
• #1 Outsourcing
• #1 Appraisal & Valuation
• #1 Property Management
• #1 US Commercial Developer
• $105 billion AUM3
Scale And Diversity• 5.5 billion square feet under
management1
• 450+ offices worldwide2
• Serves clients in over 100 countries2
• Serves over 90% of the Fortune 100
• Over 85,000 transactions in 2017
The Global Leader in an Expanding Industry I n t eg ra t ed se r v i c e s t o commerc ia l r ea l e s t a t e i n ve s to r s and occup ie r s
Leading Global Brand• Lipsey’s #1 CRE brand for 17 consecutive years
• One of the World’s Most Ethical Companies awarded by Ethisphere Institute for five straight years
• S&P 500 company since 2006
• Named a FORTUNE Most Admired Real Estate Company for six consecutive years
See slide 47 for footnotes

INVESTOR DECK | 4
CBRE STRATEGIC PRIORITIES
Intense Focus on Client Outcomes
Top Talent: Leadership and Production
Premier Platform, Notably Digital & Technology
Scale, Connectivity and Culture
Strategic Investment, Notably M&A and Digital & Tech
Thoughtful, Intensive Cost Management

INVESTOR DECK | 5
Why Reorganize? Advances CBRE’s Client-Focused Strategy
1. Elevate most talented executives into most impactful roles
2. Streamline lines of responsibility; flatter organization with greater accountability
3. Escalate focus on business line quality and Client Care program
4. Enhance operating efficiency and drive cost savings
5. Increase financial transparency
REAL ESTATEINVESTMENTS
ADVISORYSERVICES
GLOBAL WORKPLACE SOLUTIONS
CBRE’s Three Global Businesses – 2019 and Beyond

INVESTOR DECK | 6
Where Does CBRE Derive Its Revenue? Globa l marke t l eade r ac ro s s v i r t ua l l y a l l CBRE bu s i ne s s l i ne s
Manage Properties (Over 5 billion square feet):
- Outsourcing – manage facilities and projects for occupiers
- Property Management – for investor owned property
Investment Management – deploy institutional capital into real estate
Provide valuations and mortgage servicing
Deploy institutional capital into real estate development
Represent buyers and sellers of real estate; arrange financing
Represent tenants and landlords in leasing transactions
Contractual Sources3
$4,144 (44%)
Leasing$2,863 (30%)
Capital Markets2
$2,257 (24%)
0%
20%
40%
60%
80%
100%
2017
Total Fee Revenue4
$9,409
Development & Other1
See slide 47 for footnotes

INVESTOR DECK | 7
Contractual Sources3
$818 (21%)
Contractual Sources3
$4,144 (44%)Leasing$1,479 (40%)
Leasing$2,863 (30%)
Capital Markets2
$1,383 (37%)
Capital Markets2
$2,257 (24%)
Development & Other1
Development & Other1
Total Fee Revenue4: $3,742
Total Fee Revenue4: $9,409
2006 2017
61% of total fee revenue5
74% of total fee revenue5
See slide 47 for footnotes
Growing into a Better Balanced and More Resilient Business
$ in millions(%) – share of total fee revenue6
Note: 2017 fee revenue has been restated by $20M, or 0.2% of total fee revenue, in conjunction with ASC 606. We have not made a similar restatement for 2006, and fee revenue for 2006 continues to be reported under the accounting standards in effect for that period.
Con t rac t ua l r e venue s t oday a re l a rge r t han t he en t i r e company i n 2006

INVESTOR DECK | 8
0
1,000
2,000
3,000
4,000
Debt Maturing in 5 Years Liquidity
2006
0
1,000
2,000
3,000
4,000
Debt Maturing in 5 Years Liquidity
2017
CBRE’s Financial Flexibility Has Improved Dramatically
($ in millions) ($ in millions)
Note: As of December 31, 2006 and 2017, respectively. Liquidity is defined as cash and cash equivalents plus unused amounts under the revolving credit facility.

INVESTOR DECK | 9
CBRE Cycle Radar – Markets in BalanceCur ren t measu re s o f e conomic and CRE c yc l e sugges t an e x t ended c yc l e f rom he re
Q4 2006(One Year Prior to Start of Downturn)
CBRE proprietary Cycle Radar for Commercial Real Estate charts measure relative percentile for each metric at a point in time against the trailing 16 year history. The outside line represents the highest observed value for each metric over the last 16 years and the middle of the chart represents the lowest observed value.
Source: Real Capital Analytics, CBRE-Econometric Advisors, Federal Reserve, BoA Merrill Lynch, FactSetSee slide 50 for footnotes and methodology
Yield CurveTransaction
Velocity
Cap RateSpread
CRE Leverage
Supply
Rent Growth
Occupancy
REITValuation
Stock MarketValuation
TROUGH
PEAK
Q3 2018
TROUGH
Yield CurveTransaction
Velocity
Cap RateSpread
CRE Leverage
Supply
Rent Growth
Occupancy
REITValuation
Stock MarketValuation
PEAK

INVESTOR DECK | 10
Three Structural Tailwinds for Commercial Real Estate Services
1. Outsourcing – Occupier Acceptance of Outsourced Commercial Real Estate Services
2. Asset Allocation – By Institutional Investors to the Commercial Real Estate Asset Class
3. Consolidation – Customers are Driving Consolidation to Global Industry Leaders

INVESTOR DECK | 11
1992 1996 2000 2004 2008 2012 2016 2017
2006TCC
2013Norland
2015 JCI GWS
1990
First CRE Outsourcing
Contract
500+Major
Accounts
• High Barriers to Entry
• 5 Year Contracts Typical
• Facilities Management
• Project Management
• Transactions
• Consulting
Tailwind 1 – Occupiers of Real Estate Increasingly Turn to Outsourcing CBRE ’ s marke t l ead ing pos i t i on d r i v en by bo th o rgan i c g row th and s t ra t eg i c M&A

INVESTOR DECK | 12
Tailwind 2 – Increasing Institutional Ownership of CRE Drives Demand for ServicesI n s t i t u t i on s a re more f r equen t u se r s o f CRE se r v i c e s v s . l egac y owne r sh ip
Institutional Asset Allocation to Real Estate has Increased Strongly Over Time
Source: NAIOP, Federal Reserve Board of Governors, The Conference Board, Pension & Investments, Hodes Weill & Associates
0%
2.0%
4.0%
6.0%
8.0%
10.0%
1980 1990 2000 2010 2016

INVESTOR DECK | 13
Tailwind 3 – CBRE Holds the Market Leading Position in a Consolidating Industry
Notes: Revenues of private companies are estimated; CBRE 2015 gross revenue includes four months of actual gross revenue from the acquired GWS business while under our ownership, annualized for illustrative purposes; other public companies are as reported, with Savills revenue translated to US Dollars. C&W’s 2015 revenue is a pro forma figure to adjust for the acquisitions of Cassidy Turley and DTZ. Figures have not been adjusted for ASC 606.
CBRE has pu r sued and won 5 o f t he 12 me rge r s no t ed be low (d id no t b id on o the r 7 )

INVESTOR DECK | 14
• Focused technology investments further differentiating CBRE and its professionals
• CBRE can make impactful investments at a smaller percentage of company spend vs others
CBRE Floored
SaaS Interactive Creation of 3D Floor Plans and Virtual Environments
Sample of CBRE Technology Investments
www.cbre.com/vantage
CBRE Deal IQ Forum Analytics
Leading Predictive Analytics Platform
SaaS CRM and Deal Management Platform
We Believe Digital Opportunities Significantly Exceed Disruption Risk

INVESTOR DECK | 15
CBRE 360 e xpe r i ence ope ra t i ng s y s t em connec t s t enan t s w i t h CBRE t eams , se r v i c e s & amen i t i e s CBRE 360: Connecting Tenant Experience to CBRE Managed Properties
BRANDED HOME SCREEN VISITOR MANAGEMENT VIRTUAL ASSISTANTTENANT SERVICES MOBILE BUILDING ACCESS

INVESTOR DECK | 16
Client Size Has Grown as CBRE’s Capabilities ExpandedNumbe r o f La rge C l i en t s Has I nc reased a s Ab i l i t y t o Se r v i c e t he se C l i en t s Has E xpanded
$100 millionor more
$50 to $100 million
$25 to $50 million
2012 2017
13 50
5
1
15
17
Figures in gross revenue, not adjusted for ASC 606.

INVESTOR DECK | 17
CBRE Has Increased Profit Margin While Improving Business Mix
Note: Profit margin defined as adjusted net income/fee revenue.Note: 2016 and 2017 profit margin figures were restated for ASC 606. We have not made a similar restatement for 2012-2015, and profit margin figures for such periods continue to be reported under the accounting standards in effect during those periods.
4%
5%
6%
7%
8%
9%
10%
2012 2013 2014 2015 2016 2017 2018P1
See slide 48 for footnotes

INVESTOR DECK | 18
0%
30%
60%
90%
120%
150%
2012 2013 2014 2015 2016 2017
S&P 500 CBRE (Adj. EPS)
Track Record – High-Quality Earnings Growth Materially Outpaced the MarketE igh t consecu t i v e yea r s o f doub le -d ig i t ad ju s t ed EPS g row th 1
Le ve rage ra t i o 2 dec l i ned t o 0 .8 x i n 2017 f rom 1 .7 x i n 2012
Source: FactSet, Company filings
Note: 2016 and 2017 adjusted EPS were restated for ASC 606. 2016 adjusted EPS did not change, and 2017 was restated by $0.02 per share or less than 1% of adjusted EPS. We have not made a similar restatement for 2012-2015, and adjusted EPS for such periods continues to be reported under the accounting standards in effect for those periods.
Cumulative Adjusted EPS Growth – CBRE vs S&P 500
See slide 48 for footnotes

INVESTOR DECK | 19
CBRE is Positioned for Long-Term Growth
1. CBRE holds a commanding competitive position,
2. In a services industry supported by strong structural tailwinds,
3. CBRE has achieved significant earnings growth over two decades,
4. While increasing the resiliency of its business mix and the strength of its balance sheet.
0
500
1,000
1,500
2,000
1997 2006 2017
Adjusted EBITDA1 CAGR+16% Since 1997
1st yr. following initial IPOAd
just
ed E
BITD
A
($ in millions)
Note: 2017 adjusted EBITDA was restated for ASC 606. We have not made a similar restatement for 1997 or 2006, and adjusted EBITDA figures for such periods continue to be reported under the accounting standards in effect during those periods.
See slide 48 for footnotes

BUSINESS LINE SLIDES

INVESTOR DECK | 21
$2,280 $2,526
$1,813
$2,205
2016 2017 2018
Full Year YTD Q3
2017 YTD Q3 2018
New 148 117
Expansions 193 197
Renewals 128 89
Historical Fee Revenue1 Overview
Total Contracts
• Full service offering
• Facilities Management – approximately 2.4 billion square feet globally as of 12/31/2017
• Project Management
• Transaction Services
• Strategic Consulting
• Ranked among the top few outsourcing service providers across all industries for seven consecutive years2
Facilities Management
Transaction Services
Project Management
Representative Clients
($ in millions)
Occupier OutsourcingI n t eg ra ted Globa l So lu t ions fo r Occup ie r s
See slide 48 for footnotes

INVESTOR DECK | 22
Historical Fee Revenue1 Overview
Selected Strategic Accounts
• Manages buildings for investors
– Highly synergistic with property leasing
• Manages approximately 3.1 billion square feet globally as of 12/31/172
See slide 48 for footnotes
Property ManagementOpt im iz ing Bu i ld ing Opera t ing Pe r fo rmance fo r I n ves to r s
($ in millions)
RECENT ASSIGNMENTS
Gateway PortfolioMid-AtlanticIndustrial6 MSF
615 S. College StreetCharlotte, N.C.Office375,865 SF
The BlocLos Angeles, CAMixed-Use1.2 MSF
$505 $555
$397$447
2016 2017 2018
Full Year YTD Q3

INVESTOR DECK | 23
Global$3.3
EMEA$3.8
US$2.0
APAC$0.8
Value Add Funds$1.5
Separate Accounts
$5.2
Core/Core+ Funds$3.2
Funds31%
Separate Accounts
55%
Securities14%
Americas38%
EMEA52%
Asia Pacific10%
Capital Raised1
Assets under Management (AUM)3
$103.2B as of 12/31/2017
Overview($ in billions)
$9.9$10.7
2014 2015 2016 2017 Q3 TTM2018
$8.3$7.0
$8.6
• Performance-driven global real estate investment manager
• 45 year track record
• Global platform, 21 countries
• More than 500 institutional clients
• Equity to deploy: approx. $6,900 million1,2
• Co-Investment: $168.6 million2
($ in billions)
Investment ManagementPer fo rmance Ac ros s R i s k/Re tu rn Spec t rum Globa l l y
See slide 48 for footnotes
$9.9B Capital Raised in 20171
($ in billions)

INVESTOR DECK | 24
$504$528
$373$399
2016 2017 2018
Full Year YTD Q3
Premier Clients
• Euromoney Global Valuation Advisor of the Year for five consecutive years
• Clients include lenders, life insurance companies, special servicers and REITs
OverviewHistorical Revenue
Appraisal & ValuationServ ing C l i en t s G loba l l y
($ in millions)

INVESTOR DECK | 25
Office$81.6B
Retail$17.4B
Industrial$18.4B
Other$2.9B
• Advise occupiers and investors in executing lease strategies
• 2017 US consideration 59% tenant rep/41% landlord rep1
0
500
1,000
1,500
2,000
2,500
3,000
3,500
2003
2004
2005
2006
2007
2008
2009
2010
2011
2012
2013
2014
2015
2016
2017
CBRE Leasing Revenue is Largely Recurring Over Time2
A Recession Typically Causes a Short-Term Deferral of Deal Volume
$2,652 $2,863
$1,850$2,140
2016 2017 2018
Full Year YTD Q3
OverviewHistorical Revenue
LeasingS t ra teg i c Adv i so r y and Execu t ion
Trammell Crow Company Acquisition
See slide 48 for footnotes
($ in millions)
• Leasing commissions occur when leases expire (tenants renew or move)
• Long-term growth determined by employment growth and market share
• Leasing activity is deferred but not lost during a recession
− CBRE leasing revenue declined by 28% from 2007 to 2009 but recovered by 29% in 2010
2017 CBRE Global Lease Consideration by Property Type
($ in millions)
Note: 2016 and 2017 leasing revenue figures were restated for ASC 606. We have not made a similar restatement for 2003-2015, and leasing revenue figures for such periods continue to be reported under the accounting standards in effect during those periods.

INVESTOR DECK | 26
Historical Revenue
• #1 global market share, based on Real Capital Analytics$1,701 $1,806
$1,243 $1,315
2016 2017 2018
Full Year YTD Q3
Increased Ownership by Active Portfolio Managers Drives Sales Velocity
Overview
Source: NAREIT, NCREIF, Preqin, and Goldman Sachs Research
($ billions of equity value)
2007 – 2016 ▲160+%
Property SalesI n s igh t and Execu t ion Ac ros s Marke t s & P roper t y T ypes
• Private equity firms, REITs and open-end funds are active traders of real estate and account for an increasingly larger portion of the investment market
• Many large, traditional owners do not actively trade
• As a result, transaction volumes should increase over time
0
400
800
1,200
1,600
2,000
2000
2001
2002
2003
2004
2005
2006
2007
2008
2009
2010
2011
2012
2013
2014
2015
2016
Under $25M31%
$25M-$100M
40%
$100M+29%Office
$83.1B
Retail$29.9B
Industrial$37.9B
Multi-family$42.5B
Other$23.9B
2017 CBRE Global Consideration by Property Type
2017 CBRE US Consideration by Deal Size
($ in millions)

INVESTOR DECK | 27
$571 $608
$412
$491
2016 2017 2018
Full Year YTD Q3
Historical Revenue
Recent Transactions
• A leading strategic advisor for debt and structured finance solutions
– Highly synergistic with property sales
• Key services:
– Loan origination / debt placement
– Portfolio loan sales
– Loan servicing
• $46.6 billion of global mortgage activity in 20171
• Commercial loan origination with government agencies $17.9 billion2 in 2017
• $196 billion loan servicing portfolio as of 9/30/18
Overview
See slide 49 for footnotes
Commercial Mortgage Origination & ServicingP remie r Deb t and S t ruc tu red F inance So lu t ions
National Portfolio Philadelphia, PA Ireland
Stonemont Financial Group
Oaktree Capital Management Kennedy Wilson
$1.1 Billion $157 Million $140 MillionAcquisition Financing Acquisition Financing Construction Financing
($ in millions)

INVESTOR DECK | 28
Healthcare4%
Office35%
Industrial30%
Residential23%
Retail4%
Hotel3%
Other1%
5.4 6.7 6.6 6.88.8
4.03.6 4.2 3.8
3.6
2014 2015 2016 2017 Q3 2018
In Process Pipeline2
Projects In Process/Pipeline1 Overview
Recent Projects
• A premier brand in U.S. development
– 70 year record of excellence
• Partner with leading institutional capital sources
• Modest capital required from CBRE
• $92.5 million of co-investments as of Q3 2018
• $8.1 million in repayment guarantees on outstanding debt balances as of Q3 2018
($ in billions)
3
Development ServicesT rammel l C row Company – A P remie r B rand in U .S . Deve lopmen t
LA Plaza Principio Commerce Park
Los Angeles, CAMixed-use
North End, MDIndustrial
2017 In Process by Product Type
See slide 49 for footnotes

APPENDIX

INVESTOR DECK | 30
Revenue ($ in millions)
Contractual Revenue Sources Leasing Capital Markets Other
Occupier Outsourcing2
Property Management2
InvestmentManagement Valuation
Loan Servicing Leasing Sales
Commercial Mortgage
OriginationDevelopment
Services Other Total
Revenue
2017 $ 11,146 $ 1,155 $ 378 $ 528 $ 157 $ 2,863 $ 1,806 $ 451 $ 61 $ 84 $ 18,629
Fee Revenue3
2017 $ 2,526 $ 555 $ 378 $ 528 $ 157 $ 2,863 $ 1,806 $ 451 $ 61 $ 84 $ 9,409
% of Total Fee Revenue
27% 6% 4% 5% 2% 30% 19% 5% 1% 1% 100%
Fee Revenue Growth Rate (Change 2017-over- 2016)
USD ▲11% ▲10% ▲2% ▲5% ▲ 29% ▲8% ▲6% ▲1% ▲9% ▼-2% ▲8%
Local Currency ▲12% ▲10% ▲3% ▲4% ▲ 29% ▲8% ▲6% ▲1% ▲9% ▼-2% ▲8%
Contractual revenue & leasing, which is largely recurring over time1, is 74% of fee revenue
74% of total fee revenue
See slide 49 for footnotes
2017 Revenue
Note: 2016 and 2017 figures were restated for ASC 606.

INVESTOR DECK | 31
Revenue ($ in millions)
Contractual Revenue Sources Leasing Capital Markets Other
Occupier Outsourcing2
Property Management2
InvestmentManagement Valuation
Loan Servicing Leasing Sales
Commercial Mortgage
OriginationDevelopment
Services Other Total
Revenue
Q3 2018 $ 3,215 $ 303 $ 93 $ 135 $ 46 $ 823 $ 473 $ 132 $ 21 $ 20 $ 5,261
Fee Revenue3
Q3 2018 $ 730 $ 148 $ 93 $ 135 $ 46 $ 823 $ 473 $ 132 $ 21 $ 20 $ 2,621
% of Q3 2018 Total Fee Revenue
28% 6% 3% 5% 2% 31% 18% 5% 1% 1% 100%
Fee Revenue Growth Rate (Change Q3 2018-over-Q3 2017)
USD ▲ 15% ▲ 7% ▲ 1% ▲ 6% ▲ 21% ▲ 17% ▲ 4% ▲ 22% ▲ 63% ▼-12% ▲ 13%
Local Currency ▲ 16% ▲ 8% ▲ 1% ▲ 7% ▲ 21% ▲ 18% ▲ 5% ▲ 22% ▲ 63% ▼-11% ▲ 14%
75% of total fee revenue
Contractual revenue & leasing, which is largely recurring over time1, is 75% of fee revenue
See slide 49 for footnotes
Q3 2018 Revenue

INVESTOR DECK | 32
3.0x
0.0x
1.0xLeve
rage
Rat
io
Recession Recovery
Above Target Leverage (>2.0x):• Prioritize debt reduction absent compelling early-cycle investments• Avoid leverage in this range later in the business cycle
PlateauExpansion
Lower Leverage (<1.0x):• Comfortable with lower leverage later in the business cycle• Option on future actions with high potential for value creation• If leverage approaches zero, emphasize returning capital to shareholders
Long-Term Target Leverage Range (1.0x to 2.0x)
2.0x
Business Cycle Increasing Risk to Deploy Capital →
CBRE Leverage GuidepostsBu i ld L iqu id i t y when Cap i ta l i s Abundan t – Dep loy when Sca rce

INVESTOR DECK | 33
Mandatory Amortization and Maturity Schedule
1. $2,800 million revolving credit facility matures in October 2022. As of September 30, 2018, the revolving credit facility balance was $141 million.
3,107
891
425600
0
500
1,000
1,500
2,000
2,500
3,000
3,500
Liquidity 2018 2019 2020 2021 2022 2023 2024 2025 2026
Cash Revolving Credit Facility Term Loan A Senior Notes - 5.25% Senior Notes - 4.875%
Global Cash
Available Revolving
Credit Facility
($ in millions) As of September 30, 20181

INVESTOR DECK | 34
ADVISORY & TRANSACTION
CAPITAL MARKETS
FACILITIES MANAGEMENT
PROJECT MANAGEMENT
PROPERTY MANAGEMENT VALUATION
Client 1
Client 2
Client 3
Client 4
Client 5
Client 6
Client 7
Client 8
Client 9
Client 10
Client 11
Client 12
Client 13
Client 14
Client 15
Client 16
Client 17
Client 18
Client 19
Client 20
Broad Market Leadership Increases Client Value
• CBRE’s position difficult to replicate: – Breadth of product offering– Leadership within products– Deep local expertise– Ability to “Sell the entire firm”
• CBRE benefits from efforts to consolidate vendors
= Revenue between $1M and $5M
= Revenue between $5M and $10M
= Revenue greater than $10M
Revenue of CBRE Top 20 Clients, Randomly Sorted
As of December 31, 2017Figures in gross revenue, not adjusted for ASC 606.
CBRE ’ s La rge s t C l i en t s Gene ra t e Subs tan t i a l Re venue f rom Mu l t i p l e L i ne s o f Bu s i ne s s
INVESTOR DECK | 35
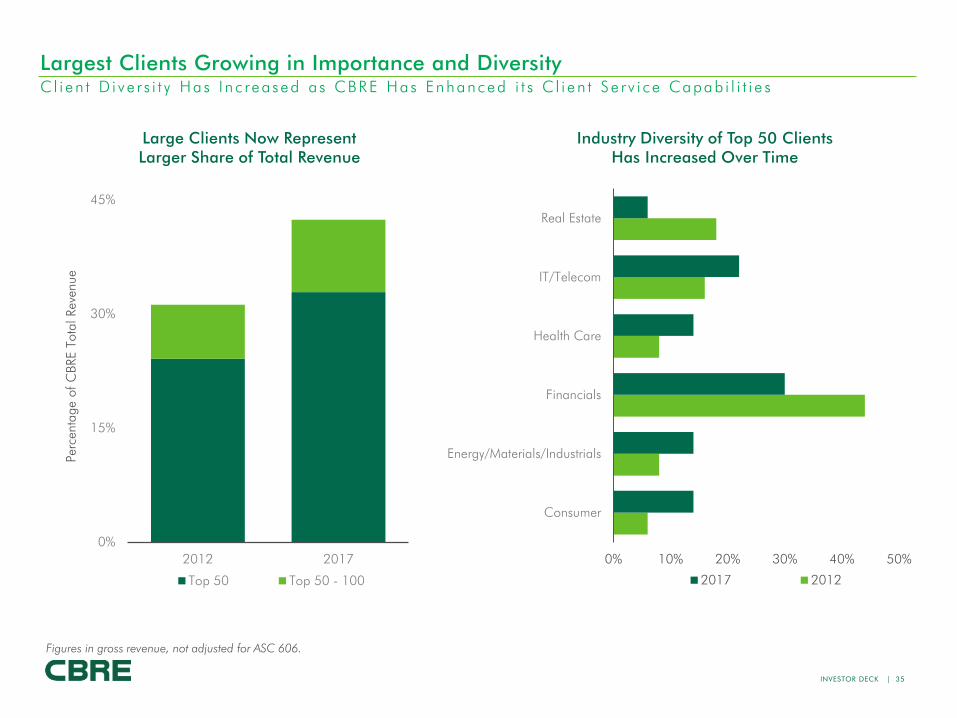
Largest Clients Growing in Importance and Diversity
Large Clients Now Represent Larger Share of Total Revenue
Industry Diversity of Top 50 Clients Has Increased Over Time
0%
15%
30%
45%
2012 2017
Top 50 Top 50 - 100
Perc
enta
ge o
f CBR
E To
tal R
even
ue
0% 10% 20% 30% 40% 50%
Consumer
Energy/Materials/Industrials
Financials
Health Care
IT/Telecom
Real Estate
2017 2012
Figures in gross revenue, not adjusted for ASC 606.
Cl i en t D i ve r s i t y Has I nc reased a s CBRE Has Enhanced i t s C l i en t Se r v i c e Capab i l i t i e s

INVESTOR DECK | 36
CBRE Has Taken Share in Leasing and Property Sales
Sources: Global property sales is based on RCA (Real Capital Analytics), US average office rent is based on data from CBRE Econometric AdvisorsNote: 2017 Americas leasing revenue has been restated by $2M, or 0.1% of total Americas leasing revenue, in conjunction with ASC 606. We have not made a similar restatement for 2007, and Americas leasing revenue for 2007 continues to be reported under the accounting standards in effect for that period.
CBRE Americas Leasing Revenue Up 66% in 10 Years Against US Office Rents Up 7%
Global Property Sales Share Increased Without a Major Capital Markets Acquisition
0%
5%
10%
15%
20%
25%
2007 2017
CBR
E G
loba
l Pro
perty
Sal
es S
hare
$0
$20
$40
$60
$80
$100
$120
$0
$500
$1,000
$1,500
$2,000
$2,500
2007 2017
Effe
ctiv
e Re
nt $
/SF
Reve
nue
$ in
mill
ions
Americas Leasing Revenue US Avg. Office Rent
CBRE marke t sha re ga in s d r i v en by s i gn i f i can t r e c ru i t i ng succe s s

INVESTOR DECK | 37
CBRE Attracts and Retains Top Talent in the Industry
3-Year Summary: Hires and Losses from and to Competitors (U.S.)
Boutique Competitors are Increasingly Less Competitive
Note: Hires do not include hundreds of internal hires and hires from non-direct competitors
0
100
200
300
400
500
600
700
Hires Losses
# o
f Pro
duce
rs
22% of producers lost to competitors were either involuntarily terminated or on performance improvement plan
6% of producers lost to competitors were top 250 producers 0
100
200
300
400
Large Competitors Other Competitors
# o
f Hire
s fro
m C
ompe
titor
s
3-Year Total

INVESTOR DECK | 38
CONSULTING AND ANALYTICS
GWS Revenue is Balanced and Diversified
• Typical 3-5 year contract terms• 90%+ renewal rate on expiring
contracts• Many 20+ year clients in portfolio• Growth in each phase of economic
cycle• Exploring software as a service
• Fees generally based on a percentage of capital project costs and/or mark-up on labor
• Short- and long-term contracts
• Commissions split with local market broker
• Portfolio-based contracts • Business includes new transactions
(buying, selling, leasing) and recurring lease renewals
Variable fee revenue | Short- and long-term contractsRecommendations often generate outsourcing decisions, service placement, workplace strategy, technology deployment, process
automation, advanced analytics
~53%GWS revenues2
~23%GWS revenues2
~24%GWS revenues2
1. Advisory and Transactions revenue represents all contractual brokerage business, delivered through dedicated, on-account teams as well as through local brokers.2. Gross revenues
ADVISORY & TRANSACTIONS | OCCUPIER1
PROJECTMANAGEMENT
FACILITIESMANAGEMENT
GWS ACCOUNT MANAGEMENT

INVESTOR DECK | 39
Occupier Leasing Advisory2
Advisory services on transactions, leasing, labor analytics, etc.
Significant Total Addressable Opportunity for Real Estate Outsourcing Services
$ i n B i l l i o n s
MARKET SIZE1
1. Market size is as of 2015.2. CBRE Occupier Leasing Advisory revenue reported in leasing.3. CBRE Integrated Facilities Management and Project Management revenue reported in Occupier Outsourcing.Sources: CBRE and McKinsey analysis; Frost & Sullivan (Global IFM Market, March 2015); KPMG REFM Pulse Report (2015), Engineering News Record’s Program Management Report (2015), Morningstar’s CRE services report (2014), Emerson Power, the Uptime Institute, CoStar, IBIS World Project Management Report (2015)
Integrated Facilities Management3
Only includes corporations/occupiers that outsource an
integrated bundle of FM hard and soft services
Project Management2
Management of projects and Capex programs in corporate
facilities
$30-$40
$70-$80
$40-$50
$140B+ Ou t sou rc i ng Spend Ava i l ab l e

INVESTOR DECK | 40
Non-GAAP financial measures
The following measures are considered “non-GAAP financial measures” under SEC guidelines:I. fee revenueII. contractual fee revenueIII. net income attributable to CBRE Group, Inc., as adjusted (which we also refer to as “adjusted net income”)IV. diluted income per share attributable to CBRE Group, Inc. shareholders, as adjusted (which we also refer to as “adjusted earnings per share” or
“adjusted EPS”)V. EBITDA and adjusted EBITDAThese measures are not recognized measurements under United States generally accepted accounting principles, or “GAAP.” When analyzing our operating performance, readers should use them in addition to, and not as an alternative for, their most directly comparable financial measure calculated and presented in accordance with GAAP. Because not all companies use identical calculations, our presentation of these measures may not be comparable to similarly titled measures of other companies.Our management generally uses these non-GAAP financial measures to evaluate operating performance and for other discretionary purposes. The company believes that these measures provide a more complete understanding of ongoing operations, enhance comparability of current results to prior periods and may be useful for investors to analyze our financial performance because they eliminate the impact of selected charges that may obscure trends in the underlying performance of our business. The company further uses certain of these measures, and believes that they are useful to investors, for purposes described below.With respect to fee revenue: the company believes that investors may find this measure useful to analyze the financial performance of our Occupier Outsourcing and Property Management business lines and our business generally. Fee revenue excludes costs reimbursable by clients, and as such provides greater visibility into the underlying performance of our business.With respect to contractual fee revenue: the company believes that investors may find this measure useful to analyze our overall financial performance because it identifies revenue streams that are typically more stable over time. With respect to adjusted net income, adjusted EPS, EBITDA and adjusted EBITDA: the company believes that investors may find these measures useful in evaluating our operating performance compared to that of other companies in our industry because these calculations generally eliminate the accounting effects of acquisitions, which would include impairment charges of goodwill and intangibles created from acquisitions—and in the case of EBITDA and adjusted EBITDA—the effects of financings and income tax and the accounting effects of capital spending. All of these measures may vary for different companies for reasons unrelated to overall operating performance. In the case of EBITDA and adjusted EBITDA, these measures are not intended to be measures of free cash flow for our management’s discretionary use because they do not consider cash requirements such as tax and debt service payments. The EBITDA and adjusted EBITDA measures calculated herein may also differ from the amounts calculated under similarly titled definitions in our credit facilities and debt instruments, which amounts are further adjusted to reflect certain other cash and non-cash charges and are used by us to determine compliance with financial covenants therein and our ability to engage in certain activities, such as incurring additional debt and making certain restricted payments. The company also uses adjusted EBITDA and adjusted EPS as significant components when measuring our operating performance under our employee incentive compensation programs.
INVESTOR DECK | 41
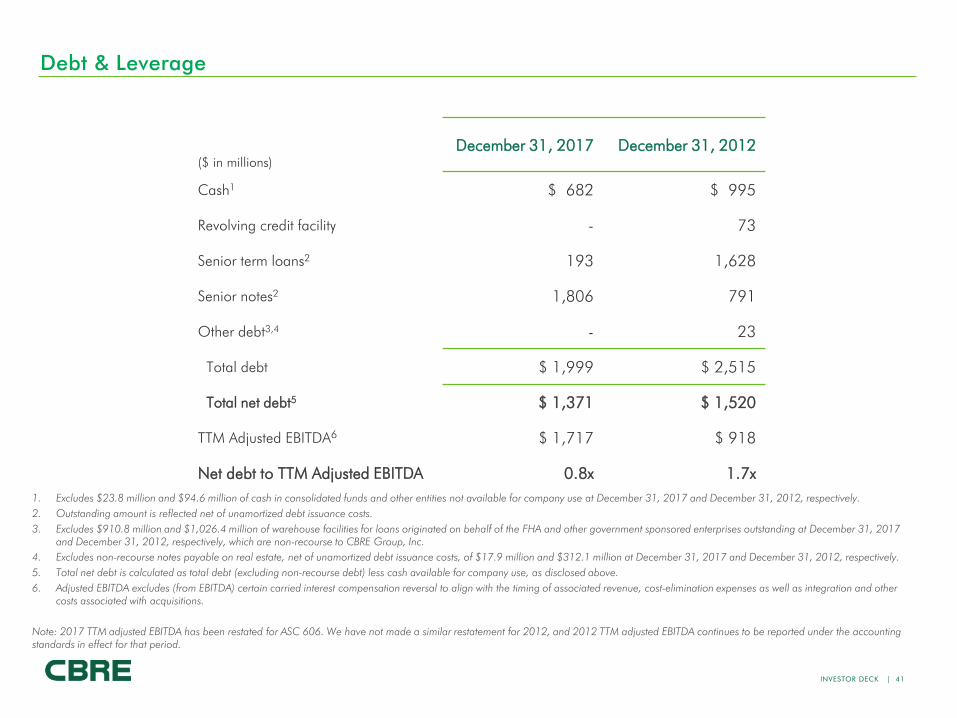
Debt & Leverage
1. Excludes $23.8 million and $94.6 million of cash in consolidated funds and other entities not available for company use at December 31, 2017 and December 31, 2012, respectively.2. Outstanding amount is reflected net of unamortized debt issuance costs.3. Excludes $910.8 million and $1,026.4 million of warehouse facilities for loans originated on behalf of the FHA and other government sponsored enterprises outstanding at December 31, 2017
and December 31, 2012, respectively, which are non-recourse to CBRE Group, Inc. 4. Excludes non-recourse notes payable on real estate, net of unamortized debt issuance costs, of $17.9 million and $312.1 million at December 31, 2017 and December 31, 2012, respectively.5. Total net debt is calculated as total debt (excluding non-recourse debt) less cash available for company use, as disclosed above. 6. Adjusted EBITDA excludes (from EBITDA) certain carried interest compensation reversal to align with the timing of associated revenue, cost-elimination expenses as well as integration and other
costs associated with acquisitions.
Note: 2017 TTM adjusted EBITDA has been restated for ASC 606. We have not made a similar restatement for 2012, and 2012 TTM adjusted EBITDA continues to be reported under the accounting standards in effect for that period.
($ in millions)December 31, 2017 December 31, 2012
Cash1 $ 682 $ 995
Revolving credit facility - 73
Senior term loans2 193 1,628
Senior notes2 1,806 791
Other debt3,4 - 23
Total debt $ 1,999 $ 2,515
Total net debt5 $ 1,371 $ 1,520
TTM Adjusted EBITDA6 $ 1,717 $ 918
Net debt to TTM Adjusted EBITDA 0.8x 1.7x

INVESTOR DECK | 42
Twelve Months Ended December 31,
($ in millions) 2017 20121 2006 1997
Adjusted EBITDA $ 1,716.7 $ 918.4 $ 653.5 $ 90.1
Adjustments:Integration and other costs related to acquisitions 27.3 39.2 7.6 -
Cost-elimination expenses - 17.6 - -Carried interest incentive compensation (reversal) expense to align with the timing of associated revenue2
(8.5) - - -
Income related to investment in Savills plc (disposed of in 2007) - - (8.6) -
Merger-related and other non-recurring costs - - - 13.8
EBITDA 1,697.9 861.6 652.5 76.3
Add:
Interest income 9.9 7.6 9.8 2.6
Less:
Depreciation and amortization 406.1 170.9 67.6 18.1
Non-amortizable intangible asset impairment - 19.8 - -
Interest expense 136.8 176.6 45.0 15.8Write-off of financing costs on extinguisheddebt - - 33.8 -
Provision for income taxes 467.8 186.3 198.3 20.6
Net income attributable to CBRE Group, Inc. $ 697.1 $ 315.6 $ 318.6 $ 24.4
Reconciliation of Adjusted EBITDA to EBITDA to Net Income
1. Includes an immaterial amount of activity from discontinued operations. 2. CBRE began adjusting carried interest compensation expense in Q2 2013 in order to better match the timing of this expense with associated carried interest revenue. This expense
has only been adjusted for funds that incurred carried interest expense for the first time in Q2 2013 or in subsequent quarters.
Note: 2016 and 2017 figures were restated for ASC 606. We have not made a similar restatement for 1997, 2006, and 2012, and such periods continue to be reported under the accounting standards in effect for such periods.

INVESTOR DECK | 43
Twelve Months Ended December 31,
($ in millions, except per share amounts) 2017 2016 2015 2014 20132 20122
Net income attributable to CBRE Group, Inc. $ 697.1 $ 573.1 $ 547.1 $ 484.5 $ 316.5 $ 315.6
Amortization expense related to certain intangible assets attributable to acquisitions
112.9 111.1 86.6 66.1 29.4 37.2
Integration and other costs related to acquisitions 27.3 125.7 48.9 - 12.6 39.2
Carried interest incentive compensation (reversal) expense to align with the timing of associated revenue1
(8.5) (15.6) 26.1 23.8 9.2 -
Cost-elimination expenses - 78.5 40.4 - 17.6 17.6
Write-off of financing costs on extinguished debt - - 2.7 23.1 56.3 -
Goodwill and other non-amortizable intangible asset impairment - - - - 98.1 19.8
Tax impact of adjusted items (42.1) (93.2) (62.6) (36.4) (65.4) (30.0)
Impact of US tax reform 143.4 - - - - -
Adjusted net income $ 930.1 $ 779.6 $ 689.2 $ 561.1 $ 474.3 $ 399.4
Adjusted diluted earnings per share $ 2.73 $ 2.30 $ 2.05 $ 1.68 $ 1.43 $ 1.22
Weighted average shares outstandingfor diluted income per share
340,783,556 338,424,563 336,414,856 334,171,509 331,762,854 327,044,145
Reconciliation of Net Income to Adjusted Net Income and Adjusted Earnings Per Share
1. Carried-interest incentive compensation expense is related to funds that began recording carried interest expense in Q2 2013 and beyond.2. Includes discontinued operations.
Note: 2016 and 2017 figures were restated for ASC 606. We have not made a similar restatement for 2012-2015, and such periods continue to be reported under the accounting standards in effect for such periods.

INVESTOR DECK | 44
Twelve Months Ended December 31,
($ in millions) 2017 2016 2015 2014 20131 20121 2006
Consolidated revenue $ 18,628.8 $ 17,369.1 $ 10,855.8 $ 9,049.9 $ 7,194.2 $ 6,519.8 $ 4,032.0
Less:Client reimbursed costs largelyassociated with employees dedicated to client facilities and subcontracted vendor work performed for clients 9,219.8 8,644.8 3,125.5 2,258.6 1,567.7 1,424.2 289.7
Consolidated fee revenue $ 9,409.0 $ 8,724.3 $ 7,730.3 $ 6,791.3 $ 5,626.5 $ 5,095.6 $ 3,742.3
Less:
Non-contractual fee revenue 5,265.1 4,942.6 2,924.3
Contractual fee revenue $ 4,143.9 $ 3,781.7 $ 818.0
Adjusted net income $ 930.1 $ 779.6 $ 689.2 $ 561.1 $ 474.3 $ 399.4
Profit margin 9.9% 8.9% 8.9% 8.3% 8.4% 7.8%
Reconciliation of Revenue to Fee Revenue and Contractual Fee Revenue
1. Includes discontinued operations.
Note: 2016 and 2017 figures were restated for ASC 606. We have not made a similar restatement for 2006 and 2012-2015, and the figures for such periods continue to be reported under the accounting standards in effect during those periods.

INVESTOR DECK | 45
Three Months Ended September 30, Nine Months Ended September 30,
($ in millions) 2018 20171 2018 20171
Consolidated revenue $ 5,261.0 $ 4,638.6 $ 15,046.3 $ 13,129.1Less:
Client reimbursed costs largely associated with employees dedicated to client facilities and subcontracted vendor work performed for clients 2,640.0 2,310.2 7,612.8 6,665.9
Consolidated fee revenue $ 2,621.0 $ 2,328.4 $ 7,433.5 $ 6,463.2
Less:Non-contractual fee revenue 1,468.6 1,300.4 3,498.3 2,972.6
Contractual fee revenue $ 1,152.4 $ 1,028.0 $ 3,935.2 $ 3,490.6
Occupier Outsourcing revenue2 $ 3,214.8 $ 2,792.2 $ 9,352.4 $ 8,035.0
Less:Client reimbursed costs largely associated with employees dedicated to client facilities and subcontracted vendor work performed for clients 2,484.7 2,160.0 7,147.6 6,222.0Occupier Outsourcing fee revenue2 $ 730.1 $ 632.3 $ 2,204.8 $ 1,813.0
Property Management revenue2 $ 303.5 $ 288.5 $ 911.7 $ 841.3
Less:Client reimbursed costs largely associated with employees dedicated to client facilities and subcontracted vendor work performed for clients 155.3 150.2 465.1 444.0Property Management fee revenue2 $ 148.2 $ 138.3 $ 446.6 $ 397.3
Reconciliation of Revenue to Fee Revenue and Contractual Fee Revenue
1. In the first quarter of 2018, the company adopted new revenue recognition guidance. Certain restatements have been made to 2017 financial statements (and thus 2017 financial information included in this slide) to conform with the 2018 presentation.
2. Occupier Outsourcing and Property Management revenue excludes associated leasing and sales revenue, most of which is contractual.

INVESTOR DECK | 46
Twelve Months Ended December 31,
($ in millions) 20171 20161
Occupier Outsourcing revenue 2 $ 11,145.6 $ 10,373.9Less:Client reimbursed costs largely associated with employees dedicated to client facilities and subcontracted vendor work performed for clients 8,619.5 8,093.9Occupier Outsourcing fee revenue 2 $ 2,526.1 $ 2,280.0
Property Management revenue 2 $ 1,155.3 $ 1,056.0Less:Client reimbursed costs largely associated with employees dedicated to client facilities and subcontracted vendor work performed for clients 600.2 550.9Property Management fee revenue 2 $ 555.1 $ 505.1
Reconciliation of Revenue to Fee Revenue
1. In the first quarter of 2018, the company adopted new revenue recognition guidance. Certain restatements have been made to 2016 and 2017 financial statements (and thus the 2016 and 2017 financial information included in this slide) to conform with the 2018 presentation.
2. Occupier Outsourcing and Property Management revenue excludes associated leasing and sales revenue, most of which is contractual.

INVESTOR DECK | 47
Footnotes
Slide 61. Other includes Development Services revenue (1%) and Other revenue (1%). 2. Capital Markets includes Sales revenue (19%) and Commercial Mortgage Origination (excludes Loan Servicing) revenue (5%).3. Contractual Sources include Occupier Outsourcing and Property Management revenue (33%; excludes associated sales and lease revenues, most of which are contractual),
Valuation revenue (5%), Global Investment Management revenue (4%) and Loan Servicing (2%). 4. Fee Revenue is gross revenue less both client reimbursed costs largely associated with our employees that are dedicated to client facilities and subcontracted vendor work
performed for clients.
NOTES: Local currency percent changes versus prior year are non-GAAP financial measures noted on slides 30 and 31. These percent changes are calculated by comparing current year results versus prior year results, in each case at prior year exchange rates.
In the first quarter of 2018, the company adopted new revenue recognition guidance. Restatements have been made to 2017 and 2016 financial data included in this presentation on slides 6, 7, 17, 18, 19, 21, 22, 25, 26, 27, 30, 31, 36, 41, 42, 43, 44, 45, and 46 to conform with the 2018 presentation. Financial data for periods prior to 2016 have not been restated and continue to be reported under the accounting standards in effect for the relevant period. Accordingly, such prior period amounts should not be compared with the restated financial data for 2016, 2017 and 2018. Although we believe that any prior period amounts would not be significantly different if we had restated such periods to conform with the 2018 presentation, there can be no assurance that there would not be a difference, and any such difference may be material.
Slide 31. Property and corporate facilities under management as of December 31, 2017, includes square footage managed by affiliates.2. As of December 31, 2017, includes affiliates.3. Assets Under Management (AUM) as of September 30, 2018. Assets under management (AUM) refers to the fair market value of real asset-related investments with respect
to which CBRE Global Investors provides, on a global basis, oversight, investment management services and other advice and which generally consist of investments in real assets; equity in funds and joint ventures; securities portfolios; operating companies and real asset-related loans. This AUM is intended principally to reflect the extent of CBRE Global Investors’ presence in the global real asset market, and its calculation of AUM may differ from the calculations of other investment or asset managers.
Slide 71. Other includes Development Services revenue (1% in both 2006 and 2017) and Other revenue (1% in both 2006 and 2017). 2. Capital Markets includes Sales revenue (33% in 2006 and 19% in 2017) and Commercial Mortgage Origination (excludes Loan Servicing) revenue (4% in 2006 and 5% in
2017).3. Contractual Sources include Occupier Outsourcing and Property Management revenue (7% in 2006 and 33% in 2017; excludes associated sales and lease revenues, most
of which are contractual), Global Investment Management revenue (6% in 2006 and 4% in 2017) Valuation revenue (8% in 2006 and 5% in 2017) and Loan Servicing (0.5% in 2006 and 2% in 2017).
4. Fee Revenue is gross revenue less both client reimbursed costs largely associated with our employees that are dedicated to client facilities and subcontracted vendor work performed for clients.
5. On a GAAP revenue basis (as opposed to a fee revenue basis) contractual plus leasing revenues are 64% and 83% of GAAP revenues in 2006 and 2017, respectively.6. Fee revenue includes Loan Servicing within Contractual Sources, consistent with the fee revenue disclosure seen on slides 30 and 31.

INVESTOR DECK | 48
Footnotes
Slide 211. Historical revenue for Occupier Outsourcing line of business excludes associated sales and leasing revenue, most of which is contractual. 2. Per International Association of Outsourcing Professionals (IAOP).
Slide 221. Property Management (also known as Asset Services) revenue excludes associated sales and leasing revenue, most of which is contractual. 2. Approximately 6% of this square footage is managed by affiliates.
Slide 231. Excludes global securities business.2. As of September 30, 2018. 3. Assets under management (AUM) refers to the fair market value of real asset-related investments with respect to which CBRE Global Investors provides, on a global basis,
oversight, investment management services and other advice and which generally consist of investments in real assets; equity in funds and joint ventures; securities portfolios; operating companies and real asset-related loans. This AUM is intended principally to reflect the extent of CBRE Global Investors’ presence in the global real asset market, and its calculation of AUM may differ from the calculations of other investment or asset managers.
Slide 181. Adjusted EPS excludes the effect of select charges from GAAP EPS as well as adjusts the provision for income taxes for such charges. Adjustments during the periods
presented included amortization expense related to certain intangible assets attributable to acquisitions, cost-elimination expenses, integration and other costs related to acquisitions, certain carried interest incentive compensation (reversal) expense to align with the timing of associated revenue, write-off of financing costs on extinguished debt and goodwill and other non-amortizable intangible asset impairment. Adjustments for the twelve months ended December 31, 2017 also include the tax impact of U.S. tax reform.
2. Leverage ratio is defined as year-end Net Debt divided by full-year adjusted EBITDA. Net Debt is defined as total debt, net of unamortized debt premiums, discounts and issuance costs, excluding warehouse facilities for loans originated on behalf of FHA and other government sponsored entities which are non-recourse to CBRE Group, Inc., non-recourse notes payable on real estate, and net of cash, excluding cash in consolidated funds and other entities not available for company use at year-end.
Slide 251. Tenant rep and landlord rep split based on 2017 CBRE US lease consideration value. 2. We regard leasing revenue as largely recurring over time because unlike most other transaction businesses, leasing activity normally takes place when leases expire. The
average lease expires in five to six years. This means that, on average, in a typical year approximately 17% to 20% of leases roll over and a new leasing decision must be made. When a lease expires in the ordinary course, we expect it to be renewed, extended or the tenant to vacate the space to lease another space in the market. In each instance, a transaction is completed. If there is a downturn in economic activity, some tenants may seek a short term lease extension, often a year, before making a longer term commitment. In this scenario, that delayed leasing activity tends to be stacked on top of the normal activity in the following year. Thus, we characterize leasing as largely recurring over time because we expect an expiration of a lease, in the ordinary course, to lead to an opportunity for a leasing commission from such completed transaction.
Slide 191. Adjusted EBITDA excludes (from EBITDA) certain carried interest incentive compensation reversal to align with the timing of associated revenue, integration and other costs
related to acquisitions, merger-related and other non-recurring charges and income related to investment in Savills plc (disposed of in January 2007).
Slide 171. CBRE has not reconciled adjusted net income for 2018P to the most directly comparable GAAP measure because this cannot be done without unreasonable effort due to
the variability and low visibility with respect to items related to acquisitions, reorganization costs, carried interest incentive compensation and financing costs, which are potential adjustments to future earnings. We expect the variability of these items to have a potentially unpredictable and potentially significant impact on our future GAAP financial results.

INVESTOR DECK | 49
Footnotes
Slide 281. As of December 31 for each year presented.2. In Process figures include Long-Term Operating Assets (LTOA) of $0.1 billion for Q3 2018, $0.2 billion for Q4 2017, $0.2 billion for Q4 2016, $0.1 billion for Q4 2015
and $0.3 billion for Q4 2014. LTOA are projects that have achieved a stabilized level of occupancy or have been held 18-24 months following shell completion or acquisition.
3. Pipeline deals are those projects we are pursuing which we believe have a greater than 50% chance of closing or where land has been acquired and the projected construction start is more than twelve months out.
Slide 301. Contractual revenue refers to revenue derived from our Occupier Outsourcing, Property Management, Investment Management, Valuation and Loan Servicing businesses.
We regard leasing revenue as largely recurring over time because unlike most other transaction businesses, leasing activity normally takes place when leases expire. The average lease expires in five to six years. This means that, on average, in a typical year approximately 17% to 20% of leases roll over and a new leasing decision must be made. When a lease expires in the ordinary course, we expect it to be renewed, extended or the tenant to vacate the space to lease another space in the market. In each instance, a transaction is completed. If there is a downturn in economic activity, some tenants may seek a short term lease extension, often a year, before making a longer term commitment. In this scenario, that delayed leasing activity tends to be stacked on top of the normal activity in the following year. Thus, we characterize leasing as largely recurring over time because we expect an expiration of a lease, in the ordinary course, to lead to an opportunity for a leasing commission from such completed transaction even if delayed by a year or two during an economic downturn.
2. Occupier Outsourcing and Property Management revenue excludes associated leasing and sales revenue, most of which is contractual.3. Fee revenue is gross revenue less both client reimbursed costs largely associated with employees that are dedicated to client facilities and subcontracted vendor work
performed for clients.
Slide 271. Activity includes loan originations, loan sales, and affiliate loan originations. 2. As measured in dollar value loaned.
Slide 311. Contractual revenue refers to revenue derived from our Occupier Outsourcing, Property Management, Investment Management, Valuation and Loan Servicing businesses.
We regard leasing revenue as largely recurring over time because unlike most other transaction businesses, leasing activity normally takes place when leases expire. The average lease expires in five to six years. This means that, on average, in a typical year approximately 17% to 20% of leases roll over and a new leasing decision must be made. When a lease expires in the ordinary course, we expect it to be renewed, extended or the tenant to vacate the space to lease another space in the market. In each instance, a transaction is completed. If there is a downturn in economic activity, some tenants may seek a short term lease extension, often a year, before making a longer term commitment. In this scenario, that delayed leasing activity tends to be stacked on top of the normal activity in the following year. Thus, we characterize leasing as largely recurring over time because we expect an expiration of a lease, in the ordinary course, to lead to an opportunity for a leasing commission from such completed transaction even if delayed by a year or two during an economic downturn.
2. Occupier Outsourcing and Property Management revenue excludes associated leasing and sales revenue, most of which is contractual.3. Fee revenue is gross revenue less both client reimbursed costs largely associated with employees that are dedicated to client facilities and subcontracted vendor work
performed for clients.
INVESTOR DECK | 50
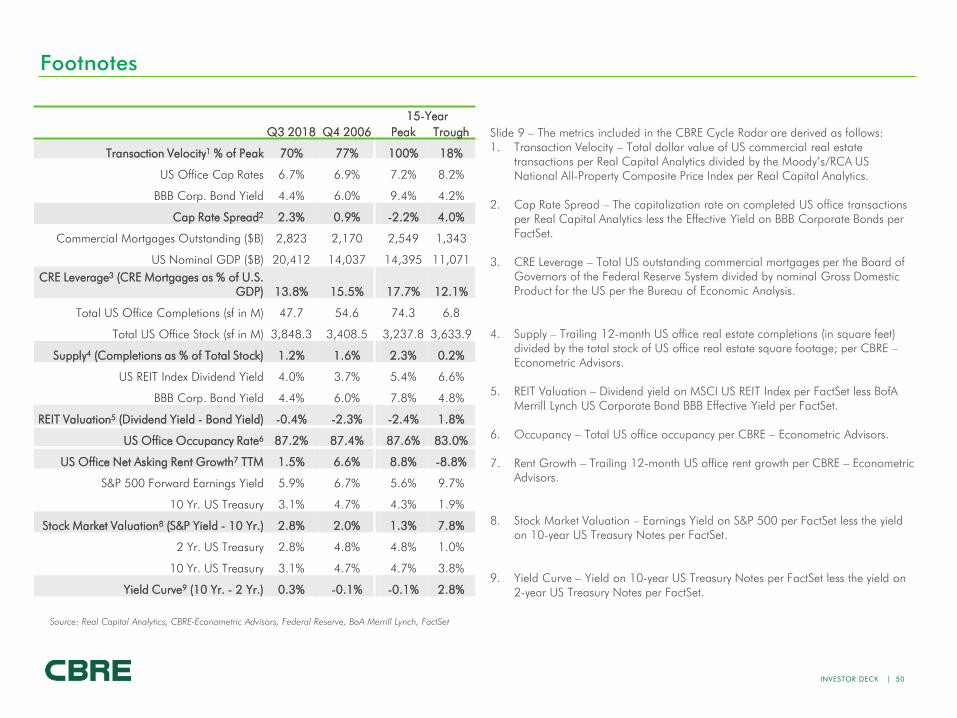
Footnotes
Slide 9 – The metrics included in the CBRE Cycle Radar are derived as follows: 1. Transaction Velocity – Total dollar value of US commercial real estate
transactions per Real Capital Analytics divided by the Moody’s/RCA US National All-Property Composite Price Index per Real Capital Analytics.
2. Cap Rate Spread – The capitalization rate on completed US office transactions per Real Capital Analytics less the Effective Yield on BBB Corporate Bonds per FactSet.
3. CRE Leverage – Total US outstanding commercial mortgages per the Board of Governors of the Federal Reserve System divided by nominal Gross Domestic Product for the US per the Bureau of Economic Analysis.
4. Supply – Trailing 12-month US office real estate completions (in square feet) divided by the total stock of US office real estate square footage; per CBRE –Econometric Advisors.
5. REIT Valuation – Dividend yield on MSCI US REIT Index per FactSet less BofAMerrill Lynch US Corporate Bond BBB Effective Yield per FactSet.
6. Occupancy – Total US office occupancy per CBRE – Econometric Advisors.
7. Rent Growth – Trailing 12-month US office rent growth per CBRE – Econometric Advisors.
8. Stock Market Valuation – Earnings Yield on S&P 500 per FactSet less the yield on 10-year US Treasury Notes per FactSet.
9. Yield Curve – Yield on 10-year US Treasury Notes per FactSet less the yield on 2-year US Treasury Notes per FactSet.
Source: Real Capital Analytics, CBRE-Econometric Advisors, Federal Reserve, BoA Merrill Lynch, FactSet
15-YearQ3 2018 Q4 2006 Peak Trough
Transaction Velocity1 % of Peak 70% 77% 100% 18%
US Office Cap Rates 6.7% 6.9% 7.2% 8.2%
BBB Corp. Bond Yield 4.4% 6.0% 9.4% 4.2%
Cap Rate Spread2 2.3% 0.9% -2.2% 4.0%
Commercial Mortgages Outstanding ($B) 2,823 2,170 2,549 1,343
US Nominal GDP ($B) 20,412 14,037 14,395 11,071CRE Leverage3 (CRE Mortgages as % of U.S.
GDP) 13.8% 15.5% 17.7% 12.1%
Total US Office Completions (sf in M) 47.7 54.6 74.3 6.8
Total US Office Stock (sf in M) 3,848.3 3,408.5 3,237.8 3,633.9
Supply4 (Completions as % of Total Stock) 1.2% 1.6% 2.3% 0.2%
US REIT Index Dividend Yield 4.0% 3.7% 5.4% 6.6%
BBB Corp. Bond Yield 4.4% 6.0% 7.8% 4.8%
REIT Valuation5 (Dividend Yield - Bond Yield) -0.4% -2.3% -2.4% 1.8%
US Office Occupancy Rate6 87.2% 87.4% 87.6% 83.0%
US Office Net Asking Rent Growth7 TTM 1.5% 6.6% 8.8% -8.8%
S&P 500 Forward Earnings Yield 5.9% 6.7% 5.6% 9.7%
10 Yr. US Treasury 3.1% 4.7% 4.3% 1.9%
Stock Market Valuation8 (S&P Yield - 10 Yr.) 2.8% 2.0% 1.3% 7.8%
2 Yr. US Treasury 2.8% 4.8% 4.8% 1.0%
10 Yr. US Treasury 3.1% 4.7% 4.7% 3.8%
Yield Curve9 (10 Yr. - 2 Yr.) 0.3% -0.1% -0.1% 2.8%


![Business Cycle Peak Trough One Cycle Expansion [Real GDP per year] Peak: Peak: real GDP reaches its maximum. Recession: Recession: real GDP declines](https://img.pdfslide.us/doc/110x75/56649e675503460f94b62c59/business-cycle-peak-trough-one-cycle-expansion-real-gdp-per-year-peak-peak.jpg)