Embed Size (px)
Citation preview
8/3/2019 CBO - Reducing Gasoline Consumption - Three Policy Options
http://slidepdf.com/reader/full/cbo-reducing-gasoline-consumption-three-policy-options 1/51
CONGRESS OF THE UNITED STATES
CONGRESSIONAL BUDGET OFFICE
A
CBOS T U D Y
NOVEMBER 2002
Reducing Gasoline
Consumption: Three
Policy Options
J u p i t e r I m a g e s

8/3/2019 CBO - Reducing Gasoline Consumption - Three Policy Options
http://slidepdf.com/reader/full/cbo-reducing-gasoline-consumption-three-policy-options 2/51
8/3/2019 CBO - Reducing Gasoline Consumption - Three Policy Options
http://slidepdf.com/reader/full/cbo-reducing-gasoline-consumption-three-policy-options 3/51
CBO
A
S T U D Y
Reducing Gasoline Consumption: Three Policy Options
4 ; 0 2 - 0 7
The Congress of the United States s Congressional Budget Office
8/3/2019 CBO - Reducing Gasoline Consumption - Three Policy Options
http://slidepdf.com/reader/full/cbo-reducing-gasoline-consumption-three-policy-options 4/51
NotesNumbers in the text and tables of this report may not add up to totals because of rounding.
Unless otherwise indicated, all years referred to are calendar years.
8/3/2019 CBO - Reducing Gasoline Consumption - Three Policy Options
http://slidepdf.com/reader/full/cbo-reducing-gasoline-consumption-three-policy-options 5/51
Preface
6everal Members of Congress and public interest groups have recently proposed poli-cies that would reduce gasoline consumption in the United States. Such proposals stem pri-marily from a desire to enhance the nation’s energy security and to decrease its emissions of carbon dioxide, a key greenhouse gas that affects the Earth’s climate. This Congressional Bud-get Office (CBO) study—prepared at the request of the Senate Committee on Environmentand Public Works—compares three methods of reducing gasoline consumption: increasingthe corporate average fuel economy (CAFE) standards that govern passenger vehicles, raisingthe federal tax on gasoline, and setting a limit on carbon emissions from gasoline combustionand requiring gasoline producers to hold allowances for those emissions (a policy known as acap-and-trade program).
The study weighs the relative merits of those policies against several major criteria: whetherthey would minimize costs to producers and consumers; how reliably they would achieve agiven reduction in gasoline use; their implications for automobile safety; and their effects onsuch factors as traffic congestion, requirements for highway construction, and emissions of airpollutants other than carbon dioxide. In addition, the analysis examines two more policy im-plications that lawmakers may be concerned about: the impact on people at different incomelevels and in different regions, and the effects on federal revenue. In keeping with CBO’s man-date to provide objective, impartial analysis, this report makes no recommendations.
The study was written by Terry Dinan and David Austin of CBO’s Microeconomic andFinancial Studies Division, which is directed by Roger Hitchner. Robert Dennis, Barbara
Edwards, Arlene Holen, Mark Lasky, Deborah Lucas, John Peterson, and Tom Woodward of CBO provided valuable comments, as did Haynes Goddard of the University of Ohio atCincinnati and Margaret Walls of Resources for the Future.
Christian Spoor edited the study, and Christine Bogusz proofread it. Angela McCollough andCecil McPherson produced initial versions of the tables and figures, Kathryn Winstead pre-pared the study for publication, and Annette Kalicki prepared the electronic versions forCBO’s Web site.
Dan L. CrippenDirector
November 2002
This study and other CBO publicationsare available at CBO’s Web site:
www.cbo.gov

8/3/2019 CBO - Reducing Gasoline Consumption - Three Policy Options
http://slidepdf.com/reader/full/cbo-reducing-gasoline-consumption-three-policy-options 6/51
8/3/2019 CBO - Reducing Gasoline Consumption - Three Policy Options
http://slidepdf.com/reader/full/cbo-reducing-gasoline-consumption-three-policy-options 7/51
CONTENTS
Summary vii
Introduction 1
The Rationale for Reducing Gasoline Consumption 1
A Brief History of the Three Policy Options 2
The Evaluation Criteria Used in This Study 6
Cost-Effectiveness 9
The Cost-Effectiveness of Raising CAFE Standards 10
The Cost-Effectiveness of Raising the Gasoline Tax 15
The Cost-Effectiveness of Creating a Cap-and-Trade
Program 17
Predictability of Gasoline Reductions 19
CAFE Standards 19
A Gasoline Tax and a Cap-and-Trade Program 20
Effects on Safety 21
CAFE Standards 21
A Gasoline Tax and a Cap-and-Trade Program 24
Effects on Other External Costs Related to Driving 25
Emissions of Regulated Air Pollutants 25
Congestion 26
Highway Construction and Maintenance 27
Other Policy Implications: Distributional and
Revenue Effects 29
Distributional Effects 29
Effects on Federal Revenue 34
8/3/2019 CBO - Reducing Gasoline Consumption - Three Policy Options
http://slidepdf.com/reader/full/cbo-reducing-gasoline-consumption-three-policy-options 8/51
vi REDUCING GASOLINE CONSUMPTION: THREE POLICY OPTIONS
Tables
1. Average Characteristics of New Cars, Model Years 1978-2000 4
2. Estimated Burden of Gasoline Spending on Households 30
3. Revenue Effects of a 15-Cent Increase in the Federal
Gasoline Tax 35
Figures
1. Vehicles’ Average Fuel Economy Compared with CAFE
Standards, Model Years 1978-2000 3
2. Total State and Local Gasoline Taxes, End of 2001 5
3. Gasoline Prices and Federal Gasoline Taxes, 1950-2000 6
4. Fatality Rates for Cars and Light Trucks, 1975-2000 22
5. Annual Cost to Households in Different Regions from
a 4.3-Cent Rise in the Federal Gasoline Tax 33
6. Annual Cost to Households in Different Regions from
a 4.3-Cent Rise in the Federal Gasoline Tax, as a Share
of Household Income 34
Boxes
1. Making CAFE Standards More Cost-Effective by
Improving Their Design 12
2. Is the Market for Fuel Economy in New Vehicles Efficient? 16
3. The Effect of Price Changes on Gasoline Consumption 17
4. Changing the Design of CAFE Standards to Improve Auto Safety 23
8/3/2019 CBO - Reducing Gasoline Consumption - Three Policy Options
http://slidepdf.com/reader/full/cbo-reducing-gasoline-consumption-three-policy-options 9/51
Summary
/awmakers concerned about the United States’
dependence on foreign oil and its emissions of carbon di-
oxide—a key greenhouse gas—have proposed raising the
corporate average fuel economy (CAFE) standards that
govern cars and light-duty trucks. Improving the fuel
efficiency of vehicles would reduce gasoline consumption.
Another way to lower gasoline consumption is to raise the
price of gasoline. Lawmakers could do that directly by
increasing the federal tax on gasoline. They could also do
it indirectly by setting a limit on total carbon emissions
from gasoline combustion and requiring gasoline produ-
cers to hold rights (or allowances) for those emissions,
which they could buy and sell among themselves after an
initial allocation. That policy is known as a cap-and-trade
program.
This study weighs the relative merits of tightening CAFE
standards, raising the federal gasoline tax, and creating
a cap-and-trade program against several major criteria:
• Cost-Effectiveness . Reducing gasoline consumption
would impose costs (both monetary and nonmone-
tary) on various producers and consumers. A cost-
effective policy would keep those costs to a minimum.
• Predictability of Gasoline Savings . How reliably would
the policy bring about the desired reduction in gaso-line consumption?
• Effects on Safety . How would the policy alter the num-
ber and severity of traffic accidents?
• Effects on Other External Costs Related to Driving. Re-
ducing gasoline consumption would affect not only
the United States’ energy security and carbon emis-
sions but other driving-related external costs (ones
whose full weight is borne by society at large rather
than by an individual). Those external costs include
traffic congestion, the need for highway construction
and maintenance, and emissions of air pollutants be-
sides carbon dioxide.
In addition to those factors, the three policy options
would have other implications that policymakers may
care about—such as their effects on people at different
income levels and in different parts of the country and
their impact on the amount of revenue collected by the
federal government.
Details of the Three Policy OptionsSignificant decreases in U.S. gasoline consumption could
lead to measurable declines in both the nation’s depen-
dence on oil and its carbon emissions. Gasoline use by
motor vehicles accounts for about 43 percent of U.S. oil
consumption and about 11 percent of world oil con-
sumption. It also accounts for 20 percent of U.S. emis-
sions of carbon dioxide.
The methods to produce those declines that are examined
in this study are not new concepts. Fuel economy stan-
dards have been in place since 1978; the federal govern-ment has taxed gasoline since 1932; and cap-and-trade
programs have been used to address environmental prob-
lems for many years.
CAFE StandardsUnder current CAFE standards, each automaker’s output
is divided into three fleets: imported passenger cars, do-
mestically produced passenger cars, and light trucks
8/3/2019 CBO - Reducing Gasoline Consumption - Three Policy Options
http://slidepdf.com/reader/full/cbo-reducing-gasoline-consumption-three-policy-options 10/51
viii REDUCING GASOLINE CONSUMPTION: THREE POLICY OPTIONS
(which include pickup trucks, minivans, and sport utility
vehicles). To comply, a manufacturer must ensure that
the average fuel efficiency of each of its fleets equals or
exceeds the applicable CAFE standard. Today, those stan-
dards are 27.5 miles per gallon (MPG) for domestic or
imported cars and 20.7 MPG for light trucks. (Vehicles
weighing more than 8,500 pounds are exempt from
CAFE requirements.) Producers must pay a penalty of
$5.50 per vehicle for every 0.1 MPG that their fleet aver-
age falls below the relevant standard.
Gasoline Taxes
In 1932, the federal government levied a tax on gasoline
of 1 cent per gallon—about 6 percent of the price of gas-
oline at that time—as a way to raise revenue. Since then,
the tax rate has gradually increased; it now stands at
18.4 cents per gallon.
State and local governments also tax gasoline consump-
tion. Currently, the average tax paid on a gallon of gaso-
line in the United States is about 41 cents—or roughly
27 percent of the price (assuming an average retail price
of $1.50). Those 41 cents of tax include average state and
local taxes of 22.6 cents.
Today, revenue from the federal gasoline tax (as well as
from taxes on diesel, gasohol, and other special fuels) goesinto the budget’s Highway Trust Fund. That fund was
created in the mid-1950s mainly to provide a dependable
source of financing for the nation’s Interstate highways.
Since the early 1980s, revenues in the Highway Trust
Fund have also been used to pay for mass transit.
Cap-and-Trade Programs
The concept of trading pollution rights (what this study
calls emission allowances) was first introduced in the
academic literature in 1968. Since then, the federal gov-
ernment has used trading programs to achieve several en-vironmental goals, such as reducing emissions of sulfur
dioxide (which cause acid rain), decreasing the lead con-
tent of gasoline, and phasing out the use of ozone-
depleting chemicals.
Under the cap-and-trade program envisioned in this
study, the government would set a limit on total carbon
emissions resulting from gasoline combustion and issue
the number of allowances corresponding to that limit.
Gasoline producers and importers would be required to
hold allowances for the carbon emissions that would
result from the gasoline they sell in the United States. The
government could auction off the allowances to gasoline
companies or distribute them for free. Either way, after
the initial allocation, firms would be allowed to buy and
sell allowances among themselves. Holding those allow-
ances would become a cost of doing business for gasoline
companies, which would lead to higher prices at the gas
pump.
Cost-EffectivenessPolicies that produced meaningful reductions in gasoline
consumption would entail costs for producers and consu-
mers. The reason is that such policies would compel pro-
ducers and consumers to undertake gasoline-saving activi-
ties that they would not have found it in their best
interests to pursue otherwise. The costs to producers
would take the form of lower profits, and the costs to
consumers would take the form of reductions in their
well-being, because of both monetary costs (such as
higher prices) and nonmonetary costs (such as decreased
safety from driving a smaller, lighter car; reduced satisfac-
tion from driving a less-powerful vehicle; or inconveni-
ence associated with carpooling).
Ideally, the costs of reducing gasoline use should be
weighed against the benefits (principally from fewer car-
bon emissions and less energy consumption). That way,
policymakers could encourage gasoline reductions as long
as the benefits of additional reductions exceeded the cost
of additional reductions. However, quantifying the costs
and benefits of gasoline reductions is difficult and is
beyond the scope of this analysis.
A less challenging criterion is to design policies that are“cost-effective”—in other words, that keep losses in pro-
ducers’ profits and consumers’ welfare to a minimum for
any given level of gasoline savings. Automakers and
drivers could make numerous technological or behavioral
changes to use less gasoline, changes that could be com-
bined in various ways or traded off for each other de-
pending on their costs. Thus, policies would be most
cost-effective if they gave people the flexibility and the
8/3/2019 CBO - Reducing Gasoline Consumption - Three Policy Options
http://slidepdf.com/reader/full/cbo-reducing-gasoline-consumption-three-policy-options 11/51
SUMMARY ix
incentive to make as many of those changes as possible.
By contrast, policies that encouraged a few gas-saving
activities but not others would not produce the most cost-
effective reduction in gasoline consumption.
A cap-and-trade program or a well-designed increase in
the gasoline tax—for example, one that applied to all uses
of gasoline that could be reduced at a cost lower than the
tax—would be cost-effective ways to decrease gasoline
consumption. Both policies would raise the price of gaso-
line and thus provide an incentive for households to
undertake all measures that would lower their gasoline use
(provided that the cost of those measures was less than
the savings in gasoline spending that would result). Such
measures could include buying more-fuel-efficient vehi-
cles, reducing their driving (for example, by carpooling
or taking public transportation), improving their vehicles’
maintenance, or driving more slowly.
Raising CAFE standards, by contrast, would not be a
cost-effective way to cut gasoline consumption because
it would not encourage all potential gas-saving activities.
By focusing solely on the fuel economy of vehicles, it
would give people no incentive to make gas-saving
changes in their driving behavior, such as carpooling. In
fact, by making vehicles more fuel efficient and thus
lowering the cost of driving, higher CAFE standardscould lead to more driving rather than less. Research sug-
gests that a 10 percent increase in CAFE standards would
result in roughly a 2 percent increase in the number of
miles driven. That effect would reduce, though not elimi-
nate, the gasoline savings caused by the improvement in
fuel economy.
Further, the current structure of CAFE standards could
encourage automakers to engage in strategies that would
bring them into compliance but would not increase fuel
economy—such as modifying the design of passenger carsso they would qualify as light trucks and be subject to a
lower standard. Improvements in the design of CAFE
standards could reduce the use of such “unproductive”
compliance methods. However, improved standards
would still not provide an incentive to reduce driving.
If lawmakers’ primary objective was to lower carbon emis-
sions rather than simply to decrease gasoline consump-
tion, then a tax or a cap-and-trade program that covered
all sources of carbon emissions would be more cost-
effective than a policy that targeted only gasoline use. For
example, a tax on the carbon content of all fossil fuels or
a cap-and-trade program that applied to all sources of
carbon emissions would encourage emission reductions
in the utility sector, which accounts for 38 percent of
U.S. carbon emissions.
Predictability of Gasoline SavingsSome lawmakers might want assurance that the policy
they adopted would actually reduce gasoline consumption
by a given amount. Neither an increase in CAFE stan-
dards nor a rise in the federal gasoline tax would ensure
a specific decline in consumption. However, predicting
the gasoline savings that would result from a rise in well-
designed CAFE standards would be easier than predicting
the savings from a specific increase in the gasoline tax. If
CAFE standards were redesigned so that automakers had
no incentive to use unproductive compliance methods,
an increase in those standards would provide a fair
amount of certainty about the resulting rise in fuel effi-
ciency. Thus, estimating gasoline savings would mainly
involve predicting increases in the number of miles
driven. By contrast, estimating the gasoline savings from
a tax increase would entail predicting increases in fuelefficiency as well as decreases in total miles driven.
Despite its greater uncertainty, an increase in the gasoline
tax could be modified over time to achieve a desired
reduction target. Furthermore, any given decrease in
consumption could be made at a lower cost through the
gasoline tax than through CAFE standards (as discussed
in the previous section).
A cap-and-trade program could be constructed to reach
a specific target for gasoline use. The government wouldissue the number of emission allowances that corre-
sponded to that target level, and (assuming adequate
enforcement) only that amount of gasoline would be sold
in the United States. However, a specific target would not
limit the cost of reductions in gasoline consumption.
Alternatively, the government could set a maximum price
for allowances and agree to sell an unlimited quantity at
that price (otherwise, a fixed supply of allowances would
8/3/2019 CBO - Reducing Gasoline Consumption - Three Policy Options
http://slidepdf.com/reader/full/cbo-reducing-gasoline-consumption-three-policy-options 12/51
x REDUCING GASOLINE CONSUMPTION: THREE POLICY OPTIONS
cause the price to rise). Such a policy would be analogous
to a gasoline tax: it would limit the cost of reducing
gasoline consumption by another gallon but would not
ensure that a given level of consumption was met.
Effects on Safety Policy changes that lowered gasoline use could have
various effects on the safety of driving. If they led to the
production of smaller or lighter cars, they would tend to
make accidents more dangerous, but if they led to lighter
trucks, they could reduce fatalities. If policies encouraged
people to drive fewer miles, they would tend to decrease
the number of accidents. The safety implications of
CAFE standards have been particularly controversial, and
studies of the topic have produced mixed results. Virtu-
ally no research has been done on how a higher gasoline
tax or a cap-and-trade program would affect the safety of
driving.
Recently, a special committee of the National Research
Council reviewed the empirical evidence about the safety
effects of CAFE standards. Most of the committee con-
cluded that declines in the size and weight of cars that
have occurred since those standards took effect have led
to increased fatalities. The committee offered an alterna-
tive design for CAFE standards intended to enhancesafety. That design would discourage automakers from
reducing the weight of cars as a way to comply with fuel
economy standards while still encouraging them to reduce
the weight of light trucks.
Effects on Other External CostsRelated to Driving The three policy options discussed in this study would
have implications for various external costs that result
from driving (costs that individuals do not alwaysconsider when making decisions because they do not bear
the full weight of those costs). Such external costs include
not only U.S. energy security and carbon emissions but
also traffic congestion, the need for highway construction
and maintenance, and emissions of various other air
pollutants (carbon monoxide, nitrogen oxides, and vola-
tile organic compounds—all of which, unlike carbon
dioxide, are regulated by the federal government).
A higher gasoline tax or a cap-and-trade program would
tend to decrease congestion, road construction and main-
tenance, and emissions of regulated pollutants by dis-
couraging driving. Higher CAFE standards, by contrast,
would encourage driving and thus would tend to increase
those costs—with the exception of emissions of nitrogen
oxides and volatile organic compounds. They would de-
cline because lower gasoline consumption would reduce
the emissions of those pollutants that occur when gasoline
is produced and delivered, and such a decrease would
more than offset the rise in tailpipe emissions that would
result from increased driving.
Unless the policy changes that occurred were very large,
the impact on those other driving-related external costs
would most likely be small. In the case of traffic con-
gestion, however, recent studies suggest that even small
changes could have significant economic costs.
Other Policy ImplicationsThe policy options in this study are not intended specifi-
cally to alter the distribution of income in the United
States or to raise federal revenue. Nevertheless, increasing
the gasoline tax, tightening CAFE standards, or enacting
a cap-and-trade program would have distributional and
revenue effects, which policymakers might want to con-sider.
Distributional Effects
The burden imposed by a policy change to reduce gaso-
line consumption will differ according to people’s income
level and where they live. Several researchers have looked
at how the effects of a higher gasoline tax or a cap-and-
trade program for carbon emissions would vary among
U.S. households on the basis of those factors. For CAFE
standards, however, no evidence about distributional
effects is available.
Measuring the incidence (who currently bears the bur-
den) of the federal gasoline tax is difficult because of
inaccuracies in reported data on annual incomes and a
lack of data on households’ longer-term ability to pay the
tax. Some studies indicate that a rise in the gasoline tax
would be regressive—that is, would place a heavier bur-
den on lower-income households than on higher-income
8/3/2019 CBO - Reducing Gasoline Consumption - Three Policy Options
http://slidepdf.com/reader/full/cbo-reducing-gasoline-consumption-three-policy-options 13/51
SUMMARY x
ones. Other research suggests that the effect would be
proportional among households in different income
categories. Regardless of the initial incidence of the tax,
the impact on some lower-income households would be
reduced if the tax increase caused a rise in government
payments (such as Social Security benefits and Supple-
mental Security Income payments) that are indexed to
changes in consumer prices. Those payments make up a
larger share of income for lower-income households than
for higher-income households.
Available evidence also suggests that an increase in the
gasoline tax would impose a bigger cost on people in rural
areas than in urban areas. The ultimate distributional ef-
fects of the tax increase would depend on what the federal
government did with the additional revenue. If laws
governing the use of Highway Trust Fund revenue were
changed, the government could use the additional money
to offset the distributional effects of higher gasoline
prices.
Like a gasoline tax, a cap-and-trade program would raise
the price of gasoline. The distributional effects of that
price increase would be the same as those from an equiva-
lent price rise resulting from a gasoline tax. If the govern-
ment decided to distribute emission allowances for free,
the recipient gasoline companies (and, by extension, theirshareholders) would receive windfall profits. That out-
come would tend to benefit higher-income households,
who on average receive a larger share of their income
from stocks than lower-income households do. Con-
versely, if the government chose to auction off the allow-
ances, the ultimate distributional effects would depend
on how it used the resulting revenue.
Revenue Effects
Raising the gasoline tax would increase federal revenue.
Although higher prices would discourage gasoline con-sumption, that effect would not be large enough to offset
the additional revenue created by the higher tax rate.
With changes to current law, that revenue could be used
in myriad ways, such as reducing federal debt, offsetting
some of the distributional effects associated with higher
gasoline prices, or lowering other taxes. Using the revenue
to reduce taxes on capital and labor, for example, could
benefit the economy because those taxes discourage eco-
nomic activity.
Tightening CAFE standards would lead to a decline in
federal gasoline-tax receipts because more-fuel-efficient
vehicles would use less gasoline. The dampening effect
on tax receipts would grow over time as more vehicles
were retired and replaced by ones that met the higher
standards.
For a cap-and-trade program, the effects on revenue
would depend on whether the government sold emission
allowances or gave them away. If the government sold
them, the effects would be similar to those of a gasoline
tax, and federal revenue (including auction proceeds and
gasoline-tax receipts) would rise. If allowances were
distributed for free, receipts from the gasoline tax would
fall, and the government would not collect any offsetting
revenue from selling allowances.
ConclusionsConcerns about oil dependence and climate change have
caused some policymakers to propose actions that would
reduce gasoline consumption. Increasing the federal tax
on gasoline, creating a cap-and-trade program for
gasoline-related carbon emissions, or raising the CAFEstandards could bring about such a reduction, but they
would measure up differently against the various criteria
considered in this analysis.
• A higher gasoline tax would be cost-effective in that
it would minimize the reduction in corporate profits
and consumers’ welfare that would result from lower
gasoline consumption. The reason is that a tax increase
would provide an equal incentive for producers and
consumers to undertake all possible gas-saving activi-
ties, rather than focusing on a few activities (such asimproving vehicles’ fuel economy). By discouraging
driving, a higher gasoline tax would also tend to de-
crease various driving-related external costs, such as
traffic congestion, the need to build and maintain
highways, and emissions of regulated vehicle pollut-
ants. However, a tax increase would not reliably en-
sure a given reduction in gasoline use; it would have
8/3/2019 CBO - Reducing Gasoline Consumption - Three Policy Options
http://slidepdf.com/reader/full/cbo-reducing-gasoline-consumption-three-policy-options 14/51
xii REDUCING GASOLINE CONSUMPTION: THREE POLICY OPTIONS
to be modified over time to achieve a desired level of
gasoline savings. Moreover, available research does not
indicate how raising the federal gasoline tax would af-
fect the safety of driving.
Studies provide conflicting evidence about how the
cost of a higher federal gasoline tax would be distrib-
uted among households at different income levels, but
they do find that rural households would tend to see
higher cost increases than urban households would.
Regardless of how those costs were distributed, an in-
crease in the gasoline tax would boost federal revenue.
The government could use that revenue in various
ways, which would have differing effects on the econo-
my as well as different distributional consequences.
• A cap-and-trade program could be constructed that
would be just as cost-effective as a gasoline-tax increase
and would reduce driving-related external costs to the
same degree. Depending on how the program was
designed, however, it could differ from a tax increase
with respect to how predictably it would deliver a
specific amount of gasoline savings, its distributional
effects, and its impact on federal revenue. No research
is available on the safety implications of a cap-and-
trade program.
• Raising CAFE standards would not be a particularly
cost-effective way to reduce gasoline consumption
because it would rely on improving the fuel efficiency
of passenger vehicles rather than encouraging the full
range of gas-saving activities by producers and consu-
mers (some of which might be less expensive). Further,
by lowering the cost of operating a vehicle, higher
CAFE standards could encourage people to drive
more, which could increase congestion. In addition,
under the standards’ current design, automakers could
use unproductive compliance methods that would im-
pose costs on producers or consumers but not reduce
gasoline consumption. An increase in CAFE standards
would offer more certainty about achieving a specific
reduction in gasoline use than a tax increase would but
less than a cap-and-trade program with a fixed cap
would. (The Congressional Budget Office is currently
analyzing the cost of lowering gasoline consumption
under alternative CAFE designs.)
The effect of CAFE standards on safety is a controver-
sial topic. A majority of a committee formed by the
National Research Council concluded that the weight
and size reduction of cars that has accompanied CAFE
standards has led to more vehicle fatalities. The com-
mittee proposed an alternative design for the standards
that would address safety concerns.
An increase in CAFE standards would lead to lower
revenue from the federal gasoline tax. No information
is available about the possible distributional effects of
higher CAFE standards, however.
Finally, the three policies described in this study are not
mutually exclusive. For example, lawmakers could choose
both to tighten CAFE standards and to increase thefederal tax on gasoline. In fact, policies that raised the
price of gasoline (such as a higher tax or a cap-and-trade
program) would tend to lessen the burden of CAFE stan-
dards on automakers because they would increase con-
sumers’ demand for fuel-efficient vehicles. However, the
total cost to producers and consumers of reducing gaso-
line consumption would be minimized by relying on
policies that raise the price of gasoline rather than policies
that require changes in fuel economy.
8/3/2019 CBO - Reducing Gasoline Consumption - Three Policy Options
http://slidepdf.com/reader/full/cbo-reducing-gasoline-consumption-three-policy-options 15/51
CHAPTER
Introduction
0embers of Congress have recently discussed
improving the fuel economy of cars and light trucks—a
subject that is likely to continue being debated in the
future. Those who support raising the corporate averagefuel economy (CAFE) standards that govern passenger
vehicles hope that doing so will lead to a decline in gaso-
line use. Such a decline could help achieve two policy
goals: enhancing the United States’ energy security and
reducing its emissions of carbon dioxide (the predominant
greenhouse gas that affects the Earth’s climate).
Other policy changes could decrease gasoline consumption
by raising its price. For example, lawmakers could increase
the federal tax on gasoline, which now stands at 18.4 cents
per gallon. Or they could institute a cap-and-tradeprogram for the carbon dioxide emissions that result when
gasoline is burned. (Those emissions are referred to here
as carbon emissions for short.) Under a cap-and-trade
program, the government would set a limit on carbon
emissions from U.S. gasoline consumption. Companies
would be required to hold rights—called allowances—for
each metric ton of carbon contained in the gasoline that
they produced or imported for domestic consumption.
Holding the allowances would become a cost of doing
business and would lead to higher prices at the gas pump.
A mandated increase in CAFE standards, a rise in the
gasoline tax, and a cap-and-trade program could achieve
the same policy goals, but they would have very different
consequences. (Although the three policy options are not
mutually exclusive, their relative merits are clearer when
the policies are considered individually.) This study com-
pares those policy options on the basis of their cost-
effectiveness, the predictability with which they would
curb gasoline use, their implications for the safety of driv-
ing, and their effects on other driving-related factors, such
as congestion, highway construction, and emissions of pol-
lutants other than carbon dioxide. In addition, the analysislooks at those policies’ distributional effects—how their
impact would vary among regions and among people at
different income levels—and their effects on federal tax
revenues.
This study does not examine the full array of policies that
could ultimately reduce gasoline consumption. For exam-
ple, the Department of Energy and the U.S. Council of
Automotive Research have announced a partnership to
promote the development of hydrogen as a primary fuel
for cars and trucks. If successful, that effort could lowergasoline use substantially, but the results would not be
realized for many years. This study focuses on more-direct
policies that could decrease gasoline consumption within
the next two decades.
The Rationale for Reducing Gasoline ConsumptionThe security of the United States’ energy supplies was a
major concern during the 1970s, when CAFE standards
were introduced. That concern is still voiced by some law-makers today. Energy security can be measured in many
ways—for example, as the share of the nation’s total de-
mand for energy that is met by imports, or as the military
cost of protecting oil supplies from the Persian Gulf, or
as the economic cost that is avoided when the world’s oil
supplies are not disrupted. The Congressional Budget
Office (CBO) believes that the last measure is the most
useful. Thus, it considers the most relevant benefits of
8/3/2019 CBO - Reducing Gasoline Consumption - Three Policy Options
http://slidepdf.com/reader/full/cbo-reducing-gasoline-consumption-three-policy-options 16/51
2 REDUCING GASOLINE CONSUMPTION: THREE POLICY OPTIONS
energy security to be the macroeconomic losses from
higher oil prices that are avoided when there are no politi-
cal disruptions to oil supplies. Many analysts argue that
the United States would be less vulnerable to such disrup-
tions if it used less oil. Consumption of finished motor
gasoline (which is derived from oil) accounts for about
43 percent of U.S. petroleum use—and about 11 percent
of world petroleum use.1
Reducing U.S. oil consumption could have other benefits.
Because the United States is such a large consumer, a sig-
nificant drop in its demand would tend to lower the world
price of oil. If collusion by oil suppliers did not keep that
price from falling, a policy that reduced U.S. consumption
would save money not only because the nation would buy
less oil but because it would spend less on the oil it did
buy.2
Concern about climate change is another driving force
behind policymakers’ desire to decrease gasoline consump-
tion. A recent report on CAFE standards by the National
Research Council cited that concern as the key reason to
make a policy change.3 Scientists have known for more
than a century that rising concentrations of carbon dioxide
and other gases in the atmosphere affect the Earth’s cli-
mate. Burning a gallon of gasoline releases 8.9 kilograms
of carbon dioxide into the atmosphere.4 Carbon emissions
make up 84 percent of the United States’ emissions of
greenhouse gases, and motor vehicles account for 20 per-
cent of U.S. carbon emissions.
Carbon dioxide emissions differ from several other vehicle
pollutants in that they are unregulated. For emissions of
hydrocarbons and carbon monoxide, for example, the
federal government sets a limit of so many grams per mile
driven. Vehicles must have pollution-control equipment
(and, in some states, periodic emission inspections) to
meet those limits. Consequently, gas-guzzling cars do not
emit more of those pollutants than fuel-efficient cars do,
so improvements in fuel economy would not lead directly
to decreases in those emissions. That is not the case for
carbon dioxide, however. Reductions in gasoline consump-
tion would lead to roughly proportional reductions in car-
bon emissions.
Although lowering gasoline use significantly could lessen
dependence on oil and decrease carbon emissions, it would
impose costs on the U.S. economy. A decline in gasoline
consumption would make society better off only if the
cost of achieving the decline was less than its benefits.
Ideally, the United States would lower its gasoline use as
long as the benefit of additional reductions exceeded the
cost of additional reductions. However, quantifying thebenefits and costs of lower gasoline consumption and
identifying the optimal level of reduction are beyond the
scope of this study. Instead, this analysis compares policies
on the basis of whether they would bring about a given
reduction at the lowest possible cost.
A Brief History of the Three Policy OptionsThe policies discussed in this study are not new concepts.
The federal government has used a gasoline tax to raiserevenue since 1932. Fuel economy standards have been
in place since the late 1970s. And cap-and-trade programs
have been used for years to address a variety of environ-
mental problems.
1. Data on finished motor gasoline as a share of U.S. oil use come
from Energy Information Administration, Petroleum Supply
Annual 2001, vol. 1 (June 2002), Table 2 (available at www.eia.
doe.gov/pub/oil_gas/petroleum/data_publications/petroleum
_supply_annual/psa_volume1/current/pdf/table_02.pdf). The
United States accounts for approximately 26 percent of world
oil consumption; see Energy Information Administration, Inter-
national Petroleum Monthly (August 2002), Table 2.4 (available
at www.eia.doe.gov/emeu/ipsr/t24.txt).
2. Under collusion, a cartel of oil suppliers would scale back pro-
duction, artificially limiting supply in an effort to keep the priceof oil at the level that had existed before U.S. demand dropped.
Under competition, by contrast, the lowest-cost oil supplies
would be brought to market to meet the reduced demand at a
reduced price, and oil supplies that cost more to market than
the new, lower price would be idled.
3. See National Research Council, Effectiveness and Impact of Cor-
porate Average Fuel Economy (CAFE) Standards (Washington,
D.C.: National Academy of Sciences, 2002), p. 8. 4. Ibid., p. 85.
8/3/2019 CBO - Reducing Gasoline Consumption - Three Policy Options
http://slidepdf.com/reader/full/cbo-reducing-gasoline-consumption-three-policy-options 17/51
CHAPTER ONE INTRODUCTION 3
1978 1982 1986 1990 1994 199814
16
18
20
22
24
26
28
30
32
Average Fuel Economy of New Cars
CAFE Standard for New Cars
Average Fuel Economy of New Light Trucks
CAFE Standard for New Light Trucks
0
CAFE StandardsCorporate average fuel economy standards were mandated
by the Energy Policy and Conservation Act of 1975. All
manufacturers that sell more than 10,000 vehicles in a
given year must comply with the standards. Each manufac-
turer’s output is divided into four categories: imported
passenger cars, domestically produced passenger cars, two-
wheel-drive light trucks, and four-wheel-drive light
trucks.5 (Light trucks include pickup trucks, minivans,
and sport utility vehicles, or SUVs.) To comply, a manu-
facturer must ensure that the average fuel efficiency of its
vehicles in a particular category meets or exceeds the stan-
dard for that category. Imported and domestically pro-
duced cars have the same standard, but a manufacturer’s
imported and domestic fleets must comply with that limit
separately. Since 1992, manufacturers have had to meet
a combined standard for their two-wheel-drive and four-
wheel-drive trucks. Vehicles that weigh more than 8,500
pounds are exempt from CAFE requirements.
Producers that fail to meet CAFE standards must pay a
penalty of $5.50 per vehicle for every 0.1 mile per gallon
(MPG) that their fleet average falls below the relevant stan-
dard. Manufacturers can use “credits”—which they earn
by producing alternative-fuel vehicles or by exceeding
CAFE standards in a given year—to determine their com-
pliance. Credits may be carried forward or backward upto three years.
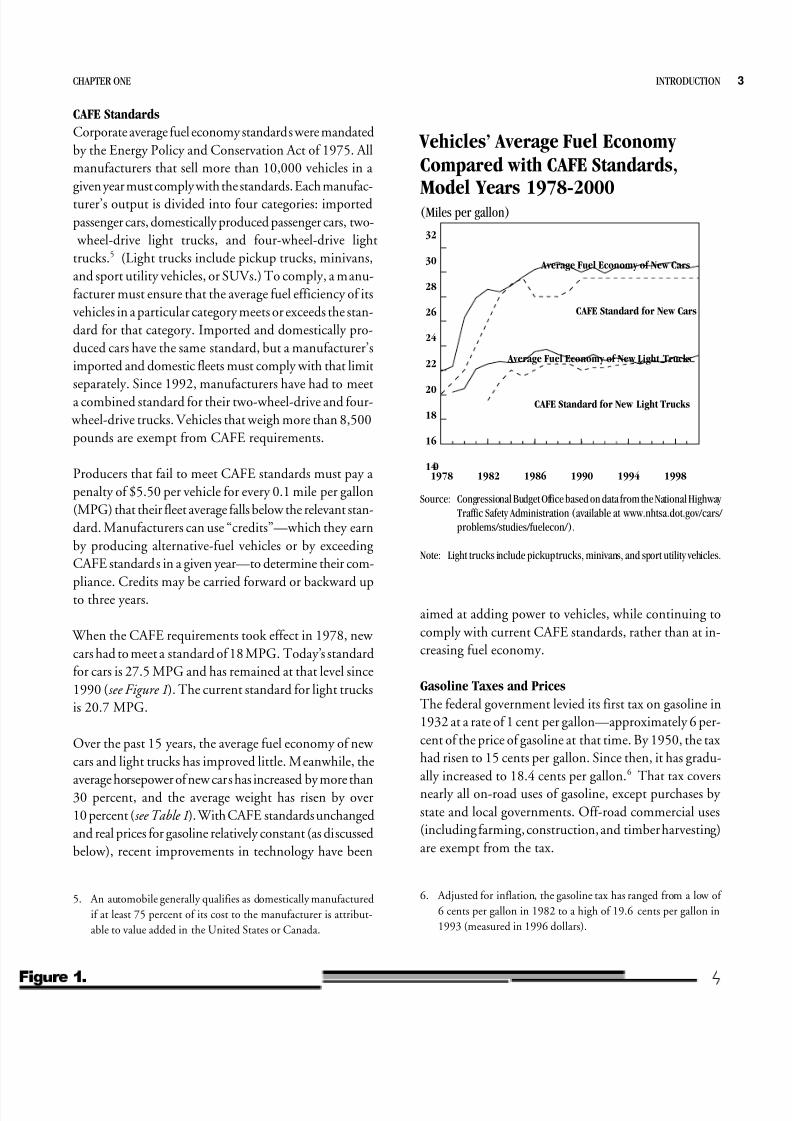
When the CAFE requirements took effect in 1978, new
cars had to meet a standard of 18 MPG. Today’s standard
for cars is 27.5 MPG and has remained at that level since
1990 (see Figure 1). The current standard for light trucks
is 20.7 MPG.
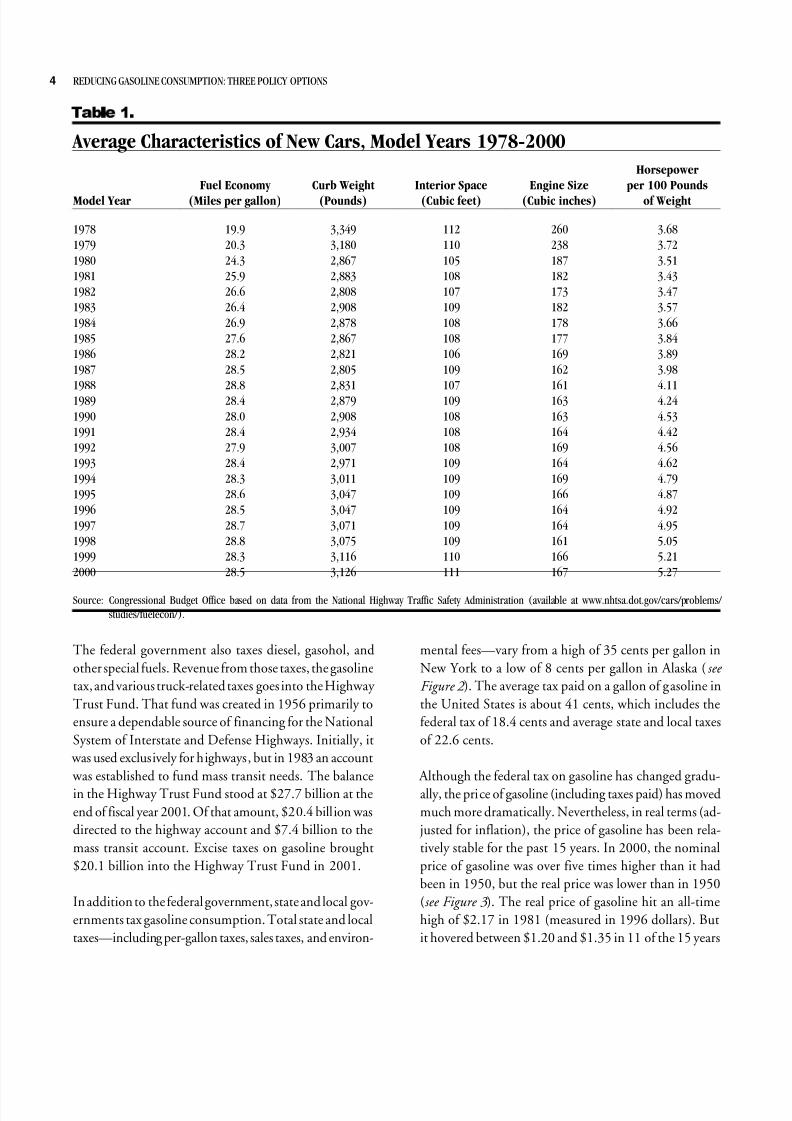
Over the past 15 years, the average fuel economy of new
cars and light trucks has improved little. Meanwhile, the
average horsepower of new cars has increased by more than30 percent, and the average weight has risen by over
10 percent (see Table 1). With CAFE standards unchanged
and real prices for gasoline relatively constant (as discussed
below), recent improvements in technology have been
) L J X U H
Vehicles’ Average Fuel Economy Compared with CAFE Standards,
Model Years 1978-2000(Miles per gallon)
Source: Congressional Budget Office based on data from the National Highway Traffic Safety Administration (available at www.nhtsa.dot.gov/cars/ problems/studies/fuelecon/).
Note: Light trucks include pickup trucks, minivans, and sport utility vehicles.
aimed at adding power to vehicles, while continuing to
comply with current CAFE standards, rather than at in-
creasing fuel economy.
Gasoline Taxes and Prices
The federal government levied its first tax on gasoline in
1932 at a rate of 1 cent per gallon—approximately 6 per-
cent of the price of gasoline at that time. By 1950, the tax
had risen to 15 cents per gallon. Since then, it has gradu-
ally increased to 18.4 cents per gallon.6 That tax covers
nearly all on-road uses of gasoline, except purchases by
state and local governments. Off-road commercial uses
(including farming, construction, and timber harvesting)
are exempt from the tax.
5. An automobile generally qualifies as domestically manufactured
if at least 75 percent of its cost to the manufacturer is attribut-
able to value added in the United States or Canada.
6. Adjusted for inflation, the gasoline tax has ranged from a low of
6 cents per gallon in 1982 to a high of 19.6 cents per gallon in
1993 (measured in 1996 dollars).
8/3/2019 CBO - Reducing Gasoline Consumption - Three Policy Options
http://slidepdf.com/reader/full/cbo-reducing-gasoline-consumption-three-policy-options 18/51
4 REDUCING GASOLINE CONSUMPTION: THREE POLICY OPTIONS
7 D E O H
Average Characteristics of New Cars, Model Years 1978-2000
Model Year
Fuel Economy
(Miles per gallon)
Curb Weight
(Pounds)
Interior Space
(Cubic feet)
Engine Size
(Cubic inches)
Horsepower per 100 Pounds
of Weight
1978 19.9 3,349 112 260 3.681979 20.3 3,180 110 238 3.721980 24.3 2,867 105 187 3.511981 25.9 2,883 108 182 3.431982 26.6 2,808 107 173 3.471983 26.4 2,908 109 182 3.571984 26.9 2,878 108 178 3.661985 27.6 2,867 108 177 3.841986 28.2 2,821 106 169 3.891987 28.5 2,805 109 162 3.981988 28.8 2,831 107 161 4.111989 28.4 2,879 109 163 4.241990 28.0 2,908 108 163 4.531991 28.4 2,934 108 164 4.421992 27.9 3,007 108 169 4.561993 28.4 2,971 109 164 4.621994 28.3 3,011 109 169 4.791995 28.6 3,047 109 166 4.871996 28.5 3,047 109 164 4.921997 28.7 3,071 109 164 4.951998 28.8 3,075 109 161 5.051999 28.3 3,116 110 166 5.212000 28.5 3,126 111 167 5.27
Source: Congressional Budget Office based on data from the National Highway Traffic Safety Administration (available at www.nhtsa.dot.gov/cars/problems/ studies/fuelecon/).
The federal government also taxes diesel, gasohol, and
other special fuels. Revenue from those taxes, the gasoline
tax, and various truck-related taxes goes into the Highway
Trust Fund. That fund was created in 1956 primarily to
ensure a dependable source of financing for the National
System of Interstate and Defense Highways. Initially, it
was used exclusively for highways, but in 1983 an account
was established to fund mass transit needs. The balance
in the Highway Trust Fund stood at $27.7 billion at the
end of fiscal year 2001. Of that amount, $20.4 billion was
directed to the highway account and $7.4 billion to the
mass transit account. Excise taxes on gasoline brought
$20.1 billion into the Highway Trust Fund in 2001.
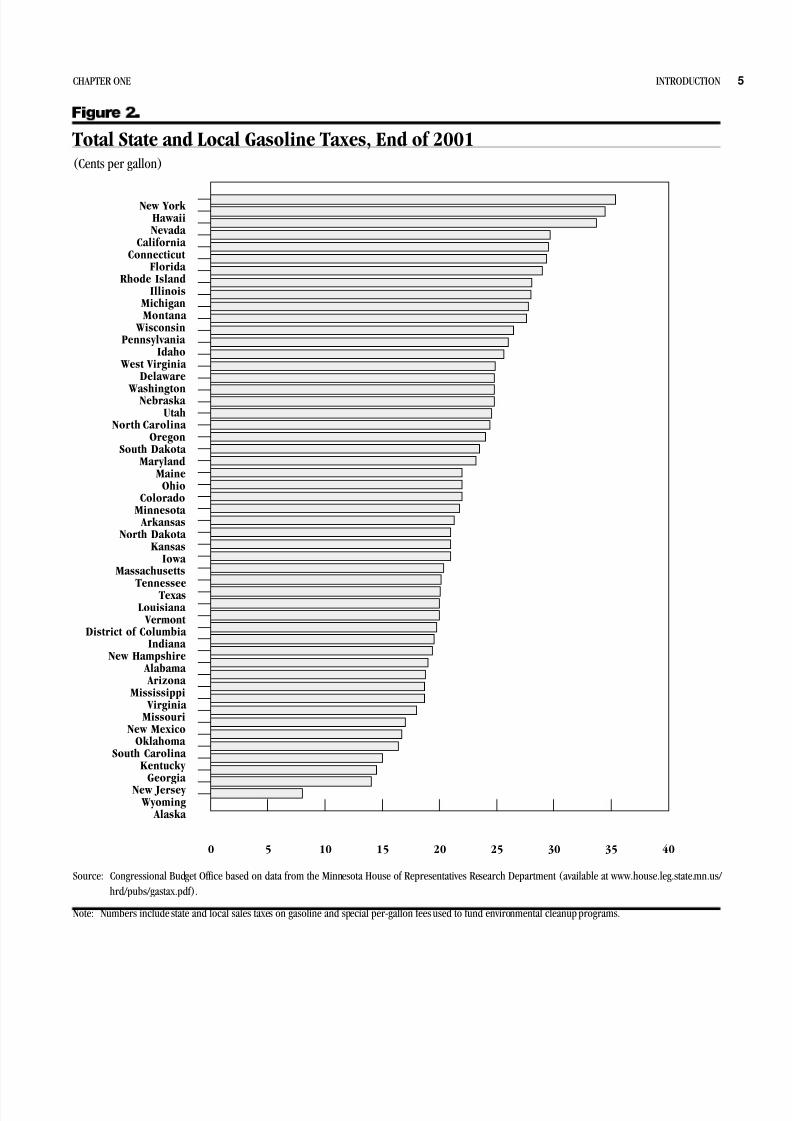
In addition to the federal government, state and local gov-
ernments tax gasoline consumption. Total state and local
taxes—including per-gallon taxes, sales taxes, and environ-
mental fees—vary from a high of 35 cents per gallon in
New York to a low of 8 cents per gallon in Alaska ( see
Figure 2 ). The average tax paid on a gallon of gasoline in
the United States is about 41 cents, which includes the
federal tax of 18.4 cents and average state and local taxes
of 22.6 cents.
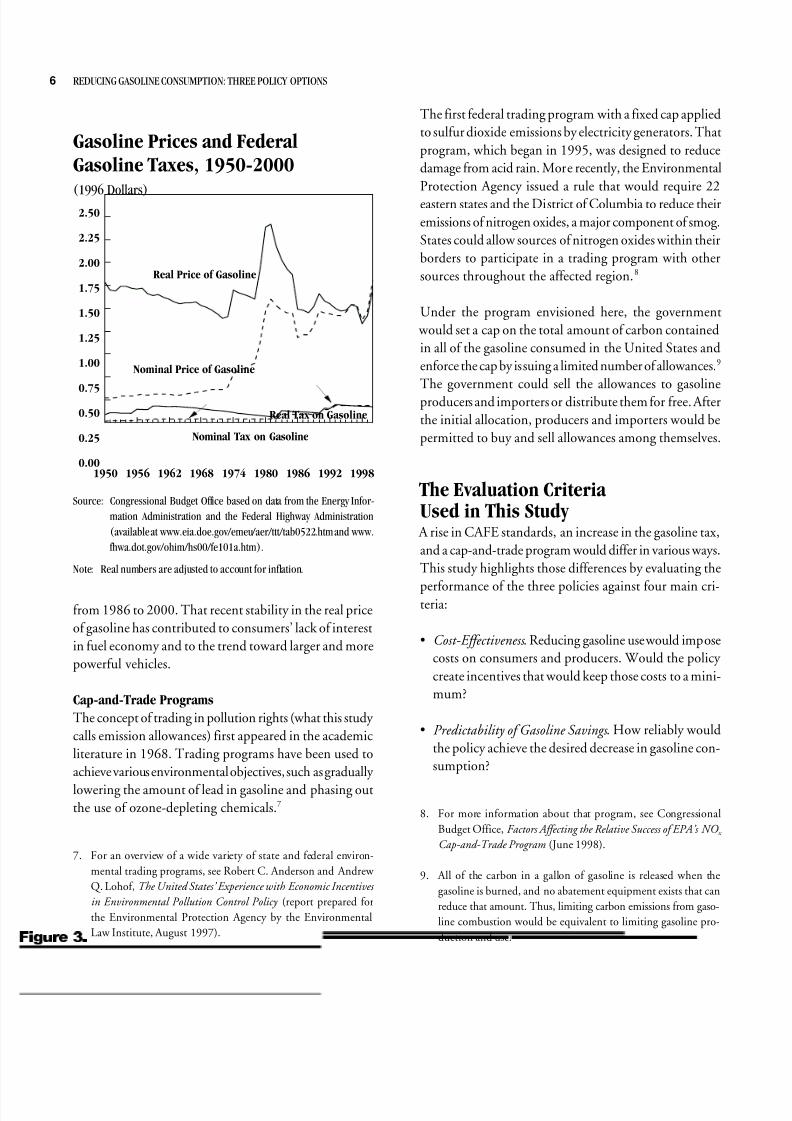
Although the federal tax on gasoline has changed gradu-
ally, the price of gasoline (including taxes paid) has moved
much more dramatically. Nevertheless, in real terms (ad-
justed for inflation), the price of gasoline has been rela-
tively stable for the past 15 years. In 2000, the nominal
price of gasoline was over five times higher than it had
been in 1950, but the real price was lower than in 1950
(see Figure 3 ). The real price of gasoline hit an all-time
high of $2.17 in 1981 (measured in 1996 dollars). But
it hovered between $1.20 and $1.35 in 11 of the 15 years
8/3/2019 CBO - Reducing Gasoline Consumption - Three Policy Options
http://slidepdf.com/reader/full/cbo-reducing-gasoline-consumption-three-policy-options 19/51
CHAPTER ONE INTRODUCTION 5
New York HawaiiNevada
California Connecticut
Florida Rhode Island
IllinoisMichiganMontana
WisconsinPennsylvania
Idaho West Virginia
Delaware
WashingtonNebraska Utah
North Carolina Oregon
South Dakota Maryland
MaineOhio
ColoradoMinnesota Arkansas
North Dakota Kansas
Iowa Massachusetts
Tennessee TexasLouisiana Vermont
District of Columbia Indiana
New Hampshire Alabama Arizona
Mississippi Virginia Missouri
New MexicoOklahoma
South Carolina Kentucky
Georgia New Jersey
Wyoming Alaska
0 5 10 15 20 25 30 35 40
) L J X U H
Total State and Local Gasoline Taxes, End of 2001(Cents per gallon)
Source: Congressional Budget Office based on data from the Minnesota House of Representatives Research Department (available at www.house.leg.state.mn.us/
hrd/pubs/gastax.pdf).
Note: Numbers include state and local sales taxes on gasoline and special per-gallon fees used to fund environmental cleanup programs.
8/3/2019 CBO - Reducing Gasoline Consumption - Three Policy Options
http://slidepdf.com/reader/full/cbo-reducing-gasoline-consumption-three-policy-options 20/51
6 REDUCING GASOLINE CONSUMPTION: THREE POLICY OPTIONS
1950 1956 1962 1968 1974 1980 1986 1992 19980.00
0.25
0.500.75
1.00
1.25
1.50
1.75
2.00
2.25
2.50
Real Price of Gasoline
Nominal Price of Gasoline
Real Tax on Gasoline
Nominal Tax on Gasoline
) L J X U H
Gasoline Prices and FederalGasoline Taxes, 1950-2000
(1996 Dollars)
Source: Congressional Budget Office based on data from the Energy Infor-
mation Administration and the Federal Highway Administration
(available at www.eia.doe.gov/emeu/aer/ttt/tab0522.htm and www.
fhwa.dot.gov/ohim/hs00/fe101a.htm).
Note: Real numbers are adjusted to account for inflation.
from 1986 to 2000. That recent stability in the real price
of gasoline has contributed to consumers’ lack of interest
in fuel economy and to the trend toward larger and more
powerful vehicles.
Cap-and-Trade Programs
The concept of trading in pollution rights (what this study
calls emission allowances) first appeared in the academic
literature in 1968. Trading programs have been used to
achieve various environmental objectives, such as gradually
lowering the amount of lead in gasoline and phasing outthe use of ozone-depleting chemicals.7
The first federal trading program with a fixed cap applied
to sulfur dioxide emissions by electricity generators. That
program, which began in 1995, was designed to reduce
damage from acid rain. More recently, the Environmental
Protection Agency issued a rule that would require 22
eastern states and the District of Columbia to reduce their
emissions of nitrogen oxides, a major component of smog.
States could allow sources of nitrogen oxides within their
borders to participate in a trading program with other
sources throughout the affected region.8
Under the program envisioned here, the government
would set a cap on the total amount of carbon contained
in all of the gasoline consumed in the United States and
enforce the cap by issuing a limited number of allowances.9
The government could sell the allowances to gasoline
producers and importers or distribute them for free. After
the initial allocation, producers and importers would be
permitted to buy and sell allowances among themselves.
The Evaluation Criteria Used in This Study A rise in CAFE standards, an increase in the gasoline tax,
and a cap-and-trade program would differ in various ways.
This study highlights those differences by evaluating the
performance of the three policies against four main cri-teria:
• Cost-Effectiveness . Reducing gasoline use would impose
costs on consumers and producers. Would the policy
create incentives that would keep those costs to a mini-
mum?
• Predictability of Gasoline Savings . How reliably would
the policy achieve the desired decrease in gasoline con-
sumption?
7. For an overview of a wide variety of state and federal environ-
mental trading programs, see Robert C. Anderson and Andrew
Q. Lohof, The United States’ Experience with Economic Incentives
in Environmental Pollution Control Policy (report prepared for
the Environmental Protection Agency by the Environmental
Law Institute, August 1997).
8. For more information about that program, see Congressional
Budget Office, Factors Affecting the Relative Success of EPA’s NO x
Cap-and-Trade Program (June 1998).
9. All of the carbon in a gallon of gasoline is released when the
gasoline is burned, and no abatement equipment exists that can
reduce that amount. Thus, limiting carbon emissions from gaso-
line combustion would be equivalent to limiting gasoline pro-
duction and use.
8/3/2019 CBO - Reducing Gasoline Consumption - Three Policy Options
http://slidepdf.com/reader/full/cbo-reducing-gasoline-consumption-three-policy-options 21/51
CHAPTER ONE INTRODUCTION 7
• Safety Effects . How would the policy affect the number
and severity of traffic accidents?
• Other Driving-Related External Costs. How would the
policy affect other external costs (ones borne by society
at large rather than by an individual) that result from
driving? Those costs include traffic congestion, the need
for highway maintenance, and emissions of vehicle pol-
lutants other than carbon dioxide.
Those criteria are described in detail in Chapters 2
through 5.
In addition to those effects, the three policy options would
have other implications that lawmakers may care about.
Those include:
• Distributional Effects . How would the costs of the policy
be distributed among U.S. households at different in-
come levels and in different parts of the country?
• Revenue Effects . How would the policy affect the amount
of revenue collected by the federal government?
Those criteria are examined in Chapter 6.

8/3/2019 CBO - Reducing Gasoline Consumption - Three Policy Options
http://slidepdf.com/reader/full/cbo-reducing-gasoline-consumption-three-policy-options 22/51
8/3/2019 CBO - Reducing Gasoline Consumption - Three Policy Options
http://slidepdf.com/reader/full/cbo-reducing-gasoline-consumption-three-policy-options 23/51
CHAPTER
Cost-Effectiveness
*asoline consumption can be reduced in many
ways—through technological improvements in the design
of vehicles as well as through a variety of behavioral
changes on the part of motorists. For example, manufac-turers could increase the fuel economy of new vehicles or
produce vehicles that use alternative fuels, such as ethanol.
Consumers could purchase relatively fuel-efficient vehicles
and hasten the retirement of older, less efficient ones. They
could shift some of their driving to the most efficient car
they own, reduce the number of miles they drive (such
as by carpooling, using public transportation, or forgoing
long trips), maintain their vehicles better, or drive more
slowly.
Each of those gas-saving activities would impose costs onthe producer or consumer who undertook it. People can
be expected to make such changes voluntarily when the
benefits to them would outweigh the costs. For example,
drivers would choose more-fuel-efficient vehicles if they
anticipated that their gasoline savings would be greater
than the disadvantages that might be associated with such
vehicles (say, a higher price or less horsepower). Likewise,
manufacturers would voluntarily improve the fuel econo-
my of their vehicles if they expected that doing so would
boost their profits.
If the federal government raised the gasoline tax, tightened
CAFE standards, or created a cap-and-trade program, it
would generate further gasoline savings by inducing pro-
ducers and consumers to undertake such activities to a
greater degree than they would otherwise.1 In all three
cases, the costs to producers would take the form of lower
profits, and the costs to consumers would take the form
of reductions in their well-being, because of both monetary
costs (such as price increases) and nonmonetary costs (suchas reduced satisfaction from driving a less-powerful vehicle
or inconvenience associated with carpooling).
The three policy options would differ in which parties they
would affect directly and indirectly. Raising the tax would
have a direct impact on consumers of gasoline because it
would increase the amount they could save by reducing
their gasoline use. It would affect automakers and gasoline
producers indirectly by raising consumers’ demand for
fuel economy in new vehicles and lowering their demand
for gasoline. A cap-and-trade program, in contrast, wouldaffect gasoline producers and importers directly by requir-
ing them to hold emission allowances. It would have an
indirect effect on gasoline consumers (who would face
higher prices) and on automobile producers (who would
see greater demand for fuel economy). Raising CAFE stan-
dards, unlike the other two policies, would have a direct
impact on automakers by requiring them to meet more-
stringent fuel economy standards. It would affect car buy-
ers indirectly through changes in the vehicle characteristics
that manufacturers offered and the prices they charged.
1. Given recent gasoline prices, automakers have found it most
profitable to produce vehicles that just meet CAFE standards.
Higher standards would therefore compel automakers to sell
more-fuel-efficient vehicles than consumers want and would
impose costs on both producers and consumers. If gasoline
prices rose significantly, an increase in CAFE standards might
not impose costs, because higher gasoline prices would boost
consumers’ demand for fuel-efficient vehicles. In that case, how-
ever, the gasoline savings would have occurred even in the ab-
sence of tighter CAFE standards.
8/3/2019 CBO - Reducing Gasoline Consumption - Three Policy Options
http://slidepdf.com/reader/full/cbo-reducing-gasoline-consumption-three-policy-options 24/51
10 REDUCING GASOLINE CONSUMPTION: THREE POLICY OPTIONS
Higher CAFE standards would also affect gasoline pro-
ducers indirectly by lessening the demand for gasoline.
Some proponents argue that raising CAFE standards
would not impose any costs. They contend that auto-
makers have low-cost ways to improve fuel economy, that
the gasoline savings from those technologies would make
consumers better off, and that without increases in CAFE
standards, producers would fail to make use of those tech-
nologies. Their argument rests on the assumption either
that consumers lack information about vehicles’ fuel
efficiency (in other words, they do not know what is best
for them) or that producers lack an incentive to respond
to consumers’ preferences for fuel efficiency. (That issue
is discussed in detail later in this study; see Box 2 on
page 16.)
Most economists do not believe that either assumption
is valid. Vehicles’ current level of fuel efficiency most likely
reflects consumers’ trade-offs between fuel economy and
other characteristics that drivers want, such as vehicle size,
horsepower, and safety. The same technologies that can
be used to boost fuel economy can be used to hold fuel
economy constant while increasing vehicles’ weight, size,
or power. Thus, the fact that producers have done the lat-
ter rather than the former in recent years suggests that they
have responded to buyers’ preferences by targeting avail-able technologies toward other features that consumers
desire. Raising CAFE standards would impose costs on
both consumers and automobile producers by forcing im-
provements in fuel economy that car buyers may not want.
Society would be best off if the costs of a policy to decrease
gasoline consumption were weighed against the benefits
of the decrease. In an ideal world, policymakers would
encourage reductions in gasoline use up to the point at
which the incremental cost—the cost of reducing an addi-
tional gallon of gasoline—that those reductions wouldimpose on producers and consumers equaled the incre-
mental benefit that would result (from fewer carbon emis-
sions and less energy consumption). However, quantifying
the benefits and costs of such reductions to determine that
ideal point is a difficult task and one that is beyond the
scope of this analysis.
A less demanding criterion is to make policy changes that
are “cost-effective” —in other words, that keep the decline
in producers’ profits and consumers’ welfare to a mini-
mum for any given level of gasoline savings. The incre-
mental cost of a gasoline-saving activity will rise as the level
of that activity grows. (For example, if automakers sought
higher and higher levels of fuel economy, the cost of
making an additional improvement in fuel economy would
increase.) Because producers and consumers have so many
methods to reduce gasoline use, which can be combined
in various ways or traded off for each other, policies would
be most cost-effective if they gave people the flexibility
to pursue as many of those methods as possible, up to the
point at which each method reached the same incremental
cost. (For instance, the total cost of decreasing gasoline
consumption could be lessened by relying more heavily
on reduced driving and less heavily on improvements in
fuel efficiency if the incremental cost for the former
activity was lower than for the latter.) By contrast, policies
that put all of their eggs in a few baskets—by encouraging
some gas-saving activities but not others—would not pro-
duce the most cost-effective reductions in gasoline use.
The Cost-Effectiveness of Raising CAFE Standards
Increasing the stringency of CAFE standards would mostlikely reduce gasoline consumption, but it would not do
so in a cost-effective way. The reason is that CAFE
standards do not directly encourage either producers or
consumers to decrease gasoline use, so they do not offer
the flexibility or the incentives for gasoline reductions to
occur at the lowest possible cost. That lack of cost-
effectiveness springs in part from shortcomings in the cur-
rent design of CAFE standards, which would allow auto-
makers to comply with higher standards in ways that
would not increase the average fuel economy of their
vehicles. It also springs from problems that are intrinsicto any policy that regulates fuel economy instead of pro-
viding a direct incentive to reduce gasoline consumption.
Automakers’ Compliance Strategies
Raising CAFE standards gives manufacturers a strong
incentive to increase the average fuel economy of the vehi-
8/3/2019 CBO - Reducing Gasoline Consumption - Three Policy Options
http://slidepdf.com/reader/full/cbo-reducing-gasoline-consumption-three-policy-options 25/51
CHAPTER TWO COST-EFFECTIVENESS 11
cles they sell (because otherwise they must pay a fine).
Automakers could use five different strategies, individually
or in combination, to comply with higher standards.
First, and most obvious, they could improve the fuel
economy of some or all of the vehicles they sell through
technological changes. One general way to boost a vehicle’s
fuel economy is to increase the overall efficiency of its
power train (the mechanism that transfers power from the
engine to the axles) in order to reduce energy losses.
Another way is to decrease the amount of energy needed
to propel the vehicle, by altering its weight, aerodynamics,
rolling resistance, or the power drain on the engine from
components such as the cooling fan and the air-condi-
tioning compressor.2
Second, manufacturers could give consumers financial
incentives to buy their more-fuel-efficient vehicles. That
strategy, called mix shifting, involves subsidizing (through
lower prices) the sale of more-fuel-efficient vehicles and
charging a premium (through higher prices) for less-fuel-
efficient ones. Because there are separate standards for cars
and light trucks, mix shifting could occur within each cate-
gory but not between categories. Some studies have shown
that mix shifting is more expensive than technology
improvements and that although some mix shifting takes
place, automakers have relied mainly on technologicalchanges to comply with CAFE standards.3
Third, manufacturers could alter the domestic content
of their vehicles. Because they must comply with separate
(though identical) standards for their domestic and im-
ported fleets, automakers cannot use relatively fuel-
efficient imports to offset less efficient domestically pro-
duced vehicles. (Imported cars are typically more fuel
efficient than domestic ones because they also cater to
foreign markets, where consumers often face higher gaso-
line prices than in the United States.) By altering the
amount of their vehicles’ value that is produced in the
United States or Canada so that domestic cars can be
reclassified as imports, automakers could use the higher
fuel economy of their imported fleet to offset the lower
fuel economy of what would otherwise be domestic
vehicles. One researcher has concluded that such a strategy
could lower manufacturers’ compliance costs significantly,
but the extent to which they have used it is unknown.4
Fourth, automakers could alter the design of cars so that
they would be reclassified as trucks and thus face a lower
CAFE standard. Anecdotal evidence of that practice exists
(for example, Chrysler’s PT Cruiser, which can carry just
four passengers and cannot tow a trailer, qualifies as a
truck because it has a removable backseat). However, the
extent of that practice is unknown.5
Policymakers established a lower CAFE standard for lighttrucks because when the standards were created, light
trucks were primarily work and cargo vehicles that needed
extra power, different gearing, and less aerodynamic de-
signs to perform their work-related functions. At that time,
they accounted for about 20 percent of new vehicles sold.
Today, light trucks constitute nearly half of new vehicles
sold, and many of them are used almost exclusively for
personal transport rather than for work or cargo.6
2. For a detailed discussion of technologies for improving fuel
economy, see National Research Council, Effectiveness and Im-
pact of Corporate Average Fuel Economy (CAFE) Standards
(Washington, D.C.: National Academy of Sciences, 2002).
3. Andrew Kleit found evidence of mix shifting in 1999 and con-
cluded that it was a very expensive compliance strategy; see
Andrew N. Kleit, Short- and Long-Range Impacts of Increases in
the Corporate Average Fuel Economy (CAFE) Standard (Washing-ton, D.C.: Competitive Enterprise Institute, February 7, 2002),
available at www.cei.org/pdf/2398.pdf. David Greene and
Yuehui Fan found that mix shifting had little effect on the gains
in fuel economy that occurred between 1975 and 1993; see
David L. Greene and Yuehui Fan, Transportation Energy Inten-
sity Trends: 1972-1992, Transportation Research Record No.
1475 (Washington, D.C.: Transportation Research Board,
1995).
4. See Pinelopi Koujianou Goldberg, “The Effects of the Corpo-
rate Average Fuel Efficiency Standards in the US,” Journal of
Industrial Economics , vol. 46, no.1 (March 1998), pp. 1-33.
5. National Research Council, Effectiveness and Impact of Corporate
Average Fuel Economy (CAFE) Standards , p. 88.
6. Ibid, p. 88.
8/3/2019 CBO - Reducing Gasoline Consumption - Three Policy Options
http://slidepdf.com/reader/full/cbo-reducing-gasoline-consumption-three-policy-options 26/51
12 REDUCING GASOLINE CONSUMPTION: THREE POLICY OPTIONS
% R [
Making CAFE Standards More Cost-Effective by Improving Their Design
The same level of fuel efficiency that corporate average
fuel economy (CAFE) standards require today might be
achieved at a lower cost if the current CAFE program was
restructured. That program includes distinct standards
for cars and light trucks, requires automakers to comply
separately for domestic and imported cars, and makes each
company meet the standards individually rather than mea-
suring compliance at the industry level. All three of those
features limit manufacturers’ behavior without reducing
gasoline consumption. Easing those constraints could po-
tentially lower the costs of complying with the current
CAFE standards.
Setting a Single Standard for All Vehicles
Reducing gasoline consumption imposes some monetary
and nonmonetary costs on producers and consumers; the
issue is how best to minimize those costs. With most auto-
makers required to meet several standards (for domestic
cars, foreign cars, and light trucks), total costs will gener-
ally not be kept to a minimum. The reason is that the costs
of complying with separate standards tend to be unequal
at the margin (the point at which a final expenditure, price
change, or weight reduction just brings a firm into compli-
ance). Inequalities in marginal compliance costs indicatethat the total cost of the CAFE program can be reduced
without lowering overall fuel economy.
Any given level of fuel efficiency could be achieved more
cheaply by allowing manufacturers to undercomply where
their marginal costs were highest, as long as they overcom-
plied by an equivalent amount (in terms of gasoline
savings) where their costs were lower. For instance, it may
be cheaper for an automaker to save “one more gallon”
of gasoline by raising the average mileage of its light trucks
somewhat than by raising the average mileage of its domes-tic cars slightly. Likewise, a firm might be able to increase
average mileage more cheaply for its imported vehicles
than for its domestic fleet. If a unified standard applied
to all of an automaker’s light-duty passenger vehicles—in-
cluding light trucks and domestic and imported cars—
companies would be free to take advantage of such cost-
saving trade-offs.
Moreover, if it was appropriately designed, a unified stan-
dard would eliminate manufacturers’ incentives to use un-
productive compliance methods. In other words, firms
could not reduce compliance costs by designing cars that
could be classified as trucks or by altering production prac-
tices so that cars were classified as imported instead of do-
mestic. Further, a unified standard would not give con-
sumers an incentive to switch from cars to trucks, since
trucks would no longer be subject to less-stringent fueleconomy requirements.
Making the transition to a single standard for all vehicles
could pose difficulties, however. A unified standard that
reflected the current average fuel economy of all new light-
duty vehicles sold would benefit manufacturers that sell
mainly cars and penalize firms that sell mainly trucks. For
example, the existing car and truck standards (27.5 and
20.7 miles per gallon, respectively) and the roughly 50/50
mix of current car and truck sales imply a unified standard
of 24.1 MPG. An automaker that produced 75 percenttrucks and 25 percent cars and just met the separate car
and truck standards would have an average mileage rating
of 22.4 MPG for its total fleet. That firm would be out
of compliance under the unified standard, even though
it had been in compliance with the separate standards. In
contrast, a company that produced 75 percent cars and
25 percent trucks and also just met the separate standards
would have a combined fleet average of 25.8 MPG, which
would exceed the unified standard.
One way around that problem would be to set a separateunified standard for each manufacturer—one that reflected
the current requirements for cars and trucks as well as the
manufacturer’s existing mix of car and truck sales. Such
a standard would not alter automakers’ compliance status.
8/3/2019 CBO - Reducing Gasoline Consumption - Three Policy Options
http://slidepdf.com/reader/full/cbo-reducing-gasoline-consumption-three-policy-options 27/51
CHAPTER TWO COST-EFFECTIVENESS 13
% R [
Continued
(In the above example, the first company would be re-
quired to meet a unified standard of 22.4 MPG, and the
second company would have to meet a unified standard
of 25.8 MPG.) But that design would “grandfather” lower
standards for manufacturers that now produce a relatively
large share of trucks. Alternatively, each automaker’s
standard could be adjusted annually to reflect that year’s
mix of car and truck sales. However, such an adjustment
would not eliminate companies’ incentives to use one un-
productive compliance method. Specifically, manufactur-
ers would be able to lower their overall compliance re-
quirements by making vehicles that could be classified as
light trucks rather than as passenger cars.
Setting a Standard for the Industry as a Whole
Under a unified standard for cars and trucks, cost differ-
ences would still generally exist among automakers because
of differences in the average size and performance attri-
butes of their vehicles and in their manufacturing costs.
One way to reduce total costs would be to lessen differ-
ences in compliance costs among companies. That could
be accomplished through fuel economy credit trading.1
Under such a trading system, the government would seta fuel economy standard for the entire auto industry.
Manufacturers that exceeded the standard would generate
credits, which they could sell to firms that fell below the
standard. (The credits would be measured in gallons of
gasoline saved.) Each company’s compliance would be
based on the fuel economy of the vehicles it sold in a given
year, plus the number of fuel economy credits it held.
Automakers with lower marginal compliance costs could
raise their average MPG ratings above the required level
in order to generate credits to sell. Other companies could
1. Such trading was recommended in National Research Council,
Effectiveness and Impact of Corporate Average Fuel Economy (CAFE)
Standards (Washington, D.C.: National Academy of Sciences,
2002).
buy those credits to make up a shortfall in their fleets’
mileage ratings.2 It would be cheaper for high-cost firms
to buy credits than to achieve the standard directly. (That
is roughly the same principle that underlies cap-and-trade
programs, in which sources of pollution trade emission
allowances.)
Letting overcomplying firms sell fuel economy credits to
undercomplying firms could minimize total costs to pro-
ducers and consumers. However, if the industrywide
standard was a unified one covering both cars and trucks,
credit trading would transfer wealth within the auto indus-
try from companies that now sell a majority of trucks (and would need to buy credits under the unified standard) to
companies that now sell a majority of cars (and would have
excess credits to sell under the new standard). Of course,
credit trading could be implemented either with or with-
out a unified standard for all vehicles.
The potential for credit trading to reduce total compliance
costs would depend on how much those costs would vary
among automakers in the absence of trading. The greater
that variation, the greater the possible savings from trad-
ing. Further, credit trading would minimize compliancecosts only if the market for credits was competitive—that
is, if no buyer or seller could influence the price of credits.
More research is needed to determine the extent to which
credit trading could actually lower the overall cost of
meeting CAFE standards. The Congressional Budget
Office is currently analyzing that issue.
2. Because some manufacturers already achieve greater fuel economy
than the current standards require, credit trading could increase
gasoline consumption if the standards themselves were not also
raised. The reason is that sales of credits by overcomplying firmsallow the buyers of the credits to undercomply by an equivalent
amount. That would let some companies expand their sales of less-
fuel-efficient vehicles. Alternatively, standards could be tightened
enough to leave total gasoline consumption unchanged.
8/3/2019 CBO - Reducing Gasoline Consumption - Three Policy Options
http://slidepdf.com/reader/full/cbo-reducing-gasoline-consumption-three-policy-options 28/51
14 REDUCING GASOLINE CONSUMPTION: THREE POLICY OPTIONS
Fifth, manufacturers could make “flex-fuel” vehicles—
which can operate on ethanol as well as gasoline—as part
of their compliance strategy. The government assumes that
such vehicles will be operated on gasoline only half of the
time, and it counts only miles per gallon of gasoline for
compliance purposes. For example, a vehicle that got 20
miles per gallon when running solely on gasoline would
be classified as a vehicle with a fuel efficiency of 33 MPG
if it was also capable of running on ethanol.7
Problems with the Current Design of CAFE Standards
Raising CAFE standards would fall short of the cost-
effectiveness ideal in part because of the current design
of those standards. As noted above, automakers can com-
ply with them in ways that do not lead to lower gasoline
use. Altering the manufacture or design of vehicles so they
count as imported rather than domestic or as light trucks
rather than cars neither raises the overall fuel economy
of passenger vehicles nor reduces gasoline consumption.
Producing flex-fuel cars can also achieve CAFE compliance
without decreasing gasoline use if those cars are not actu-
ally run on ethanol, as seems to be the case.8 The lower
the price of gasoline—and hence the less that buyers want
relatively fuel-efficient cars—the more incentive manufac-
turers have to find ways of complying with CAFE stan-
dards that do not involve altering the fuel economy of
their vehicles and do not lead to lower gasoline consump-tion.
In addition, manufacturers can avoid CAFE constraints
altogether by producing vehicles that exceed 8,500
pounds. For example, the Ford Excursion, which is used
as a passenger vehicle, weighs more than 8,500 pounds
and thus is not subject to any CAFE limit.
If higher standards caused car prices to increase more than
light-truck prices, some consumers might switch from
buying cars to buying light trucks that use more gasoline.9
Such switching would not put manufacturers out of com-
pliance but would lead to greater gasoline consumption.
Another problem with the standards’ current design is that
since each manufacturer must meet CAFE standards for
its own fleet, the incremental cost of further improvements
in fuel economy will differ among automakers. The total
cost of improving fuel economy would be lower if manu-
facturers with relatively high compliance costs were
allowed to undercomply, so long as manufacturers with
relatively low costs overcomplied by the same amount (as
measured in gasoline consumption).10
Those shortcomings of the CAFE program could be
reduced by making various design modifications to the
current standards. (For more details, see Box 1on page 12.)
Problems with Targeting Fuel Economy
Even if the previous shortcomings were addressed, raising
CAFE standards would not be cost-effective for at least
two reasons, which are intrinsic to any policy that targetsfuel economy. First, those standards do not give people
an incentive to change their driving habits in ways that
would reduce gasoline use. Instead, CAFE-induced im-
provements in the fuel efficiency of new vehicles would
lower the cost of driving those vehicles and could cause
their owners to drive more. Researchers generally assume
that a 10 percent decline in the fuel-related costs of driving
7. Those MPG figures account for the fact that ethanol is 15 per-
cent gasoline; they assume that such a vehicle would get 15
MPG running on ethanol. See Richard C. Porter, Economics at
the Wheel (San Diego: Academic Press, 1999).
8. Using information from the Energy Information Administra-
tion, the National Research Council estimated that less than 1
percent of the fuel consumed by flex-fuel vehicles in 1999 was
ethanol; the rest was gasoline. See National Research Council,
Effectiveness and Impact of Corporate Average Fuel Economy
(CAFE) Standards , p. 89. Moreover, in 2000, only 113 fueling
stations in the United States offered ethanol; see Department of
Energy, Transportation Energy Data Book: Edition 21 (October
2001), Table 7-15 (available at www-cta.ornl.gov/data/tedb21/
Spreadsheets/Table7_15.xls).
9. One study suggests that consumers will respond that way, but
its results are illustrative rather than based on empirical data.See Steven G. Thorpe, “Fuel Economy Standards, New Vehicle
Sales, and Average Fuel Efficiency,” Journal of Regulatory Eco-
nomics , vol. 11 (1997), pp. 311-326.
10. Equivalent increases or decreases in MPG ratings would not
produce equivalent changes in gasoline consumption. For exam-
ple, raising fuel economy from 33 MPG to 34 MPG would save
0.09 gallons per 100 miles driven, whereas lowering fuel econ-
omy from 21 MPG to 20 MPG would increase gasoline use by
0.24 gallons per 100 miles.
8/3/2019 CBO - Reducing Gasoline Consumption - Three Policy Options
http://slidepdf.com/reader/full/cbo-reducing-gasoline-consumption-three-policy-options 29/51
CHAPTER TWO COST-EFFECTIVENESS 15
leads to about a 2 percent increase in the number of
vehicle miles driven.11
Second, an increase in CAFE standards could cause some
drivers to delay buying new vehicles and instead operate
their older, less-fuel-efficient ones longer. Such delays
would tend to occur if manufacturers complied with
higher CAFE standards by making technological changes
that raised car prices. Although all old vehicles would be
retired eventually, delaying new-car purchases would post-
pone the full realization of the fuel-saving benefits asso-
ciated with technology improvements.12
The Cost-Effectiveness of
Raising the Gasoline Tax A well-designed increase in the federal tax on gasoline
would give consumers a direct incentive to reduce gasoline
consumption. As a result, it would encourage them to
undertake all of the activities that could lead to lower
gasoline use. Consumers would have an incentive to drive
less, to rely more heavily on the most fuel-efficient car they
owned, to retire gas-guzzling vehicles earlier, and to buy
more-fuel-efficient vehicles. In general, people engage in
each of those activities up to the point at which the cost
of the activity equals the savings in gasoline spending that
it brings about. A higher gasoline tax would encourage
consumers to undertake more of each of those activities
by increasing the value of their gasoline savings. Thus, it
could lead to a cost-effective reduction in gasoline con-
sumption.
Moreover, an increase in the gasoline tax would not create
incentives for manufacturers to make unproductive design
changes that would raise their fleets’ MPG ratings by re-
classifying vehicles without reducing gasoline use. With
a gasoline-tax hike, sales of more-fuel-efficient vehicles
would increase (relative to sales of less-fuel-efficient ones)
and the fuel economy of vehicles would improve because
of changes in consumer demand, not because manufactur-
ers had to meet regulatory requirements.
To be most cost-effective, an increase in the gasoline tax
would need to be well designed in at least two ways. First,
it would have to cover all uses of gasoline that could be
reduced at a cost lower than the tax. As noted in Chap-
ter 1, gasoline purchased by state or local governments
or for off-road commercial uses is exempt from the tax.
The extent to which such exemptions would reduce the
cost-effectiveness of a rise in the gasoline tax would depend
on the potential for gas-saving changes in the exempted
sectors. If that potential was low (in other words, gasoline
consumption in those sectors would not change under the
tax), then exempting the sectors would not significantly limit the cost-effectiveness of the tax increase.
Second, a significant rise in the gasoline tax would have
to be matched by an equivalent rise in the tax on diesel
fuel. Otherwise, drivers might shift to diesel-powered
vehicles, lessening the effectiveness of the gasoline-tax in-
crease. (Currently, less than 1 percent of new automobiles
sold in the United States are powered by diesel fuel.)13
Further, a tax increase would be most effective at reducing
gasoline consumption if it was perceived as permanentand was adjusted to keep pace with inflation. If people
expected that a rise in the gasoline tax would be removed
11. Estimates of that response vary: some research suggests that a 10
percent decrease in fuel costs could lead to as much as a 4 per-
cent rise in vehicle miles driven, whereas other studies show
little effect. Most studies find increases of between 1 percent
and 3 percent, and an estimate of 2 percent is frequently used in
empirical research. For a discussion of the estimates, see David
L. Greene, Why CAFE Worked (Oak Ridge, Tenn.: Oak Ridge
National Laboratory, November 1997).
12. One study claims that manufacturers’ mix shifting could lead to
increased gasoline consumption. The reason is that mix shiftingcould raise the total number of vehicles purchased (if buyers of
relatively fuel-efficient vehicles were more likely to increase their
purchases when prices fell than buyers of less-fuel-efficient vehi-
cles were to decrease their purchases when prices rose). How-
ever, that study fails to account for the effect that increased sales
would have on the retirement of vehicles. If higher sales were
matched by accelerated retirements, gasoline consumption
would fall. See John E. Kwoka, “The Limits of Market-Ori-
ented Regulatory Techniques: The Case of Automotive Fuel
Economy,” Quarterly Journal of Economics , vol. 97 (November
1983), pp. 695-704.
13. In 2000, 0.26 percent of new retail automobile sales in the
United States were of diesel-powered vehicles. See Department
of Energy, Transportation Energy Data Book: Edition 21 (Octo-
ber 2001), Table 7-3 (available at www-cta.ornl.gov/data/
tedb21/Spreadsheets/Table7_03.xls).
8/3/2019 CBO - Reducing Gasoline Consumption - Three Policy Options
http://slidepdf.com/reader/full/cbo-reducing-gasoline-consumption-three-policy-options 30/51
16 REDUCING GASOLINE CONSUMPTION: THREE POLICY OPTIONS
% R [
Is the Market for Fuel Economy in New Vehicles Efficient?
An increase in the gasoline tax would lead to the produc-
tion of more-fuel-efficient vehicles only if it caused
consumers to attach a higher value to fuel economy and
if producers responded to the rise in demand for more-
efficient vehicles. Some advocates of corporate average fuel
economy (CAFE) standards argue that a regulatory ap-
proach is necessary because the market for fuel economy
is not efficient—that is, consumers and producers would
not respond in those ways to a rise in the gasoline tax.1
Some proponents of CAFE standards maintain that al-
though fuel economy is displayed on the labels of new
vehicles (in the form of miles per gallon for highway andcity driving), consumers lack the information to precisely
determine their individual savings from greater fuel econo-
my. Those savings depend on the amount of highway ver-
sus city driving they will do, their projections of future
gasoline prices, and the discount rate (the interest rate used
to determine the present value of future benefits and costs)
that they select.
Although few consumers may make those calculations,
the fuel economy information on labels does let them
assess the relative fuel economy of vehicles. Without mak-ing actual calculations, consumers who expect higher gaso-
line prices in the future and who are concerned about op-
erating costs (perhaps because they drive a great deal or
have tight budgets) will tend to value fuel economy more
1. This description of potential failures in the market for fuel economy
is based on David L. Greene, Why CAFE Worked (Oak Ridge,
Tenn.: Oak Ridge National Laboratory, November 1997), pp. 3-4.
than consumers who drive less, have larger budgets, or
expect lower gasoline prices in the future. There is little
reason to believe that a tax increase that significantly raised
gasoline prices would not increase the value that consu-
mers attach to fuel economy.
Another problem with the automobile market, according
to CAFE advocates, is that buyers cannot be expected to
take the time and effort to balance their preference for fuel
economy against the numerous other features they may
care about, such as size, reliability, style, and performance.
That does not mean, however, that fuel economy does not
affect vehicle choice. Fuel economy, like cargo space orperformance, is one of multiple features that influence a
buyer’s preference for one vehicle over another. Consu-
mers would need to make trade-offs among the relative
importance of those features, but in cases in which other
features were the same, they would prefer a vehicle with
higher fuel economy. If a gasoline-tax increase caused
consumers to prefer more fuel economy, producers would
have an incentive to take that preference into account
when redesigning models.
Finally, some proponents of CAFE standards argue thatproducers would be reluctant to make design changes that
would boost fuel economy, because if they made a design
mistake, they could lose a significant share of the market
for a single vehicle model. Conversely, producers could
gain market share by choosing designs that better reflected
consumers’ preferences for all features, including fuel
economy. There is little reason to believe that automakers
would be more reluctant to meet consumers’ demand for
fuel economy than for any other feature.
or would fall over time because of inflation, they would
have less reason to buy more-fuel-efficient vehicles.
Some advocates of CAFE standards have argued that
failures in the automobile market would prevent an
increase in the gasoline tax from leading to improvements
in the fuel economy of vehicles (see Box 2 ). However, most
analysts agree that a gasoline-tax increase could be effective
in boosting fuel efficiency.
In addition, studies have found that consumers respond
to higher gasoline prices by reducing their gasoline con-
sumption, particularly in the long run. (For more details
of those studies, see Box 3 .) In the short run, consumers
may respond to higher prices mainly by driving less (for
example, by carpooling or using public transportation)
or by switching some of their driving to the most fuel-
efficient vehicle they own. In the long run, consumers can
make more-drastic changes to reduce their gasoline use.
8/3/2019 CBO - Reducing Gasoline Consumption - Three Policy Options
http://slidepdf.com/reader/full/cbo-reducing-gasoline-consumption-three-policy-options 31/51
CHAPTER TWO COST-EFFECTIVENESS 17
% R [
The Effect of Price Changes on Gasoline Consumption
Consumers’ responsiveness to price changes is measured
in the form of a “price elasticity.” That elasticity indicates
the extent to which a 1 percent increase in price would
affect the demand for a good or service (measured as a per-
centage change in the quantity sold).
Empirical estimates of price elasticities for gasoline vary
greatly, in part because they are sensitive to the type of
model used to estimate them. A 1991 survey analyzed
97 price-elasticity estimates for gasoline.1 It defined 18
different categories of models and estimated the average
short-run and long-run price elasticity for the types of
models most appropriate for measuring those elasticities.The authors found an average short-run elasticity of -0.26
and an average long-run elasticity of -0.86.2 Based on those
estimates, a 15-cent increase in the tax on gasoline (or a
10 percent increase in price, assuming a price of $1.50
per gallon) would cause a 2.6 percent decrease in the
amount of gasoline used by passenger vehicles in the short
run and an 8.6 percent decrease in the long run. An
1. Carol Dahl and Thomas Sterner, “Analyzing Gasoline Demand
Elasticities: A Survey,” Energy Economics (July 1991).
2. Seven different categories of models were found to be appropriatefor measuring short-run and long-run elasticities. The average
elasticity estimates for the categories considered appropriate for mea-
suring the short-run price elasticity ranged from -0.22 to -0.31.
The average estimates for categories appropriate for long-run
elasticities ranged from -0.80 to -1.01.
equivalent decline in gasoline consumption would result
from increasing the stringency of corporate average fuel
economy standards by roughly 10 percent.3
Consumers’ responsiveness to changes in gasoline prices
could alter over time because of numerous factors, such
as changes in average income, options for public transit,
and the availability of technologies for improving fuel
economy. Some (though not all) more-recent studies have
estimated lower long-run price elasticities. Based on a re-
view of those studies, the Department of Energy suggests
a long-run price elasticity of -0.38—implying that a 15-
cent rise in the gasoline tax would eventually cause a 3.8percent decline in the amount of gasoline used by passen-
ger vehicles.4 Measuring price elasticities is a difficult task,
however, and the elasticities discussed here should be
viewed only as rough estimates.
3. That estimate assumes that a 10 percent increase in fuel economy
would result in a 2 percent increase in vehicle miles traveled. It
also assumes that the increase in CAFE stringency would not cause
consumers to switch from cars to trucks and would not cause
manufacturers to shift vehicle production from domestic cars to
light trucks and imported cars.
4. Department of Energy, Office of Policy and International Affairs,
Policies and Measures for Reducing Energy Related Greenhouse Gas
Emissions: Lessons From Recent Literature , DOE/PO-0047 (July
1996).
For instance, they can trade in their vehicles for models
with greater fuel economy or choose to live closer to their
work.
The Cost-Effectiveness of Creating a Cap-and-Trade ProgramLike a tax increase, a cap-and-trade program for gasoline-
related carbon emissions would reduce gasoline consump-
tion in a cost-effective way. Companies would have to buy
emission allowances in order to continue producing or
importing gasoline, which most likely would lead to higher
prices at the pump. By raising the price of gasoline, a cap-
and-trade program would give people an incentive to en-
gage in all possible gas-saving activities, including buying
more-fuel-efficient vehicles as well as changing their driv-ing habits.
If the main objective of the cap-and-trade program was
to decrease carbon emissions, the same level of emission
reductions could be achieved at a lower cost by extending
the program as broadly as possible—in other words, by
making it apply to all sources of carbon emissions through-
out the economy, not just the combustion of gasoline.
8/3/2019 CBO - Reducing Gasoline Consumption - Three Policy Options
http://slidepdf.com/reader/full/cbo-reducing-gasoline-consumption-three-policy-options 32/51
18 REDUCING GASOLINE CONSUMPTION: THREE POLICY OPTIONS
Under one type of broad program (an “upstream” pro-
gram), all producers and importers of oil, coal, and natural
gas would be required to hold allowances based on the
carbon content of their fuel—that is, the carbon emitted
when the fuel is burned.14
The cap on carbon emissions would limit the production
of carbon-based fossil fuels and would cause the price of
those fuels to rise—with price increases reflecting each
fuel’s allowance requirements and, hence, its carbon con-
tent.15 Those price increases would raise companies’ and
consumers’ costs, encouraging them to decrease their use
of fossil fuels and energy-intensive goods and services. As
a result, households and businesses throughout the econo-
my would have an incentive to reduce all forms of carbon
consumption and thus carbon emissions. (For example,
utilities, which account for 38 percent of U.S. carbon
emissions, would have an incentive to rely less on coal,
which is the most carbon-intensive fossil fuel.) In short,
an upstream cap-and-trade program would create an
economywide incentive to decrease carbon emissions and
would ensure that reductions were made at the lowest
possible cost.
In contrast, a cap-and-trade program that covered only
producers and importers of gasoline would confine incen-
tives for cutting carbon emissions to the gasoline-
consuming sector—which accounts for just 20 percent
of U.S. carbon emissions. Such a system would not en-
courage potentially lower-cost reductions that might have
been made outside that sector.
Similarly, raising the gasoline tax would reduce carbon
emissions from gasoline consumption but would not en-
courage reductions in other sectors. Alternatively, levying
a tax on the carbon content of all fossil fuels—much like
enacting an upstream cap-and-trade program—would
create an incentive for carbon reductions throughout the
economy.
14. Requiring that companies hold an allowance for each ton of carbon introduced into the economy through production or
importation of fossil fuels is equivalent to requiring an allowance
for each ton of carbon emitted into the atmosphere. That is
because there is no economically viable method (such as scrub-
bing emissions from smokestacks) for reducing the amount of
carbon emissions per unit of fuel burned.
15. For example, the carbon released per million British thermal
units (MBTU) of coal is 1.8 times the amount released per
MBTU of natural gas.
8/3/2019 CBO - Reducing Gasoline Consumption - Three Policy Options
http://slidepdf.com/reader/full/cbo-reducing-gasoline-consumption-three-policy-options 33/51
CHAPTER
Predictability of Gasoline Reductions
,n adopting a policy to decrease gasoline consumption,
lawmakers might want assurance that the policy would
achieve the reductions intended. However, neither raising
corporate average fuel economy standards nor increasingthe federal gasoline tax would ensure a given decline in
gasoline use. In both cases, the ultimate decrease in con-
sumption would depend, at least in part, on how consu-
mers and producers responded to the policy change. Be-
tween those two changes, however, the uncertainty about
the resulting gasoline reduction would most likely be
greater for an increase in the gasoline tax than for an in-
crease in well-designed CAFE standards. For a cap-and-
trade program, the predictability of gasoline savings would
depend on the design of the program.
CAFE StandardsUnder the current design of the CAFE standards, estimat-
ing how much gasoline use would decline in the long run
because of a given increase in the standards would require
estimating the size of several changes in producers’ and
consumers’ behavior. Particularly important are the extent
to which:
• Manufacturers would comply with higher standards
by using unproductive strategies that would not increasethe overall fuel efficiency of the vehicles they sold,
• Price changes caused by the higher standards would
cause consumers to switch from cars to light trucks,
• CAFE-induced price changes would cause consumers
to buy vehicles that exceed the weight limit that the
standards apply to (8,500 pounds), and
• Lower operating costs would cause buyers of new vehi-
cles to drive more miles.1
If the CAFE standards were redesigned so that automakershad to meet a single, unified requirement for their entire
fleet—including trucks, cars, and foreign and domestic
vehicles—then producers and consumers would not have
an incentive to engage in the first two activities (see Box 1
on page 12). In that case, raising the CAFE standards
would be expected to produce a corresponding increase
in the fuel economy of cars and light trucks (assuming that
the penalty for noncompliance was high enough that
manufacturers would meet the standards).
Some of the potential gasoline savings from a rise in fleet- wide fuel economy would be offset by increases in driving.
However, that offset would probably be limited to about
20 percent. (Estimates vary, but most lie between 10 per-
cent and 30 percent, as noted in Chapter 2.)2 Thus, unless
higher CAFE standards caused consumers to buy vehicles
weighing more than 8,500 pounds, the gasoline savings
associated with an increase in well-designed CAFE stan-
dards would be relatively easy to predict.
1. Increases in the stringency of CAFE standards could also slow
the retirement of existing vehicles. However, that effect would
not alter the long-run gasoline savings associated with raising
CAFE standards, which are the savings that would occur once
the existing stock was replaced with vehicles subject to the new
standards.
2. See note 11 in Chapter 2.
8/3/2019 CBO - Reducing Gasoline Consumption - Three Policy Options
http://slidepdf.com/reader/full/cbo-reducing-gasoline-consumption-three-policy-options 34/51
20 REDUCING GASOLINE CONSUMPTION: THREE POLICY OPTIONS
A Gasoline Tax and a Cap-and-Trade Program An increase in the gasoline tax would not ensure a specific
decline in gasoline use, nor—unlike improved CAFE stan-
dards—would it cause a specific increase in fuel economy.Thus, estimating the gasoline savings that would result
from a particular tax increase would require estimating
changes in fleetwide fuel economy (which depend on
changes in consumer demand) as well as changes in the
number of vehicle miles traveled. Price elasticities provide
estimates of the expected change in gasoline consumption
for a given price increase (see Box 3 on page 17), but such
estimates are rough ones. Despite its uncertainty, however,
a gasoline tax could be adjusted over time to meet a
specific reduction target.
A cap-and-trade program could be designed to ensure that
a given target for gasoline consumption was reached.
Because the amount of carbon in gasoline is fixed, a limit
on carbon emissions would essentially curtail the produc-
tion of gasoline. The government could set an overall tar-
get and issue the number of emission allowances that cor-
responded to the target level. However, such a policy
would not limit the cost of reductions in gasoline con-
sumption. In other words, gasoline use would be reduced
to the target level even if the cost of making reductions
became very high as the target was approached. (Low-cost
methods would be used first, leaving successively higher-
cost methods as the amount of reductions was increased.)
Alternatively, the government could set a ceiling on the
price of allowances by agreeing to sell an unlimited quan-
tity of them at that price (otherwise, the fixed supply of
allowances would cause the price to rise). Setting a maxi-
mum price for allowances would limit reductions in car-
bon consumption to ones that cost less than that price.
It would not, however, ensure that the target was met. If,
through trading, the allowance price rose to the ceiling,
the government would sell additional allowances at that
price, and the amount of gasoline consumed would exceed
the target level. In that case, the cap-and-trade program
would be analogous to a gasoline tax, with the tax rate
equal to the ceiling price for allowances.
8/3/2019 CBO - Reducing Gasoline Consumption - Three Policy Options
http://slidepdf.com/reader/full/cbo-reducing-gasoline-consumption-three-policy-options 35/51
CHAPTER
Effects on Safety
3olicy changes that reduce gasoline consumption
could have varying effects on the safety of driving. Policies
that led to smaller or lighter cars would tend to make acci-
dents more dangerous, whereas policies that led to lightertrucks could reduce fatalities. Policies that encouraged
people to drive fewer miles would tend to lower the num-
ber of accidents.
Studies of the safety implications of corporate average fuel
economy standards have produced mixed results. Virtually
no research has been done on the safety implications of
a higher gasoline tax or a cap-and-trade program for car-
bon emissions.
CAFE StandardsThe effect of CAFE standards on driving safety has been
a much debated—and highly contentious—issue. Numer-
ous studies have examined the topic and reached varying
conclusions. A recent report by the Committee on the
Effectiveness and Impact of Corporate Average Fuel
Economy Standards, formed by the National Research
Council, discussed that controversy and weighed the
existing empirical evidence.1 This section draws heavily
on the committee's discussion and analysis.
During the first five years that CAFE standards were in
effect, the weight and size of new cars declined rapidly:
average weight fell by 800 pounds, and average wheelbase
decreased by seven inches. Light-duty trucks also declined
in weight, though to a lesser extent. In the past decade,
both cars and light trucks have grown again. Today, cars
are about 600 pounds lighter than they were in 1976, on
average, and light trucks are about 30 pounds heavier.
Changes in the weight and size of cars and light-duty
trucks can be expected to have different effects on safety.
The occupants of lighter vehicles experience greater force
in collisions with other vehicles or with fixed objects. In
addition, smaller vehicles offer smaller crush zones and
less interior space for restraint systems to operate effec-
tively. Thus, decreasing the weight and size of cars would
lead to a higher number of fatalities. Theoretically, the
same would be true for trucks, but the increased risk to
occupants of lighter trucks during collisions is offset by the reduced risk to occupants of other (usually much
lighter) vehicles involved in those collisions.2 As a result,
declines in the weight of light trucks tend to decrease fatal-
ities overall.
Sorting out the impact of CAFE standards on vehicle
safety is complicated by the fact that many other factors
also affect safety. Death rates from motor vehicle crashes
have fallen steadily over the past half century, including
during the period when CAFE standards went into effect
and vehicle weights declined (see Figure 4 ). That trend isthought to have resulted from better vehicle designs, less
drunk driving, greater use of safety belts, and improved
road design.
Although vehicle safety has improved, the relevant ques-
tion with regard to CAFE standards is whether travel in1. See National Research Council, Effectiveness and Impact of Cor-
porate Average Fuel Economy (CAFE) Standards (Washington,
D.C.: National Academy of Sciences, 2002). 2. Ibid., p. 27.
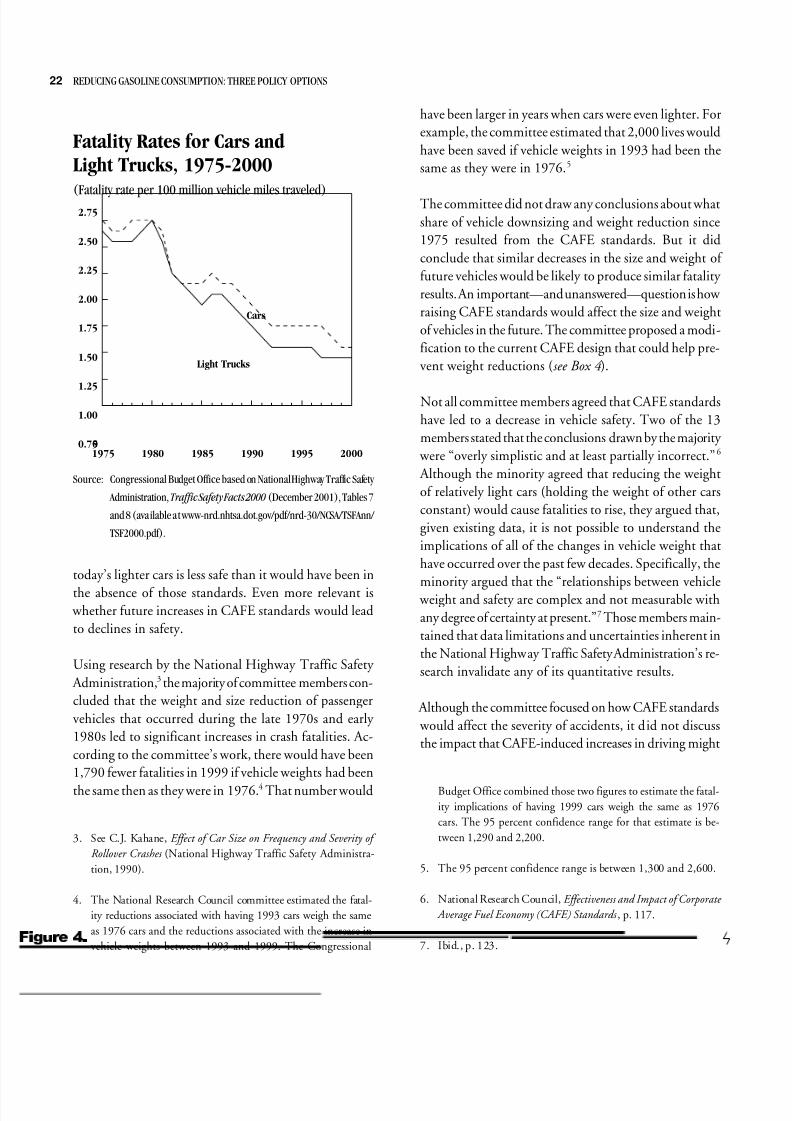
8/3/2019 CBO - Reducing Gasoline Consumption - Three Policy Options
http://slidepdf.com/reader/full/cbo-reducing-gasoline-consumption-three-policy-options 36/51
22 REDUCING GASOLINE CONSUMPTION: THREE POLICY OPTIONS
1975 1980 1985 1990 1995 20000.75
1.00
1.25
1.50
1.75
2.00
2.25
2.50
2.75
Cars
Light Trucks
0
) L J X U H
Fatality Rates for Cars and Light Trucks, 1975-2000
(Fatality rate per 100 million vehicle miles traveled)
Source: Congressional Budget Office based on National Highway Traffic Safety
Administration,Traffic Safety Facts 2000 (December 2001), Tables 7
and 8 (available at www-nrd.nhtsa.dot.gov/pdf/nrd-30/NCSA/TSFAnn/
TSF2000.pdf).
today’s lighter cars is less safe than it would have been in
the absence of those standards. Even more relevant is whether future increases in CAFE standards would lead
to declines in safety.
Using research by the National Highway Traffic Safety
Administration,3 the majority of committee members con-
cluded that the weight and size reduction of passenger
vehicles that occurred during the late 1970s and early
1980s led to significant increases in crash fatalities. Ac-
cording to the committee’s work, there would have been
1,790 fewer fatalities in 1999 if vehicle weights had been
the same then as they were in 1976.4 That number would
have been larger in years when cars were even lighter. For
example, the committee estimated that 2,000 lives would
have been saved if vehicle weights in 1993 had been the
same as they were in 1976.5
The committee did not draw any conclusions about what
share of vehicle downsizing and weight reduction since
1975 resulted from the CAFE standards. But it did
conclude that similar decreases in the size and weight of
future vehicles would be likely to produce similar fatality
results. An important—and unanswered—question is how
raising CAFE standards would affect the size and weight
of vehicles in the future. The committee proposed a modi-
fication to the current CAFE design that could help pre-
vent weight reductions (see Box 4 ).
Not all committee members agreed that CAFE standards
have led to a decrease in vehicle safety. Two of the 13
members stated that the conclusions drawn by the majority
were “overly simplistic and at least partially incorrect.” 6
Although the minority agreed that reducing the weight
of relatively light cars (holding the weight of other cars
constant) would cause fatalities to rise, they argued that,
given existing data, it is not possible to understand the
implications of all of the changes in vehicle weight that
have occurred over the past few decades. Specifically, the
minority argued that the “relationships between vehicle weight and safety are complex and not measurable with
any degree of certainty at present.”7 Those members main-
tained that data limitations and uncertainties inherent in
the National Highway Traffic Safety Administration’s re-
search invalidate any of its quantitative results.
Although the committee focused on how CAFE standards
would affect the severity of accidents, it did not discuss
the impact that CAFE-induced increases in driving might
3. See C.J. Kahane, Effect of Car Size on Frequency and Severity of
Rollover Crashes (National Highway Traffic Safety Administra-
tion, 1990).
4. The National Research Council committee estimated the fatal-
ity reductions associated with having 1993 cars weigh the same
as 1976 cars and the reductions associated with the increase in
vehicle weights between 1993 and 1999. The Congressional
Budget Office combined those two figures to estimate the fatal-
ity implications of having 1999 cars weigh the same as 1976
cars. The 95 percent confidence range for that estimate is be-
tween 1,290 and 2,200.
5. The 95 percent confidence range is between 1,300 and 2,600.
6. National Research Council, Effectiveness and Impact of Corporate
Average Fuel Economy (CAFE) Standards , p. 117.
7. Ibid., p. 123.
8/3/2019 CBO - Reducing Gasoline Consumption - Three Policy Options
http://slidepdf.com/reader/full/cbo-reducing-gasoline-consumption-three-policy-options 37/51
CHAPTER FOUR EFFECTS ON SAFETY 23
% R [
Changing the Design of CAFE Standards to Improve Auto Safety
Since corporate average fuel economy (CAFE) standards
were introduced, the average difference in weight between
cars and light trucks has widened greatly.1 At the same
time, the ratio of new cars to new trucks sold has shifted
from about 4 to 1 to near parity.2 According to many
experts, that combination of trends has significant implica-
tions for vehicle safety.3
A recent study of CAFE standards by the National Re-
search Council (NRC) proposes altering the standards’
current design—which focuses on fuel economy for entire
classes of vehicles—so that further regulation of fuel effi-
ciency would not affect safety. Fuel economy is strongly related to weight; all other things being equal, heavier
vehicles are less fuel efficient than lighter ones. Thus, the
NRC study proposes setting fuel economy targets specific
to vehicle weight: the lighter the vehicle, the more strin-
gent the target it would have to meet.4 Vehicles above a
certain weight would all have to meet the same target,
reducing automakers’ incentive to build very heavy gas-
guzzlers.
That system of standards could be designed to yield the
same total fuel efficiency as the current system. As now,
1. National Highway Traffic Safety Administration, “Overview of
Vehicle Compatibility/LTV Issues,” (February 1998), available
at www.nhtsa.dot.gov/cars/problems/studies/LTV/.
2. Light trucks now make up about 47 percent of passenger vehicles
sold; see Environmental Protection Agency,Light-Duty Automotive
Technology and Fuel Economy Trends: 1975 Through 2001, EPA
420-R-008 (September 2001).
3. See, in particular, National Research Council, Effectiveness and
Impact of Corporate Average Fuel Economy (CAFE) Standards
(Washington, D.C.: National Academy of Sciences, 2002).
4. Under current CAFE regulations and in the proposed system,
standards are averages for a manufacturer’s entire fleet of a given
class of vehicles; individual vehicles do not have to meet any
particular standard. The NRC study distinguishes between standards
for a fleet and targets for individual vehicles. In either system,
compliance would be determined at the fleet level; thus, it is
appropriate to refer to individual targets based on weight and an
overall standard for fleet miles per gallon.
each vehicle’s contribution to its manufacturer’s overall
compliance would depend on the gap between its fuel
economy and the relevant target. With weight-based tar-
gets, however, the mileage of a lightweight gas-sipper
would no longer tend to exceed the applicable fuel econo-
my target, meaning that lightweight cars would no longer
be especially effective at helping an automaker comply
with the CAFE standards. At the same time, manufacturers
would have an incentive to lighten heavier vehicles that
were subject to a single (non-weight-based) target, because
that would help them comply with the fuel economy
standards.
The expected result of instituting a weight-based CAFE
system would be to discourage the production of very
small and very large vehicles while encouraging a more
uniform and narrower distribution of vehicle weights.
That change would help reverse the growing disparity in
vehicle weights that many experts feel has been a primary
contributor to the apparent safety cost of CAFE regula-
tion. A weight-based system can also be seen as a way to
regulate firms that specialize in fuel-efficient vehicles on
a more equal footing with firms that sell heavier vehicles
(and thus are more constrained by the standards).
Improvements to vehicle safety could come with several
costs, however. The NRC study cites three. First, weight-
based targets could lessen regulators’ ability to induce
automakers to improve the overall fuel economy of their
fleets. (Weight reduction is a reliable method for improv-
ing fuel efficiency. No matter how stringent weight-based
targets were, they would reduce the cost-effectiveness of
that method.) Second, those targets would diminish com-
panies’ incentives to develop new, stronger lightweight
materials. And third, the average weight of vehicles couldincrease, resulting in greater fuel consumption (although
that effect would depend on the specific weight targets
chosen).5
5. National Research Council, Effectiveness and Impact of Corporate
Average Fuel Economy (CAFE) Standards , p. 107.

8/3/2019 CBO - Reducing Gasoline Consumption - Three Policy Options
http://slidepdf.com/reader/full/cbo-reducing-gasoline-consumption-three-policy-options 38/51
8/3/2019 CBO - Reducing Gasoline Consumption - Three Policy Options
http://slidepdf.com/reader/full/cbo-reducing-gasoline-consumption-three-policy-options 39/51
8/3/2019 CBO - Reducing Gasoline Consumption - Three Policy Options
http://slidepdf.com/reader/full/cbo-reducing-gasoline-consumption-three-policy-options 40/51
26 REDUCING GASOLINE CONSUMPTION: THREE POLICY OPTIONS
vehicle emissions.4 By lowering the cost of operating a
vehicle, higher CAFE standards would increase vehicle
miles traveled—by roughly 2 percent for each 10 percent
increase in CAFE stringency.5 More driving would mean
more tailpipe emissions.
Gauging the total effect on emissions of those three
pollutants, however, also requires accounting for changes
in emissions that occur during the production and delivery
of gasoline. Since an increase in CAFE standards would
decrease gasoline consumption, it would reduce produc-
tion- and delivery-related emissions. A life-cycle analysis
of automobile-related air pollutants indicates that those
fuel-production stages (from extraction of raw materials
to delivery of the fuel to the final user) generate emissions
of nitrogen oxides and volatile organic compounds
“roughly equal to the emissions resulting from the lifetime
of the vehicle.”6 On net, therefore, higher CAFE standards
would reduce total emissions of nitrogen oxides and vola-
tile organic compounds, because decreases in production-
and delivery-related emissions are estimated to outweigh
the increase in tailpipe emissions from greater VMTs. For
carbon monoxide, by contrast, fuel production and deliv-
ery generate comparatively small amounts of emissions.7
Thus, an increase in CAFE standards would be expected
to lead to a small rise in carbon monoxide emissions be-
cause of the rise in VMTs.
As with tighter CAFE standards, a higher gasoline tax or
a cap-and-trade program would induce long-term increases
in vehicles’ fuel economy. Although that would not
necessarily lower tailpipe emission rates of the three
regulated pollutants, it would lower the total amount of
those pollutants emitted, both by reducing production-
and delivery-related emissions and by discouraging VMTs.
Congestion A recent comparison of the external costs of driving found
that costs associated with traffic congestion (such as lost
time and productivity and delays in deliveries) exceed
other external costs, including those from emissions of
regulated pollutants and carbon dioxide and from motor
vehicle accidents. That study used a cost estimate for con-
gestion of 5 cents per mile, or $1 per gallon of gasoline.8
Researchers have estimated congestion costs at between
1.2 cents and 14.8 cents per mile, or between $0.24 and
$2.96 per gallon.9
All three policies discussed in this study would affect
congestion indirectly by altering vehicle miles traveled:
a higher gasoline tax or a cap-and-trade program would
tend to lower VMTs (by raising gasoline prices), whereas
tighter CAFE standards would tend to increase them (by
lowering the operating costs of vehicles). None of thosepolicies would be expected to have a big impact on the
level of congestion. But given the large potential costs
associated with congestion, even small policy-induced
changes in the amount of driving could have significant
economic costs.
None of those policies is well suited to discourage traffic
congestion, which is primarily a problem of peak-period
demand. The decline in VMTs from a gasoline-tax
increase or a cap-and-trade program would not necessarily
occur mainly during peak periods. Moreover, using CAFE
4. One study addresses that issue directly, estimating the change in
pollutants that would result from a three-mile-per-gallon in-
crease in fuel economy requirements for all passenger vehicles.
The study finds that emissions of the three regulated pollutants
would rise by 1.6 percent to 1.9 percent, primarily because of
the expected increase in VMTs. See Andrew N. Kleit, Short-
and Long-Range Impacts of Increases in the Corporate Average Fuel
Economy (CAFE) Standard (Washington, D.C.: Competitive
Enterprise Institute, February 7, 2002), available at www.cei.
org/pdf/2398.pdf.
5. See note 11 in Chapter 2.
6. Lester Lave and others, “Life-Cycle Analysis of Alternative Auto-
mobile Fuel/Propulsion Technologies,” Environmental Science
and Technology , vol. 34, no. 17 (August 2000), p. 3601.
7. Fuel production generates only about 2 percent of the carbon
monoxide emissions that would come from the tailpipe of a car
that complied with existing emission requirements; ibid., p.
3601.
8. See Ian W.H. Parry, “Does Tightening CAFE Do More Harm
Than Good?” (working paper, Resources for the Future, Sep-
tember 2002).
9. See Ian W.H. Parry and Kenneth A. Small, Does Britain or the
United States Have the Right Gasoline Tax? Discussion Paper 02-
12 (Washington, D.C.: Resources for the Future, March 2002),
p. 16.
8/3/2019 CBO - Reducing Gasoline Consumption - Three Policy Options
http://slidepdf.com/reader/full/cbo-reducing-gasoline-consumption-three-policy-options 41/51
CHAPTER FIVE EFFECTS ON OTHER EXTERNAL COSTS RELATED TO DRIVING 27
standards to reduce congestion would entail lowering those
standards. Policies that target the cost of peak-period driv-
ing directly, such as tolls levied during those periods, are
better suited for addressing congestion problems.
Highway Construction and MaintenanceBy altering VMTs, an increase in CAFE standards or the
federal gasoline tax or enactment of a cap-and-trade pro-
gram would also indirectly affect requirements for high-
way construction and maintenance. Unless the scale of
those policy changes was very large, however, the effects
on miles traveled would be small. The resulting change
in spending needed to continue current levels of highway
construction and maintenance would most likely besmaller still.
Raising CAFE standards is the only one of the three
policies that would be expected to stimulate demand for
highway travel, and that increase in demand would occur
gradually over a decade or so. Meanwhile, peak-period
demand for highway travel will probably continue to grow
independent of any change in the stringency of CAFE
standards. That growth is likely to outweigh the effects
of all but very large changes in CAFE standards and to
be a much more important determinant of highway con-
struction requirements.
The need for highway maintenance is largely determined
by road degradation from vehicle travel. Damage to roads
is primarily caused by freight and other heavy-duty
trucks.10 A higher gasoline tax would discourage some
travel by light-duty vehicles but would not affect heavier,
diesel-powered vehicles (unless the tax on diesel fuel was
also raised). The same would be true of a cap-and-trade
program geared toward gasoline combustion. Similarly,
the increased travel caused by higher CAFE standards
would be limited to vehicles that weigh less than 8,500
pounds. Thus, the effect of any of those policy changes
on highway maintenance needs is likely to be very small.
10. A moderately loaded tractor trailer can weigh more than 60,000
pounds, whereas the heaviest sport utility vehicles weigh little
more than 8,500 pounds. The difference in road damage associ-
ated with those vehicles is only partly reflected in differences in
taxes on fuel and other taxes and fees.

8/3/2019 CBO - Reducing Gasoline Consumption - Three Policy Options
http://slidepdf.com/reader/full/cbo-reducing-gasoline-consumption-three-policy-options 42/51
8/3/2019 CBO - Reducing Gasoline Consumption - Three Policy Options
http://slidepdf.com/reader/full/cbo-reducing-gasoline-consumption-three-policy-options 43/51
CHAPTER
Other Policy Implications:Distributional and Revenue Effects
7he policies to reduce gasoline consumption described
in this study are not aimed at altering the income distribu-
tion in the United States or raising federal revenue. None-theless, increasing the federal gasoline tax, tightening cor-
porate average fuel economy standards, or enacting a cap-
and-trade program would have distributional and revenue
effects, which policymakers might want to take into con-
sideration.
Studies suggest that a gasoline-tax increase would impose
higher costs on rural households than on urban house-
holds, but they disagree about how those costs would be
distributed among households at different income levels.
Depending on how it was designed, a cap-and-trade pro-
gram could have similar distributional effects to those of
a gasoline tax. Little research is available about the distri-
butional effects of raising CAFE standards.
Increasing the gasoline tax would boost federal revenues
(despite the decline in gasoline use that would result),
whereas increasing CAFE standards would lower revenues.
Under current law, additional receipts from a rise in the
federal gasoline tax would be dedicated to the Highway
Trust Fund, which pays for highways and mass transit.
With changes to current law, those receipts could be used
in myriad ways, which could have widely varying implica-
tions for the economy. The revenue effects of a cap-and-
trade program would depend on whether the government
chose to sell emission allowances or to give them away.
Distributional Effects A policy change to decrease gasoline consumption will
impose different burdens on households depending ontheir income level and where they live. Several researchers
have examined how the effects of a higher gasoline tax
would differ among U.S. households on the basis of those
two factors, but few have examined the distributional ef-
fects of higher CAFE standards. Some studies have looked
at the distributional effects of an economywide cap-and-
trade program for carbon emissions,1 but no research has
been done on the effects of a cap-and-trade program that
applies only to carbon emissions from gasoline use.
Effects on Households at Different Income Levels
Some advocates of raising CAFE standards argue that
doing so would be more equitable than increasing the
gasoline tax because gasoline taxes are regressive—in other
words, they disproportionately burden people with lower
income. That assertion is based on surveys of household
consumption that find that gasoline purchases take up a
much larger fraction of measured annual income for lower-
income households than for higher-income households.
However, spending on gasoline as a share of annual
income may not be a good measure of the regressivity of
1. See Congressional Budget Office, Who Gains and Who Pays
Under Carbon-Allowance Trading? The Distributional Effects of
Alternative Policy Designs (June 2000).
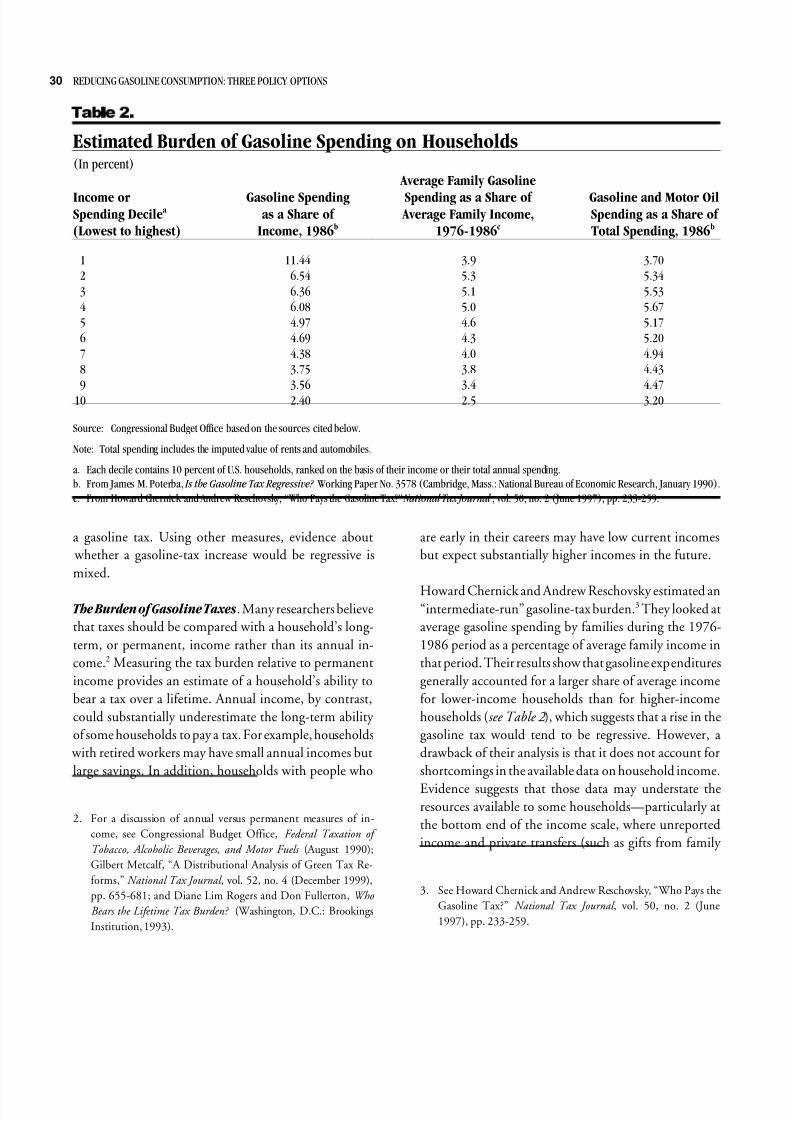
8/3/2019 CBO - Reducing Gasoline Consumption - Three Policy Options
http://slidepdf.com/reader/full/cbo-reducing-gasoline-consumption-three-policy-options 44/51
30 REDUCING GASOLINE CONSUMPTION: THREE POLICY OPTIONS
7 D E O H
Estimated Burden of Gasoline Spending on Households(In percent)
Income orSpending Decilea
(Lowest to highest)
Gasoline Spending as a Share of
Income, 1986b
Average Family Gasoline
Spending as a Share of Average Family Income,
1976-1986c
Gasoline and Motor OilSpending as a Share of Total Spending, 1986b
1 11.44 3.9 3.702 6.54 5.3 5.343 6.36 5.1 5.534 6.08 5.0 5.675 4.97 4.6 5.176 4.69 4.3 5.207 4.38 4.0 4.948 3.75 3.8 4.439 3.56 3.4 4.47
10 2.40 2.5 3.20
Source: Congressional Budget Office based on the sources cited below.
Note: Total spending includes the imputed value of rents and automobiles.
a. Each decile contains 10 percent of U.S. households, ranked on the basis of their income or their total annual spending.b. From James M. Poterba, Is the Gasoline Tax Regressive? Working Paper No. 3578 (Cambridge, Mass.: National Bureau of Economic Research, January 1990).
c. From Howard Chernick and Andrew Reschovsky, “Who Pays the Gasoline Tax?” National Tax Journal , vol. 50, no. 2 (June 1997), pp. 233-259.
a gasoline tax. Using other measures, evidence about
whether a gasoline-tax increase would be regressive is
mixed.
The Burden of Gasoline Taxes. Many researchers believe
that taxes should be compared with a household’s long-
term, or permanent, income rather than its annual in-
come.2 Measuring the tax burden relative to permanent
income provides an estimate of a household’s ability to
bear a tax over a lifetime. Annual income, by contrast,
could substantially underestimate the long-term ability
of some households to pay a tax. For example, households
with retired workers may have small annual incomes but
large savings. In addition, households with people who
are early in their careers may have low current incomes
but expect substantially higher incomes in the future.
Howard Chernick and Andrew Reschovsky estimated an“intermediate-run” gasoline-tax burden.3 They looked at
average gasoline spending by families during the 1976-
1986 period as a percentage of average family income in
that period. Their results show that gasoline expenditures
generally accounted for a larger share of average income
for lower-income households than for higher-income
households (see Table 2 ), which suggests that a rise in the
gasoline tax would tend to be regressive. However, a
drawback of their analysis is that it does not account for
shortcomings in the available data on household income.
Evidence suggests that those data may understate theresources available to some households—particularly at
the bottom end of the income scale, where unreported
income and private transfers (such as gifts from family
2. For a discussion of annual versus permanent measures of in-
come, see Congressional Budget Office, Federal Taxation of
Tobacco, Alcoholic Beverages, and Motor Fuels (August 1990);
Gilbert Metcalf, “A Distributional Analysis of Green Tax Re-
forms,” National Tax Journal , vol. 52, no. 4 (December 1999),
pp. 655-681; and Diane Lim Rogers and Don Fullerton, Who
Bears the Lifetime Tax Burden? (Washington, D.C.: Brookings
Institution, 1993).
3. See Howard Chernick and Andrew Reschovsky, “Who Pays the
Gasoline Tax?” National Tax Journal , vol. 50, no. 2 (June
1997), pp. 233-259.
8/3/2019 CBO - Reducing Gasoline Consumption - Three Policy Options
http://slidepdf.com/reader/full/cbo-reducing-gasoline-consumption-three-policy-options 45/51
CHAPTER SIX OTHER POLICY IMPLICATIONS: DISTRIBUTIONAL AND REVENUE EFFECTS 31
members) may constitute a larger share of household
resources.4
Some researchers believe that a household’s spending
provides a better measure of its long-term ability to pay
a tax than its income does. Spending reflects both expec-
tations of higher future income (to the extent that people
can borrow money) and household saving (as people draw
on accumulated resources). Thus, expenditures reflect
households’ permanent income better than annual income
does. In addition, using expenditure data avoids the
problem of understated household resources.
When gasoline spending is measured as a share of total
expenditures, evidence on the distributional effects of a
gasoline-tax increase is mixed. For example, the Congres-
sional Budget Office found that spending on all motor
fuels made up about 3 percent of total expenditures for
the bottom four-fifths of the income distribution and 2.3
percent of total expenditures for the highest one-fifth.5
A study by James Poterba ranked households in tenths
(or deciles) on the basis of their total spending and found
that gasoline and motor oil accounted for a smaller share
of total expenditures for households in the lowest-spending
decile than for households in all but the top-spending
decile (see Table 2 ).6 However, that study also found that
the second, third, and fourth deciles had higher expendi-ture shares than any of the other deciles.
Data that are viewed at the decile level may hide consid-
erable variation in households’ burdens within deciles. For
example, the Poterba study found that among households
in the lowest decile, one-third reported no direct spending
on gasoline, whereas 14 percent reported that gasoline
accounted for more than one-tenth of their total spending.
An increase in the gasoline tax, therefore, would impose
a relatively large burden on those 14 percent of low-
income households unless they received some compensa-
tion.
One way to at least partly offset higher gasoline-tax pay-
ments would be to increase government payments for
some low-income households. Government payments that
rise each year with changes in the consumer price index
(such as Social Security benefits and Supplemental Security
Income payments) would automatically increase as a result
of a higher gasoline tax—provided that the tax caused the
consumer price index to rise.
Indexed government payments generally make up a much
larger share of income for lower-income households than
for higher-income households. For example, Poterba
found that indexed transfer payments constituted two-
thirds of income for households in the lowest-spending
decile. He estimated households’ “unindexed exposure”
to changes in gasoline taxes—that is, the share of higher
gasoline spending that would not be offset by higher
transfer payments. Poterba found that unindexed gasoline
spending accounted for only 0.7 percent of total incomefor households in the lowest-spending decile and 2.8 per-
cent for the second decile. Unindexed gasoline spending
accounted for between 4.5 percent and 5.7 percent of total
income for households in the remaining deciles.7
The rise in indexed transfer payments would depend on
average gasoline consumption. Lower-income households
that received transfer payments but consumed more than
the average amount of gasoline would bear larger tax bur-
dens than Poterba estimated.
The Burden of a Cap-and-Trade Program. The distribu-
tional effects of a cap-and-trade program would have two
components: the effects of the increase in the price of
gasoline and the effects of the decision about how to allo-
cate emission allowances.
4. Studies that compare consumption with income find that con-
sumption can look too large relative to income for poorer house-
holds. For example, according to reported data, households in
the lowest f ifth of the income distribution consume more than
twice their annual income. See Congressional Budget Office,Who Gains and Who Pays Under Carbon-Allowance Trading?
p. 18.
5. See Congressional Budget Office, Federal Taxation of Tobacco,
Alcoholic Beverages, and Motor Fuels .
6. See James M. Poterba, Is the Gasoline Tax Regressive? Working
Paper No. 3578 (Cambridge, Mass.: National Bureau of Eco-
nomic Research, January 1990). 7. Ibid., pp. 19-20.
8/3/2019 CBO - Reducing Gasoline Consumption - Three Policy Options
http://slidepdf.com/reader/full/cbo-reducing-gasoline-consumption-three-policy-options 46/51
32 REDUCING GASOLINE CONSUMPTION: THREE POLICY OPTIONS
Like a gasoline tax, a cap-and-trade program would raise
the price of gasoline.8 That price rise would have the same
distributional effects as one resulting from a tax increase.
The second component would depend on policymakers’
decision about how to allocate the allowances, which could
have considerable value.9 If policymakers chose to distrib-
ute them for free (for example, to producers and importers
of gasoline), then the policy would create windfall profits
for the recipient firms, and their shareholders would bene-
fit. Stocks contribute a larger share of income for higher-
income households than for lower-income ones, so giving
the allowances away would tend to benefit higher-income
households. (It would be analogous to taxing gasoline
consumption and distributing the revenue to gasoline
producers and importers.)
If, by contrast, policymakers chose to sell emission allow-
ances through an auction, the government would capture
the value of the allowances. In that case, the distributional
effects of the cap-and-trade program would be equivalent
to those of a rise in the gasoline tax. The ultimate distribu-
tional impact would depend on what the government
chose to do with the auction revenue.
The Burden of CAFE Standards. None of the ways of
measuring the incidence of a gasoline tax that were dis-cussed above shed light on how its distributional effects
would compare with those of higher CAFE standards.
Moreover, no research on the distributional effects of an
increase in CAFE standards is currently available.
Raising CAFE standards would directly affect the prices
of new vehicles. That effect would tend to be progressive,
assuming that new-car purchases make up a larger share
of spending for higher-income households than for lower-
income households. However, a complete picture of the
distributional effects of higher CAFE standards would
require understanding their indirect effects. For example,
raising CAFE standards would be likely to increase the
demand for used cars, leading to higher used-car prices
as well.
Distributional Effects Among Regions
The effects of a gasoline-tax increase would vary among
households in different parts of the country. In general,
costs per household would be greater in rural areas than
in urban areas.
Researchers at Resources for the Future (RFF) examined
the regional impact of a 4.3-cent-per-gallon increase in
the federal gasoline tax that took effect in 1993.10 Al-
though the magnitude of RFF’s results was specific to that
tax increase, the pattern of the results suggests how the
effects of any rise in the federal gasoline tax would vary
among parts of the country. Rural households would tend
to see a greater increase in their tax payments than urban
households would because they tend to drive more miles.
RFF concluded that, on average, urban households would
pay $32 more (in 1990 dollars) in taxes each year because
of the 4.3-cent tax increase. Suburban households would
pay an average of $39 more, and rural households would
pay $45 more. On average, people in western and midwes-
tern states would tend to see greater increases in theirgasoline-tax payments than people in eastern states would
(see Figure 5 ).
The variation in tax burdens among regions was greater
when measured as a share of household income than when
measured in dollars (see Figure 6 ). The region that paid
the most in percentage terms (the west south central states)
had a tax burden that was 82 percent higher than the
region with the smallest tax burden (the mid-Atlantic
states). Measured in dollar terms, by contrast, the highest-
paying region (the mountain states) paid 64 percent morethan the lowest-paying region (the mid-Atlantic states).
That difference indicates that regions that would tend to8. The price increase would be the same regardless of whether the
government distributed carbon allowances for free or sold them
in an auction.
9. For a more detailed discussion about the distributional effects of
allocation decisions, see Congressional Budget Office, Who
Gains and Who Pays Under Carbon-Allowance Trading? and An
Evaluation of Cap-and-Trade Programs for Reducing U.S. Carbon
Emissions (June 2001).
10. See Alan J. Krupnick, Margaret A. Walls, and H. Carter Hood,
The Distributional and Environmental Implications of an Increase
in the Federal Gasoline Tax , Discussion Paper ENR 93-24
(Washington, D.C.: Resources for the Future, September
1993).
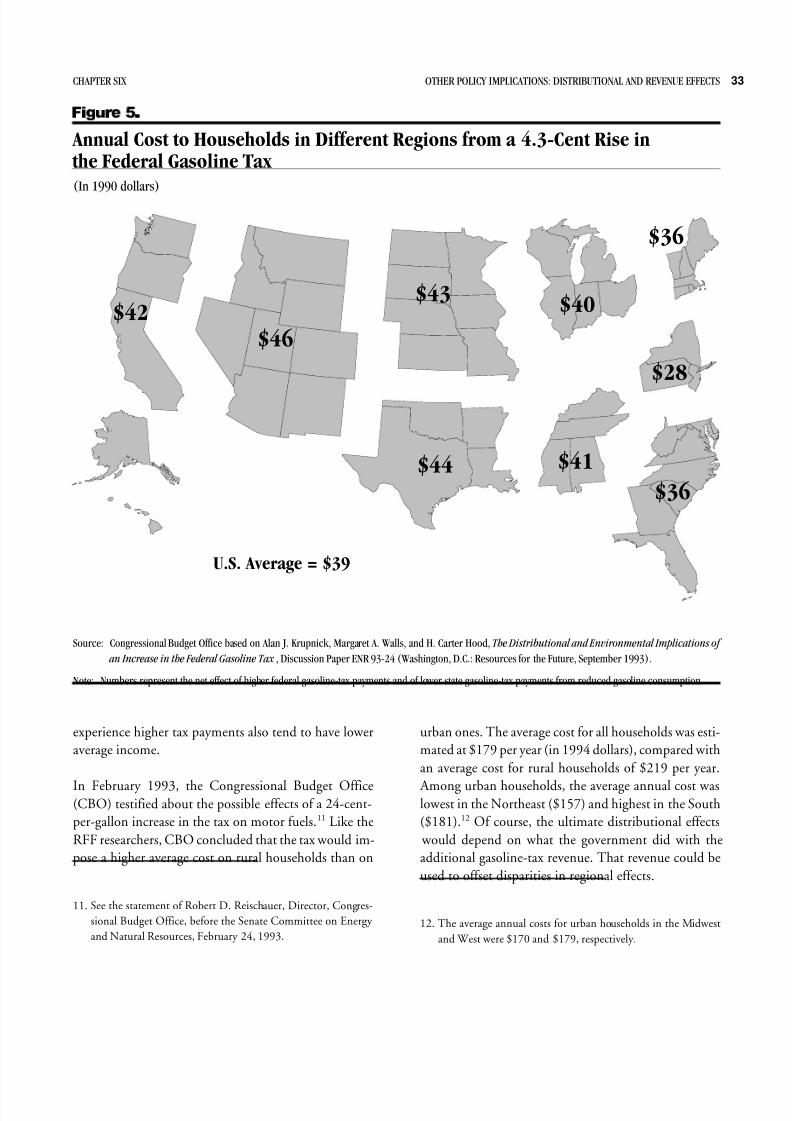
8/3/2019 CBO - Reducing Gasoline Consumption - Three Policy Options
http://slidepdf.com/reader/full/cbo-reducing-gasoline-consumption-three-policy-options 47/51
CHAPTER SIX OTHER POLICY IMPLICATIONS: DISTRIBUTIONAL AND REVENUE EFFECTS 33
$46$42
$43
$44
$40
$41
$36
$28
$36
U.S. Average = $39
) L J X U H
Annual Cost to Households in Different Regions from a 4.3-Cent Rise in the Federal Gasoline Tax (In 1990 dollars)
Source: Congressional Budget Office based on Alan J. Krupnick, Margaret A. Walls, and H. Carter Hood, The Distributional and Environmental Implications of
an Increase in the Federal Gasoline Tax , Discussion Paper ENR 93-24 (Washington, D.C.: Resources for the Future, September 1993).
Note: Numbers represent the net effect of higher federal gasoline-tax payments and of lower state gasoline-tax payments from reduced gasoline consumption.
experience higher tax payments also tend to have lower
average income.
In February 1993, the Congressional Budget Office(CBO) testified about the possible effects of a 24-cent-
per-gallon increase in the tax on motor fuels.11 Like the
RFF researchers, CBO concluded that the tax would im-
pose a higher average cost on rural households than on
urban ones. The average cost for all households was esti-
mated at $179 per year (in 1994 dollars), compared with
an average cost for rural households of $219 per year.
Among urban households, the average annual cost waslowest in the Northeast ($157) and highest in the South
($181).12 Of course, the ultimate distributional effects
would depend on what the government did with the
additional gasoline-tax revenue. That revenue could be
used to offset disparities in regional effects.
11. See the statement of Robert D. Reischauer, Director, Congres-
sional Budget Office, before the Senate Committee on Energy
and Natural Resources, February 24, 1993.12. The average annual costs for urban households in the Midwest
and West were $170 and $179, respectively.
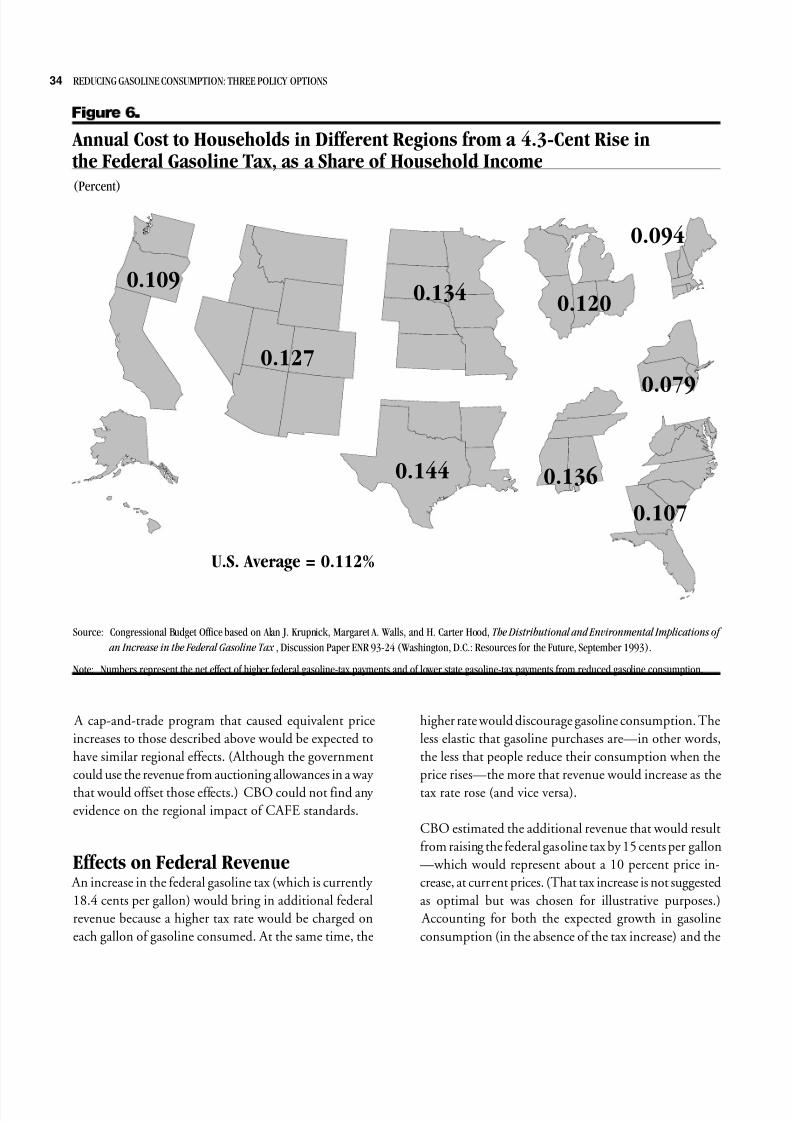
8/3/2019 CBO - Reducing Gasoline Consumption - Three Policy Options
http://slidepdf.com/reader/full/cbo-reducing-gasoline-consumption-three-policy-options 48/51
34 REDUCING GASOLINE CONSUMPTION: THREE POLICY OPTIONS
0.127
0.1090.134
0.144
0.120
0.136
0.094
0.079
0.107
U.S. Average = 0.112%
) L J X U H
Annual Cost to Households in Different Regions from a 4.3-Cent Rise in the Federal Gasoline Tax, as a Share of Household Income(Percent)
Source: Congressional Budget Office based on Alan J. Krupnick, Margaret A. Walls, and H. Carter Hood, The Distributional and Environmental Implications of
an Increase in the Federal Gasoline Tax , Discussion Paper ENR 93-24 (Washington, D.C.: Resources for the Future, September 1993).
Note: Numbers represent the net effect of higher federal gasoline-tax payments and of lower state gasoline-tax payments from reduced gasoline consumption.
A cap-and-trade program that caused equivalent price
increases to those described above would be expected to
have similar regional effects. (Although the government
could use the revenue from auctioning allowances in a way
that would offset those effects.) CBO could not find any
evidence on the regional impact of CAFE standards.
Effects on Federal Revenue An increase in the federal gasoline tax (which is currently
18.4 cents per gallon) would bring in additional federal
revenue because a higher tax rate would be charged on
each gallon of gasoline consumed. At the same time, the
higher rate would discourage gasoline consumption. The
less elastic that gasoline purchases are—in other words,
the less that people reduce their consumption when the
price rises—the more that revenue would increase as the
tax rate rose (and vice versa).
CBO estimated the additional revenue that would result
from raising the federal gasoline tax by 15 cents per gallon
—which would represent about a 10 percent price in-
crease, at current prices. (That tax increase is not suggested
as optimal but was chosen for illustrative purposes.)
Accounting for both the expected growth in gasoline
consumption (in the absence of the tax increase) and the
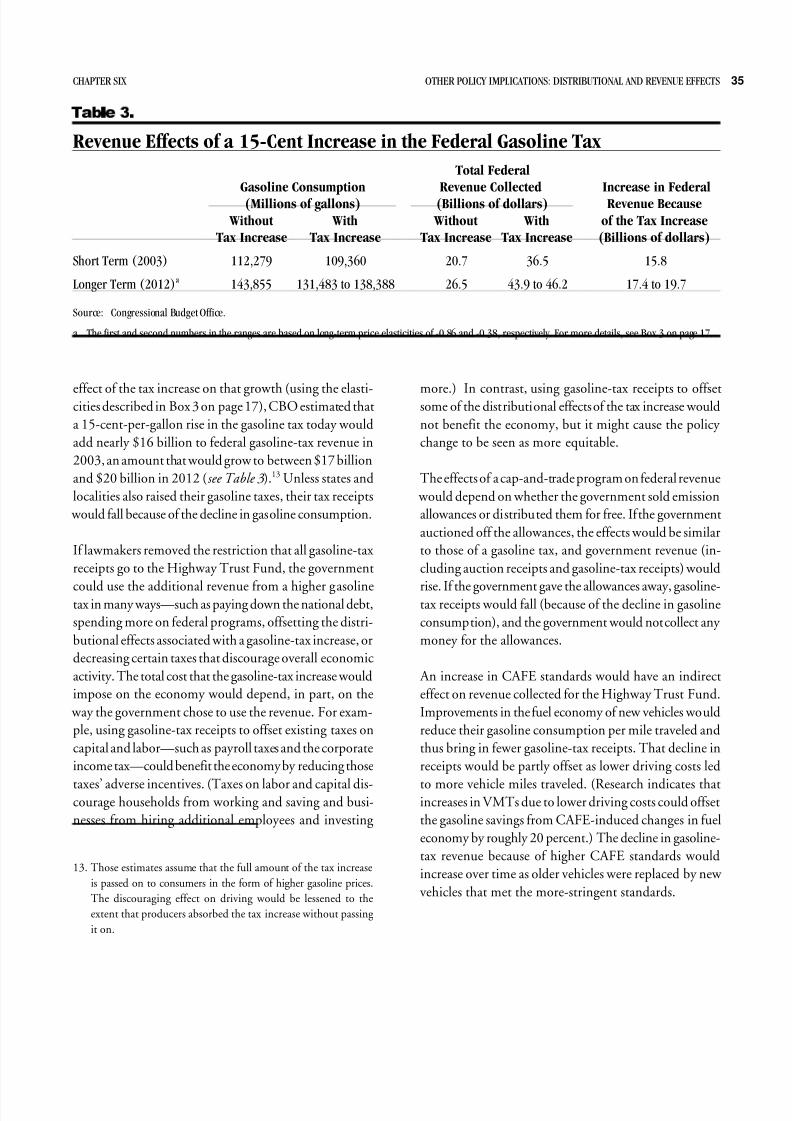
8/3/2019 CBO - Reducing Gasoline Consumption - Three Policy Options
http://slidepdf.com/reader/full/cbo-reducing-gasoline-consumption-three-policy-options 49/51
8/3/2019 CBO - Reducing Gasoline Consumption - Three Policy Options
http://slidepdf.com/reader/full/cbo-reducing-gasoline-consumption-three-policy-options 50/51
36 REDUCING GASOLINE CONSUMPTION: THREE POLICY OPTIONS
Raising the gasoline tax, tightening CAFE standards, or
enacting a cap-and-trade program would also affect federal
revenue in other, less direct ways. By imposing costs on
producers and consumers, all of those policies would tend
to discourage economic activity. That decrease in eco-
nomic activity would lead to lower tax receipts in multiple
ways—for example, collections of corporate income taxes
would decline if the profits of automakers or gasoline
companies fell.
The size of those indirect effects on tax collections would
vary with the economic cost of the policy adopted. That
cost in turn would depend on the targeted reduction in
gasoline consumption (bigger reductions would be more
costly than smaller ones) and the comprehensiveness of
the policy. As discussed in Chapter 2, policies that en-
courage all gasoline-saving activities will produce a given
gasoline reduction at a lower cost than policies that focus
on a limited number of activities.
Further, for a gasoline tax or a cap-and-trade program,
the total cost imposed on the economy would depend on
how lawmakers opted to use the revenue from the gasoline
tax or from an allowance auction. For example, using those
receipts to encourage economic activity (perhaps by re-
ducing taxes on capital or labor) would lead to lower total
costs than using those receipts to offset the distributional
effects of the policy.

8/3/2019 CBO - Reducing Gasoline Consumption - Three Policy Options
http://slidepdf.com/reader/full/cbo-reducing-gasoline-consumption-three-policy-options 51/51