Embed Size (px)
Citation preview

CB Richard Ellis | Page 1
2010 Real Estate Forecast - Capitalization Rate Trends
Michael J. Moynagh, MAI, Managing Director
CBRE Valuation and Advisory Services
CFA Society of Minnesota
American Society of Appraisers - Twin Cities Chapter
July 22, 2010

CB Richard Ellis | Page 2
Outline
2010 Real Estate Forecast Minneapolis Office St. Paul Office Suburban Office Industrial Retail Land Hospitality National Capitalization Rate Trends

2010 ForecastMinneapolis / Office

CB Richard Ellis | Page 4
Office / CBD Absorption HistoricalMinneapolis
2000 2001 2002 2003 2004 2005 2006 2007 2008 2009 2010 YTD
(1,500,000)
(1,000,000)
(500,000)
0
500,000
1,000,000
1,500,000
533,885
679,713
(1,168,342)
(51,774)
(719,415)
698,701
249,392
(33,701)
245,163
(218,001)
29,951
CB Richard Ellis | Page 5
Office / CBD Vacancy by ClassMinneapolis
2000 2001 2002 2003 2004 2005 2006 2007 2008 2009 2010
Class A 0.0694000000000001
0.0864 0.1259 0.1243 0.1681 0.1449 0.1304 0.1365 0.1153 0.1612 0.158
Class B 0.0529 0.0869 0.2899 0.2956 0.325400000000001
0.2451 0.2128 0.1604 0.143 0.2152 0.2162
Class C 0.0543000000000001
0.0845000000000002
0.1326 0.1602 0.1918 0.1824 0.1882 0.143 0.1441 0.1944 0.1993
5.00%
15.00%
25.00%
35.00%
45.00%
55.00%
65.00%
75.00%

CB Richard Ellis | Page 6
Office / CBD Gross Rates HistoricalMinneapolis
2000 2001 2002 2003 2004 2005 2006 2007 2008 2009 2010
Class A 28.05 26.35 23.17 21.54 21.48 21.24 21.83 23.24 24.54 25.31 24.73
Class B 20.93 21.14 19.25 17.73 17.08 16.86 17.9899999999999
18.94 19.7 20.4 20.41
Class C 18.69 18.94 17.66 16.68 16.75 16.16 16.52 18.15 18.69 17.89 17.88
$7.50
$12.50
$17.50
$22.50
$27.50

2010 ForecastSt. Paul / Office

CB Richard Ellis | Page 8
Office / CBD Absorption HistoricalSt. Paul
2000 2001 2002 2003 2004 2005 2006 2007 2008 2009 2010 YTD
(500,000)
(400,000)
(300,000)
(200,000)
(100,000)
0
100,000
200,000
300,000
400,000
162,102
(463,441)
(124,426)
(449,165)
(101,859)
98,045
(109,308)
57,422
(100,602)
(37,344)
(4,467)
CB Richard Ellis | Page 9
Office / CBD Vacancy by ClassSt. Paul
2000 2001 2002 2003 2004 2005 2006 2007 2008 2009 2010
Class A 0.1428 0.1205 0.1427 0.1098 0.1204 0.1118 0.1255 0.1122 0.0937000000000002
0.146 0.1523
Class B 0.0631 0.159700000000001
0.1669 0.249400000000001
0.2563 0.2426 0.2683 0.2624 0.3217 0.248 0.2471
Class C 0.046 0.1471 0.2732 0.1846 0.2654 0.1964 0.186400000000001
0.1501 0.0387 0.0564 0.0561
2.50%
7.50%
12.50%
17.50%
22.50%
27.50%
32.50%

CB Richard Ellis | Page 10
Office / CBD Gross Rates HistoricalSt. Paul
2000 2001 2002 2003 2004 2005 2006 2007 2008 2009 2010
Class A 23.23 23.99 20.7 20.47 19.61 18.42 20.54 21.01 22.65 22.68 23.14
Class B 18.29 20.05 18.36 18.33 16.77 16.57 15.54 18.94 19.18 17.65 17.56
Class C 14.42 16.88 13.04 13.69 13.22 14.91 14.45 18.15 10.66 13.76 14.38
$2.50
$7.50
$12.50
$17.50
$22.50
$27.50

2010 ForecastSuburban Office
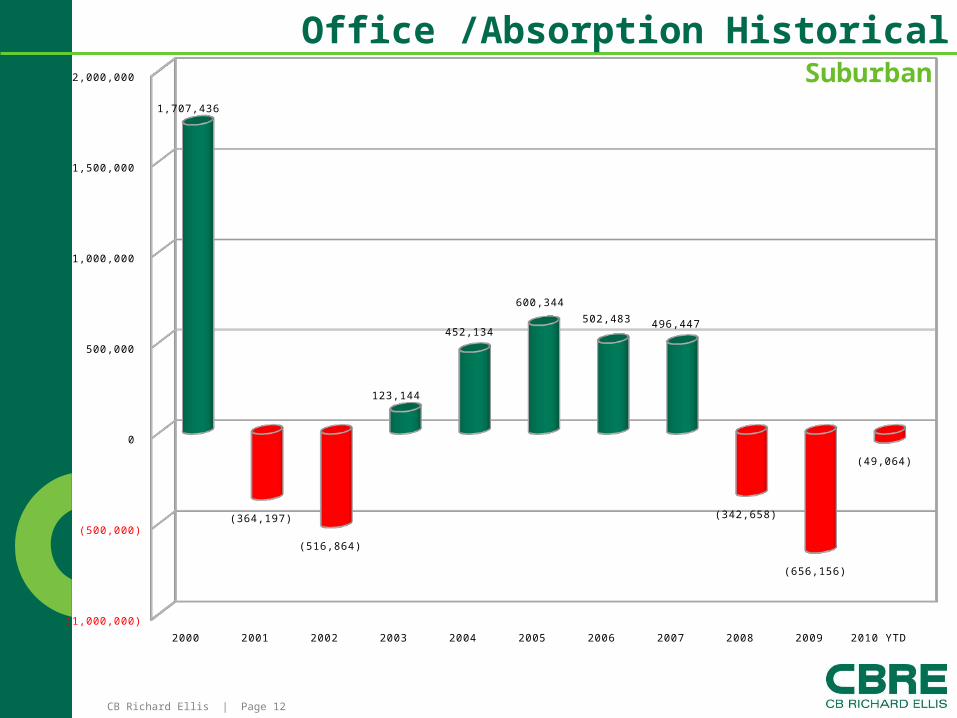
CB Richard Ellis | Page 12
2000 2001 2002 2003 2004 2005 2006 2007 2008 2009 2010 YTD
(1,000,000)
(500,000)
0
500,000
1,000,000
1,500,000
2,000,000
1,707,436
(364,197)
(516,864)
123,144
452,134
600,344
502,483 496,447
(342,658)
(656,156)
(49,064)
Office /Absorption HistoricalSuburban
CB Richard Ellis | Page 13
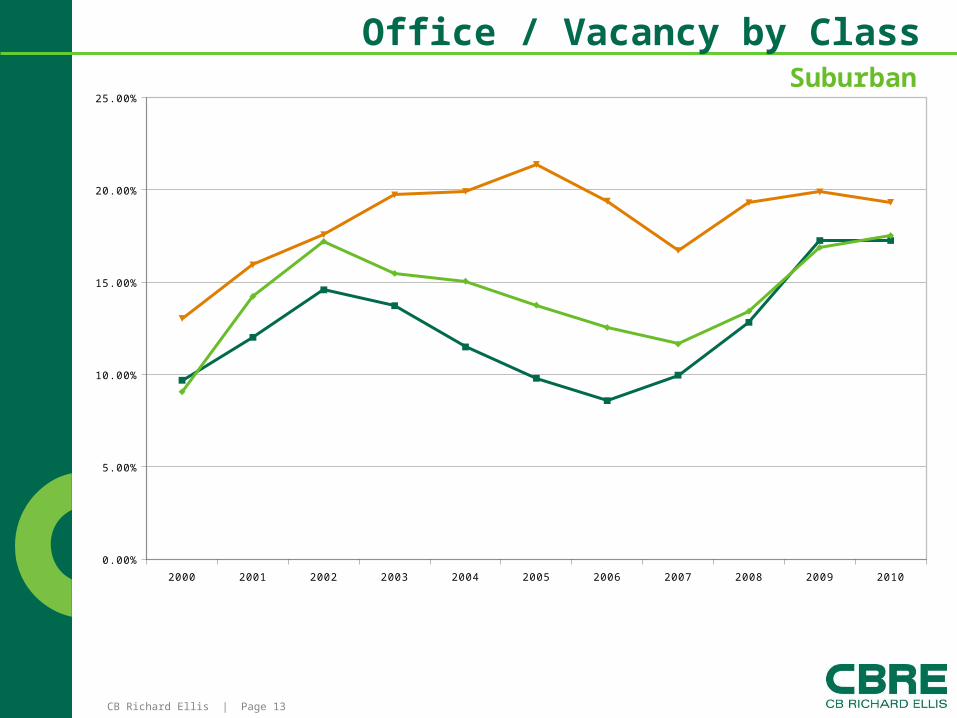
Office / Vacancy by ClassSuburban
2000 2001 2002 2003 2004 2005 2006 2007 2008 2009 2010
Class A 0.0969 0.1202 0.145900000000001
0.1373 0.115 0.0980000000000002
0.0859 0.0997000000000001
0.1283 0.1726 0.1726
Class B 0.0907 0.1424 0.1721 0.1548 0.1506 0.1376 0.1255 0.1166 0.1343 0.1689 0.1753
Class C 0.1304 0.159400000000001
0.1758 0.1973 0.1992 0.2138 0.1939 0.1672 0.1931 0.1989 0.1933
2.50%
7.50%
12.50%
17.50%
22.50%

CB Richard Ellis | Page 14
Suburban
Office / Gross Rates Historical
2000 2001 2002 2003 2004 2005 2006 2007 2008 2009 2010
Class A 25.08 25.95 25.47 25.4 24.86 24.92 25.11 26.08 26.52 26.7 25.99
Class B 21.13 20.36 20.49 20.77 20.39 20.46 19.96 21.03 21.1 21.8 21.64
Class C 17.07 16.55 17.53 15.9 16.12 15.68 16.15 16.07 16.88 17.47 17.34
$7.50
$12.50
$17.50
$22.50
$27.50
CB Richard Ellis | Page 15
Bottom may have been reached in office market.
Look for modest gains in 2010 in vacancy and rates.
Construction activity will remain flat for some time.
Office Market Conclusion

2010 ForecastIndustrial

CB Richard Ellis | Page 17
Industrial / Absorption Historical Twin Cities’ Metro Area
2002 2003 2004 2005 2006 2007 2008 2009 1Q 2010(3,000,000)
(2,000,000)
(1,000,000)
0
1,000,000
2,000,000
3,000,000
4,000,000
5,000,000
6,000,000
7,000,000
8,000,000
9,000,000
747,391
1,399,716
2,385,448
7,350,507
2,260,930
717,982 511,003
(2,554,495)
(134,699)

CB Richard Ellis | Page 18
Industrial / Direct Vacancy RateTwin Cities Metro Area
2002 2003 2004 2005 2006 2007 2008 2009 1Q 2010
Vacancy 6.4% 7.0% 7.0% 5.6% 5.7% 5.9% 5.9% 7.3% 7.4%
5.3%
5.8%
6.3%
6.8%
7.3%
7.8%
6.4%
7.0% 7.0%
5.6%
5.7%
5.9%
5.9%
7.3%7.4%
CB Richard Ellis | Page 19
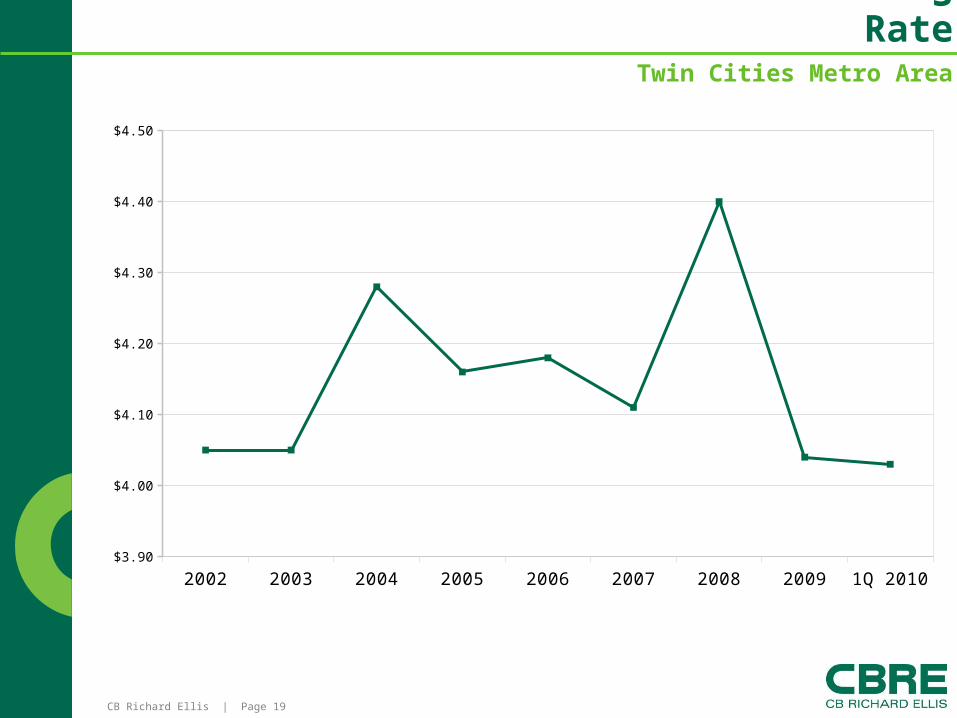
Industrial / Net Warehouse Asking Rate
Twin Cities Metro Area
2002 2003 2004 2005 2006 2007 2008 2009 1Q 2010
Asking Rate 4.05 4.05 4.28 4.16 4.18 4.11 4.4 4.04 4.03
$3.95
$4.05
$4.15
$4.25
$4.35
$4.45
CB Richard Ellis | Page 20
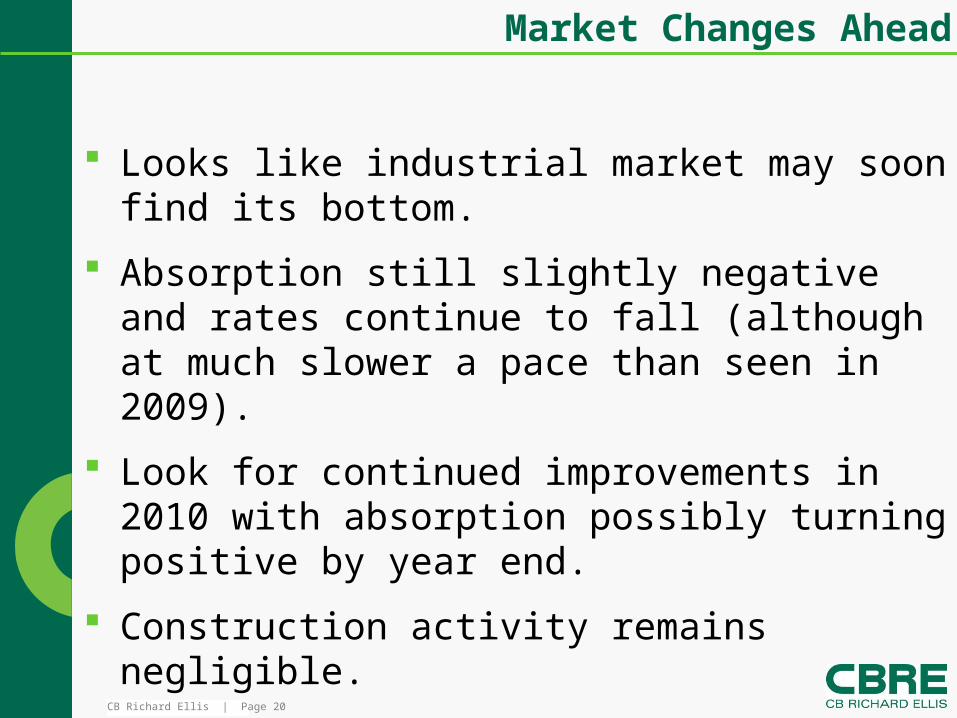
Looks like industrial market may soon find its bottom.
Absorption still slightly negative and rates continue to fall (although at much slower a pace than seen in 2009).
Look for continued improvements in 2010 with absorption possibly turning positive by year end.
Construction activity remains negligible.
Market Changes Ahead

2009 ForecastRetail

CB Richard Ellis | Page 22
Retail AbsorptionTwin Cities Metro Area
2004 2005 2006 2007 2008 2009 1Q 2010(500,000.00)
0.00
500,000.00
1,000,000.00
1,500,000.00
(108,000)
1,443,000 1,392,000
891,000
174,000
(461,000)
(35,000)
CB Richard Ellis | Page 23
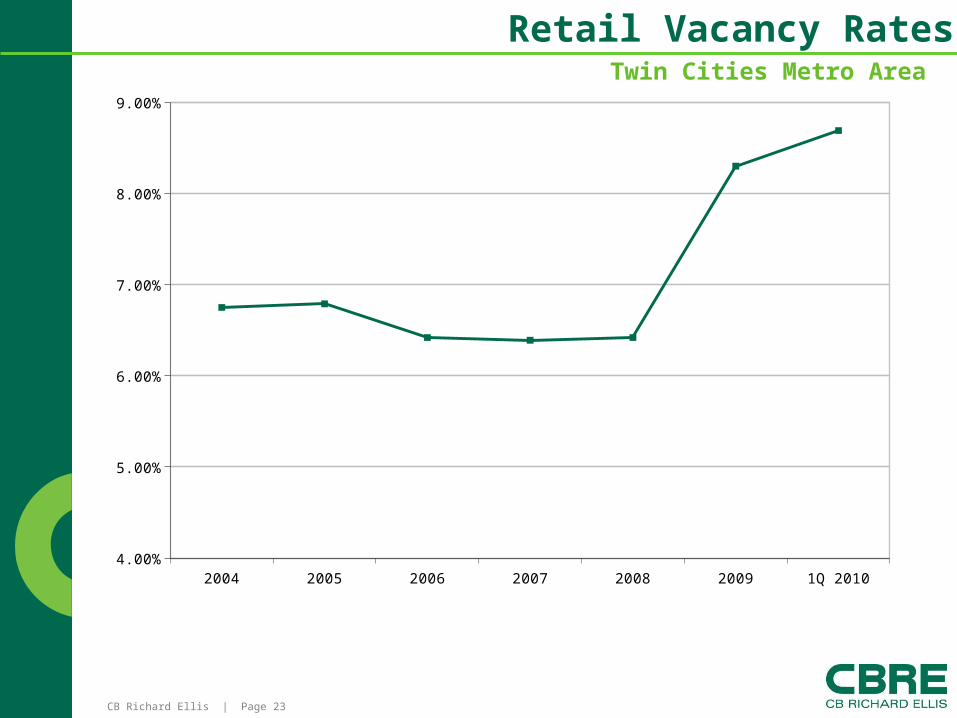
Retail Vacancy RatesTwin Cities Metro Area
2004 2005 2006 2007 2008 2009 1Q 2010
Vacancy 0.0675 0.0679 0.0642 0.0639 0.0642 0.0830000000000001
0.0869
4.50%
5.50%
6.50%
7.50%
8.50%
CB Richard Ellis | Page 24
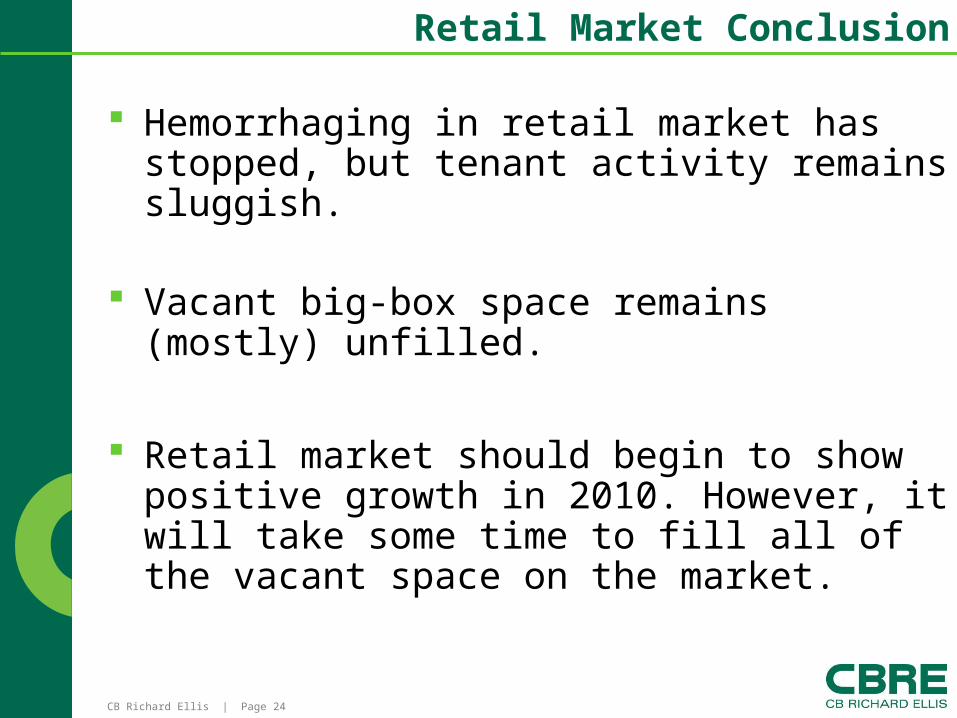
Hemorrhaging in retail market has stopped, but tenant activity remains sluggish.
Vacant big-box space remains (mostly) unfilled.
Retail market should begin to show positive growth in 2010. However, it will take some time to fill all of the vacant space on the market.
Retail Market Conclusion

2010 ForecastLand

CB Richard Ellis | Page 26
Land Land prices have fallen
Several Major Residential Developers have walked away from transactions There is an over supply of finished lots

2009 ForecastHospitality
CB Richard Ellis | Page 28
2002 2003 2004 2005 2006 2007 2008 2009 2010P-9
-7
-5
-3
-1
1
3
5
-1.2
0.3
3.62.9
1.9
0.5
-6
-2.4
2.5
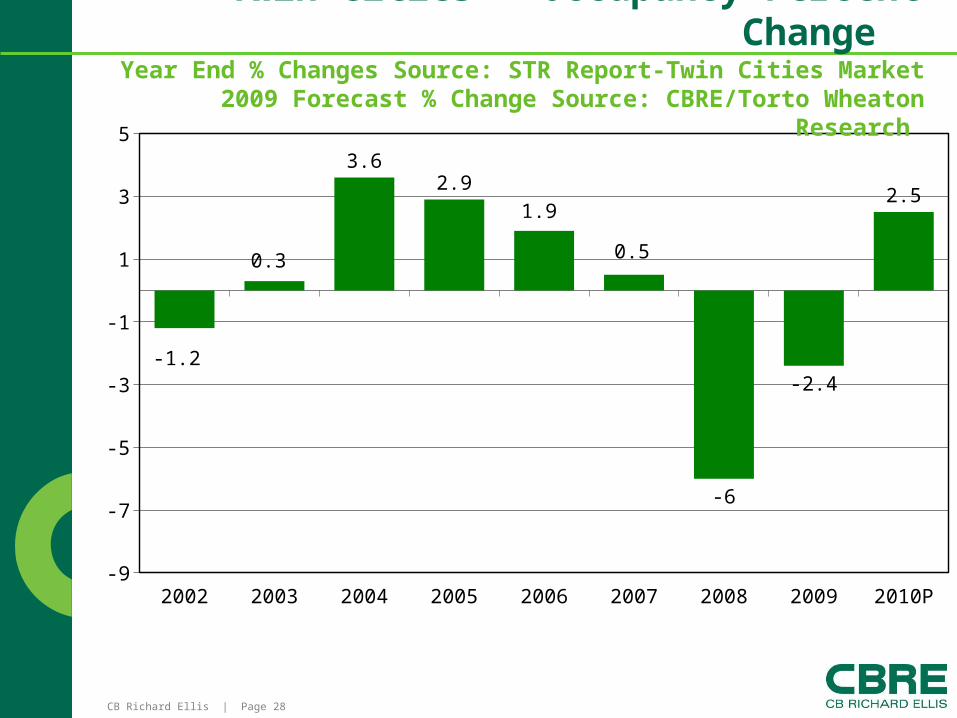
Twin Cities - Occupancy Percent Change
Year End % Changes Source: STR Report-Twin Cities Market2009 Forecast % Change Source: CBRE/Torto Wheaton
Research
CB Richard Ellis | Page 29
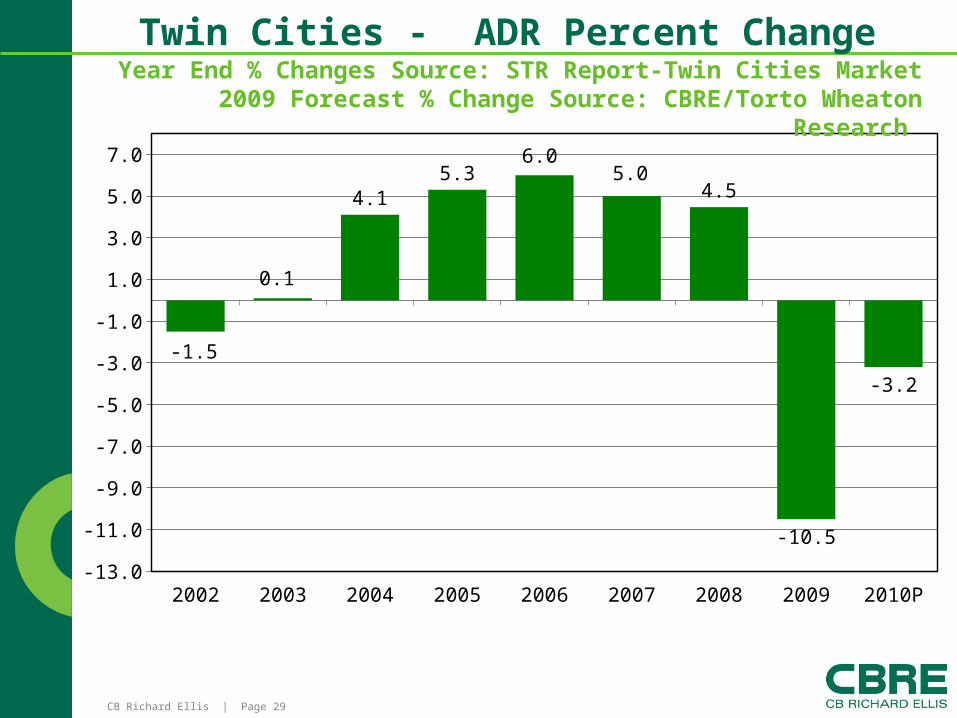
2002 2003 2004 2005 2006 2007 2008 2009 2010P-13.0
-11.0
-9.0
-7.0
-5.0
-3.0
-1.0
1.0
3.0
5.0
7.0
-1.5
0.1
4.15.3
6.05.0
4.5
-10.5
-3.2
Twin Cities - ADR Percent Change Year End % Changes Source: STR Report-Twin Cities Market
2009 Forecast % Change Source: CBRE/Torto Wheaton Research

CB Richard Ellis | Page 30
2002
2003
2004
2005
2006
2007
2008
2009
2010
P-20.0
-15.0
-10.0
-5.0
0.0
5.0
10.0
-2.7
0.4
7.8 8.4 8.05.6
-1.9
-19.0
1.0
Twin Cities - RevPAR Percent Change Year End % Changes Source: STR Report-Twin Cities Market
2009 Forecast % Change Source: CBRE/Torto Wheaton Research

CB Richard Ellis | Page 31
Twin Cities - Lodging Forecast
New supply (hotels u/c) diminishing.
Questionable when/if planned supply will come to fruition.
Indicators appear to be signaling a turn around in the hotel market.
Expected continued improvements in 2010 and 2011.
CB Richard Ellis | Page 32
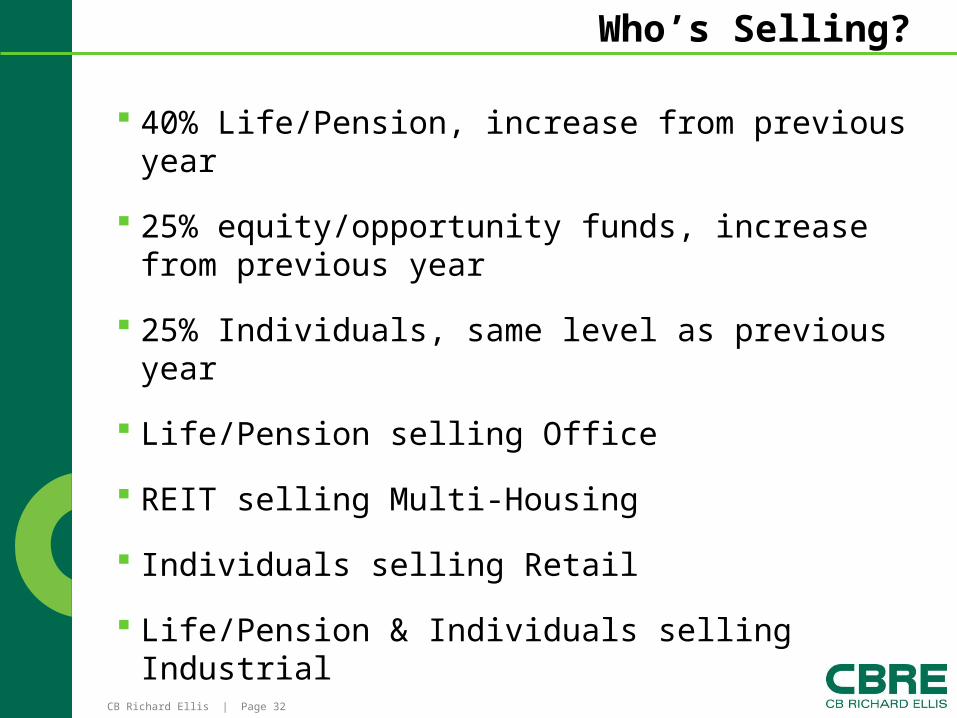
Who’s Selling?
40% Life/Pension, increase from previous year
25% equity/opportunity funds, increase from previous year
25% Individuals, same level as previous year
Life/Pension selling Office
REIT selling Multi-Housing
Individuals selling Retail
Life/Pension & Individuals selling Industrial

CB Richard Ellis | Page 33
Who’s Bidding? All buyer types similar to last year
Equity/Opportunity Funds buying Office
Individuals buying Multi-Housing
Individuals buying Retail
Equity/Opportunity Funds buying Investment
CB Richard Ellis | Page 34
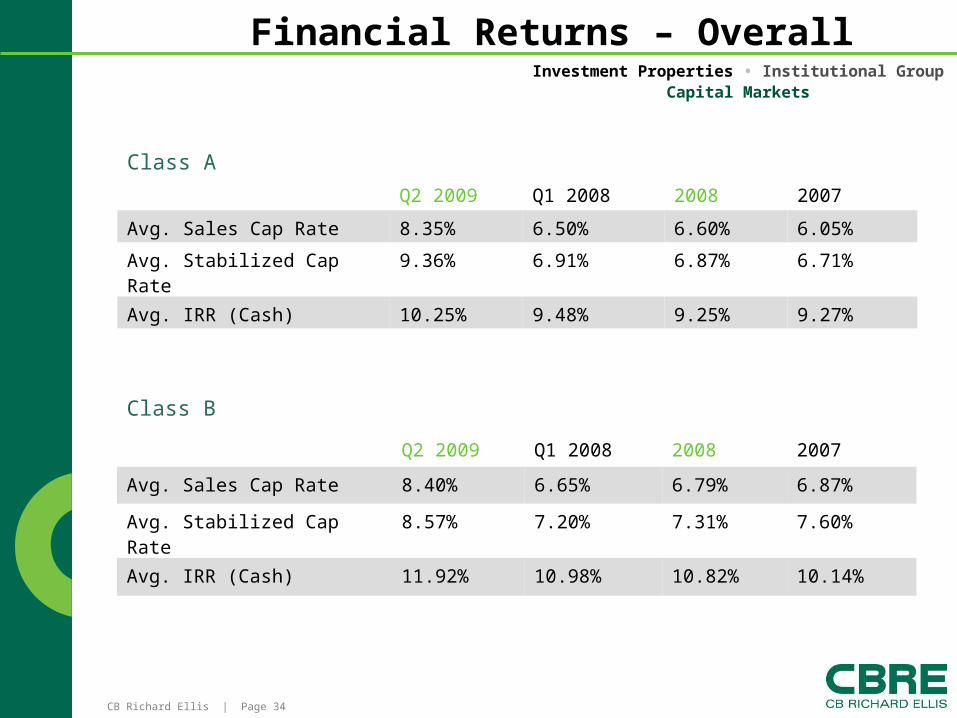
Investment Properties • Institutional GroupCapital Markets
Financial Returns – Overall
Class A
Q2 2009 Q1 2008 2008 2007
Avg. Sales Cap Rate 8.35% 6.50% 6.60% 6.05%
Avg. Stabilized Cap Rate 9.36% 6.91% 6.87% 6.71%
Avg. IRR (Cash) 10.25% 9.48% 9.25% 9.27%
Class B
Q2 2009 Q1 2008 2008 2007
Avg. Sales Cap Rate 8.40% 6.65% 6.79% 6.87%
Avg. Stabilized Cap Rate 8.57% 7.20% 7.31% 7.60%
Avg. IRR (Cash) 11.92% 10.98% 10.82% 10.14%
CB Richard Ellis | Page 35
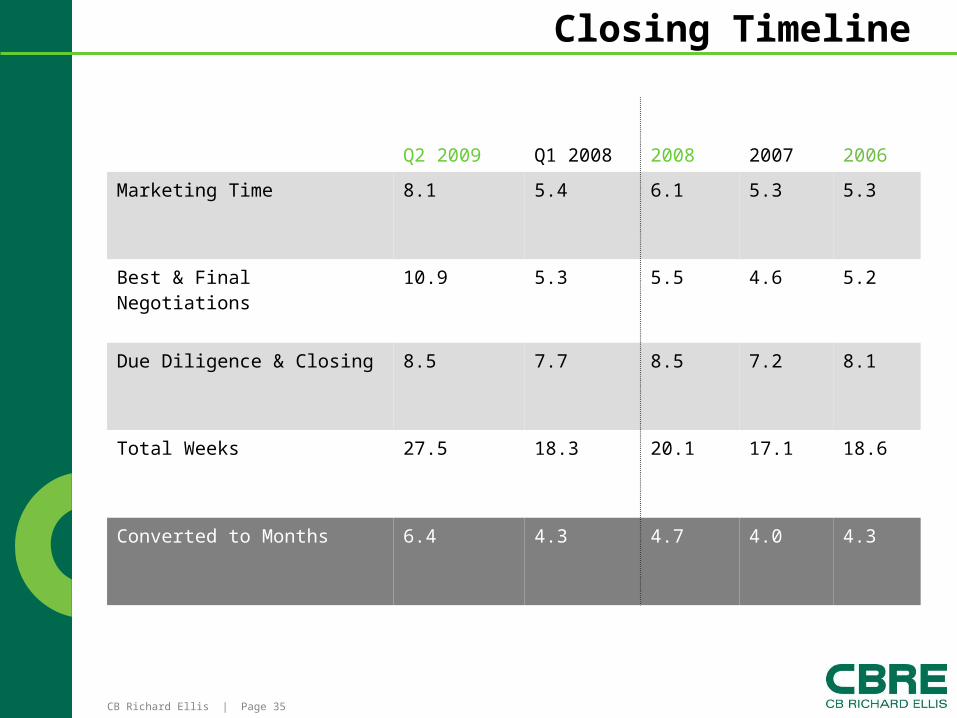
Closing Timeline
Q2 2009 Q1 2008 2008 2007 2006
Marketing Time 8.1 5.4 6.1 5.3 5.3
Best & Final Negotiations 10.9 5.3 5.5 4.6 5.2
Due Diligence & Closing 8.5 7.7 8.5 7.2 8.1
Total Weeks 27.5 18.3 20.1 17.1 18.6
Converted to Months 6.4 4.3 4.7 4.0 4.3

CB Richard Ellis | Page 36
War StoriesLand Subdivisions-Out state MN52 subdivisions, small communities, no appraisals, loans based on napkin valuation by lender, 300 lot development in community of 250 people?Large Retail CenterSold for $100M in 06, will close next week at $35M with original developer buying, Anchor Co-tenancy, % Co-tenancy, Sales kick out clause (reduce rent or leave)

CB Richard Ellis | Page 37
War Stories Suburban Office Bldg, sold in 2006 for $25M, now at $15M, 40% loss! Suburban new construction condos completed 18 months ago, not one condo sold! Twin Cities redevelopment hotel, projected $189 ADR and 70% occupancy, actual ADR of $120 and 50% occupancy! Suburban office complex with $18.5M mortgage from 2006 is currently at a value of $9-$10M! Borrower is attempting to rework loan! Good luck!
CB Richard Ellis | Page 38
National Capitalization Rate Trends
CB Richard Ellis | Page 39
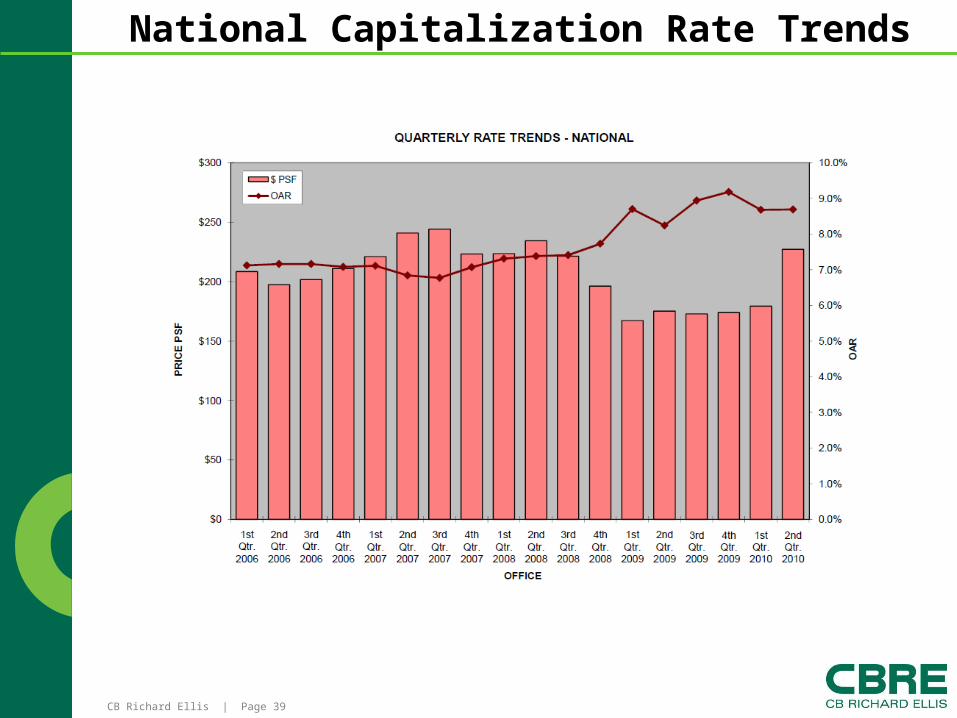
National Capitalization Rate Trends
CB Richard Ellis | Page 40
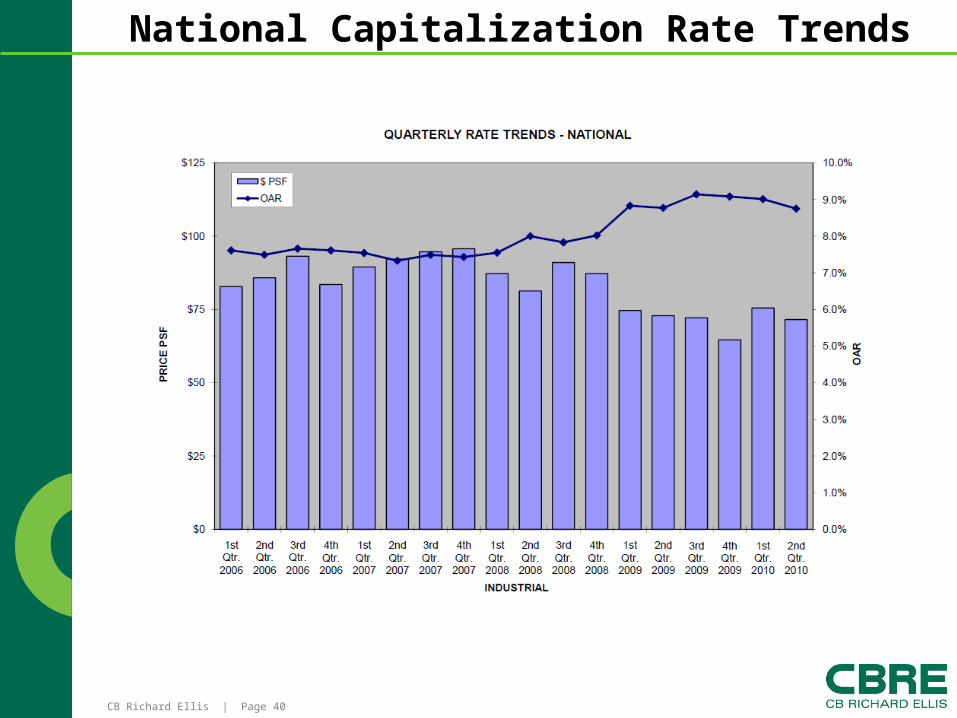
National Capitalization Rate Trends
CB Richard Ellis | Page 41
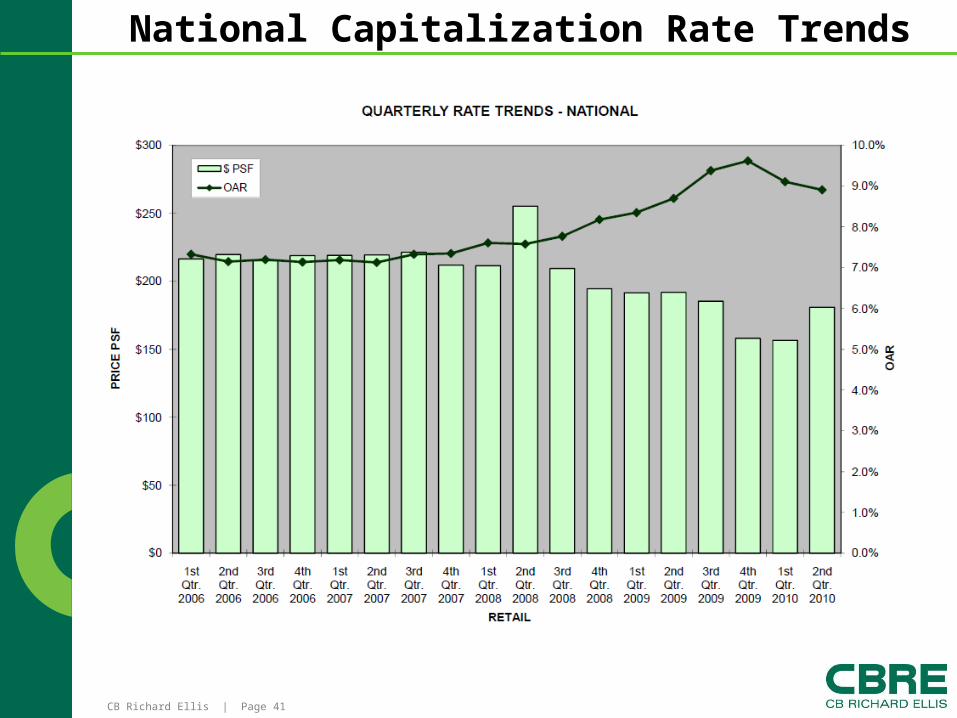
National Capitalization Rate Trends

CB Richard Ellis | Page 42
National Capitalization Rate Trends

CB Richard Ellis | Page 43
Questions & Answers
?
Conclusion

Thank you for this opportunity to share our
information with you.
Michael J. Moynagh, MAIManaging Director
CB Richard Ellis81 South 9th Street, Suite 410
Minneapolis, MN [email protected] / www.cbre.com/mike.moynagh
Contact Information: