Embed Size (px)
Citation preview

30
Cavitation occurs whenever the pressure in the flow of water drops
to the value of the pressure of the saturated water vapour, pv (at
the prevailing temperature); cavities filled by vapour, and partly by gases
excluded from the water as a result of the low pressure, are formed.
When these ‘bubbles’ are carried by the flow into regions of higher
pressure, the vapour quickly condenses and the bubbles implode, the
cavities being filled suddenly by the surrounding water. Not only is this
process noisy, with disruption in the flow pattern, but – more importantly
– if the cavity implodes against a surface, the violent impact of the water
particles acting in quick succession at very high pressures (of the order of
1000 atm), if sustained over a period of time, causes substantial damage
to the (concrete or steel) surface, which can lead to a complete failure of
the structure. Thus cavitation corrosion (pitting) and the often
accompanying vibration is a phenomenon that has to be taken into
account in the design of hydraulic structures, and pre- vented whenever
possible

31
Low pressures – well below atmospheric pressure – will occur at points of separation of water flowing alongside fixed boundaries, particularly if the flow velocity is high. Thus there are two factors, pressure p and velocity u, which influence the onset of cavitation. They are combined with density ! in the cavitation number, ":
! =p! pv"u2
Cavitation occurs if the cavitation number falls below a critical value "c which is a function of the geometry and can vary widely. As an example, the incipient cavitation number for sloping offsets and triangular protrusions, as determined from data by Wang and Chou
Incipient cavitation number for sloped protrusions

32
According to Ball and Johnson (Cassidy and Elder, 1984), a 3mm
perpendicular offset into the flow can cause cavitation at velocities
as low as 11m/s; for an equally high recess from the flow the
critical velocity is about 32 m/s.
A value of "c of around 0.2 is sometimes considered (Falvey, 1990)
when assessing the critical velocity on ‘smooth’ concrete surfaces

33
The basic shape of the overfall (ogee) spillway is derived from the lower envelope of the overall nappe flowing over a high vertical rectangular notch with an approach velocity V0 = 0 and a fully aerated space beneath the nappe (p = p0),
Overfall spillway

34
For a notch of width b, head h, and coefficient of discharge C’d, the discharge equation is
which, for V0=0, reduces to
C’d is about 0.62
35
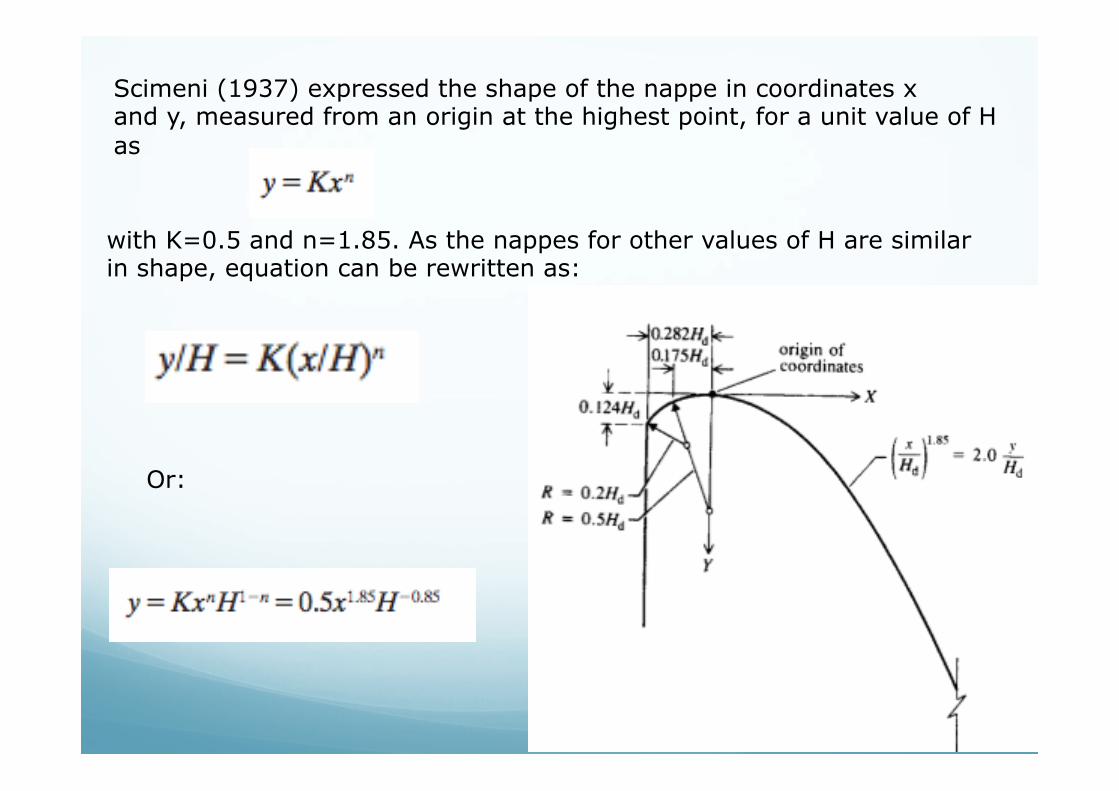
Scimeni (1937) expressed the shape of the nappe in coordinates x and y, measured from an origin at the highest point, for a unit value of H as
with K=0.5 and n=1.85. As the nappes for other values of H are similar in shape, equation can be rewritten as:
Or:

36
for K=0.5 (curve a, in slide 27) the pressures acting on the surface defined by equation are atmospheric (p0) for K>0.5 (curve b) the pressures acting on the spillway will be negative (p<p0) for K<0.5 (curve c) the pressures acting on the spillway will be positive (p > p0).
For an overflow spillway we can thus rewrite the discharge equation as
37
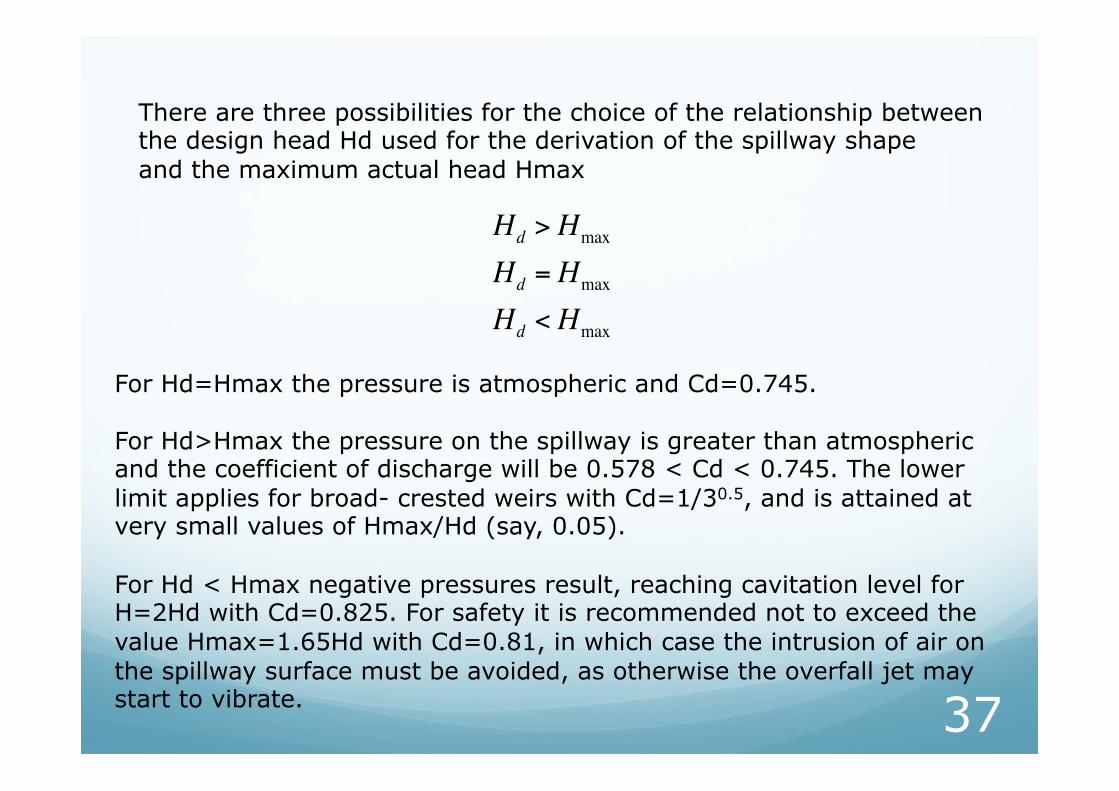
There are three possibilities for the choice of the relationship between the design head Hd used for the derivation of the spillway shape and the maximum actual head Hmax
For Hd=Hmax the pressure is atmospheric and Cd=0.745. For Hd>Hmax the pressure on the spillway is greater than atmospheric and the coefficient of discharge will be 0.578 < Cd < 0.745. The lower limit applies for broad- crested weirs with Cd=1/30.5, and is attained at very small values of Hmax/Hd (say, 0.05). For Hd < Hmax negative pressures result, reaching cavitation level for H=2Hd with Cd=0.825. For safety it is recommended not to exceed the value Hmax=1.65Hd with Cd=0.81, in which case the intrusion of air on the spillway surface must be avoided, as otherwise the overfall jet may start to vibrate.
Hd > Hmax
Hd = Hmax
Hd < Hmax

38
For gated spillways, the placing of the gate sills by 0.2H downstream from the crest substantially reduces the tendency towards negative pressures for outflow under partially raised gates. The discharge through partially raised gates may be computed from:
with Cd1=0.6 or, better, from:
where a is the distance of the gate lip from the spillway surface, and He the effective head on the gated spillway ( H) (0.55 <Cd2 < 0.7)

39
in the equations b refers to the spillway length. In the case of piers on the crest (e.g. gated spillways) this length has to be reduced to be =b!2(N "p +"a) # where n is the number of contractions and Kp and Ka are the pier and abutment contraction coefficients

40
41
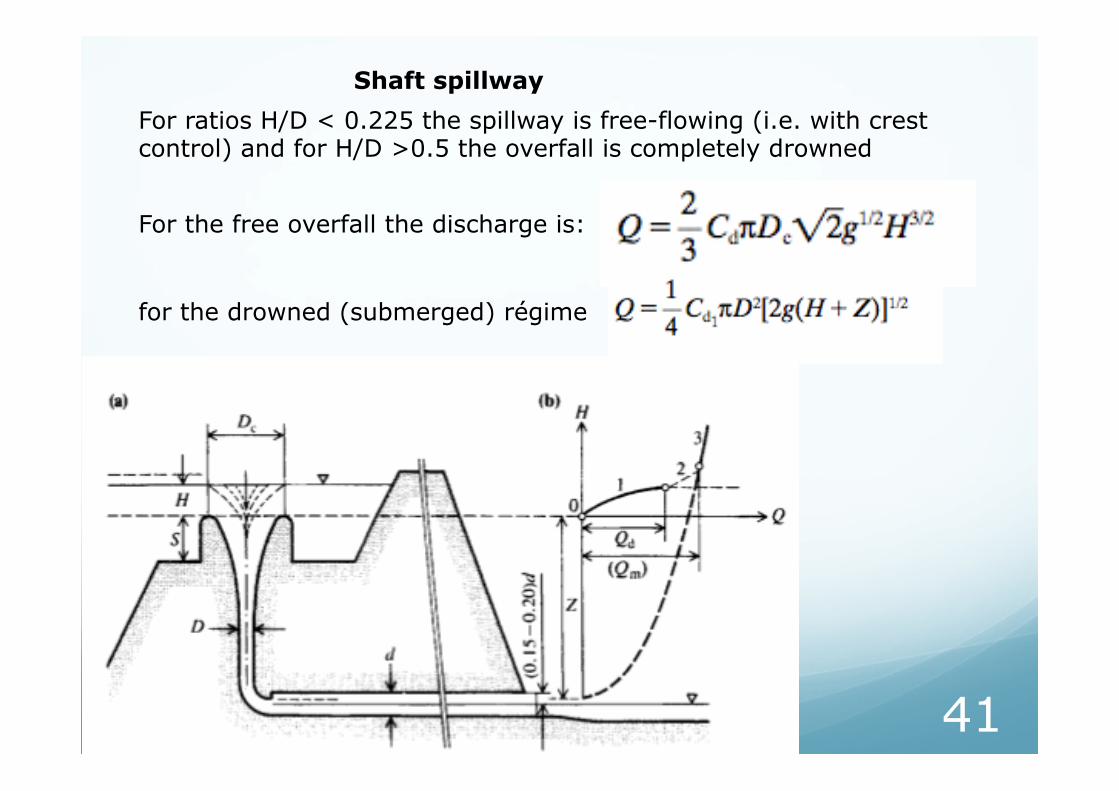
Shaft spillway For ratios H/D < 0.225 the spillway is free-flowing (i.e. with crest control) and for H/D >0.5 the overfall is completely drowned
for the drowned (submerged) régime
For the free overfall the discharge is:
42
Energy dissipation at dams and weirs is closely associated with spillway design, particularly with the chosen specific discharge q, the difference between the upstream and downstream water levels (H*) and the down- stream conditions
Energy dissipation
In the design of energy dissipation, environmental factors have to be considered; some of the most important ones are the effect of dissolved gases supersaturation on fish in deep plunge pools, and of spray from flip bucket jets which can result in landslides and freezing fog

43
Consider the energy dissipation process in five separate stages, some of which may be combined or absent: 1. on the spillway surface; 2. in a free-falling jet; 3. at impact into the downstream pool; 4. the stilling basin; 5. at the outflow into the river.
44
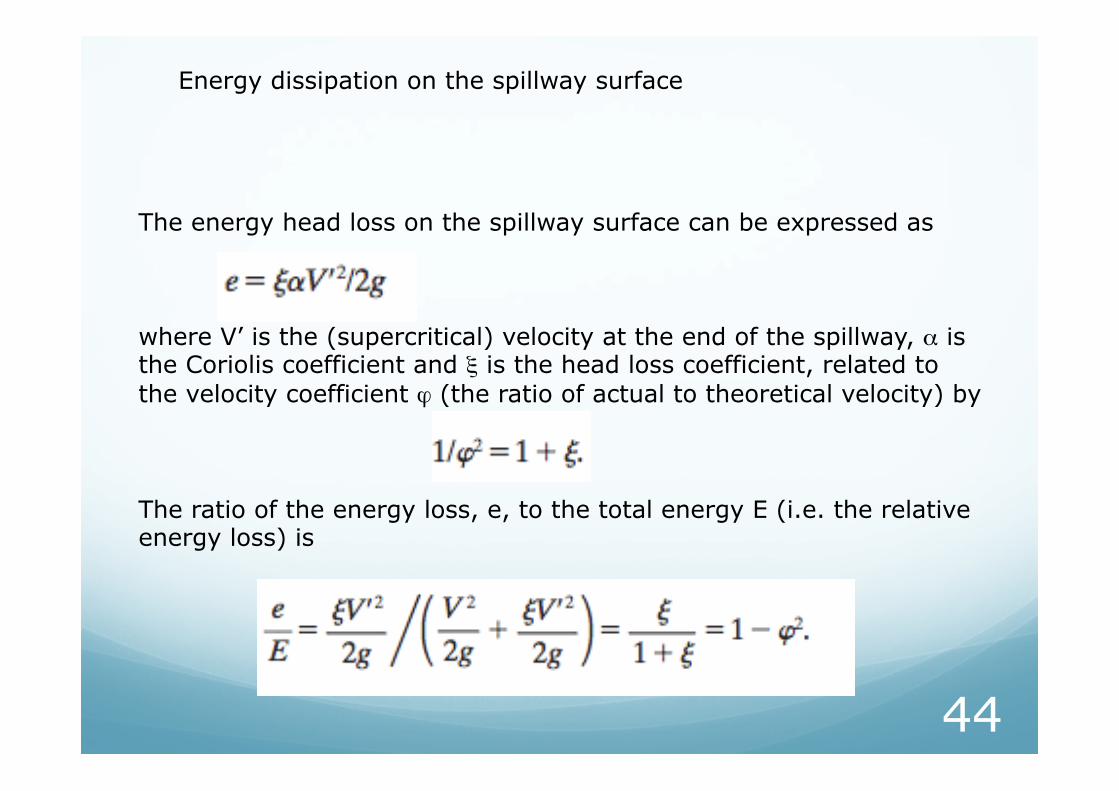
Energy dissipation on the spillway surface
The energy head loss on the spillway surface can be expressed as where V’ is the (supercritical) velocity at the end of the spillway, # is the Coriolis coefficient and $ is the head loss coefficient, related to the velocity coefficient % (the ratio of actual to theoretical velocity) by The ratio of the energy loss, e, to the total energy E (i.e. the relative energy loss) is

45
For S/H<30
The value of $ could be increased (and % decreased) by using a rough spillway or by placing baffles on the spillway surface. However, unless aeration is provided at these protrusions, the increased energy dissipation may be achieved only by providing an opportunity for cavitation damage
46
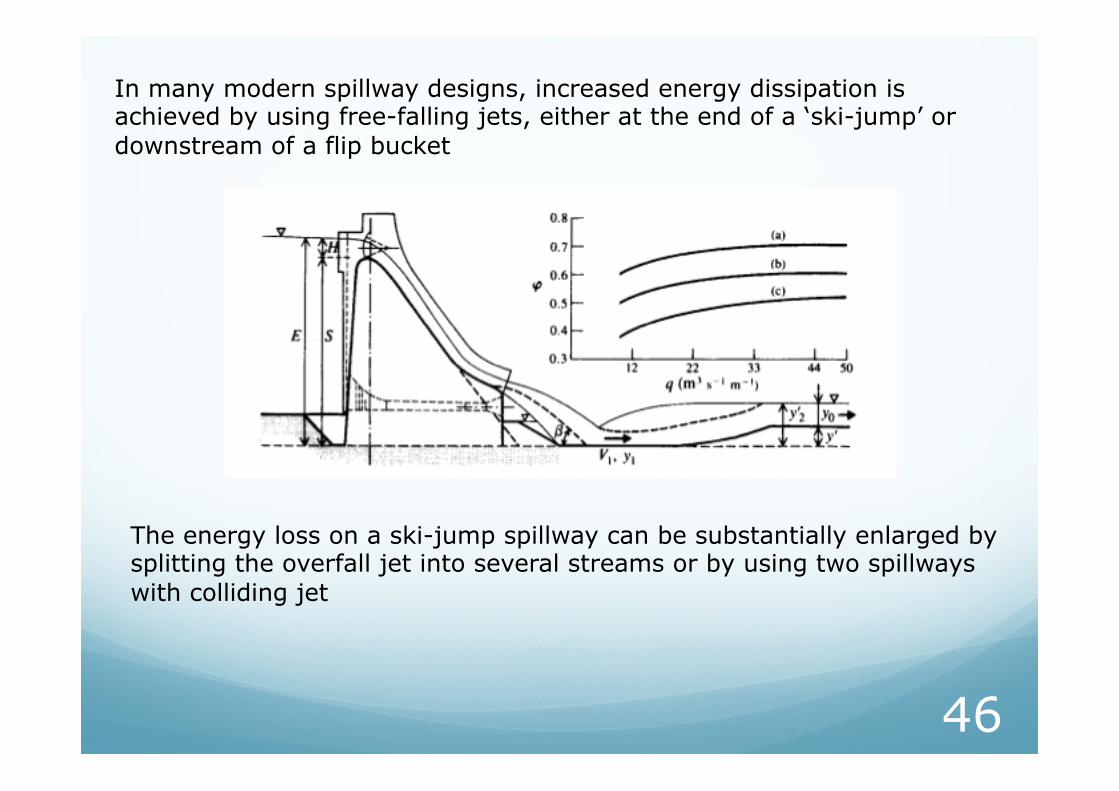
In many modern spillway designs, increased energy dissipation is achieved by using free-falling jets, either at the end of a ‘ski-jump’ or downstream of a flip bucket
The energy loss on a ski-jump spillway can be substantially enlarged by splitting the overfall jet into several streams or by using two spillways with colliding jet
47
The combined energy loss in the first three phases of energy dissipation
can be expressed from a velocity coefficient %1–3, which can be
determined in model tests from the theoretical supercritical flow depth
conjunctive to the subcritical depth needed to form a stable jump down-
stream of a (ski-jump) spillway. Even if this value of % may be subject to
scale effects (the prototype % is likely to be smaller because of increased
aeration), the model studies give a very good indication of the relative
merits of various designs.
Generally
%1–3= f(S’/S, q, geometry)
where S’ is the height of the ‘take-off’ point above the reference datum.
48
The increase of % (and decrease of relative energy loss) with q is again
demonstrated. By using a suitable design, the values of % have been
reduced throughout by a factor about 0.7; this results in substantial
energy losses, e.g. for %1–3= 0.5, e/E=75%
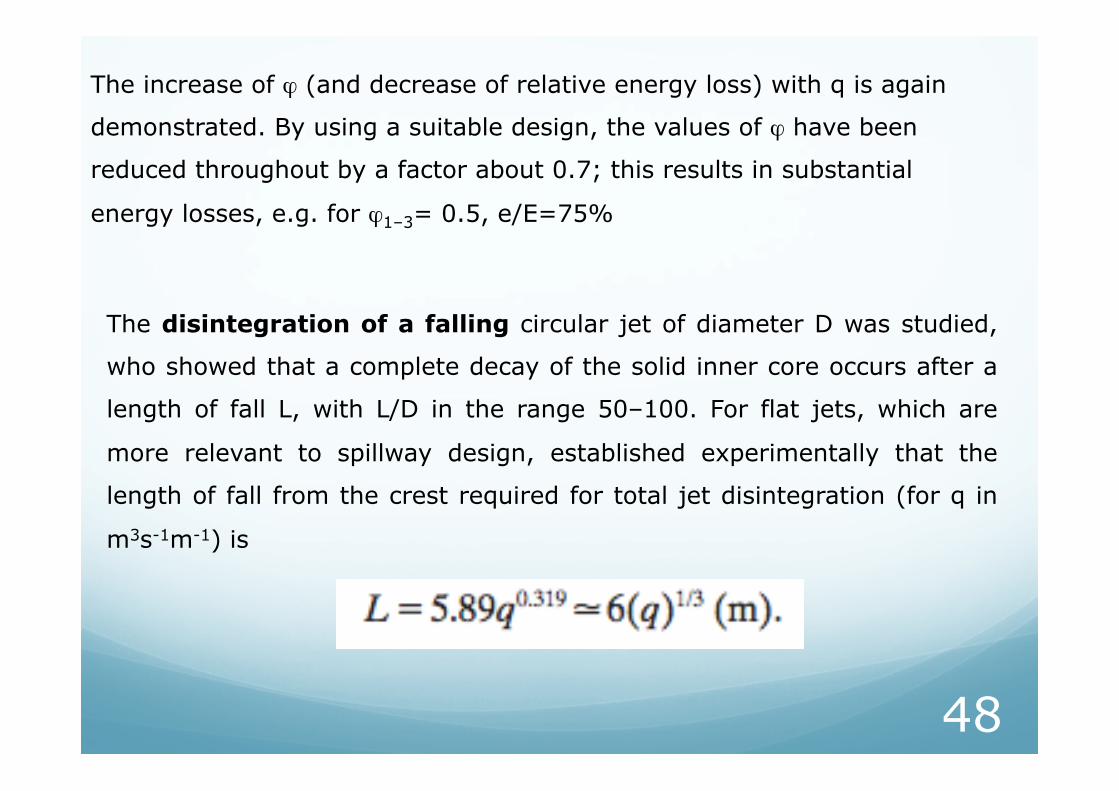
The disintegration of a falling circular jet of diameter D was studied,
who showed that a complete decay of the solid inner core occurs after a
length of fall L, with L/D in the range 50–100. For flat jets, which are
more relevant to spillway design, established experimentally that the
length of fall from the crest required for total jet disintegration (for q in
m3s-1m-1) is
49
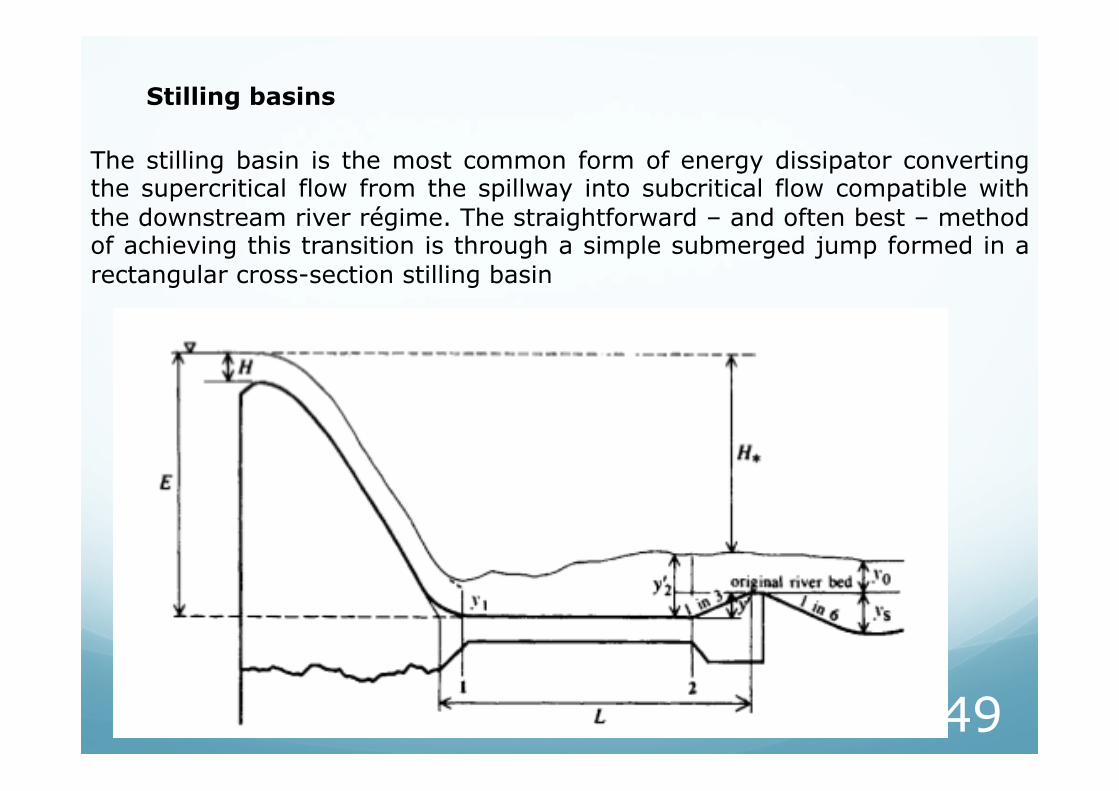
Stilling basins
The stilling basin is the most common form of energy dissipator converting the supercritical flow from the spillway into subcritical flow compatible with the downstream river régime. The straightforward – and often best – method of achieving this transition is through a simple submerged jump formed in a rectangular cross-section stilling basin

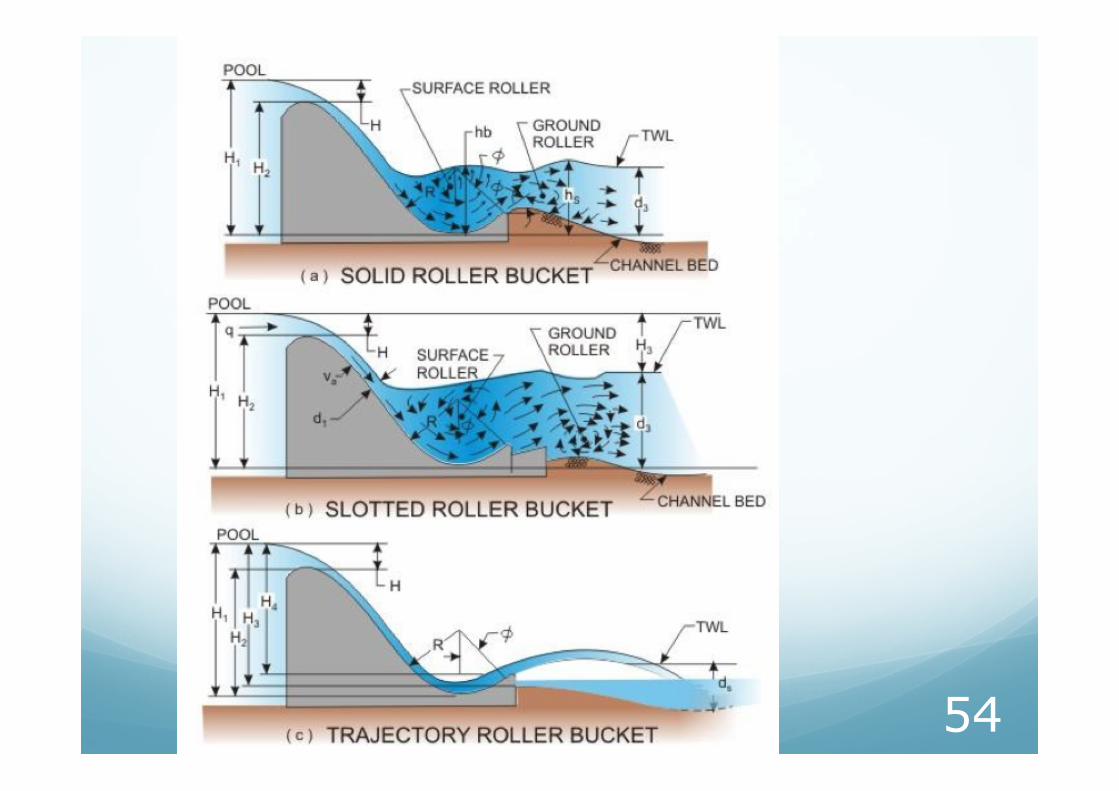
50 Sky-jump bucket type energy dissipator
51
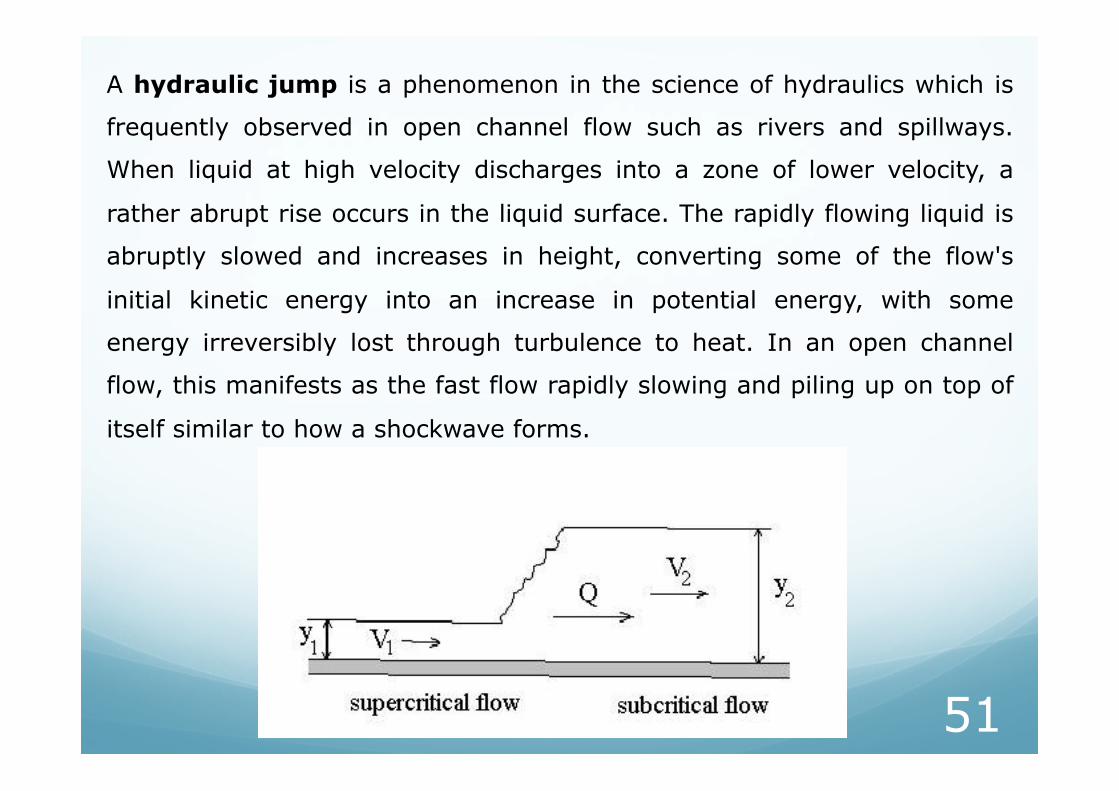
A hydraulic jump is a phenomenon in the science of hydraulics which is
frequently observed in open channel flow such as rivers and spillways.
When liquid at high velocity discharges into a zone of lower velocity, a
rather abrupt rise occurs in the liquid surface. The rapidly flowing liquid is
abruptly slowed and increases in height, converting some of the flow's
initial kinetic energy into an increase in potential energy, with some
energy irreversibly lost through turbulence to heat. In an open channel
flow, this manifests as the fast flow rapidly slowing and piling up on top of
itself similar to how a shockwave forms.

52
Basic equation (rectangular section):
where "’ and K are coefficients (derived from laboratory and field experiments).
Length of the stilling basin
Depth of the stilling basin
Energy
Depth;

53
For a suitably chosen % and a value of E corresponding to the total
energy available above the stilling basin floor, y1, y2and y’ can be
computed from equations (from a chosen value of safety coefficient).
The values of the coefficients "’ and K in equations can be taken
(Novak and Cábelka, 1981) as 1.1<&’<1.25 and 4.5<K<5.5, where
the lower value of K applies for Fr1>10 and the higher for Fr1 < 3
54
55
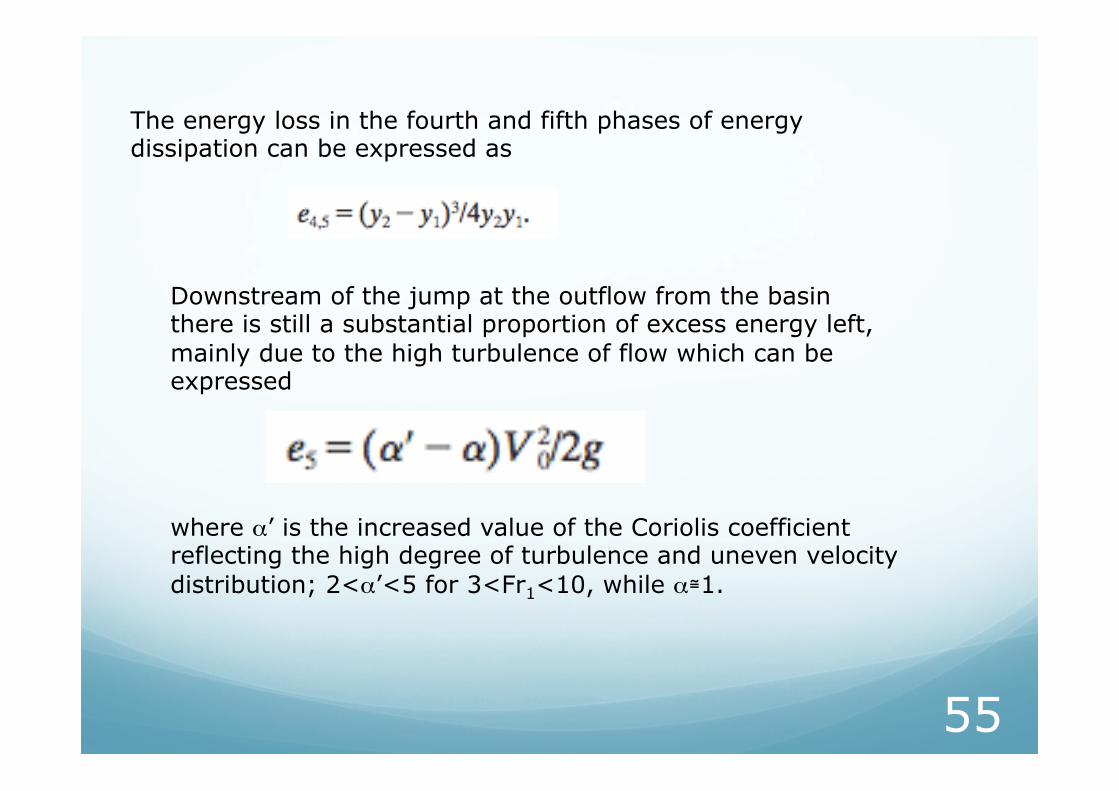
The energy loss in the fourth and fifth phases of energy dissipation can be expressed as
Downstream of the jump at the outflow from the basin there is still a substantial proportion of excess energy left, mainly due to the high turbulence of flow which can be expressed
where #’ is the increased value of the Coriolis coefficient reflecting the high degree of turbulence and uneven velocity distribution; 2<#’<5 for 3<Fr1<10, while # 1.

56
Equation shows that the efficiency of energy dissipation in the jump itself within the stilling basin decreases with the Froude number, leaving up to 50% of the energy to be dissipated downstream of the basin at low Froude numbers