Embed Size (px)
Citation preview

8
Cavitation in HydraulicMachinery
8.1 INTRODUCTION
Cavitation is caused by local vaporization of the fluid, when the local static
pressure of a liquid falls below the vapor pressure of the liquid. Small bubbles or
cavities filled with vapor are formed, which suddenly collapse on moving forward
with the flow into regions of high pressure. These bubbles collapse with
tremendous force, giving rise to as high a pressure as 3500 atm. In a centrifugal
pump, these low-pressure zones are generally at the impeller inlet, where the fluid
is locally accelerated over the vane surfaces. In turbines, cavitation ismost likely to
occur at the downstream outlet end of a blade on the low-pressure leading face.
When cavitation occurs, it causes the following undesirable effects:
1. Local pitting of the impeller and erosion of the metal surface.
2. Serious damage can occur from prolonged cavitation erosion.
3. Vibration of machine; noise is also generated in the form of sharp
cracking sounds when cavitation takes place.
4. A drop in efficiency due to vapor formation, which reduces the
effective flow areas.
The avoidance of cavitation in conventionally designed machines can be
regarded as one of the essential tasks of both pump and turbine designers. This cavit-
ation imposes limitations on the rate of discharge and speed of rotation of the pump.
Copyright 2003 by Marcel Dekker, Inc. All Rights Reserved
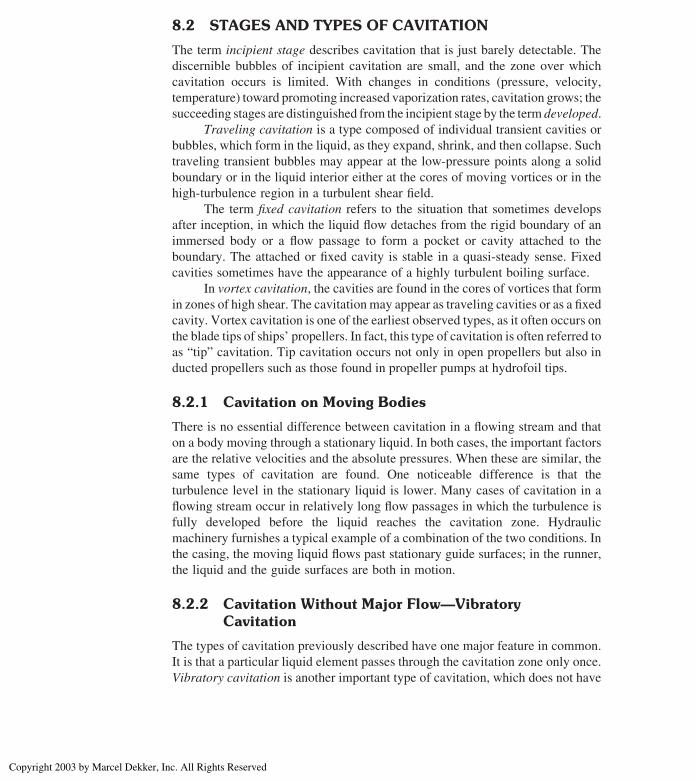
8.2 STAGES AND TYPES OF CAVITATION
The term incipient stage describes cavitation that is just barely detectable. The
discernible bubbles of incipient cavitation are small, and the zone over which
cavitation occurs is limited. With changes in conditions (pressure, velocity,
temperature) toward promoting increased vaporization rates, cavitation grows; the
succeeding stages are distinguished from the incipient stage by the term developed.
Traveling cavitation is a type composed of individual transient cavities or
bubbles, which form in the liquid, as they expand, shrink, and then collapse. Such
traveling transient bubbles may appear at the low-pressure points along a solid
boundary or in the liquid interior either at the cores of moving vortices or in the
high-turbulence region in a turbulent shear field.
The term fixed cavitation refers to the situation that sometimes develops
after inception, in which the liquid flow detaches from the rigid boundary of an
immersed body or a flow passage to form a pocket or cavity attached to the
boundary. The attached or fixed cavity is stable in a quasi-steady sense. Fixed
cavities sometimes have the appearance of a highly turbulent boiling surface.
In vortex cavitation, the cavities are found in the cores of vortices that form
in zones of high shear. The cavitationmay appear as traveling cavities or as a fixed
cavity. Vortex cavitation is one of the earliest observed types, as it often occurs on
the blade tips of ships’ propellers. In fact, this type of cavitation is often referred to
as “tip” cavitation. Tip cavitation occurs not only in open propellers but also in
ducted propellers such as those found in propeller pumps at hydrofoil tips.
8.2.1 Cavitation on Moving Bodies
There is no essential difference between cavitation in a flowing stream and that
on a body moving through a stationary liquid. In both cases, the important factors
are the relative velocities and the absolute pressures. When these are similar, the
same types of cavitation are found. One noticeable difference is that the
turbulence level in the stationary liquid is lower. Many cases of cavitation in a
flowing stream occur in relatively long flow passages in which the turbulence is
fully developed before the liquid reaches the cavitation zone. Hydraulic
machinery furnishes a typical example of a combination of the two conditions. In
the casing, the moving liquid flows past stationary guide surfaces; in the runner,
the liquid and the guide surfaces are both in motion.
8.2.2 Cavitation Without Major Flow—VibratoryCavitation
The types of cavitation previously described have one major feature in common.
It is that a particular liquid element passes through the cavitation zone only once.
Vibratory cavitation is another important type of cavitation, which does not have
Chapter 8322
Copyright 2003 by Marcel Dekker, Inc. All Rights Reserved

this characteristic. Although it is accompanied sometimes by continuous flow, the
velocity is so low that a given element of liquid is exposed to many cycles of
cavitation (in a time period of the order of milliseconds) rather than only one.
In vibratory cavitation, the forces causing the cavities to form and collapse are
due to a continuous series of high-amplitude, high-frequency pressure pulsations
in the liquid. These pressure pulsations are generated by a submerged surface,
which vibrates normal to its face and sets up pressure waves in the liquid. No
cavities will be formed unless the amplitude of the pressure variation is great
enough to cause the pressure to drop to or below the vapor pressure of the liquid.
As the vibratory pressure field is characteristic of this type of cavitation, the name
“vibratory cavitation” follows.
8.3 EFFECTS AND IMPORTANCE OF CAVITATION
Cavitation is important as a consequence of its effects. These may be classified
into three general categories:
1. Effects that modify the hydrodynamics of the flow of the liquid
2. Effects that produce damage on the solid-boundary surfaces of the flow
3. Extraneous effects that may or may not be accompanied by significant
hydrodynamic flow modifications or damage to solid boundaries
Unfortunately for the field of applied hydrodynamics, the effects of
cavitation, with very few exceptions, are undesirable. Uncontrolled cavitation
can produce serious and even catastrophic results. The necessity of avoiding or
controlling cavitation imposes serious limitations on the design of many types of
hydraulic equipment. The simple enumeration of some types of equipment,
structures, or flow systems, whose performance may be seriously affected by the
presence of cavitation, will serve to emphasize the wide occurrence and the
relative importance of this phenomenon.
In the field of hydraulic machinery, it has been found that all types of
turbines, which form a low-specific-speed Francis to the high-specific-speed
Kaplan, are susceptible to cavitation. Centrifugal and axial-flow pumps suffer
from its effects, and even the various types of positive-displacement pumps may
be troubled by it. Although cavitation may be aggravated by poor design, it may
occur in even the best-designed equipment when the latter is operated under
unfavorable condition.
8.4 CAVITATION PARAMETER FOR DYNAMICSIMILARITY
The main variables that affect the inception and subsequent character of
cavitation in flowing liquids are the boundary geometry, the flow variables
Cavitation in Hydraulic Machinery 323
Copyright 2003 by Marcel Dekker, Inc. All Rights Reserved

of absolute pressure and velocity, and the critical pressure pcrit at which a bubble
can be formed or a cavity maintained. Other variables may cause significant
variations in the relation between geometry, pressure, and velocity and in the
value of the critical pressure. These include the properties of the liquid (such as
viscosity, surface tension, and vaporization characteristics), any solid, or gaseous
contaminants that may be entrained or dissolved in the liquid, and the condition
of the boundary surfaces, including cleanliness and existence of crevices, which
might host undissolved gases. In addition to dynamic effects, the pressure
gradients due to gravity are important for large cavities whether they be traveling
or attached types. Finally, the physical size of the boundary geometry may be
important, not only in affecting cavity dimensions but also in modifying the
effects of some of the fluid and boundary flow properties.
Let us consider a simple liquid having constant properties and develop
the basic cavitation parameter. A relative flow between an immersed object and
the surrounding liquid results in a variation in pressure at a point on the object,
and the pressure in the undisturbed liquid at some distance from the object is
proportional to the square of the relative velocity. This can be written as the
negative of the usual pressure coefficient Cp, namely,
2Cp ¼ ð p0 2 pÞdrV2
0=2ð8:1Þ
where r is the density of liquid, V0 the velocity of undisturbed liquid relative to
body, p0 the pressure of undisturbed liquid, p the pressure at a point on object, and
ð p0 2 pÞd the pressure differential due to dynamic effects of fluid motion.
This is equivalent to omitting gravity. However, when necessary, gravity
effects can be included.
At some location on the object, p will be a minimum, pmin, so that
ð2CpÞmin ¼ p0 2 pmin
rV20=2
ð8:2Þ
In the absence of cavitation (and if Reynolds-number effects are neglected), this
value will depend only on the shape of the object. It is easy to create a set of
conditions such that pmin drops to some value at which cavitation exists. This can
be accomplished by increasing the relative velocity V0 for a fixed value of the
pressure p0 or by continuously lowering p0 with V0 held constant. Either
procedure will result in lowering of the absolute values of all the local pressures
on the surface of the object. If surface tension is ignored, the pressure pmin will be
the pressure of the contents of the cavitation cavity. Denoting this as a bubble
pressure pb, we can define a cavitation parameter by replacing pmin; thus
Kb ¼ p0 2 pb
rV20=2
ð8:3Þ
Chapter 8324
Copyright 2003 by Marcel Dekker, Inc. All Rights Reserved

or, in terms of pressure head (in feet of the liquid),
Kb ¼ ð p0 2 pbÞ=gV20=2g
ð8:4Þ
where p0 is the absolute-static pressure at some reference locality, V0 the
reference velocity, pb the absolute pressure in cavity or bubble, and g the specific
weight of liquid.
If we now assume that cavitation will occur when the normal stresses at a
point in the liquid are reduced to zero, pb will equal the vapor pressure pv.
Then, we write
Kb ¼ p0 2 pv
rV20=2
ð8:5Þ
The value of K at which cavitation inception occurs is designated as Ki.
A theoretical value of Ki is the magnitude jð2CpÞminj for any particular body.
The initiation of cavitation by vaporization of the liquid may require that a
negative stress exist because of surface tension and other effects. However, the
presence of such things as undissolved gas particles, boundary layers, and
turbulence will modify and often mask a departure of the critical pressure pcritfrom pv. As a consequence, Eq. (8.5) has been universally adopted as the
parameter for comparison of vaporous cavitation events.
The beginning of cavitation means the appearance of tiny cavities at or near
the place on the object where the minimum pressure is obtained. Continual
increase in V0 (or decrease in p0) means that the pressure at other points along the
surface of the object will drop to the critical pressure. Thus, the zone of cavitation
will spread from the location of original inception. In considering the behavior of
the cavitation parameter during this process, we again note that if Reynolds-
number effects are neglected the pressure coefficient (2Cp)min depends only on
the object’s shape and is constant prior to inception. After inception, the value
decreases as pmin becomes the cavity pressure, which tends to remain constant,
whereas either V0 increases or p0 decreases. Thus, the cavitation parameter
assumes a definite value at each stage of development or “degree” of cavitation
on a particular body. For inception, K ¼ K i; for advanced stages of cavitation,
K , K i: Ki and values of K at subsequent stages of cavitation depend primarily
on the shape of the immersed object past which the liquid flows.
We should note here that for flow past immersed objects and curved
boundaries, Ki will always be finite. For the limiting case of parallel flow of an
ideal fluid, Ki will be zero since the pressure p0 in the main stream will be the
same as the wall pressure (again with gravity omitted and the assumption that
cavitation occurs when the normal stresses are zero).
Cavitation in Hydraulic Machinery 325
Copyright 2003 by Marcel Dekker, Inc. All Rights Reserved
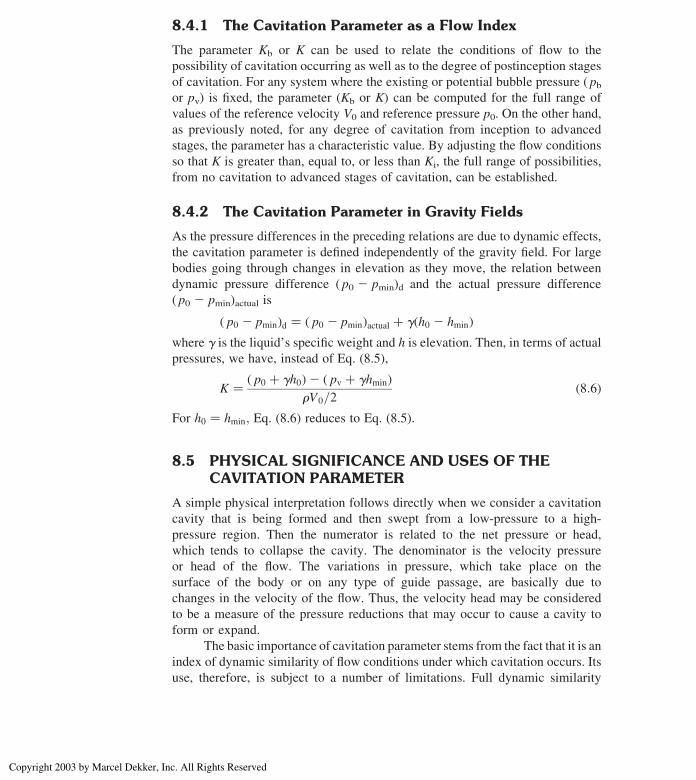
8.4.1 The Cavitation Parameter as a Flow Index
The parameter Kb or K can be used to relate the conditions of flow to the
possibility of cavitation occurring as well as to the degree of postinception stages
of cavitation. For any system where the existing or potential bubble pressure ( pbor pv) is fixed, the parameter (Kb or K) can be computed for the full range of
values of the reference velocity V0 and reference pressure p0. On the other hand,
as previously noted, for any degree of cavitation from inception to advanced
stages, the parameter has a characteristic value. By adjusting the flow conditions
so that K is greater than, equal to, or less than Ki, the full range of possibilities,
from no cavitation to advanced stages of cavitation, can be established.
8.4.2 The Cavitation Parameter in Gravity Fields
As the pressure differences in the preceding relations are due to dynamic effects,
the cavitation parameter is defined independently of the gravity field. For large
bodies going through changes in elevation as they move, the relation between
dynamic pressure difference ( p0 2 pmin)d and the actual pressure difference
( p0 2 pmin)actual is
ð p0 2 pminÞd ¼ ð p0 2 pminÞactual þ gðh0 2 hminÞwhere g is the liquid’s specific weight and h is elevation. Then, in terms of actual
pressures, we have, instead of Eq. (8.5),
K ¼ ð p0 þ gh0Þ2 ð pv þ ghminÞrV0=2
ð8:6Þ
For h0 ¼ hmin; Eq. (8.6) reduces to Eq. (8.5).
8.5 PHYSICAL SIGNIFICANCE AND USES OF THECAVITATION PARAMETER
A simple physical interpretation follows directly when we consider a cavitation
cavity that is being formed and then swept from a low-pressure to a high-
pressure region. Then the numerator is related to the net pressure or head,
which tends to collapse the cavity. The denominator is the velocity pressure
or head of the flow. The variations in pressure, which take place on the
surface of the body or on any type of guide passage, are basically due to
changes in the velocity of the flow. Thus, the velocity head may be considered
to be a measure of the pressure reductions that may occur to cause a cavity to
form or expand.
The basic importance of cavitation parameter stems from the fact that it is an
index of dynamic similarity of flow conditions under which cavitation occurs. Its
use, therefore, is subject to a number of limitations. Full dynamic similarity
Chapter 8326
Copyright 2003 by Marcel Dekker, Inc. All Rights Reserved
between flows in two systems requires that the effects of all physical conditions be
reproduced according to unique relations. Thus, even if identical thermodynamics
and chemical properties and identical boundary geometry are assumed, the
variable effects of contaminants in the liquid-omitted dynamic similarity require
that the effects of viscosity, gravity, and surface tension be in unique relationship at
each cavitation condition. In other words, a particular cavitation condition is
accurately reproduced only if Reynolds number, Froude number, Weber number,
etc. as well as the cavitation parameter K have particular values according to a
unique relation among themselves.
8.6 THE RAYLEIGH ANALYSIS OF A SPHERICALCAVITY IN AN INVISCID INCOMPRESSIBLELIQUID AT REST AT INFINITY
The mathematical analysis of the formation and collapse of spherical cavities,
which are the idealized form of the traveling transient cavities, has proved
interesting to many workers in the field. Furthermore, it appears that as more
experimental evidence is obtained on the detailed mechanics of the cavitation
process, the role played by traveling cavities grows in importance. This is
especially true with respect to the process by which cavitation produces physical
damage on the guiding surfaces.
Rayleigh first set up an expression for the velocity u, at any radial distance
r, where r is greater than R, the radius of the cavity wall. U is the cavity-wall
velocity at time t. For spherical symmetry, the radial flow is irrotational with
velocity potential, and velocity is given by
f ¼ UR2
rand
u
U¼ R2
r 2ð8:7Þ
Next, the expression for the kinetic energy of the entire body of liquid at time t is
developed by integrating kinetic energy of a concentric fluid shell of thickness dr
and density r. The result is
ðKEÞliq ¼ r
2
Z 1
R
u24pr 2dr ¼ 2prU 2R3 ð8:8ÞThe work done on the entire body of fluid as the cavity is collapsing from the
initial radius R0 to R is a product of the pressure p1 at infinity and the change in
volume of the cavity as no work is done at the cavity wall where the pressure is
assumed to be zero, i.e.,
4pp13
R30 2 R3
� � ð8:9ÞIf the fluid is inviscid as well as incompressible, the work done appears as kinetic
Cavitation in Hydraulic Machinery 327
Copyright 2003 by Marcel Dekker, Inc. All Rights Reserved

energy. Therefore, Eq. (8.8) can be equated to Eq. (8.9), which gives
U 2 ¼ 2p13r
R30
R32 1
� �ð8:10Þ
An expression for the time t required for a cavity to collapse from R0 to R can be
obtained from Eq. (8.10) by substituting for the velocity U of the boundary, its
equivalent dR/dt and performing the necessary integration.
This gives
t ¼ffiffiffiffiffiffiffiffi3r
2p1
s Z R0
R
R3=2dR
R30 2 R3
� �1=2 ¼ R0
ffiffiffiffiffiffiffiffi3r
2p1
s Z 1
b
b3=2db
ð12 b3Þ1=2 ð8:11Þ
The new symbol b is R/R0. The time t of complete collapse is obtained if
Eq. (8.11) is evaluated for b ¼ 0: For this special case, the integration may be
performed by means of functions with the result that t becomes
t ¼ R0
ffiffiffiffiffiffiffiffir
6p1
r£ G 3
6
� �G 1
2
� �
G 43
� � ¼ 0:91468R0
ffiffiffiffiffiffir
p1
rð8:12Þ
Rayleigh did not integrate Eq. (8.11) for any other value of b. In the detailed
study of the time history of the collapse of a cavitation bubble, it is convenient to
have a solution for all values of b between 0 and 1.0. Table 8.1 gives values of the
dimensionless time t ¼ t=R0
ffiffiffiffiffiffiffiffiffiffiffir=p1
pover this range as obtained from a numerical
solution of a power series expansion of the integral in Eq. (8.11).
Equation (8.10) shows that as R decreases to 0, the velocity U increases to
infinity. In order to avoid this, Rayleigh calculated what would happen if, instead
of having zero or constant pressure within the cavity, the cavity is filled with a
gas, which is compressed isothermally. In such a case, the external work done on
the system as given by Eq. (8.9) is equated to the sum of the kinetic energy of the
liquid given by Eq. (8.8) and the work of compression of the gas, which is
4pQR30 lnðR0=RÞ; where Q is the initial pressure of the gas. Thus Eq. (8.10) is
replaced by
U 2 ¼ 2p13r
R30
R32 1
� �2
2Q
r£ R3
0
R3ln0
R0
Rð8:13Þ
For any real (i.e., positive) value ofQ, the cavity will not collapse completely, but
U will come to 0 for a finite value of R. If Q is greater than p1, the first movement
of the boundary is outward. The limiting size of the cavity can be obtained by
setting U ¼ 0 in Eq. (8.13), which gives
p1z2 1
z2 Q ln z ¼ 0 ð8:14Þ
Chapter 8328
Copyright 2003 by Marcel Dekker, Inc. All Rights Reserved
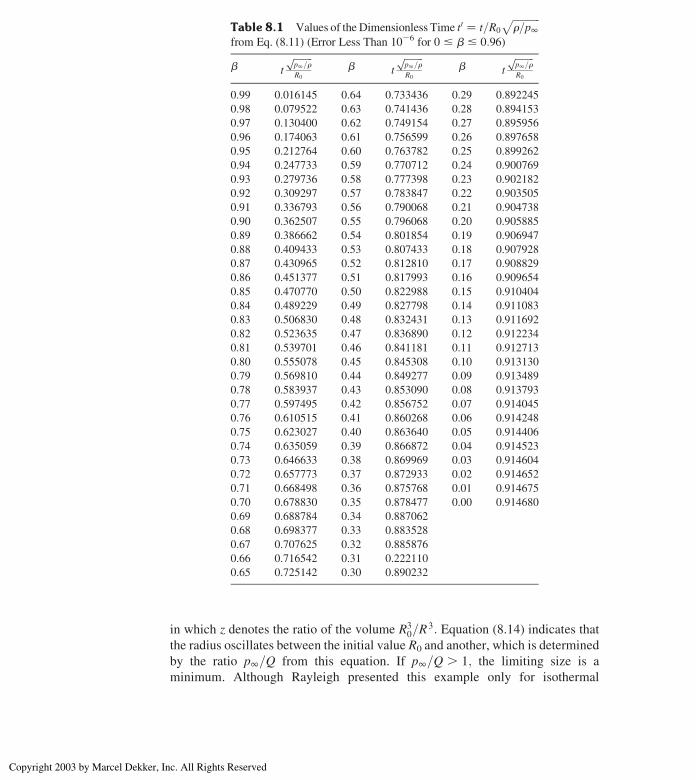
in which z denotes the ratio of the volume R30=R
3: Equation (8.14) indicates that
the radius oscillates between the initial value R0 and another, which is determined
by the ratio p1=Q from this equation. If p1=Q . 1; the limiting size is a
minimum. Although Rayleigh presented this example only for isothermal
Table 8.1 Values of the Dimensionless Time t0 ¼ t=R0
ffiffiffiffiffiffiffiffiffiffiffir=p1
p
from Eq. (8.11) (Error Less Than 1026 for 0 # b # 0:96Þb t
ffiffiffiffiffiffiffiffip1=r
pR0
b t
ffiffiffiffiffiffiffiffip1=r
pR0
b t
ffiffiffiffiffiffiffiffip1=r
pR0
0.99 0.016145 0.64 0.733436 0.29 0.892245
0.98 0.079522 0.63 0.741436 0.28 0.894153
0.97 0.130400 0.62 0.749154 0.27 0.895956
0.96 0.174063 0.61 0.756599 0.26 0.897658
0.95 0.212764 0.60 0.763782 0.25 0.899262
0.94 0.247733 0.59 0.770712 0.24 0.900769
0.93 0.279736 0.58 0.777398 0.23 0.902182
0.92 0.309297 0.57 0.783847 0.22 0.903505
0.91 0.336793 0.56 0.790068 0.21 0.904738
0.90 0.362507 0.55 0.796068 0.20 0.905885
0.89 0.386662 0.54 0.801854 0.19 0.906947
0.88 0.409433 0.53 0.807433 0.18 0.907928
0.87 0.430965 0.52 0.812810 0.17 0.908829
0.86 0.451377 0.51 0.817993 0.16 0.909654
0.85 0.470770 0.50 0.822988 0.15 0.910404
0.84 0.489229 0.49 0.827798 0.14 0.911083
0.83 0.506830 0.48 0.832431 0.13 0.911692
0.82 0.523635 0.47 0.836890 0.12 0.912234
0.81 0.539701 0.46 0.841181 0.11 0.912713
0.80 0.555078 0.45 0.845308 0.10 0.913130
0.79 0.569810 0.44 0.849277 0.09 0.913489
0.78 0.583937 0.43 0.853090 0.08 0.913793
0.77 0.597495 0.42 0.856752 0.07 0.914045
0.76 0.610515 0.41 0.860268 0.06 0.914248
0.75 0.623027 0.40 0.863640 0.05 0.914406
0.74 0.635059 0.39 0.866872 0.04 0.914523
0.73 0.646633 0.38 0.869969 0.03 0.914604
0.72 0.657773 0.37 0.872933 0.02 0.914652
0.71 0.668498 0.36 0.875768 0.01 0.914675
0.70 0.678830 0.35 0.878477 0.00 0.914680
0.69 0.688784 0.34 0.887062
0.68 0.698377 0.33 0.883528
0.67 0.707625 0.32 0.885876
0.66 0.716542 0.31 0.222110
0.65 0.725142 0.30 0.890232
Cavitation in Hydraulic Machinery 329
Copyright 2003 by Marcel Dekker, Inc. All Rights Reserved
compression, it is obvious that any other thermodynamic process may be
assumed for the gas in the cavity, and equations analogous to Eq. (8.13) may be
formulated.
As another interesting aspect of the bubble collapse, Rayleigh calculated
the pressure field in the liquid surrounding the bubble reverting to the empty
cavity of zero pressure. He set up the radial acceleration as the total differential of
the liquid velocity u, at radius r, with respect to time, equated this to the radial
pressure gradient, and integrated to get the pressure at any point in the liquid.
Hence,
ar ¼ 2du
dt¼ 2
›u
›t2 u
›u
›t¼ 1
r
›p
›rð8:15Þ
Expressions for ›u=›t and uð›u=›rÞ as functions of R and r are obtained from
Eqs. (8.7) and (8.10), the partial differential of Eq. (8.7) being taken with respect
to r and t, and the partial differential of Eq. (8.7) with respect to t. Substituting
these expressions in Eq. (8.15) yields:
1
p1›p
›r¼ R
3r 2ð4z2 4ÞR3
r 32 ðz2 4Þ
� �ð8:16Þ
in which z ¼ * ðR0=RÞ3 and r # R always. By integration, this becomes
1
p1
Z p
p1dp ¼ R
3ð4z2 4ÞR3
Z r
1
dr
r 52 ðz2 4Þ
Z r
1
dr
r 2
� �ð8:17Þ
which gives
p
p12 1 ¼ R
3rðz2 4Þ2 R4
3r 4ðz2 1Þ ð8:18Þ
The pressure distribution in the liquid at the instant of release is obtained by
substituting R ¼ R0 in Eq. (8.18), which gives
p ¼ p1 12R0
r
� �ð8:19Þ
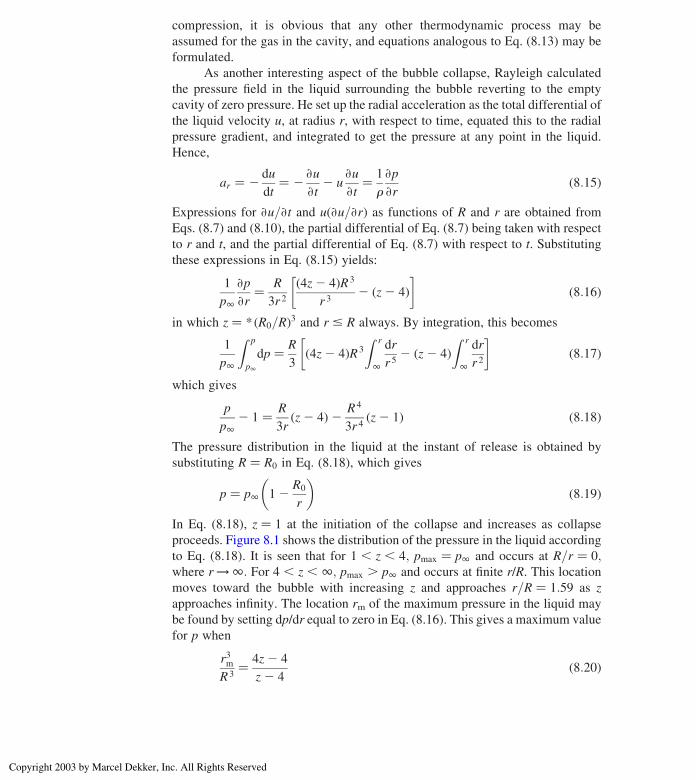
In Eq. (8.18), z ¼ 1 at the initiation of the collapse and increases as collapse
proceeds. Figure 8.1 shows the distribution of the pressure in the liquid according
to Eq. (8.18). It is seen that for 1 , z , 4; pmax ¼ p1 and occurs at R=r ¼ 0;where r !1: For 4 , z , 1; pmax . p1 and occurs at finite r/R. This location
moves toward the bubble with increasing z and approaches r=R ¼ 1:59 as z
approaches infinity. The location rm of the maximum pressure in the liquid may
be found by setting dp/dr equal to zero in Eq. (8.16). This gives a maximum value
for p when
r3mR3
¼ 4z2 4
z2 4ð8:20Þ
Chapter 8330
Copyright 2003 by Marcel Dekker, Inc. All Rights Reserved
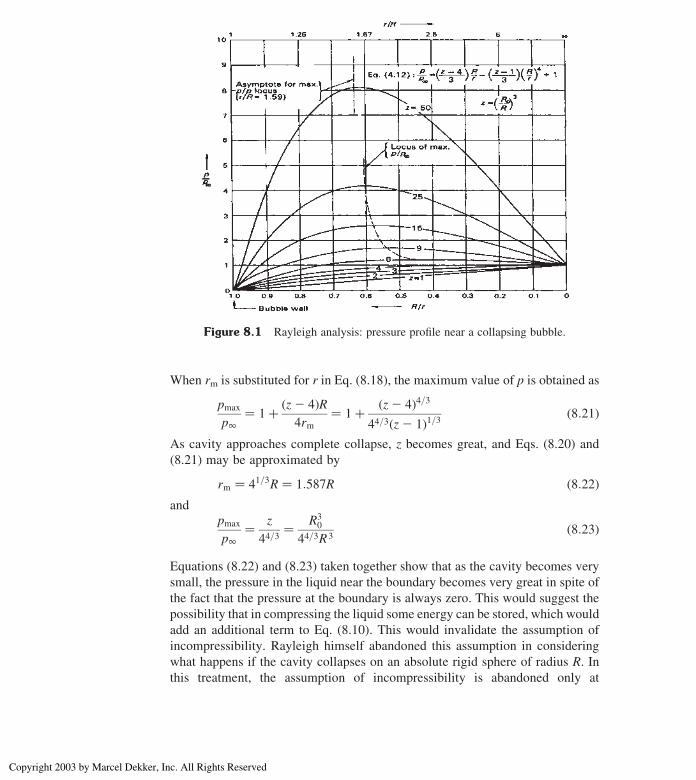
When rm is substituted for r in Eq. (8.18), the maximum value of p is obtained as
pmax
p1¼ 1þ ðz2 4ÞR
4rm¼ 1þ ðz2 4Þ4=3
44=3ðz2 1Þ1=3 ð8:21Þ
As cavity approaches complete collapse, z becomes great, and Eqs. (8.20) and
(8.21) may be approximated by
rm ¼ 41=3R ¼ 1:587R ð8:22Þand
pmax
p1¼ z
44=3¼ R3
0
44=3R3ð8:23Þ
Equations (8.22) and (8.23) taken together show that as the cavity becomes very
small, the pressure in the liquid near the boundary becomes very great in spite of
the fact that the pressure at the boundary is always zero. This would suggest the
possibility that in compressing the liquid some energy can be stored, which would
add an additional term to Eq. (8.10). This would invalidate the assumption of
incompressibility. Rayleigh himself abandoned this assumption in considering
what happens if the cavity collapses on an absolute rigid sphere of radius R. In
this treatment, the assumption of incompressibility is abandoned only at
Figure 8.1 Rayleigh analysis: pressure profile near a collapsing bubble.
Cavitation in Hydraulic Machinery 331
Copyright 2003 by Marcel Dekker, Inc. All Rights Reserved
the instant that the cavity wall comes in contact with the rigid sphere. From that
instant, it is assumed that the kinetic energy of deformation of the same particle is
determined by the bulk modulus of elasticity of the fluid, as is common in water-
hammer calculations. On this basis, it is found that
ðP0Þ22E
1
2¼ rU 2 ¼ p1
3
R30
R32 1
� �¼ p1
3ðz2 1Þ ð8:24Þ
where P 0 is the instantaneous pressure on the surface of the rigid sphere and E is
the bulk modulus of elasticity. Both must be expressed in the same units.
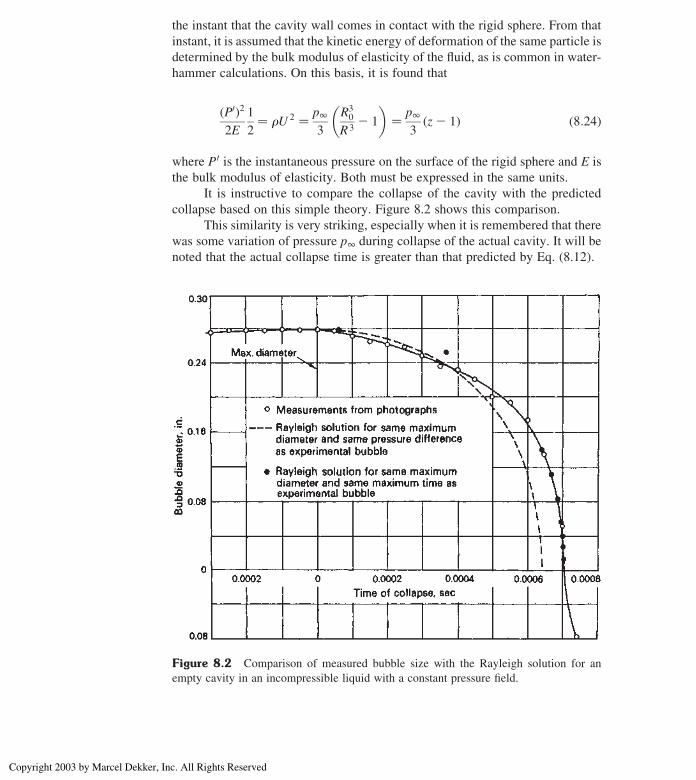
It is instructive to compare the collapse of the cavity with the predicted
collapse based on this simple theory. Figure 8.2 shows this comparison.
This similarity is very striking, especially when it is remembered that there
was some variation of pressure p1 during collapse of the actual cavity. It will be
noted that the actual collapse time is greater than that predicted by Eq. (8.12).
Figure 8.2 Comparison of measured bubble size with the Rayleigh solution for an
empty cavity in an incompressible liquid with a constant pressure field.
Chapter 8332
Copyright 2003 by Marcel Dekker, Inc. All Rights Reserved
8.7 CAVITATION EFFECTS ON PERFORMANCE OFHYDRAULIC MACHINES
8.7.1 Basic Nature of Cavitation Effects onPerformance
The effects of cavitation on hydraulic performance are many and varied. They
depend upon the type of equipment or structure under consideration and the
purpose it is designed to fulfill. However, the basic elements, which together
make up these effects on performance, are stated as follows:
1. The presence of a cavitation zone can change the friction losses in a
fluid flow system, both by altering the skin friction and by varying the
form resistance. In general, the effect is to increase the resistance,
although this is not always true.
2. The presence of a cavitation zone may result in a change in the local
direction of the flow due to a change in the lateral force, which a given
element of guiding surface can exert on the flow as it becomes covered
by cavitation.
3. With well-developed cavitation the decrease in the effective cross-
section of the liquid-flow passages may become great enough to cause
partial or complete breakdown of the normal flow.
The development of cavitation may seriously affect the operation of all
types of hydraulic structures and machines. For example, it may change the
rate of discharge of gates or spillways, or it may lead to undesirable or
destructive pulsating flows. It may distort the action of control valves and other
similar flow devices. However, the most trouble from cavitation effects has
been experienced in rotating machinery; hence, more is known about the
details of these manifestations. Study of these details not only leads to a better
understanding of the phenomenon in this class of equipment but also sheds
considerable light on the reason behind the observed effects of cavitation
in many types of equipment for which no such studies have been made.
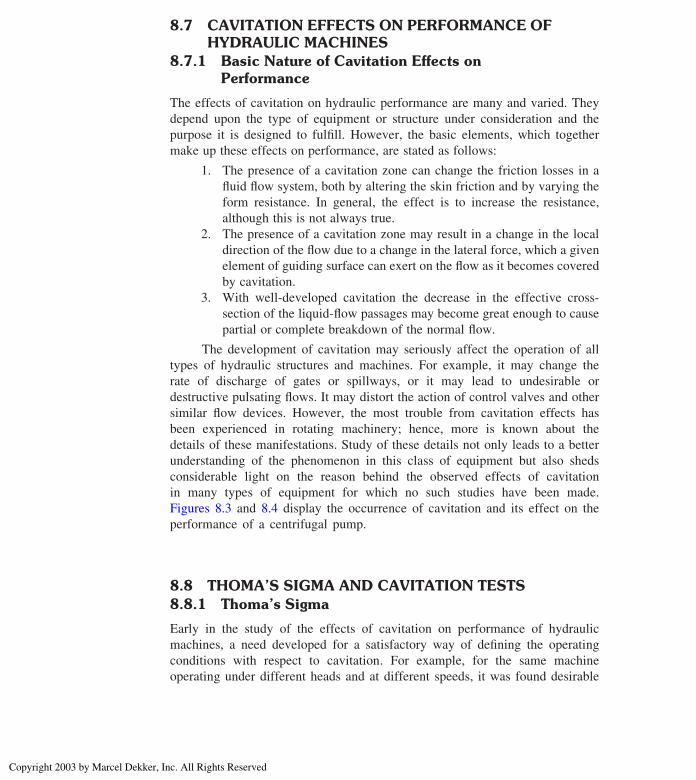
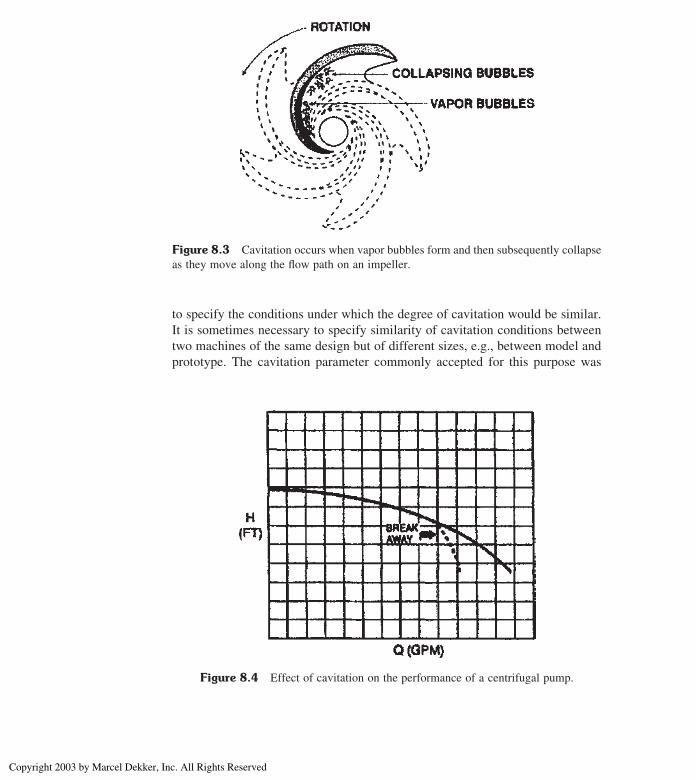
Figures 8.3 and 8.4 display the occurrence of cavitation and its effect on the
performance of a centrifugal pump.
8.8 THOMA’S SIGMA AND CAVITATION TESTS8.8.1 Thoma’s Sigma
Early in the study of the effects of cavitation on performance of hydraulic
machines, a need developed for a satisfactory way of defining the operating
conditions with respect to cavitation. For example, for the same machine
operating under different heads and at different speeds, it was found desirable
Cavitation in Hydraulic Machinery 333
Copyright 2003 by Marcel Dekker, Inc. All Rights Reserved
to specify the conditions under which the degree of cavitation would be similar.
It is sometimes necessary to specify similarity of cavitation conditions between
two machines of the same design but of different sizes, e.g., between model and
prototype. The cavitation parameter commonly accepted for this purpose was
Figure 8.3 Cavitation occurs when vapor bubbles form and then subsequently collapse
as they move along the flow path on an impeller.
Figure 8.4 Effect of cavitation on the performance of a centrifugal pump.
Chapter 8334
Copyright 2003 by Marcel Dekker, Inc. All Rights Reserved

proposed by Thoma and is now commonly known as the Thoma sigma, sT.
For general use with pumps or turbines, we define sigma as
ssv ¼ Hsv
Hð8:25Þ
where Hsv, the net positive suction head at some location ¼ total absolute head
less vapor-pressure head ¼ ½ð patm=gÞ þ ð p=gÞ þ ðV 2=2gÞ2 ð pv=gÞ�; H is the
head produced (pump) or absorbed (turbine), and g is the specific weight of fluid.
For turbines with negative static head on the runner,
Hsv ¼ Ha 2 Hs 2 Hv þ V2e
2gþ Hf ð8:26Þ
where Ha is the barometric-pressure head, Hs the static draft head defined as
elevation of runner discharge above surface of tail water, Hv the vapor-pressure
head, Ve the draft-tube exit average velocity (tailrace velocity), and Hf the draft-
tube friction loss.
If we neglect the draft-tube friction loss and exit-velocity head, we get
sigma in Thoma’s original form:
sT ¼ Ha 2 Hs 2 Hv
Hð8:27Þ
Thus
sT ¼ ssv 2V2e=2gþ Hf
Hð8:28Þ
Sigma (ssv or sT) has a definite value for each installation, known as the plant
sigma. Every machine will cavitate at some critical sigma (ssvcor sTc
). Clearly,
cavitation will be avoided only if the plant sigma is greater than the critical sigma.
The cavitation parameter for the flow passage at the turbine runner
discharge is, say,
Kd ¼ Hd 2 Hv
V2d=2g
ð8:29Þ
where Hd is the absolute-pressure head at the runner discharge and Vd the average
velocity at the runner discharge. Equation (8.29) is similar in form to Eq. (8.25)
but they do not have exactly the same significance. The numerator of Kd is the
actual cavitation-suppression pressure head of the liquid as it discharges from the
runner. (This assumes the same pressure to exist at the critical location for
cavitation inception.) Its relation to the numerator of sT is
Hd 2 Hv ¼ Hsv 2V2d
2gð8:30Þ
For a particular machine operating at a particular combination of the operating
variables, flow rate, head speed, and wicket-gate setting,
Cavitation in Hydraulic Machinery 335
Copyright 2003 by Marcel Dekker, Inc. All Rights Reserved

V2d
2g¼ C1H ð8:31Þ
Using the previous relations, it can be shown that Eq. (8.29) may be written as
Kd ¼ sT
C1
2 12Hf
C1H
� �þ V2
e=2g
V2d=2g
The term in parenthesis is the efficiency of the draft tube, hdt, as the converter of
the entering velocity head to pressure head. Thus the final expression is
Kd ¼ sT
C1
2 hdt þ V2e
V2d
ð8:32Þ
C1 is a function of both design of the machine and the setting of the guide vane;
hdt is a function of the design of the draft tube but is also affected by the guide-
vane setting. If a given machine is tested at constant guide-vane setting and
operating specific speed, both C1 and hdt tend to be constant; hence sT and Kd
have a linear relationship. However, different designs usually have different
values of C1 even for the same specific speed and vane setting, and certainly for
different specific speeds. Kd, however, is a direct measure of the tendency of the
flow to produce cavitation, so that if two different machines of different designs
cavitated at the same value of Kd it would mean that their guiding surfaces in this
region had the dame value of Ki. However, sigma values could be quite different.
From this point of view, sigma is not a satisfactory parameter for the comparison
of machines of different designs. On the other hand, although the determination
of the value of Kd for which cavitation is incipient is a good measure of the
excellence of the shape of the passages in the discharge region, it sheds no light
on whether or not the cross-section is an optimum as well. In this respect, sigma is
more informative as it characterizes the discharge conditions by the total head
rather than the velocity head alone.
Both Kd and sigma implicitly contain one assumption, which should be
borne in mind because at times it may be rather misleading. The critical
cavitation zone of the turbine runner is in the discharge passage just downstream
from the turbine runner. Although this is usually the minimum-pressure point in
the system, it is not necessarily the cross-section that may limit the cavitation
performance of the machine. The critical cross-section may occur further
upstream on the runner blades and may frequently be at the entering edges rather
than trailing edges. However, these very real limitations and differences do not
alter the fact that Kd and sT are both cavitation parameters and in many respects,
they can be used in the same manner. Thus Kd (or K evaluated at any location in
the machine) can be used to measure the tendency of the flow to cavitate, the
conditions of the flow at which cavitation first begins (Ki), or the conditions of
the flow corresponding to a certain degree of development of cavitation.
Chapter 8336
Copyright 2003 by Marcel Dekker, Inc. All Rights Reserved
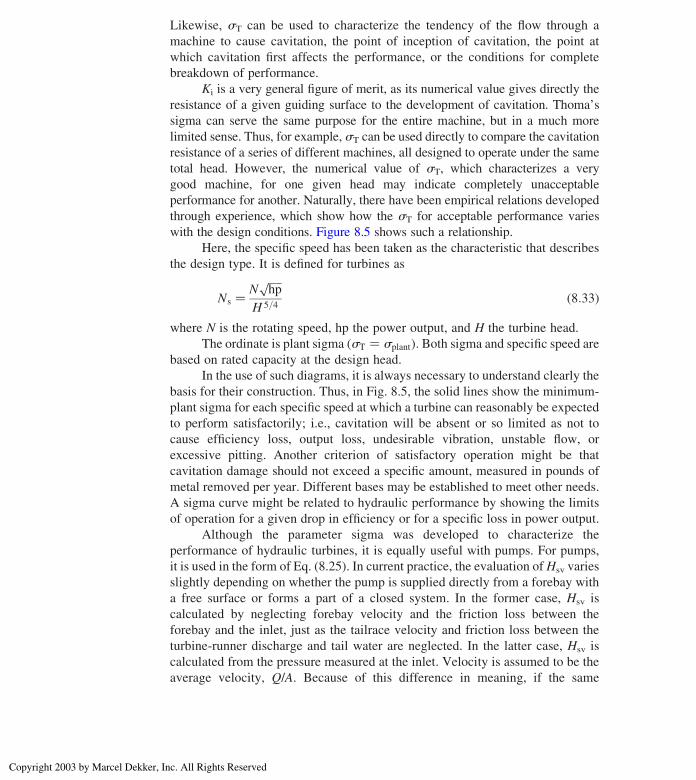
Likewise, sT can be used to characterize the tendency of the flow through a
machine to cause cavitation, the point of inception of cavitation, the point at
which cavitation first affects the performance, or the conditions for complete
breakdown of performance.
Ki is a very general figure of merit, as its numerical value gives directly the
resistance of a given guiding surface to the development of cavitation. Thoma’s
sigma can serve the same purpose for the entire machine, but in a much more
limited sense. Thus, for example, sT can be used directly to compare the cavitation
resistance of a series of different machines, all designed to operate under the same
total head. However, the numerical value of sT, which characterizes a very
good machine, for one given head may indicate completely unacceptable
performance for another. Naturally, there have been empirical relations developed
through experience, which show how the sT for acceptable performance varies
with the design conditions. Figure 8.5 shows such a relationship.
Here, the specific speed has been taken as the characteristic that describes
the design type. It is defined for turbines as
Ns ¼ Nffiffiffiffiffihp
pH 5=4
ð8:33Þwhere N is the rotating speed, hp the power output, and H the turbine head.
The ordinate is plant sigma ðsT ¼ splantÞ: Both sigma and specific speed are
based on rated capacity at the design head.
In the use of such diagrams, it is always necessary to understand clearly the
basis for their construction. Thus, in Fig. 8.5, the solid lines show the minimum-
plant sigma for each specific speed at which a turbine can reasonably be expected
to perform satisfactorily; i.e., cavitation will be absent or so limited as not to
cause efficiency loss, output loss, undesirable vibration, unstable flow, or
excessive pitting. Another criterion of satisfactory operation might be that
cavitation damage should not exceed a specific amount, measured in pounds of
metal removed per year. Different bases may be established to meet other needs.
A sigma curve might be related to hydraulic performance by showing the limits
of operation for a given drop in efficiency or for a specific loss in power output.
Although the parameter sigma was developed to characterize the
performance of hydraulic turbines, it is equally useful with pumps. For pumps,
it is used in the form of Eq. (8.25). In current practice, the evaluation ofHsv varies
slightly depending on whether the pump is supplied directly from a forebay with
a free surface or forms a part of a closed system. In the former case, Hsv is
calculated by neglecting forebay velocity and the friction loss between the
forebay and the inlet, just as the tailrace velocity and friction loss between the
turbine-runner discharge and tail water are neglected. In the latter case, Hsv is
calculated from the pressure measured at the inlet. Velocity is assumed to be the
average velocity, Q/A. Because of this difference in meaning, if the same
Cavitation in Hydraulic Machinery 337
Copyright 2003 by Marcel Dekker, Inc. All Rights Reserved

machine was tested under both types of installation, the results would apparently
show a slightly poor cavitation performance with the forebay.
8.8.2 Sigma Tests
Most of the detailed knowledge of the effect of cavitation on the performance of
hydraulic machines has been obtained in the laboratory, because of the difficulty
encountered in nearly all field installations in varying the operating conditions
over a wide enough range. In the laboratory, the normal procedure is to obtain
data for the plotting of a group of sT curves. Turbine cavitation tests are best
Figure 8.5 Experience limits of plant sigma vs. specific speed for hydraulic turbines.
Chapter 8338
Copyright 2003 by Marcel Dekker, Inc. All Rights Reserved

run by operating the machine at fixed values of turbine head, speed, and guide-
vane setting. The absolute-pressure level of the test system is the independent
variable, and this is decreased until changes are observed in the machine
performance. For a turbine, these changes will appear in the flow rate, the power
output, and the efficiency. In some laboratories, however, turbine cavitation
tests are made by operating at different heads and speeds, but at the same unit
head and unit speed. The results are then shown as changes in unit power, unit
flow rate, and efficiency.
If the machine is a pump, cavitation tests can be made in two ways. One
method is to keep the speed and suction head constant and to increase the
discharge up to a cutoff value at which it will no longer pump. The preferable
method is to maintain constant speed and flow rate and observe the effect of
suction pressure on head, power (or torque), and efficiency as the suction pressure
is lowered. In such cases, continual small adjustments in flow rate may be
necessary to maintain it at constant value.
Figure 8.6 shows curves for a turbine, obtained by operating at constant
head, speed, and gate. Figure 8.7 shows curves for a pump, obtained from tests at
constant speed and flow rate. These curves are typical in that each
performance characteristic shows little or no deviation from its normal value
Figure 8.6 Sigma curves for a hydraulic turbine under constant head, speed, and gate
opening. (Normal torque, head, and discharge are the values at best efficiency and high
sigma.)
Cavitation in Hydraulic Machinery 339
Copyright 2003 by Marcel Dekker, Inc. All Rights Reserved
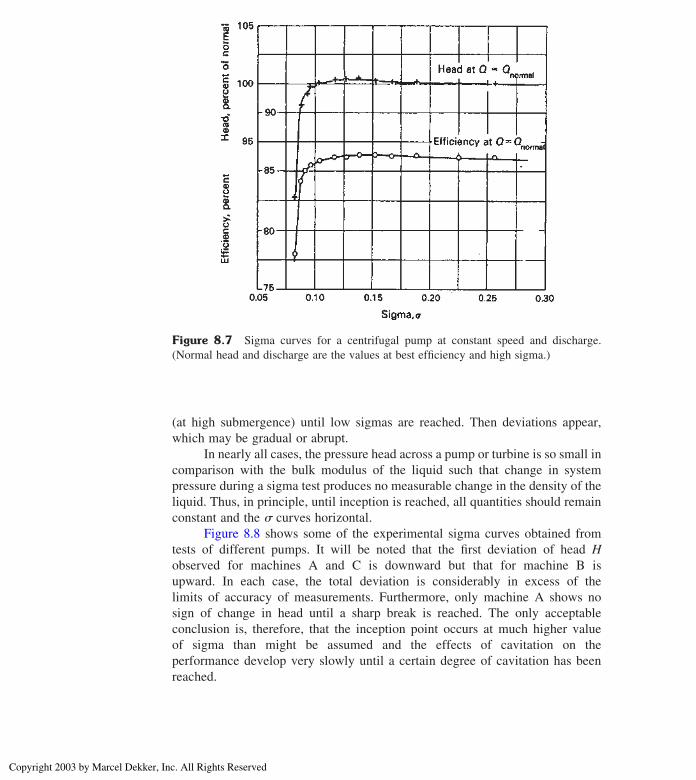
(at high submergence) until low sigmas are reached. Then deviations appear,
which may be gradual or abrupt.
In nearly all cases, the pressure head across a pump or turbine is so small in
comparison with the bulk modulus of the liquid such that change in system
pressure during a sigma test produces no measurable change in the density of the
liquid. Thus, in principle, until inception is reached, all quantities should remain
constant and the s curves horizontal.
Figure 8.8 shows some of the experimental sigma curves obtained from
tests of different pumps. It will be noted that the first deviation of head H
observed for machines A and C is downward but that for machine B is
upward. In each case, the total deviation is considerably in excess of the
limits of accuracy of measurements. Furthermore, only machine A shows no
sign of change in head until a sharp break is reached. The only acceptable
conclusion is, therefore, that the inception point occurs at much higher value
of sigma than might be assumed and the effects of cavitation on the
performance develop very slowly until a certain degree of cavitation has been
reached.
Figure 8.7 Sigma curves for a centrifugal pump at constant speed and discharge.
(Normal head and discharge are the values at best efficiency and high sigma.)
Chapter 8340
Copyright 2003 by Marcel Dekker, Inc. All Rights Reserved

8.8.3 Interpretation of Sigma Tests
The sigma tests described are only one specialized use of the parameter. For
example, as already noted, sigma may be used as a coordinate to plot the results
of several different types of experience concerning the effect of cavitation of
machines. Even though sigma tests are not reliable in indicating the actual
inception of cavitation, attempts have often been made to use them for this
purpose on the erroneous assumption that the first departure from the
noncavitating value of any of the pertinent parameters marks the inception of
cavitation. The result of this assumption has frequently been that serious
cavitation damage has been observed in machines whose operation had always
been limited to the horizontal portion of the sigma curve.
Considering strictly from the effect of cavitation on the operating
characteristics, the point where the sigma curve departs from the horizontal may
Figure 8.8 Comparison of sigma curves for different centrifugal pumps at constant
speed and discharge. (Normal head and discharge are the values at best efficiency and
high sigma.)
Cavitation in Hydraulic Machinery 341
Copyright 2003 by Marcel Dekker, Inc. All Rights Reserved
be designed as the inception of the effect. For convenience in operation, points
could be designated as siP, si, siH, or siQ, which would indicate the values of si
for the specified performance characteristics. In Fig. 8.8, such points are marked
in each curve. For pumps A and C, the indicated siH is at the point where the head
has decreased by 0.5% from its high sigma value. For pump B, siH is shown
where the head begins to increase from its high sigma value.
The curves of Fig. 8.8 show that at some lower limiting sigma, the curve of
performance finally becomes nearly vertical. The knee of this curve, where the
drop becomes very great, is called the breakdown point. There is remarkable
similarity between these sigma curves and the lift curves of hydrofoil cascades. It
is interesting to note that the knee of the curve for the cascade corresponds
roughly to the development of a cavitation zone over about 10% of the length of
the profile and the conditions for heavy vibrations do not generally develop until
after the knee has been passed.
8.8.4 Suction Specific Speed
It is unfortunate that sigma varies not only with the conditions that affect
cavitation but also with the specific speed of the unit. The suction specific speed
represents an attempt to find a parameter, which is sensitive only to the factors
that affect cavitation.
Specific speed as used for pumps is defined as
Ns ¼ NffiffiffiffiQ
pH 3=4
ð8:34Þ
where N is the rotating speed, Q the volume rate of flow, and H the head
differential produced by pump.
Suction specific speed is defined as
S ¼ NffiffiffiffiQ
pH3=4
sv
ð8:35Þ
where Hsv is the total head above vapor at pump inlet. Runners in which
cavitation depends only on the geometry and flow in the suction region will
develop cavitation at the same value of S. Presumably, for changes in the outlet
diameter and head produced by a Francis-type pump runner, the cavitation
behavior would be characterized by S. The name “suction specific speed” follows
from this concept. The parameter is widely used for pumping machinery but has
not usually been applied to turbines. It should be equally applicable to pumps and
turbines where cavitation depends only on the suction region of the runner. This
is more likely to be the case in low-specific-speed Francis turbines. The following
relation between specific speed (as used for pumps), suction specific speed, and
Chapter 8342
Copyright 2003 by Marcel Dekker, Inc. All Rights Reserved

sigma is obtained from Eqs. (8.34) and (8.35).
Ns–pump
S¼ Hsv
H
� �3=4
¼ s3=4sv ð8:36Þ
A corresponding relation between specific speed as used for turbines, suction
specific speed, and sigma can be obtained from Eqs. (8.33) and (8.35) together
with the expression
hp ¼ htgQH
550
where ht is the turbine efficiency.
Then
Ns– turb
S¼ s3=4
sv
htg
550
� �1=2 ð8:37ÞIt is possible to obtain empirical evidence to show whether or not S actually
possesses the desirable characteristic for which it was developed, i.e., to offer a
cavitation parameter that varies only with the factors that affect the cavitation
performance of hydraulic machines and is independent of other design
characteristics such as total head and specific speed. For example, Fig. 8.9
Figure 8.9 Sigma vs. specific speed for centrifugal, mixed-flow, and propeller pumps.
Cavitation in Hydraulic Machinery 343
Copyright 2003 by Marcel Dekker, Inc. All Rights Reserved

shows a logarithmic diagram of sigma vs. specific speed on which are plotted
points showing cavitation limits of individual centrifugal, mixed-flow, and
propeller pumps. In the same diagram, straight lines of constant S are shown, each
with a slope of ðlogssvÞ=ðlogNsÞ ¼ 3=4 [Eq. (8.36)]. It should be noted that ssv
and S vary in the opposite direction as the severity of the cavitation condition
changes, i.e., as the tendency to cavitate increases, ssv decreases, but S increases.
If it is assumed that as the type of machine and therefore the specific speed
change, all the best designs represent an equally close approach to the ideal
design to resist cavitation, then a curve passing through the lowest point for each
given specific speed should be a curve of constant cavitation performance.
Currently, the limit for essentially cavitation-free operation is approximately
S ¼ 12,000 for standard pumps in general industrial use. With special designs,
pumps having critical S values in the range of 18,000–20,000 are fairly common.
For cavitating inducers and other special services, cavitation is expected and
allowed. In cases where the velocities are relatively low (such as condensate
pumps), several satisfactory designs have been reported for S in the 20,000–
35,000 range.
As was explained, Fig. 8.5 shows limits that can be expected for
satisfactory performance of turbines. It is based on experience with installed units
and presumably represents good average practice rather than the optimum. The
line for Francis turbines has been added to Fig. 8.9 for comparison with pump
experience. Note that allowable S values for turbines operating with little or no
cavitation tend to be higher than those for pumps when compared at their
respective design conditions. Note also that the trend of limiting sigma for
turbines is at a steeper slope than the constant S lines. This difference of slope can
be taken to indicate that either the parameter S is affected by factors other than
those involved in cavitation performance or the different specific-speed designs
are not equally close to the optimum as regards cavitation. The latter leads to the
conclusion that it is easier to obtain a good design from the cavitation point of
view for the lower specific speeds.
NOTATION
a Acceleration
A Area
Cp Pressure coefficient
E Modulus of elasticity
h Elevation
H Head
K Cavitation parameter
KE Kinetic energy
N Rotation speed
Chapter 8344
Copyright 2003 by Marcel Dekker, Inc. All Rights Reserved
Ns Specific speed
p Pressure
Q Flow rate
r Radial distance
rm Mean radius
R Radius of cavity wall
S Suction specific speed
t Time
u Velocity
V Velocity
Z Dimensionless volume of bubble
r Density
ht Turbine efficiency
g Specific weight
t0 Dimensionless time
s Cavitation parameter
SUFFIXES
0 Undisturbed fluid properties
atm Atmospheric values
d Dynamic effects
e Exit
f Friction
i Inception properties
min Minimum
r Radial
s Static
v vapor
Cavitation in Hydraulic Machinery 345
Copyright 2003 by Marcel Dekker, Inc. All Rights Reserved