Embed Size (px)
Citation preview

Cautionary Notes
2
This presentation includes certain "Forward-Looking Statements” as that term is used in applicable securities law. All statements included herein, other than statements of historical fact, including, without limitation, statements regarding potential mineralization and resources, exploration results, and future plans and objectives of Oceanic Iron Ore Corp. (“Oceanic”, or the “Company”), are forward-looking statements that involve various risks and uncertainties. In certain cases, forward-looking statements can be identified by the use of words such as "plans", "expects" or "does not expect", "scheduled", "believes", or variations of such words and phrases or statements that certain actions, events or results “potentially”, "may", "could", "would", "might" or "will" be taken, occur or be achieved. There can be no assurance that such statements will prove to be accurate, and actual results could differ materially from those expressed or implied by such statements. Forward-looking statements are based on certain assumptions that management believes are reasonable at the time they are made. In making the forward-looking statements in this presentation, the Company has applied several material assumptions, including, but not limited to, the assumption that: (1) there being no significant disruptions affecting operations, whether due to labour/supply disruptions, damage to equipment or otherwise; (2) permitting, development, expansion and power supply proceeding on a basis consistent with the Company's current expectations; (3) certain price assumptions for iron ore; (4) prices for availability of natural gas, fuel oil, electricity, parts and equipment and other key supplies remaining consistent with current levels; (5) the accuracy of current mineral resource estimates on the Company's property; and (6) labour and material costs increasing on a basis consistent with the Company's current expectations. Important factors that could cause actual results to differ materially from the Company's expectations are disclosed under the heading "Risks and Uncertainties " in the Company’s MD&A filed February 23rd, 2017 (a copy of which is publicly available on SEDAR at www.sedar.com under the Company's profile) and elsewhere in documents filed from time to time, including MD&A, with the TSX Venture Exchange and other regulatory authorities. Such factors include, among others, risks related to the ability of the Company to obtain necessary financing and adequate insurance; the economy generally; fluctuations in the currency markets; fluctuations in the spot and forward price of iron ore or certain other commodities (e.g., diesel fuel and electricity); changes in interest rates; disruption to the credit markets and delays in obtaining financing; the possibility of cost overruns or unanticipated expenses; employee relations. Accordingly, readers are advised not to place undue reliance on Forward-Looking Statements. Except as required under applicable securities legislation, the Company undertakes no obligation to publicly update or revise Forward-Looking Statements, whether as a result of new information, future events or otherwise.
Eddy Canova, P.Geo., OGQ (403), the Director of Exploration for the Company and a Qualified Person as defined by NI 43-101, has reviewed and is responsible for the technical information contained in this presentation.

3
Corporate Overview
Capitalization Summary (April 17, 2017)
Shares in Issue 49,962,813
Warrants ($0.30) 4,925,000
Options ($0.15 - $0.25) 4,955,950
Convertible Debenture ($0.43) 4,710,067
Restricted Share Units 766,666
Fully Diluted 65,320,496
Listings FEO (TSX-V)

Company Overview
4
• Iron ore development in the Labrador Trough (Québec)
• Led by a highly experienced management team that has managed, operated developed and/or sold over $20 bn in assets
• 100% owned Ungava Bay projects - Hopes Advance, Morgan Lake, Roberts Lake
• Largest single concession holder in Québec focusing on iron ore – 3,703 mining titles over 1,568 km2
• Currently advancing Hopes Advance project through Feasibility Study
• Agreement with Power China on the framework for future development of the Hopes Advance project – August 2016

Hopes Advance 66.5% Fe Pellets
HOPES ADVANCE PROJECT - A World Class Premium Product Iron Ore Project
• World Class Iron Ore Reserves
• Lowest Quartile Costs
• Best in Class Management
• Superior Quality Product
• Stands Up in All Price Cycles
Iron Ore Carrier
5

Hopes Advance – The Premier High Quality, Low Cost Iron Ore Project in North America
6
Robust Pre-Feasibility Study*
Economics
• Base case pre-tax NPV of $5.6bn and unlevered IRR of 20.5%
• Life of mine operating cost $30/tonne, potential to become one of the world’s lowest operating cost iron ore producers
Compelling Infrastructure
Advantage
• Located on the coast, no rail infrastructure – significant capex and opex savings
• Independence and self-reliance over development of power and port infrastructure and implementation of project schedule
Large Scale Deposit • Scale – 1.36 bn Proven and Probable Reserves**
• Low mining costs with strip ratio of 0.5:1 in years 1 to 15
Straightforward Metallurgy
• High weight and iron recoveries with simple flowsheet
• Extensive bench scale and pilot plant testing suggest high quality product with 4.5% silica, very low other impurities and 66.5% iron grade
Strategic Partner Appeal
• LOI’s in place with Québec government and Inuit Community
• Low costs and “no rail” infrastructure advantage combined with scale and a high quality product are unique and desirable qualities that have wide appeal amongst steel companies globally
• EPC Framework Agreement established with Power China International
* See slide 7
** See slide 12

Hopes Advance Pre-Feasibility Highlights (September 2012)
7
Variable PFS Highlights
FOB Price $100/tonne
CAD:USD $1.00
LOM operating cost $30.18/tonne
Pre-tax NPV (8%) $5.6bn
Post-Tax NPV (8%) $3.2 bn
Pre-tax IRR (levered) 23.2%
Post-tax IRR (levered) 19.2%
Initial Capital Cost $2.85 bn
Expansion Capital Cost $1.61 bn
Strip Ratio Years 1 - 15 0.57
Strip Ratio LOM 1.17
• Phase 1 production of 10 million tpa to year 10
• Expansion to 20 million tpa production thereafter
• Expected mine life of 31 years
• Since 2012 higher CAD$ exchange rate and lower fuel prices offset a significant portion of the decline in iron prices and the project remains attractive

Significant Progress to Date
8 *See slide 12
• Technical
• Pilot plant testwork and flowsheet development
• Pre-Feasibility Study in respect of Hopes Advance completed
• Proven and probable mineral reserves* established
• Project Optimization
• Product Value in Use Marketing Study
• Product Optimization Study
• Shipping Optimization Study
• Stakeholder Partnerships
• LOI signed with Inuit community
• LOI received from the Ministry of Finance and Economy of the Québec Government for Investment in Hopes Advance Project
• EPC Framework Agreement executed with Power China International charters a clear line of sight to financing and construction

2016/7 – Breakthrough Framework Agreement with Power China International
9
• Power China is a large Chinese State Owned Enterprise with the skills, knowledge, and experience to execute on the project’s EPC requirements
• Power China’s interest is developing business in North America
• The company has USD $77 billion in assets and 200,000 employees
• Power China will facilitate financing and assist with off take agreements with Chinese steel producers
• EPC Proposal Letter received March 30, 2017
• No material deviations in scope, methodology and capital costs from the Pre-Feasibility Study
• Front End Engineering Design (FEED) Study Proposed to assess execution of design, construction and operation in more detail
• Expected to lead to an EPC contract, project financing and construction
• Power China has dedicated a team of 25 to the project

Current Global Sources Are Creating Demand For Higher Quality Supply
10
• Quality of major supply sources has declined and the decline continues
• Japanese market has focused on high quality flat carbon and stainless steel products to meet consumer demand. All Japanese steel producers currently cite quality concerns with existing iron ore supply
• The problem gets amplified with retooling in China to transform some existing long steel capacity to flat steel to meet growing domestic consumer demands
• Increased Chinese export of automotive and white goods will create additional future demand
• The trajectory in respect of steel production supports higher premiums for flat steel products than have been observed during the past decade – Vale blend confirms this
• The corresponding decrease in iron ore quality supports markedly higher future premiums for iron ore products containing very low impurities. Canada is one of the best supply sources for high quality products
• Notwithstanding cyclical pricing issues related to volume oversupply declining quality represents a structural change in the global market

Next Steps
11
Development Activity Target Completion Date
Strategic Partnering, FEED Study Commencement, and Project Financing
2017
Completion of Environmental Impact Study 2017 / 2018
Negotiate impact benefits agreement with local stakeholders
2017
Project Construction 2019 – 21
Production 2021- 2052+

Hopes Advance Mineral Reserve
12
Category Tonnes Total Fe (%) Weight Recovery (%)
Proven Reserves 763,276,000 32.3% 37.4%
Probable Reserves 595,990,000 32.1% 37.1%
Proven and Probable
Reserves 1,359,266,000 32.2% 37.3%
MINERAL RESERVES (25% Fe cut-off)
Disclosure:
• Open pit reserves are based on a 25% Fe cut off grade
• Reserves calculated based on industry standard pit optimization techniques guiding detailed pit designs including ramps and surface constraints. The mineral reserve is contained within the mineral resource. The effective date of the mineral reserve estimate is September 19, 2012
• Excludes inferred resources of approximately 72.7 million tonnes of 32.8% Fe. Mineral resources that are not mineral reserves do not have demonstrated economic viability.
• There are no known legal, political, environmental or other risks that could materially affect the potential development of the mineral reserve.

Hopes Advance Images
13
Castle Mountain
Camp Drill Core
Zone 2

Hopes Advance Metallurgy
14
Bench – Scale Testwork
April 2012
• 600 samples across all deposits at Hopes Advance
• Demonstrated high weight recoveries with high percentage of iron recovery from gravity process
• Simple process flow sheet with high grade 66.5% concentrate
• Very low levels of deleterious materials, ≤4.5% Silica
Pilot Plant Testwork and
Flowsheet Development
September 2012
• Based on 10 tonne and 250 tonne composite samples from Hopes Advance
• Simple flowsheet
Attributes
• Minus 300 micron (minus 50 mesh) coarse grind liberates 87% of Fe units
• Remaining 13% upgraded through fine grind and magnetic separation
• Low processing cost, results from low grind and low power requirements

Hopes Advance Flowsheet – Simple Metallurgy
15
Spiral Tails
%Fe 19.7%
%SiO2 59.2%
Wt% 68.5%
Gyratory Crusher Primary Grinding
Gravity Separation Magnetic Separation
Port
Gravity Concentrate
%Fe 65.9%
%SiO2 4.8%
Wt% 31.5%
Mag Concentrate
%Fe 70%
%SiO2 3.0%
Wt% 6.1%
Final Concentrate
%Fe 66.6%
%SiO2 4.5%
Wt% 37.6%
%Mn 0.22%
P80 128 um 84% of concentrate
Primary Grinding
%Fe 34.2%
%SiO2 42.1%
Wt% 100%
Grind 300um
Note: Based on Pilot Plant scale testwork in respect of the Castle Mountain deposit which supports at least the first 15 years of production
16% of concentrate
• High weight and Fe recoveries using a simple flowsheet
Cobber LIMS Con
%Fe 40.0%
%SiO2 40.8%
Wt% 13.5%
Fin
al T
ails
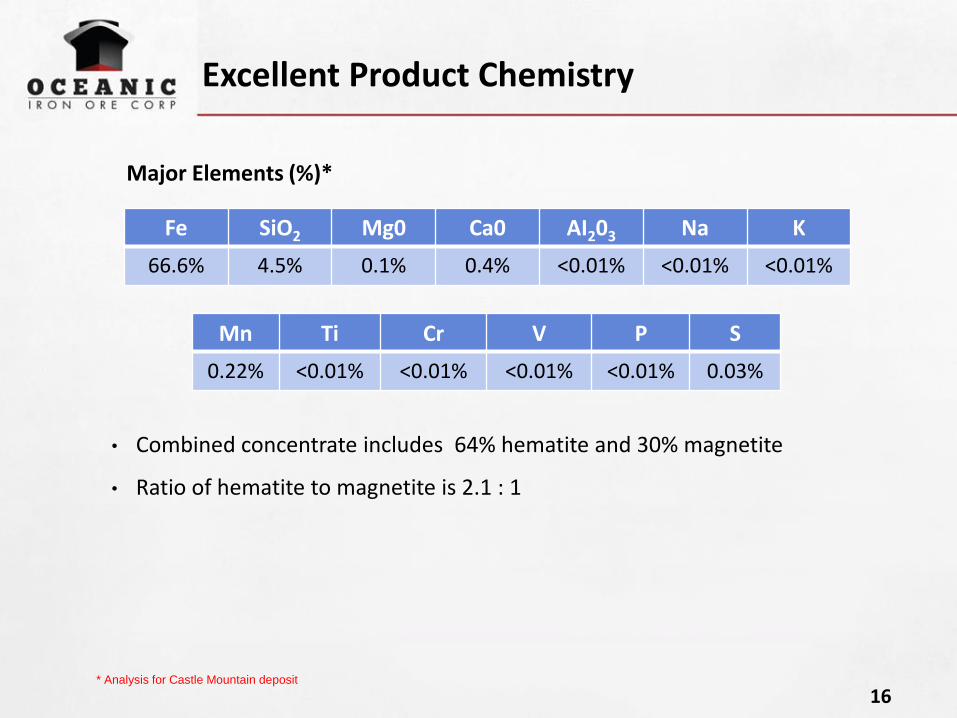
Excellent Product Chemistry
16
Fe SiO2 Mg0 Ca0 AI203 Na K
66.6% 4.5% 0.1% 0.4% <0.01% <0.01% <0.01%
Mn Ti Cr V P S
0.22% <0.01% <0.01% <0.01% <0.01% 0.03%
• Combined concentrate includes 64% hematite and 30% magnetite
• Ratio of hematite to magnetite is 2.1 : 1
* Analysis for Castle Mountain deposit
Major Elements (%)*

High Quality Product
17
• High quality product with amongst the lowest alumina and phos content
• Positive impact on blast furnace performance and overall operating and capital costs
Source: Alderon Iron Ore, Sept 2012
Alumina - %AIO2O3 Phosphorus - %P
Source: Alderon Iron Ore, Sept 2012

Hopes Advance Site Layout
18
• No rail requirement
Aupaluk
Ungava
Bay
Hopes Advance Bay
Pointe
Breakwater
Bay Zone
CDEF
Iron
Valley
West Zone
McDonald
Tailings
Facility
Concentrator,
Truck Shop, &
Camp
Power Generation
Port
Ungava Bay ProjectNorthern Quebec
Hopes Advance Site Layout
Date: September 17, 2012
Oceanic Iron Ore Claims
Restricted Land
Pipeline & Access Road
Pit Designs
Access Haul Roads
0 2500 5000Distance in meters

Port & Shipping Logistics
19
• September 2013 – results of Shipping Optimization Study led by AMEC
• Includes input from shipping & transshipment companies as well as port authorities:
• Fednav Limited • Canada Steamship Lines • Europees Massagoed Overslagbedrijf
• Shipping strategy is technically feasible • Direct shipments during ice free
months • Transshipment during winter months
• CFR Cash Costs under $65/tonne (including shipping) to the port of Qingdao China
• Decrease in bunker price since Optimization Study was completed results in approximately $5/ tonne reduction in average annual shipping costs
• Ports considered: Nuuk, Rotterdam & St. Pierre & Miquelon
Pointe Breakwater Port Site
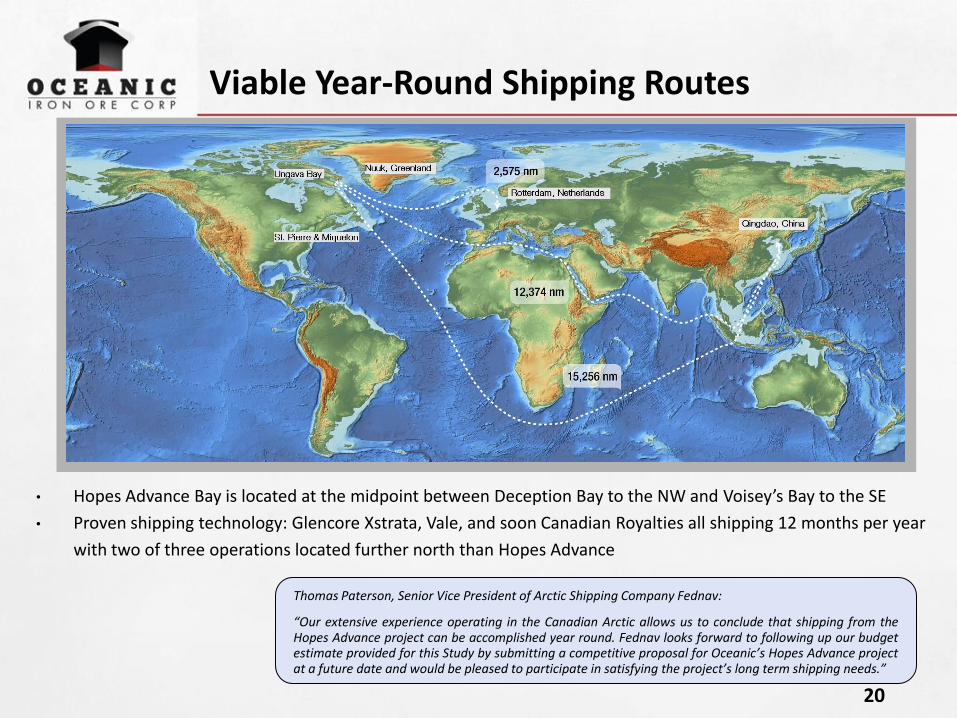
Viable Year-Round Shipping Routes
20
• Hopes Advance Bay is located at the midpoint between Deception Bay to the NW and Voisey’s Bay to the SE
• Proven shipping technology: Glencore Xstrata, Vale, and soon Canadian Royalties all shipping 12 months per year
with two of three operations located further north than Hopes Advance
Thomas Paterson, Senior Vice President of Arctic Shipping Company Fednav:
“Our extensive experience operating in the Canadian Arctic allows us to conclude that shipping from the Hopes Advance project can be accomplished year round. Fednav looks forward to following up our budget estimate provided for this Study by submitting a competitive proposal for Oceanic’s Hopes Advance project at a future date and would be pleased to participate in satisfying the project’s long term shipping needs.”

Social and Environmental Considerations
21
• A corporate philosophy and first consideration in Hope’s Advance development
• Clear communication and buy-in required from employees, consultants
and contractors
• Early stakeholder and government interaction
• LOI agreed with Inuit community
• Focus on addressing the needs of local
people while also respecting the culture
and environment
• Set a standard against which future
projects across the industry are measured

22
• Driven by global population growth
• China will lead, however India and growth in other geographic regions also contributors
Global Steel Production to Increase 50% by 2021
• Growth in global construction sector projected at +70% by 2025
• Economic iron ore resources in China declining with 40% of China’s capacity deemed uneconomic by 2018
• Next cycle will be defined by low cost, high quality production streams

China Steel Demand Robust & Growing Over Medium - Long Term
• China’s cumulative steel consumption per capita remains well behind developed world
• New and replacement consumption will drive future growth focused in automotive, machinery and “white” products such as appliances, air conditioners, etc.
23
Source: Rio Tinto

Supply Cost CIF China
Source: Macquarie Research, Oct 2014
24
“The National Development and Reform Commission on February 3, 2014 said Chinese steelmakers should keep building
up stakes in global iron-ore assets in the interests of China's strategic security and "speaking rights," or influence, in global trade. China's ore imports rose 10% last year to a record 819 million metric tons, according to customs data”
Hopes Advance <$65/t

China’s Increasing Importance as an Iron Ore Importer
25

World Iron Ore Export Sources
26

Low Operating Cost Relative to Peers
27
* 15 mtpa production ** Also expected to produce 61.5% DSO and 68% pellet feed *** Also expected to produce 67% concentrate
$25.00
$30.18
$31.07
$35.20
$42.17
$49.13
$43.97
$44.05
$59.26
$0.00 $10.00 $20.00 $30.00 $40.00 $50.00 $60.00 $70.00
Zanaga Iron Ore
Oceanic Iron Ore
Adriana Resources
Afferro Mining*
Alderon Iron Ore
Advanced Explorations
Black Iron
Champion Iron Mines
Iron Road Limited
65%+ S INTER FEED
67% CONCENTRATE
67% PELLET FEED
66% CONCENTRATE
65.5% CONCENTRATE
65% S INTER FEED**
PELLETS
66.5% CONCENTRATE
65% S INTER FEED***
Operating Cost ($/t)

Hopes Advance – The Premier Iron Ore Development Project
28
• Exceptional large scale resource in low risk jurisdiction
• Low cost producer: $30/tonne life of mine
• High grade (66.5%) premium iron concentrate for seaborne market
• Low impurities = high quality source of supply
• Fast track development schedule independent of 3rd party infrastructure and government funding
"The cash costs estimates are low relative to Canadian peers and reflect the low 1.17:1 strip ratio at Hopes Advance, particularly in the earlier years (0.57:1 in years 1 to 15) and the proximity of the deposit and infrastructure to the targeted port site. Oceanic plans to utilize a 26km pipeline to slurry iron ore concentrate from the mill to the planned port site on Ungava Bay. The short distance to tidewater and no need for rail transportation have a significantly positive impact on operating costs compared to peers."
Daniel Greenspan, Macquarie Capital Markets Canada, July 2013
APPENDICES
30
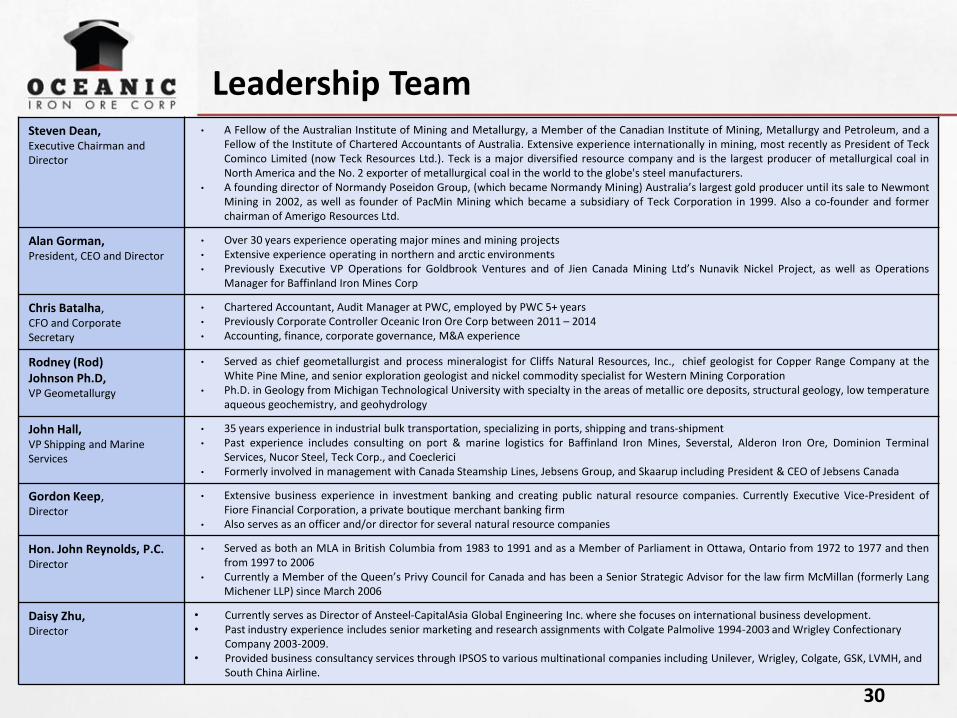
Leadership Team Steven Dean, Executive Chairman and Director
• A Fellow of the Australian Institute of Mining and Metallurgy, a Member of the Canadian Institute of Mining, Metallurgy and Petroleum, and a Fellow of the Institute of Chartered Accountants of Australia. Extensive experience internationally in mining, most recently as President of Teck Cominco Limited (now Teck Resources Ltd.). Teck is a major diversified resource company and is the largest producer of metallurgical coal in North America and the No. 2 exporter of metallurgical coal in the world to the globe's steel manufacturers.
• A founding director of Normandy Poseidon Group, (which became Normandy Mining) Australia’s largest gold producer until its sale to Newmont Mining in 2002, as well as founder of PacMin Mining which became a subsidiary of Teck Corporation in 1999. Also a co-founder and former chairman of Amerigo Resources Ltd.
Alan Gorman, President, CEO and Director
• Over 30 years experience operating major mines and mining projects • Extensive experience operating in northern and arctic environments • Previously Executive VP Operations for Goldbrook Ventures and of Jien Canada Mining Ltd’s Nunavik Nickel Project, as well as Operations
Manager for Baffinland Iron Mines Corp
Chris Batalha, CFO and Corporate Secretary
• Chartered Accountant, Audit Manager at PWC, employed by PWC 5+ years • Previously Corporate Controller Oceanic Iron Ore Corp between 2011 – 2014 • Accounting, finance, corporate governance, M&A experience
Rodney (Rod) Johnson Ph.D, VP Geometallurgy
• Served as chief geometallurgist and process mineralogist for Cliffs Natural Resources, Inc., chief geologist for Copper Range Company at the White Pine Mine, and senior exploration geologist and nickel commodity specialist for Western Mining Corporation
• Ph.D. in Geology from Michigan Technological University with specialty in the areas of metallic ore deposits, structural geology, low temperature aqueous geochemistry, and geohydrology
John Hall, VP Shipping and Marine Services
• 35 years experience in industrial bulk transportation, specializing in ports, shipping and trans-shipment • Past experience includes consulting on port & marine logistics for Baffinland Iron Mines, Severstal, Alderon Iron Ore, Dominion Terminal
Services, Nucor Steel, Teck Corp., and Coeclerici • Formerly involved in management with Canada Steamship Lines, Jebsens Group, and Skaarup including President & CEO of Jebsens Canada
Gordon Keep, Director
• Extensive business experience in investment banking and creating public natural resource companies. Currently Executive Vice-President of Fiore Financial Corporation, a private boutique merchant banking firm
• Also serves as an officer and/or director for several natural resource companies
Hon. John Reynolds, P.C. Director
• Served as both an MLA in British Columbia from 1983 to 1991 and as a Member of Parliament in Ottawa, Ontario from 1972 to 1977 and then from 1997 to 2006
• Currently a Member of the Queen’s Privy Council for Canada and has been a Senior Strategic Advisor for the law firm McMillan (formerly Lang Michener LLP) since March 2006
Daisy Zhu, Director
• Currently serves as Director of Ansteel-CapitalAsia Global Engineering Inc. where she focuses on international business development. • Past industry experience includes senior marketing and research assignments with Colgate Palmolive 1994-2003 and Wrigley Confectionary
Company 2003-2009. • Provided business consultancy services through IPSOS to various multinational companies including Unilever, Wrigley, Colgate, GSK, LVMH, and
South China Airline.

UNGAVA PROPERTY PROJECT AREAS 3,703 CLAIMS – 1,568 SQ.KM.
31

Conceptual Port Location
32
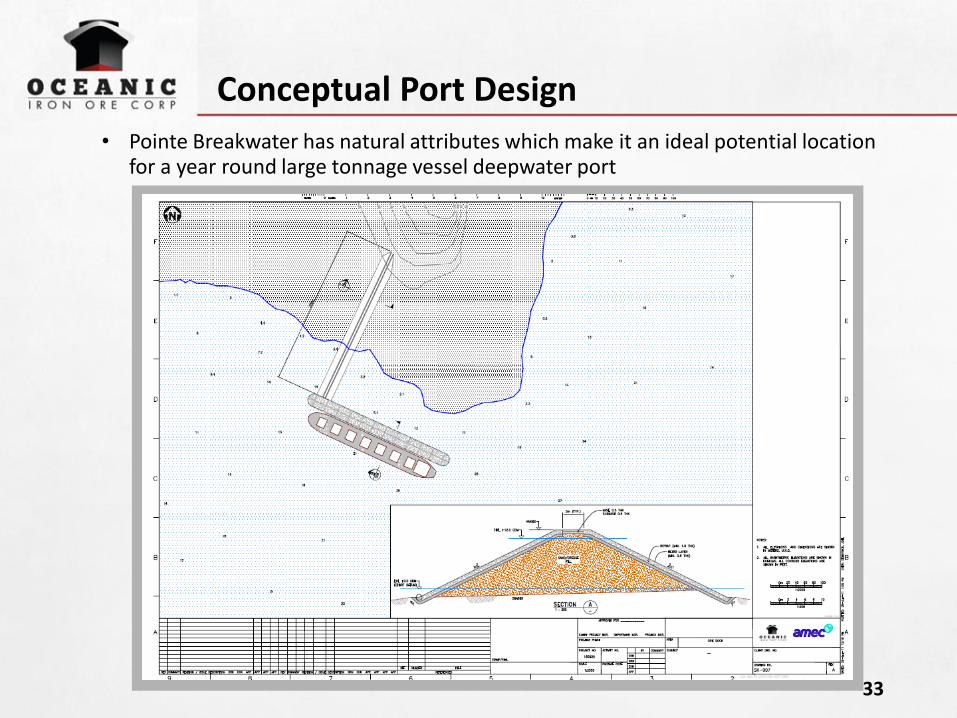
Conceptual Port Design
33
• Pointe Breakwater has natural attributes which make it an ideal potential location for a year round large tonnage vessel deepwater port

Conceptual Shiploader Design
34
• Shiploader will be engineered and constructed to accommodate the tides in Ungava Bay

Trans-shipment
Floating Transfer
Station Export vessel
• Floating transfer station with deck mounted equipment to transfer cargo from ice class vessels to export vessel
35
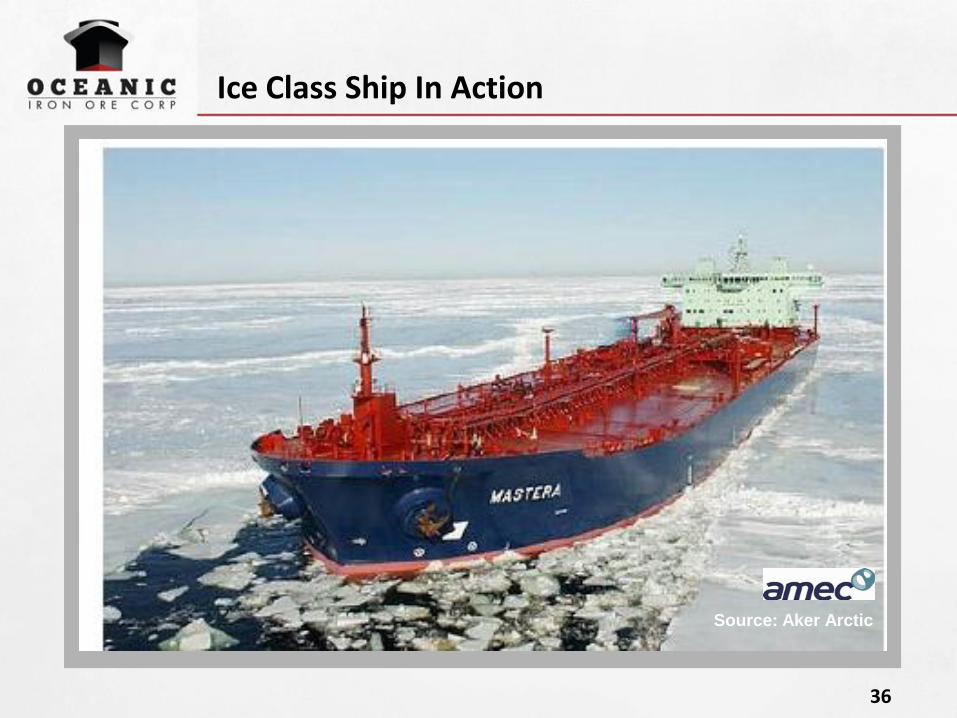
Ice Class Ship In Action
Source: Aker Arctic
36

Section View of the Castle Mountain Grid
37
Previous Work
38
• Labrador Trough noted for iron potential in 1895 by GSC
• First claims staked in Hopes Advance area in 1951
• 1950-1970 active exploration including sampling, trenching, drilling, metallurgical
testwork
• Ungava Iron Ores Company completed most of the exploration in Hopes Advance area
(1951-1962) including 12,935 m in 185 holes in 8 deposits. Scoping and pre-feasibility
studies were completed
• International Iron Ores Limited exploration of the Roberts Lake area (1952-1957)
including 5,115 m in 97 holes in 6 deposits
• Oceanic Iron Ores Company was active in the Morgan Lake area (1955-1957) and work
included 3,611 m in 45 holes in 2 deposits

Roberts Lake – Historical Resource*
39
Deposit
Crude Resource
(million metric
tonnes)
Head Iron
(Sol. Fe)
Exploration
Drillholes
Metres
Drilled Source Date
Kayak Bay Zone (Zone 1) 111.7 35.3% 45 1,880 P.E. Cavanagh 1970
Payne River (Zone 2) 22.3 31.0% 26 2,535 P.E. Cavanagh 1970
Igloo Lake (Zone 3) 101.6 38.0% 11 248 P.E. Cavanagh 1970
Hump (Zone 4) 203.2 37.6% 15 452 P.E. Cavanagh 1970
Total Drill Indicated 438.8 36.8% 97 5,115 --- ---
Synclinal (Zone 5) 203.2 36.0% 0 0 P.E. Cavanagh 1970
Yvon Lake (Zone 6) 101.6 36.8% 0 0 P.E. Cavanagh 1970
Potential Zone 1 254.0 35.0% 0 0 P.E. Cavanagh 1970
Potential Zone 2 254.0 35.0% 0 0 P.E. Cavanagh 1970
Total Potential 812.8 35.5% 0 0 --- ---
Total Roberts Lake Area 1,251.6 35.9% 97 5,115 --- ---
*These are historical resource estimates that do not comply with the current Canadian Institute of Mining, Metallurgy and Petroleum Resources (CIM) Definition Standards on Mineral Resources and Mineral Reserves as required by National Instrument 43-101 (NI 43-101) Standards of Disclosure for Mineral Projects. These historical resource estimates were described as “drill indicated” and “potential” at the time of reporting which does not correspond to the categorization set forth in sections 1.2 and 1.3 of NI 43-101. Although these historical resource estimates are relevant to support the presence of large areas of iron mineralization, these estimates are speculative, are based on very limited exploration drilling and will require extensive new exploration and metallurgical efforts to validate. They should not be treated as current mineral resources or reserves or relied upon until confirmed by current exploration and a Qualified Person. A Qualified Person has not done sufficient work to upgrade or classify these historical resource estimates as current NI-43-101 compliant mineral resources. The Roberts Lake historic resource was reported in 1970 from drilling in the late 1950s, the Morgan Lake historic resource was reported in 1957 and 1964, and the Hopes Advance historic resource was reported in 1958. Further information in respect of these historic resources is outlined in a 43-101 technical report prepared by Micon entitled “Technical Report on the Ungava Iron Property – Ungava Bay Region, Quebec, Canada dated Oct. 29, 2010, available on SEDAR.

Morgan Lake – Historical Resource*
40
Deposit
Crude Resource
(million metric
tonnes)
Head Iron
(Mag. Fe)
Exploration
Drillholes
Metres
Drilled Source Date
Payne Range 72.4 23.9% 29 1,427 G.A. Gross 1964
Morgan Lake 437.8 21.8% 16 2,184 A.T. Griffis 1957
Total Drill Indicated 510.2 22.1% 45 3,611 --- ---
Morgan Lake Potential 101.6 22.7% 0 0 A.T. Griffis 1,957
Total Morgan Lake Area 611.8 22.2% 45 3,611 --- ---
*These are historical resource estimates that do not comply with the current Canadian Institute of Mining, Metallurgy and Petroleum Resources (CIM) Definition Standards on Mineral Resources and Mineral Reserves as required by National Instrument 43-101 (NI 43-101) Standards of Disclosure for Mineral Projects. These historical resource estimates were described as “drill indicated” and “potential” at the time of reporting which does not correspond to the categorization set forth in sections 1.2 and 1.3 of NI 43-101. Although these historical resource estimates are relevant to support the presence of large areas of iron mineralization, these estimates are speculative, are based on very limited exploration drilling and will require extensive new exploration and metallurgical efforts to validate. They should not be treated as current mineral resources or reserves or relied upon until confirmed by current exploration and a Qualified Person. A Qualified Person has not done sufficient work to upgrade or classify these historical resource estimates as current NI-43-101 compliant mineral resources. The Roberts Lake historic resource was reported in 1970 from drilling in the late 1950s, the Morgan Lake historic resource was reported in 1957 and 1964, and the Hopes Advance historic resource was reported in 1958. Further information in respect of these historic resources is outlined in a 43-101 technical report prepared by Micon entitled “Technical Report on the Ungava Iron Property – Ungava Bay Region, Quebec, Canada dated Oct. 29, 2010, available on SEDAR.

$0
$1,000
$2,000
$3,000
$4,000
$5,000
$6,000
$7,000
$8,000
$9,000
$10,000
$11,000
75 80 85 90 95 100 105 110 115 120 125 130 135
NP
V @
8%
(m
illio
n)
FOB Ungava Bay ($ / tonne)
Pre-Tax
After-Tax
NPV Sensitivity to FOB Ungava Bay Iron Ore Price (Unlevered)*
41
* Source: Oceanic Iron Ore Corp. – NI 43-101 Technical Report on a Prefeasibility Study Completed on the Hopes Advance Bay Iron Deposits Ungava Bay Region, Quebec, Canada NTS 24M/08, 24N05 dated November 2, 2012

NPV Sensitivity to Fuel Pricing
42
* Source: Oceanic Iron Ore Corp. – NI 43-101 Technical Report on a Prefeasibility Study Completed on the Hopes Advance Bay Iron Deposits Ungava Bay Region, Quebec, Canada NTS 24M/08, 24N05 dated November 2, 2012
70 75 80 85 90 95 100 105 110 115 120 125 130
After-Tax 1.9 1.9 1.9 1.8 1.8 1.8 1.7 1.7 1.6 1.6 1.6 1.5 1.5
IRR 15.0 14.8 14.7 14.5 14.4 14.2 14.1 13.9 13.8 13.6 13.5 13.3 13.2
10.5
11.0
11.5
12.0
12.5
13.0
13.5
14.0
14.5
15.0
15.5
1.5
1.6
1.6
1.7
1.7
1.8
1.8
1.9
1.9
2.0
2.0
IRR
(%)
NP
V @
8%
($
bill
ion
)
% of base case
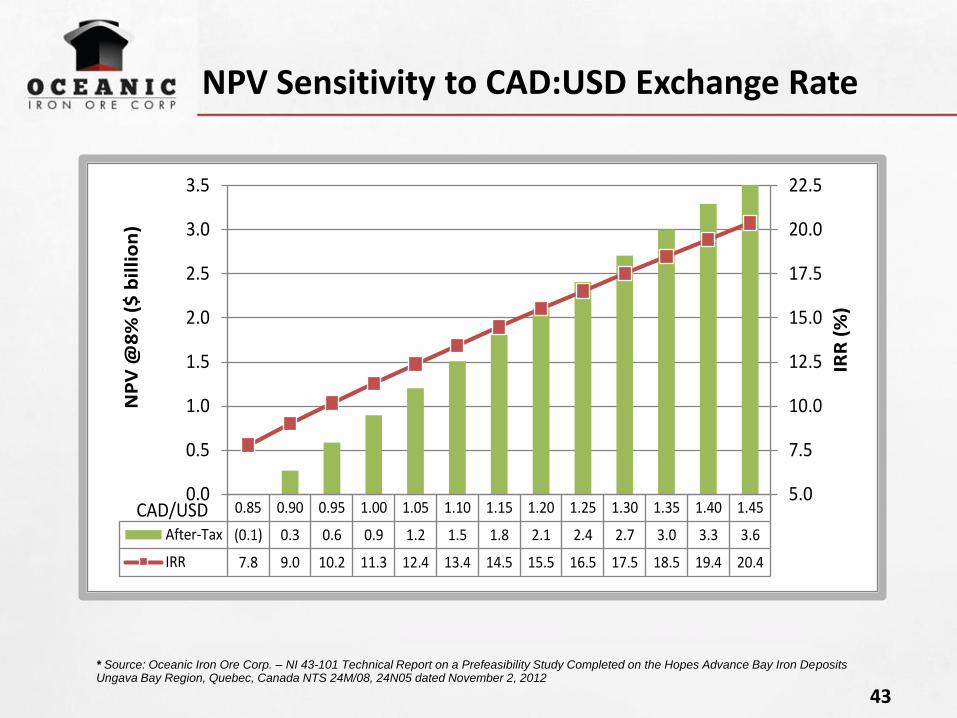
NPV Sensitivity to CAD:USD Exchange Rate
43
* Source: Oceanic Iron Ore Corp. – NI 43-101 Technical Report on a Prefeasibility Study Completed on the Hopes Advance Bay Iron Deposits Ungava Bay Region, Quebec, Canada NTS 24M/08, 24N05 dated November 2, 2012
0.85 0.90 0.95 1.00 1.05 1.10 1.15 1.20 1.25 1.30 1.35 1.40 1.45
After-Tax (0.1) 0.3 0.6 0.9 1.2 1.5 1.8 2.1 2.4 2.7 3.0 3.3 3.6
IRR 7.8 9.0 10.2 11.3 12.4 13.4 14.5 15.5 16.5 17.5 18.5 19.4 20.4
5.0
7.5
10.0
12.5
15.0
17.5
20.0
22.5
0.0
0.5
1.0
1.5
2.0
2.5
3.0
3.5
IRR
(%
)
NP
V @
8%
($
bil
lio
n)
CAD/USD

Construction Capital Costs*
44
Capital Description
Initial Capex
2014 to 2016
($000)
Expansion Capex
2025/2026
($000)
Mine Equipment 92,658 61,231
Mine Development 66,203 2,918
Crusher 29,674 30,355
Concentrator 481,514 492,643
Pipeline 56,740 83,787
Port Filtering and Drying 325,654 267,401
Port and Marine Infrastructure 288,000 84,000
Power 377,892 26,775
Site Infrastructure 81,591 25,675
Site Roads 33,583 -
Camp and Offices 29,575 7,175
Airstrip Upgrade 11,824 -
Fresh Water Supply 10,469 3,621
Sewage 4,554 1,574
Tailings and Hazardous Waste Disposal 23,577 30,122
Communications 2,305 -
Mobile Equipment 9,983 -
Indirect Costs 499,962 249,378
Contingency and Closure Bond 427,899 241,135
Total Construction Capital $2,853,657 $1,607,790
* Source: Oceanic Iron Ore Corp. – NI 43-101 Technical Report on a Prefeasibility Study Completed on the Hopes Advance Bay Iron Deposits Ungava Bay Region, Quebec, Canada NTS 24M/08, 24N05 dated November 2, 2012
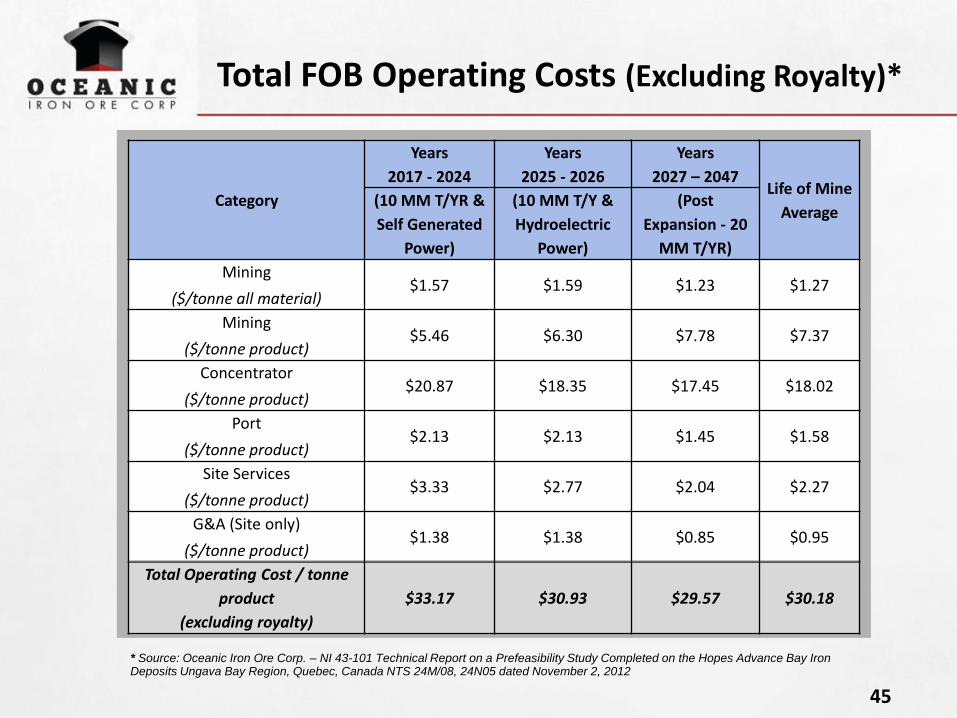
Total FOB Operating Costs (Excluding Royalty)*
45
Category
Years
2017 - 2024
Years
2025 - 2026
Years
2027 – 2047 Life of Mine
Average (10 MM T/YR &
Self Generated
Power)
(10 MM T/Y &
Hydroelectric
Power)
(Post
Expansion - 20
MM T/YR)
Mining
($/tonne all material) $1.57 $1.59 $1.23 $1.27
Mining
($/tonne product) $5.46 $6.30 $7.78 $7.37
Concentrator
($/tonne product) $20.87 $18.35 $17.45 $18.02
Port
($/tonne product) $2.13 $2.13 $1.45 $1.58
Site Services
($/tonne product) $3.33 $2.77 $2.04 $2.27
G&A (Site only)
($/tonne product) $1.38 $1.38 $0.85 $0.95
Total Operating Cost / tonne
product
(excluding royalty)
$33.17 $30.93 $29.57 $30.18
* Source: Oceanic Iron Ore Corp. – NI 43-101 Technical Report on a Prefeasibility Study Completed on the Hopes Advance Bay Iron Deposits Ungava Bay Region, Quebec, Canada NTS 24M/08, 24N05 dated November 2, 2012

Concentrator Operating Costs
Period 2017 – 2024 2025 – 2026 2027 – 2047 LOM Total
Production Rate 10 M t/y 10 M t/y 20 M t/y -
Power Self-Generated Hydroelectric Hydroelectric -
Operating Cost
Manpower $126,113 $32,285 $424,882 $583,280
Electric Power $977,857 $184,539 $3,641,264 $4,803,661
Consumables,etc $103,948 $26,611 $543,593 $674,152
Grinding Media, Reagents $222,816 $57,041 $1,165,205 $1,445,062
Dryer – Bunker C $173,080 $59,078 $1,206,816 $1,438,974
Dryer – Diesel $6,188 $2,112 $43,143 $51,442
Materials handling – fuel $621 $159 $2,634 $3,415
Materials handling – other $20,074 $5,139 $103,243 $128,457
Total $1,630,698 $366,964 $7,130,780 $9,128,443
Unit cost ($/t concentrate) $20.87 $18.35 $17.45 $18.02
46
LOM Concentrator Operating Costs (Thousand $)