Embed Size (px)
Citation preview

1
Causes of Motor Vehicle Collisions with Bicycles & Pedestrians
Collision Study in a Small City with Many Bike Lanes Results Compared to Similar Studies Over the Past Twenty Years
Published Jan 2017 by Corvallis Right of Way ACKNOWLEDGEMENTS ................................................................................................................................................................................... 1 ABSTRACT ............................................................................................................................................................................................................ 1 1. INTRODUCTION ............................................................................................................................................................................................. 2 2. CORVALLIS STUDY OF TRAFFIC COLLISIONS INVOLVING BICYCLISTS AND PEDESTRIANS ............................................ 2 2A. METHODS ...................................................................................................................................................................................................... 2 2B. DATA SOURCE AND LIMITATIONS .......................................................................................................................................................... 2 2C. CORVALLIS’S RESULTS & DISCUSSION ................................................................................................................................................. 3 3. LITERATURE REVIEW ................................................................................................................................................................................. 8 3A. MOTOR VEHICLE VS BICYCLE COLLISIONS ......................................................................................................................................... 9 3B. MOTOR VEHICLE VS BICYCLE FATALITIES ........................................................................................................................................ 13 3C. MOTOR VEHICLE VS PEDESTRIAN COLLISIONS ................................................................................................................................ 14 3D. MOTOR VEHICLE VS PEDESTRIAN FATALITIES ................................................................................................................................ 16 3E. A NOTE ON FATALITIES ........................................................................................................................................................................... 17 3F. A NOTE ON FAULT ..................................................................................................................................................................................... 18 4. CORVALLIS’S CAUSES OF COLLISIONS DEFINED, DISCUSSED, AND COMPARED TO OTHER STUDIES ........................ 18 5. RESULTS: SYNTHESIS OF CORVALLIS DATA WITH THE LITERATURE .................................................................................... 26 5A. REDUCING MOTOR VEHICLE COLLISIONS WITH BICYCLES .......................................................................................................... 26 5B. REDUCING MOTOR VEHICLE COLLISIONS WITH PEDESTRIANS ................................................................................................... 27 5C. REDUCING MOTOR VEHICLE COLLISIONS WITH BICYCLES AND PEDESTRIANS ..................................................................... 28 5D. REDUCING MOTOR VEHICLE VS BICYCLE COLLISIONS & FATALITIES ...................................................................................... 28 5E. REDUCING MOTOR VEHICLE VS PEDESTRIAN COLLISIONS & FATALITIES ............................................................................... 29 5F. REDUCING MOTOR VEHICLE COLLISIONS AND FATALITIES INVOLVING BICYCLES OR PEDESTRIANS ............................ 29 6. CONCLUSION................................................................................................................................................................................................ 29 APPENDIX A. LIGHTING AND WEATHER DATA FROM ALL STUDIES ............................................................................................ 29 Acknowledgements This collision study was conducted by Corvallis Right of Way, a non-profit organization in Corvallis, Oregon. Researchers include Vivek Jeevan, Wendy Byrne, Vernon Huffman, Dr. Nancy Baumeister, and Dr. David Rabinowitz. Data analysis and writers include Alcyon Lord, R. Schwindt, Jay Thatcher, and Erica Jeevan. Thanks to Bicycle Lawyer Ray Thomas and Personal Injury Attorney Charley Gee for their investment in Corvallis and longstanding dedication to Oregon traffic safety. Abstract We analyzed four years of police collision reports involving bicycles or pedestrians in Corvallis, Oregon. Between 2011 and 2015 there were 134 collisions between motorists and bicyclists and 45 between motorists and pedestrians.
We identified 21 behavioral causes of collisions involving bicycles. Surprisingly, of these, only five behaviors caused 81% of collisions. These were: 1. "Motorist fails to yield to bicycle while turning" (41%), 2. "Motorist fails to yield to rider in bike lane" (29%), 3. "Motorist fails to obey traffic control device (19%), 4. "Motorist fails to yield to bicycle in crosswalk or sidewalk" (15%), 5. "Cyclist fails to obey traffic control device" (13%). In more descriptive terms, we see that motorists often hit cyclists while turning across a bike lane, by failure to stop for cyclists at stop signs, and while turning out of driveways or parking lots. Cyclists hit cars most often while failing to stop at stop signs or red lights.
We identified 12 behavioral causes of collisions involving pedestrians. Of these the top cause was involved in 69% of collisions. Sadly, it was "Motorist failure to yield to pedestrian in crosswalk or sidewalk" (69%). It seems that people walking are not safe even on the sidewalk or in a crosswalk.
We conducted a literature search of similar bicycle and pedestrian collision studies over the past 20 years. We found four notably consistent results throughout the literature: 1. “Motorist fails to yield while turning” is a leading cause of collision and fatality, 2. “Motorist unsafely passes cyclist” is the top cause of bicycle fatality, 3. The majority of collisions and fatalities occur during daylight, during dry, and during clear weather conditions, 4. Drivers of motor vehicles cause the majority of collisions and fatalities involving bicycle and pedestrians.

2
1. Introduction
Vision Zero is an international traffic safety concept stating that traffic deaths and injuries are preventable, therefore, none are acceptable. A key component to accomplishing Vision Zero is the Focus on the Five approach, which allocates education and enforcement resources primarily toward the top five behavioral causes of collisions and fatalities. This data-driven approach is used to develop many types of safety programs, not just traffic safety. Focusing on the top problems ensures that time and money are spent most effectively. However, Focusing on the Five requires knowing what the top five problems are, which is a non-trivial requirement. For bicycle and pedestrian safety, the necessary data is found in collision studies based on police reports.
Comprehensive bicycle and pedestrian collision studies are typically conducted in large cities. Due to differences in infrastructure and laws, it is not clear if conclusions from those studies apply to the smaller city of Corvallis, Oregon. Corvallis is 14 square miles of land, with 30,000 Oregon State University students and 55,000 local citizens. Largely due to an extensive network of bicycle lanes, Corvallis is a gold-rated bicycle-friendly city. Corvallis has bike lanes on 98 percent of its collector and arterial roadways.
Corvallis Right of Way performed a study of local bicycle and pedestrian collisions to determine which collision causes constitute our Top Five. With this information, city and state organizations can confidently focus their efforts on the top causes. These results can theoretically be applied to any similar-sized American city with a large network of bicycle lanes. Additionally, we conducted a literature review of similar bicycle/pedestrian collision and fatality studies over the past twenty years throughout the United States and Canada. Certain trends can only be determined by looking at an overview of all studies. This paper presents the findings from each study and compares results. 2. Corvallis Study of Traffic Collisions Involving Bicyclists and Pedestrians 2A. Methods We scrutinized Corvallis Police Department traffic collision reports involving bicycles and pedestrians from May 2011 through June 2015. We tracked behaviors that the police identified as causative. Had the behavior not occurred, the collision would not have occurred. To be as comprehensive as possible, we investigated a larger list of behaviors than any previously known study. Our list of motorist behaviors covers right-of-way laws as specified by current Oregon Revised Statutes and Corvallis Code of Ordinances. For bicyclists and pedestrians, in addition to law, we investigated behaviors that are legal yet considered “poor practices”. A Focus on the Five approach should emphasize “best practices” (known as “defensive driving” to motor vehicles) as well as legal requirements because laws are ever-changing and vary by jurisdiction, but “best practices” are timeless and universal. Defining “best/poor practices” can be controversial, and tracking all possible “poor practices” would create an impractically long list of causes. Therefore, we carefully chose to investigate only the “poor practices” that receive considerable amount of attention and resources from society today. This allows us to prove or disprove, with hard data, whether those behaviors are true safety problems.
Our police reports included electric bicycles and skaters in small numbers that did not significantly affect our overall results. We counted those transportation forms as bicycles because state and city laws give them the same rights and responsibilities as bicycles. 2B. Data Source and Limitations Modern collision studies are based on police reports. Although it is impossible to know what truly occurred during a collision, police reports are the most comprehensive and available data source. One might wish to incorporate court documents for information discovered after the police report, however those are difficult to obtain and correlate to known collisions. One might also wish to peruse medical records for collisions not reported to police. However, individual medical records are confidential, and the information made public by hospitals lacks the level of detail needed for this type of study.

3
Police reports offer consistent and thorough documentation. They are written shortly after the collision by an officer on the scene and include statements from all involved parties and witnesses, diagrams of how the collision occurred, and useful metadata (location, time, etc). In rare cases, they include follow-up information such as further interviews with suspects or results of skid pattern analysis. We assumed that every word, description, and diagram on a police report was the complete truth. We tallied every behavior mentioned in the report, and made no assumptions about anything not explicitly stated.
Our study gave no relevance to traffic citations issued. For most collisions, the police report described multiple illegal behaviors, yet the officer ultimately gave out one or zero citations. Regardless of the officer’s enforcement discretion, we want to use all the data available in the report.
Two main limitations of police reports are discussed in nearly every collision study. The first limitation is that when motor vehicles collide with bicyclists or pedestrians, the driver is typically uninjured and able to give their side of the story for the report, having had time to think about it before police arrive. The cyclist or pedestrian may be adrenalized, in shock, in pain, confused, unable to recall what happened, unconscious, or dead. In those situations, they are not in an equal frame of mind to the driver to give their side of the story for the report. The second limitation is a national trend for police to empathize with and be more forgiving towards motorists. This is a researched[1] and thoroughly documented[2] problem. If laws that protect the cyclist or pedestrian are unknown or ignored, the report will incorrectly indicate that the cyclist/pedestrian did something wrong.
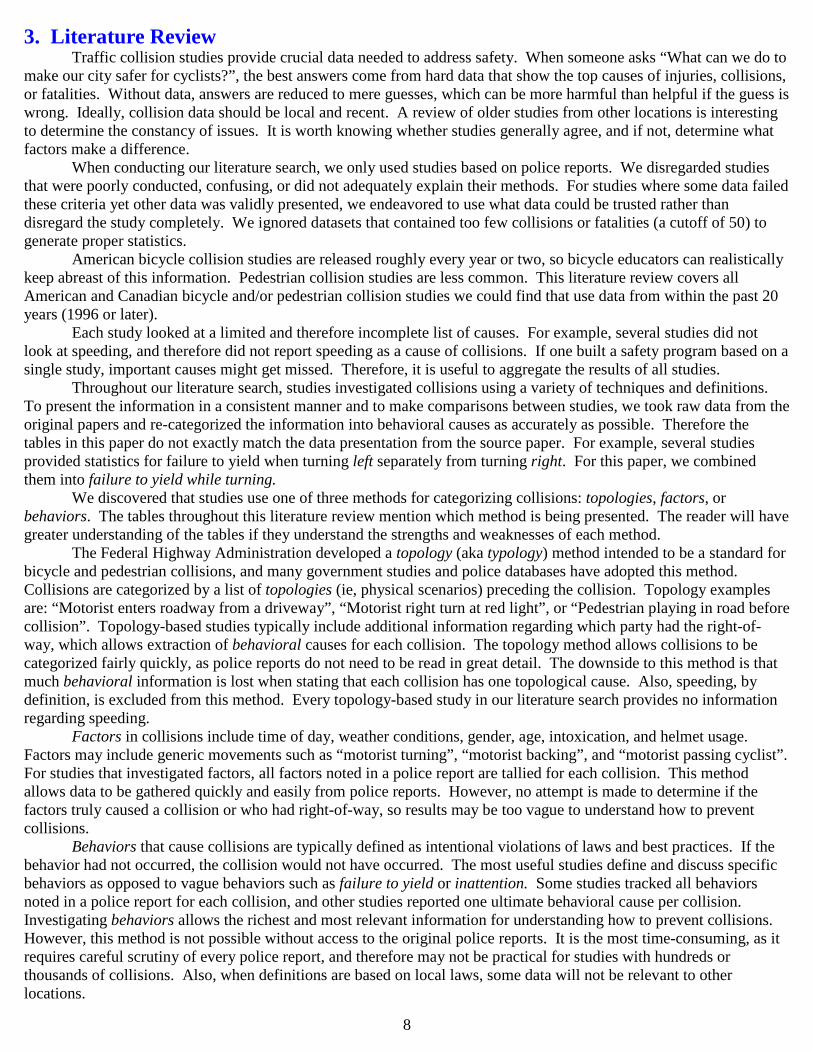
We have no data on collisions not reported to police. Additionally, we did not use reports from State Police, County Sheriffs (who also respond to traffic accidents within Corvallis), or Oregon State University campus. 2C. Corvallis’s Results & Discussion We investigated the behavioral causes of 134 bicycle/car collisions and 45 pedestrian/car collisions that occurred between May 2011 – June 2015 in Corvallis, Oregon. Our pedestrian results are shown in Table 1 and bicycle results shown in Table 2. The same information is visually displayed as bar graphs in Figure 4 and Figure 5. During this study period, there were no reported bicycle/pedestrian collisions or bicycle/bicycle collisions. Detailed definitions of each behavior are given in Section 4 of this paper, where these behaviors are also compared throughout the literature. Table 1: Pedestrian Results from our Corvallis study
Behavioral causes of Corvallis motor vehicle vs pedestrian collisions (May 2011 - June 2015) % of collisionsa # instances Motorist fails to yield to pedestrian in crosswalk or sidewalk 69% 31 Motorist fails to yield while turning 40% 18 Pedestrian fails to yield to motorist on roadway 11% 5 Motorist no attempt at safety 9% 4 Motorist other 7% 3 Motorist fails to stop before sidewalk when emerging from driveway, alley, or parking lot 7% 3 Motorist speed excessive to conditions 4% 2 Motorist distracted by electronic device (cell phone, etc) 4% 2 Pedestrian intoxicated 4% 2 Motorist fails to yield while entering/exiting parking space 2% 1 Motorist fails to obey traffic control device (stop sign, red light, etc) 2% 1 Pedestrian fails to obey traffic control device (don't walk sign) 2% 1 Pedestrian enters crosswalk too suddenly 0% 0 Motorist wrong way 0% 0 Motorist unsafe lane change 0% 0 Motorist passes a vehicle stopped for pedestrian at crosswalk 0% 0 Motorist intoxicated 0% 0 Pedestrian no attempt at safety 0% 0 Pedestrian other 0% 0 Pedestrian distracted by electronic device (cell phone, headphones, etc) 0% 0
aPercentages add to more than 100% because there can be multiple causes of a collision.

4
Table 2: Bicycle Results from our Corvallis study Behavioral causes of Corvallis motor vehicle vs bicycle collisions (May 2011 - June 2015) % of collisionsa # instances
Motorist fails to yield while turning 42% 56 Motorist fails to yield to rider in bike lane 29% 39 Motorist fails to obey traffic control device (red light, stop sign, etc) 19% 25 Motorist fails to yield to bicycle in crosswalk or sidewalk 15% 20 Cyclist fails to obey traffic control device (red light, don't walk, etc) 13% 17 Motorist fails to stop before sidewalk when emerging from driveway, alley, or parking lot 11% 14 Cyclist wrong way 6% 8 Cyclist fails to yield while turning 6% 8 Motorist speed excessive to conditions 5% 7 Cyclist no lights/reflectors 5% 6 Cyclist enters crosswalk quickly/suddenly, or enters/crosses driveway or parking lot quickly 5% 6 Motorist no attempt at safety 3% 4 Cyclist unsafe lane change (includes sidewalk to traffic lane) 3% 4 Motorist unsafely passes cyclist 2% 3 Motorist fails to yield while entering/exiting parking space 2% 2 Cyclist rear ends motorist 2% 2 Motorist intoxicated 1% 1 Motorist other 1% 1 Motorist opens door into bicycle traffic 1% 1 Cyclist unsafely passes motorist 1% 1 Cyclist intoxicated 1% 1 Motorist rear ends cyclist 0% 0 Motorist wrong way 0% 0 Motorist unsafe lane change 0% 0 Motorist passes a vehicle stopped for a pedestrian 0% 0 Motorist distracted by electronic device (cell phone, etc) 0% 0 Cyclist fails to stop before sidewalk when emerging from driveway, alley, or parking lot 0% 0 Cyclist speed excessive to conditions 0% 0 Cyclist fails to yield while entering/exiting parking space 0% 0 Cyclist passes a vehicle stopped for a pedestrian 0% 0 Cyclist no attempt at safety 0% 0 Cyclist other 0% 0 Cyclist distracted by electronic device (cell phone, headphones, etc) 0% 0
aPercentages add to more than 100% because there can be multiple causes of a collision.
The findings in these tables contradict the frequent belief that collisions are mostly caused by extreme behaviors such as driving drunk and speeding. While those horrific behaviors can and do cause severe injury and justly deserve attention from society, they are not the cause of most collisions between people driving cars and people bicycling or walking.
In the course of doing this study, we learned that most collisions are associated with motorists doing common, everyday behavior such as turning right or passing over crosswalks or sidewalks. Turning motions or driving over crosswalks and sidewalks are so common that we do not think of them as dangerous, yet mistakes while doing so were our top causes of collisions. Why are they so commonly associated with collisions? We can only speculate as we do not know what was in the minds of the people involved, but statements in police reports indicate that a momentary lapse in attention and misunderstanding of the rules of the road are often involved. Lack of initial and ongoing education is an exacerbating factor, as many road users do not realize which right-of-way rules they do not understand. In the interest of improving safety, our hope is that every road user can read through these lists of collision causes, learn about concepts they are less familiar with, know where to focus their energies, and thereby improve their own transportation habits. To reduce bicycle and pedestrian collisions, education and enforcement should focus on the top issues in these two tables. For bicycle/car collisions, the top five behaviors were involved 81% of all collisions. For pedestrian/car collisions, the top two behaviors were involved in 71% of all collisions. This provides a strong starting point for addressing safety, as addressing these few behaviors will have the largest impact.

5
In Table 1 and Table 2, behaviors naturally fell into three patterns, depending on how frequently they contributed to collisions: none, low, and high. This will be useful in the literature search section of this paper to simplify comparison of our results to those of other studies. We defined behaviors as none if they did not cause any collisions during our 4-year study. We defined low contributors as those that caused so few collisions that other causes had identical or nearly identical numbers. For car/bicycles, these are the behaviors that caused 0 - 6% of collisions. For car/pedestrians, these are the behaviors that caused 0 – 11% collisions. Beyond that, there is a sharp increase in collision incidences. For car/bicycles, this occurs where motorist fails to stop before sidewalk caused almost twice as many collisions as the next less frequent behavior. For car/pedestrians, this occurs where motorist failure to yield while turning caused over three times as many collisions as the next less frequent behavior. We defined behaviors as high contributors if they existed in this realm, as they were responsible for the bulk of all collisions. Notice in the literature review section of this paper that many other studies exhibit this same pattern in their results.
We mapped the locations of these collisions as shown in Figure 1, Figure 2, and Figure 3. Intersections with repeated collisions beg for infrastructure improvement. Collisions are scattered throughout the city with concentrations matching human density: around Oregon State University campus, throughout downtown, and along the busiest roads. This demonstrates that, outside of those few poorly functioning intersections, collisions are widespread, and that changing behaviors through education and enforcement will play a larger role in reducing collisions than changing infrastructure.
Figure 1 – Combined map of all motor vehicle vs bicycle and motor vehicle vs pedestrian collisions

6
Figure 2 – Locations of all motor vehicle vs bicycle collisions in Corvallis, Oregon

7
Figure 3 - Locations of all motor vehicle vs pedestrian collisions in Corvallis, Oregon
8
3. Literature Review Traffic collision studies provide crucial data needed to address safety. When someone asks “What can we do to
make our city safer for cyclists?”, the best answers come from hard data that show the top causes of injuries, collisions, or fatalities. Without data, answers are reduced to mere guesses, which can be more harmful than helpful if the guess is wrong. Ideally, collision data should be local and recent. A review of older studies from other locations is interesting to determine the constancy of issues. It is worth knowing whether studies generally agree, and if not, determine what factors make a difference.
When conducting our literature search, we only used studies based on police reports. We disregarded studies that were poorly conducted, confusing, or did not adequately explain their methods. For studies where some data failed these criteria yet other data was validly presented, we endeavored to use what data could be trusted rather than disregard the study completely. We ignored datasets that contained too few collisions or fatalities (a cutoff of 50) to generate proper statistics.
American bicycle collision studies are released roughly every year or two, so bicycle educators can realistically keep abreast of this information. Pedestrian collision studies are less common. This literature review covers all American and Canadian bicycle and/or pedestrian collision studies we could find that use data from within the past 20 years (1996 or later).
Each study looked at a limited and therefore incomplete list of causes. For example, several studies did not look at speeding, and therefore did not report speeding as a cause of collisions. If one built a safety program based on a single study, important causes might get missed. Therefore, it is useful to aggregate the results of all studies.
Throughout our literature search, studies investigated collisions using a variety of techniques and definitions. To present the information in a consistent manner and to make comparisons between studies, we took raw data from the original papers and re-categorized the information into behavioral causes as accurately as possible. Therefore the tables in this paper do not exactly match the data presentation from the source paper. For example, several studies provided statistics for failure to yield when turning left separately from turning right. For this paper, we combined them into failure to yield while turning.
We discovered that studies use one of three methods for categorizing collisions: topologies, factors, or behaviors. The tables throughout this literature review mention which method is being presented. The reader will have greater understanding of the tables if they understand the strengths and weaknesses of each method.
The Federal Highway Administration developed a topology (aka typology) method intended to be a standard for bicycle and pedestrian collisions, and many government studies and police databases have adopted this method. Collisions are categorized by a list of topologies (ie, physical scenarios) preceding the collision. Topology examples are: “Motorist enters roadway from a driveway”, “Motorist right turn at red light”, or “Pedestrian playing in road before collision”. Topology-based studies typically include additional information regarding which party had the right-of-way, which allows extraction of behavioral causes for each collision. The topology method allows collisions to be categorized fairly quickly, as police reports do not need to be read in great detail. The downside to this method is that much behavioral information is lost when stating that each collision has one topological cause. Also, speeding, by definition, is excluded from this method. Every topology-based study in our literature search provides no information regarding speeding. Factors in collisions include time of day, weather conditions, gender, age, intoxication, and helmet usage. Factors may include generic movements such as “motorist turning”, “motorist backing”, and “motorist passing cyclist”. For studies that investigated factors, all factors noted in a police report are tallied for each collision. This method allows data to be gathered quickly and easily from police reports. However, no attempt is made to determine if the factors truly caused a collision or who had right-of-way, so results may be too vague to understand how to prevent collisions. Behaviors that cause collisions are typically defined as intentional violations of laws and best practices. If the behavior had not occurred, the collision would not have occurred. The most useful studies define and discuss specific behaviors as opposed to vague behaviors such as failure to yield or inattention. Some studies tracked all behaviors noted in a police report for each collision, and other studies reported one ultimate behavioral cause per collision. Investigating behaviors allows the richest and most relevant information for understanding how to prevent collisions. However, this method is not possible without access to the original police reports. It is the most time-consuming, as it requires careful scrutiny of every police report, and therefore may not be practical for studies with hundreds or thousands of collisions. Also, when definitions are based on local laws, some data will not be relevant to other locations.

9
In Section 2C of this paper, we categorized each behavior as high, low, or none, depending on how frequently it contributed to collisions in Corvallis. The purpose of that categorization was for use in the tables of this literature review. Each table has a column where, if a matching behavior exists, we mention its category in Corvallis. This column is intended to provide a simplified and visual comparison between that study’s results and Corvallis’s results. 3A. Motor Vehicle vs Bicycle Collisions We found seven motor vehicle vs bicycle collision studies that fit our literature search criteria. A brief overview of the strengths and limitations of each study is given in the paragraphs below. Afterwards, the results of these seven studies are shown in tables.
A 2003 Toronto study[3] is of good quality. Their collisions occurred on traffic lanes or sidewalks, and there was only a brief mention of a network of bicycle lanes planned after the data had been collected. By contrast, bicycle lanes are ubiquitous in Corvallis today. This is useful from a data perspective, as this opposing infrastructure allows rich comparisons (discussed further in Section 4 of this paper).
A 2004 Orlando study [4] is of sufficient quality that its collision findings were used in a 2012 Federal Highway Administration bicycle safety audit[5], with the goal of providing bicycle safety guidance for all future FHWA road projects.
A 2007 North Carolina study [6] investigated a limited set of factors found at each collision. Its police data made no attempt to determine if each factor was a behavioral root cause of a collision. However, when factors are repeatedly found in the majority of collisions, this literature search can safely assume that those factors are related to the root cause. Although this study seems mostly well conducted (given the limitations of its source data), several of its findings are major outliers and at odds with the remainder of the literature.
A 2011 North Carolina study[7], was conducted by a different organization than the 2007 North Carolina study and looked at years after the previous study.
A 2012 San Francisco study[8] was based on police reports that only provided one “most likely [behavioral] cause” for each collision. If there were multiple behavioral causes of a collision, as Corvallis police reports show is most often the case, the officer determined which one got listed in the report. This allows subjectivity in the data, and San Francisco police is known for allegations of anti-cyclist bias. Regardless of the limitations of its data source, this study is well done and presented.
A 2013 Minneapolis study[9] is low on details and clarity. Similar to the San Francisco study, most (but not all) of its police reports only provided one ultimate cause for each collision.
A 2015 Vancouver, Canada study [10] is well done.

10
Table 3: Bicycle collision data from a 2003 Toronto study
Topologies of Toronto motor vehicle vs bicycle collisions % of collisionsa Frequency in Corvallis motor vehicle vs bicycle collisionsb
Motorist failure to yield while turning 30% high Motorist failure to yield at stop sign or red light 12% high Motorist unsafe passing 12% low Motorist opens door into bicycle traffic 12% low Motorist failure to yield when emerging from lane or driveway 8% high Other 4% Cyclist failure to yield at stop sign or red light 3% high Cyclist wrong way riding 3% low Cyclist failure to yield when turning 2% low Cyclist fails to yield when entering road from sidewalk, midblock 2% low Cyclist enters crosswalk without yielding right of way 2% low Cyclist loses control 2% Cyclist strikes stopped vehicle 2% low Motorist reversing 2% Cyclist unsafe passing of motorist 1% low Traffic light turned red before cyclist could completely cross intersection 1% Cyclist failure to yield when emerging from lane or driveway 1% none Motorists failure to yield pulling into/out of onstreet parking 1% low
aPercentages add to 100% because there is one topology per collision. bThis column shows whether the cause had high or low correlation (defined in Section 2C) to Corvallis collisions, or did not cause a single collision during Corvallis’s 4-year study period. A blank space means no similar cause was investigated in Corvallis’s study.
Table 4: Bicycle collision data from a 2004 Orlando study
Topologies of Orlando motor vehicle vs bicycle collisions % of collisionsa Frequency in Corvallis motor vehicle vs bicycle collisionsb
Other 26% Motorist failure to obey traffic control device 14% high Cyclist failure to obey traffic control device 14% high Motorist failure to yield when emerging from parking lot or driveway 10% high Cyclist failure to yield when emerging from parking lot or driveway, or changing from sidewalk to roadway mid-block 9% low
Motorist unsafely passes cyclist 8% low Motorist failure to yield while turning or merging 8% high Cyclist failure to yield while turning or merging 6% low Head-on 3% low Cyclist unsafely passes motorist 1% low Motorist opens door into bicycle traffic 0.0% low
aPercentages add to 100% within rounding because there is one topology per collision. bThis column shows whether the cause had high or low correlation (defined in Section 2C) to Corvallis collisions, or did not cause a single collision during Corvallis’s 4-year study period.

11
Table 5: Bicycle collision data from a 2007 North Carolina study
Factors in North Carolina motor vehicle vs bicycle collisions % of collisionsa
Frequency in Corvallis motor vehicle vs bicycle collisionsb
Cyclist wrong way riding 31% low Cyclist turning/merging 24% low Motorist overtaking 11% low Motorist turning/merging 10% high Cyclist intoxicated 6% low Head on collision 3% low Motorist intoxicated 2% low Motorist or cyclist speeding 1% low Motorist backing 1%
aPercentages do not add to 100% because multiple or none of these factors may be involved in a collision. bThis column shows whether the cause had high or low correlation (defined in Section 2C) to Corvallis collisions, or did not cause a single collision during Corvallis’s 4-year study period. A blank space means no similar cause was investigated in Corvallis’s study.
Table 6: Bicycle collision data from a 2011 North Carolina study
Topologies of North Carolina motor vehicle vs bicycle collisions % of collisionsa Frequency in Corvallis motor vehicle vs bicycle collisionsb
Motorist overtaking cyclist 17% low Other 14% Cyclist fails to obey traffic control device 13% high Motorist fails to obey traffic control device 12% high Motorist fails to yield while turning, changing lanes, or pulling in/out of parking space 11% high Cyclist fails to yield when entering road midblock from sidewalk, driveway, or alley 9% low
Cyclist fails to yield while turning or changing lanes 8% low Motorist fails to yield when emerging from driveway or parking lot 6% high Non-roadway 4% Head-on 3% low Cyclist overtaking motorist 1% low Motorist failure to yield while backing 0.8% Parking / bus-related 0.04% low
aPercentages add to 100% because there is one topology per collision. bThis column shows whether the cause had high or low correlation (defined in Section 2C) to Corvallis collisions, or did not cause a single collision during Corvallis’s 4-year study period. A blank space means no similar cause was investigated in Corvallis’s study.

12
Table 7: Bicycle collision data from a 2012 San Francisco study Behavioral causes of San Francisco motor vehicle vs bicycle collisions
that caused injury % of collisionsa Frequency in Corvallis motor vehicle vs bicycle collisionsb
Motorist failure to yield when turning 18% high Cyclist driving at unsafe speed given conditions of roadway 16% none Cyclist failure to obey traffic control device 10% high Cyclist other 9% Motorist unsafe opening of vehicle door 8% low Motorist other 7% Cyclist wrong way 5% low Motorist driving at unsafe speed given conditions of roadway 3% low Cyclist unknown 3% Motorist unknown 2% Cyclist failure to yield when turning 2% low Motorist unsafe maneuver or backing after being parked 2% low Cyclist failure to yield to cross traffic from driveway or alley 2% none Motorist failure to obey traffic control device 5% high Cyclist unsafe lane change 2% low Motorist unsafe lane change 2% none Cyclist unsafe passing or overtaking of another vehicle 1% low Cyclist insufficient lights or reflectors on bicycle 1% low Cyclist failure to yield to pedestrian at a crosswalk 0.8% none Motorist unsafe overtaking or passing maneuver to the left 0.8% low
aPercentages add to 100% because each collision was assigned one ultimate cause. bThis column shows whether the cause had high or low correlation (defined in Section 2C) to Corvallis collisions, or did not cause a single collision during Corvallis’s 4-year study period. A blank space means no similar cause was investigated in Corvallis’s study.
Table 8: Bicycle collision data from a 2013 Minneapolis study
Behavioral causes of Minneapolis motor vehicle vs bicycle collisions % of collisionsa Frequency in Corvallis motor vehicle vs bicycle collisionsb
Motorist failure to yield right of way 32 Cyclist failure to yield right of way 13 Cyclist disregarding traffic control device 13 high Motorist inattentive or distracted 9 Cyclist improper lane use 9 Cyclist intoxicated 6 low Motorist Improper lane use 5 Motorist disregarding traffic control device 5 high Cyclist innatentive or distracted 5 Cyclist – other 5 Motorist vision obstructed by other factors 2 Motorist – other 2 Motorist doors cyclist 2 low Cyclist failure to use headlight 2 low Motorist intoxicated 1 low Motorist failure to use headlight < 0.1%
aPercentages add to more than 100% because there can be multiple causes of a collision. bThis column shows whether the cause had high or low correlation (defined in Section 2C) to Corvallis collisions, or did not cause a single collision during Corvallis’s 4-year study period. A blank space means no similar cause was investigated in Corvallis’s study.

13
Table 9: Bicycle collision data from a 2015 Vancouver, Canada study
Behavioral causes of Vancouver motor vehicle vs bicycle collisions % collisionsa Frequency in Corvallis motor vehicle vs bicycle collisionsb
Motorist failure to obey traffic control device 27% high Motorist fails to yield while turning 21% high Motorist opens door into bicycle traffic 15% low Motorist unsafely passes cyclist 6% low Motorist unsafe lane change 5% none Motorist fails to yield while entering/exiting parking space 4% low Cyclist fails to obey traffic control device 3% high Motorist hits cyclist who was stopped at intersection 1% Cyclist rear ends motorist 1% low Cyclist collides with stopped motorist at intersection 0.3%
aPercentages do not add 100% because multiple or none of these behaviors may cause a collision. bThis column shows whether the cause had high or low correlation (defined in Section 2C) to Corvallis collisions, or did not cause a single collision during Corvallis’s 4-year study period. A blank space means no similar cause was investigated in Corvallis’s study.
3B. Motor Vehicle vs Bicycle Fatalities Fatalities are a different problem from collisions, and can have fundamentally different causes. Throughout the spectrum of traffic types (motor vehicles, bicycles, and pedestrians), behaviors that cause relatively few collisions are leading causes of fatalities. Therefore, fatalities should be understood and dealt with separately. In this section, we compare each study’s fatality findings to Corvallis’s collision findings. We fully understand that this is an apples-to-oranges comparison. It is meant to compare fatalities to collisions, and learn how similar or different the causes are.
We found three motor vehicle vs bicycle fatality studies that fit our literature search criteria. A brief overview of the strengths and limitations of each study is given in the paragraphs below. Afterwards, the results of the studies are shown in tables.
A 2000 New York City study [11] is excellent and comprehensive. New York City, with its large population, is an ideal location to focus on fatalities. This study still stands today as the latest comprehensive study of bicycle fatalities anywhere in the United States or Canada. The 2007 North Carolina study described in the car/bicycle collision section also provides a limited set of factors in car/bicycle fatalities. This information is a small portion of the overall study. Its police data made no attempt to determine if each factor was a behavioral root cause of a collision. However, when factors are repeatedly found in the majority of fatalities, this literature search can safely assume that those factors are related to the root cause. Although this study seems mostly well conducted (given the limitations of its source data), several of its findings are major outliers and at odds with the remainder of the literature. The 2011 North Carolina study described in the car/bicycle collision section also provides a tiny amount of fatality data. It implies that it investigated the causes of fatalities the same way it investigated collisions, but does not explicitly provide the results. It states motorist unsafe passing is the top cause of fatality, having caused 39%. It also states that the head-on topology caused 11% of fatalities. Other fatality causes are briefly mentioned, but there is not enough information to convert from topology to behaviors, or to obtain percentages to know if those causes rank above or below head-on.

14
Table 10: Bicycle fatality data from a 2000 New York City study
Behavioral causes of New York City motor vehicle vs bicycle fatalities % of fatalititesa Frequency in Corvallis motor vehicle vs bicycle collisions
Motorist aggressively or unsafely passed cyclist 25% low Motorist speeding 17% low Motorist failure to yield when turning 15% high Motorist went through red light or stop sign 11% high Cyclist traveling wrong way 11% low Cyclist went through red light or stop sign 11% high Motorist or passenger "doored" cyclist 6% low Motorist Intoxicated 6% low Cyclist abruptly changed lane 4% low Cyclist emerged from sidewalk without warning 2% low Motorist traveling wrong-way 0% none
aPercentages add to more than 100% because there can be multiple causes of a fatality. bThis column shows whether the cause had high or low correlation (defined in Section 2C) to Corvallis collisions, or did not cause a single collision during Corvallis’s 4-year study period.
Table 11: Bicycle fatality data from a 2007 North Carolina study
Factors in North Carolina motor vehicle vs bicycle fatalities % of fatalitiesa Frequency in Corvallis motor vehicle vs bicycle collisionsb
Cyclist turning/merging 35% low Motorist overtaking 32% low Cyclist wrong way riding 25% low Cyclist intoxicated 21% low Motorist intoxicated 12% low Head on collision 10% low Motorist or cyclist speeding 8% low Motorist turning/merging 3% high Motorist backing 0%
a Percentages do not add to 100% because multiple or none of these factors may be involved in a fatality. bThis column shows whether the cause had high or low correlation (defined in Section 2C) to Corvallis collisions, or did not cause a single collision during Corvallis’s 4-year study period. A blank space means no similar cause was investigated in Corvallis’s study.
Table 12: Bicycle fatality data from a 2011 North Carolina study
Topologies of North Carolina motor vehicle vs bicycle fatalities % of fatalities Frequency in Corvallis motor vehicle vs bicycle collisionsa
Motorist overtaking cyclistb 39% low Head-on 11% low
aThis column shows whether the cause had high or low correlation (defined in Section 2C) to Corvallis collisions, or did not cause a single collision during Corvallis’s 4-year study period.
bStudy explicitly states that motorist overtaking cyclist is the top cause of fatality and gives the percentage. Study also gives the percentage for Head On. Not enough information is provided about any other causes to know how they rank compared to Head On.
3C. Motor Vehicle vs Pedestrian Collisions
We found three motor vehicle vs pedestrian collision studies that fit our literature search criteria. A brief overview of the strengths and limitations of each study is given in the paragraphs below. Afterwards, the results of those studies are shown in tables.
A 2007 Toronto study[12] is based on topology, but presents enough information to understand a limited set of behaviors.
A 2012 San Francisco study[8] is based on police reports that only provided one “most likely [behavioral] cause” for each collision. If there were multiple behavioral causes of a collision, as Corvallis data show is most often

15
the case, the officer determined which one got listed in the report. This allows subjectivity in the data. Regardless of the limitations of its data source, this study is well done and presented.
A 2013 Louisville study[13] is low on details and clarity. Some of its findings appear contradictory. However, it does contain usable data. Its police data does not say whether each factor was truly a behavioral root cause of a collision, or a just an incidental occurrence.
Table 13: Pedestrian collision data from a 2007 Toronto study
Behavioral causes of Toronto motor vehicle vs pedestrian collisions % of collisionsa Frequency in Corvallis motor
vehicle vs pedestrian collisionsb Motorist fails to yield to pedestrian in crosswalk, sidewalk, shoulder, or pedestrian crossover 35% high
Pedestrian fails to yield to motorist in roadway 22% low Motorist fails to yield while turning 22% high Pedestrian crosses intersection without right-of-way 20% low Motorist failure to yield when entering/exiting parking space 18% low Other/unknown 5%
aPercentages add to more than 100% because there can be multiple causes of a collision. bThis column shows whether the cause had high or low correlation (defined in Section 2C) to Corvallis collisions, or did not cause a single collision during Corvallis’s 4-year study period.
Table 14: Pedestrian collision data from a 2012 San Francisco study Behavioral causes of San Francisco motor vehicle vs pedestrian
collisions that caused injury but not fatality % of collisionsa Frequency in Corvallis motor
vehicle vs pedestrian collisionsb Motorist failure to yield to pedestrian at a crosswalk 41% high Pedestrian failure to yield to motorist on roadway 20% low Motorist driving at unsafe speed given conditions of roadway 7% low Motorist other 6% Pedestrian failure to obey traffic control devices 6% low Motorist unsafe maneuver or backing after being parked 5% low Motorist failure to obey traffic control devices 4% low Pedestrian failure to watch for cross traffic at crosswalk 4% none Pedestrian other 2% Motorist failure to yield when turning 1% high Motorist failing to yield to pedestrians when driving over sidewalk 0.9% high Motorist failure to yield to pedestrians exiting a streetcar or bus 0.6% Motorist overtaking a vehicle that is yielding to a pedestrian 0.5% none Motorist driving on sidewalk 0.4% Motorist not exercising due care for pedestrian outside crosswalk 0.4%
aPercentages add to 100% because each collision was assigned one ultimate cause. bThis column shows whether the cause had high or low correlation (defined in Section 2C) to Corvallis collisions, or did not cause a single collision during Corvallis’s 4-year study period. A blank space means no similar cause was investigated in Corvallis’s study.

16
Table 15: Pedestrian collision data from a 2013 Louisville study
Top factors in Louisville motor vehicle vs pedestrian collisions % of collisionsa Frequency in Corvallis motor
vehicle vs pedestrian collisionsb Motorist inattention 22% Pedestrian darts into road 18% Pedestrian walking in road 17% Pedestrian crossing with signal 13% high
Pedestrian not at intersection 12% Pedestrian in crosswalk 12% high Motorist failure to yield right of way 9% Motorist other factor 8% Motorist alcohol involvement 2% none Motorist distraction 2% Motorist disobey traffic control device 2% low
aPercentages add to more than 100% because multiple factors can contribute to a collision. bThis column shows whether the cause had high or low correlation (defined in Section 2C) to Corvallis collisions, or did not cause a single collision during Corvallis’s 4-year study period. A blank space means no similar cause was investigated in Corvallis’s study.
3D. Motor Vehicle vs Pedestrian Fatalities
We found three motor vehicle vs pedestrian fatality studies that fit our literature search criteria. A brief overview of the strengths and limitations of each study is given in the paragraphs below. Afterwards, the results of those studies are shown in tables.
A 1999 New York City study[14] stands out as being the most fascinating to read. The author is an eloquent writer, and every page contains quotable lines that can be used for local safety programs. This paper expertly mixes data, theory, and an intense plea for safety.
The 2007 Toronto paper mentioned in the pedestrian collision section also investigated fatalities. It is based on topology, but presents enough information to understand a limited set of behaviors.
A 2010 New York City study[15] is based on causes that were sometimes poorly described in police reports. As such, its findings contain contradictions. Additionally, there was a limit in the number of behaviors described per collision. Regardless of the limitations of the source data, this study did a strong job compiling and reporting the data.
Table 16: Pedestrian fatality data from a 1999 New York City study
Behavioral causes of New York City motor vehicle vs pedestrian fatalities % of fatalitiesa
Frequency in Corvallis motor vehicle vs pedestrian collisionsb
Motorist speed excessive to conditions 30% low Motorist turns into pedestrian in crosswalk, ped had right-of-way 17% high Motorist fails to obey stop sign or red light 10% low Pedestrian enters road or crosswalk suddenly 8% low Motorist struck pedestrian in unsignalized crosswalk 7% highc Motorist fails to yield to pedestrian on sidewalk 6% high Motorist backing up 3% Motorist intoxicated 3% low Motorist wrong way 2% none Motorist intentionally hits pedestrian 1% Motorist inattention 1% Pedestrian fails to yield to emergency vehicle 1%
aPercentages add to more than 100% because there can be multiple causes of a collision. bThis column shows whether the cause had high or low correlation (defined in Section 2C) to Corvallis collisions, or did not cause a single collision during Corvallis’s 4-year study period. A blank space means no similar cause was investigated in Corvallis’s study.
cCorvallis data looked at crosswalks as a whole, and did not differentiate between signalized and unsignalized crosswalks.

17
Table 17 – Pedestrian fatality data from a 2007 Toronto study
Behavioral causes of Toronto motor vehicle vs pedestrian fatalities % of fatalitiesa Frequency in Corvallis motor
vehicle vs pedestrian collisionsb Pedestrian fails to yield to motorist in roadway 34% low Motorist fails to yield to pedestrian in crosswalk, sidewalk, shoulder, or pedestrian crossover 27% high
Pedestrian crosses intersection without right-of-way 19% low Motorist fails to yield while turning 16% high Motorist failure to yield when entering/exiting parking space 13% low
aPercentages add to more than 100% because there can be multiple causes of a fatality. bThis column shows whether the cause had high or low correlation (defined in Section 2C) to Corvallis collisions, or did not cause a single collision during Corvallis’s 4-year study period.
Table 18: Pedestrian fatality data from a 2010 New York City study Behavioral causes of New York City motor vehicle vs pedestrian
fatalities and severe injuries % of fatalities + severe
injuriesa Frequency in Corvallis motor
vehicle vs pedestrian collisionsb Motorist failure to yield right of way 67% Motorist failure to yield to pedestrian crossing with signal 27% Pedestrian failure to yield right of way 21% Pedestrian failure to obey signal 20% low Motorist speed excessive to conditions 24% low Motorist unsafe backing 7% Motorist failure to yield to pedestrian in unsignalized marked crosswalk 6% Intoxication by motorist or pedestrian 5% low Failure to obey traffic control device by motorist or pedestrian 5% low Motorist road rage 4% Motorist unsafe passing or lane usage improperly 2% Pedestrian playing in road 1% Motorist failure to yield to road worker 1% Motorist failure to yield to child getting on/off school bus 0.1%
aPercentages add to more than 100% because there can be multiple factors to a fatality/severe injury. bThis column shows whether the cause had high or low correlation (defined in Section 2C) to Corvallis collisions, or did not cause a single collision during Corvallis’s 4-year study period. A blank space means no similar cause was investigated in Corvallis’s study.
3E. A Note on Fatalities
Knowing data about collisions does not provide the complete story regarding safety. Certain behaviors may be low contributors to collisions, but may increase the severity of injury when collision does occur. Some studies correlate behavior with injury severity, going as far as to separate behavior data in terms of no injury, moderate injury, severe injury, and fatality. Behaviors can have different rankings on different injury categories. This study feels that focusing on both ends of the spectrum, collision and fatalities, gives an overall description of safety. If a behavior is a low contributor to both collisions and fatalities, it can be considered as a low overall safety problem. However, it is always possible that a behavior could be a low contributor to both, yet be a high contributor to severe injury, in which case it would still be a safety concern.
Corvallis did not have enough bicycle or pedestrian fatalities during our 4 year study period to generate comprehensive conclusions. The best way to understand local fatalities would be to conduct a state-level study using the same methods as our Corvallis study. However, that would require obtaining police reports from police departments all around Oregon, which is outside the capabilities of our city-level organization. Therefore, we rely on this literature search to understand fatalities.
Fatalities are more difficult to investigate than collisions for two reasons. The first reason is that police reports only describe physical conditions immediately at the scene, typically along the lines of “cyclist transferred to hospital” or “pedestrian refused medical attention”. The reports mention if someone is obviously dead at the scene, but do not project into the future to state who died later from their injuries. It is likely that any set of collision data includes additional deaths that cannot be known just by reading police reports.
18
The second reason fatalities are hard to investigate is that even large cities do not have enough fatalities to generate proper statistics. It takes a city as large as New York City or an entire state to generate the numbers needed. However, it is not clear whether New York traffic patterns can be applied to other cities. State electronic databases are known to standardize reports, but in the process strip out much of the important information from local hand-written police reports. The 2011 North Carolina bicycle collision study, which used a state database, lamented this problem by stating[7]: “The development of effective countermeasures to help prevent these crashes is hindered by insufficient detail on standard police report forms. The information from the crash report forms is stored on computerized files. Analysis of this data can provide information on where bicycle-motor vehicle crashes occur (city street, two-lane roadway, intersection location, etc.), when they occur (time of day, day of week, etc.), and to whom they occur (age of victim, gender, level of impairment, etc.), but can provide very little information about the actual sequence of events leading to the crash.” 3F. A Note on Fault A compelling aspect of collision studies that many people want to know is: who is at fault for the majority of collisions? When these studies are released to the public, news articles often emphasis this aspect. For this reason, the following tables summarize fault throughout our literature search, wherever fault could be determined. Not every study provided this information.
Table 19: Determination of fault in car/bicycle studies Study Type of collision or fatality studied % of Motorist Faulta % of Cyclist Fault
Corvallis 2016 car/bike collision 77% 23% Vancouver, Canada 2015 car/bike collision 93% 7% Minneapolis 2013 car/bike collision 53% 47% San Francisco 2012 car/bike collision 48% 52% North Carolina 2011 car/bike collision 58% 42% Orlando 2004 car/bike collision 58% 42% Toronto 2003 car/bike collision 80% 20% New York City 2000 car/bike fatality 74% 26%
aFor studies that provided one cause per collision, “% of fault” refers to percentage of collisions caused by that party. For studies that provide multiple behaviors per collision, “% of fault” refers to percentage of behaviors caused by that party.
Table 20: Determination of fault in car/pedestrian studies Study Type of collision or fatality studied % of Motorist Faulta % of Pedestrian Fault
Corvallis 2016 car/ped collision 89% 11% San Francisco 2012 car/ped collision 68% 32% Toronto 2007 car/ped collision 56% 44% New York City 2010 car/ped fatality 83% 17% Toronto 2007 car/ped fatality 43% 57% New York City 1999 car/ped fatality 90% 10%
aFor studies that provided one cause per collision, “% of fault” refers to percentage of collisions caused by that party. For studies that provide multiple behaviors per collision, “% of fault” refers to percentage of behaviors caused by that party.
4. Corvallis’s Causes of Collisions Defined, Discussed, and Compared to Other
Studies This section compares Corvallis’s results to the results found in our literature review. Corvallis’s results from
Table 1 and Table 2 are central to this discussion, and you may wish to print them for reference while reading this section. Each behavior is formally defined as it was used in the Corvallis study. This overview of all studies allows us to discover trends that would not otherwise have been known, determine which findings are consistent or inconsistent, and understand each behavior in a more comprehensive manner than could be known from reading one study alone.

19
In this section, we sometimes discuss the ranking of an issue in a certain study, and other times discuss the percentage of collisions/fatalities it was involved in. Both approaches have strengths and weaknesses, so we use both depending on which is the most illuminating for the topic at hand. Rank is useful as a general comparison, but some studies investigated a larger list of issues than others. Percentages are useful to know the exact impact of an issue, but don’t help prioritize it against other issues. A.) Failure to Yield to Bicycle or Pedestrian in Crosswalk or Sidewalk – This can apply to motorists or bicyclists. Motorists and bicyclists in traffic lanes or emerging from driveways or parking lots must yield to bicyclists and pedestrians in a crosswalk or sidewalk. This requirement comes directly from multiple state laws.
In Corvallis, this motorist failure is the #1 cause of car/pedestrian collision, causing a staggering 69%. This is almost twice as many collisions as the #2 cause, is more than 6 times the #3 cause, and is more than the #3 through #18 causes combined (see Table 1). It is a remarkable finding that one behavior so massively overshadows other behaviors. This motorist failure is also the #4 cause of car/bike collision, causing 15% of collisions and more collisions than any bicycling behavior.
Other studies also find this motorist failure to be a leading contributor to car/pedestrian collisions and fatalities. This issue demands increased education and enforcement. As children, we were taught to look both ways before crossing the street. As adults, it is more important to look both ways before driving across sidewalks and crosswalks. B.) Failure to Yield While Turning – This can apply to motorists or bicyclists. This refers to attempting a turn and colliding with another party that has the right-of-way.
In Corvallis, Motorist failure to yield while turning is the #1 cause of car/bike collisions, and the #2 cause of car/pedestrian collisions. The moment before a turn is a moment to be the most aware of one’s surroundings. A person is leaving their lane, moving their entire vehicle ninety degrees, and entering a new lane. It is imperative to take stock of the surroundings and ensure the path is clear to undertake such a big motion. One cannot pretend that other traffic does not exist. If one turns through a bike lane, sidewalk, crosswalk, or traffic lane without looking and waiting, one is likely to turn into the path of another person. Studies routinely find this to be a leading cause of collisions, as shown in Table 21. Table 21 has a slight limitation that some studies bundled failure to yield while turning with other behaviors or sometimes defined it slightly differently. Results appear in Table 21 only if the bundled behaviors are rare and the definition is similar.
In Corvallis, cyclist failure to yield while turning is a low contributor to collisions. Throughout the literature, the percentage of collisions caused by this is quite constant. The 2007 North Carolina study is the one outlier, oppositely finding that cyclists turning is highly correlated with collisions and fatalities. Table 21: Literature comparison of Failure To Yield While Turning
Study Type of collision or fatality
studied Incidence of Motorist Fails to
Yield While Turning Incidence of Cyclist Fails
to Yield While Turning Corvallis, Oregon 2016 car/ped collision 40%, #2 cause Corvallis, Oregon 2016 car/bike collision 42%, #1 cause 5% Vancouver, Canada 2015 car/bike collision 21%, #2 cause San Francisco 2012 car/bike collision 18%, #1 cause 2% Portland, Oregon 2012 [16] car collision 27%, #2 cause Portland, Oregon 2012 car fatality + incapacitating injury 27%, #2 cause North Carolina 2011 car/bike collision 11%, #5 cause 8% Corvallis, OR 9th Street 2010 [17] car collision 45%, #1 cause North Carolina 2007 car/bike collision 10% 24%, #2 cause North Carolina 2007 car/bike fatality 3% 35%, #1 cause Toronto 2007 car/ped collision 22%, #3 cause Toronto 2007 car/ped fatality 16%, #3 cause Orlando 2004 car/bike collision 8% 6% Toronto 2003 car/bike collision 30%, #1 cause 2% New York City 2000 car/bike fatality 15%, #3 cause New York City 1999 car/ped fatality 17%, #2 cause

20
C.) Failure to Yield to Rider in Bicycle Lane – This only applies to motorists. When crossing or turning through bicycle lanes, motorists must yield to traffic in bicycle lanes. For more details, refer to pages 91-92 of the Legal Guide for Oregon Bicyclists[25].
This is a large problem in Corvallis. This occurs in nearly one-third of all of Corvallis car/bike collisions, and is the #2 cause of collisions.
The 2003 Toronto study[3] is a useful contrast to Corvallis, as it was conducted before Toronto had bike lanes. In its report, the author described the theoretical changes to its collision results once bike lanes would become available: “Bike lanes and bike paths do not eliminate interactions between cyclists and motorists at intersections, where many collisions occur. However, the presence of bicycle lanes can serve to remind motorists to be alert for cyclists, and they can also channel cyclists into a more predictable and visible position on the road.”
Now in Corvallis, a city packed with bike lanes, the experiment has been conducted and the results do not support that hypothesis. Motorists failure to yield while turning was the #1 cause of collision in Toronto and still holds that ranking in Corvallis. Additionally, Corvallis has a high rate of Motorist Fails to Yield to Rider in Bicycle Lane. The bicycle lane has not sufficiently reminded motorists about the presence of cyclists nor sufficiently raised the visibility of cyclists. It is frequently documented in Corvallis police reports that the motorist admitted to not seeing the cyclist until it was too late. Of all 134 car/bike collisions, the motorist only reported seeing the cyclist once. This was a case where the motorist turned left at an intersection, misjudged his car’s turning radius, and struck a stationary cyclist waiting in a turn lane.
A large Oregon State University[18] study devoted to bike lane “right hook” collisions (where a motorist makes a right turn into the path of a cyclist) sheds light on how to understand and prevent these. This study found three foundational causes:
1.) Motorists are most likely to cause a right hook when they arrive at an intersection first and the cyclist in a bike lane approaches later. Risk increases when other vehicles or pedestrians divert the driver's attention, and when cyclists, traveling at higher speeds than the slowing car, appear in side-view mirrors for less time.
2.) In two-thirds of right hooks and near misses, the foundational cause was the driver's failure to scan for cyclists in the bike lane. If the motorist does not look, no amount of bright clothing or lighting on the part of the cyclist can prevent that collision.
These first two foundational causes of right hooks are already discussed in traffic education classes, but perhaps are not stressed as much as they should be. Drivers Ed commonly teaches the phrase “turn your head before turning your wheels”. Bicycle traffic classes teach that right hooks are nearly eliminated when the bicyclist rides in the middle of the traffic lane.
3.) Motorists often did not know of their legal requirement to yield to bike lanes, and instead assumed cyclists should stay out of their way. Motorists and cyclists alike must be aware that it is a Class B traffic violation for motorists to obstruct bike lane traffic. Bicycle lawyer Ray Thomas best explains this by stating that a bicycle’s right-of-way in a bike lane is similar to that of a locomotive’s right-of-way on a railroad track[25].
D.) Failure to Obey Traffic Control Device - This can apply to motorists, bicyclists, or pedestrians. Traffic control devices are the metal signs and electric signals that dictate traffic flow. These include Stop signs, Yield signs, red lights, and Don’t Walk signals.
In Corvallis, motorist failure to obey these devices contributes frequently to collisions with bicycles, and is the #3 cause of collision. Bicyclist failure to obey these devices is the most common bicyclist cause of collision, and should therefore be stressed in bicycle education classes. However when addressing overall car/bike safety, it is only the 5th ranked cause of collision.
For cyclists, this is an issue that draws considerable societal attention. When reviewing other studies, the highest ranking for cyclist fails to obey traffic control devices as a cause of collision was #3. In the majority of studies, it did not make the top 5. In Corvallis, education and enforcement would be better spent trying to accomplish higher compliance of motorists to obey traffic control devices. Table 22 tallies the ratio of motorists to cyclists that cause car/bike collisions by disobeying traffic devices throughout our literature search. An example ratio of “2 to 1” means that motorists cause two collisions for every one caused by a cyclist. The spread of results is surprising. Slightly more

21
studies found motorists as the larger problem, and those found motorists to be the larger problem by a much wider margin.
Table 22 – Determining if cyclists or motorists cause more car/bike collisions by disobeying a traffic control device Study Ratio of motorists to cyclists that caused car/bike collision by disobeying a traffic device
Corvallis, Oregon 2016 1.5 to 1 Vancouver, Canada 2015 7.8 to 1 Minneapolis 2013 0.4 to 1 San Francisco 2012 0.5 to 1 North Carolina 2011 1.0 to 1 Orlando 2004 1.0 to 1 Toronto 2003 4.4 to 1
Pedestrian failure to obey traffic control devices only caused a single collision in Corvallis during our four-year study period. Other pedestrian studies sometimes did not report on this behavior or reported it only for either pedestrians or motorists but not both. Where data is available, it is shown in Table 23.
Table 23 – Literature comparison of Failure to Obey Traffic Control Device in car/pedestrian studies
Study Type of collision or fatality studied Incidence of Failure to Obey Traffic Control Device Corvallis 2016 car/ped collision motorist 2%, pedestrian 2% Louisville 2013 car/ped collision motorist 2% San Francisco 2012 car/ped collision motorist 4%, pedestrian 6% New York City 2010 car/ped fatality pedestrian 20% New York City 1999 car/ped fatality motorist 10%
E.) Failure to Stop Before Sidewalk When Emerging from Driveway, Alley, or Parking Lot – This can apply to motorists or bicyclists. This requirement comes directly from state law. Vehicles emerging from a driveway, alley, or parking lot are expected to come to a complete stop before the sidewalk and remain stopped until it is clear to proceed forward.
In Corvallis, cyclists did not cause a single collision due to this behavior. In Corvallis, this motorist behavior was a significant contributor to collisions with bicycles. It caused nearly twice as many collisions as the next most frequent cause, cyclist wrong way, which attracts far more societal attention.
The literature has slightly mixed agreement. Some studies agree with Corvallis, while others found somewhat decreased incidences of motorist failures and somewhat higher incidences of cyclist failures. F.) Wrong Way – This can apply to motorists or bicyclists. For motorists, this refers to the legal requirement to drive in the intended direction. For bicyclists, this refers to riding opposite the direction of traffic in bike lanes or traffic lanes. Bicyclists in Oregon have legal right-of-way in bike lanes regardless of which direction they travel[19]. However, bicycle safety programs expend significant resources[20] to discourage this behavior. Therefore, we tracked this as a bicycle-related cause of collision. Failing to track this would have been a glaring omission for this study. For further details and history of the law giving bicyclists the right to travel in either direction of a bicycle lane, refer to pages 33-34 of the Legal Guide for Persons on Foot[21].
This cycling behavior receives significant attention. In Corvallis, of the cyclist behaviors that cause collision, this is the second most common, and this issue should therefore receive emphasis in cycling education programs. However, of all behaviors that cause collisions, this ranked #7, causing a mere 6% of all collisions. If one seeks to reduce collisions, other issues require more attention. For example, there is little societal pressure for motorists to come to a complete stop behind the sidewalk when emerging from a driveway or parking lot, even though that behavior causes nearly twice as many car/bike collisions as cyclists going the wrong way.
The literature agrees that wrong-way cycling is a low contributor to collisions. In fact, Corvallis had the highest percentage of wrong-way cycling collisions of all studies, with the exception of the 2007 North Carolina study, which

22
found that 31% of collisions involved wrong-way cycling. However, that 2007 North Carolina study is an outlier with respect to several findings. For fatalities, the literature agrees that wrong way cycling is more significant, and is always found in the middle of the list of causes of fatalities. G.) Speed Excessive to Conditions – This can apply to motorists or bicyclists. For the concept of speeding, Oregon uses the legal concept of the basic speed rule, which specifies that speed must be reasonable with respect to all traffic conditions.
Speed is not often mentioned in police reports, so in most cases we could make no assumption about speeds. Even when speed was mentioned, we were conservative when counting this issue. An argument can be made that in many collisions, speed was excessive to conditions because a lower speed would have allowed the car or bicycle to brake in time. However, due to lack of data and our conservativeness, we did not find speed as a large contributor to collisions in Corvallis.
Every collision study that investigated speeding used a similar phrase stating that that speed should be relative to road conditions. Many studies did not investigate speeding. Those that did found mixed results. Some found speeding to be a relatively low contributor, and others found it to be a high contributor. Notably, New York City found motorist speeding to be the #1 cause of pedestrian fatalities and the #2 cause of bicycling fatalities. San Francisco found motorist speeding to be the #3 cause of pedestrian injury. Interestingly, San Francisco also found cyclist speeding to be the #2 cause of bicycle/car collision, yet did not explain such a counter-intuitive finding.
The 2011 American Automobile Association study[22] plotted motorist speed with pedestrian injury severity. It also conducted a literature search, demonstrating that numerous studies reached the same conclusion. All studies show that between 15-20 mph is a critical speed, beyond which pedestrian fatalities rise sharply with small increases in speed. H.) No Lights/Reflectors – This can apply to motorists or bicyclists. For bicyclists, during limited visibility conditions, state law requires a front light and a rear reflector. For collisions where cyclists lacked proper lighting and the motorist also committed at least one major legal violation, it is impossible to know if this cycling behavior actively caused the collision or was merely an incidental factor. However, we counted this every time it was mentioned in a police report.
For as much societal attention as this receives, this contributed to a mere 5% of collisions in Corvallis. A universally found result is that the majority of car/bike and car/pedestrian collisions occur during daylight, clear, and dry conditions where lighting is not a factor. Studies do not vary on this finding. When collisions are plotted by time-of-day, collision numbers closely match the number of motor vehicles on the streets, with spikes in collisions matching AM and PM traffic. There is so much data on this topic that Appendix A is devoted to displaying all the relevant graphs and information.
For car/bike fatalities, only the 2007 North Carolina study[6] contained lighting and weather information. A screenshot from that study, titled “Bicyclist Injury Severity in bicycle-motor vehicle accidents”, is shown in Appendix A. Looking at the raw numbers in the “fatal injury” column shows that, similar to collisions, the vast majority of car/bike fatalities occur in clear and dry conditions. The majority of fatalities occur in daylight, but not by as wide a margin as for collisions.
Lighting findings are mixed for car/pedestrian fatalities. The 2010 New York City study[15] finds that the majority of car/pedestrian fatalities and serious injuries occur in daylight and dry conditions. However, the 2014 National Highway Traffic Safety Administration data[23,24] shows that the majority of pedestrian fatalities occur in darkness. Data from both reports are shown as graphs in Appendix A.
Bicycle safety messages that focus on lights are ineffective because they address a minority of collisions and fatalities. This is a large problem because cyclists are often told they will be safe if they have lights, with little or no information about avoidance techniques for the majority of hazardous situations. I.) Bicycle Enters Crosswalk Too Quickly/Suddenly, or Enters/Crosses Driveway or Parking Lot Faster Than a Walking Speed – This only applies to bicyclists. This definition comes directly from Oregon law. Although bicycles have right-of-way within crosswalks, bicyclists may not leave the curb

23
and move in front of a vehicle so suddenly as to cause an immediate hazard. When vehicles approach, bicycles on sidewalks must approach and enter crosswalks and approach and cross driveways and parking lots at speeds no greater than an ordinary walk. These behaviors are all mandated under the same law, therefore these behaviors are categorized together in this study.
In Corvallis, this caused a low 5% of collisions. J.) No attempt at safety – This can apply to motorists, bicyclists, or pedestrians. This transcends being distracted, making a mistake, or not understanding right-of-way rules. These are extreme situations where the victim was at the wrong place at the wrong time. The perpetrator was out of control or made no attempt to follow roadway rules. Examples might include an intentional act of road rage, having a heart attack while on the road, or a high speed police chase. K.) Unsafe Lane Change – This can apply to motorists or bicyclists. This refers to causing a collision while attempting to move laterally into a different lane while still traveling in the same direction. This differs from unsafe passing because in this case, the perpetrator had no intention of passing a slower vehicle. For bicyclists, this also includes starting from a sidewalk and moving laterally into a bicycle lane or traffic lane.
For both motorists and bicyclists, this is a low contributor to collisions in Corvallis. Studies that investigated this behavior found similar results. L.) Unsafe Passing – This can apply to motorists or bicyclists. This refers to collisions caused while one vehicle attempts to pass another. For our study, a pass is defined as when two vehicles start in the same lane, and the vehicle behind moves laterally and increases speed. Oregon law sometimes uses the term overtaking to mean the same as passing. Other studies also use the terms passing and overtaking interchangeably.
Motorist unsafely passes cyclist was the #1 cause of car/bike fatality in the 2011 North Carolina study (39% of fatalities) and the 2000 New York City study (25% of fatalities), and was the #2 cause of fatality in the 2007 North Carolina study (32% of fatalities, only 3% behind the #1 cause). Therefore, motorist unsafely passes cyclist should be recognized as the top cause of bicycle fatality. This behavior should therefore be considered analogous to DUI, which is the top cause of motor vehicle fatality[16]. DUI and motorist unsafely passes cyclist justify the most safety resources, education, and enforcement due to their close association with fatalities.
Corvallis shows a low incidence of motorist unsafely passes cyclist collisions compared to the literature. This is likely due to the high number of bike lanes in Corvallis. Other studies show an interesting spread of results, as shown in Table 24.
Table 24: Literature comparison of Motorist Unsafely Passes Cyclist collisions
Study % of car/bike collisions caused by Motorist Unsafely Passes Cyclist Corvallis, Oregon 2016 2% Vancouver, Canada 2015 6% San Francisco 2012 0.8 % North Carolina 2011 17% North Carolina 2007 11% Orlando 2004 8% Toronto 2003 12%
M.) Failure to Yield When Entering/Exiting a Parking Space – Although this can apply to motorists or bicyclists, it is hard to imagine a situation where bicycle parking creates a right-of-way conflict. Motorists pulling into or out of onstreet parking must always yield to bicycle lane traffic. For more details, refer to page 66 of the Legal Guide for Oregon Bicyclists[25].
For car/pedestrian collisions, this only caused 2% of Corvallis collisions, which is slightly less than other studies. The Toronto study was an outlier, showing that this contributed to 18% of car/ped collisions and 13% of

24
car/ped fatalities. Those percentages are surprisingly high since fatalities are less likely at low speeds, as would be the case in parking situations.
For car/bicycle collisions, Corvallis and the literature agree that this is a low contributor to collisions. N.) Rear End – This can apply to motorists or bicyclists. This occurs when two vehicles are in the same lane and oriented in the same direction, and the front portion of the offending vehicle collides with the rear portion of the victim’s vehicle.
Because of the many bicycle lanes in Corvallis, there are fewer physical opportunities for rear-ends to occur between cars and bicycles. There were only two cases of bicycles rear-ending motorists. In one case, the cyclist ran into a car parked on the side of the road. In the other case, a cyclist had his head down in the rain and rode into a vehicle double parked and blocking the traffic lane. Not a single motorist rear-ended a cyclist. O.) Intoxicated – This can apply to motorists, bicyclists, or pedestrians. This refers to being intoxicated by drugs or alcohol. This issue can blur the line between behavioral cause and incidental factor. We always counted intoxication when the intoxicated person violated the other person’s right-of-way. However, when an intoxicated person’s right-of-way was violated, it was difficult to determine the role of intoxication. For example, if a cyclist ran a red light and got hit by an intoxicated driver otherwise traveling legally, did intoxication cause that collision? Could a sober person in the same situation have avoided the collision? Was the intoxicated party engaged in other illegal behaviors? The determination was made on a case-by-case basis.
Other studies have struggled with how and when to count intoxication. The Orlando study counted intoxication too liberally in their small sample of fatalities and stressed cyclist intoxication as the common theme, even though a closer look at their data showed that several of the intoxicated cyclists were victims of right-of-way violations so egregious that sober cyclists would have been unlikely to survive. The 1999 New York pedestrian study took a strong stance on the opposite end of the spectrum, stating: Of course, the pedestrian’s state of mind [ie, intoxication] should have no bearing in determining culpability when the driver speeds, mounts the sidewalk or otherwise violates the pedestrian’s right-of-way, as occurs in most pedestrian fatalities in New York City.
Intoxicated driving is a low contributor (3%) to motor vehicle collisions [16], so it is no surprise to see similar low numbers contributing to bicycle and pedestrian collisions. However, intoxicated driving is the top cause (63%) of motor vehicle fatalities[16], so it is surprising that similar high percentages are not always seen in bicycle and pedestrian fatalities. A possible reason for these low incidences, discussed in two studies, is that hit and run is correlated to intoxication[26]. Collision and fatality statistics only apply where data is known. For hit & runs, studies may throw out the collision entirely for lack of complete data or may include what information is known and therefore not include intoxication even though it is suspected.
Although we do not have enough fatality studies from enough locations to form conclusive trends, it is worth noting that all fatality studies with low intoxication incidences come from New York City. The spread of results is shown in Table 25.

25
Table 25: Literature comparison of Intoxication. Blank spaces means that data was not given in that study. Study Type of collision or fatality studied Incidence of intoxication
Corvallis, Oregon 2016 car/ped collision MOTORIST: 0% PEDESTRIAN: 4% Corvallis, Oregon 2016 car/bike collision MOTORIST: 1% CYCLIST: 1% Louisville 2013 car/ped collision MOTORIST: 2% Minneapolis 2013 car/bike collision MOTORIST: 1% CYCLIST: 6% Portland 2012 car/bike fatality MOTORIST or CYCLIST (data not separated): 54% Portland 2012 car/ped fatality MOTORIST or PEDESTRIAN (data not separated): 45%
New York City 2010 car/ped fatality MOTORIST or PEDESTRIAN (data not separated): 5%, and suspected for motorists in the 21% of hit and runs cases
North Carolina 2011 car/bike collision MOTORIST: 2% suspected CYCLIST: 8% suspected North Carolina 2007 car/bike collision MOTORIST: 2% CYCLIST: 6% North Carolina 2007 car/bike fatality MOTORIST: 12% CYCLIST: 21%
Orlando 2004 car/bike collision MOTORIST: 1% at the scene, and suspected in the 16% of collisions that were hit & run
CYCLIST: 2%
Toronto 2003 car/bike collision MOTORIST: 0.2% CYCLIST: 0.6% New York City 2000 car/bike fatality MOTORIST: 6% New York City 1999 car/ped fatality MOTORIST: 3%
P.) Other – This can apply to motorists, bicyclists, or pedestrians. As comprehensive as our list of causes is, strange situations occur where there is no applicable category. Q.) Motorist Opens Door Into Bicycle Traffic – This only applies to motorists. State law prohibits opening a car door in any way that interferes with traffic in traffic lanes, bicycle lanes, or sidewalks.
This issue receives significant attention in bicycling education. Cyclists are instructed to ride far enough away from parked cars such that when doors swing open, the cyclist will not collide with a steel wall or get pushed into the adjacent traffic lane. However, many bicycle lanes are built next to on-street parking, which manufactures this type of conflict. Driver education in European countries stresses opening car doors using the hand farthest from the door and reaching across your body, forcing you to turn and look at bike lanes before opening the door. Bike Law, a national network of bicycle lawyers, shared their data[27] in 2015 that “Doorings are by far the most common type of case we see.” However, it is not clear whether that applies for the entire Bike Law network or only the individual law firm presenting the information. For all these reasons, it is instructive to scrutinize the literature regarding this issue. Table 26 shows an interesting spread of results.
This issue is likely underrepresented throughout all studies, as the general public is typically unaware of local laws prohibiting this type of door movement, and when such collisions occur, does not recognize it as a traffic collision that requires calling the police.
Table 26: Literature comparison of Motorist Opens Door Into Bicycle Traffic Study Incidence of Motorist Opens Door Into Bicycle Traffic
Corvallis, Oregon 2016 1% of collisions, #17 cause of collision Vancouver, Canada 2015 15% of collisions, #3 cause of collision San Francisco 2012 8% of collisions, #5 cause of collision Orlando 2004 zero reported incidences during their 2 year study period Toronto 2003 12% of collisions, #4 cause of collision New York City 2000 6% of fatalities, #7 cause of fatality
R.) Passing a Vehicle Stopped For a Pedestrian – This can apply to motorists or bicyclists. This requirement comes directly from state law that makes it illegal to pass a vehicle that is stopped at a crosswalk for a pedestrian.
There is no indication in the Corvallis data or throughout the literature that this is a frequent problem.

26
S.) Distracted By Electronic Device – This can apply to motorists, bicyclists, or pedestrians. Our Corvallis study defines this as being distracted by any electronic device such as cell phones or headphones. Even though Oregon law allows hand-free cell phone use while driving, we tracked all cell phone usage as a cause of collision. A common message from bicycling safety programs is to not listen to headphones while riding. Because of the pervasiveness of this message, even though riding with headphones is legal, we tracked any type of headphone or music usage under this category. Although pedestrians are legally free to indulge in electronics, any related distraction that caused a collision was tracked under this category.
This is likely underreported for motorists. After a collision, motorists can quickly put away their device. Electronic device usage would not be mentioned in the police report unless witnesses reported seeing it. Drivers that operate their phones below their windows make it additionally hard for witnesses to spot this. Oppositely, for bicyclists and pedestrians, this behavior is nearly impossible to hide.
In Corvallis’s four-year study period, this behavior was involved in zero car/bike collisions and only two car/pedestrian collisions (in both cases the motorist was distracted). Pedestrian and bicycle electronic distraction did not cause a single collision. Every year, several communities around the country attempt to pass legislation to ban pedestrians and/or bicycles from using electronic devices. Our data clearly shows that would be a waste of resources, and would lead to harassment of cyclist and pedestrians with minimal safety benefit. T.) Pedestrian Failure to Yield to Motorist on Roadway – This only applies to pedestrians. This refers to a pedestrian crossing a road outside of a crosswalk. By state law, pedestrians may cross the road anywhere, after yielding to vehicles. The city of Corvallis has no further modifications to state law on this matter.
In Corvallis, the #1 and #2 causes of car/pedestrian collision massively overshadow all other causes. Pedestrian failure to yield to motorist on roadway is far less frequent, yet is still #3 on that list. Having caused five collisions over four years, this is the top pedestrian behavior that led to collisions.
In the Toronto study, this behavior caused 22% of collisions and 34% of fatalities. In the San Francisco study, this caused 20% of collisions. In the Louisville study, pedestrian darts into road was a factor in 18% of collisions, pedestrian walking in road in 17%, and pedestrian not at intersection in 12%. U.) Pedestrian Enters Crosswalk Too Suddenly – This only applies to pedestrians. By state law, although pedestrians have right-of-way within crosswalks, pedestrians may not step off the curb and in front of a vehicle so suddenly as to cause an immediate hazard.
In Corvallis, this did not cause a reported collision during our four-year study.
5. Results: Synthesis of Corvallis Data with the Literature Using the Focus on the Five approach to safety, what are the top five causes of traffic danger for bicyclists and pedestrians? The answer depends on the specific problem being addressed. The following sections present the different “top fives” based on different desired outcomes. Collision information comes from Corvallis’s study and fatality information comes from our literature search. We therefore believe these results apply to any small US city with many bicycle lanes, and are a strong starting point for tackling safety problems anywhere in the United States. 5A. Reducing Motor Vehicle Collisions with Bicycles
If one wants to reduce car/bicycle collisions, Figure 4 provides the necessary guidance. Education and enforcement should focus on the top causes, and can be relaxed from the bottom causes. The top five problematic behaviors are:
#1 Motorist Failure to Yield While Turning #2 Motorist Failure to Yield to Rider in Bike Lane #3 Motorist Failure to Obey Traffic Control Device (red light, stop sign, etc) #4 Motorist Failure to Yield to Bicycle in Crosswalk or Sidewalk

27
#5 Cyclist Failure to Obey Traffic Control Device (red light, stop sign, etc).
Figure 4 – Bar graph of Corvallis, Oregon’s car/bicycle collisions
5B. Reducing Motor Vehicle Collisions with Pedestrians
If one wants to reduce car/pedestrian collisions, Figure 5 provides the necessary guidance. Education and enforcement should focus on the top causes, and can be relaxed from the bottom causes. The data is so heavily weighted towards the two top causes of collision that a Focus on the Two approach will be maximally effective:
#1 Motorist Fails to Yield To Pedestrian in Crosswalk or Sidewalk #2 Motorist Fails to Yield While Turning
28
Figure 5 – Bar graph of Corvallis Oregon’s car/pedestrian collisions
5C. Reducing Motor Vehicle Collisions with Bicycles and Pedestrians
Combining pedestrian and bicycle issues might be easier to digest in some education settings. Bicycles+pedestrians are often addressed as a combined group by organizations, governments, and studies. Corvallis’s car/bicycle and car/pedestrian collision numbers can be summed to address bicycles+pedestrians as a combined group. The top five problematic behaviors are:
#1 Motorist fails to yield while turning (occurred 74 times in our study, 56 to cyclists and 18 to pedestrians) #2 Motorist fails to yield to pedestrian or cyclist in sidewalk/crosswalk (occurred 51 times in our study, 20 to
cyclists, and 31 to pedestrians) #3 Motorist fails to yield to rider in bike lane (occurred 39 times in our study) #4 Motorist fails to obey traffic control device (occurred 26 times in our study, 25 to cyclists and once to
pedestrians) #5 Cyclist or pedestrian fails to obey traffic control device (occurred 18 times in our study, 17 times by cyclists,
once by a pedestrian) 5D. Reducing Motor Vehicle vs Bicycle Collisions & Fatalities
Fatalities may have substantially different causes from collisions. Certain behaviors may rarely cause collision, but are likely fatal when they occur. Addressing collisions plus fatalities is a more thorough approach to safety, and is ideal in scenarios such as traffic education classes.
Defining the five top problems as a synthesis of collisions and fatalities requires augmenting Corvallis’s collision results with fatality results from other studies. Due to the complexity of combining results from different studies, we can determine the most common findings throughout the literature, but we cannot directly rank them against each other.
If one wished to reduce car/bicycle collisions and fatalities, these are the top five problematic behaviors (encompassing Corvallis’s top three causes of collisions and the top causes of fatalities found in every study in our literature search):
• Motorist or cyclist fails to yield while turning • Motorist unsafely passes cyclist • Motorist fails to yield to rider in bike lane • Motorist fails to obey traffic control device
29
• Motorist speed excessive to conditions 5E. Reducing Motor Vehicle vs Pedestrian Collisions & Fatalities
Addressing collisions plus fatalities is a more thorough approach to safety, and is ideal in scenarios such as traffic education classes. Defining the five top problems as a synthesis of collisions and fatalities requires augmenting Corvallis’s collision results with fatality results from other studies. Due to the complexity of combining results from different studies, we can determine the most common findings throughout the literature, but we cannot directly rank them against each other.
If one wished to reduce car/pedestrian collisions and fatalities, these are the top five problematic behaviors (encompassing Corvallis’s top three causes of collisions and the top two to six causes of fatalities found in every study in our literature search).
• Motorist fails to yield to pedestrian in crosswalk/sidewalk • Motorist fails to yield while turning • Motorist speed excessive to conditions • Motorist fails to obey traffic control device • Pedestrian fails to yield to motorist on roadway
5F. Reducing Motor Vehicle Collisions and Fatalities involving Bicycles or Pedestrians
If one wanted to combine collisions+fatalities and also combine bicyclists+pedestrians, there are five behaviors that top all studies. There was no guarantee that a set of five such behaviors would exist. The fact that this common set exists is a testament to the similarity of the issues throughout the literature, even accounting for studies with outlying results. These are the top five problematic behaviors (encompassing Corvallis’s top cause of car/bike collisions, Corvallis’s top three causes of car/ped collisions, and the top one to three causes of fatalities found in every study in our literature search):
• Motorist fails to yield to pedestrian in crosswalk/sidewalk • Motorist/cyclist fails to yield while turning • Motorist speed excessive to conditions • Motorist unsafely passes cyclist • Pedestrian fails to yield to motorist in roadway
6. Conclusion In summary, reducing the number of collisions between people driving cars and people walking or bicycling is within our reach. A thorough review of Corvallis’s collision data combined with data throughout the United States and Canada reveals strong patterns in their results. There are common, consistent behaviors that cause collisions and fatalities. These behaviors are: motorist failure to yield to pedestrians in the crosswalk/sidewalk, motorist/cyclist failure to yield while turning, motorist speed excessive to conditions, motorist unsafely passes cyclist, and pedestrian failure to yield to motorist on the roadway. Using a Focus on the Five approach to safety, we now have a clear vision of where resources, education, and enforcement efforts should be focused. We can make the largest difference by ensuring road users know the right-of-way rules associated with each of these behaviors and pay attention to them at all times. Appendix A. Lighting and Weather Data From All Studies The literature contains a wealth of data regarding lighting and weather conditions. This section allows us to display all the information from our literature search. A universal finding for car/car studies, bike/car collisions, bike/car fatalities, and pedestrian/car collisions is that the majority occur during daylight, clear, and dry conditions. Pedestrian/car fatality studies are split between finding darkness or daylight as the majority condition. The overwhelming conclusion is that educational messages that equate safety with lights are ineffective, as they do not address the majority of dangerous situations that cyclists and pedestrians face. Collisions are not correlated to

30
darkness, but are instead closely correlated to general traffic volumes, with spikes in collisions matching AM and PM traffic peaks. Each box below is a collage of screenshots from its respective study. All relevant lighting, weather, and time-of-day information have been cut and pasted together for easy viewing.

31

32

33

34

35
1 McLeod, K. (May 2014) “Every Bicyclist Counts”, League of American Bicyclists 2 Mionske, B. (Nov 8, 2007) “Legally Speaking – A Fatal Bias”, BicycleLaw 3 (2003) "City of Toronto Bicycle/Motor-Vehicle Collision Study", Transportation Infrastructure Management Section 4 Wilson, M., (undated, 2004 or later) “Orlando Area Bicyclist Crash Study: A Role-Based Approach to Crash Countermeasures”, MetroPlan
Orlando 5 Nabors, D. (May 2012) “Bicycle Road Safety Audit Guidelines and Prompt Lists”, Federal Highway Administration, report # FHWA-SA-12-
018 6 Kim, J. (2007) “Bicyclist injury severities in bicycle-motor vehicle accidents”, Accident Analysis & Prevention, volume 39, pages 238-251 7 (Aug 2011) “North Carolina Bicycle Crash Types 2005-2009”, North Carolina Department of Transportation 8 (Aug 28, 2012) “2010-2011 San Francisco Collisions Report”, San Francisco Municipal Transportation Agency 9 (Jan 15, 2013) “Understanding Bicyclist-Motorist Crashes in Minneapolis, Minnesota”, City of Minneapolis Public Works Department 10 (Jan 22, 2015) “Cycling Safety Study”, City of Vancouver 11 Komanoff, C. (May 2000), “The only good cyclist. NYC Bicycle Fatalities - Who’s Responsible?”, Right of Way 12 (Jan 2007) “City of Toronto Pedestrian Collision Study”, Traffic Data Centre and Safety Bureau 13 (Oct 3, 2013), “Understanding Pedestrian Crashes in Louisville, KY 2006 – 2010”, Public Works Department Louisville Metro 14 Komanoff, C. (March 199) “Killed By Automobile Death in the Streets in New York City 1994-1997”, Right of Way 15 Shin, H. (Aug 2010) “The New York City Pedestrian Safety Study & Action Plan: Technical Supplement”, New York City Department of
Transportation 16 (April 2012) “Metro State of Safety Report”, Portland Metro 17 (Mar 15, 2010) “9th Street Improvement Plan”, Corvallis Area Metropolitan Planning Organization

36
18 Hurwitz, D. (2015) “Towards Effective Design Treatment For Right Turns At Intersections With Bicycle Traffic”, Oregon Department of
Transportation, Project SPR 767 19 (Oct 2015), “Lawyers Answer Questions”, Corvallis Right of Way, retrieved May 28, 2016 20 (2010) “Oregon Bicyclist Manual”, Oregon Department of Transportation 21 Thomas, R. (2008) “Oregon Pedestrian Rights: A Legal Guide for Persons on Foot”, Willamette Pedestrian Coalition, 1st edition 22 Tefft, B. (Sept 2011) “Impact Speed and a Pedestrian’s Risk of Severe Injury or Death”, American Automobile Association Foundation for
Traffic Safety 23 (May 2016) “Traffic Safety Facts Pedestrians 2014 Data”, National Highway Traffic Safety Administration, National Center for Statistics
and Analysis, report # DOT HS 812 270 24 “Traffic Safety Facts 2014, A Compilation of Motor Vehicle Crash Data from the Fatality Analysis Reporting System and the General
Estimates System”, National Highway Traffic Safety Administration, National Center for Statistics and Analysis, report # DOT HS 812 261 25 Thomas, R. (2012) “Pedal Power: A Legal Guide for Oregon Bicyclists”, Bicycle Transportation Alliance, 8th edition 26 Solnick, S. (Nov 1994) “Hit the bottle and run: the role of alcohol in hit-and-run pedestrian fatalities”, Journal of Studies on Alcohol and
Drugs, Volume 55, Issue 6, pages 679–684 27 Kevenides, B. (Dec 22, 2015) “Resolution of a Case That Highlights Car Door Danger”, Bike Law