Embed Size (px)
Citation preview
International Journal of Social Science and Economic Research
ISSN: 2455-8834
Volume:02, Issue:07 "July 2017"
www.ijsser.org Copyright © IJSSER 2017, All right reserved Page 3772
CAUSES OF ECONOMIC GROWTH IN INDONESIA: EVIDENCE
FROM EIGHTEEN PROVINCES
1AGUS TRI BASUKI, 2MULYANTO
1University of Muhammadiyah Yogyakarta and Student of P.hd Economics Faculty of Economics,
Sebelas Maret University of Surakarta. Indonesia
2Sebelas Maret University, Surakarta, Indonesia
ABSTRACT
This study aims to analyze the composition of local government spending (education, health,
marine and fisheries, agriculture, and general allocation funds), the number of poor people,
inflation, foreign direct investment and opinion Supreme Audit Agency against the Local
Government Financial Report to economic growth in several provinces in Indonesia. This study
uses data from 18 provinces in Indonesia from 2010 to 2015.
The model used in this study is panel data regression, the use of data panels in economic research
has several main advantages over the data type cross section and time series. Panel data can
provide researchers with a large number of observations, increasing the degree of freedom, data
having great variability and reducing the collinearity between explanatory variables, which can
produce efficient econometric estimates.
Almost all variables have an influence on economic growth (government expenditure for
education, government expenditure for health, government expenditure for marine and fishery,
government expenditure for agriculture, general allocation fund, foreign direct investment, and
inflation), except the number of poor people and opinion of the Supreme Audit Agency against
the Local Government Financial Report has no influence on on economic growth.
Keywords: economic growth, panel data, good governance, and fiscal policy.
1. INTRODUCTION
One of the targets of Indonesia's national development is to create economic growth and equity
of development outcomes, including the distribution of income among regions. Indonesia's
national development of the next five years needs to prioritize efforts to achieve food
sovereignty, energy adequacy and management of maritime and marine resources (Medium
International Journal of Social Science and Economic Research
ISSN: 2455-8834
Volume:02, Issue:07 "July 2017"
www.ijsser.org Copyright © IJSSER 2017, All right reserved Page 3773
Term Development Plan 2014-2019). In order to achieve the national goal, the nation is faced
with three main issues, namely: (1) the decline of state authority; (2) the weakening of the joints
of the national economy; and (3) the outbreak of intolerance and personality crisis of the nation.
The weakness of the nation's economic joints is the evident from the unresolved issues of
poverty, social inequalities, inequality among regions, environmental degradation due to
excessive exploitation of natural resources, food, energy, financial and technological
dependence. The state is unable to utilize the enormous wealth of natural resources for the
welfare of its people. The hope for the strengthening of the nation's economic joints becomes
even further when the state is unable to provide health insurance and a decent quality of life for
its citizens, failing in minimizing inequality and inequality of national income, through
dependence on foreign debt and the provision of food that relies on imports, In the face of energy
crisis problems due to the dominance of production tools and global corporate capital and
reduced national oil reserves.
Economics explained that investment is the purchase of capital or goods that are not consumed,
but used for production activities so as to produce goods or services in the future. The result of
Barro's research, 1991, economic growth is not significantly related to public investment stocks.
Sylwester, 2000, Increased levels of human capital have no positive relationship, and a direct
influence on growth. Mehanna, that trade openness stimulates investment, which in turn boosts
economic growth. Nawatmi, 2013, investment has a positive influence on economic growth.
Practically, government spending will affect economic activity, not only because government
spending can create a development process, but also as an aggregate demand component that can
add products. The results of Suleiman, 2012, there is a long-term relationship between
government spending and national income, and public expenditures and revenues for the
Nigerian case. Hendarmin, 2013, the effect of government capital expenditure on economic
growth is positive but insignificant, Sujaningsih, et al., 2012, there is a cointegration relationship
between government spending and tax on output in the long term.
The debate over the relationship between corruption and growth still continues today.
Economists, historians and political experts have been involved in a long debate over whether
corruption endangers economic growth. The general view holds that corruption disrupts
economic activity by distorting the efficient allocation of resources in the economy.
The results of Paolo Mauro, 1995, Corruption can reduce investment, thereby reducing economic
growth. Brempong, 2002, corruption reduces the rate of revenue growth. An increase of one unit
of corruption index reduces the GDP growth rate between 0.75 and 0.9 percentage points, and
per capita income is between 0.39 and 0.41 percentage points; a relatively large effect given the
International Journal of Social Science and Economic Research
ISSN: 2455-8834
Volume:02, Issue:07 "July 2017"
www.ijsser.org Copyright © IJSSER 2017, All right reserved Page 3774
slow economic growth in Africa. Corruption lowers the rate of per capita income growth directly
by reducing the productivity of existing resources and indirectly through reduced investment.
Nawatmi, 2013, corruption has negative influence on economic growth. The sincerity from the
government in building this area is measured by the existence of a government system known as
Regional Autonomy. In support of this, the government passed Law Number 22 of 1999 on
Regional Government which was subsequently revised to Law No.32 of 2004 and Law No.
25/1999 on the financial balance between the central and regional government which was
subsequently revised into Laws Law Number 33 Year 2004.
The law is the foundation for the region to develop its region independently by relying more on
the capability and potential of the region. This law also gives local discretion to the regions to
design various development programs that suit local needs.
From the above background, researchers are very interested in analyzing the factors that
determine the growth of provinces in some regions of Indonesia. This research is expected to
prove the role of local government expenditures, especially in the areas of education, health,
marine and fisheries, agriculture, general allocation funds, population and foreign investment,
and opinion of the Supreme Audit Board to the Regional Government Financial Reports in
encouraging economic growth, Creating effectiveness and harmony in regional economic
development, as well as the creation of good governance.
The purpose of this study is to know the effect of population size, government expenditure on
education, government expenditures for health, government expenditures on marine and
fisheries, government expenditures for agriculture, general allocation funds, foreign investment
and opinion of the Supreme Audit Agency against Local Government Financial Statements on
growth regional economy.
2. METHODS
Regression used in this research is regression with panel data. Panel data is a combination of
time and cross data. With recurrent cross-section observation, panel analysis allows researchers
to study the dynamics of change with short time series. The combination of time series with
cross-section can improve the quality and quantity of data in a way that is impossible to use only
one of two dimensions (Gujarati, 2003; 638-640). Analysis of panel data can provide a rich and
robust study of a set of people, if one is willing to consider both space and time dimensions of
the data.
The use of panel data in modeling has its advantages and disadvantages. Hsiao (2006) and
Klevmarken (1989) in Baltagi (2005) describe the benefits of using panel data, among others:
(1). Controlling individual heterogeneity. Panel data can treat individuals, companies, countries
International Journal of Social Science and Economic Research
ISSN: 2455-8834
Volume:02, Issue:07 "July 2017"
www.ijsser.org Copyright © IJSSER 2017, All right reserved Page 3775
heterogeneously. Greene (2002) mentioned that in some panel data, the number of cross section
units is large, but the observation period is small, so the time series method is no longer suitable
for use. The condition of such data would be better if analyzed by techniques focused on cross
section variation or heterogeneity. In addition, panel data is also able to analyze variables that do
not change over time. (2). Panel data more informative, varied, collinearity between smaller
variables, greater degrees of freedom, and more efficient. More informative data can yield more
reliable parameter estimates. (3). Panel data is good for analyzing dynamic phenomena, one of
which is poverty and income dynamics. (4). Panel data both to identify and measure undetectable
effects on cross section data and time series.
GDRP = f (EDUC, HEALTH, MARINE, AGRIC, DAU, POVERT, INF, FDI, OPINI)
Where the GDRP represents gross domestic product, EDUC represents local government
spending on education, HEALTH represents local government spending on health, MARINE
represents local government spending on marine and fisheries, AGRIC represents local
government expenditure on agriculture, DAU represents revenue sharing between central and
Local government, POVERT symbolizes the number of poor people, INF symbolizes the amount
of inflation, FDI symbolizes foreign investment, and OPINI symbolizes the assessment of the
Supreme Audit Agency against the Local Government Financial Report.
Model in this research is as follows:
GDRPti = β0 + β1EDUCti + β2HEALTHti + β3MARINEti + β4AGRICti + β5DAUti + β6POVERTti
+ β7INFti + β8FDIti + β9OPINIti + et
Then we turn the model into a double log model, so it becomes the following equation:
Log(GDRPti) = β0 + β1Log(EDUCti) + β2Log(HEALTHti) + β3Log(MARINEti) +
β4Log(AGRICti) + β5og(DAUti) + β6Log(POVERTti) + β7INFti + β8Log(FDIti) + β9OPINIti + et
In rearranging panel data will yield three results of model equation; None effect, fixed effect and
random effect. To select the most appropriate model to be used in this research, it can be done
several tests, namely: (1). Chow test is a test to determine the Fixed Effet or Random Effect
model that is best used in estimating panel data. (2). The Hausman test can be defined as a
statistical test to select whether the most appropriate Fixed Effect or Random Effect model is
used. (3). To determine whether the Random Effect model is better than the Common Effect
(OLS) method, the Lagrange Multiplier (LM) test is used.
International Journal of Social Science and Economic Research
ISSN: 2455-8834
Volume:02, Issue:07 "July 2017"
www.ijsser.org Copyright © IJSSER 2017, All right reserved Page 3776
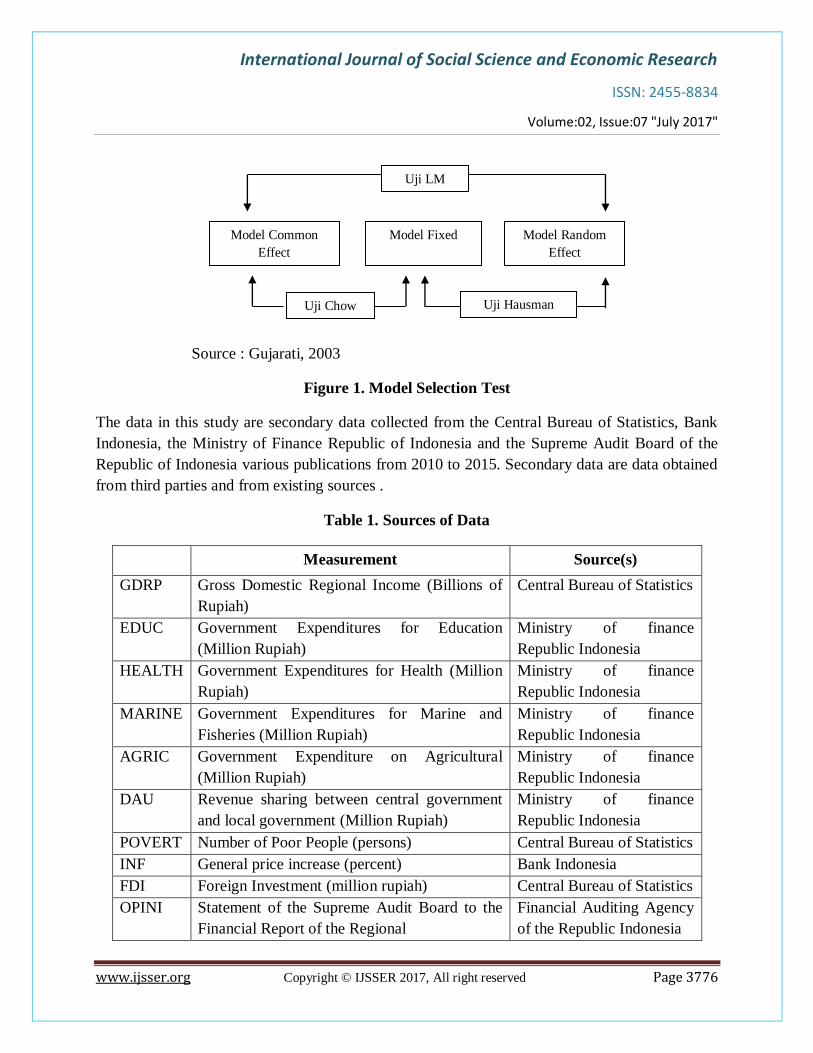
Source : Gujarati, 2003
Figure 1. Model Selection Test
The data in this study are secondary data collected from the Central Bureau of Statistics, Bank
Indonesia, the Ministry of Finance Republic of Indonesia and the Supreme Audit Board of the
Republic of Indonesia various publications from 2010 to 2015. Secondary data are data obtained
from third parties and from existing sources .
Table 1. Sources of Data
Measurement Source(s)
GDRP Gross Domestic Regional Income (Billions of
Rupiah)
Central Bureau of Statistics
EDUC Government Expenditures for Education
(Million Rupiah)
Ministry of finance
Republic Indonesia
HEALTH Government Expenditures for Health (Million
Rupiah)
Ministry of finance
Republic Indonesia
MARINE Government Expenditures for Marine and
Fisheries (Million Rupiah)
Ministry of finance
Republic Indonesia
AGRIC Government Expenditure on Agricultural
(Million Rupiah)
Ministry of finance
Republic Indonesia
DAU Revenue sharing between central government
and local government (Million Rupiah)
Ministry of finance
Republic Indonesia
POVERT Number of Poor People (persons) Central Bureau of Statistics
INF General price increase (percent) Bank Indonesia
FDI Foreign Investment (million rupiah) Central Bureau of Statistics
OPINI Statement of the Supreme Audit Board to the
Financial Report of the Regional
Financial Auditing Agency
of the Republic Indonesia
Model Common
Effect
Model Fixed
Effect
Model Random
Effect
Uji Chow Uji Hausman
Uji LM
International Journal of Social Science and Economic Research
ISSN: 2455-8834
Volume:02, Issue:07 "July 2017"
www.ijsser.org Copyright © IJSSER 2017, All right reserved Page 3777
3. RESULTS
3.1. Classic Assumption Test
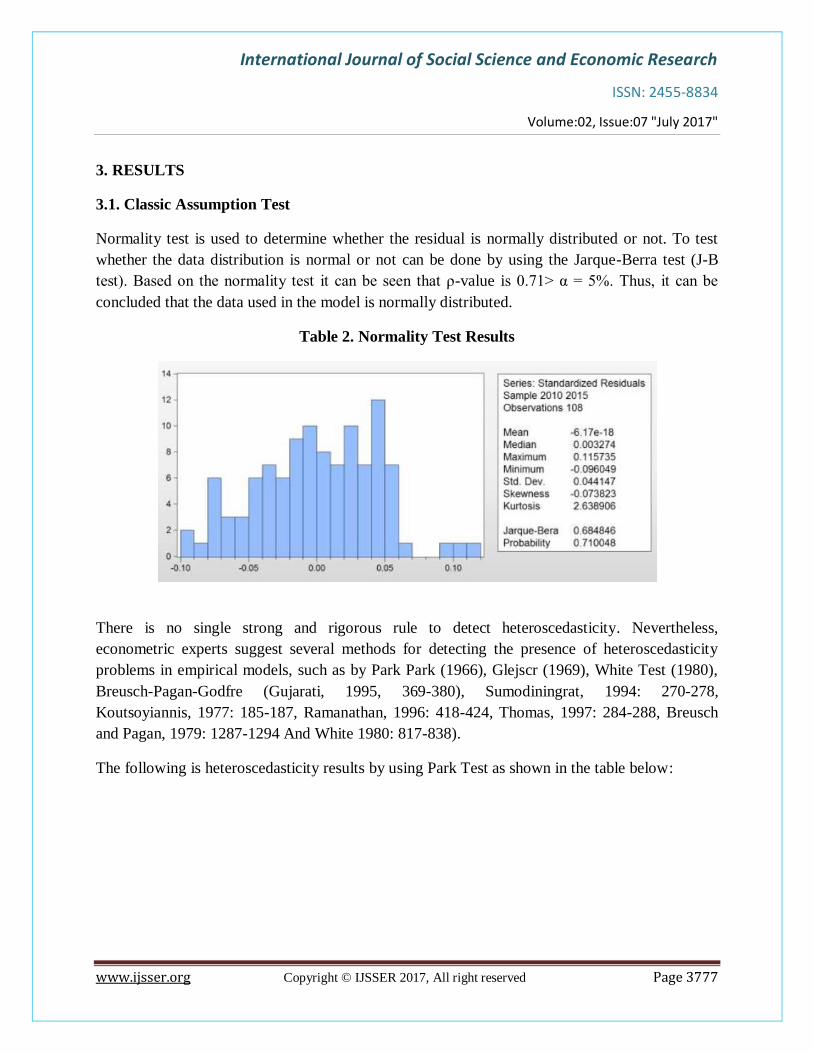
Normality test is used to determine whether the residual is normally distributed or not. To test
whether the data distribution is normal or not can be done by using the Jarque-Berra test (J-B
test). Based on the normality test it can be seen that ρ-value is 0.71> α = 5%. Thus, it can be
concluded that the data used in the model is normally distributed.
Table 2. Normality Test Results
There is no single strong and rigorous rule to detect heteroscedasticity. Nevertheless,
econometric experts suggest several methods for detecting the presence of heteroscedasticity
problems in empirical models, such as by Park Park (1966), Glejscr (1969), White Test (1980),
Breusch-Pagan-Godfre (Gujarati, 1995, 369-380), Sumodiningrat, 1994: 270-278,
Koutsoyiannis, 1977: 185-187, Ramanathan, 1996: 418-424, Thomas, 1997: 284-288, Breusch
and Pagan, 1979: 1287-1294 And White 1980: 817-838).
The following is heteroscedasticity results by using Park Test as shown in the table below:
International Journal of Social Science and Economic Research
ISSN: 2455-8834
Volume:02, Issue:07 "July 2017"
www.ijsser.org Copyright © IJSSER 2017, All right reserved Page 3778
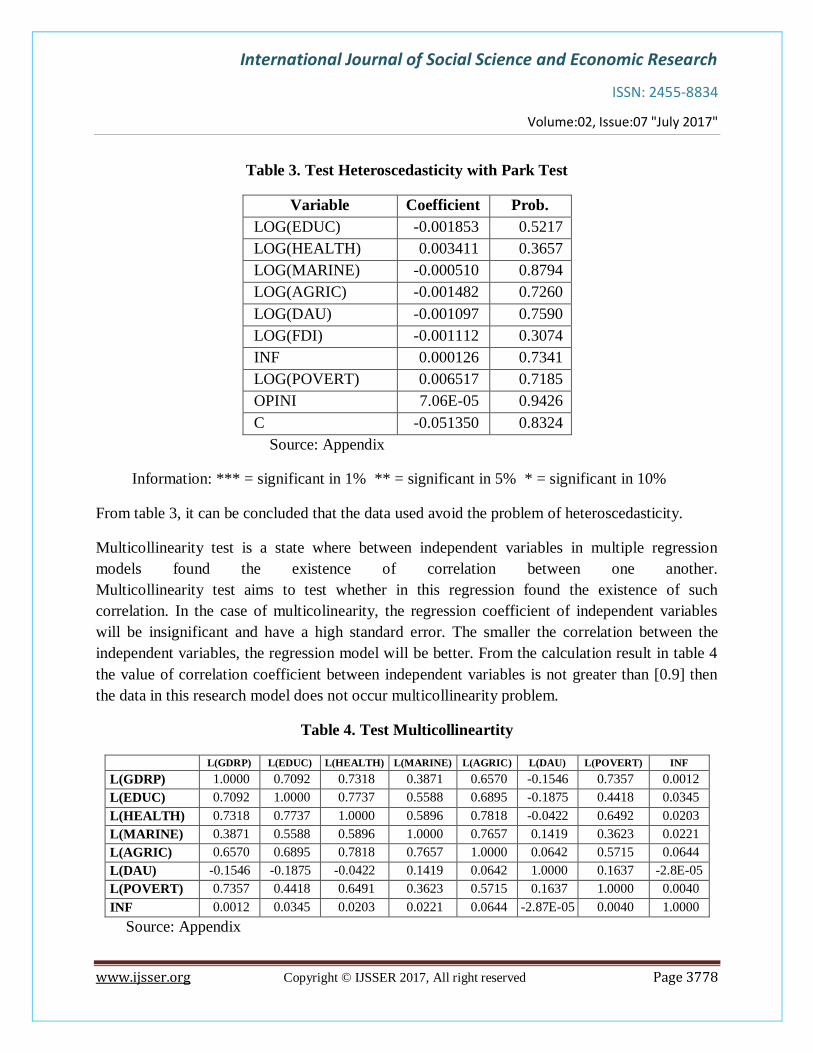
Table 3. Test Heteroscedasticity with Park Test
Variable Coefficient Prob.
LOG(EDUC) -0.001853 0.5217
LOG(HEALTH) 0.003411 0.3657
LOG(MARINE) -0.000510 0.8794
LOG(AGRIC) -0.001482 0.7260
LOG(DAU) -0.001097 0.7590
LOG(FDI) -0.001112 0.3074
INF 0.000126 0.7341
LOG(POVERT) 0.006517 0.7185
OPINI 7.06E-05 0.9426
C -0.051350 0.8324
Source: Appendix
Information: *** = significant in 1% ** = significant in 5% * = significant in 10%
From table 3, it can be concluded that the data used avoid the problem of heteroscedasticity.
Multicollinearity test is a state where between independent variables in multiple regression
models found the existence of correlation between one another.
Multicollinearity test aims to test whether in this regression found the existence of such
correlation. In the case of multicolinearity, the regression coefficient of independent variables
will be insignificant and have a high standard error. The smaller the correlation between the
independent variables, the regression model will be better. From the calculation result in table 4
the value of correlation coefficient between independent variables is not greater than [0.9] then
the data in this research model does not occur multicollinearity problem.
Table 4. Test Multicollineartity
L(GDRP) L(EDUC) L(HEALTH) L(MARINE) L(AGRIC) L(DAU) L(POVERT) INF
L(GDRP) 1.0000 0.7092 0.7318 0.3871 0.6570 -0.1546 0.7357 0.0012
L(EDUC) 0.7092 1.0000 0.7737 0.5588 0.6895 -0.1875 0.4418 0.0345
L(HEALTH) 0.7318 0.7737 1.0000 0.5896 0.7818 -0.0422 0.6492 0.0203
L(MARINE) 0.3871 0.5588 0.5896 1.0000 0.7657 0.1419 0.3623 0.0221
L(AGRIC) 0.6570 0.6895 0.7818 0.7657 1.0000 0.0642 0.5715 0.0644
L(DAU) -0.1546 -0.1875 -0.0422 0.1419 0.0642 1.0000 0.1637 -2.8E-05
L(POVERT) 0.7357 0.4418 0.6491 0.3623 0.5715 0.1637 1.0000 0.0040
INF 0.0012 0.0345 0.0203 0.0221 0.0644 -2.87E-05 0.0040 1.0000
Source: Appendix
International Journal of Social Science and Economic Research
ISSN: 2455-8834
Volume:02, Issue:07 "July 2017"
www.ijsser.org Copyright © IJSSER 2017, All right reserved Page 3779
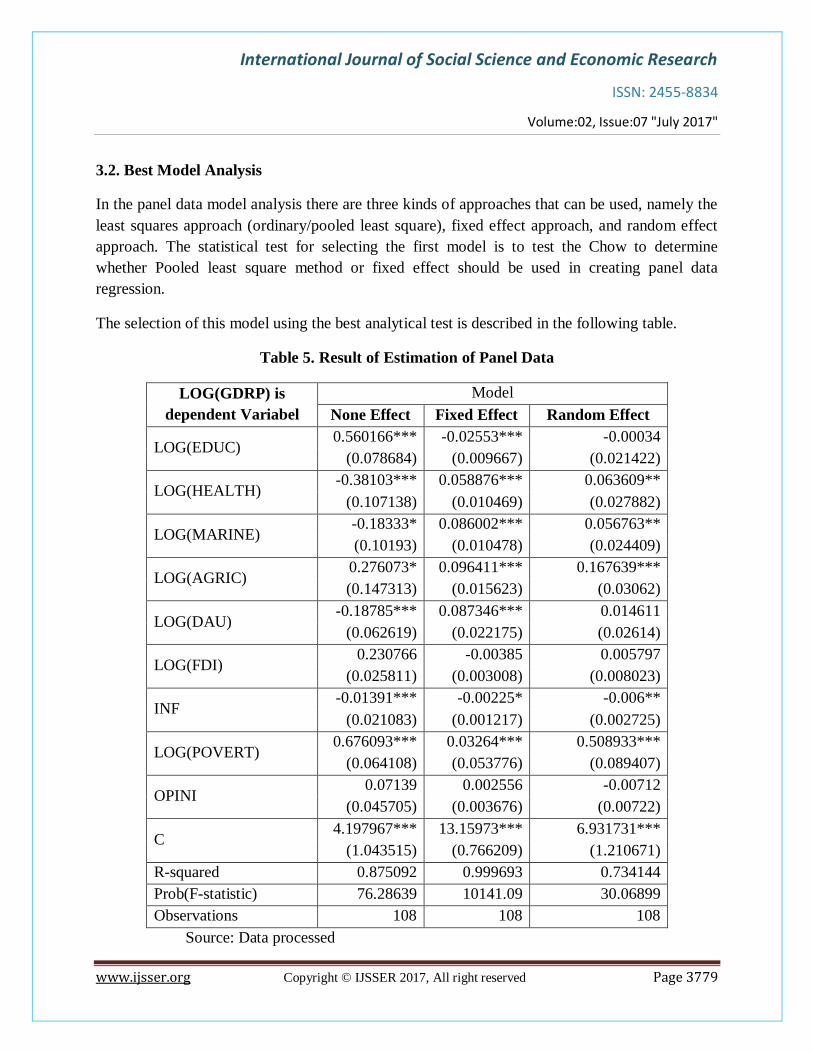
3.2. Best Model Analysis
In the panel data model analysis there are three kinds of approaches that can be used, namely the
least squares approach (ordinary/pooled least square), fixed effect approach, and random effect
approach. The statistical test for selecting the first model is to test the Chow to determine
whether Pooled least square method or fixed effect should be used in creating panel data
regression.
The selection of this model using the best analytical test is described in the following table.
Table 5. Result of Estimation of Panel Data
LOG(GDRP) is
dependent Variabel
Model
None Effect Fixed Effect Random Effect
LOG(EDUC) 0.560166*** -0.02553*** -0.00034
(0.078684) (0.009667) (0.021422)
LOG(HEALTH) -0.38103*** 0.058876*** 0.063609**
(0.107138) (0.010469) (0.027882)
LOG(MARINE) -0.18333* 0.086002*** 0.056763**
(0.10193) (0.010478) (0.024409)
LOG(AGRIC) 0.276073* 0.096411*** 0.167639***
(0.147313) (0.015623) (0.03062)
LOG(DAU) -0.18785*** 0.087346*** 0.014611
(0.062619) (0.022175) (0.02614)
LOG(FDI) 0.230766 -0.00385 0.005797
(0.025811) (0.003008) (0.008023)
INF -0.01391*** -0.00225* -0.006**
(0.021083) (0.001217) (0.002725)
LOG(POVERT) 0.676093*** 0.03264*** 0.508933***
(0.064108) (0.053776) (0.089407)
OPINI 0.07139 0.002556 -0.00712
(0.045705) (0.003676) (0.00722)
C 4.197967*** 13.15973*** 6.931731***
(1.043515) (0.766209) (1.210671)
R-squared 0.875092 0.999693 0.734144
Prob(F-statistic) 76.28639 10141.09 30.06899
Observations 108 108 108
Source: Data processed
International Journal of Social Science and Economic Research
ISSN: 2455-8834
Volume:02, Issue:07 "July 2017"
www.ijsser.org Copyright © IJSSER 2017, All right reserved Page 3780
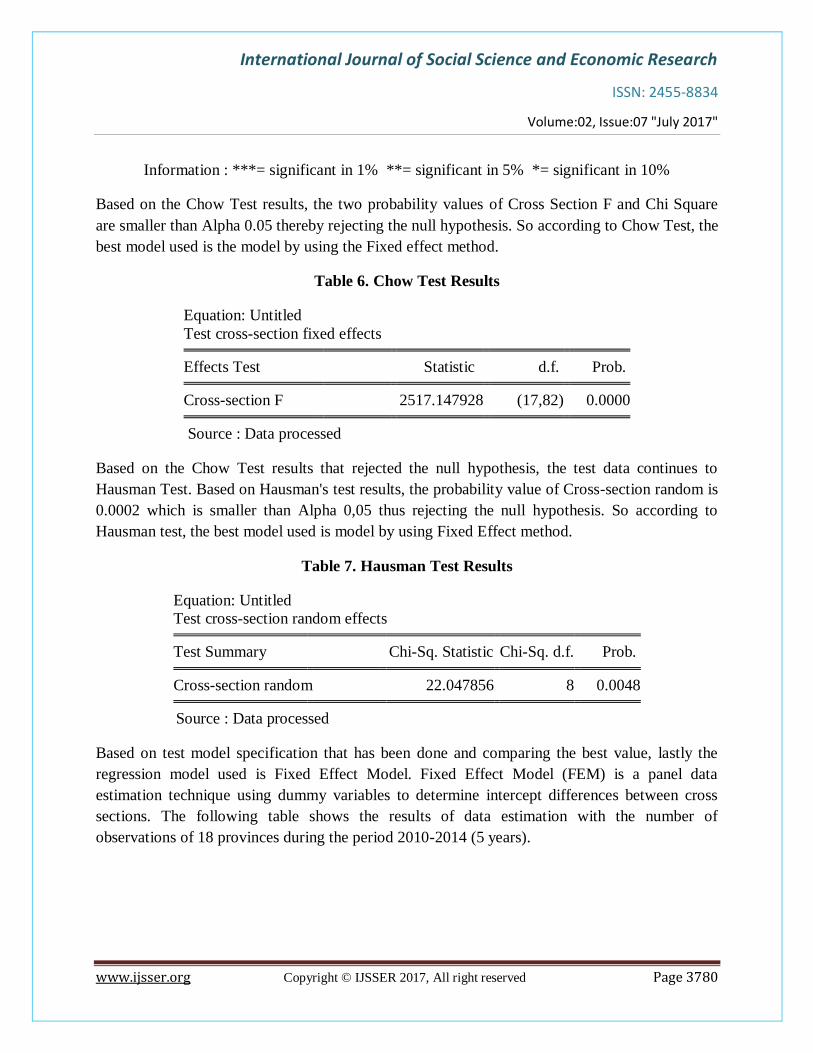
Information : ***= significant in 1% **= significant in 5% *= significant in 10%
Based on the Chow Test results, the two probability values of Cross Section F and Chi Square
are smaller than Alpha 0.05 thereby rejecting the null hypothesis. So according to Chow Test, the
best model used is the model by using the Fixed effect method.
Table 6. Chow Test Results
Equation: Untitled
Test cross-section fixed effects
Effects Test Statistic d.f. Prob.
Cross-section F 2517.147928 (17,82) 0.0000
Source : Data processed
Based on the Chow Test results that rejected the null hypothesis, the test data continues to
Hausman Test. Based on Hausman's test results, the probability value of Cross-section random is
0.0002 which is smaller than Alpha 0,05 thus rejecting the null hypothesis. So according to
Hausman test, the best model used is model by using Fixed Effect method.
Table 7. Hausman Test Results
Equation: Untitled
Test cross-section random effects
Test Summary Chi-Sq. Statistic Chi-Sq. d.f. Prob.
Cross-section random 22.047856 8 0.0048
Source : Data processed
Based on test model specification that has been done and comparing the best value, lastly the
regression model used is Fixed Effect Model. Fixed Effect Model (FEM) is a panel data
estimation technique using dummy variables to determine intercept differences between cross
sections. The following table shows the results of data estimation with the number of
observations of 18 provinces during the period 2010-2014 (5 years).
International Journal of Social Science and Economic Research
ISSN: 2455-8834
Volume:02, Issue:07 "July 2017"
www.ijsser.org Copyright © IJSSER 2017, All right reserved Page 3781
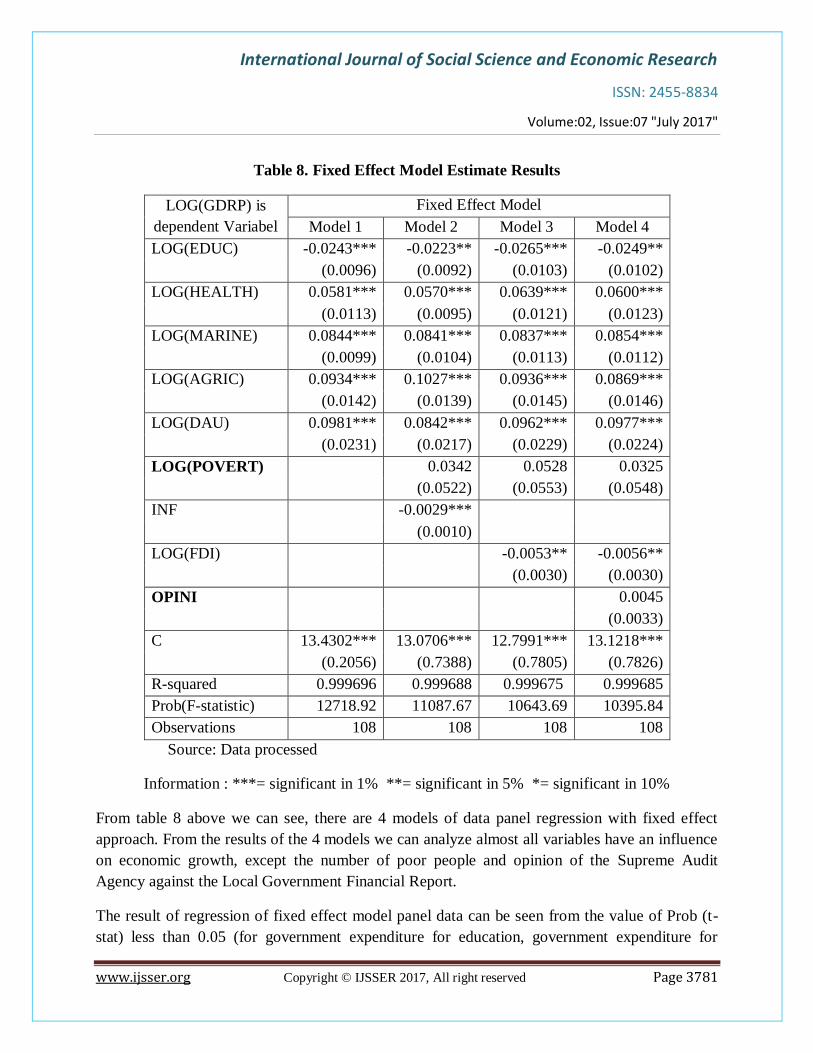
Table 8. Fixed Effect Model Estimate Results
LOG(GDRP) is
dependent Variabel
Fixed Effect Model
Model 1 Model 2 Model 3 Model 4
LOG(EDUC) -0.0243*** -0.0223** -0.0265*** -0.0249**
(0.0096) (0.0092) (0.0103) (0.0102)
LOG(HEALTH) 0.0581*** 0.0570*** 0.0639*** 0.0600***
(0.0113) (0.0095) (0.0121) (0.0123)
LOG(MARINE) 0.0844*** 0.0841*** 0.0837*** 0.0854***
(0.0099) (0.0104) (0.0113) (0.0112)
LOG(AGRIC) 0.0934*** 0.1027*** 0.0936*** 0.0869***
(0.0142) (0.0139) (0.0145) (0.0146)
LOG(DAU) 0.0981*** 0.0842*** 0.0962*** 0.0977***
(0.0231) (0.0217) (0.0229) (0.0224)
LOG(POVERT) 0.0342 0.0528 0.0325
(0.0522) (0.0553) (0.0548)
INF -0.0029***
(0.0010)
LOG(FDI) -0.0053** -0.0056**
(0.0030) (0.0030)
OPINI 0.0045
(0.0033)
C 13.4302*** 13.0706*** 12.7991*** 13.1218***
(0.2056) (0.7388) (0.7805) (0.7826)
R-squared 0.999696 0.999688 0.999675 0.999685
Prob(F-statistic) 12718.92 11087.67 10643.69 10395.84
Observations 108 108 108 108
Source: Data processed
Information : ***= significant in 1% **= significant in 5% *= significant in 10%
From table 8 above we can see, there are 4 models of data panel regression with fixed effect
approach. From the results of the 4 models we can analyze almost all variables have an influence
on economic growth, except the number of poor people and opinion of the Supreme Audit
Agency against the Local Government Financial Report.
The result of regression of fixed effect model panel data can be seen from the value of Prob (t-
stat) less than 0.05 (for government expenditure for education, government expenditure for
International Journal of Social Science and Economic Research
ISSN: 2455-8834
Volume:02, Issue:07 "July 2017"
www.ijsser.org Copyright © IJSSER 2017, All right reserved Page 3782
health, government expenditure for marine and fishery, government expenditure for agriculture,
general allocation fund). With a confidence level of 95 percent, almost all the variables have a
significant effect on economic growth. Significant variables are marked by prob t-statistics (as
partial test) which is less than 0.05. So with a 99 percent confidence level variable that does not
significantly affect economic growth is the variable allocation of education budget and foreign
investment has no effect on economic growth. And the model can explain 99.96 percent of the
variations that occur in the PDRB variable (adjusted R-squared).
Government expenditure for Education has negative impact on regional economic growth. This
means that the allocation of education cannot improve the quality and quantity of education but
only improve the welfare of educators. This means that the increase in allocation of education
funds is mostly used for certification and school operations. The misconception of ideas have
been made in several provinces in Indonesia that stated the creation and expansion of the
opportunity to obtain rapid, quantitative education is the key to the success of national
development, the more educational opportunities, the faster the development process will be.
Departing from that opinion the region is vying to hold the expansion of education in a short
time, so this field becomes more politically sensitive. Each of the ownership of the head of the
region always raised free education. The rapid expansion of educational opportunities has cost
enormous amounts, but the average condition of the community actually has a development gap.
Our country is faced with two fundamental alternatives to policy in addressing educational
issues, first expanding the formal education system quantitatively with some minor modifications
in curricula, teaching methods and evaluations without changing the costly educational policies
and institutional structures of markets Workforce. Second, try to reform the entire system of
education, accompanied by changes to the conditions of demand and supply of school
opportunities and redirect the curriculum to fit national needs. Evidence suggests that the first
alternative will only exacerbate problems of unemployment, poverty, inequality of income
distribution, and stagnation of the village economy. The results of this study are supported by the
research of Adela Shera et al (2014) that spending on education has negative relationship with
economic growth.
Government spending on health has a positive effect on regional economic growth, proving that
an increase in health spending will lead to a reduction in infant and maternal mortality to boost
economic growth. Besides, with the existence of healthy insurance Indonesia can encourage
productivity, which in turn will encourage the economic growth.
Government spending on marine and fishery allocations has positive effect on regional economic
growth. This is because 2/3 parts of our country tangible ocean then the allocation of government
International Journal of Social Science and Economic Research
ISSN: 2455-8834
Volume:02, Issue:07 "July 2017"
www.ijsser.org Copyright © IJSSER 2017, All right reserved Page 3783
spending will optimize resources in the field of marine and fisheries, so the maritime sector will
develop.
Based on the analysis it can be concluded that development expenditure for agriculture has an
influence on economic growth in 18 provinces in Indonesia. The objective of agricultural
development in Indonesia is to improve the living standards of rural communities by increasing
income, total production, and productivity of small farmers, the first thing that must be done by
the government is to identify the main sources of agricultural progress and the basic conditions
that would affect The successful achievement of agricultural development goals, all these
important elements are clearly related to each other to form a very complex network of
relationships. To facilitate the understanding we can divide into three components of small-scale
agricultural development resources, namely: (1) improvement of technological progress and
innovation in agricultural activities is an important prerequisite that must be fulfilled in order to
achieve the improvement of output level and productivity, (2) Economic policy Appropriate
government policies such as regulation and protection of prices of agricultural commodities,
especially cereals of basic foodstuffs. (3) Land Reform, agricultural and rural development only
succeeds in bringing the benefits to many if there is a joint effort between the government and all
farmers, especially the granting and improving the right of ownership or land use to each farmer.
If the programs of land reform can be effectively treated and effectively implemented by the
government it will create a solid foundation for improving the output and living standards of
rural farmers.
General allocation funds have a positive influence on regional economic growth. General
Allocation Fund (DAU) is the amount of funds allocated to each Autonomous Region
(province/district/city) in Indonesia each year as development fund. DAU is one component of
expenditure on APBN, and becomes one component of revenue in APBD. The purpose of the
DAU is as equitable distribution of inter-regional financial capacity to fund the needs of the
Autonomous Region in the context of decentralization. DAU is used by local governments to
encourage economic growth, especially as a complementary fund in regional development.
The number of poor people has no effect on economic growth. Poverty occurs because the ability
of economic actors are not the same, so there are people who can not participate in the
development process or enjoy the results of development. In the effort to overcome poverty there
are two main strategies that must be taken by the government. First, protect families and poor
communities through the fulfillment of their basic needs. Second, empower them to have the
ability to do business and prevent new poverty. The results of this study are in accordance with
Okoroafor's findings, et. Al, (2013), there is no correlation between poverty and economic
growth in Nigeria.
International Journal of Social Science and Economic Research
ISSN: 2455-8834
Volume:02, Issue:07 "July 2017"
www.ijsser.org Copyright © IJSSER 2017, All right reserved Page 3784
Inflation has a negative effect on economic growth, meaning that if inflation rises it will reduce
economic growth. The results of this study are in accordance with the results of Aidi F.K., and
Mwakanemela K, (2013) studies, that inflation has a negative impact on economic growth.
The relationship between foreign investment and economic growth shows a negative
relationship. So far, foreign investment in Indonesia has been exploring natural resources, and
regions that only rely on natural resources have low average economic growth, so the
government must make a policy to raise the added value of natural products so that the
investment role can be optimally used. This study supports the results of Hendarmin (2012) and
Olabisi et al (2012) research, that foreign capital investment actually reduces economic growth
through exclusive agreements in production with the government by not generating the returns
they gain. Criticisms of foreign investment have been largely undertaken due to the uneven
impacts of development outcomes in Indonesia and in many cases the activities of foreign capital
firms that only reinforce the dualistic economic structure and exacerbate the distribution of
income. They will divert resources from use to produce food to use to produce sophisticated
goods that mostly satisfy only certain groups and tend to exacerbate the imbalance of economic
opportunities between rural and urban areas with most operating in urban areas and accelerate
the flow of urbanization from village to city. Foreign investment companies tend to produce
unsuitable goods (only consumed by certain groups), thus encouraging the luxury consumption
pattern through advertising and the resulting goods tend to use capital-intensive technology. So
that domestic resources tend to be allocated to socially unprofitable projects.
Opinion of the Supreme Audit Agency to the Local Government Financial Report has no
relationship to regional economic growth. Financial audits are conducted in order to provide an
opinion on the fairness of financial information presented in the financial statements.
Performance audit aims to assess the economic aspects, efficiency, and effectiveness, but do not
see the outcomes. So in terms of BPK assessment is very reasonable but macroeconomic
performance is not achieved as expected. The government should have started implementing
performance-based budgets, budgeting with this performance approach is structured with output
orientation. The benchmark of the success of this budget system is the performance or
achievement of the objective or budget outcome by using funds efficiently. By building a
budgeting system that can integrate performance planning with an annual budget, there will be a
link between available funds and the expected outcomes.
4. DISCUSSION AND CONCLUSION
Almost all variables have an influence on economic growth, except the number of poor people
and opinion of the Supreme Audit Agency against the Local Government Financial Report.
International Journal of Social Science and Economic Research
ISSN: 2455-8834
Volume:02, Issue:07 "July 2017"
www.ijsser.org Copyright © IJSSER 2017, All right reserved Page 3785
From the analysis of the influence of the composition of government spending (education,
health, marine and fisheries, agriculture, and general allocation funds). Firstly, from the
government expenditure component including government expenditure on marine and fishery
has the biggest contribution in encouraging economic growth in the Indonesian territory, and this
is in accordance with the shape of our country which consists of a number of islands with 2/3 of
the waters area. Both components of government expenditure on agriculture contribute second
only to marine and fishery expenditures, this is also very much in line with employment in
Indonesia, 35 per cent of labor absorption is in the agricultural sector, so the priority of
agricultural development or government-backed government programs is appropriate .
Government expenditure for education has negative impact on regional economic growth.
Government needs to reevaluate basic education in terms of curriculum, teaching methods, and
educational evaluation. So that not only the pursuit of quantity but also maintain the quality of
basic education.
Inflation has a negative effect on economic growth, meaning that if inflation rises it will reduce
economic growth. Inflation is one of the major macroeconomic diseases, so the government
together with financial institutions can keep the price stability of goods through inflation control,
so as not to disrupt economic growth.
There is a negative relationship between foreign investment and economic growth. Foreign
investment companies tend to produce unsuitable goods (only consumed by certain groups), thus
encouraging the luxury consumption pattern through advertising and the resulting goods tend to
use as capital-intensive technology. Hence domestic resources tend to be allocated to socially
unprofitable projects.
The opinion of the Supreme Audit Agency on the financial reports of local governments has no
relationship to regional economic growth. The government needs to simplify procedures and
optimize the role of the KPK, as well as the inherent supervision of agencies directly related to
the use of budgets for public purposes.
REFERENCES
Afzal, M., et al. (2012), Relationship among Education, Poverty and Economic Growth in
Pakistan: An Econometric Analysis. Journal of Elementary Education, Vol.22, No. 1 pp.23-45
Agrawal, Gaurav. 2015, Foreign Direct Investment and Economic Growth in BRICS Economies:
A panel data analisys, Jounal of Economic and Business and management. Vo. 3 No 4 P.421-424
International Journal of Social Science and Economic Research
ISSN: 2455-8834
Volume:02, Issue:07 "July 2017"
www.ijsser.org Copyright © IJSSER 2017, All right reserved Page 3786
Aidi F.K., and Mwakanemela K,, (2013), Impact of Inflation on Economic Growth on Economic
Growth : A Studi Case of Tabzania, Asian Journal of Empirical Research,3(4)2013: 363-380.
AS. Al-Shatti, 2014, The Impact of Public Expenditure on economic Growth in Jordan,
International Journal of economics and Finance, Vol 6 no 10 2014 P. 157-167.
Arsyad, Lincolin. 2004, Ekonomi Pembangunan, Publishing Section STIE YKPN, Yogyakarta
Barro, R. J, 2000. ‘Inequality and Growth in a Panel of Countries’, Journal of Economic Growth,
Vol. 5, No. 1.
----------------,1989, “A Cross-Country Study of Growth, Saving, and Government,” National
Bureau of Economic Research, working paper No. 2855, February 1989.
----------------,1990, “Government Spending in a Simple Model of Endogenous Growth,” Journal
of Political Economy, XCVIII 1990, S103-25.
----------------, and Gary S. Becker,1989, “Fertility Choice in a Model of Economic Growth,”
Econometrica, LVII (1989), 481-501.
---------------, and Xavier Sala i Martin, 1990, “Economic Growth and Convergence across the
United States,” National Bureau of Economic Research, working paper, July 1990.
----------------, and Holger C. Wolf, 1989. “Data Appendix for Economic Growth in a Cross
Section of Countries,” unpublished, National Bureau of Economic Research, November 1989.
Behera J., 2014, Inflation and its Impact on Economic Growth: Evidence from Six South Asian
Countries, Journal of Economics and Sustainable Development ISSN 2222-1700 (Paper) ISSN
2222-2855 (Online) Vol.5, No.7, 2014
BM Louzi & Abadi, Abeer. 2011, The Impact of Foreign Direct Investment on Economic
Growth in Jordan, IJRRAS 8(2) p.253-258
Boediono, 1992, Teori Pertumbuhan Ekonomi, Synopsis Series Introduction to Economics,
Edition 1, 5th Print, BPFE, Yogyakarta.
Dada, Matthew A. 2013, Composition Effect of Government Expenditure on Private
Consumption and Output Growth in Nigeria : a Single Equation Error correction Modelling,
Rumanian Journal of fiscal policy, Vol. 4, issue 2(7), July-Des 2013, P. 18-34
International Journal of Social Science and Economic Research
ISSN: 2455-8834
Volume:02, Issue:07 "July 2017"
www.ijsser.org Copyright © IJSSER 2017, All right reserved Page 3787
David E. Bloom, David Canning, Linlin Hub, Yuanli Liu, Ajay Mahal, Winnie Yip, 2010, The
contribution of population health and demographic change to economic growth in China and
India, Journal of Comparative Economics 38 p. 17–33
Daniel O. Abala, 2014, foreign Direct Investment and economic Growth : An empirical Analysis
of Kenyan data, DBA Africa Management Review April 2014. No. 1. P.62-83.
Djojohadikusumo. Sumitro. 1994. “Perkembangan Pemikiran Ekonomi : Dasar Teori Ekonomi
Pertumbuhan dan Ekonomi Pembangunan”. LP3ES. PT. Ikrar Mandiri Abadi. Jakarta
Ebaidalla, Ebaidalle M. 2013, Causality between Government Expenditure and national Income
Evidence From Sudan, Journal of Economic Cooperation and Development 4 p.61-76
Gujarati, Damodar N. 2003. Basic Econometrics Fourth Edition. New York: TheMcGrow Hill
Companies Inc
Hakim, Abdul. 2002, Ekonomi Pembangunan, First Edition, publisher Ekonomisia, Yogyakarta
Idrees, AS & Siddiqi, M Wasif. 2013, Does Public Education Expenditure cause Economic
Growth Comparison of Development and Developed and Developing Countries, Pakistan
journal of Commerce and social Scial Science Vol 7(1), 174-183.
Jokumbo, S. et al 2010, Foreign Private Investment and economic Growth in Nigeria, Apllied
Econometrics and International Development Vol 10-2. P .189-204
Koojaroenprasit, Sauwaluck. 2011, The Impact of foreign Direct Investment on Economic
Growth A Case Study of South Korea, International Journal of Business and Social Science, Vol
3 no 21. P.8-19.
Kuncoro, Mudrajad. 2005,. Otonomi dan Pembangunan Daerah: Reformasi, Perencanaan,
Strategi, dan Peluang, Publisher Erlangga Jakarta.
Kuncoro, Mudrajad. 2009. Metode Riset Untuk Bisnis dan Ekonomi. Publisher Erlangga Jakarta.
Kuncoro, Mudrajad. 1997, Ekonomi Pembangunan, Teori, masalah dan kebijakan, First printing,
Publishing and printing unit of YKPN's corporate management academy, Yogyakarta.
Kurt, Serdar. 2015, Government Health Expenditure and economic Growth : A Feder Ram
Approach for the case of Turkey, International Journal of economics and Financial Issues, 5(2).
P. 441-447
International Journal of Social Science and Economic Research
ISSN: 2455-8834
Volume:02, Issue:07 "July 2017"
www.ijsser.org Copyright © IJSSER 2017, All right reserved Page 3788
Leitao, N Carles & Rashekhi, Saeed. 2013, The Impact of Foreign Direct Investment on
Economic Growth The Portuguese experience, Theoretical and Applied Economics Vol XX No 1
(578). P.51-62
Loizides. J, 2005, Government Expenditure and economic Growth : Evidence from Trivariate
Causality Granger, Journal of Apllied Ecomics Vol VIII, No 1. P. 125-152
Lutherani, Agnes. 2013, Analisis Faktor-Faktor Penentu Pertumbuhan Ekonomi dan
Kesempatan Kerja di Propinsi Sulawesi Utara, Dissertation (unpublished) Doctoral Program of
Economics Hasanudin University, Makasar.
Majumder, S.C., (2016)., Inflation and Its Impacts on Economic Growth of Bangladesh,
American Journal of Marketing Research, Vol. 2, No. 1, pp. 17-26
Manik, Rikwan ES. & Hidayat, Paidi. 2010, Analisis kausalitas antara pengeluaran pemerintah
dan pertumbuhan ekonomi Sumatera utara (Metode Cointegration Test dan Granger causality
Test), Jurnal keuangan dan bisnis Vol 2 No 1 Maret 2010, hal. 46-56.
Mehanna, Rock-Antoine. 1990, The Temporal Causality Between Investment And Growth In
Developing Economies, Journal Of Business And Economics Research Volume 1, Number 3, p.
85-91.
Melnyk, Leonid et al, 2014, The Impact of Foreign Direct Investment on Economic Growth case
of Post Communication Transition Economies, Problem and Perspective in Management, Vol 12
isuue I, 2014 P.18-24.
Meuro, Paolo. 1995, Corruption and Growth, Quarterly Journal of Economic, 110 p. 681-712
Mauro, Paolo. 1995, Corruption and Growth, The Quarterly Journal of Economics, Vol. 110,
No. 3 (Aug., 1995), pp. 681-712.
Muthui, J.N. et al, 2013, The impact of Public Expenditure Component on economic Growth in
Kenya 1964-2011, International Journal of business and social Science. Vol.4 no 4. April 2013
p. 233-254
N. Gregory Mankiw, David Romer, David N. Weil, 1992, A Contribution to the Empirics of
Economic Growth, The Quarterly Journal of Economics, Vol. 107, No. 2 (May, 1992), pp. 407-
437
Nwarji, 2012, effect of public Export on economic Growth in Nigeria : A Diaaggreagted Time
series analysis, International journal of management Science and research Vol 1 issue 7. P.1-15
International Journal of Social Science and Economic Research
ISSN: 2455-8834
Volume:02, Issue:07 "July 2017"
www.ijsser.org Copyright © IJSSER 2017, All right reserved Page 3789
Okoroafor, et. al, (2013), Poverty and Economic growth in Nigeria 1990-2011, The Macrotheme
Review 2(6), SI-IMT.
Oni, et al (2014), Joint Effects of Capital and Recurrent Expenditure in Nigerian’s Economic
Growth, Eropean journal of Globalization and Development Research, Vol 9, No 1. P. 530-543
Osuala, A.E., et. Al., (2013), Impact Inflation and Economic Growth ini Nigeria : A Causality
Test, JORIND 11(1), June, ISSN 1596-8308.
Pak Hung Mo, 2001, Corruption and Economic Growth, Journal of comparative Economic 29, P.
66-79.
Radodi, H, & Saidi, H. 2011, The Impact of Foreign Direct Investment of Economic Growth in
Developing and Developed Economics., Interdiciplinnary Journal of research in Business. Vol
1, issue 6 Juni 2011. P.10-17.
Sakarupova, Zuzana . 2014, A Causa Relationship between Foreign Direct Investment,
Economic Growth, and Export for Slovakia, Procedia Economics and Finance 15 p. 123-128
Sultan A., dan Shah F.M., (2014), Impact of Inflation on Economic Growth in Pakistan,
International Journal of Science and Research (IJSR) ISSN (Online): 2319-7064.
Sultan, ZA & Haque, Md Imdadul. 2011, the Estimation of the Cointegration Relationship
between Growth, Domestic Investment and Export : The indian Economy, International Journal
of Economics and Finance, Vol 3 No 4 September 2011. P. 226-232.
Tambunan, Tulus T.H. 2001, Perekonomian Indonesia : Teori dan Temuan Empiris, Ghalia
Indonesia, Jakarta.
Todaro, Michael P., Economic Development in the Third World, (6th ed.), London: Addison
Wesley Longman, 1997.
Vijay LNG & honey Gupta, 2013, Public Expenditure and Economic Growth a case Study of
india, Global Journal ofmanagement and Business Study, Vol. 3, No 2 (2013). PP. 191-196

![Members: Markus Hartono [ 122071080 ] Theresia Lola [ 12208118 ] Tulus Basuki [ 122080122 ]](https://img.pdfslide.us/doc/110x75/56814388550346895db0051f/members-markus-hartono-122071080-theresia-lola-12208118-tulus-basuki.jpg)


![Auxilary Boiler Basuki Inc]](https://img.pdfslide.us/doc/110x75/546a38cdaf795976298b45ab/auxilary-boiler-basuki-inc.jpg)