Embed Size (px)
Citation preview
THE CAUSES AND CONSEQUENCES OF THE CAUSES AND CONSEQUENCES OF THE CAUSES AND CONSEQUENCES OF THE CAUSES AND CONSEQUENCES OF
INCREASING INEQUALITY IN INDONESIA: INCREASING INEQUALITY IN INDONESIA: INCREASING INEQUALITY IN INDONESIA: INCREASING INEQUALITY IN INDONESIA:
A LONG TERM VIEW A LONG TERM VIEW A LONG TERM VIEW A LONG TERM VIEW
Asep Suryahadi, Ridho Al Izzati, Daniel Suryadarma
The SMERU Research Institute
Forum Kajian Pembangunan
Bank Indonesia Institute
Jakarta 20 February 2018

OverviewOverviewOverviewOverview
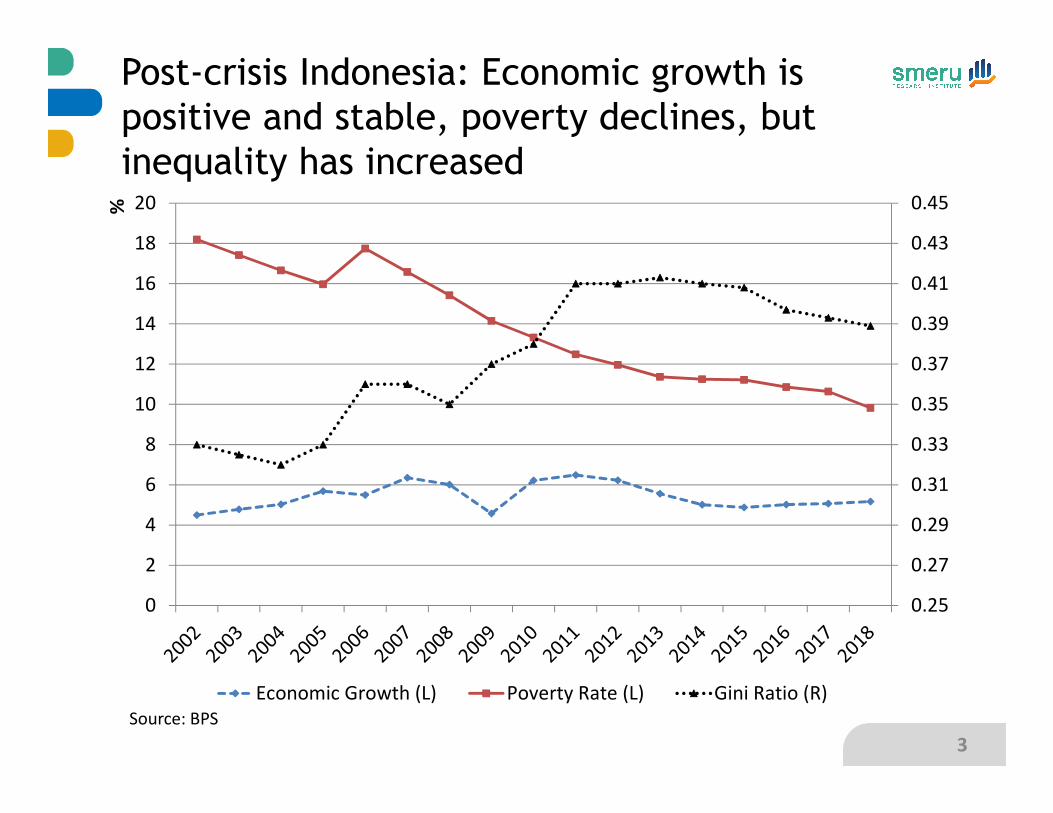
Post-crisis Indonesia: Economic growth is
positive and stable, poverty declines, but
inequality has increased
3
0.25
0.27
0.29
0.31
0.33
0.35
0.37
0.39
0.41
0.43
0.45
0
2
4
6
8
10
12
14
16
18
20%
Economic Growth (L) Poverty Rate (L) Gini Ratio (R)
Source: BPS
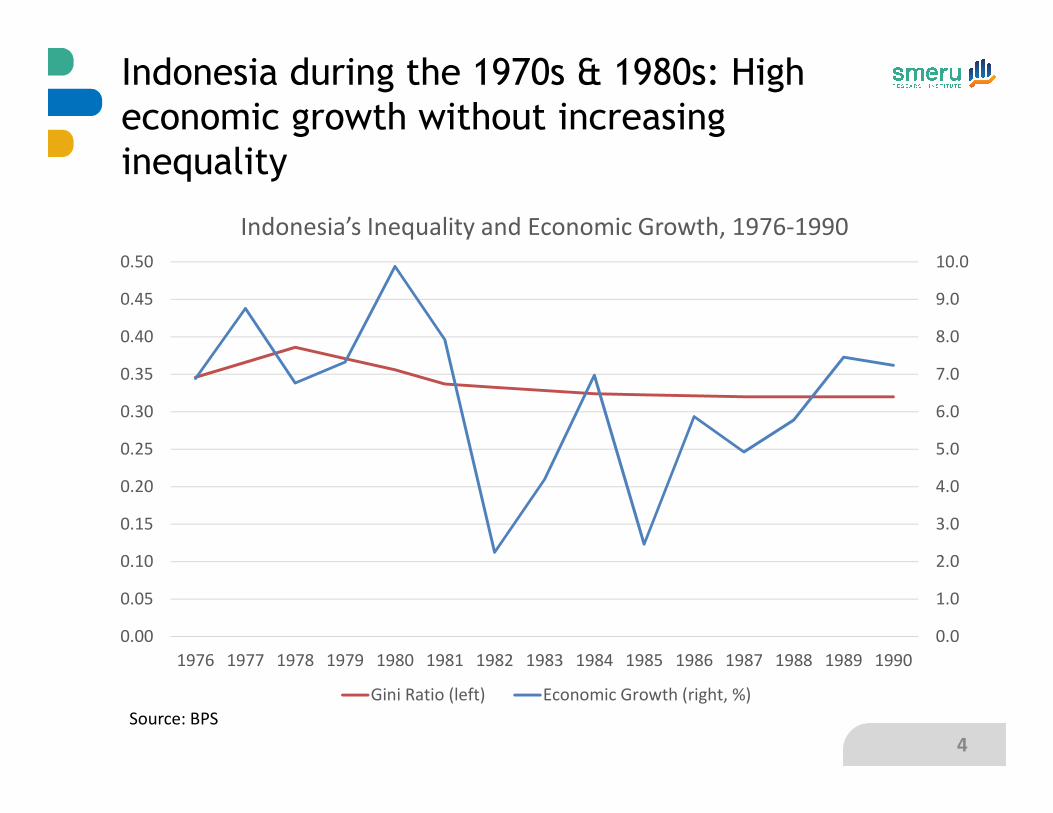
Indonesia during the 1970s & 1980s: High
economic growth without increasing
inequality
4
0.0
1.0
2.0
3.0
4.0
5.0
6.0
7.0
8.0
9.0
10.0
0.00
0.05
0.10
0.15
0.20
0.25
0.30
0.35
0.40
0.45
0.50
1976 1977 1978 1979 1980 1981 1982 1983 1984 1985 1986 1987 1988 1989 1990
Indonesia’s Inequality and Economic Growth, 1976-1990
Gini Ratio (left) Economic Growth (right, %)
Source: BPS
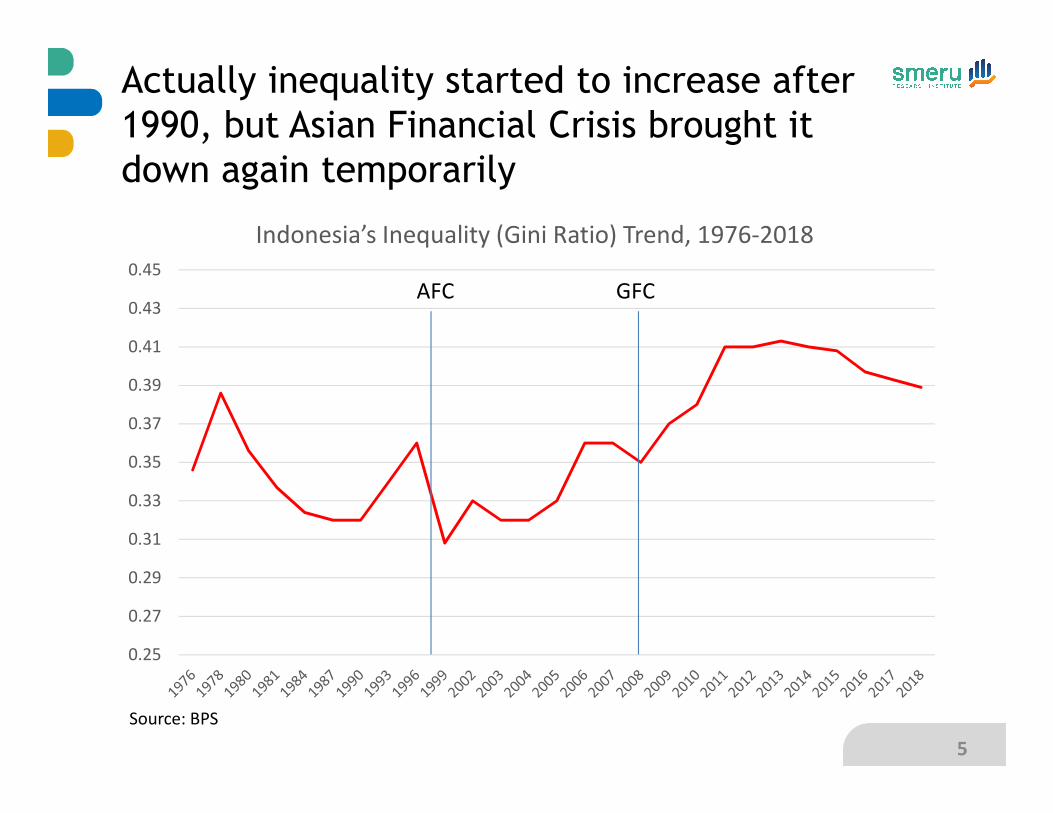
Actually inequality started to increase after
1990, but Asian Financial Crisis brought it
down again temporarily
5
Source: BPS
0.25
0.27
0.29
0.31
0.33
0.35
0.37
0.39
0.41
0.43
0.45
Indonesia’s Inequality (Gini Ratio) Trend, 1976-2018
AFC GFC
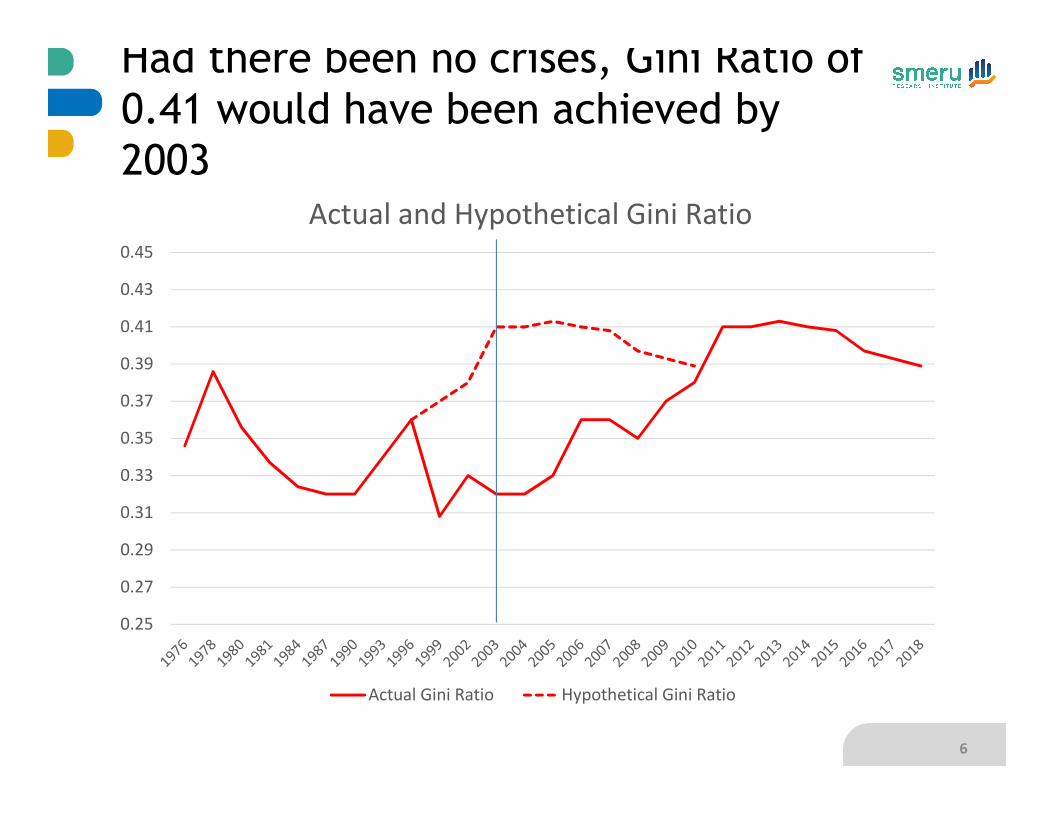
Had there been no crises, Gini Ratio of
0.41 would have been achieved by
2003
6
0.25
0.27
0.29
0.31
0.33
0.35
0.37
0.39
0.41
0.43
0.45
Actual and Hypothetical Gini Ratio
Actual Gini Ratio Hypothetical Gini Ratio

The CausesThe CausesThe CausesThe Causes
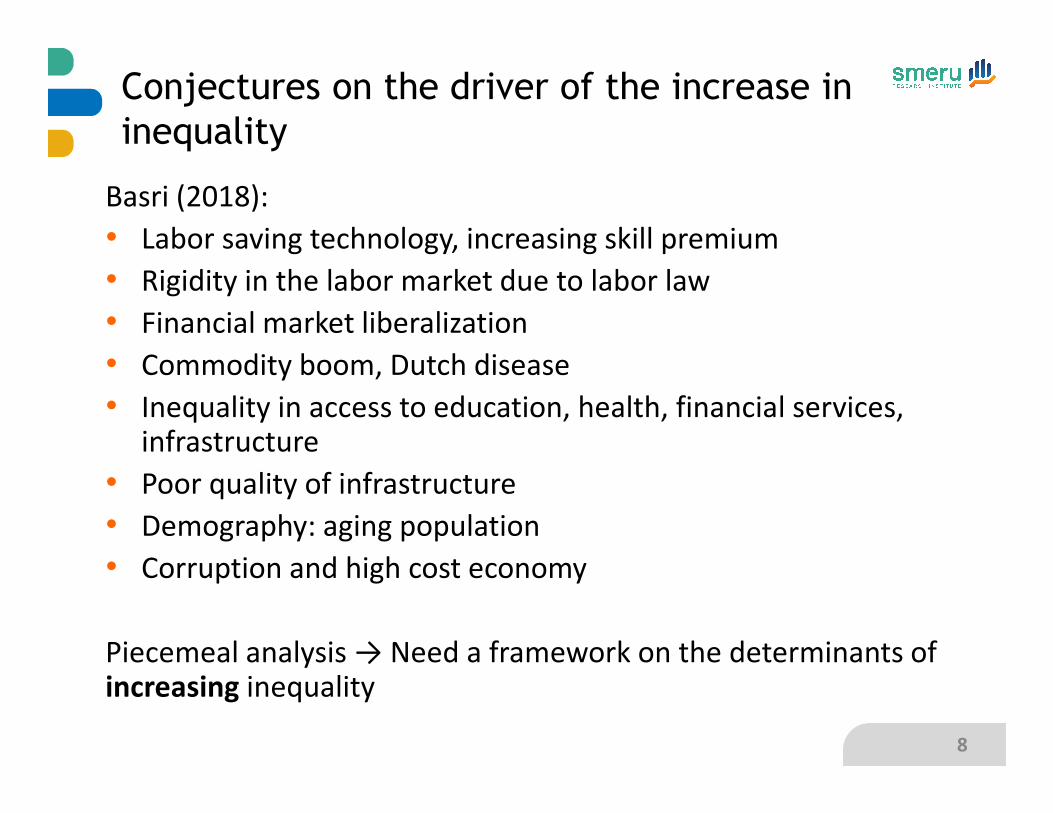
Basri (2018):
• Labor saving technology, increasing skill premium
• Rigidity in the labor market due to labor law
• Financial market liberalization
• Commodity boom, Dutch disease
• Inequality in access to education, health, financial services, infrastructure
• Poor quality of infrastructure
• Demography: aging population
• Corruption and high cost economy
Piecemeal analysis → Need a framework on the determinants of increasing inequality
8
Conjectures on the driver of the increase in
inequality
9
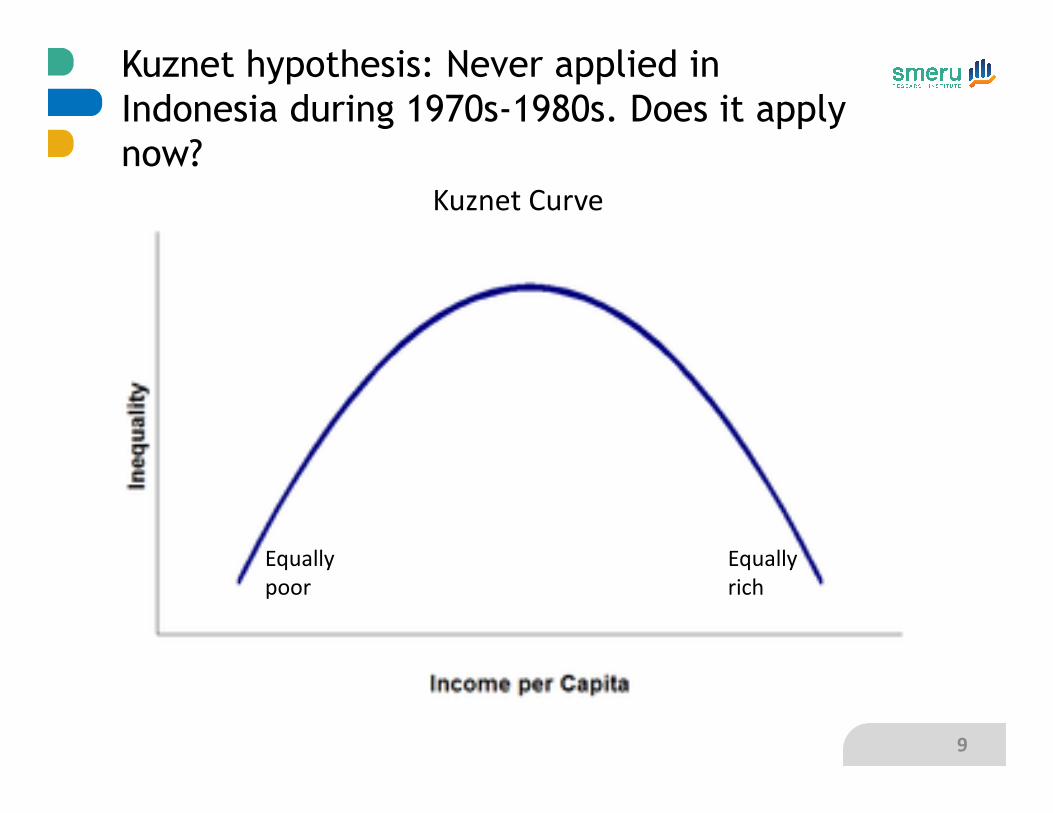
Kuznet hypothesis: Never applied in
Indonesia during 1970s-1980s. Does it apply
now?
Kuznet Curve
Equally
poor
Equally
rich
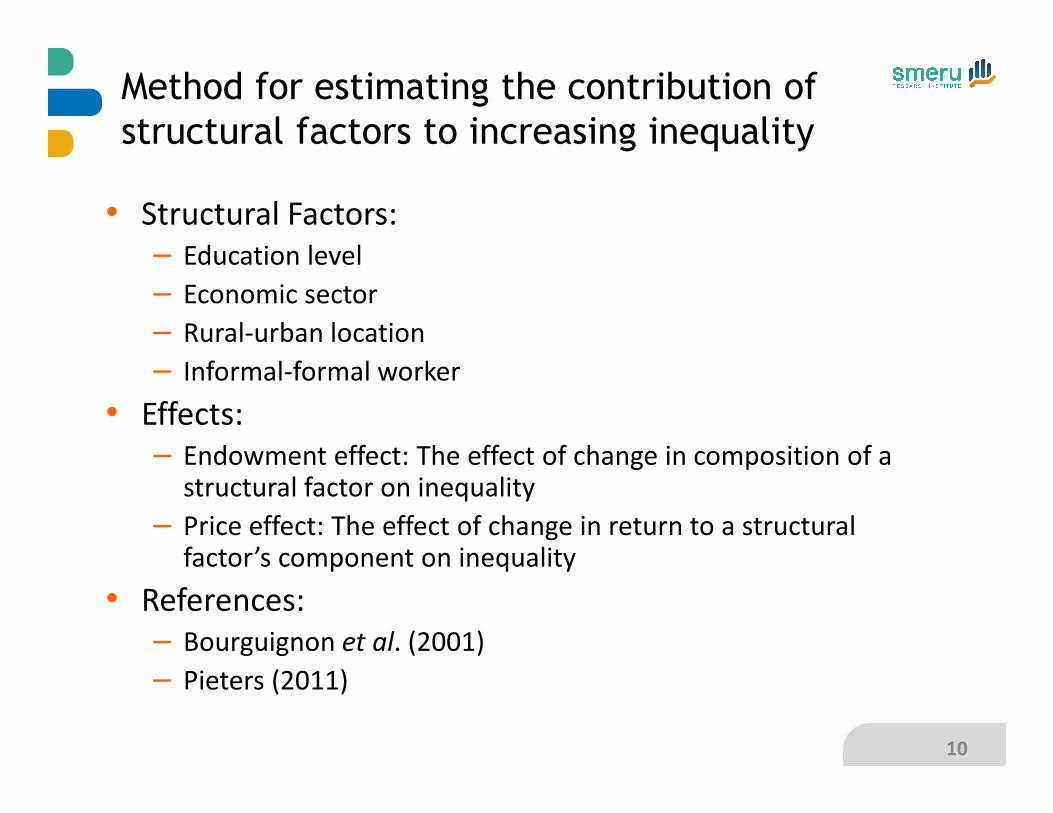
• Structural Factors:
– Education level
– Economic sector
– Rural-urban location
– Informal-formal worker
• Effects:
– Endowment effect: The effect of change in composition of a structural factor on inequality
– Price effect: The effect of change in return to a structural factor’s component on inequality
• References:
– Bourguignon et al. (2001)
– Pieters (2011)
10
Method for estimating the contribution of
structural factors to increasing inequality
0%
10%
20%
30%
40%
50%
60%
70%
80%
90%
100%
1986 1988 1989 1991 1992 1994 1996 1997 1998 2000 2001 2002 2003 2004 2005 2006 2007 2008 2009 2010 2011 2012 2013 2014 2015 2016 2017
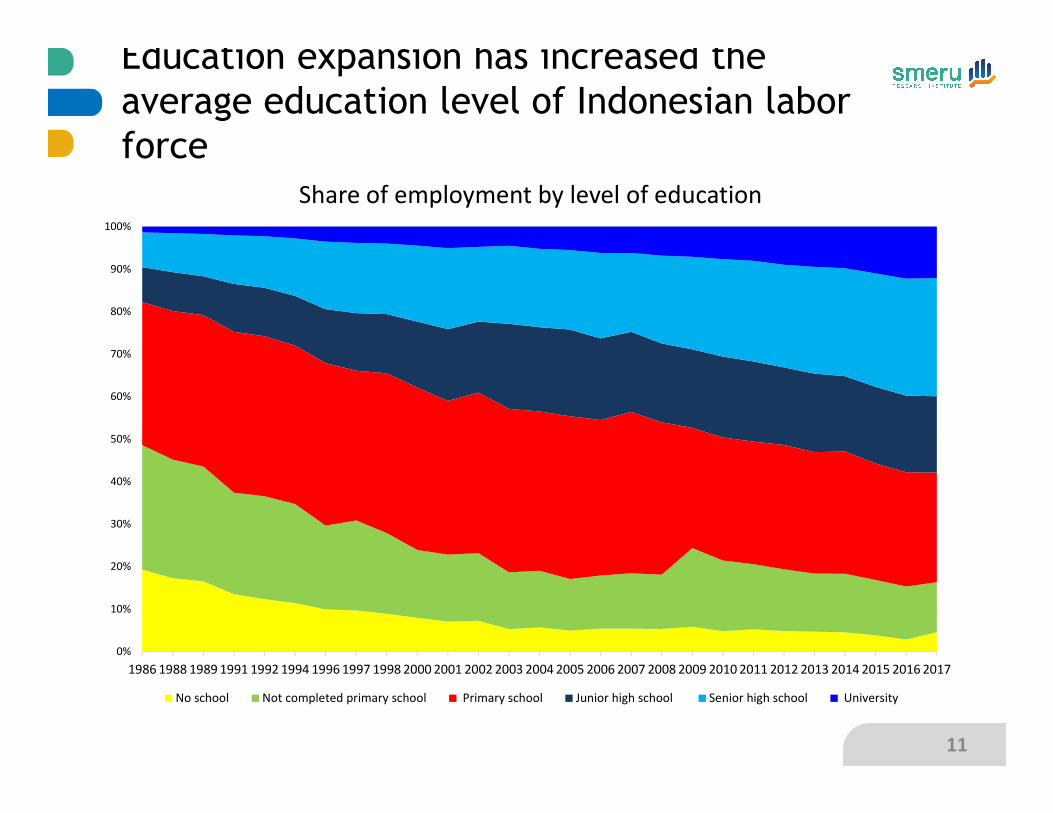
Share of employment by level of education
No school Not completed primary school Primary school Junior high school Senior high school University
Education expansion has increased the
average education level of Indonesian labor
force
11
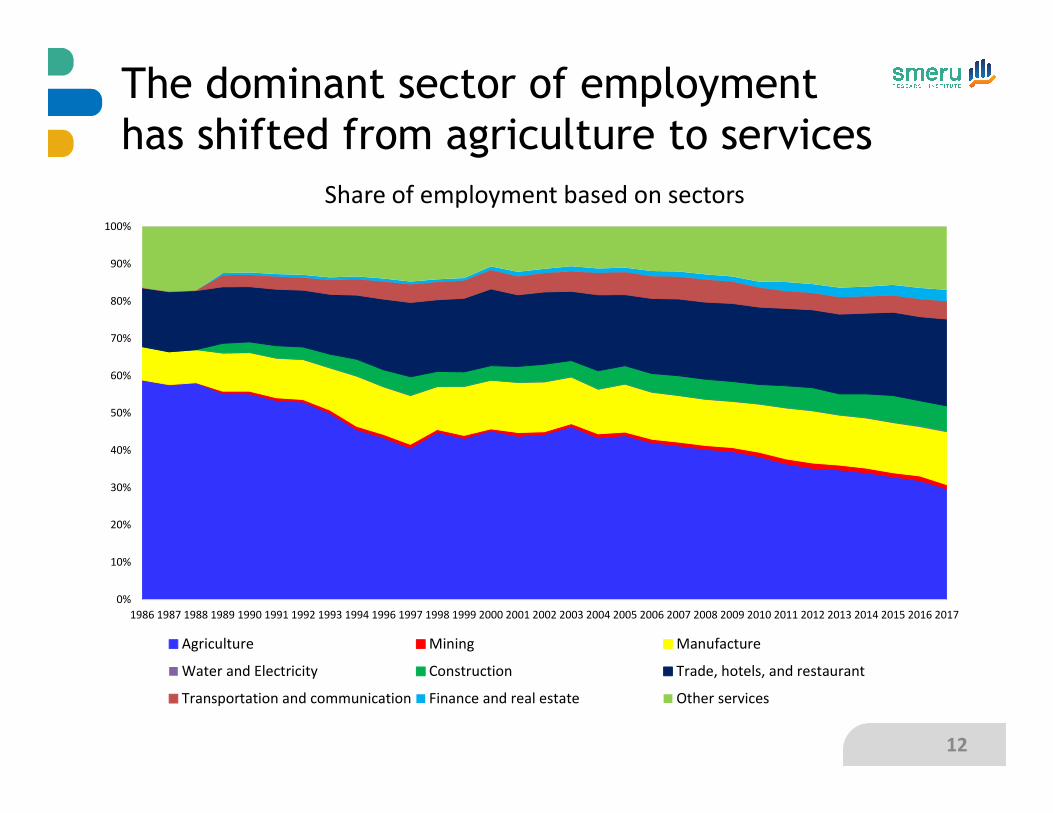
The dominant sector of employment
has shifted from agriculture to services
0%
10%
20%
30%
40%
50%
60%
70%
80%
90%
100%
1986 1987 1988 1989 1990 1991 1992 1993 1994 1996 1997 1998 1999 2000 2001 2002 2003 2004 2005 2006 2007 2008 2009 2010 2011 2012 2013 2014 2015 2016 2017
Share of employment based on sectors
Agriculture Mining Manufacture
Water and Electricity Construction Trade, hotels, and restaurant
Transportation and communication Finance and real estate Other services
12
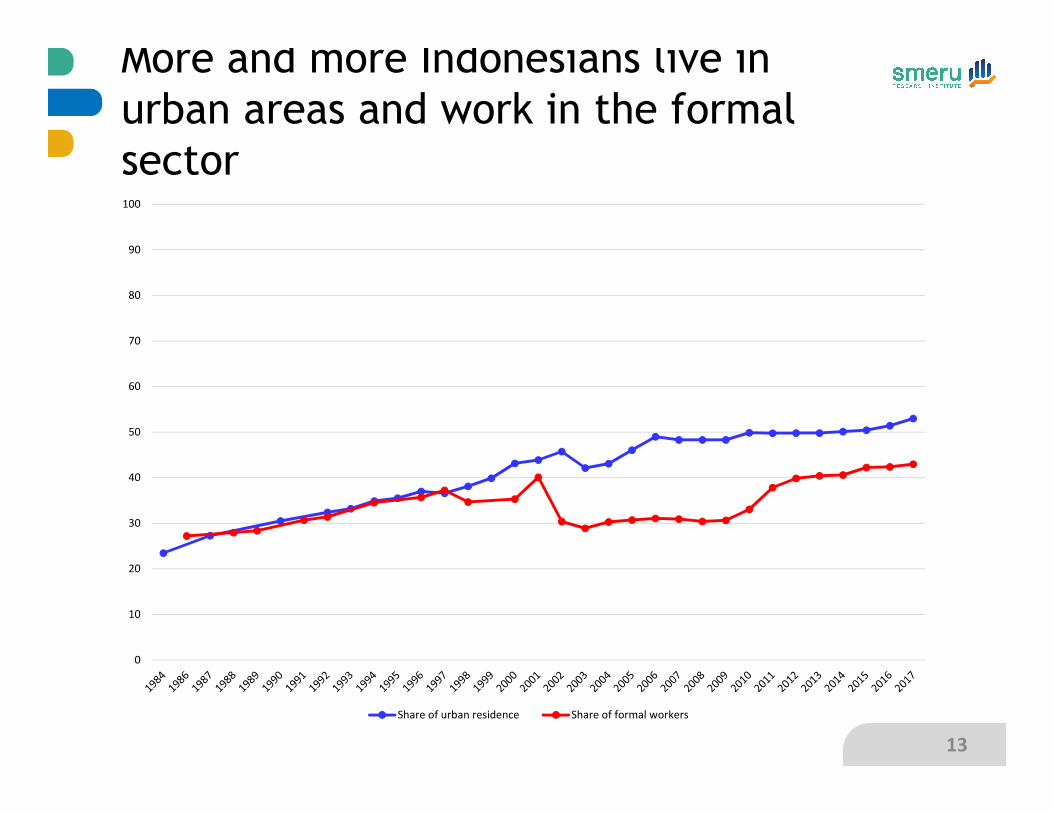
More and more Indonesians live in
urban areas and work in the formal
sector
0
10
20
30
40
50
60
70
80
90
100
Share of urban residence Share of formal workers
13
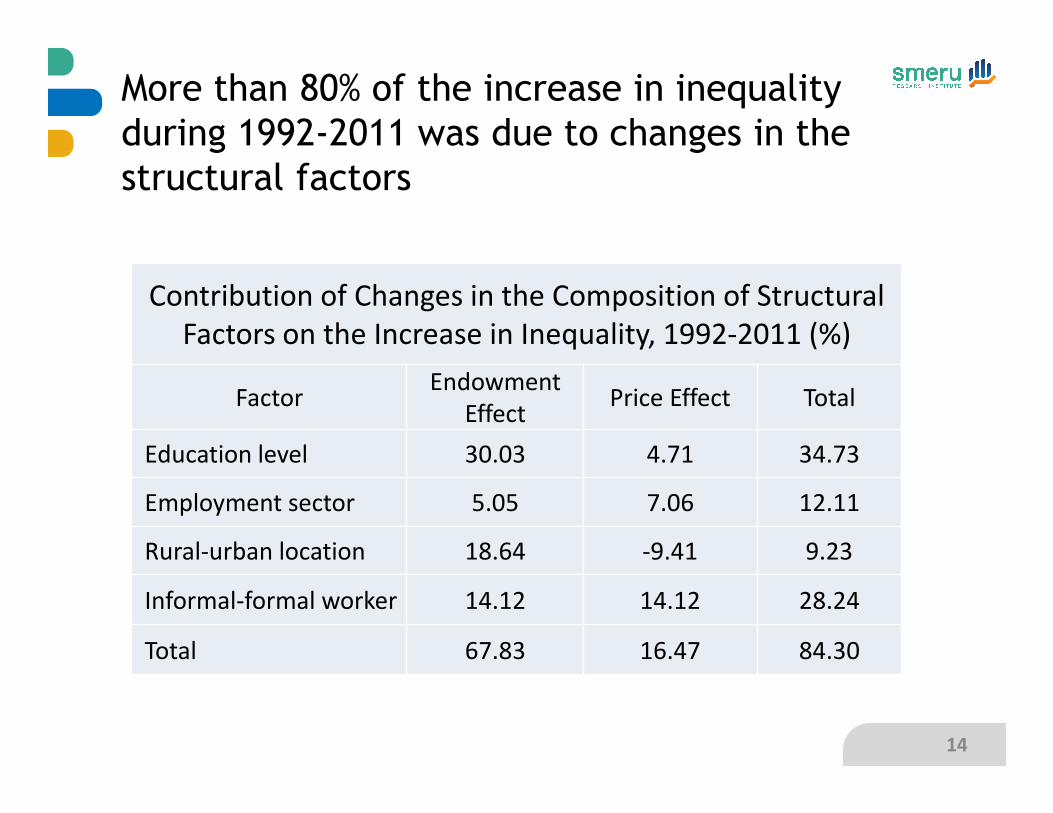
More than 80% of the increase in inequality
during 1992-2011 was due to changes in the
structural factors
14
Contribution of Changes in the Composition of Structural
Factors on the Increase in Inequality, 1992-2011 (%)
FactorEndowment
EffectPrice Effect Total
Education level 30.03 4.71 34.73
Employment sector 5.05 7.06 12.11
Rural-urban location 18.64 -9.41 9.23
Informal-formal worker 14.12 14.12 28.24
Total 67.83 16.47 84.30

The ConsequencesThe ConsequencesThe ConsequencesThe Consequences
16
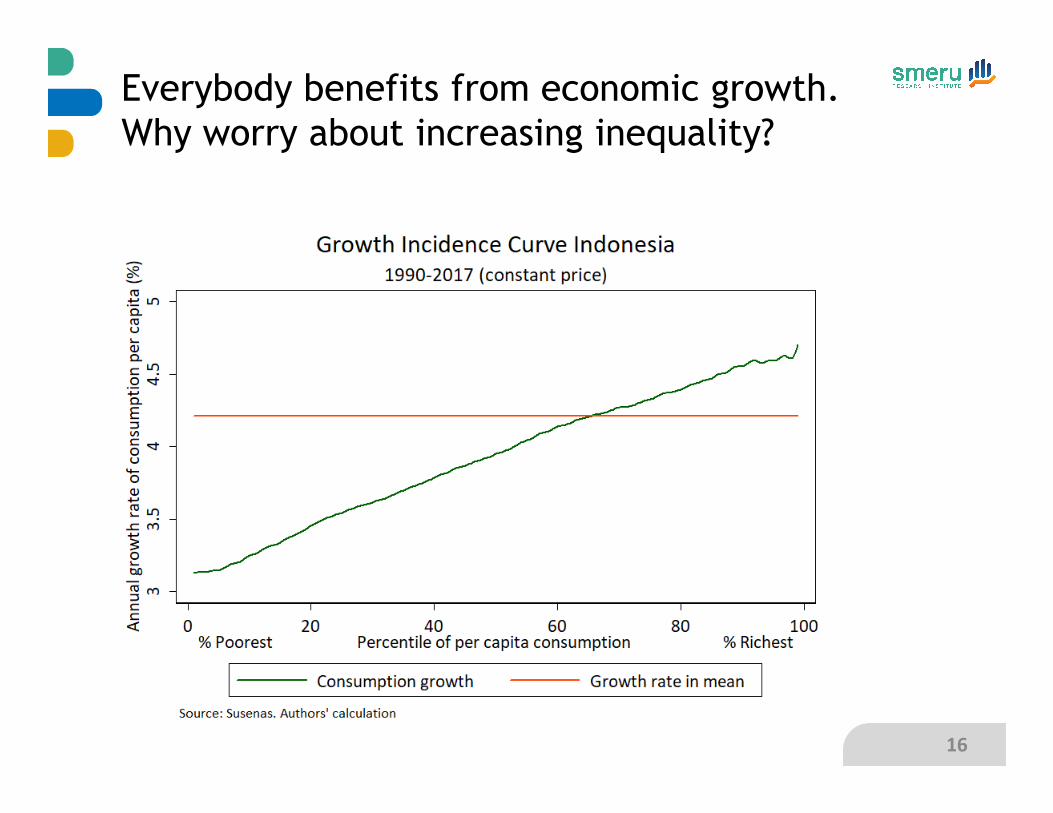
Everybody benefits from economic growth.
Why worry about increasing inequality?
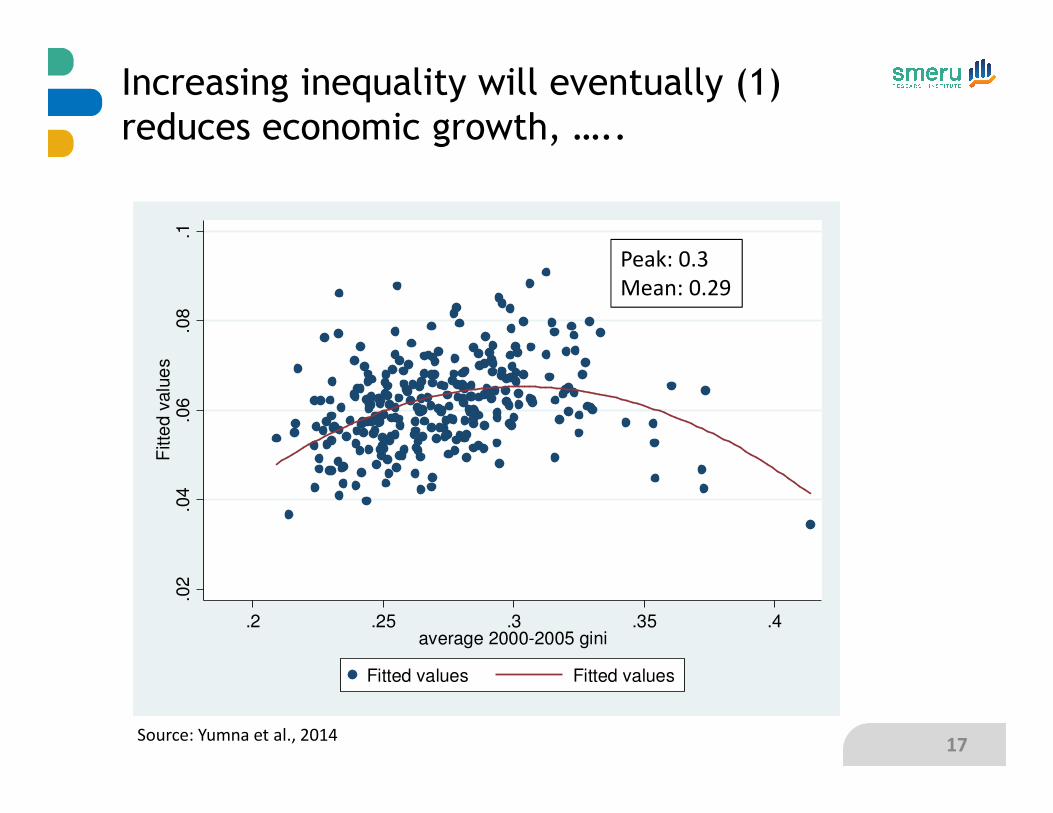
Increasing inequality will eventually (1)
reduces economic growth, …..
17
.02
.04
.06
.08
.1F
itte
d v
alu
es
.2 .25 .3 .35 .4average 2000-2005 gini
Fitted values Fitted values
Peak: 0.3
Mean: 0.29
Source: Yumna et al., 2014
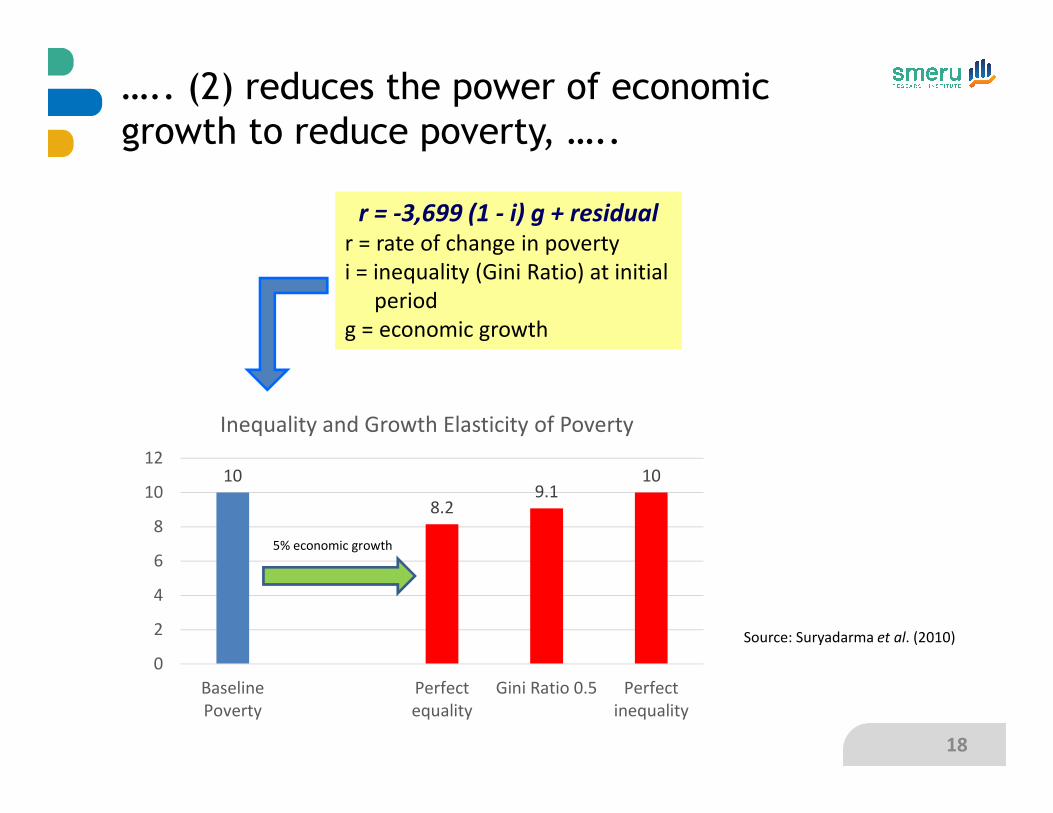
….. (2) reduces the power of economic
growth to reduce poverty, …..
18
r = -3,699 (1 - i) g + residual
r = rate of change in poverty
i = inequality (Gini Ratio) at initial
period
g = economic growth
10
8.29.1
10
0
2
4
6
8
10
12
Baseline
Poverty
Perfect
equality
Gini Ratio 0.5 Perfect
inequality
Inequality and Growth Elasticity of Poverty
5% economic growth
Source: Suryadarma et al. (2010)
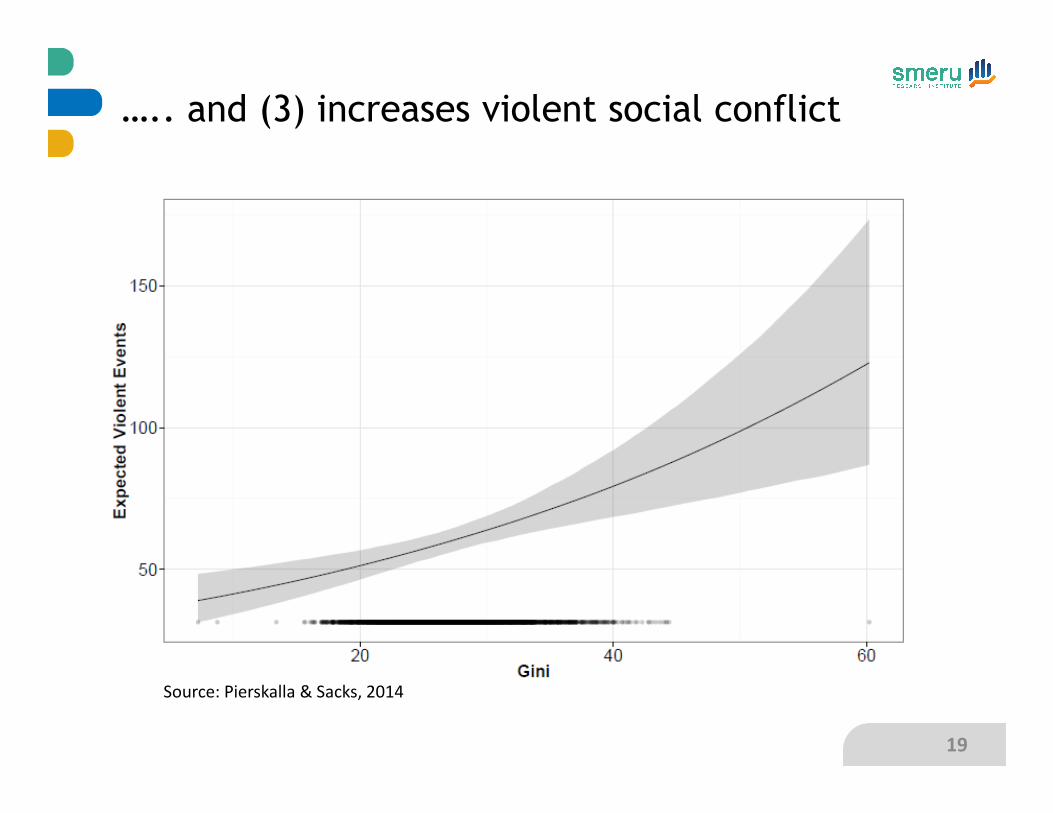
Source: Pierskalla & Sacks, 2014
19
….. and (3) increases violent social conflict

Medium Term OutlookMedium Term OutlookMedium Term OutlookMedium Term Outlook
21
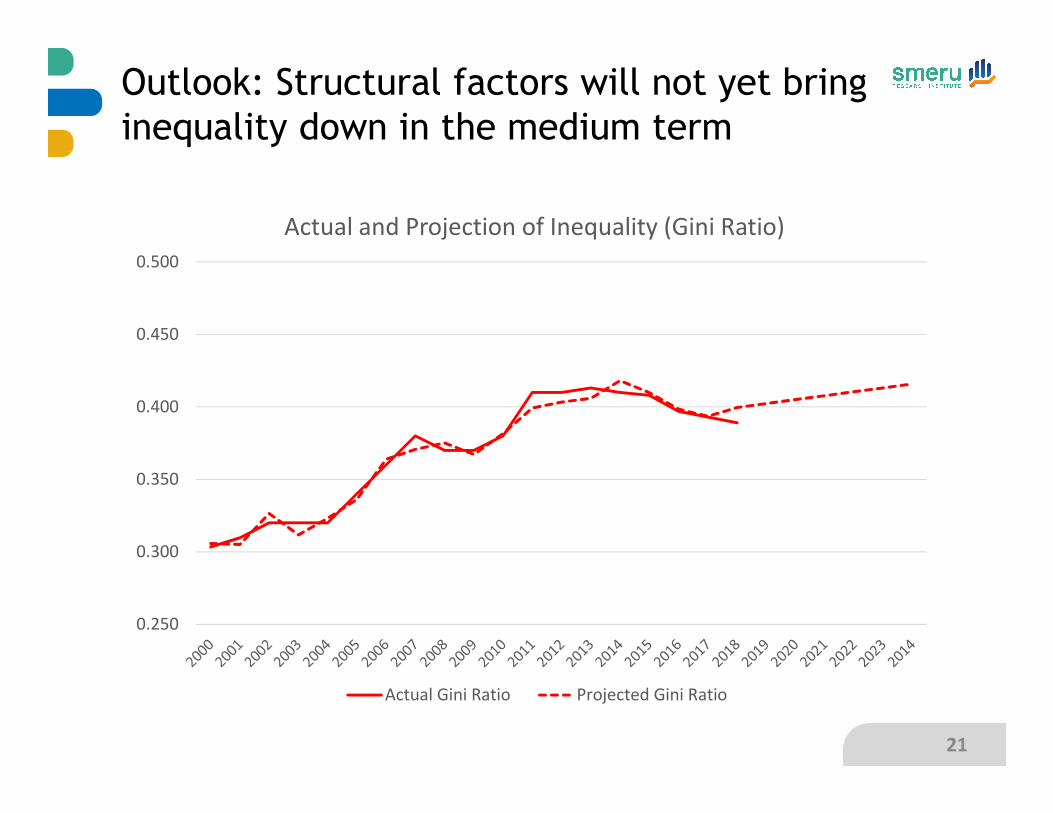
Outlook: Structural factors will not yet bring
inequality down in the medium term
0.250
0.300
0.350
0.400
0.450
0.500
Actual and Projection of Inequality (Gini Ratio)
Actual Gini Ratio Projected Gini Ratio
22
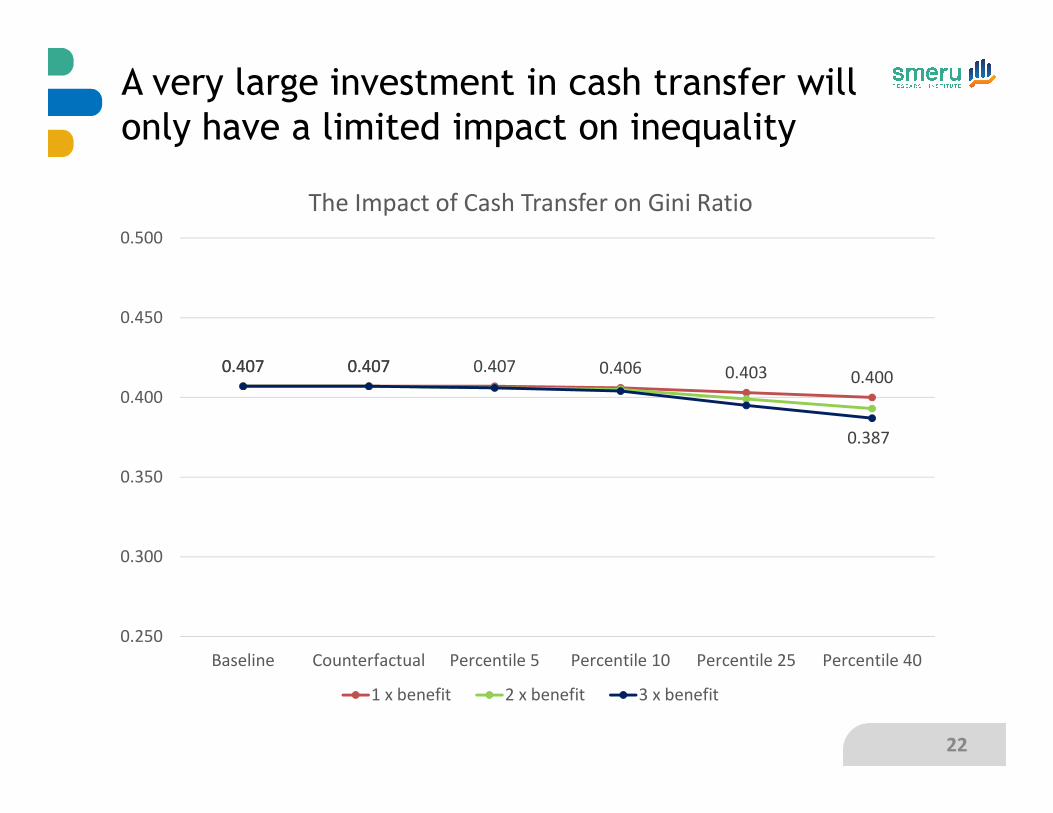
A very large investment in cash transfer will
only have a limited impact on inequality
0.407 0.407 0.407 0.406 0.403 0.4000.407 0.407
0.387
0.250
0.300
0.350
0.400
0.450
0.500
Baseline Counterfactual Percentile 5 Percentile 10 Percentile 25 Percentile 40
The Impact of Cash Transfer on Gini Ratio
1 x benefit 2 x benefit 3 x benefit
Conclusion
• The increase in inequality in Indonesia is mainly due to
development, which has brought changes in the
economic and social structure
• Given that Indonesia is still in the increasing trajectory of
Kuznet curve, a Gini Ratio of 0.4 or higher is the new
normal
• To reach the decreasing trajectory of Kuznet curve
sooner, where inequality will start to go down, Indonesia
needs to speed up the structural transformation through:
– Expanding education services further
– Fostering industrial development
– Facilitating formalization of economic activities
– Increasing the rate of urbanization
23