Embed Size (px)
Citation preview

CAUSES AND CONSEQUENCES OF FIRM DISCLOSURES
OF ANTICORRUPTION EFFORTS
Paul Healy and George Serafeim*
Harvard Business School
November 2011
Abstract
Using Transparency International’s ratings of firm disclosures on anticorruption efforts,
we find that disclosures are related to firms’ country and industry exposures to
corruption, and to enforcement and monitoring variables. We then examine whether
firms’ residual anticorruption disclosures are related to subsequent allegations of
corruption and subsequent performance. Firms with abnormally low anticorruption
disclosures have higher subsequent media allegations of corruption than firms with
abnormally high disclosure. They also report higher future sales growth, and a negative
relation between profitability and sales growth in high corruption countries. None of
those differences is observed across firms with high and low abnormal anticorruption
disclosures in low corruption countries. We interpret these findings as indicating that
firms with abnormally high disclosures enforce policies designed to combat corruption.
These policies are accompanied by lower subsequent allegations of corruption, and lower
but more profitable sales growth in high corruption countries.
* Paul Healy is a Professor at Harvard Business School, and George Serafeim is an Assistant Professor of
Business Administration in Harvard Business School. We are grateful to Transparency International, in
particular Robin Hodess and Deborah Hardoon, for providing the data for this study. We also wish to thank
to Barbara Esty and Kathleen Ryan for research assistance with the media data. Finally we are grateful for
comments received by Gwen Yu and participants at the HBS International Seminar. The project was
supported by financial assistance from the Department of Faculty Research and Development of the
Harvard Business School. Contact emails: Paul Healy [email protected], George Serafeim

2
1. Introduction
Corruption is increasingly viewed as a significant impediment to economic
development.1 A recent World Bank survey of more than 150 leading public officials
and citizens from 60 developing nations cited corruption as the number one factor
hampering their countries’ economic development and growth. Recent estimates of the
magnitude of corruption also indicate its severity. For example, Mexico Transparency
estimated that in 2007, Mexicans paid 115 million bribes amounting to $175 million for
35 services that should have been free. An Integrity Watch Afghanistan study indicated
that in 2009, the average Afghani citizen paid $156, or 31% of average per capita income,
in bribes. The World Bank estimates that globally bribes paid by individuals and firms to
the public sector, amount to $1 trillion per year, and that the cost of corruption equals
more than 5% of global GDP ($2.5 trillion).
Largely because of data limitations, research on corruption has focused on its
causes and consequences at the country level. Country factors are certainly important in
learning about corruption. But our understanding of corruption is also likely deepened by
studying the phenomenon at the firm level, where many questions remain unanswered. In
this study we try to answer some of those questions by using Transparency
International’s (TI) ratings of firms’ public disclosures of strategy, policies, and
management systems for combatting corruption. Our sample comprises 480 of the
world’s largest companies. We use the disclosure ratings to pose three questions. First,
are firms’ disclosures on anticorruption efforts related to their exposure to corruption
1 The World Bank, and this study, defines corruption as the misuse of public office for private gain. It
arises when individuals or firms pay bribes to public officials to facilitate legal transactions (e.g. to
accelerate the purchase of legitimate government licenses), to avoid potentially costly government
regulations (e.g. to evade pollution regulations), or to secure lucrative government contracts.
3
risk, as well as to enforcement and monitoring costs? Second, do firms with abnormally
high disclosures face fewer subsequent allegations of corruption? And third, is
subsequent firm growth and profitability related to abnormally strong and weak
anticorruption disclosures?
Our study contributes to a growing literature on bribery at the firm and individual
level,2 and deepens our understanding of corporate disclosure of anticorruption efforts.
Advocates for transparency have argued that disclosure is a “critical aspect of
demonstrating commitment by companies to prevent, monitor and address corruption”
(Transparency International, 2009). But it could also represent “cheap talk” to persuade
regulators that the firm is complying with local laws or ethical standards, or to create a
public image of a good corporate citizen. The casual observation that there is wide
variation in terms of anticorruption disclosures suggests that the perceived benefits and
costs vary widely across companies. Barriers to disclosure include concerns raised by
legal departments about exposure to increased liabilities and expenses incurred to put in
place a robust anticorruption system (PwC 2008). Benefits to disclosure include a better
reputation and a lower probability of employees engaging in corrupt activities which
could lead to a loss of credibility and social license, economic losses due to government
penalties and customers refusing to do business with the company, and a lower
attractiveness to skilled employees. For example, among large firms, 96% of senior
executives believe that a publicly disclosed anticorruption program is very valuable or
somewhat valuable to the company’s reputation and brands (PwC, 2008).
We make two contributions to the literature on firm bribery. First, by examining
2 See Svensson, 2003; Khwaja and Mian, 2005; Beck, Demirgurc-Kunt, and Maksimovic, 2005; Lyon and
Maher, 2005; Bertrand, Djankov, Hanna and Mullainathan, 2007; Di Tella and Franschelli, 2011; and
Spencer and Gomez, 2011.

4
whether disclosures on anticorruption efforts are related to costly actions, such as hiring
more reputable audit firms and U.S. listing, and to future allegations of corruption, we
provide evidence on whether such disclosures reflect firm commitment, or are merely
cheap talk. Second, our tests of the relation between firms’ residual anticorruption
disclosures and their financial performance provide evidence on the corporate costs and
benefits of corruption.
Our results indicate that firm disclosures on anticorruption efforts are related to
various proxies for potential exposure to corruption, including the extent of corruption in
home and host countries, and operation in a high-risk industry. Disclosures are also
related to monitoring and enforcement costs, such as enforcement of corruption laws by
home countries, U.S. cross-listing that subjects firms to U.S. laws and enforcement,
monitoring by big-four auditors, and prior experience with corruption enforcement.
Overall, our model of disclosure explains 42% of the variation in ratings. In addition to
increasing our understanding of the factors that explain firms’ disclosures of
anticorruption policies, these findings increase our confidence that the TI ratings are
related to underlying risks of corruption. Their relation to costly enforcement and to
costly complementary actions, such as U.S. listing and hiring big four audit firms,
suggests that disclosure is more than cheap talk.
The residuals of the disclosure model indicate whether the sample firms have
abnormally high or low disclosures of their anticorruption efforts. If these reflect real
efforts to combat corruption and are more than cheap talk, firms with positive residuals
would be less likely to face lower subsequent risk of being linked to corruption. To test
this hypothesis, we collect the number of articles that appear in major business

5
publications around the world and identify those that allege a corporation is involved in
corrupt activities. Controlling for a firm’s media presence and for the number of articles
about corruption in prior years, we find that firms with abnormally high anticorruption
disclosures have fewer subsequent media articles alleging corrupt activities.
We then use geographic segment data to examine three-year ahead sales growth
for sample firms with abnormally strong and weak transparency ratings. These tests
compare sales growth rates in high- and low-corruption segments, controlling for factors
associated with disclosure ratings. We find that in segments where corruption risk is high,
firms with abnormally low disclosure ratings have about 16% subsequent three-year sales
growth versus only 1% for firms with abnormally strong ratings. This is consistent with
firms that have unexpectedly strong disclosure ratings enforcing anticorruption efforts in
high-risk countries, leading to lower growth than firms with particularly weak ratings. In
contrast, residual ratings are unrelated to future sales growth in segments where
corruption risk is low.
However, our analysis also shows that sample firms with abnormally low
disclosures have a negative relation between their three-year ahead changes in profit
margins/ROEs and sales growth in corrupt geographic segments. Such is not the case for
firms with abnormally strong disclosures. Nor do we find any differential relation for
firms with abnormally high and low disclosure using sales growth in geographic
segments with low corruption risk. These findings suggest that firms with abnormally
high disclosure enforce policies designed to combat corruption at the cost of lower
growth. But such firms are able to defend their margins and ROEs on incremental sales in
these markets, whereas firms with abnormally low disclosure experience a decrease in

6
their profitability as they grow.
The remainder of the paper is organized as follows. Section 2 discusses prior
research on corruption. Section 3 describes the data and empirical tests, our findings are
presented in section 4, and conclusions in section 5.
2. Prior Research on Corruption
Academic research on corruption has typically focused on studying its macro causes and
consequences. These studies conclude that corruption has an adverse effect on a
country’s economic performance, lowering its GDP per capita, foreign investment and
economic growth, and increasing social inequality. 3
Corruption appears to be related to a
complex set of political and regulatory factors, such as the size of the public sector,
autocratic government, weak regulations, and lower economic competition;4 cultural
variables, like low levels of generalized trust, non-Protestant populations, and greater
acceptance of hierarchy;5 and geographic and historical influences, such as the abundance
of natural resources, corruption among neighboring states, and distance from the world’s
major trading centers. 6
3 See Hall and Jones 1999; Kaufmann et al. 1999a; Wyatt 2002; Lambsdorff 2003, Knack and Keefer 1995;
Mauro 1995; 1997; Brunetti et al. 1998; Brunetti and Weder 1998; Campos et al. 1999; Gymiah-Brempong
2002; Rock and Bonnett 2004; Tanzi and Davoodi 2001; Gupta et al. 2002; Gymiah-Brempong 2002; You
and Khagram 2005; Anoruo and Braha 2005; Mo 2001; Pellegrini and Gerlagh 2004; Méon and Sekkat
2005. 4 Elliott 1997; Adsera et al. 2000; Montinola and Jackman 2002; Gerring and Thacker 2005; Graeff and
Mehlkop 2003; La Porta et al. 1999; Goldsmith 1999; Sandholtz and Koetzle 2000; Persson et al. 2003;
Gerring and Thacker 2004, 2005; Montinola and Jackman 2002, Broadman and Recanatini 1999; Djankov
et al. 2002; Svensson 2005; Gerring and Thacker 2005; Ades and Di Tella 1997, 1999; Lambsdorff and
Cornelius 2000; Ades and Di Tella 1995; 1997, 1999; Sung and Chu 2003; Gerring and Thacker 2005;
Treisman 2000; Leite and Weidemann 1999; and Graeff and Mehlkop 2003. 5 La Porta et al. 1997; 1999; Uslaner 2004; Treisman 2000; Lipset and Lenz 2000; Gerring and Thacker
2005; Anderson and Tverdova 2003. 6 Ades and Di Tella 1999; Leite and Weidemann 1999; Sandholtz and Gray 2003; Gerring and Thacker
2005; Treisman 2000; Swamy et al. 2001.
7
Recent studies have studied corruption from the perspective of firms and
individuals. Studies of firms conclude that organizations are more likely to pay bribes
when they employ a local partner in high-risk countries (Spencer and Gomez, 2011) and
when they have low bargaining power (Svensson, 2003).
Firm studies have also examined the consequences of corruption in a variety of
settings. Beck, Demirgurc-Kunt, and Maksimovic (2005) show that firm growth is
constrained in countries where there is corruption among bank officials. Kwaja and Mian
(2005) find that politically connected firms in Pakistan received more loans and had
higher default rates than unconnected firms. Di Tella and Franceshelli (2011) find that
Argentinian newspapers are less likely to report government corruption on their front
page if they generate more government advertising. Weitzel and Berns (2006) show that
takeover premiums are lower for targets in corrupt countries, and interpret this as
evidence of acquirers being price-protected against any incremental risk or lower profits
associated with the deal. Lyon and Maher (2005) document that U.S. firms that reported
paying bribes prior to the FCPA faced higher audit fees, consistent with bribery
increasing monitoring costs. Kwok and Tadesse (2006) examine whether multinational
corporations (MNCs) influence corruption in countries in which they operate. The
authors hypothesize that this can arise from MNC home country regulations that penalize
MNCs caught engaging in corruption, and host country businesses learning about the
costs of corruption from MNCs. Consistent with this hypothesis, they find that corruption
is negatively related to past foreign direct investment.
However, despite the useful insights generated by these previous studies, our level
of understanding of why different firms exhibit different attitudes towards corruption and

8
the consequences for their performance is still relatively low.
3. Sample, Anticorruption Ratings, and Empirical Tests
3.1. Anticorruption Ratings
In 2007, Transparency International (TI) developed a study to rate firms’ public
disclosures of their anticorruption efforts. The specific rating system used to assess a
company’s anticorruption efforts is presented in the Appendix. The information is
separated into three categories: strategy (valued at 10 points), policies (valued at 15
points), and management systems (valued at 25 points).7
Strategy information covered whether a firm discloses an anticorruption policy,
its membership of anticorruption initiatives, and the extent of its application of the policy.
Policy information included disclosure of policies prohibiting facilitation payments and
the giving and receiving of inappropriate gifts by employees, as well as the regulation
and transparency of political contributions and lobbying. Finally, management system
disclosures covered information provided on requirements for business partners to
comply with the company’s anticorruption efforts, anticorruption training for employees
and business partners, whistleblower and help systems for employees, systems to monitor
corruption breaches and to act against employees involved, and key performance
indicators to track complaints, actions taken, and the extent of corruption-related training.
3.2. Sample
7 TI assigned a higher weight to management systems because they believe that systems are less likely to
represent cheap talk but rather real efforts of corporations to combat corruption.

9
TI’s initial sample comprised 500 leading firms from Forbes’ March 2007 Global 2000,
including the largest 250 listed companies, 107 companies from high-risk sectors, and
143 companies from the top 25 global exporting countries. Companies eligible to be
added from high-risk sectors comprised the largest 40 oil and gas firms, the largest 40
companies in basic materials (including forestry and mining), the 20 largest aerospace
and defense firms, and the largest 20 firms in each of the capital goods, construction,
telecommunications, and utilities sectors. Eligible companies from the 25 largest global
exporters (as defined by the World Bank in 2005) included a minimum of 40 companies
from the three largest exporting countries (United States, Germany and Japan), at least 30
companies from the next three largest export countries (China, France and the United
Kingdom), at least 20 from the next three largest export countries (Italy, Canada and
Netherlands), 10 or more from the 10th
to 20th
largest exporting nations (excluding Saudi
Arabia, Malaysia and Singapore which had less than 10 companies listed on the Forbes’
Global 2000), and at least 5 companies from the 21st to 25
th largest export countries.
Of the initial sample of 500, 14 firms were eliminated by TI because they were no
longer listed, were a holding company of another company included in the analysis, or
there was inadequate information in English or the local language to adequately evaluate
their efforts. We eliminated six more companies because of data unavailability, leaving a
final sample of 480 firms.
Table 1a presents the distribution of the initial sample firms by country, and table
1b shows the distribution by sector. Twenty-five percent of the sample firms are from the
U.S., 8 percent each from Japan and Germany, and 6 percent each from the U.K., France
and China. In total, 31 countries are represented in our sample. Comparing these numbers
10
to the contribution of each country to world GDP as of 2007, US, UK and French firms
are slightly overrepresented, while Chinese firms are underrepresented. Industries heavily
represented, each with ten percent, include banking, basic materials, and oil and gas.
Other industries with substantial presence in the sample are capital goods, chemicals,
construction, telecommunications, and utilities.
To construct the ratings for each of the 480 sample companies, TI investigators
examined their public documents available prior to June 2007 (corporate websites, annual
reports, and sustainability reports). For further information on the ratings methodology
see Transparency International (2009).
Summary statistics on the aggregate scores for the sample companies are reported
in table 2. The maximum score for any single company is 50. The mean score is 16.9 and
the median 19, implying that most of the sample companies disclose less than 50 percent
of the anticorruption factors included in the TI rating system. However, there is
significant variability in corporate disclosure of anticorruption efforts. The first quartile
score is 3.75, implying that more than 25 percent of the sample firms discloses almost
nothing. In contrast, the third quartile score is 26.
3.3. Factors Associated with Disclosure Ratings
Our first test examines factors that are associated with firms’ disclosure ratings. These
include factors representing regulatory enforcement and external monitoring of business
practices associated with corruption and bribery, factors that reflect inherent corruption
risk, and a variety of controls.
11
Regulatory enforcement and monitoring variables include home country
enforcement, prior enforcement actions against the company, U.S. listing, and use of a
big four audit firm:
(i) Home country enforcement. Companies from home countries that actively
enforce anticorruption laws are expected to demonstrate that they have strong
policies in place to protect against the risk of bribery and to reduce the
penalties that they could face from any enforcement actions. Home country
enforcement is the number of prosecutions in the home country in 2006 and
2005, deflated by its share of world exports (representing its economic
importance).8 We obtain that data from the OECD enforcement report on
bribery and corruption.
(ii) Prior enforcement actions against the company. Companies that have faced
prior enforcement actions for bribery or corruption are expected to have
higher disclosure ratings since they are likely to have developed
anticorruption policies in response to the prior actions and to be more
conscious of the costs of corruption. Prior enforcement actions is an indicator
variable that takes the value one if a firm was prosecuted for corruption in the
past, and zero otherwise.
(iii) U.S. Listing. Firms listed as ADRs on the New York Stock Exchange and
NASDAQ are required to adhere to the U.S. Foreign Corrupt Practices Act,
and are subject to U.S. enforcement of the Act, which is the strongest in the
world. Firms that elect to list in the U.S. are therefore expected to have
8 Frequency of enforcement actions against corruption tends to be very persistent over time at the country
level and as a result including data for previous years, yields very similar results. Moreover, we expect that
firms’ anticorruption efforts will be influenced more by the current enforcement environment.

12
demonstrated strong efforts to combat corruption to avoid the regulatory costs
of enforcement actions. U.S. listing is a dummy variable that takes the value
one if the sample firm is listed as an ADR on the NYSE or NASDAQ at the
end of 2006, and zero otherwise.9
(iv) Big Four Auditors. Given their reputations, big four audit firms are expected
to demand stronger anticorruption standards and disclosures by the companies
they audit. Consequently, we predict that the disclosure ratings will be
positively related to big four audit firm selection. The big four audit variable
is a dummy variable that takes the value one if the sample firm has a big-four
auditor at the end of 2006 and zero otherwise.
Variables reflecting the inherent risks of corruption faced by companies include
home and host country corruption rankings and whether the firm operates in a high-risk
industry. Although we expect that these variables will be related to disclosure ratings, it
is difficult to predict whether their effect will be positive or negative. Firms that operate
in high corruption home or host environments could opt for extensive disclosure of their
anticorruption efforts to communicate their commitment to internal and external
stakeholders, and to reduce the risks. Alternatively, such firms could decide to be opaque
to avoid drawing attention to questionable business practices.
The specific variables used to reflect exposure to corruption are as follows:
(v) Home Country Corruption Rating. The level of home country corruption is
likely to be an important factor in determining a firm’s inherent risks of
corruption and bribery, and to influence its anticorruption efforts and
9 Indicatively, the United States pursued 75% of all foreign bribery enforcement actions between 1977 and
2011. The second most active enforcer was the United Kingdom with 5.1% of the cases. For more
information see the TRACE Global Enforcement Report 2011.

13
transparency. Home country corruption is the 2006 World Bank corruption
rating10
for sample firms’ country of origin.
(vi) Weighted Average Host Geographic Segment Corruption Ratings. The
sample firms typically operate in a variety of geographic segments outside
their home country, ranging from those where corruption is common to those
where it is not. Corruption ratings for each host segment are computed by
weighting the 2006 World Bank corruption ratings for the countries that make
up the segment by countries’ relative GDP. We then compute the weighted
average rating for all host segments for a firm by weighting each segment
rating by its share of total company sales.
(vii) Industry Risk. A company’s exposure to corruption is also likely to be
determined by the industry in which it operates. Industries that sell products
and services to government customers are considered high-risk. As identified
by TI, these include oil and gas, basic materials (including forestry and
mining), defense, capital goods, construction, telecommunications, and
utilities sectors. These industries score the highest at TI’s Bribe Payers Index
(BPI) that measures the supply of bribes in different sectors. We measure
industry risk by constructing an indicator variable that takes the value one for
firms that operate in one of these sectors, and zero otherwise.
Finally, we include controls for firm size, profitability, ownership structure and
diversification that other studies have found to be related to disclosure:
10
The World Bank Control of Corruption measure is an aggregate of 15 measures that reflect the severity
of corruption in a country. For the firms in our sample, this measure ranges from -0.81 for the most corrupt
country to 2.39 for the least corrupt country.

14
(viii) Firm Size. If there are economies of scale at the firm level in developing
anticorruption systems and providing detailed disclosure on these efforts,
larger firms are more likely to have higher ratings than smaller counterparts.
Of course, the TI sample comprises many of the largest firms in the world that
should all be able to take advantage of any economies of scale. We measure
firm size by the natural logarithm of total assets at the end of 2006.
(ix) ROE. Prior studies conclude that disclosure increases with profitability (see
Healy, Hutton and Palepu 1997, Miller 2002). To control for this effect, we
include firm return on equity (ROE) in the model. ROE is net income deflated
by beginning-of-year shareholders’ equity for 2006.
(x) Closely held Ownership. Prior research (Eng and Mak 2003) has found that
firm disclosure is related to its ownership structure. Closely held ownership is
measured by the percentage of shares held by investors that own at least 5% of
the shares at the fiscal year end of 2006.
(xi) Diversification. Bens and Monahan (2004) find evidence consistent with
highly diversified firms providing more disclosure, which they argue
facilitates monitoring. Given the industry and international diversification of
many of the sample firms, we control for these effects. International
diversification is the percent of a firm’s sales outside its home country divided
by total sales for fiscal year end of 2006. Industry diversification is the
number of industry segments that the firm operates in, calculated using two-
digit SIC codes.

15
Descriptive statistics for the above variables are presented in table 2. The sample
firms are large and profitable. The median firm has assets valued at $30 billion11
and a
return on equity of 25.3 percent. It operates in 4 business segments,12
and generates 34
percent of sales outside its home country. Forty-five percent operate in high-risk
industries, 89 percent have a big four auditor, and 34 percent list as an ADR in the U.S.
Only 2 percent of the firms had corruption enforcement actions in the past, consistent
with enforcement actions against corruption and bribery being rare events. Finally, on
average the sample companies’ host countries are more corrupt than their home countries.
3.4. Disclosures and Subsequent Allegations of Corruption
As discussed earlier, one challenge for our study is that it is unclear whether ratings of
anticorruption disclosure, the primary dependent variable, reflect strong firm
commitment to fighting corruption or merely cheap talk. Firms that are committed to
combatting corruption are likely to disclose their policies widely to communicate with
employees, customers, investors, and regulators. But it is also plausible that less
committed firms disclose comparable efforts to combat corruption, but have weak
enforcement. Further, the TI ratings are based on public disclosures. Firms that provide
extensive internal disclosures (that reach customers and employees directly) could be
equally committed to fighting disclosure as highly rated firms. To provide a deeper
understanding of whether the disclosure ratings reflect actual firm anticorruption
enforcement, we examine whether abnormally strong or weak anticorruption disclosure
11
Calculated as the exponent of 17.24. 12
Calculated as the exponent of 1.39.

16
ratings are related to allegations of bribery in the media subsequent to the date the ratings
were constructed.
If ratings reflect actual commitments to combating corruption, firms with
abnormally high ratings (controlling for the factors discussed above) will have made
particularly strong efforts to combat bribery and have a lower likelihood of being
associated with corruption compared to peers with abnormally low ratings. To test this
hypothesis, we estimate the association between abnormal disclosure scores and
subsequent allegations of corruption made against the sample firms. To measure
subsequent allegations of corruption, we collect data for each sample firm on the number
of articles in major news and business publications from 2008 to 2010 where the
company is mentioned in conjunction with allegations of corruption or bribery. We
include as independent variables the total number of articles where the company is
mentioned during this period to control for media interest, and the number of articles
where the company is mentioned in relation to a corruption scandal in 2007 to control for
preexisting corruption scandals.
We search Factiva for the number of media articles that concern each particular
company. Factiva indexes each article and names the company that the article is dealing
with as well as the subject under which an article can be classified. We restrict our
searches to all media publications that are classified under “Major News and Business
Publications” because these publications are more credible, increasing our confidence
that the allegations are not completely unsubstantiated. To classify articles alleging that a
company is involved in corrupt activities, we add the subject terms “Corruption”,
“Bribery”, and “Financial Crime”. The average number of articles that allege a company

17
as being corrupt is 11.5 in 2010, 8.2 in 2009, and 10.4 in 2008. The average number of
articles for a company is 2,804 in 2010, 2,522 in 2009, and 2,437 in 2008.
To test the relation between corruption allegations and prior disclosure, we
estimate the following model:
CorruptArticlesit is the number of media articles in year t (t = 2008, 2009, and 2010 for
the dependent variable, and t = 2007 for the independent variable) alleging that a firm is
involved in corruption. Res_DRi,2007 is the firm’s residual anticorruption disclosure rating
in 2007 generated from the disclosure prediction model discussed in the previous section.
TotalArticlesit is the total number of media articles for the company in a given year.
A negative relation between abnormal disclosure ratings and subsequent
corruption allegations is consistent with disclosures made by the sample companies
reflecting their actual anticorruption efforts. In contrast, an insignificant or positive13
relation indicates that the company disclosures are merely public relations efforts
designed to manage external perceptions.
3.5. Disclosure and Subsequent Performance
Finally, we examine whether firms’ disclosure ratings are related to the firm’s subsequent
performance. We hypothesize that if firms with abnormally high disclosure ratings are
committed to fighting corruption, they will report lower sales growth in high-risk
13
A positive relation between subsequent media allegations about corruption and the residual component of
disclosure could arise also because the determinants model incompletely captures the riskiness of a firm’s
environment. This would bias the results against our hypothesis.
18
countries/regions because they are unable to compete effectively against local incumbents
or multinationals with lower anticorruption standards. We expect that this will be
especially true in countries where corruption is widespread.
However, the effect of disclosure (and commitment) on profitability is less clear.
If firms with high anticorruption efforts generate lower sales growth and are unable to
take advantage of economies of scale, their profitability will decline. Yet such firms will
also show lower costs because they do not pay bribes. Department of Justice/SEC (2008)
allegations against Siemens, reported that on average the costs of bribery paid by the
company on a sample of corrupt transactions amounted to 3.2% of sales.14
Moreover, the
unintended consequences of fostering a corporate culture that tolerates corruption and
bribery are potentially severe. These companies might face increased costs and lower
revenues due to damaged corporate reputation and goodwill, employee theft, product
quality and safety concerns, inability to attract top human capital etc. We therefore make
no a priori prediction about the relation between disclosure and profitability.
To estimate the relation between subsequent sales growth rates, profits, and
disclosure, we compute the following variables:
Geographic Segment Sales Growth Rates: Sales growth rates for the sample firms’
geographic segments are computed for the three-year period from 2007-2010, which is
subsequent to the date the disclosure rating was constructed.
Geographic Segment Corruption Risk: We use two approaches to assign firms’
geographic segments to high- and low-corruption risk categories. The first compares the
2006 World Bank corruption rating for a segment to the average for all segments
14
See also comments by Peter Solmssen, General Counsel for Siemens, in discussing corrupt transactions
uncovered at Siemens, in Fighting Corruption at Siemens, P. Healy and D Pietrowski, HBS Case,
September 2009.

19
included in our sample.15
Segments with ratings higher (lower) than or equal to the
sample median are classified as being high- (low-) risk. Such an approach maximizes the
difference between the high- and low-risk classifications.
The second approach recognizes that some firms may decide to compete only in
high-risk (or low-risk) regions. In such a case, different firms will be assigned to each
category, making it possible that differences in sales growth are attributable to firm-
specific correlated omitted variables. We therefore use a firm-specific approach to
classify geographic segments. Under this method, a firm’s segments are recorded as high
(low) risk if they are higher (lower) than or equal to the median rating for all segments
where the firm operates. This approach ensures that firm observations are equally
represented across both the high- and low-risk categories. However, it also requires that
firms report sales for at least two geographic segments. Forty-seven firms have data for
only one geographic segment and are therefore excluded from this test.
Profitability: Segment profits are not consistently available for the sample firms. This is
because it is fairly unusual for companies to report profitability numbers for each
segment. We therefore use two measures of firm profitability changes subsequent to the
construction of the disclosure ratings. The first is the change in firm return-on-sales from
2007 to 2010 (ROS), where ROS is net income over sales. The second measure is the
change in firm Return-on-Equity from 2007 to 2010 (ROE) where ROE is defined as
net income over beginning-of-year shareholder’s equity.
15
47 countries/regions are included in our segment sample.

20
Abnormal Disclosure Ratings: We use abnormal (residual) firm disclosures of
anticorruption efforts in our performance analysis to control for factors associated with
disclosure discussed in section 3.3.
We conduct two tests of the effect of corruption risks and disclosure ratings on
geographic segment sales growth. The first is a difference-in-differences approach that
compares segment sales growth rates for companies with abnormally high and low
anticorruption disclosure ratings in segments with high and low corruption risk. The
second test uses OLS to estimate the relation controlling for lagged sales growth:
where SGijt is sales growth for geographic segment j for firm i in period t (t=2007-2010),
is a dummy variable that takes the value one for segments with corruption risk
below the median segment (and zero otherwise), and is a dummy variable that
takes the value one if a firm has a residual disclosure rating higher than the sample firm
median (and zero otherwise).
To test the impact of segment sales growth on profitability, we estimate the
following regression models:

21
ROSi is the change Return-on-Sales from 2007 to 2010 for firm i, ROEi is the change
in Return-on-Equity from 2007 to 2010 for firm i, SGLO
(SGHI
) are the aggregate sales
growth rates for low- and high-risk countries/regions. 2 (3) is the effect of sales growth
in low (high) corruption countries on the change in profitability margins. 4 represents
the impact of high abnormal corruption disclosure in low-risk countries on profitability.
5 represents the impact of high abnormal corruption disclosure in high-risk countries on
profitability, and is the primary coefficient of interest.
4. Results
4.1. Determinants of Variation in Disclosure Ratings
Table 3 reports the results of the model explaining cross-company variation in
anticorruption disclosures. We standardize all variables to allow the reader to be able to
easily compare the relative economic significance of each variable. Because all variables
are scaled to have a standard normal distribution with zero mean and unitary standard
deviation, estimates represent the effect on the dependent variable of a one standard
deviation increase in the independent variables.
The overall explanatory power of the model is 42%, and many of the independent
variables are statistically and economically significant. It is worth noting that the
explanatory power of the model is very similar to that generated using only country and
industry fixed effects and the firm specific variables that are identified, suggesting that
the industry and country variables incorporated in the model capture much of the country
and industry variation in the data.

22
The enforcement and monitoring variables are all statistically and economically
significant. Home country enforcement has the largest estimated coefficient of 0.357,
implying that a one standard deviation increase in home country enforcement increases a
company’s disclosure rating by 0.357. The U.S. listing variable and big four auditor
variables are also positive and significant, indicating that firms that subject themselves to
U.S. anticorruption laws and enforcement through U.S. listing, and firms that hire big
four auditors report greater anticorruption efforts. Finally, firms that have experienced
past enforcement actions for corruption are more likely to have high disclosure ratings.
The significant estimates for the enforcement and monitoring variables suggest
that the disclosure ratings reflect more than just cheap talk. It is costly for firms that pay
lip service to anticorruption efforts (and receive a high disclosure rating) to list in the
U.S. or to hire a big four audit firm. Managers of such firms would face the risk of
enforcement actions and exposure of inconsistencies by auditors. Equally, firms that
operate in high enforcement countries or have faced prior enforcement actions face real
risks from pursuing a cheap talk disclosure strategy.16
These findings, therefore, lead us
to conclude that at least for an important subset of the sample firms, their disclosure
rating reflects a genuine effort to combat corruption.
The variables reflecting firms’ exposure to corruption are also significant. The
positive home country estimate implies that firms from less corrupt home countries
disclose stronger anticorruption efforts. The negative estimate for average host
geographic segment risk and the positive industry risk estimate indicate that firms
operating in high-risk host segments and industries are more likely to disclose strong
16
The Siemens situation, albeit an extreme one, demonstrates the potential costs for firms facing
enforcement actions. Siemens agreed to pay $1.8 billion in fines to U.S. and German regulators and spent
more than $800 million in costs to investigate and respond to the enforcement actions.

23
anticorruption efforts. However, we interpret the average host segment effect with
caution, as further unreported tests that interact the host segment risk variable with
foreign sales intensity indicate that the effect is stronger for firms with modest foreign
operations and insignificant for firms with sizable foreign operations.
Finally, only two of the control variables, the extent of foreign diversification and
the percentage of closely held shares, are significant. The positive coefficient on %
foreign sales indicates that internationally diversified firms report more anticorruption
efforts. The negative estimate on % closely held shares implies that firms with dispersed
ownership report fewer anticorruption efforts. Both these estimates are consistent with
prior research. But it is worth noting that variables that have been shown to correlate
strongly with corporate disclosures, such as firm size and profitability, are insignificant in
predicting disclosures of anticorruption efforts, perhaps because anticorruption
disclosures are different to other forms of disclosure, or because the sample comprises
only very large firms.
Overall, the results are consistent with firm disclosures being strongly related to
enforcement and monitoring costs and with exposure to corruption risk. The enforcement
and corruption estimates suggest that the disclosure ratings do not simply reflect cheap
talk, as firms that choose to list on U.S. exchanges, hire big four audit firms, and that are
subject to strong home country enforcement face real costs from “padding” their
anticorruption disclosures.
4.2. Subsequent Corruption Allegations and Disclosure Ratings

24
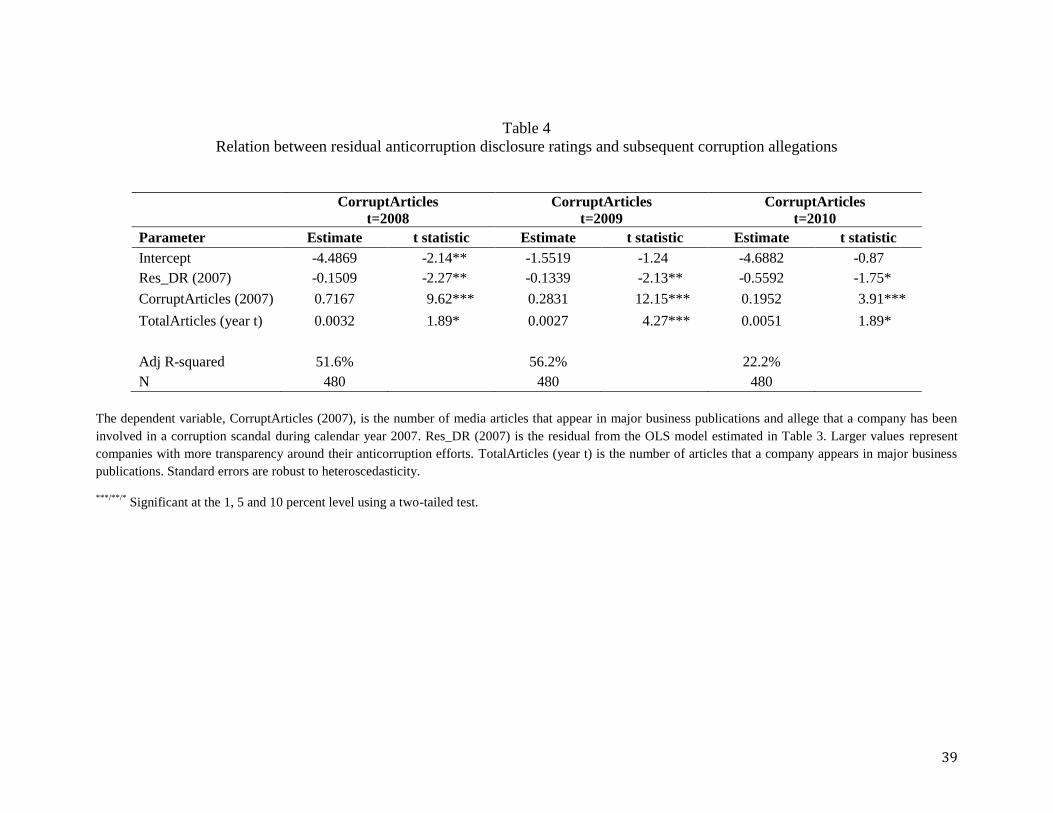
Table 4 shows coefficient estimates for the relation between the residual of anticorruption
efforts and subsequent allegations in the media about corruption. The table presents the
results for three different years, 2008, 2009 and 2010. Across all three models, the
coefficients on residual (abnormal) disclosure ratings are negative and significant
indicating that firms with abnormally high anticorruption disclosure ratings have fewer
subsequent allegations of corruption. The 2008 coefficient on RES_DRD indicates that a
one standard deviation increase in abnormal anticorruption disclosure decreases the
number of corruption articles by 1.5, a decrease of 15%. The respective economic effect
for 2009 is -18%, and for 2010 is -46%, although this last effect is less statistically
reliable.
The coefficients on the control variables have the expected signs. Firms with
more media attention have more corruption allegations, and firms with past corruption
allegations tend to have more future allegations. These results are consistent with the
results of the previous section in that they suggest that anticorruption disclosures are not
merely cheap talk but on average reflect genuine efforts by corporations to combat
corruption.
4.3. Sales Growth and Disclosure Ratings
Results of tests of the relation between disclosure ratings and three-year ahead sales
growth are presented in table 5. Because of missing segment reporting the sample
decreases to 350 firms. The table reports average segment sales growth rates from 2007
to 2010 (after the ratings were constructed) for firms with residual disclosure ratings
(estimated using the model discussed above) that are above or below the median, and in

25
geographic segments with high and low corruption risk. Table 5a reports results when
segment risks are classified relative to the sample median, maximizing the spread
between segment risk categories. Table 5b reports results using a benchmark that rates
geographic segment risks as high or low for each firm, based on its median segment risk.
This ensures that firm observations are equally represented across each country/regional
category and that the influence of other firm characteristics is mitigated. This approach is
equivalent to holding the firm constant and identifying changes in sales growth across
segments with different corruption levels.
The findings are similar using both approaches. In low-risk segments, the sample
firms with abnormally low and high disclosure ratings have comparable future sales
growth rates (-2.3% and -2.9% in panel A, and -2.1% and -3.5% in panel B). Thus, in low
risk segments, firms’ reporting of anticorruption efforts appears to have little impact on
their subsequent sales growth. As an aside, the weak sales growth rates for the sample
firms during sample period (2007-2010) likely reflect the economic downturn that
affected developed economies during these years.
In contrast, the future segment sales growth rates for firms with abnormally high
and low disclosure ratings diverge sharply in high-risk countries/regions. Panel A shows
that firms with abnormally high ratings show sales growth of only 0.8%, compared to
16% for those with low ratings. A differences-in-differences test, comparing this
difference to that for low-risk segments, is statistically and economically significant.
This result is confirmed in panel B, where future sales growth is -2.1% for firms with
abnormally high disclosure ratings versus 11% for firms with abnormally low ratings.
Recall that this test assigns segments to high/low-risk categories based on each firm’s

26
regions of operation. It therefore controls for any self-selection that occurs in firms’
decisions of where to operate.
Panel C repeats the analysis using a regression framework that allows us to
control for past sales growth. Prior research indicates that sales growth exhibits mean
reversion over time (see Palepu and Healy, 2008), consistent with the existence of
competitive forces and entrepreneurial activity. The significant negative estimate for
lagged sales growth confirms that sales growth mean reverts over time. However,
importantly, the results of interest to this paper remain unchanged. In high-risk regions,
firms with low disclosure ratings grow faster. In the first column that mirrors the
methodology in Panel A, the growth premium is 17.4%. In the second column that
mirrors the methodology in Panel B and controls for firm fixed effects, the growth
premium is 16%.
It is worth noting that, since these findings use residual, rather than total
disclosure ratings, they cannot be attributable to differences in country or industry risk
exposures, or to differences in enforcement or monitoring effects across the sample firms.
Also, the persistence of the sales growth differences when segments are classified as
high/low risk using within firm comparisons implies that the findings are not attributable
to particularly high and low disclosure firms electing to operate in countries with
different exposure to corruption.
We interpret the findings as indicating that firms that report higher than expected
anticorruption efforts enforce these standards in high-risk countries and pay a price in the
form of lower sales growth rates than peers with unexpectedly low disclosure.

27
4.4. Profitability, Sales Growth and Disclosure Ratings
Table 6 reports estimates of the relation between performance and abnormal disclosure.
We are able to collect data on changes in profitability margins and sales growth in high
and low corruption countries for 250 firms. The net margin on incremental sales is
positively related to sales growth in low-risk countries and negatively related to growth in
high-risk countries. The magnitudes of the estimated coefficients are economically
interesting. The estimates suggest that an increase in sales by 10%, in low risk countries
increases ROS by 13 basis points. In contrast, a 10% increase in sales in high risk
countries, decreases ROS by almost 14 basis points. Increasing the scale of the operations
generates a profitability premium in low risk countries, but damages profitability margins
in high risk countries. The results are similar when the dependent variable is the change
in ROE. A 10% increase in sales increases ROE by 17 basis points in low risk countries,
but decreases ROE by 7 basis points in high risk countries.
However, the financial implications of corruption differ when we interact high-
risk country sales growth with a dummy variable for firms with high abnormal
anticorruption disclosures. In this model, the estimate for sales growth in high corruption
countries, which isolates the effect for firms with abnormally low anticorruption
disclosures, continues to be negative and significant. The estimates imply that for these
firms, a 10% increase in sales in high corruption countries is accompanied by declines in
ROS and ROE of around 20 to 21 basis points.
But the interaction effect for firms with high residual anticorruption efforts and
sales growth in corrupt countries is positive and significant. The sum of the two
estimates, which represents the overall sales effects for the high disclosure firms, is

28
insignificant. Firms with high anticorruption efforts that grew sales in high-risk markets,
therefore, did so without damaging their profitability. For countries where corruption is
low, sales growth has a similar impact on net profit margins or ROE for both high and
low disclosure firms.
The findings, therefore, suggest that low disclosure firms grow businesses in
high-risk countries at the cost of reducing their profitability margins. One potential
explanation for this pursuit of less profitable growth is that these firms perceive that high-
risk markets are those with the highest growth, and that the pursuit of growth will
eventually pay off. Pursuing growth in these markets is therefore viewed as an
investment that permits the firm to build market share and hopefully recover its
profitability in the market when it matures.
It is also noteworthy that the difference in profit margins associated with sales
growth in high risk markets for firms with positive and negative residual disclosures is
roughly 118 basis points. This difference is within range of the average bribe paid by
Siemens on corrupt transactions of three percent of the contract amount, suggesting that
bribes are likely to be an important factor underlying the lower profitability of low
disclosure firms.
5. Conclusion
Our findings indicate that 2007 public disclosures of companies’ anticorruption policies
are not merely cheap talk. Firm disclosures are predictably related to enforcement and
monitoring costs, such as home country enforcement, U.S. listing, big four auditors, and
prior enforcement actions. They also reflect industry and country corruption risks. In
29
addition, firms with abnormally high anticorruption ratings have a lower frequency of
subsequent allegations of corruption in the media, suggesting that disclosures reflect their
commitment to fighting corruption.
The financial implications of fighting disclosure are more nuanced. Over the
following three years, firms with abnormally low disclosure have roughly 15% higher
sales growth in corrupt country markets than their high disclosure peers. But this higher
growth is accompanied by lower profit margins and ROEs. For firms with abnormally
low disclosure ratings, we find a negative relation between changes in ROS and ROE and
sales growth in high risk countries. No such decline occurs for high disclosure firms, or
for either disclosure type in markets where corruption is low.
The evidence therefore suggests that firms with high disclosure on their
anticorruption efforts are committed to fighting corruption. The policies and enforcement
actions reflected in their disclosures help to protect their public reputation and
profitability, but at the cost of slower sales growth in high corruption risk markets.
There are a number of caveats worth discussing that apply to our results. First, the
sample used in this study includes primarily large multinational firms. Therefore, our
results might not transfer to a sample of small local firms. Future work could examine the
generalizability of our results. Second, we test the effect on sales growth and profitability
over the next three years. The effect of anticorruption efforts on sales growth and
profitability could be different for longer time horizons. Again, this is an interesting
avenue for future research.
Not surprisingly, given the formative stage of firm-level research on corruption,
our findings raise many more questions for future study than we are able to answer. For

30
example, what factors, other than monitoring/enforcement costs and risk exposures,
explain the differences in firms’ level of disclosure and commitment to fight corruption?
Does the level of competition from local firms influence multinational firms’ disclosures
and corruption policies in their countries? Does the pursuit of growth (at the cost of
profitability) ultimately pay off for aggressive low disclosure firms? What are the most
effective methods of combatting corruption at the firm level? What role do individual
leaders play in setting company policies and disclosures on anticorruption efforts?

31
References
Ades, A. and R. Di Tella (1995), ‘Competition and corruption’, draft paper, Keble
College, Oxford University.
Ades, A. and R. Di Tella (1997), ‘National champions and corruption: some unpleasant
interventionist arithmetic’, Economic Journal, 107, 1023–42.
Ades, A. and R. Di Tella (1999), ‘Rents, competition, and corruption’, American
Economic Review, 89, 982–94.
Adsera, A., C. Boix and M. Payne (2000), ‘Are you being served? Political accountability
and quality of government’, Inter-American Development Bank Research Department
Working Paper 438, Washington, DC.
Anderson, C.J. and Y.V. Tverdova (2003), ‘Corruption, political allegiances, and
attitudes toward government in contemporary democracies’, American Journal of
Political Sciences, 47(1), 91–109.
Anoruo, E. and H. Braha (2005), ‘Corruption and economic growth: the African
experience’, Journal of Sustainable Development in Africa, 7(1), 43–55.
Bens, Daniel and Steven Monahan (2004), “Disclosure Quality and the Excess Value of
Diversification,” Journal of Accounting Research, (42 (4), 691-730.
Broadman, H.G. and F. Recanatini (1999), ‘Seeds of corruption: do market institutions
matter?’, World Bank Policy Research Working Paper 2368, Washington, DC.
Brunetti, A., G. Kisunko and B. Weder (1998), ‘Credibility of rules and economic
growth: evidence from a worldwide private sector survey’, World Bank Economic
Review, 12(3), 353–84.
Brunetti, A. and B. Weder (1998), ‘Investment and institutional uncertainty: a
comparative study of different uncertainty measures’, Weltwirtschaftliches Archiv, 134,
513–33.
Campos, J.E., D. Lien and S. Pradhan (1999), ‘The impact of corruption on investment:
predictability matters’, World Development, 27(6), 1059–67.
De Rosa, D., N. Gooroochurn, and H. Gorg (2010): “Corruption and productivity : firm-
level evidence from the BEEPS survey,” Policy Research Working Paper Series 5348,
The World Bank. 2, 3
Djankov, S., R. La Porta, F. Lopez-de-Silanes and A. Shleifer (2002), ‘The regulation of
entry’, Quarterly Journal of Economics, 117(1), 1–37.

32
Elliott, K.A. (1997), ‘Corruption as an international policy problem: overview and
recommendations’, in K.A. Elliott (ed.), Corruption and the Global Economy,
Washington, DC: Institute for International Economics, pp. 175–233.
Eng, L. and Y. Mak (2003), ‘Corporate governance and voluntary disclosure’, Journal of
Accounting and Public Policy, 22 (4), 325-345.
Gerring, J. and S. Thacker (2005), ‘Do neoliberal policies deter political corruption?’,
International Organization, 59, 233–54.
Goldsmith, A.A. (1999), ‘Slapping the grasping hand: correlates of political corruption in
emerging markets’, American Journal of Economics and Sociology, 58(4), 866–83.
Graeff, P. and G. Mehlkop (2003), ‘The impact of economic freedom on corruption:
different patterns for rich and poor countries’, European Journal of Political Economy,
19(3), 605–20.
Gupta, S., H. Davoodi and R. Alonso-Terme (2002), ‘Does corruption affect income
inequality and poverty?’, Economics of Governance, 3, 23–45.
Gymiah-Brempong, K. (2002), ‘Corruption, economic growth, and income inequality in
Africa’, Economics of Governance, 3, 183–209.
Hall, R. and C. Jones (1999), ‘Why do some countries produce so much more output per
worker than others?’, Quarterly Journal of Economics, 114, 83–116.
Kaufmann,D., A. Kraay and P. Zoido-Lobatón (1999a), ‘Aggregating governance
indicators’, World Bank Policy Research Working Paper no. 2195, World Bank,
Washington, DC.
Khwaja, A. and A. Mian (2005) ‘Do lenders favor politically connected firms? Rent
provision in an emerging financial market, Quarterly Journal of Economics, 120 (4),
1371-1411.
Kwok, C. and S. Tadesse (2006), “The MNC as an agent of change for host country
institutions: FDI and corruption” Journal of International Business Studies 37 (6), 767-
785.
La Porta, R., F. Lopez-De-Silanes, A. Shleifer and R.W. Vishny (1997), ‘Trust in large
organisations’, American Economic Review, Papers and Proceedings, 137(2), 333–8.
La Porta, R., F. Lopez-De-Silanes, A. Shleifer and R.W. Vishny (1999), ‘The quality of
government’, Journal of Law, Economics and Organization, 15(1), 222–79.
Lambsdorff, J., (2003). How corruption affects productivity. Kyklos (56), 457–474

33
Lambsdorff, J. and P. Cornelius (2000), ‘Corruption, Foreign Investment and Growth’,
The Africa Competitiveness Report 2000/2001, ed. by K. Schwab, J.D. Sachs et al., joint
publication of the World Economic Forum and the Institute for International
Development, Harvard University. Oxford University Press, 70-78.
Lang, M. and R. Lundholm. (1993). ‘Cross-Sectional Determinants of Analysts Ratings
of Corporate Disclosures.’ Journal of Accounting Research, 31. Autumn: 246-271.
Lang, M. and R. Lundholm. (1996). ‘Corporate Disclosure Policy and Analyst Behavior.’
The Accounting Review, 71. October: 467-492.
Leite, C. and J. Weidemann (1999), ‘Does Mother Nature corrupt? Natural resources,
corruption, and economic growth’, International Monetary Fund Working Paper, 99/85,
July.
Lipset, S.M. and G.S. Lenz (2000), ‘Corruption, culture, and markets’, in L.E. Harrison
and S.P. Huntington (eds), Culture Matters: How Values Shape Human Progress, New
York: Basic Books, pp. 112–24.
Lyon, J. and M. Maher (2005), ‘The importance of business risk in setting audit fees:
Evidence from cases of client misconduct,’ Journal of Accounting Research, 43 (1), 131-
151.
Mauro, P. (1995), ‘Corruption and growth’, Quarterly Journal of Economics, 110(3),
681–712.
Mauro, P. (1997), ‘The effects of corruption on growth, investment, and government
expenditure: a cross-country analysis’, in K. Elliott (ed.), Corruption and the Global
Economy, Washington, DC: Institute for International Economics, pp. 83–107.
Méon, P.-G. and K. Sekkat (2005), ‘Does corruption grease or sand the wheels of
growth?’, Public Choice, 122, 69–97.
Mo, P.H. (2001), ‘Corruption and economic growth’, Journal of Comparative Economics,
29, 66–79.
Montinola, G. and R.W. Jackman (2002), ‘Sources of corruption: a cross-country study’,
British Journal of Political Science, 32, 147–70.
Pellegrini, L. and R. Gerlagh (2004), ‘Corruption’s effect on growth and its transmission
channels’, Kyklos, 57(3), 429–56.
Persson, T., G. Tabellini and F. Trebbi (2003), ‘Electoral rules and corruption’, Journal of
the European Economic Association, 1(4), 958–89.

34
Rock, M.T. and H. Bonnett (2004), ‘The comparative politics of corruption: accounting
for the East Asian paradox in empirical studies of corruption growth and investment’,
World Development, 32(6), 999–1017.
Sandholtz, W. and M. Gray (2003), ‘International integration and national corruption’,
International Organization, 57(4), 761–800.
Sandholtz,W. and W.Koetzle (2000), ‘Accounting for corruption: economic structure,
democracy, and trade’, Industrial Studies Quarterly, 44, 31–50.
Spencer, J. and C. Gomez. (2011). ‘MNEs' corruption: the impact of national institutions
and subsidiary strategy.’ Strategic Management Journal 32(3): 254–279.
Sung, H.-E. and D. Chu (2003), ‘Does participation in the global economy reduce
political corruption? An empirical inquiry’, International Journal of Comparative
Criminology, 3(2), 94–118.
Svensson J. (2003), ‘Who must pay bribes and how much? Evidence from a cross-section
of firms,’ The Quarterly Journal of Economics, 118 (1), 207-230.
Svensson, J. (2005), ‘Eight questions about corruption’, Journal of Economic
Perspectives, 19(3), 19–42.
Swamy, A., S. Knack, Y. Lee and O. Azfar (2001), ‘Gender and corruption’, Journal of
Development Economics, 64, 25–55.
Tanzi, V. and H. Davoodi (2001), ‘Corruption, growth, and public finances’, in A.K. Jain
(ed.), Political Economy of Corruption, London: Routledge, pp. 89–110.
Transparency International (2009), Transparency in Reporting on Anticorruption: A
Report on Corporate Practices, (Transparency International, Berlin, Germany).
Treisman, D. (2000), ‘The causes of corruption: a cross-national study’, Journal of Public
Economics, 76, 399–457.
Uslaner, E. (2004), ‘Trust and corruption’, in J. Graf Lambsdorff,M. Schramm and M.
Taube (eds), The New Institutional Economics of Corruption: Norms, Trust, and
Reciprocity, London: Routledge, pp. 76–92.
Wyatt,G. (2002), ‘Corruption, productivity and transition’, CERT Discussion Papers no.
205, Centre for Economic Reform and Transformation, Heriot Watt University.
You, J.-S. and S. Khagram (2005), ‘Inequality and corruption’, American Sociological
Review, 70(1), 136–57.

35
Table 1a
Distribution of Transparency International sample by country
Country
Top 250
companies
High risk
sectors
High export
countries
Omitted
Total
Australia 6 0 0 1 5
Austria 0 2 0 0 2
Belgium 3 0 7 0 10
Bermuda 1 0 0 1 0
Brazil 4 2 0 0 6
Canada 8 9 4 1 20
China 7 2 21 2 28
Denmark 2 0 0 0 2
Finland 1 3 0 0 4
France 19 7 4 1 29
Germany 15 2 23 1 39
Hong Kong 2 2 6 0 10
India 1 3 1 1 4
Ireland 2 1 0 0 2
Italy 7 1 12 1 19
Japan 22 12 7 2 39
Malaysia 0 0 8 0 8
Mexico 2 1 7 1 9
Netherlands 10 1 9 1 19
Norway 3 1 0 0 3
Russia 5 5 0 1 9
Saudi Arabia 1 0 2 1 2
Singapore 0 2 7 0 9
South Africa 0 0 5 0 5
South Korea 5 2 3 2 8
Spain 6 5 0 1 10
Sweden 4 4 2 1 9
Switzerland 8 2 0 1 9
Taiwan 0 1 9 0 10
Thailand 0 1 0 0 1
United Kingdom 21 3 6 0 30
United States 87 33 0 0 120
Total 250 107 143 20 480

36
Table 1b
Distribution of Transparency International sample by sector
Sector
Top 250
High risk
sectors
High
export
countries
Omitted
Total
Aerospace & defense 5 14 0 0 19
Banking 51 0 0 2 49
Business services & supplies 1 0 2 0 3
Capital goods 2 18 2 0 22
Chemicals 5 0 10 0 20
Conglomerates 10 0 10 0 20
Construction 5 15 4 0 24
Consumer durables 10 0 1 1 18
Diversified financials 16 0 1 1 16
Drugs & biotechnology 12 0 4 1 15
Food, drink & tobacco 7 0 13 1 19
Food markets 2 0 6 1 7
Healthcare equipment & services 4 0 2 0 6
Hotels, restaurants & leisure 1 0 2 0 3
Household & personal products 2 0 6 1 7
Insurance 24 0 0 0 24
Basic materials 10 30 7 1 46
Media 5 0 4 1 8
Oil & gas operations 23 17 8 2 46
Retailing 6 0 3 1 8
Semiconductors 2 0 5 0 7
Software & services 3 0 1 0 4
Technology hardware & equipment 9 0 6 1 14
Telecommunications services 13 7 10 1 29
Trading companies 3 0 3 0 6
Transportation 5 0 3 0 6
Utilities 14 6 15 5 30
Total 250 107 143 20 480

37
Table 2
Summary statistics
Variable
Mean
St. Dev.
Q3
Median
Q1
Disclosure of anticorruption efforts 16.90 12.00 26.00 19.00 3.75
ROE 27.7% 19.1% 34.6% 25.3% 17.6%
Size 17.51 1.57 18.40 17.24 16.49
Percent foreign sales 35.8% 31.0% 59.7% 31.8% 4.2%
No. of segments 1.35 0.60 1.79 1.39 1.10
Percent closely held shares 23.4% 25.0% 36.3% 11.8% 2.2%
Big 4 auditor 0.89 0.31 1.00 1.00 1.00
U.S. Listing 0.34 0.47 1.00 0.00 0.00
Corruption enforcement 0.02 0.15 0.00 0.00 0.00
High risk industry 0.45 0.50 1.00 0.00 0.00
Home country corruption rating 1.41 0.80 1.85 1.77 1.21
Home country corruption enforcement 1.84 2.39 3.97 0.45 0.00
Average host segment corruption rating 1.25 0.70 1.77 1.37 0.77
Disclosure of anticorruption efforts is an index of the public disclosures provided by a firm about its
anticorruption efforts. The specific measures comprising the index are presented in the Appendix. ROE is
net income over beginning period shareholder’s equity for fiscal year 2006. Size is the natural logarithm of
total assets at the end of fiscal year 2006. Percent of foreign sales is sales outside the home country deflated
by total sales for fiscal year 2006. No. of segments is the number of two-digit SIC sectors in which the firm
operates for fiscal 2006. Percent of closely held shares is the percentage of shares that are held by investors
that own at least 5% of the shares at the end of fiscal year 2006. Big 4 auditor is an indicator variable for
firms audited by a Big 4 accounting firm at the end of fiscal year 2006. U.S. listing is an indicator variable
that takes the value one for firms listed as ADRs in the US at the end of fiscal year 2006. Corruption
enforcement is an indicator variable that takes the value one if a firm has been prosecuted for a corruption
scandal in 2005 or 2006. High risk industry is an indicator variable that takes the value one if a company is
operating in one of the following industries during fiscal 2006: aerospace and defense, oil and gas, basic
materials, capital goods, construction, telecommunications, and utilities. Home country corruption rating is
the World Bank’s 2006 rating of a firm’s home country corruption. Home country corruption enforcement
is the number of prosecutions in the home country in 2006 and 2005, deflated by the economic importance
of the country measured by its share of world exports in 2006. Average host segment rating is the weighted
average of corruption ratings for a firm’s non-home geographic segments, where the weights are the
segments’ shares of total company sales. Segment corruption ratings are computed by taking the weighted
average World Bank 2006 rating for each country that makes up a segment, where the weights are the
countries’ shares of segment GDP.

38
Table 3
Determinants of disclosure of anticorruption efforts
Variable
Estimate
t statistic
Intercept 0.0000 0.00
ROE 0.0428 0.96
Size 0.0630 1.48
Percent foreign sales 0.1793 4.22***
No. of segments 0.0527 1.49
Percent closely held shares -0.1047 -2.47**
Big 4 auditor 0.1315 3.74***
U.S. listing 0.1337 3.05**
Corruption enforcement 0.0879 3.39***
High risk industry 0.1133 2.81**
Home country corruption 0.2611 5.10***
Home country corruption enforcement 0.3572 8.48***
Host country corruption -0.0986 -2.13**
Adjusted R-squared 41.6%
N 480
This table presents estimates from an OLS model where the dependent variable is ratings of firms’
disclosures of anticorruption efforts. All independent variables are defined in Table 2 and are standardized
to have a mean of zero and a standard deviation of one. Standard errors are robust to heteroscedasticity. ***/**/*
Significant at the 1, 5 and 10 percent level using a two-tailed test.
39
Table 4
Relation between residual anticorruption disclosure ratings and subsequent corruption allegations
CorruptArticles
t=2008
CorruptArticles
t=2009
CorruptArticles
t=2010
Parameter Estimate t statistic Estimate t statistic Estimate t statistic
Intercept -4.4869 -2.14** -1.5519 -1.24 -4.6882 -0.87
Res_DR (2007) -0.1509 -2.27** -0.1339 -2.13** -0.5592 -1.75*
CorruptArticles (2007) 0.7167 9.62*** 0.2831 12.15*** 0.1952 3.91***
TotalArticles (year t) 0.0032 1.89* 0.0027 4.27*** 0.0051 1.89*
Adj R-squared 51.6%
56.2%
22.2%
N 480 480 480
The dependent variable, CorruptArticles (2007), is the number of media articles that appear in major business publications and allege that a company has been
involved in a corruption scandal during calendar year 2007. Res_DR (2007) is the residual from the OLS model estimated in Table 3. Larger values represent
companies with more transparency around their anticorruption efforts. TotalArticles (year t) is the number of articles that a company appears in major business
publications. Standard errors are robust to heteroscedasticity.
***/**/* Significant at the 1, 5 and 10 percent level using a two-tailed test.

40
Table 5
Relation between future sales growth rates (2007-2010) for sample firm geographical
segments, ratings of segment corruption, and firm residual anticorruption disclosure ratings
Panel A: Average geographic segment sales growth from 2007 to 2010. Firms’ geographic
segments are classified as having high/low corruption risk if their corruption score is
above/below the median for all sample firm segments.
Residual anticorruption disclosure
Low High
Low -2.3% -2.9%
Geographic segment
corruption
High 16.0% 0.8%
Differences-in-
differences
Estimate
14.7%
p-value
0.015
N=1,185 geographic segments for 350 firms operating in 47 geographic regions
Panel B: Average geographic segment sales growth from 2007 to 2010. Firms’ geographic
segments are classified as having high/low corruption risk if their corruption score is
above/below the median for the firm’s own segments.
Residual anticorruption disclosure
Low High
Low -2.1% -3.5%
Geographic segment
corruption
High 11.0% -2.1%
Differences-in-
differences
Estimate
11.7%
p-value
0.014
N=1,137 geographic segments for 303 firms operating in 46 geographic segments

41
Panel C: Regression analysis controlling for lagged geographic segment sales growth.
Model 1 Model 2
Variable
Estimate t statistic Estimate
t statistic
Intercept 0.2538 4.22***
-0.2453 -4.37***
-0.2583 -4.59
*** -0.1677 -2.87
**
-0.1739 -1.85* - -
0.1742 2.84**
0.1605 2.30**
-0.2430 -3.53***
-0.2677 -3.04***
Firm fixed effects No
Yes
Adj R-squared 4.75%
29.21%
N 1,074 1,029
The dependent variable is sales growth ( between 2007 and 2010 for the sample firms’ geographic
segments. is a dummy variable that takes the value one if the geographic segment’s corruption rating
is low, and otherwise is zero. is a dummy variable that takes the value one if the firm has a residual
disclosure rating above the sample firm median, and is otherwise zero. is sales growth between 2004
and 2007 for the sample firm’s geographic segments. Standard errors are robust to heteroscedasticity and
clustered at the firm level. In Model 1 firms’ geographic segments are classified as having high/low corruption
risk if their corruption score is above/below the median for all sample firm segments. In Model 2 geographic
segments are classified as having high/low corruption risk if their corruption score is above/below the median
for the firm’s own segments. ***/**/*
Significant at the 1, 5 and 10 percent level using a two-tailed test.

42
Table 6
Relation between changes in profitability and sales growth for firms with high/low residual anticorruption disclosure ratings
ΔROS ΔROE
Variable Estimate t Stat Estimate t Stat Estimate t Stat Estimate t Stat
Intercept 0.0428 0.03 0.2381 0.15 -1.6735 -1.23 -1.2202 -0.73
-0.4055 -0.42 -0.9360 -0.54
1.2995 3.01
** 1.2103 1.58 1.6888 2.31** 1.3373 1.10
-1.3674 -3.61
*** -1.9556 -3.45
*** -0.7022 -1.22 -2.1027 -2.69
**
*
0.1487 0.16 0.5706 0.38
*
1.1840 1.75* 2.8420 2.39**
Industry effects Yes Yes Yes Yes
Adj R-squared 11.8% 11.9% 6.6% 7.1%
N 250 250 250 250
Dependent variable is the change in return on sales (Return on Sales) or return on equity (ROE) between 2007 and 2010. is a dummy variable that takes
the value one for firms that have residual anticorruption disclosure ratings (estimated using the model in Table 3) higher than the median sample firm, and
otherwise zero. and
are the sales growth rates for geographic segments with low/high corruption ratings respectively. ***/**/*
Significant at the 1, 5 and
10 percent level using a two-tailed test.

43
Appendix
Factors used by TI to rate companies’ disclosures on their anticorruption efforts
STRATEGY (maximum 10 points)
An overall code of conduct or statement of principles including a reference to
antibribery (2)
Membership of key stakeholder initiatives with an anticorruption component (Global
Compact, PACI, various sectoral initiatives, etc.) (3)
A specific corporate antibribery or anticorruption policy (2)
The extent of the application of this policy to employees, partners and others (3)
POLICY (maximum 15 points)
Antibribery policy commitment (5)
Prohibition of facilitation payments (3.5)
Regulation of inappropriate giving and receiving of gifts by employees (2.5)
Regulating and making transparent political contributions (2)
Commitment to making lobbying activities transparent (2)
MANAGEMENT SYSTEMS (maximum 25 points)
Requirement for business partners compliance with the company’s anticorruption
approach, including due diligence and training of partners, as appropriate (5)
Training to employees and agents and clear communication of company policies,
including in indigenous languages, as appropriate (5)
Existence of a whistleblower policing and employee help/guidance system, including
non-victimization provisions (5)
Existence of review and verification systems to monitor corruption related issues and
breaches, and procedures to act against employees involved, including the external
verification/auditing of these systems (5)
Reporting of relevant Key Performance Indicators (KPIs), including the number and
nature of complaints, the number of disciplinary actions for corruption and bribery,
and the extent of bribery-related training (5)
Source: Transparency International, Transparency in Reporting on Anticorruption: A Report on Corporate
Practices, 2009