Embed Size (px)
Citation preview
DOI: 10.1161/CIRCGENETICS.112.963140
1
Causal Relevance of Blood Lipid Fractions in the Development of Carotid Atherosclerosis: Mendelian Randomisation Analysis
Running title: Shah et al.; Lipid causality in carotid atherosclerosis
Sonia Shah, MSc1*; Juan-Pablo Casas, PhD2*; Fotios Drenos, PhD3; John Whittaker, PhD4; John Deanfield, MD,PhD5; Daniel I. Swerdlow, PhD6; Michael V. Holmes, MBBS6; Mika
Kivimaki, PhD6; Claudia Langenberg, PhD7,8; Nick Wareham, MD,PhD8; Karl Gertow, PhD9; Bengt Sennblad, PhD9; Rona J. Strawbridge, PhD9; Damiano Baldassarre, PhD10,11; Fabrizio
Veglia, PhD11; Elena Tremoli, PhD10,11; Bruna Gigante, PhD12; Ulf de Faire, MD, PhD12; Meena Kumari, PhD6; Philippa J. Talmud, PhD3; Anders Hamsten, MD,PhD9;
Steve E. Humphries, PhD6; Aroon D. Hingorani, MD,PhD13 *
1University College London Genetics Institute, 3Centre for Cardiovascular Genetics, Institute for Cardiovascular Science, 5Institute of Cardiovascular Science, 6Genetic Epidemiology Group, Dept of Epidemiology & Public
Health, 7Dept of Epidemiology & Public Health, 13Centre for Clinical Pharmacology, Dept of Medicine, University College London; 2Dept of Non-Communicable Disease Epidemiology, London School of Hygiene and Tropical
Medicine, London; 4Genetics Division, Research & Development, GlaxoSmithKline, NFSP, Harlow; 8MRC Epidemiology Unit, Institute of Metabolic Science, Addenbrooke's Hospital, Cambridge, United Kingdom;
9Atherosclerosis Research Unit, Dept of Medicine, Solna, Karolinska Institutet, Karolinska University Hospital Solna, Stockholm, Sweden; 10Dipartimento di Scienze Farmacologiche e Biomolecolari, Università di Milano; 11Centro Cardiologico Monzino, IRCCS, Milan Italy; 12Division of Cardiovascular Epidemiology, Institute of
Environmental Medicine, Karolinska Institutet, Stockholm, Sweden*contributed equally
Corresponding author:
Aroon Hingorani, MD, PhD
Centre for Clinical Pharmacology
Department of Medicine
University College London
London, WC1E 6BT, UK
Tel: +44(0)20 31083080
Fax: +44(0)2078130242
E-mail: [email protected]
Journal Subject Codes: [112] Lipids; [135] Risk Factors; [89] Genetics of cardiovascular disease
msten, MD,PhD ; DDD,P,PPhDhDhD131313 *
cs, Inststtitititututute e e fofofor r r CaCaCardrdrdioioiovav sInstitute of Cardiovascular Science Genetic Epidemiology Group Dept of Epidemiology & Pu
p io oe Mo oe s
lC t
Institututeee ofofo CCCaraa diiovoo ascular Science, Genetic Epipp dedemiology Group, DeDepppt of Epidemiology & Pupt ofofof EEEppidemimiiooologgyyy & Public Health, 13Centre for Cllinical Pharmacaa ologgy, Dept of Medicine, Unionnndododonn; 2Dept ofofof NNNonoo -CoCoCommmmmmunununicicicababablelele DDDisiseaaasesese EEEpidedemiololo ogogogy,y,y, Lononondododon nn ScScSchohh olll ooof ff HyHyHygigigieneneneee ananandd d Troe, Looondon; 4Geneeticccs DDivvisiononon, Researchcch & DeDeevelloppmenent,t,t, GGGlaaxoooSmithKhKKlinnen ,, NFSSPSP, HHHarrrlowww; 8Mololoogygygy Unit, Insnn titututtte of MMMetaaabobobolic ScScieeencce, AAAdddennbbrooookekek 's HHospppittal, CCammmbbrb ididdge, UnUnUnitededd Kinnnggdoerosisisisss ReReReseseseararar hchch UUUnininit,tt DDDepepept offf MMMededediici inne,e,e SSSolololnanana, KaKaKarororoliiinsnsnskakaka IIInsnsnstiiitutututetetettt, KKKarararololinininskskska aa UUUnivivivererersisisitytyty HHHosoockholm, Sweden; 101010DiDiDipapapartrtimmmenene tooo dddi ScScScienznnze ee FaFaarmrmrmacaccololo ogo iccchehehe eee BBioioiomommolelelecococolaaaririri,,, Università di Mil
Cardiologico Monznznzininino,o,o, IIRCRCRCCSCSCS, MiMiMilalalan n n ItItItalalalyyy;;; 12122DDiDivivivisisisiononon of ff CaCaCardrdrdioioiovavaascscsculululararar EEEpipipidededemiology, InstitutEnEnEnvivirororonmnmnmenenentatatall MeMeMedidicicinenene,, KaKaKarororolilinsnsnskaka IIInsnsnstititutututetetett,t, SSStototockckhoholmlm,, SwSwSwededenenen
***cooontntntririribububuteteted dd eqeqequauauallyy
by guest on May 27, 2018
http://circgenetics.ahajournals.org/D
ownloaded from
by guest on M
ay 27, 2018http://circgenetics.ahajournals.org/
Dow
nloaded from
by guest on May 27, 2018
http://circgenetics.ahajournals.org/D
ownloaded from
by guest on M
ay 27, 2018http://circgenetics.ahajournals.org/
Dow
nloaded from
by guest on May 27, 2018
http://circgenetics.ahajournals.org/D
ownloaded from
by guest on M
ay 27, 2018http://circgenetics.ahajournals.org/
Dow
nloaded from
by guest on May 27, 2018
http://circgenetics.ahajournals.org/D
ownloaded from
by guest on M
ay 27, 2018http://circgenetics.ahajournals.org/
Dow
nloaded from
by guest on May 27, 2018
http://circgenetics.ahajournals.org/D
ownloaded from
by guest on M
ay 27, 2018http://circgenetics.ahajournals.org/
Dow
nloaded from
by guest on May 27, 2018
http://circgenetics.ahajournals.org/D
ownloaded from
DOI: 10.1161/CIRCGENETICS.112.963140
2
Abstract:
Background - Carotid intima–media thickness (CIMT), a subclinical measure of atherosclerosis,
is associated with risk of coronary heart disease (CHD) events. Statins reduce progression of
CIMT and CHD risk in proportion to the reduction in low-density lipoprotein cholesterol (LDL-
C). However, interventions targeting triglycerides or high density lipoprotein cholesterol (HDL-
C) have produced inconsistent effects on CIMT and CHD risk, making it uncertain whether such
agents are ineffective for CHD prevention or whether CIMT is an inadequate marker of HDL-C
or triglyceride-mediated effects. We aimed to determine the causal association between the three
major blood lipid fractions and common CIMT using Mendelian randomisation (MR) analysis.
Methods and Results - Gene scores specific for LDL-C, HDL-C and triglycerides were derived
based on single nucleotide polymorphisms (SNPs) from a gene-centric array in around 5000
individuals (Cardiochip scores) and from a genome-wide association meta-analysis in over
100,000 individuals (Global Lipids Genetic Consortium (GLGC) scores). These were used as
instruments in an MR analysis in two prospective cohort studies. A genetically-predicted 1
mmol/L higher LDL-C concentration was associated with a higher common CIMT by 0.03 mm
(95% CI=0.01–0.04) and 0.04 mm (95% CI=0.02–0.06) based on the Cardiochip and GLGC
scores, respectively. HDL-C and triglycerides were not causally associated with CIMT.
Conclusions – Our findings confirm a causal relationship between LDL-C and CIMT but not
with HDL-C and triglycerides. At present, the suitability of CIMT as a surrogate marker in trials
of cardiovascular therapies targeting HDL-C and triglycerides is questionable and requires
further study.
Key words: lipids; Mendelian randomization; carotid intima-media thickness
( ) y
rrrigigiglylylycececeririridededesss wewewerrre ddderrr
c array y y ininin aaarororoununund d d 50505 0
dividuals (Global Lipids Genetic Consortium (GLGC) scores). These were used
s
g
.01–0.04) and 0.04 mm (95% CI=0.02–0.06) based on the Cardiochip and GLG
pectively. HDL g y y
(CCararardididiococochihihippp scscscoroo es) and from a genome-e-e-wiww de association mmmeta-analysis in over
diiivivividuals (Glooobababal LLiLipipipidsdsds GGGennnete icicic CConnnssortiuum (G(G(GLGLGLGCCC) scoooreeres). ThThThesesse ee weweererere uuusesesed
s ininin aaan MR aaanaalyyysiss iin twowwo pprorospppeectivevve cohohorrrtt t sstudddiies. AAA genennetticicicalaa lyyy---pppredededicteeedd 1
gher LDL-C coooncncncene tratattioioion n waww s asaa sosociaaated dd wiw tht aaa hhigiggheer coccommmmmmono CCIMT by 0.03
.01–0.04) ) and 0.00 040404 mm (9(9(95%5%5% CCCIII=00.02002 0–00 0.06)6)6) baseddd on thhhe CaCC rdddiioi chipp and GLG
pecectititivevelylyly.. HDHDHDLLL-CC C ananddd trtrt igigiglylylyceceririridededess wewerere nnotott ccauausasallllllyy asassosociciciattatededed wwititithhh CICICIMTMTMT..
by guest on May 27, 2018
http://circgenetics.ahajournals.org/D
ownloaded from
DOI: 10.1161/CIRCGENETICS.112.963140
3
Introduction
Higher low-density lipoprotein-cholesterol (LDL-C) concentration is associated with a higher
risk of coronary heart disease (CHD), and the relationship is considered causal because
randomised trials using LDL-lowering interventions such as HMG-CoA reductase inhibitors
(statins) have shown to reduce CHD risk in proportion to the LDL-C reduction(1,2).
Interventions to elevate HDL-C or reduce triglycerides might also confer incremental protection
against CHD, but thus far randomised trials of drugs directed at these two lipid fractions have
been unable to confirm or refute such effects(3–7).
Conclusive demonstration of the benefit and safety of new lipid-modifying interventions
requires evaluation in large, expensive randomised trials with hard clinical end points in people
already receiving effective drugs for CHD prevention. Approaches that help validate treatment
targets ahead of such trials may help reduce the risk of late-stage failures in drug development.
One approach has been to use a non-invasive measure of atherosclerosis, carotid intima-media
thickness (CIMT), as a surrogate end-point. CIMT is considered to be a subclinical measure of
atherosclerosis, which is strongly associated with risk of CHD(8,9). LDL-C-lowering statin
drugs that are effective in reducing CHD also reduced progression of CIMT in proportion to the
degree of LDL-C-lowering(10–12). However, interventions developed so far that reduce
triglycerides or raise HDL-C have shown inconsistent effects on CIMT(13–15), making it
uncertain whether the specific agents are ineffective for CHD prevention, whether these two lipid
fractions in general are not causally related to CHD and therefore invalid targets, or whether
CIMT is an inadequate marker of HDL-C or triglyceride-mediated effects on CHD risk.
Mendelian randomisation provides a means of evaluating and quantifying the extent to
which associations between a putative risk factor (e.g. HDL-C or triglycerides) and an outcome,
d-modddififif iyiing iii tnterrrveveven
aluation in large, expensive randomised trials with hard clinical end points in pe
eiving effective drugs for CHD prevention. proaches that he validate treatm
a m
a e
CIMT) as a s rrogate end point CIMT is considered to be a s bclinical meas r
aluauauatititiononon iiinn n lall rgrgrgeee, expensive randomised dd trtrtriai ls with hard cliiininn cal end points in pe
eiivi iiing effectivvee druguggs fofoforr r CHHHDD D prppreveneentionon. ApApApprprproaoao chhhees thhah ttt heheelllp vaaalidiidaaateee treaeeatm
ad ofoff sssucucuchhh triaiai llsls mmayay hhhelpp rerereddduce ttthehehe rrriiisk kk fofof latatateee-stststaaage fffaiaiailulul reress inn dddrururug deded vevelolol pmpm
ach has been to use a non-invasiiive measure off f athehh rosclell rosiiis,,, carotid intima-me
CCCIMIMT)T) te dnd ioint CICIMTMT ii idid ded t bbe bb lcliiniic lal by guest on May 27, 2018
http://circgenetics.ahajournals.org/D
ownloaded from
DOI: 10.1161/CIRCGENETICS.112.963140
4
such as CHD or CIMT, are causal(16). Mendelian randomisation utilises genetic variants as
proxies for the risk factor of interest to overcome some common limitations of non-genetic
observational studies. The random allocation of parental alleles to offspring at meiosis results in
population distributions of genetic variants that are largely independent of environmental factors
that typically confound epidemiological associations between putative risk factors and disease,
whilst the unidirectional flow of biological information from gene through to risk factor and then
to disease outcome avoids reverse causation(17).
Using large-scale single-nucleotide polymorphism (SNP) arrays, many SNPs influencing
LDL-C, HDL-C and triglycerides have recently been identified(18,19), and these provide
potential instruments for Mendelian randomisation analyses. Independently inherited SNPs
contributing to the levels of these lipids act approximately additively, such that each individual
in a population can be assigned a “genetic score” based on the number of trait-raising alleles
carried. Genetic scores derived from a combination of variants should provide stronger and more
specific instruments for lipid traits compared to a single SNP, and increase the power to conduct
Mendelian randomisation analysis.
In this study we generated genetic scores for LDL-C, HDL-C and triglycerides based on
SNPs present on the gene-centric Illumina Cardiochip(20) that were found to be associated with
each of the three lipid fractions in the Whitehall II study(18). We used these genetic scores to
estimate the causal association between the three major blood lipid fractions and common CIMT
in around 3000 participants from the Whitehall II study(21) and around 3400 individuals from
the IMPROVE study(22) using an instrumental variable analysis. We compared the causal
estimates to those derived using genetic scores based on the Global Lipids Genetic Consortium
(GLGC) lipid-associated SNPs, which were independently identified by a meta-analysis in over
ys, many SNPs inffflululue
), and dd thththese provididideee
n s
g d
t e
n d
tr ments for lipid traits compared to a single SNP and increase the po er to con
nstruuumemementntntss fofof r MeMM ndelian randomisation nn anananalyses. Independndndeeently inherited SNPs
g tooo the levels ooof thhheeese lililippip ds aacttt aapprorroximamatelylyly aaadddddditiviively, sssuchchch that t t eeeachchch indddiiivid
tion cacacannn bebebe aassssigigigneneddd a a “g“g“geneneneeettic scccororore”e”e” bbbasas deded ooonnn thththeee nuuumbmbmberer oof traiaiait-tt raissinini gg alallllelelell
netic scores deriiiveddd ffrf om a combibibina itiion offf variants shohh lluldd d prpp ovididide stronggger and
t nt ffo lili ipidd tr iait ded t isi lle SSNPNP dd iin thhe t by guest on May 27, 2018
http://circgenetics.ahajournals.org/D
ownloaded from
DOI: 10.1161/CIRCGENETICS.112.963140
5
100,000 individuals(19).
Methods
Study participants
The Whitehall II study (WHII) recruited 10,308 participants (70% men) between 1985 and 1989
from 20 London-based Civil Service departments(21). The study was approved by the UCL
Research Ethics Committee, and participants gave informed consent to each aspect of the study.
Clinical measurements were taken at 5-year intervals. Clinical data were available from four
phases (phase 1:1985-1988, phase 3:1991-1993, phase 5:1997-1999 and phase 7:2003-2004).
Phase 3 (1991-1993) provided the first comprehensive phenotyping and is considered the
baseline phase.
The IMPROVE study(22) recruited a total of 3711 individuals (48% men) between
March 2004 and April 2005 from 7 centres in 5 European countries with a median age of 64.4
years. Eligibility criteria included age between 55 to 79 years, presence of at least three vascular
risk factors, and absence of symptoms of cardiovascular diseases and any conditions that might
limit longevity or visualization of the carotid intima. The study was designed in accordance with
the rules of Good Clinical Practice, and with the ethical principles established in the Declaration
of Helsinki. Informed consent was obtained from all participants. Baseline measures were
available for this analysis.
Lipid and carotid intima-media thickness measurements
In WHII, lipid measurements from phase 3 were used in this analysis since very few participants
were on lipid-modifying medication compared to follow-up phases, while ultrasound vascular
measurements were only available at phase 7 (2003–2004). Measurement of serum lipids and
nd phhhasasase e e 7:7:7:20202003030 -2-2-2000000444
991-1993) provided the first comprehensive phenotyping and is considered the
e
4 and April 2005 from 7 centres in 5 European countries with a median age of 6
ibility criteria g y , p s
991-199939393) )) prpp ovvvidii ed the first comprehensiveve phenotyping aandnnd is considered the
haaaseee.
e IMMMPRPRPROVOVOVE EE stststudududyyy(2(2(22)22 rererecrcrcruiuiuitetet d dd aaa tttotototalalal oooff f 373737111111 iiindndndivivividididuauaualllaaa sss (4(4(48%8%% mmmenenen) ) ) bebebetwtwtweeeeen n
4 and April 200005 55 frfrfromomom 777 ccenenentrtrtreseses iiin nn 555 EuEuEurororopepepeanaa cccououountntntririr esess wwwititith hh aaa mememedian age of 6
ibbbililitityy crcrititereriaiia iincncluludeddedd agagee bebbetwtweeeenn 55555 tttoo 797979 yyeaearsrs,,aa prpresesenencece oofff aatt t leleasastt ththrereee vavass
by guest on May 27, 2018
http://circgenetics.ahajournals.org/D
ownloaded from
DOI: 10.1161/CIRCGENETICS.112.963140
6
common CIMT in WHII and IMPROVE is described in detail in the Supplementary Methods
section.
Genotyping and quality control
For WHII participants DNA was extracted from whole blood samples as previously described
(18). 5592 samples were genotyped using the Illumina Human Cardiochip(20) and 3413 were
later genotyped using the Illumina Metabochip(23). After quality control (filtering for duplicates,
cryptic relatedness, ambiguous gender, self-reported non-Caucasians, outliers based on the
genome-wide identity-by-state analysis implemented in PLINK, sample call rate <80% and SNP
call rate <98%), 5059 Cardiochip genotyped samples and 3126 Metabochip genotyped samples
individuals were available for the analysis.
In the IMPROVE study, DNA was extracted as described by Baldassare et al(22). In total
3695 samples were genotyped using the Illumina Metabochip. After quality control (using call
rate <95% and removing individuals for relatedness (confirmed or cryptic), reported non-
European descent, outliers identified by multi-dimensional scaling, estimated inbreeding
(excessive homozygosity) and mismatch between recorded and genotype-determined sex ) 3430
individuals remained for this analysis.
Derivation of lipid genetic scores
Two lipid genetic scores were derived; one from a discovery-based analysis using the Illumina
Human Cardiochip in WHII(18) and one based on lipid-associated variants reported by the
GLGC(19).
Cardiochip score: SNPs previously found to be associated with baseline LDL-C, HDL-C or
triglycerides in WHII(18) were included in a stepwise variable selection scheme with the
Bayesian Information Criterion(24), implemented separately for each chromosome, to select the
ple call rate <80% ananand
ochip p genotttypepp d sasasamm
h n
l
a
descent o tliers identified b m lti dimensional scaling estimated inbreeding
wererereee avavavaiaiailalalabllleee for the analysis.
heee IIIMPROVE ssstudydydy, DNDNNAA A wawwas exxtracaactedd aas dddeesscrcrcribbbeddd by BaBaBaldddaaassareee eeet alll(22)2)2). In
les wererereee gggenoottytypepeped dd ususing gg thththee Illumimiminanana MMM tetetababbococochihihip.pp. AfAfAfteteter r ququala ity cococontroolll ((u(usisiingng
and removinggg indddivii idididuallls fffor relllat deddness (((confirmed dd or cryyyptptptiiic),)), reppported non-
d nt ltliie iiddentififiiedd bb ll iti didi iio ll laliin stiimat ded ii bnb dediin by guest on May 27, 2018
http://circgenetics.ahajournals.org/D
ownloaded from
DOI: 10.1161/CIRCGENETICS.112.963140
7
best genetic predictors for each lipid trait(18). For each lipid fraction, the risk allele counts
(LDL-C and triglyceride-raising alleles and HDL-C-reducing alleles) for the selected SNPs were
weighted using the risk-allele beta-coefficient obtained from a Ridge regression(25) in WHII,
using the Lawless and Wang estimate of the Ridge constant(26). The Ridge regression is a
variant of ordinary multiple linear regression that ‘shrinks’ the beta-coefficients of redundant
SNPs, thereby circumventing issues that may arise if highly-correlated SNPs are retained by the
variable selection model. In both the variable selection and ridge regression, sex and age were
added in the baseline model. The final genetic score for each participant was the sum of the
weighted risk allele count. APOE is a major determinant of LDL-C levels and the effect of the
APOE haplotype was included in the LDL score calculation. Of the two SNPs that determine the
major APOE isoforms (ApoE2, ApoE3 and ApoE4), only one (rs7412) is represented on the
genome-wide and gene-centric platforms used in WHII and GLGC. In both studies the two SNPs
(rs7412 and rs429358) had been separately genotyped, and haplotypes determined(22,27). We
used the previously reported effect of the APOE haplotypes on LDL-C, from a meta-analysis in
61,463 healthy participants, to generate a weighted APOE score. Based on the latter study, using
3/ 3 individuals as reference (28), the APOE haplotype was scored as follows: -0.9,
2 3=-0.4, 2 4=-0.2, 3/ 3=0, 3 4=0.1 and 4 4=0.2. The SNPs used in the Cardiochip score
are shown in Supplementary tables 1-3. The same weights were used to calculate lipid genetic
scores for individuals in the IMPROVE dataset.
GLGC score: A threshold of P-value<5×10 8 was used by the GLGC to denote association
between SNPs and lipid traits(19). For the purpose of the genetic score calculation only the lead
SNP from each locus was selected, and if a SNP was associated with more than one lipid fraction
it was only used in the genetic score calculation for the trait with which it had the most
nt was the sum offf ttthehh
vels a ddnd ttthehh effffffecttt oofof
l n
OE isoforms poE2, oE3 and oE , on one rs7412 is represented on th
o
d W
e io sl reported effect of the APOE haplot pes on LDL C from a meta anal s
lotyyypepepe wwwasas iiincclululuded in the LDL score caaalclclculu ation. Of the twowowo SNPs that determin
OEEE isos forms (AAApppoEE2E ,,, AppApooEo 3 aanddd AApoEooE4), oonlylyly ooonenen (rrrs7741222))) isss rrrepreeeseeenttteeded ooon th
de andndnd gggeeene-cece tntntririicc pplatfofoformrmrms usededed iin nn WHWHWHIIIIII aaandndnd GGGLGLGLGCCC. InInI bbboth hh stststudududieess thththe e ttwtwo
d rs429358) ) had dd bbeb en sepapp ratelyly gggenotypypyp dedd, ,, and hahh pllplotypypypes dddetermined((22,2, 7)). W
ii lsl rt ded ffff t fof thhe AAPOPOEE hha lplot LDLDLL CC ff ta lal by guest on May 27, 2018
http://circgenetics.ahajournals.org/D
ownloaded from
DOI: 10.1161/CIRCGENETICS.112.963140
8
significant association P-value. Risk allele counts were calculated in WHII and IMPROVE and
weighted using the reported univariate beta-coefficients. Since the discovery of these SNPs was
carried out in an independent dataset and only a single SNP was selected at each locus, the issues
of inflated instrument strength due to discovery bias, and linkage disequilibrium were minimised.
The SNPs used in the GLGC score are shown in Supplementary tables 1-3.
For both sets of scores, SNPs not present in the data (because they were not represented
on the genotyping platform or failed quality control) were excluded from the genetic score
calculations. Individuals with missing genotypes were also excluded from the analysis.
Strength and association of lipid levels with lipid genetic scores
We evaluated the association of lipid levels with their respective genetic scores using linear
regression, with no adjustment for covariates. The proportion of variance explained (R2) and the
F-statistic were reported as measures of the strength of each genetic score as an instrument(29).
To show the benefit of using a combined genetic score as an instrument over a single SNP, we
compared the R2 of the GLGC scores (since these are not affected by discovery bias) with those
from single SNP instruments, namely rs651821 (proxy for the APOA5 SNP rs662799, previously
reported to be associated with triglyceride levels and CHD(30)), rs17231506 (proxy for the
CETP Taq1B polymorphism) and the APOE haplotypes that create the ApoE2/E3/E4 isoforms .
Direct associations of blood lipid fractions with CIMT
Association of CIMT with lipid levels was determined using linear regression, with and without
adjustment for sex, age, smoking, diabetes status and statin use.
Instrumental variable analysis
To evaluate the causal association of each lipid fraction with CIMT, we carried out an
instrumental variable analysis using the two-stage least squares method (2SLS)(31), whereby
rom the analysis.
t r
n
w (
he R2 of the GLGC scores (since these are not affected b disco er bias) ith t
ted ttthehehe aaassssssococociaaatitition of lipid levels with thhheieie rr respective ggeneteteticii scores using linear
wwittth no adjusttmmmennt ffor cccovarrriiai tess. ThTThe prrooporortititiononon of ff vvarianannceee eeexplaaainnneddd (((R222) an
were rrrepepepoororted dd asas mmeaeasus ress ooofff the stststrrrengnn ththth oof ff eaaachchch gggeeeneeetititic scscorrore asss ananan insnsttrtrumumenent(
e benefit of usinggg a combibb ned dd gegg netiiic score as an iiinstrument over a singlg e SNP,,,
hehh RR22 fof hth GLGLGCGC (( isi hth t fafffect ded bb ddiis bbiia )) ii hth t by guest on May 27, 2018
http://circgenetics.ahajournals.org/D
ownloaded from
DOI: 10.1161/CIRCGENETICS.112.963140
9
each genetic score was used as an instrumental variable for the unconfounded and unbiased
effect of the respective lipid fraction on CIMT. No adjustment was made for covariates. A meta-
analysis of the effect estimates was also carried out using a fixed-effect model. We repeated the
2SLS analysis, using lipid levels that were corrected for statin use. For statin users, the recorded
lipid values were multiplied by a constant: LDL-C by 1.352; HDL-C by 0.949, and TG by 1.210.
The multiplicative correction factors were based on analysis of repeatedly measured lipid levels,
including levels measured before and after lipid-lowering treatment, in WHII. This methodology
has been used in the most recent large-scale lipid meta-analysis(32).
Results
Study characteristics
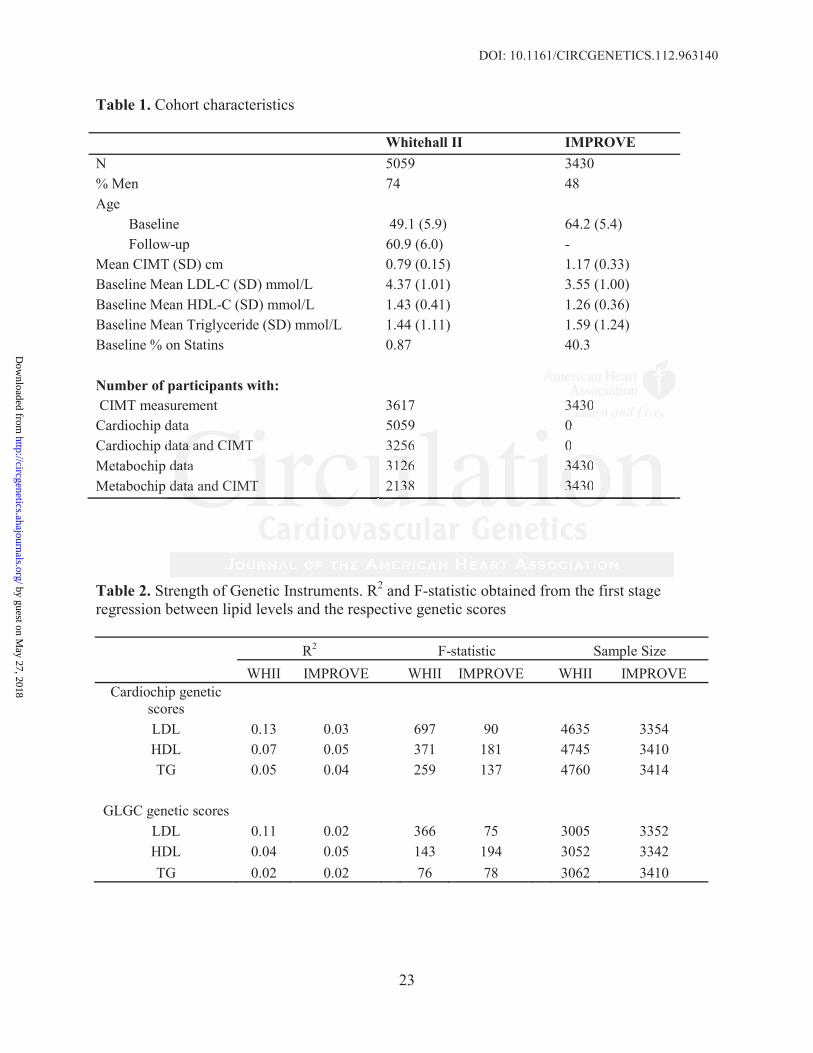
Population characteristics and sample sizes with both genotype and phenotype data are shown in
Table 1. The mean age of IMPROVE participants in this analysis was 64.2 years (SD=5.4),
similar to the mean age of WHII participants at the follow-up phase when CIMT measurements
were taken (60.9 years (SD=6.0)). Mean CIMT in IMPROVE and WHII was 1.17mm (±0.33)
and 0.79mm (±0.15), respectively. The lower mean LDL-C level in IMPROVE (3.55 mmol/L;
SD=1.00) compared to WHII (4.37 mmol/L; SD=1.01) may partly be explained by the larger
proportion of participants on statin medication (40% versus 0.9%, respectively).
Cardiochip lipid genetic scores
Seventeen (including the 2 APOE SNPs genotyped separately) were used for the LDL genetic
score, and 12 and 13 SNPs, respectively, for the HDL and triglyceride genetic scores
(Supplementary Tables 1-3). After applying quality control filters, all SNPs were available in
the WHII dataset. In the IMPROVE dataset 13 LDL (including 2 APOE SNPs), 11 HDL and 9
triglyceride SNPs were available for the score calculation.
r
h )
he mean age p p -up phase when CIMT measurem
raaacttteristics
chahaharararactctcterererisisisttticscscs ananandd d sasasampmpmplelel sssizizizesss wwwititithhh boboboththth gggenenenotototypypype ee ananand d d phphphenenenotototypypypee e dddatatata aaarerere shhoh
he mean age of ff IMIMIMPRPRPROVOVOVEE E papapartrtrticicicipipipananantststs ininin ttthihihiss annnalala ysysysisisi wwwasasas 646464.2.2.2 yeyy ars (SD=5.4)
hehhe mmeaeann agagee ofoff WWWHIHIHIII papartrticicipiipanantstts atatt tthehe fffololllolloww-uupp phphhasasee whwhhenen CCCIMIMIMTTT memeasasururemem
by guest on May 27, 2018
http://circgenetics.ahajournals.org/D
ownloaded from
DOI: 10.1161/CIRCGENETICS.112.963140
10
GLGC lipid genetic scores
Of the lead SNPs reported by the GLGC meta-analysis, 12 (including 2 APOE SNPs) were used
for the GLGC LDL score, and 29 and 16 SNPs, respectively, were used for the HDL and
triglyceride genetic scores (Supplementary Tables 1-3). In WHII, all LDL SNPs, 28 out of 29
HDL SNPs and all triglyceride SNPs were present. In IMPROVE, 10 (including 2 APOE SNPs)
out of 12 LDL SNPs, 28 out of 29 HDL SNPs, and all triglyceride SNPs were present in the
genotype data after quality control filters were applied.
Association of lipid levels with lipid genetic scores
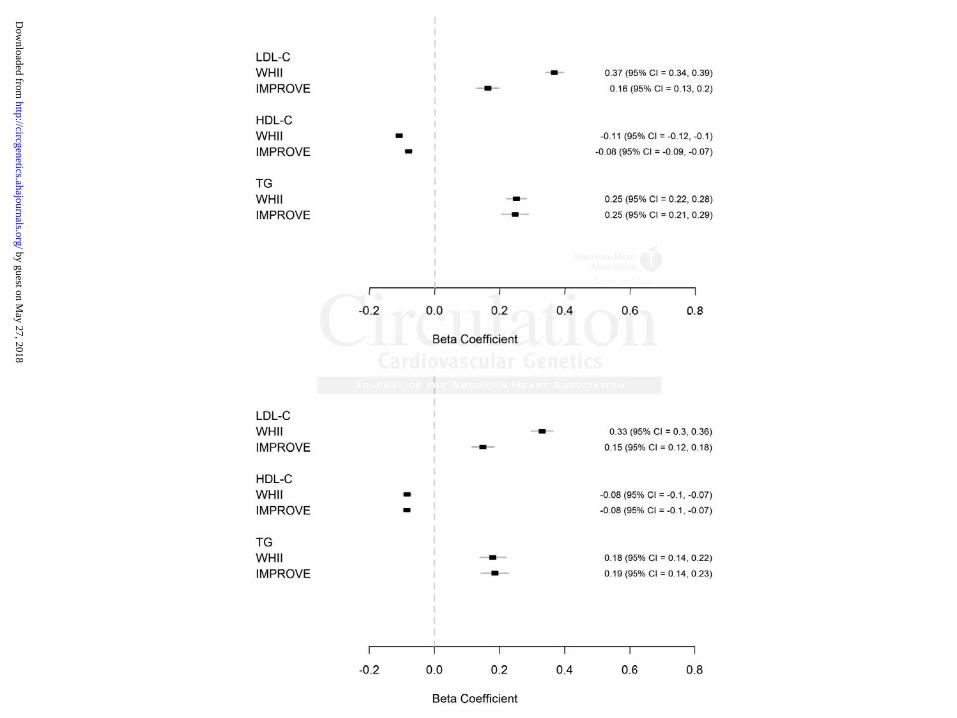
A 1SD higher Cardiochip LDL genetic score was associated with 0.37 (95% CI=0.34–0.39) and
0.16 mmol/L (95% CI=0.13–0.20) higher LDL-C in WHII and IMPROVE, respectively. A 1 SD
higher HDL genetic score was associated with 0.11 (95% CI=0.10 – 0.12) and 0.08 mmol/L
(95% CI=0.07–0.09) lower HDL-C in WHII and IMPROVE, respectively. A 1 SD higher
triglycerides genetic score was associated with 0.25 (95% CI=0.22–0.28) and 0.25 mmol/L (95%
CI=0.21–0.29) higher triglycerides in WHII and IMPROVE, respectively (Figure 1A).
Differences in lipid levels associated with the GLGC genetic scores were in the same direction
but were slightly lower in magnitude in both studies (Figure 1B).
Lipid genetic scores as instruments for Mendelian randomisation analysis
The Cardiochip genetic scores explained 13% and 3% of the total variance in LDL-C, 7% and
5% of the variance in HDL-C, and 5% and 4% of the variance in triglycerides in WHII and
IMPROVE, respectively. The GLGC genetic scores explained 11% and 2% of the total variance
in LDL-C, 4% and 5% of the variation in HDL-C, and 2% and 2% of the variation in
triglycerides levels in WHII and IMPROVE, respectively. All scores had large F-statistics
(Table 2). The WHII R2 and F-statistics for the Cardiochip scores are likely to be inflated due to
(95%%% CCCIII=0.00 343434–000 33.3999
/ A
L L
e L
29) higher trigl cerides in WHII and IMPROVE respecti el (Fig re 1A)
/L (9(9(95%5%5% CCCI=I=I=0..1311 –0.20) higher LDL-C iin nn WHWW II and IMPROROROVE, respectively. A
L geeenetic scoree wwwass aaassococociateeedd d wwwitth 000.11 (995%%% CCCI=I=I=0.10110 – 000.12)2)) and 000.0. 888 mmmmmmool/L
.07–000 00.09)9)9) lowwerer HHHDLDLDL-C iiinnn WWWHIIIIII aaandndnd IIIMPMPMPROROROVEVEVE, rrrespppececectititivevelyll . AAA 111 SDDD hhhigigi heheh rr
es gegg netic score was associateddd witii hh h 00.0 252525 (((959595%%% CICII 0=00 22.22–22 00.0 282828) ) andd d 0.25 mmol/L
2929)) hihi hgh t iri lgl idid ii WHWHIIII dnd IIMPMPROROVEVE iti ll ((FiFi 11A)A) by guest on May 27, 2018
http://circgenetics.ahajournals.org/D
ownloaded from
DOI: 10.1161/CIRCGENETICS.112.963140
11
discovery bias, and the higher sample size in WHII for the Cardiochip scores will also contribute
to a higher F-statistic. The considerably lower R2 values for the LDL genetic score in IMPROVE
may reflect the large number of individuals on statins. In all cases the genetic scores were much
stronger instruments than single SNPs. Comparison of the GLGC genetic scores with single
SNPs in WHII is shown in Supplementary figure 1, which also shows that the genetic scores
have improved specificity as instruments over single SNPs, with respect to the 3 lipid fractions.
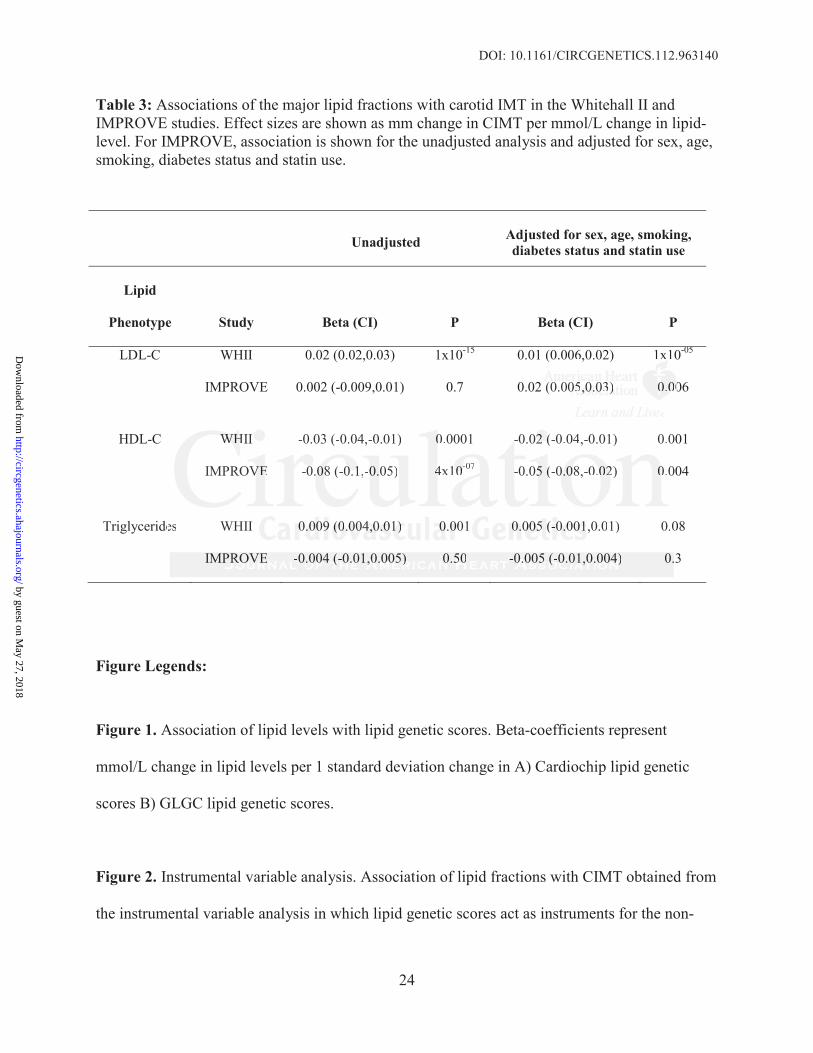
Direct association of blood lipid fractions with CIMT
After adjustment for age, sex, smoking, diabetes status and statin use, only LDL-C and HDL-C
were associated with CIMT (Table 3). A 1mmol/L higher LDL-C was associated with 0.01 mm
(95% CI=0.006–0.02) and 0.02 mm (95% CI=0.005–0.03) higher CIMT in WHII and
IMPROVE, respectively. A 1 mmol/L higher HDL-C was associated with 0.02 mm (95%
CI=0.01–0.04) and 0.05 mm (95% CI=0.02– 0.08) lower CIMT in WHII and IMPROVE,
respectively.
Instrumental variable analysis
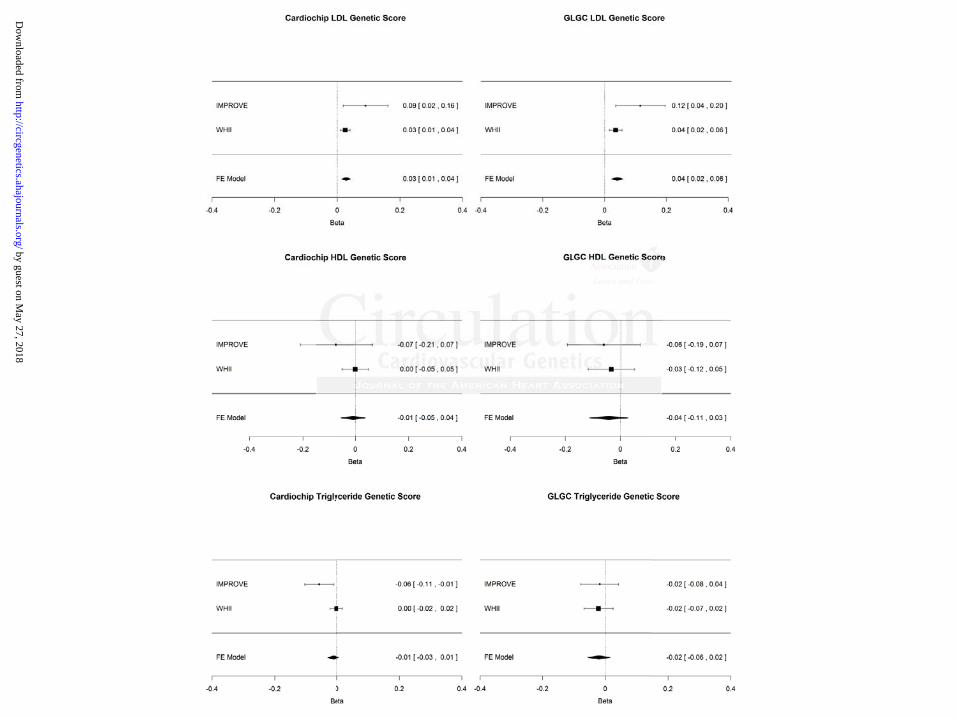
Based on the meta-analysis of the estimates derived from the instrumental variable analysis, a 1
mmol/L higher LDL-C was associated with 0.03 mm (95% CI=0.01–0.04; p=0.0002) and 0.04
mm (95% CI=0.02–0.06; p<0.0001) higher CIMT, when using the Cardiochip and GLGC LDL
genetic scores, respectively, as instruments (figure 2). HDL-C and triglycerides were not found
to be associated with CIMT using instrumental variable analysis (figure 2). There was no change
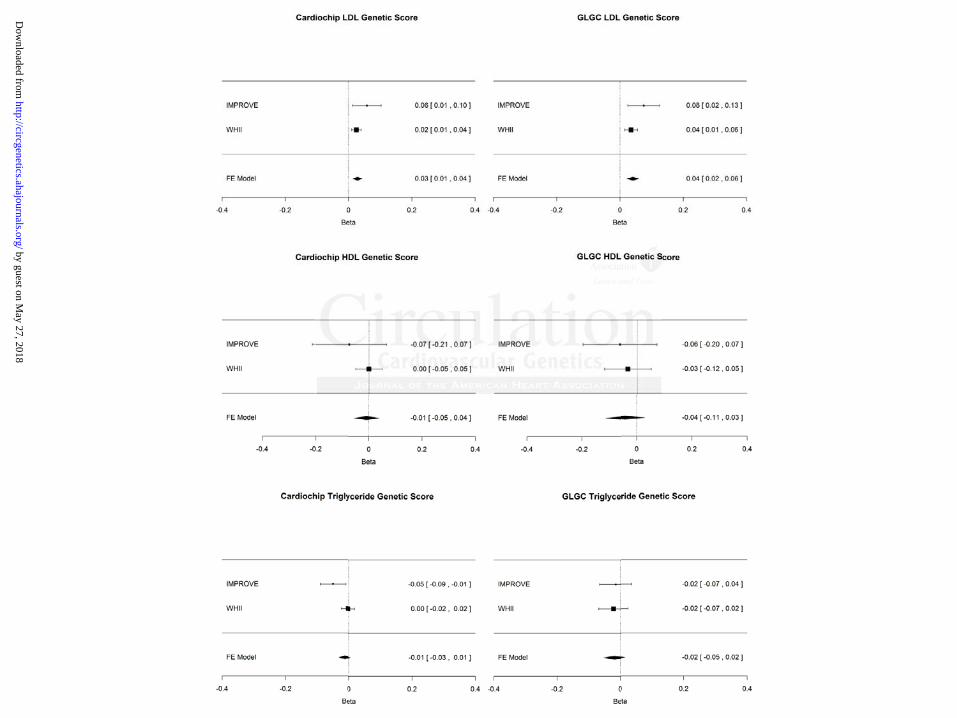
in the overall IV estimate when using lipid levels corrected for statin use (figure 3).
Discussion
Specific LDL-C, HDL-C and triglycerides genetic scores were used in a Mendelian
randomisation analysis to assess the causal relationship between each lipid fraction and CIMT.
only LDL-C and HHHDDD
s asso iici tatt dded wititith 000.0001
y
t l i bl l i
.00006–6–6–0.00 020202) ) ) annd d d 0.02 mm (95% CI=0.005–5–5–0.00 03) higher CIMMMT in WHII and
, reespectively. AAA 1 mmmmoool/l/l/L hihihighghgherr HHHDDL-CC wasas aaasssss ociaiiated wwwithhh 000.02 22 mmmmmm (((9555%%%
04) ananandd d 000.0555 mmm m (9(9(95%5%5% CCCI=I=I=000.02– 000.080808)) lolol wwer r CICICIMTMTMT iiinnn WHWHWHIIIIII andndnd IIIMPMPMPROROROVEVEVE,
yyy.
t ll ii blbl ll ii by guest on May 27, 2018
http://circgenetics.ahajournals.org/D
ownloaded from
DOI: 10.1161/CIRCGENETICS.112.963140
12
Though there was a positive association between directly measured LDL-C and CIMT and a
negative association between directly measured HDL-C and CIMT, the results from the
Mendelian randomisation analysis support a causal association with LDL-C only. Despite
differences in cohort characteristics (i.e. healthier individuals and much smaller proportion on
lipid-lowering medication in WHII compared to IMPROVE), the different effect of genetic score
on lipid levels (smaller in the IMPROVE study) and the different SNPS used in the two genetic
scores (Cardiochip versus GLGC), the association between LDL-C and CIMT was found to be
causal in both studies. Although the genetic scores were comparable instruments for HDL-C and
triglycerides, no effect on CIMT was found for these two genetic scores.
One criterion for causality is the magnitude of effect. In our study, using GLGC genetic
variants as instruments for LDL-C yielded a 0.04mm difference in CIMT per mmol/L difference
in LDL-C. To contextualise these findings, a meta-analysis of 11 statin trials(11) found that after
treatment with statins (mean treatment duration of 25.6 months), there was a significant
reduction in the mean LDL-C (pre-treatment: 168.6±33.3 mg/dL, post-treatment: 102.33±27.9
mg/dL, P<0.05, N=2132) and also a 0.04mm (95% CI=0.028-0.052) difference in mean CIMT
between statin therapy arm and placebo arm (Bedi et al., 2010). This is roughly equivalent to a
0.02mm decrease in CIMT per mmol/L decrease in LDL-C, and therefore reasonably concordant
with the genetic data.
Clinical perspective
Randomised controlled drug trials with hard clinical end points require a very large number of
participants and follow-up over a long period, making them technically and financially
challenging. As a result, clinically related, laboratory-derived surrogate endpoints have been
used as alternative endpoints in these situations. CIMT has been used as a surrogate end-point in
nstruments for HDDDLLL-C
es.
e n
e
T a
w
n the mean LDL C (pre treatment: 168 6±33 3 mg/dL post treatment: 102 33±2
e crrritititerererioioionn fofofor cacacausality is the magnitudeee ooof f effect. In our stututudy, using GLGC gen
innstttruments foor LDDDLLL-CC yiyy eldededed a 0.04004mmm diffffefeferererence inn CIMIMIMT TT ppper mmmmmmoool//L/L dddiffffe
To cononontetetexxtuaalililisese tttheheh sese finnndididinngs, aaa mmmeteteta-anan lalalysssisisis ooofff 111111 sssttatatititinn ttrt ialslsls(1(1(111) fffououndndd ttthhha
with statins ((mean treatment ddduratioii n foff 22255.666 monthhsh ),)), thehh re was a siggnificant
n thhe LDLDLL CC ((p t at nt 161688 66±3333 33 /g/dLdL st t at nt 101022 3333 2±2 by guest on May 27, 2018
http://circgenetics.ahajournals.org/D
ownloaded from
DOI: 10.1161/CIRCGENETICS.112.963140
13
many lipid-modifying drug trials to help inform later cardiovascular disease end-point trials(33–
36). However, the suitability of CIMT as a surrogate marker in cardiovascular drug trials has
come under debate, due to conflicting trial results e.g. the SANDS(37) and FIELD(38) trials. The
underlying assumption in randomised trials using CIMT as a surrogate marker is that the rate of
change in CIMT over time in response to drug therapies reflects the change in the risk of
cardiovascular outcomes. The majority of CIMT trials, however, have short follow-up periods
and modest sample sizes and therefore lack power to identify associations with cardiovascular
outcomes. Rather, they are designed to provide inferences on cardiovascular outcomes based on
a presumed inverse relationship between atherosclerosis progression and cardiovascular
benefit(39).
A recent large-scale meta-analysis of 41 randomised trials assessing CIMT at baseline
and follow-up after treatment(40), including a total of 18,307 participants, concluded that
regression of CIMT induced by cardiovascular drug therapies was not associated with a
reduction in cardiovascular events. Though the meta-analysis was technically sound, the
heterogeneity in the interventions evaluated, the methods used for CIMT measurement, the
outcome definition, study design, population characteristics and follow-up time between the 41
trials may have reduced the ability to detect an association between carotid IMT and
cardiovascular event reductions in such trials.
The aim of the ACCORD(5) Lipid trial was to test whether treatment of patients with
type 2 diabetes with fenofibrate, to increase plasma HDL cholesterol levels and reduce plasma
TG concentrations, would result in additional cardiovascular benefit compared with simvastatin
(LDL-lowering) therapy alone. Though the addition of fenofibrates to statin treatment did not
show any significant reduction in clinical events in the placebo versus treatment groups, sub-
ascular outcomes bbbasasa e
nd ca ddrdiioi vascularrr
.
e i
-
o
n cardio asc lar e ents Tho gh the meta anal sis as technicall so nd the
.
eccec nnnt large-scaaleee memmettta-anananalysssisisis oooff 41 rrandodomiiisseed d d trrialslls assesesssiingngng CIMIMIMT aaat basaaseli
-up aftftftererer tttreatttmementntt(4(4(40)00 , innclclcluuudingg aaa totototttal ll ofoff 181818 33,3070707 ppparrrtititi icicipapa tntnts, ccconononcluddd deded ttthahah ttt
of CIMT induceddd bbby yy ca ddrdioii vasc llular dddrug gg thhherapppies was not associiiated with a
n didi lla ts ThTh hgh thhe eta lal iis t chh ini llll dd thhe by guest on May 27, 2018
http://circgenetics.ahajournals.org/D
ownloaded from
DOI: 10.1161/CIRCGENETICS.112.963140
14
group analyses suggested benefits of fenofibrate therapy in mixed dyslipidemia individuals.
Similar results were reported in post hoc analyses performed in other fibrate studies(41).
Therefore, a MR analysis to determine causality between HDL-C, triglycerides and CIMT in a
sufficiently large mixed dyslipidemia sample would be worthwhile.
Our findings suggest that CIMT is likely to be a reliable surrogate outcome measure in
randomised trials of LDL-lowering therapy, but because of the lack of evidence in the genetic
association between HDL-C, triglycerides and CIMT, cast doubt on the use of CIMT in trials of
HDL-C and triglyceride-modifying therapies.
Previous Mendelian randomisation studies based on lipid-associated SNPs
To date there have been few Mendelian randomisation studies addressing association of lipids
with CIMT or CHD. A study by Aulchenko et al.(42) generated genetic scores for total
cholesterol, LDL-C, HDL-C and triglycerides based on 28 SNPs (identified prior to the GLGC
study). They looked at the direct association of the genetic scores with CIMT and found only the
total cholesterol genetic score to be associated with CIMT. However, they did not use an
instrumental variable approach to quantify any causal effect. The GLGC(19) found 4 lipid-
associated SNPs to also be associated with CAD but they did not attempt to quantify the causal
effect of the lipid fractions using an instrumental variable approach. The Triglyceride Coronary
Disease Genetics Consortium and emerging Risk Factor Collaboration compared the risk of
genetically (as determined by the APOA5 SNP rs662799) elevated triglycerides levels among
over 20,000 CHD cases and 35,000 controls(30). They concluded that there was a causal role for
triglycerides-mediated pathway(s) in CHD. However, the APOA5 variant was also associated
with HDL-C levels in their study. The association of genetically determined triglycerides levels
with CHD was also attenuated to the null after adjusting not only for HDL, but also for non-HDL
ed SNSNSNPPPs
r p
, L
e n
sterol genetic score to be associated ith CIMT Ho e er the did not se an
re hahahaveveve bbbeeeeeenn fefefewww Mendelian randomisatttioioionn studies addresssisising association of lip
ooro CHD. A sttuddy byyy AAAulululcheneenkooo eet aaal..(422) geenneerararateed ggenetticcc scscs ooores fofofor totootal l
, LDLDLDL-CCC, HHHDLDLDL CC-C aa dndnd triglglglycycyceridddeseses bbbaaasededd oonn 282828 SSSNPNPNPs (i(i(iddede tntntififified dd prprpriiior totot tttheheh GGGL
eyyy looked at the dddirect associiiation off thheh gegg netic scores wiii hthh CCCIMMMTTT and found on
te ll iti t bbe iiatedd ii hth CCIMIMTT HH hth ddidid ot by guest on May 27, 2018
http://circgenetics.ahajournals.org/D
ownloaded from
DOI: 10.1161/CIRCGENETICS.112.963140
15
cholesterol and other variables. This non-specific effect of rs662799 compromises one key
assumption for a valid Mendelian randomisation analysis of a biomarker and complicates the
interpretation of the results. The latter two studies did not look at association of lipid-associated
SNPs with CIMT, which is the objective of this study.
Limitations
The validity of the Mendelian randomisation analysis may be compromised by a) population
stratification, where allele frequencies and disease rates differ between population subgroups; b)
pleiotropy, where genetic instruments affect the outcome through more than one intermediate
risk factor, though this is not an issue for cis-acting SNPs used as instruments for a protein
biomarker, c) linkage disequilibrium, where another polymorphism in close proximity (and in
linkage disequilibrium) to the variant of interest, is causing disease through another pathway, and
d) weak instrument bias. Analysis in the WHII was restricted to Caucasians and principal
component analysis revealed no substantial population stratification. In the IMPROVE study,
though all individuals were Caucasians there was population stratification that reflected the
geographical location from which the samples were obtained(22). However, the SNPs used to
generate the GLGC genetic scores were also discovered in individuals of European descent from
the United States, Europe or Australia. Therefore, the scores should be applicable to the general
European population and stratification is less likely to be an issue in this Mendelian
randomisation analysis.
In WHII, lipid measures used in the IV analysis were those from an earlier phase to
CIMT measurements, since the proportion of statin users at this earlier phase was very low.
Analysis using lipid measures from the same phase as the CIMT measures gave similar results
(provided on request). Although the two studies differ in design, the consistency of genetic
e than one intermedededia
rumentstt fffor a ppproteteteininin
d
equilibrium to the variant of interest, is causing disease throu another pathwa
s
analysis revealed no substantial population stratification. In the IMPROVE stud
indi id als ere Ca casians there as pop lation stratification that reflected the
c) lililinknknkagagage e didd seseseqqquilibrium, where anotheeer rr ppolymorphism in n clcc ose proximity (and
equququilibrium) too tthee vvvar aiaianntn of ff iini ttterresttt, is ccaausiiingngng dddiisi eaaasse thhrh oooughghgh anooothththeer pattthwhwwa
. AAAnanallyly isisis in ttthehehe WHIHIHIIII waww s s rere tststririictctctededed ttto CaCaCaucucasasiaii nss aaandndnd ppririincncipipi lalal strumemementntnt bbbiiiass
analysyy is revealel dd d no s bbubstantiiialll pppoppp lullatioii n stratiiififificatiiion. In thehh IIIMPROVE stud
inddii idid lls CCa iia thhe llatiio st itififi iti thhat flfl tedd hth by guest on May 27, 2018
http://circgenetics.ahajournals.org/D
ownloaded from
DOI: 10.1161/CIRCGENETICS.112.963140
16
associations with lipid traits across studies of differing design has been a feature of numerous
genome wide association studies. Therefore we present the effect estimates both separately and
combined.
Often, genes act on multiple pathways and may therefore be associated with multiple
intermediate phenotypes, especially those that act as transcription factors for other genes. Some
SNPs included in the score may be independently associated with other cardiovascular risk
factors and so individually they would not be valid instruments. By combining these multiple
SNPs into one score the issue of pleiotropy can be largely overcome. An association with one
polymorphism could have arisen by chance or confounding, but associations with more than one
polymorphism in different genes marking the same exposure are unlikely unless the exposure is
causal(43). Given the large number of lipid genetic variants that have been identified by different
studies, it is possible to generate many independent combinations of such variants, and from
these many independent instrumental variable estimates of the causal effect of exposure of
interest on outcome. It is important to note that instrument strength of the Cardiochip genetic
scores in WHII are likely to be inflated due to discovery bias. However, both the Cardiochip and
GLGC genetic scores, which used only partially overlapping SNP sets, supported the causal
association of LDL-C with CIMT in each study. Using two different scores containing only
partially overlapping SNPs gives us confidence that the results are not biased by the SNP set
used, as the two instruments are unlikely to be influenced by the same pleiotropy or linkage
disequilibrium-induced confounding, and their consistency provides strong evidence against the
notion that reintroduced confounding is generating the effect(44).
Both Cardiochip and GLGC LDL genetic scores were stronger instruments than the HDL
and triglyceride genetic scores in WHII, and it remains to be seen whether the addition of more
An association wittth h h o
iations iiwiththth more thththa
ism in different genes marking the same exposure are unlikely unless the exposu
f
s possible to generate many independent combinations of such variants, and from
y
o tcome It is important to note that instr ment strength of the Cardiochipf genet
ismmm iiin n dididifffffferererennnt t t genes marking the sameee eeexxposure are unlikekekely unless the exposu
GGiG vvven the larggeee nuummbmberrr of liliippip ddd ggeneettic vavarianantstss thhah t hhave bbbeeeennn idennntititifiiededd byyy dif
s possisisiblblbleee to ggenenerer tatatee manynyny iiindepppenenendededenttt ccomombibibinananatititionsss ofofof ssucuch vavaariririantss, anand dd ffrfromo
y indepppendent instrumental variabbblell estiiimates of thhhe causalll effffffect of exppposure of
tc IIt ii iim rt t to ot hthat ii tr t st hth fof thhe CC didi hihiff et by guest on May 27, 2018
http://circgenetics.ahajournals.org/D
ownloaded from
DOI: 10.1161/CIRCGENETICS.112.963140
17
SNPs that increase the HDL and triglyceride instrument strength will alter the conclusions based
on this analysis. However, it is important to note that all genetic scores had comparable
instrument strength in the IMPROVE study, and despite the HDL genetic scores being the
strongest instruments in this cohort, causality was only observed for LDL-C.
Our method for generating genetic scores makes several assumptions: additive effects of
alleles, no gene-gene interactions and a linear effect of lipids on CIMT. Though not explored in
this work, if these assumptions did not hold, it would be possible to incorporate such knowledge
into the model. An alternative to using a composite genetic score as an instrument is to use the
SNPs as multiple instruments. Though this may improve the power, the large number of SNPs
may potentially create a weak instrumental variable problem(45). A comparison of the different
methodologies would be worthwhile but is beyond the scope of this report.
Conclusion
A Mendelian randomisation analysis, using the instrumental variable regression approach,
supports a causal association between LDL-C and CIMT, indicating CIMT to be a useful
surrogate end-point in clinical trials of LDL-lowering medications. Whether HDL-C or
triglycerides are causally associated with CIMT is uncertain. Thus, we conclude that, at present,
the suitability of CIMT as a surrogate marker in trials of therapies targeting these lipid fractions
is questionable and requires further study.
Acknowledgments: We thank all of the participants and the general practitioners, research nurses and data management staff who supported data collection and preparation. Prof. Hingorani and Dr. Casas were responsible for the study concept and design. Dr. Kumari, Dr. Kivimaki and Prof. Deanfield were involved in the acquisition of the WHII data. Drs. Baldassarre, Veglia, Strawbridge, Sennblad, Gertow, Tremoli, Gigante and de Faire were involved in the acquisition of the IMPROVE data. Ms. Shah carried out the statistical analysis of
n instrument is to usususe
he largeg numbebb r ofofof SSSN
i fe
g
n
an randomisation analysis, using the g pp ,
ialllly y y crcrcreaeaeatetete a wwweaee k instrumental variable ee prproblem(45). A cococommparison of the diffe
giiei sss would be wwwortthwwhwhilililee e buuuttt is bbeyonoond thhee sccopopopeee oof ttthhis reeeppporrtr ...
n
aaann rarandndomomisisi atatioionn ananalalysysisis,, ususiningg ththee ininststtrurumementnttallal vvarariaiiablblblee reregrgresessisionon aapppproroacach,h, aa
by guest on May 27, 2018
http://circgenetics.ahajournals.org/D
ownloaded from
DOI: 10.1161/CIRCGENETICS.112.963140
18
the data. Ms. Shah, Dr. Casas, Prof. Humphries and Prof. Hingorani drafted the manuscript, and all authors critically revised the manuscript for important intellectual content.
Funding Sources: The work on WHII was supported by the British Heart Foundation (BHF) [PG/07/133/24260, RG/08/008, SP/07/007/23671] and a Senior Fellowship to Professor Hingorani [FS/2005/125]. Prof Humphries is a BHF Chairholder. Prof. Talmud and Dr. Drenos have support from the British Heart Foundation. Drs. Kumari and Kivimaki are supported by the National Institutes of Health (NIH). Dr. Kivimaki’s time on this manuscript was partially supported by the National Heart Lung and Blood Institute [(NHLBI:HL36310]. Dr Holmes is supported by a MRC Population Health Scientist Fellowship (G0802432). The WHII study has been supported by grants from the Medical Research Council; British Heart Foundation; Health and Safety Executive; Department of Health; National Institute on Aging [AG13196], US, National Institute of Health; Agency for Health Care Policy Research [HS06516]; and the John D and Catherine T MacArthur Foundation Research Networks on Successful Midlife Development and Socio-economic Status and Health. The IMPROVE study was supported by the European Commission (Contract number: QLG1-CT-2002-00896), the Swedish Heart-Lung Foundation, the Swedish Research Council (projects 8691 and 0593), the Knut and Alice Wallenberg Foundation, the Torsten and Ragnar Söderberg Foundation, the Foundation for Strategic Research, the Stockholm County Council (project 562183), the Strategic Cardiovascular and Diabetes Programmes of Karolinska Institutet and Stockholm County Council, the Academy of Finland (Grant #110413) the British Heart Foundation (RG2008/014) and the Italian Ministry of Health (Ricerca Corrente).
Conflict of Interest Disclosures: Dr. Casas reports being a co-applicant on a BHF grant of ‘Genetics for Cardiovascular Disease’. Prof. Whittaker is an employee of GlaxoSmithKline(GSK), holds stock in GSK and is in receipt of an MRC grant for ‘exploiting genetic information in the estimation of disease risk’. Prof. Deanfield reports receiving BHF Programme grants and Medical Research Foundation grants, honoraria payment from and holding membership on speaker’s bureaus for Novartis, Roche, Merck, Danone and Pfizer, and acting as a consultant for Merck, AstraZeneca, Roche and Danone. Prof. Humphries reports receiving payment for speaker’s bureau at the Genzyme Meeting on Familial Hypercholesterolemia, and being on the advisory board for Storegene, a genetic testing UCL spin-off company for determining CHD-risk. All authors declare no other relationships or activities that could appear to have influenced the submitted work. Dr Holmes reports receiving support from a MRC Population Health Scientist Fellowship (G0802432). Dr. Kivimaki reports receiving NHLBI and MRC grants. Prof. Hingorani reports receiving BHF Programme and Project grants. Drs. Baldassare and Prof. Tremoli report receiving funding from the European Commission (Contract number: QLG1-CT-2002-00896)
References:
1. Baigent C, Keech A, Kearney PM, Blackwell L, Buck G, Pollicino C, et al. Efficacy and safety of cholesterol-lowering treatment: prospective meta-analysis of data from 90,056 participants in 14 randomised trials of statins. Lancet. 2005;366:1267-1278.
stststuuudydydy wwwasasas sssupupuppopoportrtrtededed, theee SwSwSwedededisisish h h HeHeHeararart-t-t-LLLthe KKKnununut t t ananand d d AlAlAliciciceee
g Foundation, the Torsten and Ragnar Söderberg Foundation, the Foundation foreue Academy of Finland (Grant #110413) the British Heart Foundation (RG2008/0
f fo eds stock in GSK and is in receipt of an MRC grant for ‘e ploiting genetic inform
g Founddndatata iooon,nn tthehh Torsten and Ragnar Södederberg Foundationonn, the Foundation foresesesearara ch, thththeee Stttockholm County Council (((pproject 562118388 ), tthhhe Strategic ululularrr and Diabebebetttess PrPrProgogogrararammmmmees ofofo KKKaraarolinnsska a InInInstststitititutututetete andndnd SStoockckckhohoholmlmlm CCCouoountntnty yye AAAcacc demy of f FFFinllannnd (G(G(Grant #1111104133) thhee BrBrBritititisisishh HHHeaart FoFoounnndddationnn (RGRGRG2000008/0ian nn MiMiMinininistststryryry ooof HeHeHealllththth (((RiRiR cececercrcr a CoCoCorrrrrrenenentetete).).).
f Interest Disclosures: DDDr. CCCasas repopp rts bebb iiing gg a co-appppppliiicant on a BHF grgg ant ofooor Cardiovovasasascucuculalalar rr DiDiDiseseseasasaseee’.’.’. PrPrProfofof... WhWhWhititittatatakekeker r r iffff s s s ananan eeempmpmplooloyeyeyee ee ofofof GGGlalalaxoxoxoSmSmSmithKlineedsdd to kck ii GSGSKK dd iis ii iipt fof MRMRCC t ffo ‘‘e lloiitiin iti iinffo by guest on M
ay 27, 2018http://circgenetics.ahajournals.org/
Dow
nloaded from
DOI: 10.1161/CIRCGENETICS.112.963140
19
2. Baigent C, Blackwell L, Emberson J, Holland L, Reith C, Bhala N, et al. Efficacy and safety of more intensive lowering of LDL cholesterol: a meta-analysis of data from 170 000 participants in 26 randomised trials. Lancet. 2010;376:1670-1681.
3. Cannon CP, Shah S, Dansky HM, Davidson M, Brinton EA, Gotto AM, et al. Safety of anacetrapib in patients with or at high risk for coronary heart disease. N Engl J Med. 2010;363:2406-2415.
4. Forrest MJ, Bloomfield D, Briscoe RJ, Brown PN, Cumiskey A, Ehrhart J, et al. Torcetrapib-induced blood pressure elevation is independent of CETP inhibition and is accompanied by increased circulating levels of aldosterone. Br J Pharmacol. 2008;154:1465-1473.
5. Ginsberg HN, Elam MB, Lovato LC, Crouse JR, Leiter LA, Linz P, et al. Effects of combination lipid therapy in type 2 diabetes mellitus. N Engl J Med. 2010;362:1563-1574.
6. Jun M, Foote C, Jicheng L, Neal B, Patel A, Nicholls SJ, et al. Effects of fibrates on cardiovascular outcomes: a systematic review and meta-analysis. Lancet. 2010;375:1875-1884.
7. NHLBI Communications. NIH stops clinical trial on combination cholesterol treatment. 2011. Available from: http://www.nih.gov/news/health/may2011/nhlbi-26.htm
8. O’Leary DH, Polak JF, Kronmal RA, Manolio TA, Burke GL, Wolfson SK. Carotid-artery intima and media thickness as a risk factor for myocardial infarction and stroke in older adults. Cardiovascular Health Study Collaborative Research Group. N Engl J Med. 1999;340:14-22.
9. Chambless LE, Heiss G, Folsom AR, Rosamond W, Szklo M, Sharrett AR, et al. Association of coronary heart disease incidence with carotid arterial wall thickness and major risk factors: the Atherosclerosis Risk in Communities (ARIC) Study, 1987-1993. Am J Epidemiol. 1997;146:483-494.
10. Espeland MA, O’leary DH, Terry JG, Morgan T, Evans G, Mudra H. Carotid intimal-media thickness as a surrogate for cardiovascular disease events in trials of HMG-CoA reductase inhibitors. Curr. Control Trials Cardiovasc Med. 2005;6:3.
11. Bedi US, Singh M, Singh PP, Bhuriya R, Bahekar A, Molnar J, et al. Effects of statins on progression of carotid atherosclerosis as measured by carotid intimal-medial thickness: a meta-analysis of randomized controlled trials. J Cardiovasc Pharmacol Ther. 2010;15:268-273.
12. Kastelein JJP, Wiegman A, de Groot E. Surrogate markers of atherosclerosis: impact of statins. Atheroscler. Suppl. 2003;4:31-36.
13. Bots ML, Visseren FL, Evans GW, Riley WA, Revkin JH, Tegeler CH, et al. Torcetrapib and carotid intima-media thickness in mixed dyslipidaemia (RADIANCE 2 study): a randomised, double-blind trial. Lancet. 2007;370:153-160.
ccctststs ooof f f fififibrbrbratatateseses ooonnn cet. 202020101010 33;3757575:11187775-5-5-11
Communications. NIH stops clinical trial on combination cholesterol treatment. fr
emedia thickness as a risk factor for myocardial infarction and stroke in older aduu 2
ess LE, Heiss G, Folsom AR, Rosamond W, Szklo M, Sharrett AR, et al. Associaheart disease incidence ith carotid arterial all thickness and major risk facto
Commmmumumunininicacacationonons. NIH stops clinical triaaal ll oon combination cchohh lesterol treatment. fromomom: http:////w/w/wwwwwww.nnnihihih.g.g.govovov/n/n/newewews///hehehealllththth/m// ayay20111111/n/n/nhlhh bibibi-2-2-26.66 hththtmmm
DDDH,H,H, Polakkk JJJF, KKKroonnnmalalal RRRA,,, MManaanolioiio TAA, BBururu kee GGLLL, WWollffsfsonn SSSK. CCCarrroootid---aaartemedddiaiaia ttthihihicknenessss aass aa rir skkk fffacacactor fofoforrr mymm ococarardididialalal iiinfnfnfaaarctttioioion n anand dd sttrororokekeke in n lololdeded rr dadaduular Health Studududy y y CoCoCollllllabababorororatatativivive e e ReReReseseseararrchcch GGGrororouppp. N N N EnEnEnglglgl JJJ MeMeMed.d.d. 111999;340:14-2
esss LE, Heieieissssss GGG, , , FoFoFolslslsomomom AAAR,R,R, RRRosososamamamononond d d W,W,W, SSSzkzkzklololo MMM,,, ShShSharararrereretttttt AAAR,R,R, eeet tt alaa . Associiahhe t didi iin icidde ii hth otidid rt iiall llll thihi kck dnd jaj iiskk ffact by guest on M
ay 27, 2018http://circgenetics.ahajournals.org/
Dow
nloaded from
DOI: 10.1161/CIRCGENETICS.112.963140
20
14. Taylor AJ, Villines TC, Stanek EJ, Devine PJ, Griffen L, Miller M, et al. Extended-release niacin or ezetimibe and carotid intima-media thickness. N Engl J Med. 2009;361:2113-2122.
15. Hiukka A, Westerbacka J, Leinonen ES, Watanabe H, Wiklund O, Hulten LM, et al. Long-term effects of fenofibrate on carotid intima-media thickness and augmentation index in subjects with type 2 diabetes mellitus. J Am Coll Cardiol. 2008;52:2190-2197.
16. Ebrahim S, Davey-Smith G. Mendelian randomization: can genetic epidemiology help redress the failures of observational epidemiology? Hum Genet. 2008;123:15-33.
17. Smith GD, Ebrahim S. Mendelian randomization: prospects, potentials, and limitations. Int J Epidemiol. 2004;33:30-42.
18. Talmud PJ, Drenos F, Shah S, Shah T, Palmen J, Verzilli C, et al. Gene-centric association signals for lipids and apolipoproteins identified via the HumanCVD BeadChip. Am J HumGenet. 2009;85:628-642.
19. Teslovich TM, Musunuru K, Smith AV, Edmondson AC, Stylianou IM, Koseki M, et al. Biological, clinical and population relevance of 95 loci for blood lipids. Nature. 2010;466:707-713.
20. Keating BJ, Tischfield S, Murray SS, Bhangale T, Price TS, Glessner JT, et al. Concept, design and implementation of a cardiovascular gene-centric 50 k SNP array for large-scale genomic association studies. PloS One. 2008;3:e3583.
21. Marmot M, Brunner E. Cohort Profile: the Whitehall II study. Int J Epidemiol. 2005; 34:251-256.
22. Baldassarre D, Nyyssönen K, Rauramaa R, de Faire U, Hamsten A, Smit AJ, et al. Cross-sectional analysis of baseline data to identify the major determinants of carotid intima-media thickness in a European population: the IMPROVE study. Eur Heart J. 2010;31:614-622.
23. Voight BF, Kang HM, Ding J, Palmer CD, Sidore C, Chines PS eta l. The metabochip, a custom genotyping array for genetic studies of metabolic, cardiovascular, and anthropometric traits. PLoS Genet. 2012;8:e1002793.
24. Schwarz G. Estimating the Dimension of a Model. Ann Stat. 1978;6:461-464.
25. Brown PJ. Measurement, Regression and Calibration. Oxford University Press; 1994.
26. Lawless JF, Wang P. A simulation study of ridge and other regression estimators. Communications in Statistics. 1976;5:307-323.
27. Sabia S, Kivimaki M, Kumari M, Shipley MJ, Singh-Manoux A. Effect of Apolipoprotein E epsilon4 on the association between health behaviors and cognitive function in late midlife. MolNeurodegener. 2010;5:23.
eadChip. Am J Huuummm
u IMM KoKoKosesesekikiki MMM etet a7
g t
t 4
clinininicicicalalal aandndnd ppopopopulation relevance of 95 lololocic for blood lipidddsss. Nature. 2010;466:7
g BJBJBJ, , Tischfffieii ld S, MMMurrararay y SSS,, BhBBhangagagale TT,, PrPrPricice TTS, GGlessnsnnerr JJJT,TT ettt aala . CCConnnceeptimplelelemememenntatttioioi nn ofoff aa ccardididiovovovasculalalarr gegg nene-cecentnttririricc 505050 kkk SSSNPNPNP aarrrayyy fffooor larargege-scsc lalaleesociation studieieies. PlPlPloSoSoS OOOnenene. 202020080808;3;3;3:e:e:e35355838383...
ttt M, Brunnnenener r r E.E.E. CCCohohohororort t t PrPrProfofofililile:e:e: ttthehehe WWWhihihitetetehhhalaa l ll IIIIII ssstututudydydy. InInInttt JJJ EEEpipipidededemimimiolololt . 2005; 34
by guest on May 27, 2018
http://circgenetics.ahajournals.org/D
ownloaded from
DOI: 10.1161/CIRCGENETICS.112.963140
21
28. Bennet AM, Di Angelantonio E, Ye Z, Wensley F, Dahlin A, Ahlbom A, et al. Association of apolipoprotein E genotypes with lipid levels and coronary risk. J Am Med Assoc.2007;298:1300-1311.
29. Staiger D, Stock JH. Instrumental Variables Regression with Weak Instruments. Econometrica. 1997;65:557-586.
30. Sarwar N, Sandhu MS, Ricketts SL, Butterworth AS, Di Angelantonio E, Boekholdt SM, et al. Triglyceride-mediated pathways and coronary disease: collaborative analysis of 101 studies.Lancet. 2010;375:1634-1639.
31. Baum CF, Schaffer ME, Stillman S. Instrumental variables and GMM: Estimation and testing. The Stata Journal. 2003;3:1-31.
32. Asselbergs FW, Guo Y, van Iperen EP, Sivapalaratnam S, Tragante V, Lanktree MB, et al. Large-Scale Gene-Centric Meta-analysis across 32 Studies Identifies Multiple Lipid Loci. Am J Hum Genet. 2012;91:823-838
33. Taylor AJ, Sullenberger LE, Lee HJ, Lee JK, Grace KA. Arterial Biology for the Investigation of the Treatment Effects of Reducing Cholesterol (ARBITER) 2: a double-blind, placebo-controlled study of extended-release niacin on atherosclerosis progression in secondary prevention patients treated with statins. Circulation. 2004;110:3512-3517.
34. Smilde T, van Wissen S, Awollersheim H, Trip M, Kastelein J, Stalenhoef A. Effect of aggressive versus conventional lipid lowering on atherosclerosis progression in familial hypercholesterolemia (ASAP): a prospective, randomised, double-blind trial. Lancet.2001;357:577-581.
35. MacMahon S, Sharpe N, Gamble G, Hart H, Scott J, Simes J, et al. Effects of lowering average of below-average cholesterol levels on the progression of carotid atherosclerosis: results of the LIPID Atherosclerosis Substudy. LIPID Trial Research Group. Circulation.1998;97:1784-1790.
36. Crouse JR, Raichlen JS, Riley WA, Evans GW, Palmer MK, O’Leary DH, et al. Effect of rosuvastatin on progression of carotid intima-media thickness in low-risk individuals with subclinical atherosclerosis: the METEOR Trial. J Am Med Assoc. 2007; 297:1344-1353.
37. Fleg JL, Mete M, Howard BV, Umans JG, Roman MJ, Ratner RE, et al. Effect of statins alone versus statins plus ezetimibe on carotid atherosclerosis in type 2 diabetes: the SANDS (Stop Atherosclerosis in Native Diabetics Study) trial. J Am Coll Cardiol. 2008;52:2198-2205.
38. Keech A, Simes RJ, Barter P, Best J, Scott R, Taskinen MR, et al. Effects of long-term fenofibrate therapy on cardiovascular events in 9795 people with type 2 diabetes mellitus (the FIELD study): randomised controlled trial. Lancet. 2005;366:1849-1861.
te V, Lanktree MBBB, , etMMMululultititiplplple ee LiLiLipipipidd d LoLoLocicici. AAA
Aon of the Treatment Effects of Reducing Cholesterol (ARBITER) 2: a double-blintrolled study of extended-release niacin on atherosclerosis progression in seconp
fvs77 581
AJ,J,J, SSSululullelelenbnbnbergegeger LE, Lee HJ, Lee JK, GrGrGracace KA. Arterial BBBiology for the onn n ofofof the Trerereatatatmemm ntntnt EEEffffffeccctststs ooof ff ReReRedududucicicingnn CChholeeestststerererol (((ARARARBIBIBITETT R)R)R) 222::: a dododoububublelele-blinttrt ooolled study oof extxttendedededd-d reeeleleleasssee niaaccin onn atatheheheroror sclllerrosis prrrogogogressssiooonn innn seceeconpatatatieieients treaeaeateed wiithhh staaatiiinsn . CiC rrrcuulaaatioon. 220040404;110101 :351112-353551777.
T, van Wissennn SSS, ,, AwAwAwololollelelersrsrsheheheimimim HHH,,, TrTTripipp MMM, KaKK stststeleleleieiein nn J,J,J, SSStatatalelelenhnhnhoeoeoef A. Effect of versus conventiiion llal lllipipididid lloweriiing gg on a hhtherosclerosiiis ppprogrgg essiiion in familial sssterolemiaia (((ASASASAPAPAP):):): aa ppprororospspspececectititiveveve, , rararandndndomomomisisiseddd, ,, dododoububublelle---blblblininind d d trtrtriaiaial.l.l. LaLaLancncncet.7777 558181 by guest on M
ay 27, 2018http://circgenetics.ahajournals.org/
Dow
nloaded from
DOI: 10.1161/CIRCGENETICS.112.963140
22
39. Taylor AJ, Bots ML, Kastelein JP. Vascular disease: meta-regression of CIMT trials-data in, garbage out. Nat Rev Cardiol. 2011;8:128-130.
40. Costanzo P, Perrone-Filardi P, Vassallo E, Paolillo S, Cesarano P, Brevetti G, et al. Does carotid intima-media thickness regression predict reduction of cardiovascular events? A meta-analysis of 41 randomized trials. J Am Coll Cardiol. 2010;6:2006-2020.
41. Ginsberg HN. The ACCORD (Action to Control Cardiovascular Risk in Diabetes) Lipid Trial: What we learn from subgroup analyses. Diabetes Care. 2011;34:S107-S108.
42. Aulchenko YS, Ripatti S, Lindqvist I, Boomsma D, Heid IM, Pramstaller PP, et al. Loci influencing lipid levels and coronary heart disease risk in 16 European population cohorts. Nat Genet. 2009;41:47-55.
43. Lewis SJ. Mendelian randomization as applied to coronary heart disease, including recent advances incorporating new technology. Circ Cardiovasc Genet. 2010;3:109-117.
44. Palmer TM, Lawlor DA, Harbord RM, Sheehan NA, Tobias JH, Timpson NJ, et al. Using multiple genetic variants as instrumental variables for modifiable risk factors. Stat Methods MedRes. 2012;21:223-242.
45. Pierce BL, Ahsan H, Vanderweele TJ. Power and instrument strength requirements for Mendelian randomization studies using multiple genetic variants. Int J Epidemiol. 2010;40:740-752.
isease, including rerereccec00;3;3;3:1:1:1090909-1-1117177.
impsononon NNNJJJ eeettt alalal UUUsis
2
B
nettticicic vvvararariaiaiantnn s asasas instrumental variables fofoforr modifiable risk k k faff ctors. Stat Methods211:1 2222223-242.22
BL,L,L, AAAhsan HHH, VaVV nddeeerweeeelele TJTJ. PoPPoweeerr and innnststs rumem nttt sstrenngggth h rererequiiriremememeents ffoor randddomomomizizizatioonn tststududdiieies s usisiingngng mullltititiplplple ee geenenetititic vavava iiriananants. InInInttt JJJ ttt EEEpidididemememiiiol. 2220101010;0;0 4404
by guest on May 27, 2018
http://circgenetics.ahajournals.org/D
ownloaded from
DOI: 10.1161/CIRCGENETICS.112.963140
23
Table 1. Cohort characteristics
Whitehall II IMPROVEN 5059 3430% Men 74 48Age
Baseline 49.1 (5.9) 64.2 (5.4)Follow-up 60.9 (6.0) -
Mean CIMT (SD) cm 0.79 (0.15) 1.17 (0.33)Baseline Mean LDL-C (SD) mmol/L 4.37 (1.01) 3.55 (1.00)Baseline Mean HDL-C (SD) mmol/L 1.43 (0.41) 1.26 (0.36)Baseline Mean Triglyceride (SD) mmol/L 1.44 (1.11) 1.59 (1.24)Baseline % on Statins 0.87 40.3
Number of participants with:CIMT measurement 3617 3430
Cardiochip data 5059 0Cardiochip data and CIMT 3256 0Metabochip data 3126 3430Metabochip data and CIMT 2138 3430
Table 2. Strength of Genetic Instruments. R2 and F-statistic obtained from the first stageregression between lipid levels and the respective genetic scores
R2 F-statistic Sample SizeWHII IMPROVE WHII IMPROVE WHII IMPROVE
Cardiochip genetic scoresLDL 0.13 0.03 697 90 4635 3354HDL 0.07 0.05 371 181 4745 3410TG 0.05 0.04 259 137 4760 3414
GLGC genetic scoresLDL 0.11 0.02 366 75 3005 3352HDL 0.04 0.05 143 194 3052 3342TG 0.02 0.02 76 78 3062 3410
34443030data 5059 0ddata 5059 0datttaaa aana d CIIMMMT 3256 0dddatataa 311266 3434343000dadadataaa and CIMTT 21388 344430
by guest on May 27, 2018
http://circgenetics.ahajournals.org/D
ownloaded from
DOI: 10.1161/CIRCGENETICS.112.963140
24
Table 3: Associations of the major lipid fractions with carotid IMT in the Whitehall II and IMPROVE studies. Effect sizes are shown as mm change in CIMT per mmol/L change in lipid-level. For IMPROVE, association is shown for the unadjusted analysis and adjusted for sex, age, smoking, diabetes status and statin use.
Figure Legends:
Figure 1. Association of lipid levels with lipid genetic scores. Beta-coefficients represent
mmol/L change in lipid levels per 1 standard deviation change in A) Cardiochip lipid genetic
scores B) GLGC lipid genetic scores.
Figure 2. Instrumental variable analysis. Association of lipid fractions with CIMT obtained from
the instrumental variable analysis in which lipid genetic scores act as instruments for the non-
Unadjusted Adjusted for sex, age, smoking, diabetes status and statin use
Lipid
Phenotype Study Beta (CI) P Beta (CI) P
LDL-C WHII 0.02 (0.02,0.03) 1x10-15 0.01 (0.006,0.02) 1x10-05
IMPROVE 0.002 (-0.009,0.01) 0.7 0.02 (0.005,0.03) 0.006
HDL-C WHII -0.03 (-0.04,-0.01) 0.0001 -0.02 (-0.04,-0.01) 0.001
IMPROVE -0.08 (-0.1,-0.05) 4x10-07 -0.05 (-0.08,-0.02) 0.004
Triglycerides WHII 0.009 (0.004,0.01) 0.001 0.005 (-0.001,0.01) 0.08
IMPROVE -0.004 (-0.01,0.005) 0.50 -0.005 (-0.01,0.004) 0.3
(0.006,0.02) 1x1x 0
(0.0000555,0,0,0.0.0.0333))) 0.00 000000
0
0
e 0
3
WHWHWHII -0.03 (-0.04,-0.01) 00.0001 -0.0222 (((-0.04,-0.01) 0.00
IMPROVVEEE -0.0.080808 (-0.00 11,-000.05) 44x100--07 --0.055 (((-0.0.0.0008,-0.000222) 00.0 00
es WHII 0.0.0.0000009 99 (0(0(0.0.0.0040404,0,0,0.0.0.01)1)1) 0.00 0000001 0.0.0.000000555 (((--0.0.0.0000001,11 0.01) 0.0
IMPRRROVOVOVEEE -0...0000004 44 (((-0.0.0.0100 ,0,0,0.000050505))) 0.00 505050 -0.0.0.0000005 5 5 (((-0.0.0.010101,0,0,0.0.0.0040404))) 0...3
by guest on May 27, 2018
http://circgenetics.ahajournals.org/D
ownloaded from

DOI: 10.1161/CIRCGENETICS.112.963140
25
confounded effect of each lipid fraction. Effect sizes and 95% confidence intervals in each study
and summary estimates from a fixed-effect model are shown as mm change in CIMT per
mmol/L change in lipid level.
Figure 3. Instrumental variable analysis using lipid levels corrected for statin use. Association of
lipid fractions with CIMT obtained from the instrumental variable analysis in which lipid genetic
scores act as instruments for the non-confounded effect of each lipid fraction. Effect sizes and
95% confidence intervals in each study and summary estimates from a fixed-effect model are
shown as mm change in CIMT per mmol/L change in lipid level.
a fixed-effect modddelelel a
by guest on May 27, 2018
http://circgenetics.ahajournals.org/D
ownloaded from
by guest on May 27, 2018
http://circgenetics.ahajournals.org/D
ownloaded from
by guest on May 27, 2018
http://circgenetics.ahajournals.org/D
ownloaded from
by guest on May 27, 2018
http://circgenetics.ahajournals.org/D
ownloaded from
Aroon D. HingoraniGigante, Ulf de Faire, Meena Kumari, Philippa J. Talmud, Anders Hamsten, Steve E. Humphries and
Sennblad, Rona J. Strawbridge, Damiano Baldassarre, Fabrizio Veglia, Elena Tremoli, BrunaMichael V. Holmes, Mika Kivimaki, Claudia Langenberg, Nick Wareham, Karl Gertow, Bengt
Sonia Shah, Juan-Pablo Casas, Fotios Drenos, John Whittaker, John Deanfield, Daniel I. Swerdlow,Mendelian Randomization Analysis
Causal Relevance of Blood Lipid Fractions in the Development of Carotid Atherosclerosis:
Print ISSN: 1942-325X. Online ISSN: 1942-3268 Copyright © 2012 American Heart Association, Inc. All rights reserved.
TX 75231is published by the American Heart Association, 7272 Greenville Avenue, Dallas,Circulation: Cardiovascular Genetics
published online December 28, 2012;Circ Cardiovasc Genet.
http://circgenetics.ahajournals.org/content/early/2012/12/28/CIRCGENETICS.112.963140World Wide Web at:
The online version of this article, along with updated information and services, is located on the
http://circgenetics.ahajournals.org/content/suppl/2012/12/28/CIRCGENETICS.112.963140.DC1Data Supplement (unedited) at:
http://circgenetics.ahajournals.org//subscriptions/
is online at: Circulation: Cardiovascular Genetics Information about subscribing to Subscriptions:
http://www.lww.com/reprints Information about reprints can be found online at: Reprints:
document. Permissions and Rights Question and Answer this process is available in the
located, click Request Permissions in the middle column of the Web page under Services. Further information aboutnot the Editorial Office. Once the online version of the published article for which permission is being requested is
can be obtained via RightsLink, a service of the Copyright Clearance Center,Circulation: Cardiovascular Genetics Requests for permissions to reproduce figures, tables, or portions of articles originally published inPermissions:
by guest on May 27, 2018
http://circgenetics.ahajournals.org/D
ownloaded from

1
SUPPLEMENTAL MATERIAL
Causal relevance of blood lipid fractions in the development of carotid
atherosclerosis: Mendelian randomization analysis
Shah et al
Methods
Lipid and carotid intima-media thickness measurements
In WHII, serum for lipid analyses was refrigerated at -4C and assayed within 72 hours.
Cholesterol and triglycerides were measured with the use of a Cobas Fara centrifugal
analyzer (Roche Diagnostics System, Nutley, NJ). HDL-cholesterol was measured by
precipitating non-HDL cholesterol with dextran sulfate-magnesium chloride with the use of a
centrifuge and measuring cholesterol in the supernatant fluid (1). LDL-C concentration was
calculated using the Friedewald formula (2). Phase 3 provided the first comprehensive
dataset for lipid measurements and was considered the baseline phase. Ultrasound vascular
measurements were taken at Phase 7 (2003–2004). Participants were examined in a supine
position, with the head turned to a 45 degree angle away from the side to be scanned. CIMT
was measured in the right and left common carotid arteries. Longitudinal images of the
common carotid artery, triggered on the R-wave of the ECG, were magnified and recorded in
DICOM format as a cine loop, on the hard drive of the ultrasound machine for later analysis.
The common CIMT was measured at its thickest part 1 cm proximal to the bifurcation. A
measurement was taken between the leading edge of the intima and the media adventitia on
3 separate images on each side using electronic callipers and the mean of the 6 measures
2
was used for analysis. The overall coefficient of variation for repeated measures of CIMT
was 4.7% (N = 89) (1).
In IMPROVE, blood sampling for laboratory tests was performed after an overnight fast.
Serum was frozen at –80oC prior to shipment for centralized biochemical analyses and
biobanking in Stockholm (Karolinska Institute Stockholm, Sweden). Serum concentrations of
total, HDL cholesterol and triglycerides were analyzed in a centralized laboratory with the
use of LX Beckman instruments. Cholesterol and triglycerides were measured with
enzymatic methods. LDL-C concentration was calculated using the Friedewald (2). The
CIMT variable selected for this analysis was the maximum IMT of the CC which was
measured as follows: The far walls of the left and right common carotid (CC) artery were
visualized in anterior, lateral, and posterior projections and recorded on sVHS videotapes.
Measurements were taken at the thickest part of common carotids 1 cm proximal to the
bifurcation. The far walls of the CCs in their entire length were measured in at least three
different images on each side using dedicated software able to automatically recognize the
leading edge of the intima and the media adventitia. For each segment the mean of the 6
measures was used in this analysis. The overall coefficient of variation for repeated
measures of CIMT was 3.9% (N = 121) (3).
Genotyping and quality control
For WHII participants, DNA was extracted from blood samples (via magnetic bead
technology; Medical Solutions, Nottingham, UK) and normalized to a concentration of 50
ng/μl. 5592 samples were genotyped using the Illumina Human Cardiochip(4) and 3413 of
these were also genotyped using the Illumina CardioMetabochip (also referred to as the
3
Illumina Metabochip) (5). Genotyping of the two APOE snps (rs7412 and rs429358) was
previously carried out using a universal heteroduplex generator (6).
In the IMPROVE study, several biological samples were kept in a biobank. Specifically, the
biobank contains 14 aliquots of 0.5 mL EDTA plasma and 8 aliquots of 0.5 mL serum for
each subject. In addition, for each subject, 2 × 5 mL whole blood was stored for DNA
extraction. DNA was purified (in the Atherosclerosis Research Unit, Karolinska Institute
Stockholm, Sweden) from all patients who signed informed consent for genetic studies. In
total 3695 samples were genotyped using the Illumina CardioMetabochip.
References
1. Kivimäki M, Lawlor DA, Davey Smith G, Kumari M, Donald A, Britton A, et al. Does
high C-reactive protein concentration increase atherosclerosis? The Whitehall II Study. PloS
One. 2008;3:e3013.
2. Friedewald WT, Levy RI, Fredrickson DS. Estimation of the concentration of low-
density lipoprotein cholesterol in plasma, without use of the preparative ultracentrifuge. Clin.
Chem. 1972;8:499-502.
3. Baldassarre D, Nyyssönen K, Rauramaa R, de Faire U, Hamsten A, Smit AJ, et al.
Cross-sectional analysis of baseline data to identify the major determinants of carotid intima-
media thickness in a European population: the IMPROVE study. Eur. Heart J. 2010;31:614-
622.
4. Keating BJ, Tischfield S, Murray SS, Bhangale T, Price TS, Glessner JT, et al.
Concept, design and implementation of a cardiovascular gene-centric 50 k SNP array for
large-scale genomic association studies. PloS One. 2008;3:e3583.

4
5. Ingelsson E. Large-scale genome-wide association studies consortia: blessing,
burden, or necessity? Circulation. Cardiovascular Genetics. 2010;3:396-398.
6. Bolla MK, Wood N, Humphries SE. Rapid determination of apolipoprotein E genotype
using a heteroduplex generator. J. Lipid Res. 1999;40:2340-2345.
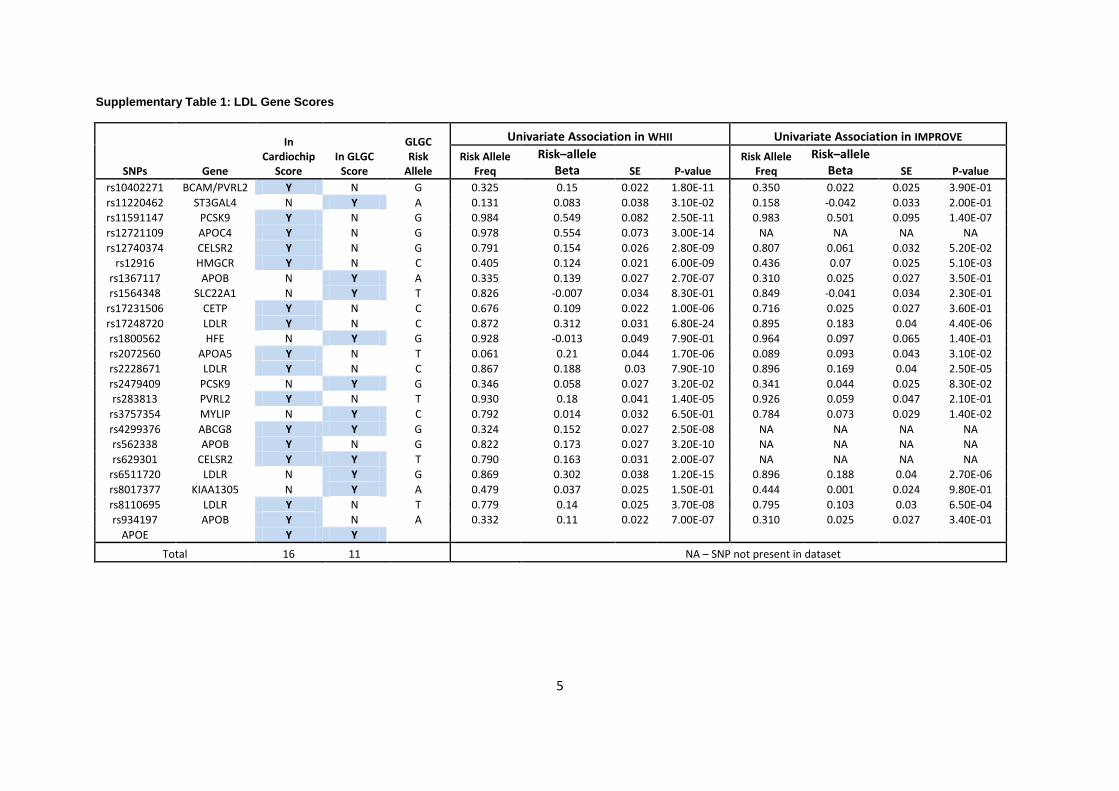
5
Supplementary Table 1: LDL Gene Scores
SNPs Gene
In Cardiochip
Score In GLGC
Score
GLGC Risk
Allele
Univariate Association in WHII Univariate Association in IMPROVE
Risk Allele Freq
Risk–allele Beta SE P-value
Risk Allele Freq
Risk–allele Beta SE P-value
rs10402271 BCAM/PVRL2 Y N G 0.325 0.15 0.022 1.80E-11 0.350 0.022 0.025 3.90E-01
rs11220462 ST3GAL4 N Y A 0.131 0.083 0.038 3.10E-02 0.158 -0.042 0.033 2.00E-01
rs11591147 PCSK9 Y N G 0.984 0.549 0.082 2.50E-11 0.983 0.501 0.095 1.40E-07
rs12721109 APOC4 Y N G 0.978 0.554 0.073 3.00E-14 NA NA NA NA
rs12740374 CELSR2 Y N G 0.791 0.154 0.026 2.80E-09 0.807 0.061 0.032 5.20E-02
rs12916 HMGCR Y N C 0.405 0.124 0.021 6.00E-09 0.436 0.07 0.025 5.10E-03
rs1367117 APOB N Y A 0.335 0.139 0.027 2.70E-07 0.310 0.025 0.027 3.50E-01
rs1564348 SLC22A1 N Y T 0.826 -0.007 0.034 8.30E-01 0.849 -0.041 0.034 2.30E-01
rs17231506 CETP Y N C 0.676 0.109 0.022 1.00E-06 0.716 0.025 0.027 3.60E-01
rs17248720 LDLR Y N C 0.872 0.312 0.031 6.80E-24 0.895 0.183 0.04 4.40E-06
rs1800562 HFE N Y G 0.928 -0.013 0.049 7.90E-01 0.964 0.097 0.065 1.40E-01
rs2072560 APOA5 Y N T 0.061 0.21 0.044 1.70E-06 0.089 0.093 0.043 3.10E-02
rs2228671 LDLR Y N C 0.867 0.188 0.03 7.90E-10 0.896 0.169 0.04 2.50E-05
rs2479409 PCSK9 N Y G 0.346 0.058 0.027 3.20E-02 0.341 0.044 0.025 8.30E-02
rs283813 PVRL2 Y N T 0.930 0.18 0.041 1.40E-05 0.926 0.059 0.047 2.10E-01
rs3757354 MYLIP N Y C 0.792 0.014 0.032 6.50E-01 0.784 0.073 0.029 1.40E-02
rs4299376 ABCG8 Y Y G 0.324 0.152 0.027 2.50E-08 NA NA NA NA
rs562338 APOB Y N G 0.822 0.173 0.027 3.20E-10 NA NA NA NA
rs629301 CELSR2 Y Y T 0.790 0.163 0.031 2.00E-07 NA NA NA NA
rs6511720 LDLR N Y G 0.869 0.302 0.038 1.20E-15 0.896 0.188 0.04 2.70E-06
rs8017377 KIAA1305 N Y A 0.479 0.037 0.025 1.50E-01 0.444 0.001 0.024 9.80E-01
rs8110695 LDLR Y N T 0.779 0.14 0.025 3.70E-08 0.795 0.103 0.03 6.50E-04
rs934197 APOB Y N A 0.332 0.11 0.022 7.00E-07 0.310 0.025 0.027 3.40E-01
APOE
Y Y
Total 16 11 NA – SNP not present in dataset
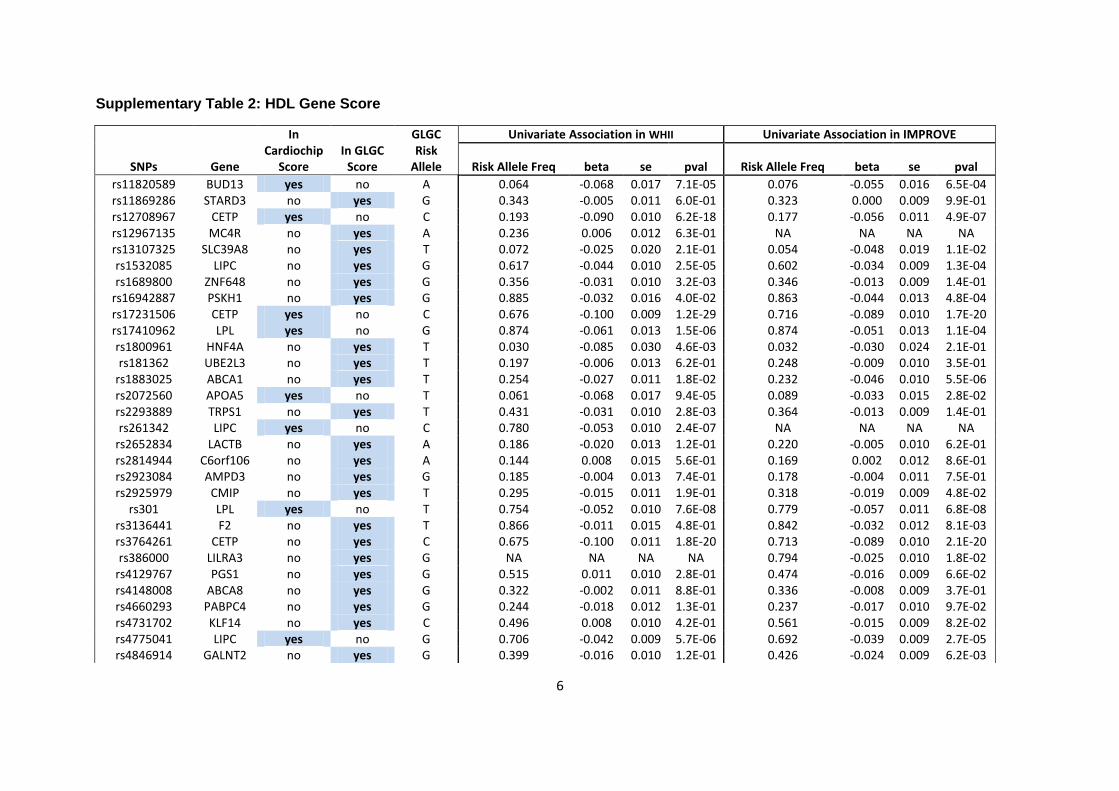
6
Supplementary Table 2: HDL Gene Score
SNPs Gene
In Cardiochip
Score In GLGC
Score
GLGC Risk
Allele
Univariate Association in WHII Univariate Association in IMPROVE
Risk Allele Freq beta se pval Risk Allele Freq beta se pval
rs11820589 BUD13 yes no A 0.064 -0.068 0.017 7.1E-05 0.076 -0.055 0.016 6.5E-04 rs11869286 STARD3 no yes G 0.343 -0.005 0.011 6.0E-01 0.323 0.000 0.009 9.9E-01 rs12708967 CETP yes no C 0.193 -0.090 0.010 6.2E-18 0.177 -0.056 0.011 4.9E-07 rs12967135 MC4R no yes A 0.236 0.006 0.012 6.3E-01 NA NA NA NA rs13107325 SLC39A8 no yes T 0.072 -0.025 0.020 2.1E-01 0.054 -0.048 0.019 1.1E-02 rs1532085 LIPC no yes G 0.617 -0.044 0.010 2.5E-05 0.602 -0.034 0.009 1.3E-04 rs1689800 ZNF648 no yes G 0.356 -0.031 0.010 3.2E-03 0.346 -0.013 0.009 1.4E-01
rs16942887 PSKH1 no yes G 0.885 -0.032 0.016 4.0E-02 0.863 -0.044 0.013 4.8E-04 rs17231506 CETP yes no C 0.676 -0.100 0.009 1.2E-29 0.716 -0.089 0.010 1.7E-20 rs17410962 LPL yes no G 0.874 -0.061 0.013 1.5E-06 0.874 -0.051 0.013 1.1E-04 rs1800961 HNF4A no yes T 0.030 -0.085 0.030 4.6E-03 0.032 -0.030 0.024 2.1E-01 rs181362 UBE2L3 no yes T 0.197 -0.006 0.013 6.2E-01 0.248 -0.009 0.010 3.5E-01
rs1883025 ABCA1 no yes T 0.254 -0.027 0.011 1.8E-02 0.232 -0.046 0.010 5.5E-06 rs2072560 APOA5 yes no T 0.061 -0.068 0.017 9.4E-05 0.089 -0.033 0.015 2.8E-02 rs2293889 TRPS1 no yes T 0.431 -0.031 0.010 2.8E-03 0.364 -0.013 0.009 1.4E-01 rs261342 LIPC yes no C 0.780 -0.053 0.010 2.4E-07 NA NA NA NA
rs2652834 LACTB no yes A 0.186 -0.020 0.013 1.2E-01 0.220 -0.005 0.010 6.2E-01 rs2814944 C6orf106 no yes A 0.144 0.008 0.015 5.6E-01 0.169 0.002 0.012 8.6E-01 rs2923084 AMPD3 no yes G 0.185 -0.004 0.013 7.4E-01 0.178 -0.004 0.011 7.5E-01 rs2925979 CMIP no yes T 0.295 -0.015 0.011 1.9E-01 0.318 -0.019 0.009 4.8E-02
rs301 LPL yes no T 0.754 -0.052 0.010 7.6E-08 0.779 -0.057 0.011 6.8E-08 rs3136441 F2 no yes T 0.866 -0.011 0.015 4.8E-01 0.842 -0.032 0.012 8.1E-03 rs3764261 CETP no yes C 0.675 -0.100 0.011 1.8E-20 0.713 -0.089 0.010 2.1E-20 rs386000 LILRA3 no yes G NA NA NA NA 0.794 -0.025 0.010 1.8E-02
rs4129767 PGS1 no yes G 0.515 0.011 0.010 2.8E-01 0.474 -0.016 0.009 6.6E-02 rs4148008 ABCA8 no yes G 0.322 -0.002 0.011 8.8E-01 0.336 -0.008 0.009 3.7E-01 rs4660293 PABPC4 no yes G 0.244 -0.018 0.012 1.3E-01 0.237 -0.017 0.010 9.7E-02 rs4731702 KLF14 no yes C 0.496 0.008 0.010 4.2E-01 0.561 -0.015 0.009 8.2E-02 rs4775041 LIPC yes no G 0.706 -0.042 0.009 5.7E-06 0.692 -0.039 0.009 2.7E-05 rs4846914 GALNT2 no yes G 0.399 -0.016 0.010 1.2E-01 0.426 -0.024 0.009 6.2E-03
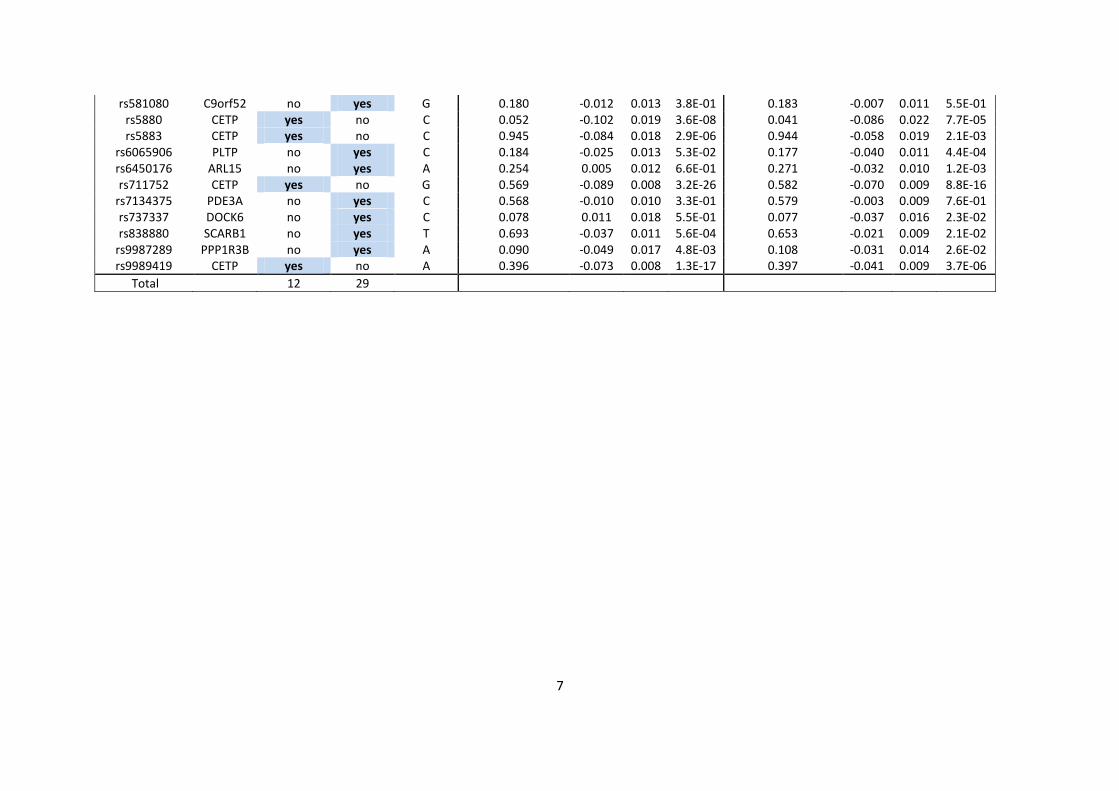
7
rs581080 C9orf52 no yes G 0.180 -0.012 0.013 3.8E-01 0.183 -0.007 0.011 5.5E-01 rs5880 CETP yes no C 0.052 -0.102 0.019 3.6E-08 0.041 -0.086 0.022 7.7E-05 rs5883 CETP yes no C 0.945 -0.084 0.018 2.9E-06 0.944 -0.058 0.019 2.1E-03
rs6065906 PLTP no yes C 0.184 -0.025 0.013 5.3E-02 0.177 -0.040 0.011 4.4E-04 rs6450176 ARL15 no yes A 0.254 0.005 0.012 6.6E-01 0.271 -0.032 0.010 1.2E-03 rs711752 CETP yes no G 0.569 -0.089 0.008 3.2E-26 0.582 -0.070 0.009 8.8E-16
rs7134375 PDE3A no yes C 0.568 -0.010 0.010 3.3E-01 0.579 -0.003 0.009 7.6E-01 rs737337 DOCK6 no yes C 0.078 0.011 0.018 5.5E-01 0.077 -0.037 0.016 2.3E-02 rs838880 SCARB1 no yes T 0.693 -0.037 0.011 5.6E-04 0.653 -0.021 0.009 2.1E-02
rs9987289 PPP1R3B no yes A 0.090 -0.049 0.017 4.8E-03 0.108 -0.031 0.014 2.6E-02 rs9989419 CETP yes no A 0.396 -0.073 0.008 1.3E-17 0.397 -0.041 0.009 3.7E-06
Total 12 29
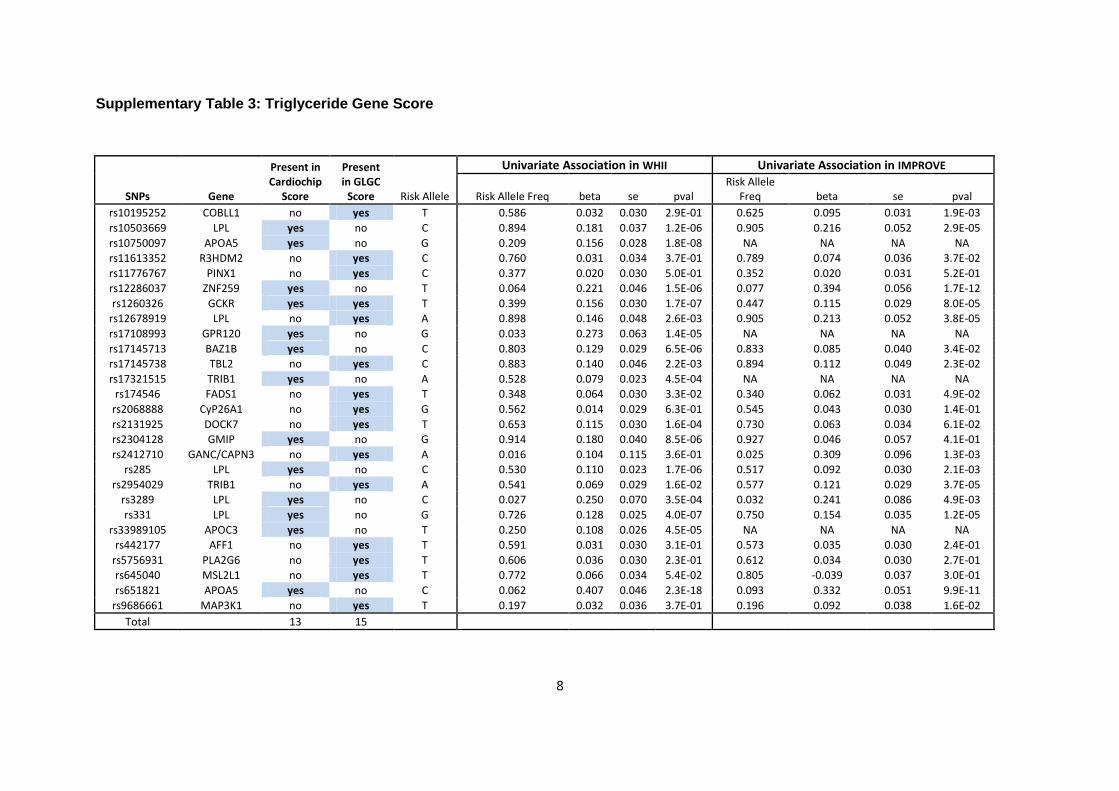
8
Supplementary Table 3: Triglyceride Gene Score
SNPs Gene
Present in Cardiochip
Score
Present in GLGC
Score Risk Allele
Univariate Association in WHII Univariate Association in IMPROVE
Risk Allele Freq beta se pval Risk Allele
Freq beta se pval
rs10195252 COBLL1 no yes T 0.586 0.032 0.030 2.9E-01 0.625 0.095 0.031 1.9E-03
rs10503669 LPL yes no C 0.894 0.181 0.037 1.2E-06 0.905 0.216 0.052 2.9E-05
rs10750097 APOA5 yes no G 0.209 0.156 0.028 1.8E-08 NA NA NA NA
rs11613352 R3HDM2 no yes C 0.760 0.031 0.034 3.7E-01 0.789 0.074 0.036 3.7E-02
rs11776767 PINX1 no yes C 0.377 0.020 0.030 5.0E-01 0.352 0.020 0.031 5.2E-01
rs12286037 ZNF259 yes no T 0.064 0.221 0.046 1.5E-06 0.077 0.394 0.056 1.7E-12
rs1260326 GCKR yes yes T 0.399 0.156 0.030 1.7E-07 0.447 0.115 0.029 8.0E-05
rs12678919 LPL no yes A 0.898 0.146 0.048 2.6E-03 0.905 0.213 0.052 3.8E-05
rs17108993 GPR120 yes no G 0.033 0.273 0.063 1.4E-05 NA NA NA NA
rs17145713 BAZ1B yes no C 0.803 0.129 0.029 6.5E-06 0.833 0.085 0.040 3.4E-02
rs17145738 TBL2 no yes C 0.883 0.140 0.046 2.2E-03 0.894 0.112 0.049 2.3E-02
rs17321515 TRIB1 yes no A 0.528 0.079 0.023 4.5E-04 NA NA NA NA
rs174546 FADS1 no yes T 0.348 0.064 0.030 3.3E-02 0.340 0.062 0.031 4.9E-02
rs2068888 CyP26A1 no yes G 0.562 0.014 0.029 6.3E-01 0.545 0.043 0.030 1.4E-01
rs2131925 DOCK7 no yes T 0.653 0.115 0.030 1.6E-04 0.730 0.063 0.034 6.1E-02
rs2304128 GMIP yes no G 0.914 0.180 0.040 8.5E-06 0.927 0.046 0.057 4.1E-01
rs2412710 GANC/CAPN3 no yes A 0.016 0.104 0.115 3.6E-01 0.025 0.309 0.096 1.3E-03
rs285 LPL yes no C 0.530 0.110 0.023 1.7E-06 0.517 0.092 0.030 2.1E-03
rs2954029 TRIB1 no yes A 0.541 0.069 0.029 1.6E-02 0.577 0.121 0.029 3.7E-05
rs3289 LPL yes no C 0.027 0.250 0.070 3.5E-04 0.032 0.241 0.086 4.9E-03
rs331 LPL yes no G 0.726 0.128 0.025 4.0E-07 0.750 0.154 0.035 1.2E-05
rs33989105 APOC3 yes no T 0.250 0.108 0.026 4.5E-05 NA NA NA NA
rs442177 AFF1 no yes T 0.591 0.031 0.030 3.1E-01 0.573 0.035 0.030 2.4E-01
rs5756931 PLA2G6 no yes T 0.606 0.036 0.030 2.3E-01 0.612 0.034 0.030 2.7E-01
rs645040 MSL2L1 no yes T 0.772 0.066 0.034 5.4E-02 0.805 -0.039 0.037 3.0E-01
rs651821 APOA5 yes no C 0.062 0.407 0.046 2.3E-18 0.093 0.332 0.051 9.9E-11
rs9686661 MAP3K1 no yes T 0.197 0.032 0.036 3.7E-01 0.196 0.092 0.038 1.6E-02
Total 13 15
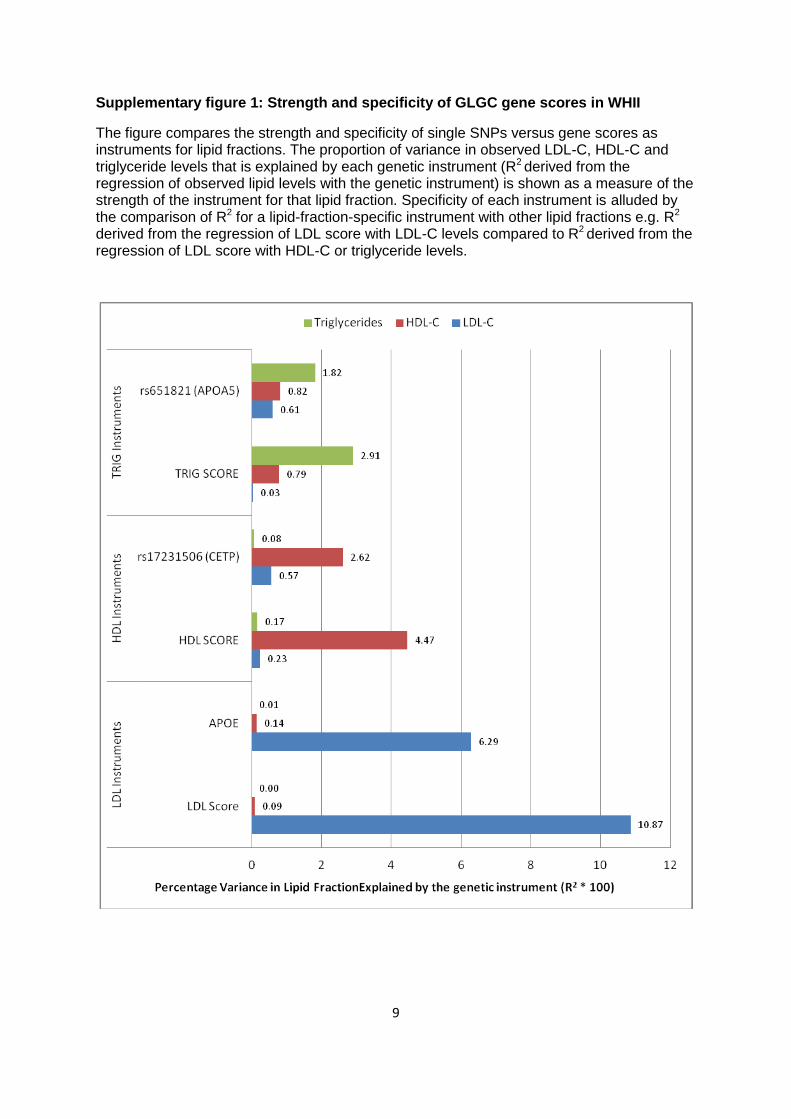
9
Supplementary figure 1: Strength and specificity of GLGC gene scores in WHII
The figure compares the strength and specificity of single SNPs versus gene scores as instruments for lipid fractions. The proportion of variance in observed LDL-C, HDL-C and triglyceride levels that is explained by each genetic instrument (R2 derived from the regression of observed lipid levels with the genetic instrument) is shown as a measure of the strength of the instrument for that lipid fraction. Specificity of each instrument is alluded by the comparison of R2 for a lipid-fraction-specific instrument with other lipid fractions e.g. R2 derived from the regression of LDL score with LDL-C levels compared to R2 derived from the regression of LDL score with HDL-C or triglyceride levels.